range-wide analysis of wildlife habitat: implications for conservation
TRANSCRIPT

Biological Conservation 143 (2010) 1960–1969
Contents lists available at ScienceDirect
Biological Conservation
journal homepage: www.elsevier .com/locate /b iocon
Range-wide analysis of wildlife habitat: Implications for conservation
Andrés Viña a,*, Mao-Ning Tuanmu a, Weihua Xu b, Yu Li a, Zhiyun Ouyang b, Ruth DeFries c, Jianguo Liu a
a Center for Systems Integration and Sustainability, Department of Fisheries and Wildlife, Michigan State University, East Lansing, MI, USAb State Key Laboratory of Urban and Regional Ecology, Research Center for Eco-Environmental Sciences, Chinese Academy of Sciences, Beijing, Chinac Department of Ecology, Evolution, and Environmental Biology (E3B), Columbia University, New York, NY 10027, USA
a r t i c l e i n f o
Article history:Received 4 January 2010Received in revised form 19 April 2010Accepted 25 April 2010
Keywords:Giant pandaHabitat modelingMODISNature reserveRange-wide analysis
0006-3207/$ - see front matter � 2010 Elsevier Ltd. Adoi:10.1016/j.biocon.2010.04.046
* Corresponding author. Address: Center for Systeability, 1405 S. Harrison Road, Suite 115 ManlyUniversity, East Lansing, MI 48823-5243, USA. Tel.: +432 5066.
E-mail address: [email protected] (A. Viña).
a b s t r a c t
The range-wide habitat status of many endangered species is unclear. We evaluated the status and spatialdistribution of the habitat of the endangered giant panda (Ailuropoda melanoleuca) across its entire geo-graphic range (i.e., six mountain regions located in Sichuan, Shaanxi and Gansu provinces, China) by inte-grating field and remotely sensed data to develop a habitat distribution model. Results suggest thatcurrent suitable habitat corresponds to ca. 1/4 of the habitat baseline (i.e., maximum amount of habitatpossible). The highest proportion of suitable habitat relative to the baseline is in the Qinling mountainregion. Overall, around 40% of the suitable habitat is inside nature reserves, but the proportion of habitatinside them varied among different mountain regions, ranging from ca. 17% (Lesser Xiangling) to ca. 66%(Qinling). The habitat model also predicted the occurrence of potentially suitable habitat outside the cur-rently accepted geographic range of the species, which should be further evaluated as potential pandareintroduction sites. Our approach is valuable for assessing the conservation status of the entire habitatof the species, for identifying areas with significant ecological roles (e.g., corridors), for identifying areassuitable for panda reintroductions, and for establishing specific conservation strategies in different partsof the giant panda geographic range. It might also prove useful for range-wide habitat analyses of manyother endangered species around the world.
� 2010 Elsevier Ltd. All rights reserved.
1. Introduction
As many species are now facing unprecedented reductions inhabitat availability due mainly to human actions, range-wide hab-itat analyses are becoming a necessity, particularly for endangeredspecies and across political boundaries (Sanderson et al., 2002;Thorbjarnarson et al., 2006). Such analyses allow the identificationof areas that require different conservation actions (e.g., establish-ment of new nature reserves, corridors and species reintroductionsites). However, for many threatened and endangered species theinformation regarding specific habitat characteristics and distribu-tion across their entire geographic ranges is often inadequate(Odom et al., 2001). This is the case of the endangered giant panda(Ailuropoda melanoleuca), which is considered a global icon of bio-diversity conservation (Liu et al., 2001; Loucks et al., 2001; Mack-innon and De Wulf, 1994).
Giant pandas once ranged throughout most of China, northernVietnam, and northern Myanmar (Pan et al., 2001), but fewer than
ll rights reserved.
ms Integration and Sustain-Miles Bldg, Michigan State1 517 432 5078; fax: +1 517
1600 individuals in the wild are estimated to survive within sixmountain regions (Qinling, Minshan, Qionglai, Greater Xiangling,Lesser Xiangling and Liangshan) in three provinces (Gansu, Shaanxiand Sichuan) of China (Hu and Wei, 2004; Mackinnon and De Wulf,1994; Reid and Gong, 1999; State Forestry Administration, 2006)(Fig. 1). The drastic reduction in the geographic distribution ofthe species is mainly attributed to human activities [e.g., agricul-tural expansion, logging, infrastructure development, and residen-tial development (Liu et al., 2003a)]. This has prompted theChinese government and international non-governmental organi-zations to invest in the establishment of 63 giant panda nature re-serves (protected areas specifically designed to conserve thespecies). As panda populations inside many of these nature re-serves tend to be isolated (Viña et al., 2007; Xu et al., 2006), it isnecessary to establish conservation blocks that integrate severalnature reserves and enhance the habitat connectivity among them.However, giant panda habitat analyses have been performedmainly inside nature reserves (Linderman et al., 2005; Liu et al.,1999, 2001, 2005; Viña et al., 2007, 2008) or within single moun-tain regions (Feng et al., 2009; Loucks et al., 2003; Shen et al.,2008; Xu et al., 2006) and often using different criteria for charac-terizing the habitat of the species. Therefore, an analysis of thehabitat status and distribution across the entire geographic rangeof the species is warranted.

Fig. 1. Topographic map showing the location of the mountain regions currently inhabited by giant pandas (Hu and Wei, 2004; Mackinnon and De Wulf, 1994; Reid and Gong,1999; State Forestry Administration, 2006). Also shown are locations of the 540 field sampling plots established for this study with 84 of them exhibiting evidences of theoccurrence of giant pandas (i.e., tracks, feces, dens, sleeping sites), together with 34 plots established outside the mountain regions for model verification.
A. Viña et al. / Biological Conservation 143 (2010) 1960–1969 1961
In this study we quantified the habitat of the giant panda acrossits entire geographic range. Our specific objectives were to estab-lish the areal extent of the habitat, assess the degree of habitat con-nectivity, evaluate the amount of habitat inside 63 giant pandareserves, and identify potential sites for locating new nature re-serves, corridors and reintroduction sites.
2. Methods
2.1. Study area
The study area (ca. 125,170 km2) was defined by the six moun-tain regions currently inhabited by giant pandas (Fig. 1). Thesemountain regions are characterized by high mountains and deepvalleys, with elevations between ca. 70 and 6250 m. Together withthis strong elevational gradient there is high variation in climateand soils that leads to diverse flora and fauna. One of the world’stop 25 Biodiversity Hotspots is included in the region, the South-west China hotspot (Mittermeier et al., 2004; Myers et al., 2000).Natural vegetation is dominated by evergreen and deciduousbroadleaf forests at lower elevations and subalpine coniferous for-ests at higher elevations. The dense understory of these forests isdominated by ca. 60 bamboo species, with approximately 35 ofthem being the preferred food of giant pandas (Hu and Wei,2004; Li, 1997).
2.2. Habitat distribution model
2.2.1. Modeling approachModels that predict the spatial distribution of the habitat of tar-
get species have generated great interest in recent years, as theyhelp not only in the prediction of the locations of suitable habitat,
but also aid in understanding niche requirements (Guisan and Thu-iller, 2005). These models relate observations of the occurrence ofthe target species with environmental variables in order to estab-lish the suitability of an area to meet the biological requirements ofthe target species. Many such models require information on theareas that exhibit both confirmed presences and absences of thetarget species. While the presence of the target species can bedetermined through direct observation or through the use of surro-gates (e.g., fecal droppings), information on confirmed absences ismore difficult to obtain. This is particularly true for vagile specieswith small population sizes, such as the giant panda, because theabsence of individuals in a particular place does not necessarilymean that it is unsuitable habitat. Therefore, models specially de-signed for presence-only data have been developed in recent years(Hirzel et al., 2002; Phillips et al., 2006; Stockwell and Peters,1999).
Several studies that compared the performance of differentpresence-only models have found that MaxENT, a general pur-pose machine-learning method for making predictions fromincomplete information, constitutes one of the most accuratealgorithms, particularly when using a small number of occurrencelocations (Elith et al., 2006; Hernandez et al., 2006; Pearson et al.,2007; Phillips et al., 2006). Therefore, we used MaxENT as themodeling framework for mapping the spatial distribution of giantpanda habitat. MaxENT estimates the probability of an area to besuitable habitat for the target species, by finding a probability dis-tribution of maximum entropy (i.e., maximum uniformity) suchthat the expected value of each environmental variable matchesits empirical average, defined by known occurrence locations.The algorithm runs a user-defined number of iterations or untila convergence limit is reached. The final output is a continuoushabitat suitability index (HSI), ranging from 0 (unsuitable) to 1(perfectly suitable).

1962 A. Viña et al. / Biological Conservation 143 (2010) 1960–1969
2.2.2. Giant panda occurrenceThe giant pandas are difficult to observe in the wild due mainly
to their small population size in a large geographic area. Therefore,we used surrogates (i.e., tracks, fecal droppings, dens, sleepingsites) to determine their occurrence. Among these, fecal droppingswere the most abundant and constituted a straightforward indica-tor of the occurrence of the species because they are deposited fre-quently (an average of four droppings/hour) and remain visible forseveral months (Schaller et al., 1985). We searched for these surro-gates in 540 sampling plots (ca. 314 m2 each) distributed through-out the study area (Fig. 1). To avoid areas where giant pandas areknown to be absent, we concentrated our field sampling effortsin the geographic areas of each of the six mountain regions wheresurrogates of the species have been sighted in the past. Samplingplots were then distributed randomly within each of these geo-graphic areas. The selection of geographic areas to randomly dis-tribute our sampling plots was done with the aid of local guides.The center of each sampling plot was geo-referenced using areal-time differentially corrected global positioning system (GPS)receiver. Each of these plots was visited one time in either Septem-ber–November of 2004, or in May–July of 2005, 2006 and 2007.Among the 540 plots surveyed, 84 exhibited evidences of theoccurrence of giant pandas.
Although no giant panda sightings have been reported outsidethe six mountain regions comprising the study area in recent dec-ades, 34 additional field plots were distributed outside them in or-der to verify if some of these areas constitute potential suitablehabitat. The locations of these verification plots (Fig. 1) were estab-lished based on the results of the habitat model developed in thestudy (see below).
2.2.3. Environmental variablesThe phenological characteristics of forest canopies together
with the asynchronous phenologies of forests with and withoutunderstory bamboo have been used for identifying and mappingthe areas that constitute giant panda habitat within a single naturereserve (Viña et al., 2008). Vegetation phenology has also beenassociated with the elevational migration of giant pandas (Becket al., 2008). Therefore, we used vegetation phenology, as mea-sured by a time series of images acquired by the Moderate Resolu-tion Imaging Spectroradiometer (MODIS) satellite sensor system,as an environmental variable for modeling giant panda habitat.MODIS time series data were selected not only for their high tem-poral resolution (i.e., daily acquisition), but also because they covervast areas, thus are suitable for analyzing the habitat status anddistribution across the entire geographic range of the species. Weused a time series of 8-day composite surface reflectance data ac-quired between January, 2004 and December, 2007 (a total of 184images, 46 for each year) by the MODIS sensor system on board theNational Aeronautics and Space Administration (NASA) Terra satel-lite (product MOD09Q1 – Collection 5). This geometrically cor-rected image dataset has surface reflectance values, corrected forthe effects of atmospheric gases, aerosols and thin cirrus clouds(Vermote et al., 1997), collected in two spectral bands (b1: 620–670 nm; b2: 841–876 nm) with a pixel resolution of ca.250 m � 250 m. A time series of the Wide Dynamic Range Vegeta-tion Index (WDRVI) was calculated from these data using theformula:
WDRVI ¼ a � qb2 � qb1
a � qb2 þ qb1ð1Þ
where qb1 and qb2 are surface reflectance values in bands 1 and2, respectively, and a is a coefficient that down-weights the contri-bution of the near-infrared band (b2), making it comparable to thatof the red band (b1) (Gitelson, 2004). We selected an a = 0.25 as theoptimum for the MODIS time series dataset used in the study
(Henebry et al., 2004). The WDRVI constitutes a non-linear trans-formation of the widely used Normalized Difference Vegetation In-dex (NDVI) and is specifically designed to increase the sensitivityto changes in vegetation when the NDVI saturates (Gitelson,2004; Viña et al., 2004). This index exhibits a linear relationshipwith the fraction of photosynthetically active radiation absorbedby vegetation (Viña and Gitelson, 2005) and has been used for ana-lyzing the spatio-temporal heterogeneity of tropical forests (Agui-lar-Amuchastegui and Henebry, 2006, 2008).
To reduce the effects of temporal autocorrelation in the WDRVIimage time series a principal component analysis was applied. Afew principal components effectively summarize the dominantmodes of the spatio-temporal variation, therefore retaining mostof the information contained in the image time series (Benedettiet al., 1994; Eklundh and Singh, 1993; Townshend et al., 1985).The first 20 principal components retained (explaining ca. 70% ofthe total variance) were used as environmental variables. Thesevariables, together with the locations of the 84 field plots (out ofthe 540 sampled) with giant panda occurrences (i.e., with presenceof tracks, feces, dens, sleeping sites) were used in MaxENT. If atleast one field plot with a panda occurrence fell within a MODISpixel, the entire pixel was considered as habitat, and used for mod-el calibration. This constitutes an approximation since a pixel as-signed as panda habitat would not necessarily be 100% habitaton the ground as a result of sub-pixel complexity. However, thisprocedure is common in many pixel-based imagery classificationmethods (Lu and Weng, 2007). As all the 84 field plots with giantpanda evidences were located in different MODIS pixels, 84 pixelswere used for model calibration.
2.2.4. Model validationTo evaluate the accuracy of the habitat model, three validation
procedures were performed using an independent validation data-set of 1453 giant panda occurrence locations obtained during thethird national panda survey performed between 2000 and 2002(State Forestry Administration, 2006). As sometimes two or moreof these giant panda occurrences fell within a single MODIS pixel,a total of 1257 pixels with at least one giant panda occurrencewere used for validation.
The first procedure involves binning the HSI scale and then cal-culating the frequency of pixels with giant panda occurrences thatfall in each of these bins. This observed frequency is then dividedby the frequency of pixels belonging to the same bin across thestudy area (i.e., expected frequency). If the locations used for vali-dation occur at random, this ratio of frequencies (observed/ex-pected) is equal to unity. A Spearman-rank correlation coefficientis then calculated between the ratio of frequencies (observed/ex-pected) in each bin and the bin rank. A model with high accuracyshould have a high positive Spearman-rank correlation coefficient(i.e., closer to 1), as more observed giant panda occurrences wouldcontinually fall within higher bin ranks (Boyce et al., 2002). Themain disadvantage of this procedure is that it is sensitive to thenumber of bins as well as their boundaries (Boyce et al., 2002).Therefore, a modification (Hirzel et al., 2006) was implementedin which the HSI was divided into 100 bins and an observed/ex-pected frequency was calculated in each shift of a moving windowof 10 continuous bins. Through this procedure, a continuous ob-served/expected frequency curve was obtained and a Spearman-rank correlation coefficient [termed Boyce Index (Hirzel et al.,2006)] was calculated.
The second procedure is the Kappa analysis, which is a chance-corrected measure of agreement (Cohen, 1960). The Kappa statisticranges between 0 and 1 and model accuracy can be judged asexcellent if Kappa > 0.75, good if 0.75 > Kappa > 0.4, or poor if Kap-pa < 0.4 (Araújo et al., 2005; Landis and Koch, 1977). However, thisvalidation procedure could not be performed in its traditional

A. Viña et al. / Biological Conservation 143 (2010) 1960–1969 1963
manner due to the lack of species absence information. Therefore,we distinguished presence from random, rather than presencefrom absence, using two different randomly selected pixel data-sets. The first dataset [named Background (BG)] consisted of1000 pixels randomly selected across the entire study area (i.e.,the six mountain regions inhabited by giant pandas). This wasdone in order to evaluate the accuracy of the model for separatinghabitat pixels from background pixels. The second dataset [namedForest (F)] also consisted of 1000 pixels randomly selected acrossthe study area, but only among pixels with more than 10% tree cov-er in the MODIS-derived vegetation continuous fields tree-coverproduct (Hansen et al., 2003). This was done in order to evaluatethe accuracy of the model for separating habitat pixels from forestpixels, as not all forest pixels constitute giant panda habitat (e.g.,forests without understory bamboo). The 10% threshold in thetree-cover product was selected with the assumption that pixelswith at least 10% tree cover have the potential to be classified asforest under natural conditions, in order to account for the defores-tation that has occurred during the last decades (Liu et al., 2001;Viña et al., 2007). Unfortunately the use of presence/random datawill always give lower Kappa values than those obtained by pres-ence/absence data because several randomly selected pixels willfall in areas that have been correctly predicted as suitable habitatby the model, thus artificially increasing commission errors. There-fore, the Kappa values obtained in this study will not be fully com-parable with those of other studies.
The third procedure consists of calculating a receiver operatingcharacteristic (ROC) curve (Hanley and Mcneil, 1982). The ROCcurve is a plot of the sensitivity values (i.e., true positive fraction)vs. their equivalent 1-specificity values (i.e., false positive fraction)for all possible HSI thresholds. The area under the ROC curve (AUC)is a measure of model accuracy. The AUC ranges from 0 to 1, wherea score of 1 indicates perfect discrimination, a score of 0.5 implies aprediction that is not better than random, and lower than 0.5 im-plies a worse than random prediction. A standard for judging mod-el performance based on AUC values (Araújo et al., 2005; Swets,1988) is: excellent (AUC > 0.9), good (0.9 > AUC > 0.8), fair(0.8 > AUC > 0.7), poor (0.7 > AUC > 0.6), and failed(0.6 > AUC > 0.5). Although presence/absence data are requiredfor calculating ROC curves, we used the same dataset on presencepixels and the two random pixel datasets (i.e., BG and F) used forperforming the Kappa analysis to calculate ROC curves. As withthe Kappa analysis, AUC values calculated in this manner tend tobe underestimated because some of the random pixels are actuallypresence pixels (Wiley et al., 2003), but a random prediction willstill correspond to an AUC of 0.5 (Phillips et al., 2006).
In order to examine the relative importance of each of the 20principal components (used as environmental variables) for mod-eling giant panda habitat we developed a model with each of theprincipal components in isolation and then calculated the AUCusing the validation data described above. The principal compo-nent with the highest AUC value constitutes the most informative(in isolation) for separating giant panda habitat.
2.3. Habitat status
To evaluate the amount of habitat area and its connectivity inthe different mountain regions comprising the study area, it wasnecessary to find an optimal HSI cumulative threshold for separat-ing the continuous HSI into habitat and non-habitat areas. We se-lected the optimal threshold as the one that exhibited themaximum Kappa, when applied to all possible HSI cumulativethresholds, using the 1257 pixels with a giant panda occurrenceand the 1000 BG pixels obtained randomly across the study area.For assessing the degree of habitat connectivity, we calculatedthe clumpiness index using the software FRAGSTATS (McGarigal
et al., 2002). This landscape metric is related to habitat aggregationand ranges from zero to one, with values closer to zero indicating ahigher degree of fragmentation and values closer to one indicatinga high degree of aggregation. The most relevant characteristic ofthis metric for this study is that it is independent of habitat area(Neel et al., 2004), making it suitable for comparing the degree ofhabitat connectivity in different mountain regions that differ inthe amount of habitat they contain.
Since the different mountain regions have particular topo-graphic conditions, in order to compare the habitat status amongthem we evaluated the predicted suitable habitat in each mountainregion (i.e., as obtained by MaxENT applied to field and MODISdata) against a habitat baseline condition defined as the maximumamount of habitat possible (Viña et al., 2007). For this, a map of thehabitat baseline condition was generated using elevation and slopeobtained in lattice format from a digital elevation model acquiredby the Shuttle Radar Topography Mission, which has been shownto exhibit high elevational accuracy (Berry et al., 2007). Becausegiant pandas have particular topographic preferences (Hu andWei, 2004; Liu et al., 1999), pixels with slopes 645� and withinan elevational range between 1200 and 3800 m [although varyingthese ranges among different mountain regions as shown by Huand Wei (2004)] were considered as the topographic baseline. Itshould be noted that this baseline could have a potential bias to-wards higher elevations, since the upper elevation limit in the dis-tribution of the species is due to physiological constraints whilethe lower elevation limit is mainly dictated by human disturbance(Feng et al., 2009; Schaller et al., 1985). However, it is still suitablefor comparing the habitat status among different mountain re-gions. To exclude pixels falling within these topographic criteriabut not classified as forest under natural conditions, an additionalrestriction was included in which pixels with less than 10% treecover, in the MODIS-derived vegetation continuous fields tree-cov-er product (Hansen et al., 2003), were excluded from the habitatbaseline.
3. Results
The map derived from the giant panda habitat model showsthat suitable habitat is located primarily in the central (Qionglaimountain region) and northern (Minshan and Qinling mountainregions) portions of the study area, while the southernmost re-gion (i.e., comprising Liangshan, Greater Xiangling and LesserXiangling mountain regions) exhibits comparatively loweramounts of habitat (Fig. 2). This map exhibited high accuracyusing three different validation procedures (Fig. 3), which demon-strates that the approaches used have utility for evaluating thehabitat distribution of the species. The Boyce Index exhibited ahigh positive value, representing a monotonic increase in the ra-tio of frequencies (observed/expected) as more observed giantpanda occurrences continually fall within higher HSI bin ranks(Fig. 3A), while the Kappa and AUC values ranged between 0.52and 0.62 and between 0.83 and 0.89, respectively (Fig. 3B andC). These values show that the model is good, based on standardsfor judging model performance (Araújo et al., 2005; Landis andKoch, 1977; Swets, 1988), not only for separating habitat pixelsfrom background pixels across the study area, but also for sepa-rating habitat pixels from forest pixels. These values are quitehigh, considering the fact that the use of random pixels reducesthe Kappa and AUC due to artificial commission errors. In addi-tion, part of the disagreement between the model output andthe occurrence data obtained from the giant panda survey of2000–2002 (State Forestry Administration, 2006) could be attrib-utable to changes in the habitat suitability between validationand remotely sensed data collection dates.

Fig. 2. Spatial distribution of the giant panda habitat suitability index (HSI) values across its entire geographic range obtained through MaxENT using time series of the WideDynamic Range Vegetation Index (WDRVI) derived from 8-day surface reflectance data acquired in 2004–2007 by the Moderate Resolution Imaging Spectroradiometer(MODIS) sensor on board the Terra satellite (product MOD09Q1 – Collection 5).
1964 A. Viña et al. / Biological Conservation 143 (2010) 1960–1969
The first principal component, explaining ca. 24.4% of the vari-ance in the time series of MODIS–WDRVI imagery, contains thehighest information by itself for discriminating habitat from back-ground pixels (Fig. 4A). The 17th principal component, whileexplaining only ca. 0.8% of the image time series variance, containsthe highest information by itself for discriminating habitat fromforest pixels (Fig. 4A). These two components exhibit the highestcorrelation with spring WDRVI values, as shown by their loadings(Fig. 4B). Therefore, this season seems to be the best time for dis-criminating giant panda habitat. For comparison purposes, theloadings of the second principal component are also shown inFig. 4B. This component represents the annual seasonality of thevegetation (i.e., highest loadings occur during summer and winter;Fig. 4B), but while this component explains about 10% of the vari-ance contained in the image time series, it contains little informa-tion by itself for discriminating giant panda habitat (Fig. 4A).
A binary habitat/non-habitat map (Fig. 5) was created afterfinding the optimal HSI cumulative threshold for separating habi-tat pixels from background pixels (HSI = 0.03), as determined bythe Kappa analysis (Fig. 3B). This map shows that the remainingpanda habitat inside the six mountain regions currently inhabitedby giant pandas covers an area of ca. 21,300 km2, corresponding toca. 17% of the entire study area and ca. 27% of the habitat baseline.Although the Minshan mountain region exhibits the largest area ofgiant panda habitat (around 48% of the entire habitat is located inthis mountain region; Table 1), the Qinling mountain region exhib-its the highest proportion of giant panda habitat as compared
against the habitat baseline (ca. 45% of the habitat baseline; Table1). Thus, the status of the giant panda habitat seems to be better inQinling than in any other mountain region. In addition, this moun-tain region also exhibits the highest values of the clumpiness index(Table 1), suggesting that the habitat present in Qinling exhibitshigher connectivity than the one observed in other mountain re-gions. The mountain regions of the southernmost portion of thegiant panda geographic range (i.e., Liangshan, Greater Xianglingand Lesser Xiangling) exhibit not only the lowest absolute and rel-ative amounts of suitable habitat (i.e., compared against the habi-tat baseline), but also the lowest clumpiness index values (Table 1).Therefore, the status of the habitat in these mountain regions is thepoorest in the entire geographic range of the species, in terms ofthe amount of habitat present and its degree of connectivity.
Around 40% of the suitable giant panda habitat in the six moun-tain regions is within nature reserves, but differences amongmountain regions are evident. For instance, while ca. 2/3 of thehabitat in Qinling is inside nature reserves only ca. 17% of the hab-itat in Lesser Xiangling is inside them (Table 1).
Projecting the model to areas outside the study area (i.e., out-side the six mountain regions inhabited by giant pandas), we foundthat large areas of suitable giant panda habitat occur, particularlyin areas located to the northwest, west and south of the Qinlingmountain region (Fig. 2). Based on the information obtained inthe 34 verification plots (Fig. 1), we determined that some of thesepredicted habitat areas outside the six mountain regions poten-tially constitute suitable habitat, because they are forested, with

Fig. 3. Results of three validation procedures: (A) Boyce Index, (B) Kappa, and (C)the area under the receiver operating characteristic curve (AUC), calculated usingan independent validation dataset of 1453 giant panda occurrence locationsobtained from the third national panda survey between 2000 and 2002 (StateForestry Administration, 2006), together with 1000 pixels randomly selected acrossthe study area (BG), and 1000 pixels randomly selected among pixels classified asforest (F) [i.e., with more than 10% tree cover in the MODIS-derived vegetationcontinuous fields tree-cover product (Hansen et al., 2003)]. Maximum KappaBG andAUCBG represent the accuracies of the model for separating habitat pixels frombackground pixels, while maximum KappaF and AUCF represent the accuracies ofthe model for separating habitat pixels from forest pixels.
Fig. 4. (A) AUC values (calculated using the same validation data described in Fig. 3)of the giant panda habitat model obtained using each principal component [PC;derived from the MODIS–WDRVI image time series (2004–2007)] in isolation. Ahigher AUC value indicates that the PC contains more information for discriminat-ing habitat from background (BG) or habitat from forest (F) pixels, respectively. (B)Principal component loadings (which indicate the correlation of each componentwith members of the original image time series) of the two PC that exhibited thehighest AUC values when used in isolation (i.e., PC1 and PC17). Loadings of PC2 arealso shown for comparison purposes.
A. Viña et al. / Biological Conservation 143 (2010) 1960–1969 1965
gentle slopes and contain understory bamboo species such as Bash-ania fargesii and Fargesia dracocephala, which are suitable for thegiant panda.
4. Discussion
Vegetation phenology, measured through time series ofWDRVI derived from MODIS surface reflectance data, proved to
be a suitable descriptor of giant panda habitat across its entiregeographic range, as shown by the high accuracy of our modelpredictions. The season in which the time series of WDRVI con-tains more information for isolating giant panda habitat seemsto be the spring. Similar results have been reported in whichbroadleaf forests with understory bamboo have on average ca.15.8% higher WDRVI values than broadleaf forests without under-story bamboo, particularly during the spring (Viña et al., 2008).Thus, the presence of understory bamboo significantly influencesthe vegetation phenology in a way that can be exploited for iso-lating and mapping giant panda habitat. This constitutes animprovement over previous synoptic giant panda habitat evalua-tions in which the presence of understory bamboo was ignored(Liu et al., 2001; Loucks et al., 2003; Viña et al., 2007) due tothe difficulty in isolating its signal from that of overstory canopy(Linderman et al., 2004; Wang et al., 2009). However, it is neces-sary to emphasize that MODIS data are acquired with a relativelycoarse spatial resolution, which is suitable for evaluating the hab-itat in the entire range of the species, but might not be com-pletely suitable at smaller scales in localized areas. Therefore,while the finer temporal resolution of MODIS data can compen-sate their disadvantage of coarser spatial resolution (Viña et al.,2008), the results of this study are not directly comparable tothose performed with imagery acquired by sensor systems withhigher spatial resolutions.
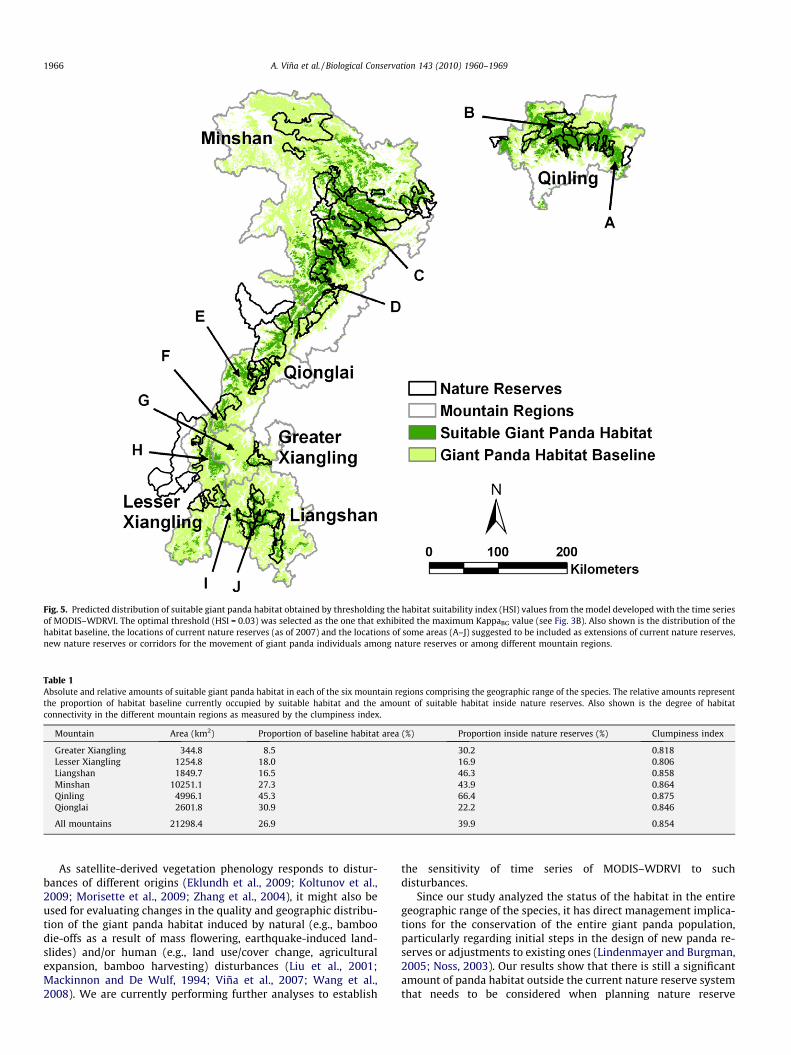
Fig. 5. Predicted distribution of suitable giant panda habitat obtained by thresholding the habitat suitability index (HSI) values from the model developed with the time seriesof MODIS–WDRVI. The optimal threshold (HSI = 0.03) was selected as the one that exhibited the maximum KappaBG value (see Fig. 3B). Also shown is the distribution of thehabitat baseline, the locations of current nature reserves (as of 2007) and the locations of some areas (A–J) suggested to be included as extensions of current nature reserves,new nature reserves or corridors for the movement of giant panda individuals among nature reserves or among different mountain regions.
Table 1Absolute and relative amounts of suitable giant panda habitat in each of the six mountain regions comprising the geographic range of the species. The relative amounts representthe proportion of habitat baseline currently occupied by suitable habitat and the amount of suitable habitat inside nature reserves. Also shown is the degree of habitatconnectivity in the different mountain regions as measured by the clumpiness index.
Mountain Area (km2) Proportion of baseline habitat area (%) Proportion inside nature reserves (%) Clumpiness index
Greater Xiangling 344.8 8.5 30.2 0.818Lesser Xiangling 1254.8 18.0 16.9 0.806Liangshan 1849.7 16.5 46.3 0.858Minshan 10251.1 27.3 43.9 0.864Qinling 4996.1 45.3 66.4 0.875Qionglai 2601.8 30.9 22.2 0.846
All mountains 21298.4 26.9 39.9 0.854
1966 A. Viña et al. / Biological Conservation 143 (2010) 1960–1969
As satellite-derived vegetation phenology responds to distur-bances of different origins (Eklundh et al., 2009; Koltunov et al.,2009; Morisette et al., 2009; Zhang et al., 2004), it might also beused for evaluating changes in the quality and geographic distribu-tion of the giant panda habitat induced by natural (e.g., bamboodie-offs as a result of mass flowering, earthquake-induced land-slides) and/or human (e.g., land use/cover change, agriculturalexpansion, bamboo harvesting) disturbances (Liu et al., 2001;Mackinnon and De Wulf, 1994; Viña et al., 2007; Wang et al.,2008). We are currently performing further analyses to establish
the sensitivity of time series of MODIS–WDRVI to suchdisturbances.
Since our study analyzed the status of the habitat in the entiregeographic range of the species, it has direct management implica-tions for the conservation of the entire giant panda population,particularly regarding initial steps in the design of new panda re-serves or adjustments to existing ones (Lindenmayer and Burgman,2005; Noss, 2003). Our results show that there is still a significantamount of panda habitat outside the current nature reserve systemthat needs to be considered when planning nature reserve

A. Viña et al. / Biological Conservation 143 (2010) 1960–1969 1967
expansions or the creation of new nature reserves. This is particu-larly true in the Lesser Xiangling and Qionglai mountain regions,which exhibit low proportions of habitat area inside nature re-serves. In addition, the current nature reserves are in general small(Mean = 475 km2 and SD = 586.5 km2) and isolated from others(Fig. 5) and thus have a limited ability to maintain viable giant pan-da populations (Loucks et al., 2001). Thus, it is necessary to estab-lish new reserves or corridors to connect isolated habitat patchesand nature reserves, a common strategy for species conservationin fragmented landscapes (Beier and Noss, 1998).
The Chinese government has planned to add ca. 180,000 km2 ofland area (2% of China’s territory) to China’s nature reserve system(Liu and Diamond, 2005; Liu et al., 2003b) between 2010 and 2020.Thus, opportunities exist to create additional nature reserves fornumerous species including the giant panda, expand current nat-ure reserves, and create dispersal corridors that increase the con-nectivity among them. Based on our results, we suggest someareas (A–J in Fig. 5) as candidates to be included in the expansionof China’s nature reserve system. While the importance of some ofthese areas (B–F in Fig. 5) for connecting suitable panda habitatwithin mountain regions has been identified in previous localizedstudies (Loucks et al., 2003; Shen et al., 2008; Xu et al., 2006), wefound additional areas that have the potential for connecting hab-itat among different mountain regions. For example, areas F, G andH connect habitat patches among Qionglai, Greater Xiangling andLesser Xiangling, and area I links habitat between Lesser Xianglingand Liangshan (Fig. 5).
Besides the fragmented distribution of suitable panda habitatand its low ratio to the habitat baseline in all six mountain re-gions, we also found noticeable differences in the status of thegiant panda habitat among mountain regions. These differencessuggest that different conservation strategies and allocations ofconservation resources are required in different mountain re-gions. For instance, suitable habitat in the Qinling mountain re-gion corresponds to the highest proportion of habitat baselineand exhibits the highest connectivity (Table 1). This mountain re-gion also exhibits the highest amount of habitat inside nature re-serves. Thus, conservation actions in this mountain region can beoriented mainly towards minimizing the impacts of humans inand around nature reserves and alleviate the poverty of the localpeople in order to reduce their exploitation of forest products(e.g., bamboo culms and shoots, fuelwood and mushroom collec-tion). In contrast, the status of the habitat in the southernmostportion of the giant panda geographic range (i.e., GreaterXiangling, Lesser Xiangling and Liangshan) is in jeopardy, as itcomprises the lowest proportions of habitat baseline and exhibitscomparatively lower habitat connectivity (Table 1). Giant pandapopulations in these mountain regions are considered threatened(Hu and Wei, 2004), with only ca. 60 individuals estimated to in-habit them (State Forestry Administration, 2006). Therefore, inaddition to establishing conservation actions for minimizing theimpacts of humans on these habitat areas, active habitat restora-tion might also be required in order to link their small and iso-lated giant panda populations with the larger ones present inother mountain regions. Consequently, while the areas proposedin this study for establishing new reserves or corridors have thepotential for linking habitat among Greater Xiangling, LesserXiangling and Qionglai (F, G and H in Fig. 5) and between LesserXiangling and Liangshan (I in Fig. 5), active habitat restoration(e.g., reforestation and bamboo plantation) might also be neces-sary in these proposed areas, in order to create suitable habitatcorridors. As nation-wide conservation programs have the prom-ise to increase forest cover in China (Liu et al., 2008), we suggestthat the managers of these programs in the southernmost moun-tain regions of the giant panda range consider including activerestoration of giant panda habitat in their operations (e.g., plant-
ing native tree species as opposed to exotic ones, and plantingbamboo species suitable for the giant panda).
The habitat model also predicted large areas of potentially suit-able habitat occurring outside the six mountain regions (Fig. 2).Historical reports (Chu and Long, 1983) and Pleistocene fossils(Zhu and Li, 1980) indicate a much wider distribution of the giantpandas in the past, which included these habitat areas predictedoutside the six mountain regions. The absence of pandas in thesepotentially suitable habitat areas could be due to local extinctionsand out-migrations as a result of bamboo die-offs after mass flow-ering (Li and Denich, 2004). Perhaps these areas then became iso-lated due to the increasing human activities in their surroundings(Li and Denich, 2004; Pan et al., 2001), particularly logging andagricultural expansion. As species reintroductions are regarded asfeasible management strategies (Richardson et al., 2009), the suit-ability of these areas to support giant panda populations should beevaluated in panda reintroduction viability assessments (Guo,2007; Li and Denich, 2004). Due to the successful breeding of giantpandas in captivity, the Chinese government has been making ear-nest efforts to reintroduce them to the wild (Guo, 2007). Therange-wide analysis performed in this study provides a foundationfor identifying potential suitable areas for such pandareintroductions.
The procedures performed in this study are of special signifi-cance for establishing an overall view of the status of the entiregiant panda habitat and could potentially be used for analyzingits changes through time. This allows identifying different conser-vation strategies to be implemented in different parts of the giantpanda geographic range. As the habitat of this species comprisesseveral types of forest ecosystems (Reid and Hu, 1991; Taylorand Qin, 1993) which are also home to thousands of other animaland plant species, these conservation strategies will also promotethe conservation of other endangered species such as the goldenmonkey (Rhinopithecus roxellanae), the takin (Budorcas taxicolor),the red panda (Ailurus fulgens), the forest musk deer (Moschus ber-ezovskii), and the Asiatic black bear (Ursus thibetanus). However, itis important to underline that further analyses in the field are re-quired before any management actions are taken.
Range-wide habitat analyses such as the one described in thisstudy might provide similar pertinent information for establishingconservation strategies and identifying conservation priorities indifferent locations of the geographic range of many other endan-gered species around the world. Although the final selection ofareas for conservation needs to explicitly consider human factors(e.g., land use, land tenure, infrastructure) and treat them as cou-pled human-natural systems in order to achieve both socioeco-nomic and ecological sustainability (Liu et al., 2007), the resultsfrom range-wide evaluations provide the biophysical foundationto help delineate areas for future socioeconomic feasibilityassessments.
Acknowledgments
The study was supported by the National Aeronautics and SpaceAdministration (Land Use/Land Cover Change program and Terres-trial Ecology and Biodiversity program), the US National ScienceFoundation (Dynamics of Coupled Natural and Human Systemsprogram and Partnership for International Research and Educa-tion), and the National Natural Science Foundation of China. Wethank Gaodi Dang, Zeyin Jiang, and Xiaobin Su for their invaluableassistance during field campaigns. William McConnell, Wei Liu andthree anonymous reviewers provided valuable comments and sug-gestions to the manuscript. Omnistar in Singapore provided satel-lite signal for the differential correction of our global positioningsystem receivers during field campaigns. We gratefully acknowl-edge China’s Third National Panda Survey for the giant panda

1968 A. Viña et al. / Biological Conservation 143 (2010) 1960–1969
occurrence data used in the validation of our habitat model, andthe Land Processes Distributed Active Archive Center (LP DAAC),located at the US Geological Survey (USGS) Earth Resources Obser-vation and Science (EROS) Center (lpdaac.usgs.gov), for the MODISdata used in the study.
References
Aguilar-Amuchastegui, N., Henebry, G.M., 2006. Monitoring sustainability intropical forests: how changes in canopy spatial pattern can indicate foreststands for biodiversity surveys. IEEE Geoscience and Remote Sensing Letters 3,329–333.
Aguilar-Amuchastegui, N., Henebry, G.M., 2008. Characterizing tropical forestspatio-temporal heterogeneity using the wide dynamic range vegetationindex (WDRVI). International Journal of Remote Sensing 29, 7285–7291.
Araújo, M.B., Pearson, R.G., Thuiller, W., Erhard, M., 2005. Validation of species-climate impact models under climate change. Global Change Biology 11, 1504–1513.
Beck, P.S.A., Wang, T.J., Skidmore, A.K., Liu, X.H., 2008. Displaying remotely sensedvegetation dynamics along natural gradients for ecological studies.International Journal of Remote Sensing 29, 4277–4283.
Beier, P., Noss, R.F., 1998. Do habitat corridors provide connectivity? ConservationBiology 12, 1241–1252.
Benedetti, R., Rossini, P., Taddei, R., 1994. Vegetation classification in the middlemediterranean area by satellite data. International Journal of Remote Sensing15, 583–596.
Berry, P.A.M., Garlick, J.D., Smith, R.G., 2007. Near-global validation of the SRTMDEM using satellite radar altimetry. Remote Sensing of Environment 106, 17–27.
Boyce, M.S., Vernier, P.R., Nielsen, S.E., Schmiegelow, F.K.A., 2002. Evaluatingresource selection functions. Ecological Modelling 157, 281–300.
Chu, C., Long, Z., 1983. The vicissitudes of the giant panda. Acta Zoologica Sinica 29,93–104.
Cohen, J., 1960. A coefficient of agreement for nominal scales. Education andPsychological Measurement 20, 37–46.
Eklundh, L., Singh, A., 1993. A comparative analysis of standardized andunstandardized principal components analysis in remote sensing.International Journal of Remote Sensing 14, 1359–1370.
Eklundh, L., Johansson, T., Solberg, S., 2009. Mapping insect defoliation in Scots pinewith MODIS time-series data. Remote Sensing of Environment 113, 1566–1573.
Elith, J., Graham, C.H., Anderson, R.P., Dudik, M., Ferrier, S., Guisan, A., Hijmans, R.J.,Huettmann, F., Leathwick, J.R., Lehmann, A., Li, J., Lohmann, L.G., Loiselle, B.A.,Manion, G., Moritz, C., Nakamura, M., Nakazawa, Y., Overton, J.M., Peterson, A.T.,Phillips, S.J., Richardson, K., Scachetti-Pereira, R., Schapire, R.E., Soberon, J.,Williams, S., Wisz, M.S., Zimmermann, N.E., 2006. Novel methods improveprediction of species’ distributions from occurrence data. Ecography 29, 129–151.
Feng, T.T., van Manen, F.T., Zhao, N.X., Li, M., Wei, F.W., 2009. Habitat assessment forgiant pandas in the Qinling Mountain Region of China. Journal of WildlifeManagement 73, 852–858.
Gitelson, A.A., 2004. Wide dynamic range vegetation index for remotequantification of biophysical characteristics of vegetation. Journal of PlantPhysiology 161, 165–173.
Guisan, A., Thuiller, W., 2005. Predicting species distribution: offering more thansimple habitat models. Ecology Letters 8, 993–1009.
Guo, J., 2007. Wildlife conservation – giant panda numbers are surging – or arethey? Science 316, 974–975.
Hanley, J.A., Mcneil, B.J., 1982. The meaning and use of the area under a receiveroperating characteristic (ROC) curve. Radiology 143, 29–36.
Hansen, M.C., DeFries, R.S., Townshend, J.R.G., Carroll, M., Dimiceli, C., Sohlberg, R.A.,2003. Global percent tree cover at a spatial resolution of 500 meters: firstresults of the MODIS vegetation continuous fields algorithm. Earth Interactions7.
Henebry, G.M., Viña, A., Gitelson, A.A., 2004. The wide dynamic range vegetationindex and its potential utility for gap analysis. GAP Analysis Program Bulletin12, 50–56.
Hernandez, P.A., Graham, C.H., Master, L.L., Albert, D.L., 2006. The effect of samplesize and species characteristics on performance of different species distributionmodeling methods. Ecography 29, 773–785.
Hirzel, A.H., Hausser, J., Chessel, D., Perrin, N., 2002. Ecological niche factor analysis:how to compute habitat suitability maps without absence data? Ecology 83,2027–2036.
Hirzel, A.H., Le Lay, G., Helfer, V., Randin, C., Guisan, A., 2006. Evaluating the abilityof habitat suitability models to predict species presences. Ecological Modelling199, 142–152.
Hu, J., Wei, F., 2004. Comparative ecology of giant pandas in five mountain ranges oftheir distribution in China. In: Lindburg, D., Baragona, K. (Eds.), Giant Pandas.Biology and Conservation. University of California press, pp. 137–147.
Koltunov, A., Ustin, S.L., Asner, G.P., Fung, I., 2009. Selective logging changes forestphenology in the Brazilian Amazon: evidence from MODIS image time seriesanalysis. Remote Sensing of Environment 113, 2431–2440.
Landis, J.R., Koch, G.G., 1977. The measurement of observer agreement forcategorical data. Biometrics 33, 159–174.
Li, C., 1997. A Study of Staple Food Bamboo for the Giant Panda. Guizhou ScientificPublishing House, Guiyang, China.
Li, Z., Denich, M., 2004. Is Shennongjia a suitable site for reintroducing giant panda:an appraisal on food supply. The Environmentalist 24, 165–170.
Lindenmayer, D.B., Burgman, M.A., 2005. Practical Conservation Biology, second ed.CSIRO Publishing, Melbourne.
Linderman, M., Liu, J., Qi, J., An, L., Ouyang, Z., Yang, J., Tan, Y., 2004. Using artificialneural networks to map the spatial distribution of understorey bamboo fromremote sensing data. International Journal of Remote Sensing 25, 1685–1700.
Linderman, M., Bearer, S., An, L., Tan, Y.C., Ouyang, Z.Y., Liu, J., 2005. The effects ofunderstory bamboo on broad-scale estimates of giant panda habitat. BiologicalConservation 121, 383–390.
Liu, J., Diamond, J., 2005. China’s environment in a globalizing world. Nature 435,1179–1186.
Liu, J., Ouyang, Z., Taylor, W., Groop, R., Tan, Y., Zhang, H., 1999. A framework forevaluating effects of human factors on wildlife habitats: the case on the giantpandas. Conservation Biology 13, 1360–1370.
Liu, J., Linderman, M., Ouyang, Z., An, L., Zhang, H., 2001. Ecological degradation inprotected areas: the case of Wolong Nature Reserve for giant pandas. Science292, 98–101.
Liu, J., Daily, G.C., Ehrlich, P.R., Luck, G.W., 2003a. Effects of household dynamics onresource consumption and biodiversity. Nature 421, 530–533.
Liu, J., Ouyang, Z.Y., Pimm, S.L., Raven, P.H., Wang, X.K., Miao, H., Han, N.Y., 2003b.Protecting China’s biodiversity. Science 300, 1240–1241.
Liu, X.H., Toxopeus, A.G., Skidmore, A.K., Shao, X.M., Dang, G.D., Wang, T.J., Prins,H.H.T., 2005. Giant panda habitat selection in Foping Nature Reserve, China.Journal of Wildlife Management 69, 1623–1632.
Liu, J., Dietz, T., Carpenter, S.R., Alberti, M., Folke, C., Moran, E.F., Pell, A.N., Deadman,P., Kratz, T., Lubchenco, J., Ostrom, E., Ouyang, Z., Provencher, W., Redman, C.L.,Schneider, S.H., Taylor, W.W., 2007. Complexity of coupled human and naturalsystems. Science 317, 1513–1516.
Liu, J., Li, S.X., Ouyang, Z.Y., Tam, C., Chen, X.D., 2008. Ecological and socioeconomiceffects of China’s policies for ecosystem services. Proceedings of the NationalAcademy of Sciences of the United States of America 105, 9477–9482.
Loucks, C.J., Lu, Z., Dinerstein, E., Wang, H., Olson, D.M., Zhu, C.Q., Wang, D.J., 2001.Giant pandas in a changing landscape. Science 294, 1465.
Loucks, C.J., Lu, Z., Dinerstein, E., Wang, D.J., Fu, D.L., Wang, H., 2003. The giantpandas of the Qinling Mountains, China: a case study in designing conservationlandscapes for elevational migrants. Conservation Biology 17, 558–565.
Lu, D., Weng, Q., 2007. A survey of image classification methods and techniques forimproving classification performance. International Journal of Remote Sensing28, 823–870.
Mackinnon, J., De Wulf, R., 1994. Designing protected areas for giant pandas inChina. In: Miller, R.I. (Ed.), Mapping the Diversity of Nature. Chapman & Hall,London, pp. 127–142.
McGarigal, K., Cushman, S., Neel, M., Ene, E., 2002. FRAGSTATS Version 3: SpatialPattern Analysis Program for Categorical Maps. Amherst, Massachusetts.<http://www.umass.edu/landeco/research/fragstats/fragstats.html>.
Mittermeier, R.A., Robles-Gil, P., Hoffmann, M., Pilgrim, J.D., Brooks, T.B.,Mittermeier, C.G., Lamoreux, J.L., Fonseca, G.A.B., 2004. Hotspots Revisited:Earth’s Biologically Richest and Most Endangered Ecoregions. CEMEX, MexicoCity, Mexico.
Morisette, J.T., Richardson, A.D., Knapp, A.K., Fisher, J.I., Graham, E.A., Abatzoglou, J.,Wilson, B.E., Breshears, D.D., Henebry, G.M., Hanes, J.M., Liang, L., 2009. Trackingthe rhythm of the seasons in the face of global change: phenological research inthe 21st century. Frontiers in Ecology and the Environment 7, 253–260.
Myers, N., Mittermeier, R.A., Mittermeier, C.G., da Fonseca, G.A.B., Kent, J., 2000.Biodiversity hotspots for conservation priorities. Nature 403, 853–858.
Neel, M.C., McGarigal, K., Cushman, S.A., 2004. Behavior of class-level landscapemetrics across gradients of class aggregation and area. Landscape Ecology 19,435–455.
Noss, R.F., 2003. A checklist for wildlands network designs. Conservation Biology 17,1270–1275.
Odom, R.H., Ford, W.M., Edwards, J.W., Stihler, C.W., Menzel, J.M., 2001. Developinga habitat model for the endangered Virginia northern flying squirrel (Glaucomyssabrinus fuscus) in the Allegheny Mountains of West Virginia. BiologicalConservation 99, 245–252.
Pan, W., Lü, Z., Wang, D., Wang, H., 2001. The Opportunity for the Giant Panda toExist. Peking University Press, Beijing, China.
Pearson, R.G., Raxworthy, C.J., Nakamura, M., Peterson, A.T., 2007. Predicting speciesdistributions from small numbers of occurrence records: a test case usingcryptic geckos in Madagascar. Journal of Biogeography 34, 102–117.
Phillips, S.J., Anderson, R.P., Schapire, R.E., 2006. Maximum entropy modeling ofspecies geographic distributions. Ecological Modelling 190, 231–259.
Reid, D.G., Gong, J., 1999. Giant panda conservation action plan. In: Servheen, C.,Herrero, S., Peyton, B. (Eds.), Bears: Status Survey and Conservation Action Plan.IUCN, Gland, Switzerland and Cambridge, UK.
Reid, D.G., Hu, J., 1991. Giant panda selection between Bashania fangiana bamboohabitats in Wolong Reserve, Sichuan, China. Journal of Applied Ecology 28, 228–243.
Richardson, D.M., Hellmann, J.J., McLachlan, J.S., Sax, D.F., Schwartzd, M.W.,Gonzalez, P., Brennan, E.J., Camacho, A., Rooth, T.L., Sala, O.E., Schneider, S.H.,Ashe, D.M., Rappaport Clark, J., Early, R., Etterson, J.R., Fielder, E.D., Gill, J.L.,Minteer, B.A., Polasky, S., Safford, H.D., Thompson, A.R., Vellend, M., 2009.Multidimensional evaluation of managed relocation. Proceedings of theNational Academy of Sciences 106, 9721–9724.

A. Viña et al. / Biological Conservation 143 (2010) 1960–1969 1969
Sanderson, E.W., Redford, K.H., Chetkiewicz, C.L.B., Medellin, R.A., Rabinowitz, A.R.,Robinson, J.G., Taber, A.B., 2002. Planning to save a species: the jaguar as amodel. Conservation Biology 16, 58–72.
Schaller, G.B., Hu, J., Pan, W., Zhu, J., 1985. The Giant Pandas of Wolong. University ofChicago Press, Chicago.
Shen, G., Feng, C., Xie, Z., Ouyang, Z., Li, J., Pascal, M., 2008. Proposed conservationlandscape for giant pandas in the Minshan Mountains, China. ConservationBiology 22, 1144–1153.
State Forestry Administration, P.R.C., 2006. Report of the Third National Giant PandaCensus. Science Publishing House, Beijing, China.
Stockwell, D., Peters, D., 1999. The GARP modelling system: problems and solutionsto automated spatial prediction. International Journal of GeographicalInformation Science 13, 143–158.
Swets, J.A., 1988. Measuring the accuracy of diagnostic systems. Science 240, 1285–1293.
Taylor, A.H., Qin, Z.S., 1993. Bamboo regeneration after flowering in the WolongGiant Panda Reserve, China. Biological Conservation 63, 231–234.
Thorbjarnarson, J., Mazzotti, F., Sanderson, E., Buitrago, F., Lazcano, M., Minkowski,K., Muniz, M., Ponce, P., Sigler, L., Soberon, R., Trelancia, A.M., Velasco, A., 2006.Regional habitat conservation priorities for the American crocodile. BiologicalConservation 128, 25–36.
Townshend, J.R.G., Goff, T.E., Tucker, C.J., 1985. Multitemporal dimensionality ofimages of normalized difference vegetation index at continental scales. IEEETransactions on Geoscience and Remote Sensing 23, 888–895.
Vermote, E.F., ElSaleous, N., Justice, C.O., Kaufman, Y.J., Privette, J.L., Remer, L., Roger,J.C., Tanre, D., 1997. Atmospheric correction of visible to middle infrared EOS–MODIS data over land surfaces: background, operational algorithm andvalidation. Journal of Geophysical Research–Atmospheres 102, 17131–17141.
Viña, A., Gitelson, A.A., 2005. New developments in the remote estimation of thefraction of absorbed photosynthetically active radiation in crops. GeophysicalResearch Letters 32, L17403. doi:10.1029/2005GL023647.
Viña, A., Henebry, G.M., Gitelson, A.A., 2004. Satellite monitoring of vegetationdynamics: sensitivity enhancement by the wide dynamic range vegetationindex. Geophysical Research Letters 31, L04503. doi:10.1029/2003GL019034.
Viña, A., Bearer, S., Chen, X., He, G., Linderman, M., An, L., Zhang, H., Ouyang, Z., Liu,J., 2007. Temporal changes in giant panda habitat connectivity acrossboundaries of Wolong Nature Reserve, China. Ecological Applications 17,1019–1030.
Viña, A., Bearer, S., Zhang, H., Ouyang, Z., Liu, J., 2008. Evaluating MODIS data formapping wildlife habitat distribution. Remote Sensing of Environment 112,2160–2169.
Wang, X., Xu, W., Ouyang, Z., Zhang, J., 2008. Impacts of Wenchuan Earthquake ongiant panda habitat in Dujiangyan region. Acta Ecologica Sinica 28, 5856–5861.
Wang, T.J., Skidmore, A.K., Toxopeus, A.G., 2009. Improved understorey bamboocover mapping using a novel hybrid neural network and expert system.International Journal of Remote Sensing 30, 965–981.
Wiley, E.O., McNyset, K.M., Peterson, A.T., Robins, C.R., Stewart, A.M., 2003. Nichemodeling and geographic range predictions in the marine environment using amachine-learning algorithm. Oceanography 16, 120–127.
Xu, W., Ouyang, Z., Viña, A., Zheng, H., Liu, J., Xiao, Y., 2006. Designing a conservationplan for protecting the habitat for the giant pandas in the Qionglai MountainRange, China. Diversity and Distributions 12, 610–619.
Zhang, X., Friedl, M.A., Schaaf, C.B., Strahler, A.H., 2004. Climate controls onvegetation phenological patterns in northern mid- and high latitudes inferredfrom MODIS data. Global Change Biology 10, 1133–1145.
Zhu, J., Li, Y., 1980. The Giant Panda. Beijing Science Press.