random packing of hyperspheres and marsaglia’s parking …whitlock/parking.pdf · 2.1...
TRANSCRIPT
Random packing of hyperspheres and Marsaglia’s
Parking Lot Test
Stefan C. Agapie and Paula A. Whitlock∗
Department of Computer and Information Sciences
Brooklyn College
2900 Bedford Avenue
Brooklyn, New York 10021
September 30, 2009
Abstract
Many studies of randomly packed hyperspheres in multiple dimensions
have been performed using Monte Carlo or Molecular Dynamics simula-
tions to probe the behaviour of the systems. The calculations are usually
initiated by randomly placing the hyperspheres in some D dimensional
box until some randomly loosely packed density is achieved. Then either
a compression algorithm or a particle scaling technique is used to reach
higher packing fractions. The interesting aspect in the initial random
placing of the hyperspheres is that it is closely related to a test of random
number generators that was proposed by Marsaglia, the ”Parking Lot”
test. It is this relationship that is investigated in this paper.
1

1 Introduction
The study of hard hyperspheres in a variety of dimensions has been an active
field for many years in part because in two and three dimensions hyperspheres
can represent common materials like simple fluids, or non-interacting granular
substances such as gravel, beads or fruit. In these systems, most of the structure
is determined by the purely repulsive hard sphere interaction. When extended
to dimensions greater than three, hard hyperspheres are used to investigate
properties such as geometrical frustration and the geometry of the crystalline
state. One very interesting property is the likelihood of randomly placed hyper-
spheres forming jammed states rather than reorganizing into a crystal. Decades
of simulation studies using both Monte Carlo (MC) and Molecular Dynamics
(MD) have shown that while two dimensional hard disks readily reorganise into
a hexagonally ordered state as the density is increased from a fluid density,
this is not true for higher dimensions. Instead, increasing the density of a hard
hypersphere fluid system for dimensions greater than two results in a jammed
state, ıi.e., a state in which the density can not be increased. Various sugges-
tions have been made as to why the transition from a fluid state to an ordered,
crystalline state is difficult [1, 2, 3, 4].
To begin a simulation of a hard hypersphere system, an initial configura-
tion of non-overlapping hyperspheres can be obtained by either starting from a
crystal state at the chosen density or by randomly placing the hyperspheres in
the simulation box. The latter method will only work for low to moderate fluid
densities before it becomes too time consuming to find sufficient space where
a hypersphere can be placed and not overlap its neighbors. This difficulty has
given rise to the development of techniques for achieving higher densities from
lower density initial configurations. For example, in their studies of random
packing of spheres, Jodrey and Tory[5] used a compression algorithm in which
2

the spheres were pressed together, but not allowed to overlap. A similar tech-
niques was used by Speedy [6] to examine the glass transition in three dimen-
sions, and by Lue, Bishop and Whitlock[7] to study four and five dimensional
hypersphere systems. Another method involves a particle scaling algorithm[8]
in which the hyperspheres are allowed to increase in size until they touch. Then
each hypersphere is moved for a set number of passes (MC) or time steps (MD)
to re-equilibrate and loose memory of the scaling. Further rescaling is possible
until the maximum jamming density is attained.
Our interest in this paper is in the initial random placement of the hyper-
spheres in their simulation box. This is a system also studied by Marsaglia in
the development of his ”Parking Lot” test[9] to determine how well a sequence
of pseudorandom numbers (prns) from a deterministic generator mimics the
properties of a truly random sequence. The Parking Lot test is distributed as
part of the Diehard suite of tests of pseudorandom number generators (prng).
The suite is freely available on-line[10] and is used by many researchers to de-
cide whether a specific pseudorandom number generator will be adequate for
their simulations. In this article, we will use Marsaglia’s original version of the
”Parking Lot” test, our rewriting of the algorithm and our extension of it to
multiple dimensions. We investigate the properties of the various versions of
the ”Parking Lot” test with three different types of pseudorandom number gen-
erators. We will discuss why Marsaglia choose to analyze the results as he did
and relate this to the difficulty of achieving high densities of hypersphere place-
ment by random ”parking” alone. Finally, we will discuss whether the choice
of pseudorandom number generator for creating the initial configuration for a
simulation will likely affect the final results.
3
2 Parking Lot Tests and Random Packing
2.1 Marsaglia’s Parking Lot Test
Marsaglia developed the Parking Lot and related tests to determine the
uniformity of placement of hyperspheres in D dimensional space when the co-
ordinates of the center of the hyperspheres are the result of successive calls to a
prng. The ”parking problem” is a well-known random packing problem and was
given an exact mathematical treatment in one dimension by Renyi[11]. However,
the generalization to more than one dimension is less tractable. Marsaglia’s test
is a straightforward placing of a hyperspherical or hypercubic ”car” or parti-
cle of a predetermined size in a D-dimensional box without overlapping any of
the previously parked particles. Let ~c1, ~c2, . . . , ~ck be the coordinates of the k
previously non-overlapping parked particles. Then the coordinates of a next
possible particle are generated. The position of the new particle is compared
with the k other particles to check for overlap. If overlap occurs, the particle
is rejected, otherwise it becomes the k + 1 successfully parked particle. After
n attempts, there will be k successfully placed particles. Marsaglia[9] was not
able to determine the expected distribution of k given n, but was able to show
that plots of k vs n gave very different curves for different prngs.
In the Diehard test suite, Marsaglia chose to perform the Parking Lot test in
two dimensions for a specific size box with a specific value for n. Using a square
box of side L = 100, n = 12000 particles are attempted to be placed in the box.
As long as the newly proposed particle does not overlap any previously placed
particle and its center is inside the simulation box, the new particle is accepted.
Marsaglia had previously performed a simulation with what he considered to be
a very good prng and had found that k should have an average value of 3523
with a standard error of 21.9. He asserted in both the Diehard test suite[10]
and a later publication[12] that the distribution of (k − 3523)/21.9 should be
4

normal. In both references, the particle is described as a disk of radius 1.0.
However, the Diehard Fortran code reveals that a square of side 1.0 was used:
z=sq*uni()
w=sq*uni()
do 5 i=1,k
5 if(abs(x(i)-z).le.1. .and. abs(y(i)-w).le.1.) go to 3
The line labelled 5 is a test for the overlap of two squares. If disks were being
used, the distance between the particles r =√
(x(i) − z)2 + (y(i) − z)2 would
need to be less than or equal to one. Does it matter whether one uses disks or
squares? An indication of the importance of which geometric figure is parked
can be obtained by comparing the area occupied by a square of side 1.0 to the
area of a disk of diameter 1.0. The ratio of the areas, disk to square, is π/4.
Therefore, it would be anticipated that more disks could be placed in a box
than squares in the same number of tries. Marsaglia may have chosen to use
squares for the Parking Lot test because of the previous work on the packing
density of n−dimensional unit hypercubes[13, 14, 15] and his own work on the
distribution of distances between random points in rectangles[16].
2.2 Extensions of the Parking Lot Test
In the research reported here, Marsaglia’s original Parking Lot test code was
translated from Fortran to C++. This involved some interpretation since the
Diehard Test suite preprocesses the output from a prng so that all the tests use
the same bitstream file as input. That is, the user of the Diehard Test suite
needs to first create a file of 32-bit integers obtained from the prng to be tested.
These are written out in a hexadecimal format. Another code translates the
hexadecimal numbers into a binary file which is then used as input for the tests.
Preprocessing was also done for the C++ code. Each prng was called according
5

to its specifications to return a number between 0 and 1. These floating point
values were translated into 32 or 48 bit integers1 and written to an output file
in binary. The binary file was used as input for all the C++ versions of the
parking lot test. As a further test, a C code was written that did not do such
preprocessing of the output from a prng. Rather, it used the values between 0
and 1 provided by the prng to place squares in the simulation box.
Employing the same preprocessed file as in the parking squares test, a park-
ing of disks was coded. Using the same specifications as in the original test, a
simulation box with sides L = 100 and n = 12000 attempts, disks with diame-
ter 1.0 were placed. A prng was used to obtain the random coordinates of the
center of mass of a new disk to be put in the box. If it did not overlap any
previously placed disk and if its center was within the simulation box, the new
disk was accepted. Otherwise, it was rejected. As anticipated, the number of
disks that could be placed was larger than the number of squares in the same
size simulation box. The fraction of space occupied by the disks is significantly
less than that of a completely packed or jammed state. Of course, through a
rejection process alone, the jammed state can not be reached[17].
The generalization to three and four dimensions was straightforward. In
each case, hyperspheres for the chosen dimension were placed in simulation
boxes such that no overlap between hyperspheres was allowed. The size of the
simulation boxes and the number of attempts to place hyperspheres needed to be
specified. It was decided to keep similar volumes in the multidimensional spaces
and attempt to place the same number of hyperspheres as in the two dimensional
case, n = 12000. In three dimensions, the size of the cubic simulation box was
chosen to be L = 22.0 which yields a volume of 10648.0. In four dimensions, the
hypercubic box had a side of L = 10.0. As the dimension increased with similar
1All calculations were performed on a 64 bit processor where either 32 bit or IEEE arith-
metic could be chosen
6

internal hypervolumes for the simulation box, the number of hyperspheres that
could be placed in 12,000 tries decreased.
3 Pseudorandom Number Generators
In investigating and extending the Parking Lot test three pseudorandom
number generators were utilized. The first was a multiplicative congruential
generator, called rannyu, that was developed in the 1960’s to run on the CDC
6600 which had 48 bit integers:
Xn+1 = MXn mod 248 (1)
where M was chosen to have good spectral properties[19]. Since this generator
does not have an additive constant, its period (length of the sequence before
numbers begin to repeat) is less than the maximum of 248 − 1. It has been ex-
tensively tested by empirical tests and its shortcomings are well known[20]. For
example, upon applying the Diehard tests, rannyu fails the Overlapping-Pairs-
Sparse-Occupancy, the Overlapping-Quadruples-Sparse-Occupancy and the DNA
tests for bits 20-32 of a 32 bit word. A more thorough description is given in
Schmidt[18]. An optimized code for the prng was originally written in Fortran,
but has since been translated into C, C++ and Java. A C++ version of the
code was used here.
The second generator was of a completely different type and is based on the
Weyl sequence[21]
Xn = {nα} (2)
where the curly brackets {} indicate the fractional part of the irrational number
α and n = 1, 2, . . . . Weyl showed that the numbers produced by this sequence
were uniform on (0, 1). However, it has serious correlations and a generalization
7

called the ”Shuffled Nested Weyl Sequence” (SNWS)[22], given by
νn = M{n{nα}}+ 0.5, (3)
Zn = {νn{νnα}}. (4)
is used as a pseudorandom number generator instead. The multipler M is a
large integer and again α is an irrational number. The SNWS passes all the
Diehard tests. In the paper where the SNWS generator was introduced, Holian
et al[22] mention that a poor choice of prng used to initialize a MD trajectory
can lead to an unphysical result despite the Lyapunov instability[23] criteria.
The Lyapunov instability suggests that the initial state is forgotten after a few
collision times.
The third prng is the 2003 C++ version of the well-regarded ”Mersenne
Twister” (MT) generator first published in 1998 by Matsumoto and Nishimura[24].
The MT generator is a multiple-recursive matrix method[25, 26]. A random vec-
tor sequence is generated over the two element field F2 = {0, 1} by the linear
recurrence,
~xk+n = ~xk+m + ~xk+1
0 0
0 Ir
A + ~xk
Iw−r 0
0 0
A. (5)
The integer n is the degree of the recurrence, the integer m is 1 ≤ m ≤ n, w
is the machine word size, and 0 ≤ r ≤ w − 1. The Ir and Iw−r are idenity
matrices of size r and w−r, respectively, and A is a w×w matrix with elements
on F2. Each vector is multiplied by a w × w invertible matrix T on the right
in a process called tempering[27]. This is done to improve the k-distribution
properties of the least significant bits of the vector. The specific version of the
generator is 623-distributed to 32 bits accuracy and has a period of 219937 − 1.
8

Matsumoto and Nishimura report that the MT generator passed the Diehard
suite of tests.
4 Results
The Diehard testing suite version of the parking test was applied to each of
the prngs discussed above. The results are shown in the first line of Table I. All
three generators give values for the mean and sigma in agreement well within
their standard errors with Marsaglia’s values of µ = 3523 and σ = 21.9. The
C++ code’s results, the second line in Table I, are similar but not identical to
the Diehard test suite results for several reasons. First, the preprocessing is not
identical and the initial state of the generator is not the same for the two sets
of tests. Futhermore, the C++ code computes an average of 1000 repetions of
a single parking test while the Diehard testing suite repeats the test 10 times.
Of course, the values of µ and σ should not be dependent on the preprocessing
or the initial state of the generator since these are the parameters of the normal
distribution representing the asymptotic distribution function for the process,
i.e. trying to place 12, 000 squares in a box of side L = 100. So, it is no surprise
that the C code which uses no preprocessing gives a value almost the same as
that obtained by the C++ code2.
The fourth line of Table I lists the outcome when disks rather than squares
are placed in the simulation box. As expected the number of disks placed,
µ ≈ 4088, is greater than the number of squares placed, µ ≈ 3523. The observed
ratio being ∼ 0.86 which is somewhat larger than π/4. In his initial description
of the parking lot test[9], Marsaglia found that shift-register pseudorandom
number generators gave very different behaviors than combination prngs when
2The values are fortuitously the same. An independent run of the code for another 1000
repetitions of the test gave µ = 3525.1 and σ = 21.7
9

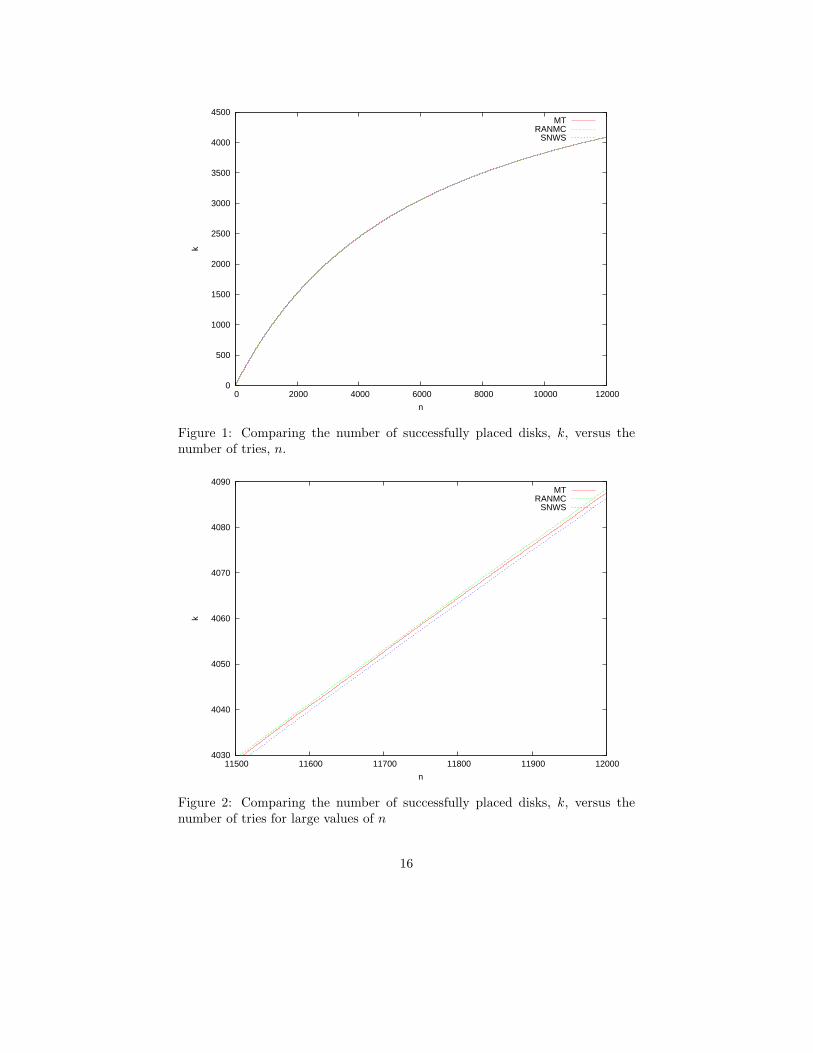
k was plotted as a function of n. In Figure 1, the behavior of k(n) for the three
prngs considered here are plotted. On the scale displayed, the prngs all seem to
show identical behavior. Some minor differences are observed for larger values of
n as shown in Figure 2; the SNWS generator successfully places fewer disks for
large n. Calculating values for µ and σ implies that the asymptotic distribution
for placing the disks is a normal distribution. This assertion is examined in
Figure 3 where the frequency of the value of k observed in 1000 repetitions of
the parking disks test is graphed. For comparison, a normal distribution using
the averaged value of k as µ and its standard error as σ for the Mersenne Twister
prng is shown.
In Table II, as anticipated, the average number of placed hyperspheres in
three and four dimensions is less than the average in two dimensions. Though
the hypervolumes are numerically similar in all the dimensions considered, the
reduced length of a side of the simulation box as the dimensions increases,
restricts the open space in which to randomly place the hyperspheres. The affect
of the side length on placing hyperspheres in three and four dimensions can be
ascertained by changing the side of the simulation box in both dimensions to L
= 100.0. This change corresponds to reducing the number density to very low
values, ρ = 0.012 in three D and ρ = 0.00012 in four D. In both cases 12,000
hyperspheres were easily placed. Another interesting aspect of the results in
Table II is the similarity of the σ values for all three prngs. This behavior is
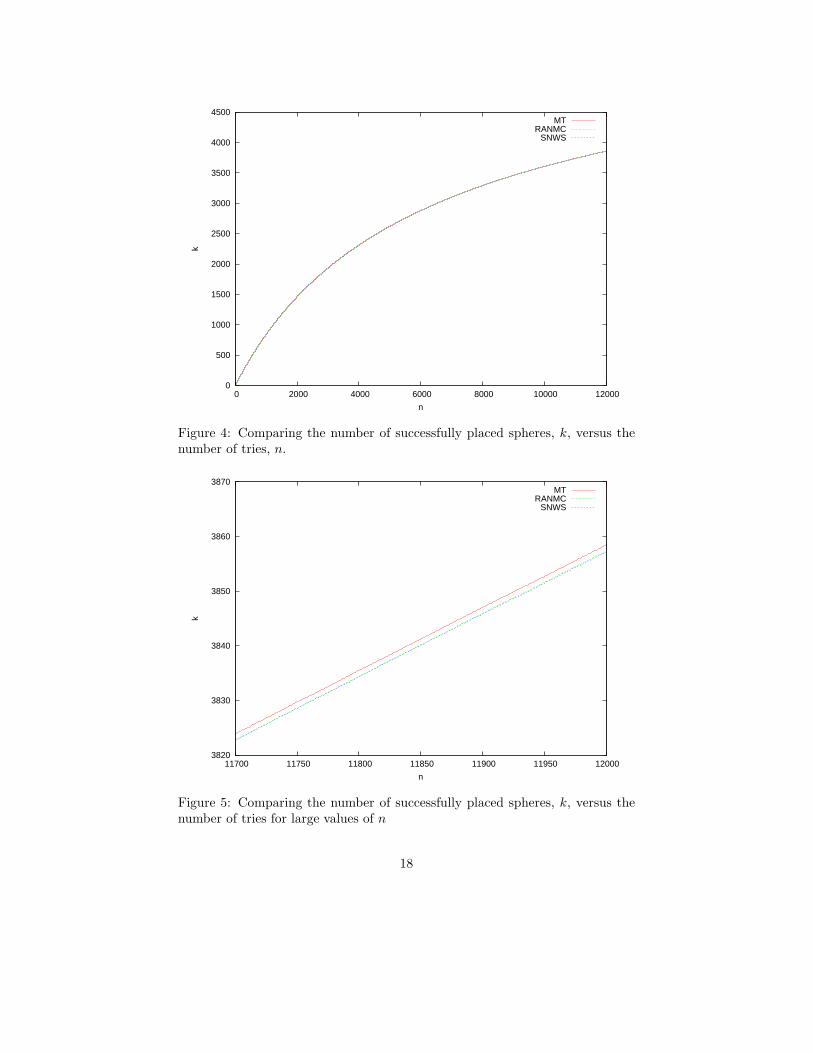
reinforced by viewing the variation of k with n shown in Figure 4 for three D
and in Figure 7 in four-D. Except for the largest values of n, k(n) for the three
prngs is almost identical. When the range, 11500 ≤ n ≤ 12000 us examined,
the SNWS consistently places less hyperspheres thant the MT prng, see Figure
5 and Figure 8. The significance of this small but consistent behavior is not
clear since all values in the graphs are within each other’s standard error.
10

The issue of the distribution of the observed values of k is addressed in Fig-
ures 6 and 9. Figure 6 graphs the frequencies of 1000 observed values of k when
n = 12, 000 and compares them with a normal distribution, φ(k) ∝ exp((k −
3857.1)2/(23.1)2) for the SNWS prng in three dimensions. In four dimensions,
the frequency function comparisons of observed k values after 12, 000 tries ob-
tained from the MT prng is compared with φ(k) ∝ exp((k − 3724.8)2/(25.6)2).
The agreement is very good and helps to convince that Marsaglia’s assertion
that the distribution of the average value of k in two dimensions is a normal
distribution.
5 Discussion
Why did Marsaglia choose the specific settings that he did for the parking lot
test? Why not choose to test for the well-researched limiting packing fraction for
a two-dimensional system? The latter is an elusive value that is dependent on
the speed of the processor, the memory available and the time that a researcher
is willing to wait. In 1979, it was claimed that only packing fractions below
0.5473 could be achieved by purely random placement of disks[17]. Thirty years
later, on very much faster processors and a willingness to wait hours to achieve
a particular value, still leads to a packing fraction of only 0.5498. After k
disks have been added to the simulation box, the residual space available to
the next disk is Rk. The probability that a proposed next disk finds sufficient
space without overlapping is proportional to the area of Rk and this deceases
steadily with the increasing value of k. This is a geometric restriction and as
k increases, the number of tries needed to place the next disk rises at a rate
more than expoenential. So, the limiting randomly achieved packing fraction,
while well-studied is not a good candidate for a fast, easily implemented test of
pseudorandom numbers.
11

The implementation
6 Acknowledgements
We thank Professor Marvin Bishop for helpful discussions. One of us, S.C.A.,
was partially supported by PSC/CUNY Award 61519-00 39.
References
[1] E.I. Corwin, H.M. Jaeger, and S.R. Nagel, ”Structural signature of jammingin granular media,” Nature, 435, 1075-1078, (2005).
[2] M. Skoge, A. Donev, F.H. Stillinger, and S. Torquato, ”Packing hyper-spheres in high-dimensional Euclidean spaces,” Phys. Rev. E, 74, 041127-11(2006).
[3] C. Song, P. Wang, and H.A. Makse, ”A phase diagram for jammed matter,”Nature, 453, 629-632, (2008).
[4] J.A. van Meel, D. Frenkel, and P. Charbonneau, ”Geometrical Frustration:A Study of 4d Hard Spheres,” ? (2009).
[5] W.S. Jodrey and E.M. Tory, ”Computer simulation of close random packingof equal spheres,” Phys. Rev. A, 32, 2347 (1985).
[6] R.J. Speedy, ”On the reproducibility of glasses,” J. Chem. Phys., 100, 6684(1994).
[7] L. Lue, M. Bishop and P.A. Whitlock, ”The Fluid to Solid Phase Transitionof Hard Hyperspheres in Four and Five Dimensions,” submitted to J. Chem.Phys., (2009).
[8] D.P. Fraser, ”Setting up Random Configurations,” Information Quarterlyfor Computer Simulation of Condensed Phases,” 19, 53-59 (1985).
[9] G. Marsaglia, ”A Current View of Random Number Generators,” In Com-puter Science and Statistics: Proceedings of the Symposium on the In-terface, 16th, Atlanta, Georgia, March 1984 (Ed. L. Billard). New York:Elsevier, 1985.
[10] G. Marsaglia, ”The Marsaglia Random Number CDROM, with the DiehardBattery of Tests of Randomness, http://www.stat.fsu.edu/pub/diehard/.
12

[11] A. Renyi, ”On a one-dimensional problem concerning random space filling,”Publ. Math. Inst. Hung. Acad. Sci. 3, 109-127 (1958).
[12] G. Marsaglia, ”On the randomness of Pi and otherdecimal expansions,” Interstat, October 2005, #5,http://interstat.statjournals.net/YEAR/2005/articles/0510005.pdf
[13] H. Solomon, ”Random packing density,” Proc. Fifth Berkeley Symp. Math.Statist. and Prob., 3, 119-134 (1967).
[14] B.E. Blaisdell and H. Solomon, ”On random sequential packing in the planeand a conjecture of Palasti,” J. of Appl. Prob., 7, 667-689, (1970).
[15] Y. Akeda and M. Hori, ”Numerical test of Palasti’s conjecture on two-dimensional random packing density,” Nature, 254, 318-319 (1975).
[16] G. Marsaglia, B. Narasimhan and A. Zaman, ”The distance between ran-dom points in rectangles,” Comm. Stat.-Theory Meth., 19, 4199-4212(1990).
[17] M. Tanemura, ”On random complete packing by discs,” Ann. Inst. Stat.Math., 31, Part B, 351-365 (1979).
[18] K.E. Schmidt, ”Variational and green’s function Monte Carlo calculationsof few-body systems,” in Models and Methods in Few-Body Physics, Lec-ture Notes in Physics, 273, 363-407 (1987).
[19] R. R. Coveyou and R. D. Macpherson, ”Fourier Analysis of Uniform Ran-dom Number Generators,” J. of the ACM, 14, 100-119, (1967).
[20] O.E. Percus and J. Percus, ”Long range correlations in linear congruentialgenerators,” J. of Comp. Phys., 77, 267-269 (1988).
[21] H. Weyl, ”Ueber die Gleichverteilung von Zahlen mod Eins,” Math. Ann.77, 313-352 (1916).
[22] B.L. Holian, O.E. Percus, T.T. Warnock and P.A. Whitlock, ”Pseudoran-dom number generator for massively parallel molecular-dynamics simula-tions,” Phys. Rev. E 50, 1607-1615 (1994).
[23] B.L. Holian, W.G. Hoover and H.A. Posch, ”Resolution of Loschmidt’sparadox: The origin of irreversible behavior in reversible atomistic dynam-ics,” Phys. Rev. Lett. 59, 10-13 (1987).
[24] M. Matsumoto and T. Nishimura, ”Mersenne Twister: A 623-Dimensionally Equidistributed Uniform Pseudo-Random Number Gener-ator,” ACM Transactions on Modeling and Computer Simulation, 8 3-30(1998).
[25] H. Niederreiter, ”Factorization of polynomials and some linear-algebraproblems over finite fields,” Linear Algebra Appl., 192, 301-328 (1993).
13

[26] H. Niederreiter, ”The multiple-recursive matrix method for pseudorandomnumber generation,” Finite Fields Appl., 1, 3-30 (1995).
[27] M. Matsumoto and Y. Kurita, ”Twisted GFSR generators II,” ACM Trans.Model. Comput. Simul., 4, 254-266 (1994).
14

Table I Two-Dimensional Parking Problem, average number parked
Specific Test rannyu SNWS MT
Diehard Suite (squares) 3533.7 ± 25.1 3529.0 ± 23.2 —-
C++ code parking squares 3523.9 ± 21.9 3522.6 ± 22.6 3524.2 ± 21.7
C code parking squares 3523.6 ± 21.9 - -
C++ code parking disks 4088.3 ± 25.6 4086.3 ± 24.1 4087.6 ± 23.5
Table II Average number of hyperspheres placed in three and four dimen-
sions.
Number of rannyu SNWS MTdimensions3 3857.3 ± 24.3 3857.1 ± 23.1 3858.5 ± 23.04 3724.3 ± 24.3 3724.0 ± 25.8 3724.8 ± 25.6
15
0
500
1000
1500
2000
2500
3000
3500
4000
4500
0 2000 4000 6000 8000 10000 12000
k
n
MTRANMC
SNWS
Figure 1: Comparing the number of successfully placed disks, k, versus thenumber of tries, n.
4030
4040
4050
4060
4070
4080
4090
11500 11600 11700 11800 11900 12000
k
n
MTRANMC
SNWS
Figure 2: Comparing the number of successfully placed disks, k, versus thenumber of tries for large values of n
16

0
0.002
0.004
0.006
0.008
0.01
0.012
0.014
0.016
0.018
0.02
4000 4020 4040 4060 4080 4100 4120 4140 4160
k
n
Figure 3: Frequency of values of k for placing disks in a simulation box withthe Mersenne Twister prng. The dashed line is a normal distribution usingµ = 4087.6 and σ = 23.5
17
0
500
1000
1500
2000
2500
3000
3500
4000
4500
0 2000 4000 6000 8000 10000 12000
k
n
MTRANMC
SNWS
Figure 4: Comparing the number of successfully placed spheres, k, versus thenumber of tries, n.
3820
3830
3840
3850
3860
3870
11700 11750 11800 11850 11900 11950 12000
k
n
MTRANMC
SNWS
Figure 5: Comparing the number of successfully placed spheres, k, versus thenumber of tries for large values of n
18

0
0.002
0.004
0.006
0.008
0.01
0.012
0.014
0.016
0.018
0.02
3780 3800 3820 3840 3860 3880 3900 3920 3940
k
n
Figure 6: Frequency of values of k for placing spheres in a simulation box withthe Shifted Nested Weyl prng. The dashed line is a normal distribution usingµ = 3857.1 and σ = 23.1
19

0
500
1000
1500
2000
2500
3000
3500
4000
0 2000 4000 6000 8000 10000 12000
k
n
MTRANMC
SNWS
Figure 7: Comparing the number of successfully placed 4-D hyerspheres, k,versus the number of tries, n.
3660
3670
3680
3690
3700
3710
3720
3730
3740
11500 11600 11700 11800 11900 12000
k
n
MTRANMC
SNWS
Figure 8: Comparing the number of successfully placed 4-D hyperspheres, k,versus the number of tries for large values of n
20

0
0.002
0.004
0.006
0.008
0.01
0.012
0.014
0.016
0.018
3640 3660 3680 3700 3720 3740 3760 3780 3800 3820
k
n
Figure 9: Frequency of values of k for placing 4-D hyperspheres in a simulationbox with the Mersenne Twister prng. The dashed line is a normal distributionusing µ = 3724.8 and σ = 25.6
21