rand water capital expenditure programme john critchley tariff consultation 22 october 2014
TRANSCRIPT

Rand Water
Capital Expenditure ProgrammeJohn Critchley
Tariff consultation 22 October 2014

CONTENT
1. Demand growth forecast
2. Augmentation & renewal plan to 2030
3. Capital budget
2
Background
• Historical growth– Several decades of growth in the 3 to 6% per annum– Resulted in increase from 1000 Ml/d in 1965 to 4000 Ml/d now – Growth started to decline from about 1990– Growth in decade to 2011 averaged 2.5%
• Projected growth– Continued decline in annual growth rates– Decline in both ‘natural’ population growth and inward migration– Expect drop from current 2% pa to 1% pa by about 2035– Projecting further, could peak by about 2070
3
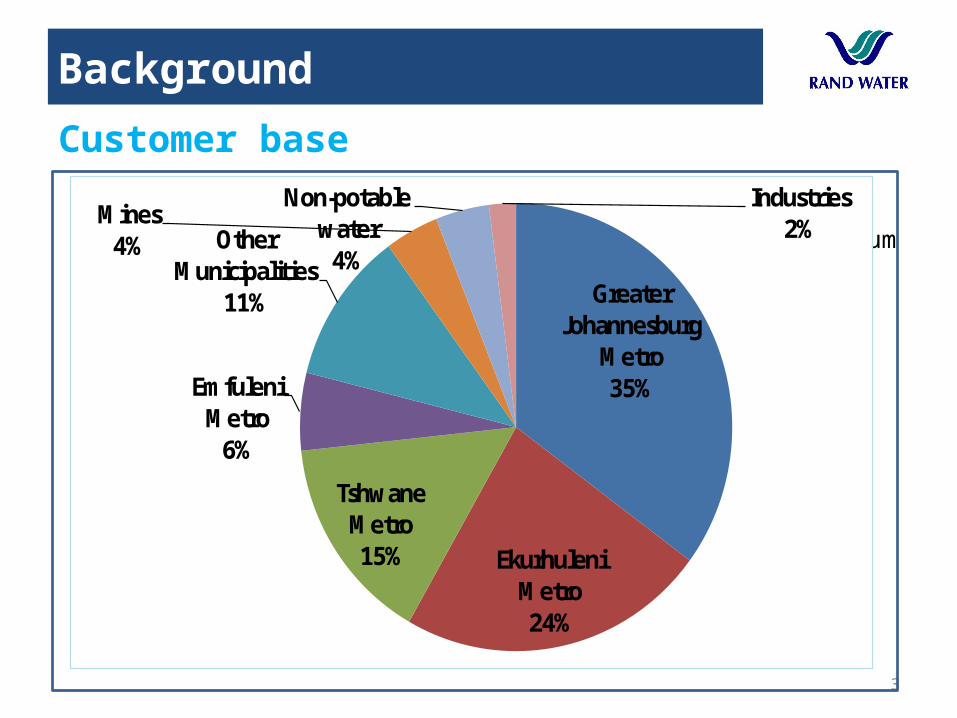
Customer base
Greater Johannesburg
Metro35%
Ekurhuleni Metro24%
Tshwane Metro15%
Emfuleni Metro
6%
Other Municipalities
11%
Mines4%
Non-potable water
4%
Industries2%
Demand Growth
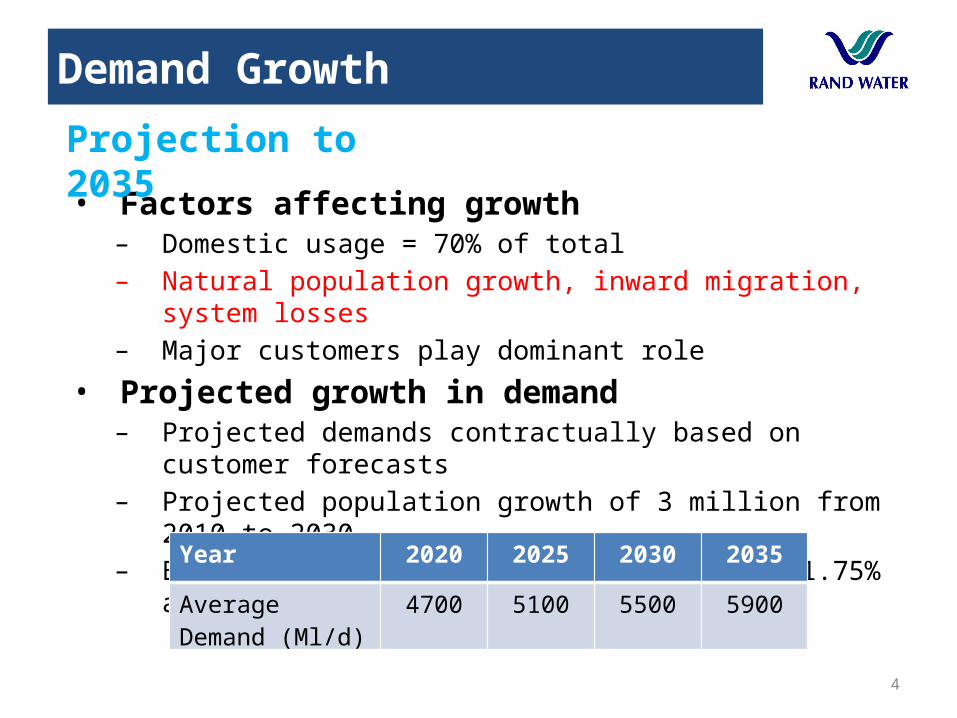
• Factors affecting growth– Domestic usage = 70% of total– Natural population growth, inward migration, system losses – Major customers play dominant role
• Projected growth in demand– Projected demands contractually based on customer forecasts– Projected population growth of 3 million from 2010 to 2030– Based on AADD of 4200 Ml/d for 2014 and 1.75% annual growth:
4
Projection to 2035
Year 2020 2025 2030 2035
Average Demand (Ml/d)
4700 5100 5500 5900

5
Demand growth versus raw water
2000 2005 2010 2015 2020 2025 2030 2035 20402,500
3,000
3,500
4,000
4,500
5,000
5,500
6,000
6,500
AADD abstraction growth - excludes Authorised Users and WDM Fl
ow (
Ml/d
)
Year
Current proposed abstraction licence
Possible future abstraction licence
Infrastructure planning projection

Demand growth scenarios and risks
• Potential for deferred capital expenditure, but:– Major projects have long lead times– Some existing infrastructure approaching full utilisation at peak
periods– Require ‘headroom’ to take major infrastructure out of service for
renewal
• Location, location, location!– WDM initiatives not intended to prevent development– Mismatch between areas of saving and development nodes
• Response– First see effectiveness of WDM initiatives by location– Complete current projects but defer future projects
6
Response to Limitations
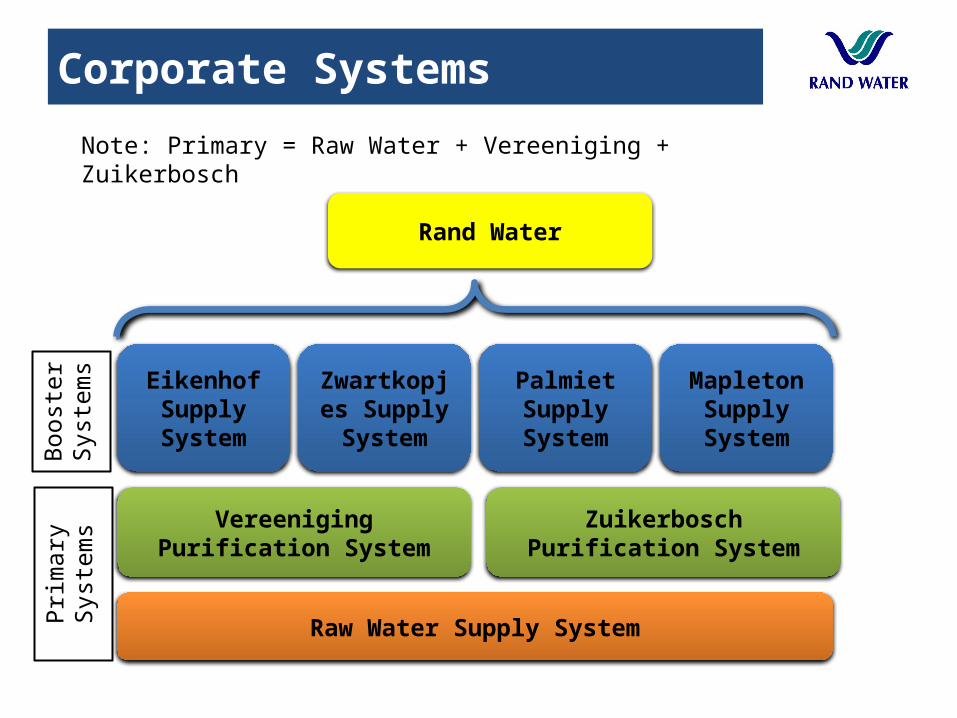
Eikenhof Supply System
Zwartkopjes Supply System
Palmiet Supply System
Mapleton Supply System
Vereeniging Purification System Zuikerbosch Purification System
Raw Water Supply System
Rand Water
Corporate Systems
Note: Primary = Raw Water + Vereeniging + Zuikerbosch
Boo
ster
S
yste
ms
Prim
ary
Sys
tem
s
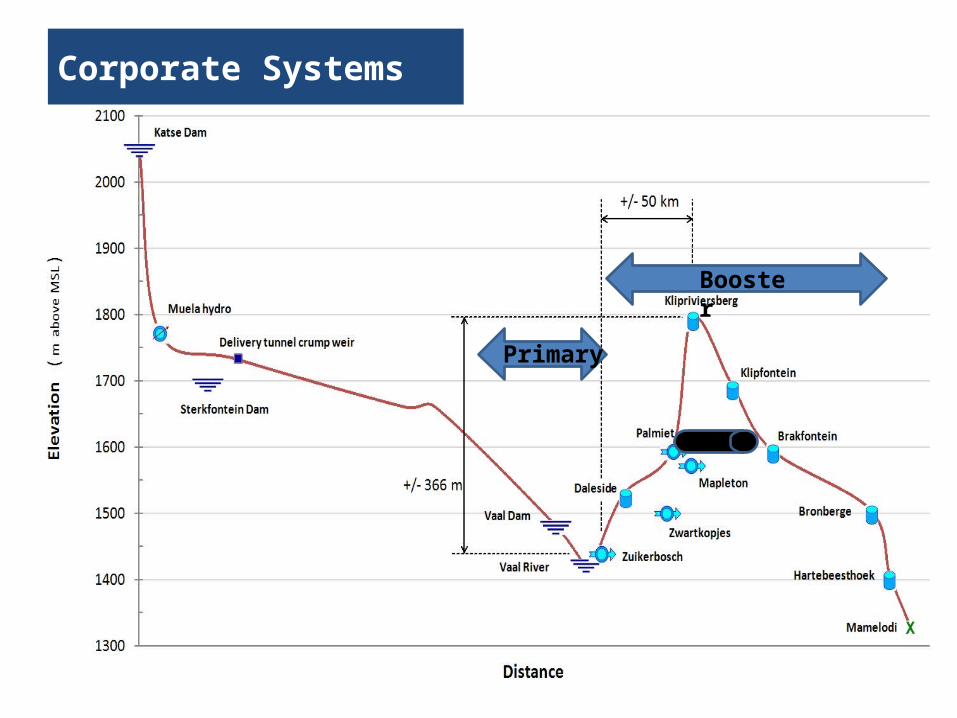
Corporate Systems
Primary
Booster

9
Eikenhof system
Zwartkopjes system
Primary systems
Mapleton system
Palmiet system
City of Tshwane
Vaal Dam
10
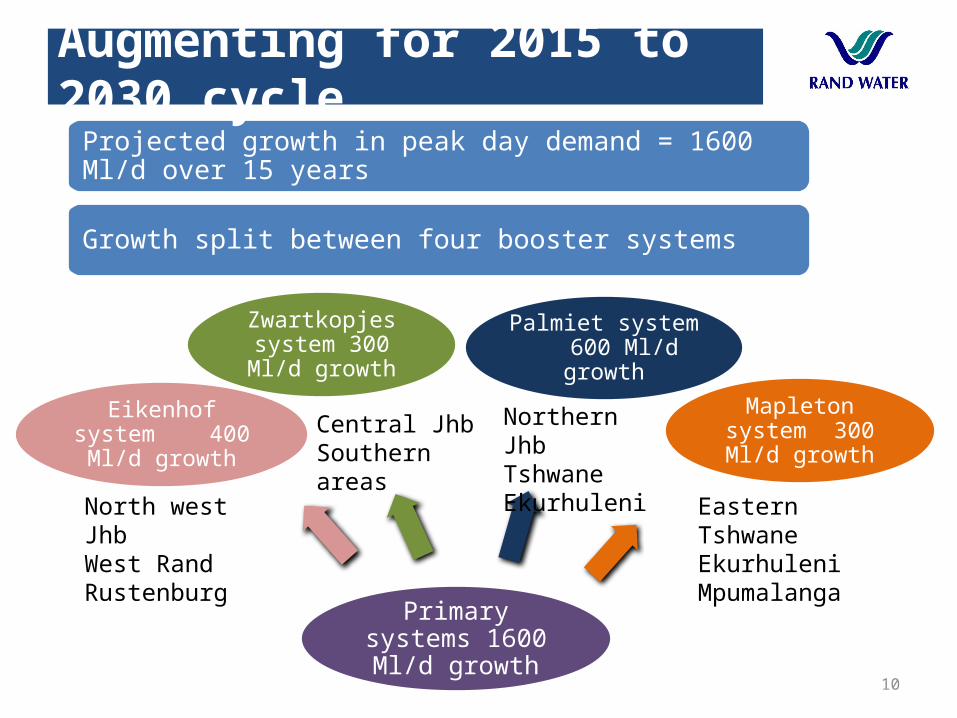
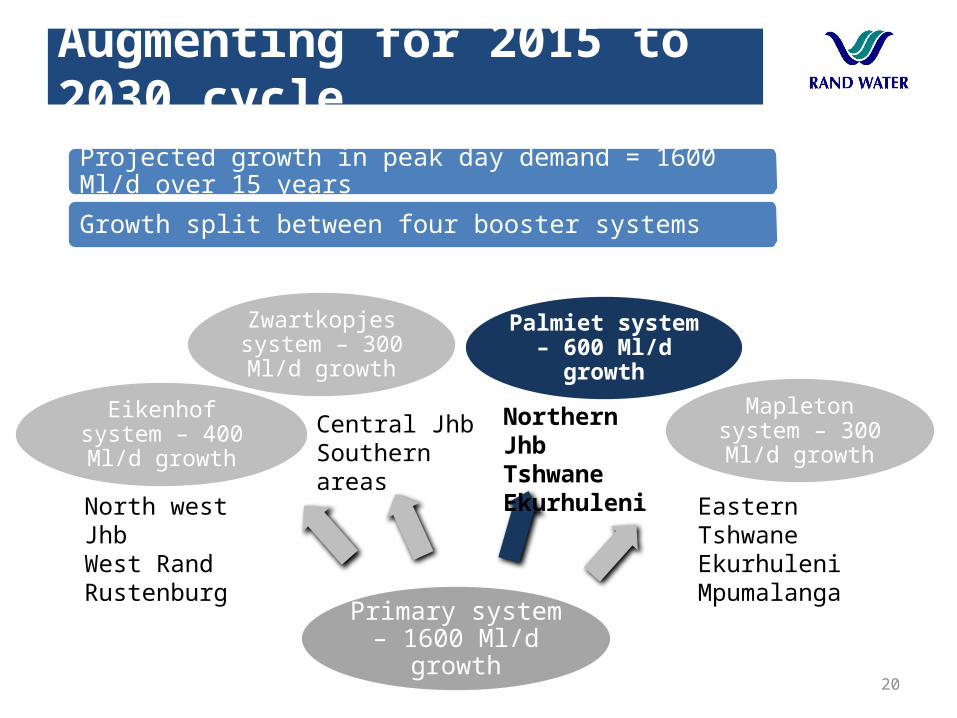
Primary systems 1600 Ml/d growth
Palmiet system 600 Ml/d growth
Mapleton system 300 Ml/d growth
Eikenhof system 400 Ml/d growth
Zwartkopjes system 300 Ml/d growth
Projected growth in peak day demand = 1600 Ml/d over 15 years
Growth split between four booster systems
North west JhbWest RandRustenburg
Central JhbSouthern areas
Northern JhbTshwaneEkurhuleni
Eastern TshwaneEkurhuleniMpumalanga
Augmenting for 2015 to 2030 cycle

Peak demand by pumping station
11
Station Design capacity
Projected peak day demands (Ml/d)(including WDM savings - indicative)
2020(2025)
2025(2030)
2030(2035)
2035(2040)
Primary Systems
Zuikerbosch 3900 4300 4800 5300 5800
Vereeniging 1400 1300 1300 1300 1300
Booster systems
Palmiet 1870 2000 2190 2380 2570
Mapleton 960 990 1080 1180 1270
Eikenhof 2000 1470 1610 1750 1880
Zwartkopjes 800 760 780 840 880
CONTENT
1. Demand growth forecast
2. Augmentation & renewal plan to 2030
3. Capital budget
12

Augmentation & Renewal Planning
• Augmentation– Increase capacity to meet future demands (quantity & quality)– 20 year view of projects based on 35+ year view of demands– Projects connected to customers per system
• Renewal– Extend life of existing assets (replace, refurbish, upgrade)
• Integrated– Many projects combine augmentation and renewal (eg pipelines)– Integrate at plant, site and system level
13
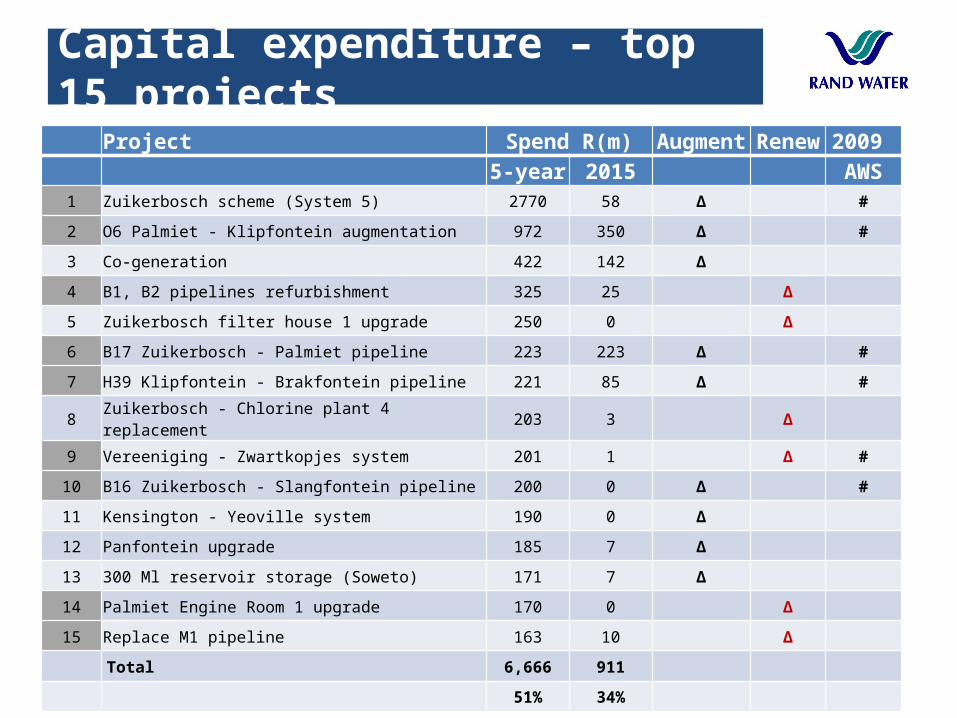
Capital expenditure – top 15 projects
14
Project Spend R(m) Augment Renew 2009
5-year 2015 AWS1 Zuikerbosch scheme (System 5) 2770 58 Δ #
2 O6 Palmiet - Klipfontein augmentation 972 350 Δ #
3 Co-generation 422 142 Δ
4 B1, B2 pipelines refurbishment 325 25 Δ
5 Zuikerbosch filter house 1 upgrade 250 0 Δ
6 B17 Zuikerbosch - Palmiet pipeline 223 223 Δ #
7 H39 Klipfontein - Brakfontein pipeline 221 85 Δ #
8 Zuikerbosch - Chlorine plant 4 replacement 203 3 Δ
9 Vereeniging - Zwartkopjes system 201 1 Δ #
10 B16 Zuikerbosch - Slangfontein pipeline 200 0 Δ #
11 Kensington - Yeoville system 190 0 Δ
12 Panfontein upgrade 185 7 Δ
13 300 Ml reservoir storage (Soweto) 171 7 Δ
14 Palmiet Engine Room 1 upgrade 170 0 Δ
15 Replace M1 pipeline 163 10 Δ
Total 6,666 911
51% 34%

• Buildings and property• Civil structures• Pipelines• Mechanical• Electrical• Process• Automation
Asset Portfolios

Infrastructure renewal
16
Asset category Replacement value (Rbn)
Design life (yrs) Annual renewal allocation (Rm)
Pipelines 46 65+ 600
Civil 12 50 to 100 70
Mechanical 9 30+ 115
Process 7 15 to 20+ 115
Buildings 4 80+ 35
Electrical 1 20 to 30+ 25
Automation 1 5 to 10+ 10
Total 80 970
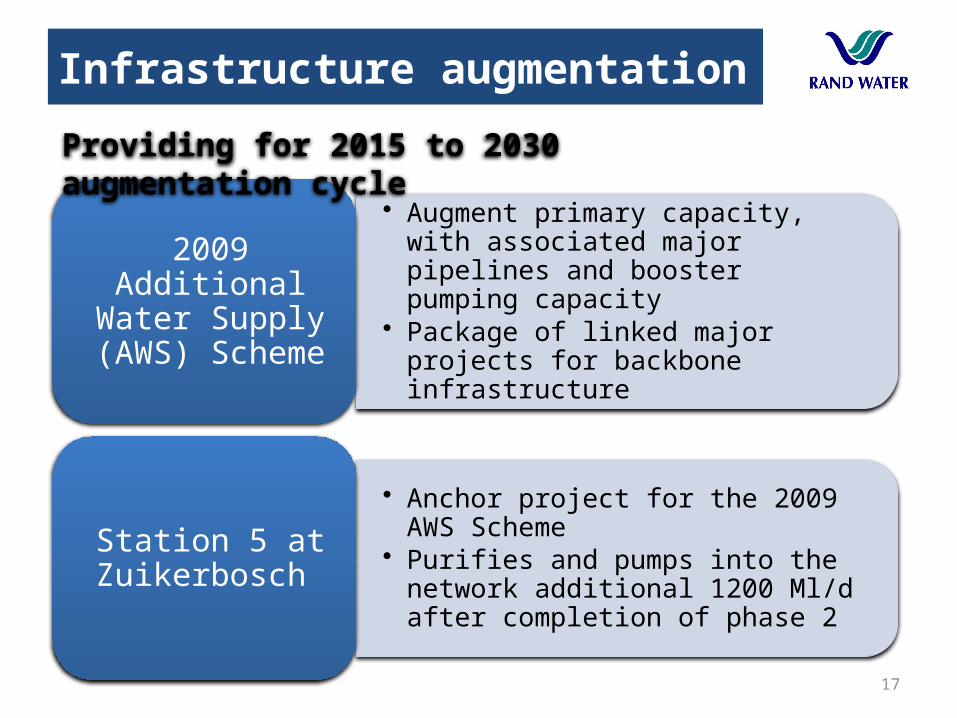
Infrastructure augmentation
17
• Augment primary capacity, with associated major pipelines and booster pumping capacity
• Package of linked major projects for backbone infrastructure
2009 Additional Water Supply (AWS)
Scheme
• Anchor project for the 2009 AWS Scheme• Purifies and pumps into the network
additional 1200 Ml/d after completion of phase 2
Station 5 at Zuikerbosch
Providing for 2015 to 2030 augmentation cycle

18
Primary system – 1600 Ml/d growth
Palmiet system – 600 Ml/d growth
Mapleton system – 300 Ml/d growth
Eikenhof system – 400 Ml/d growth
Zwartkopjes system – 300 Ml/d growth
Projected growth in peak day demand = 1600 Ml/d over 15 years
Growth split between four booster systems
North west JhbWest RandRustenburg
Central JhbSouthern areas
Northern JhbTshwaneEkurhuleni
Eastern TshwaneEkurhuleniMpumalanga
Augmenting for 2015 to 2030 cycle
19
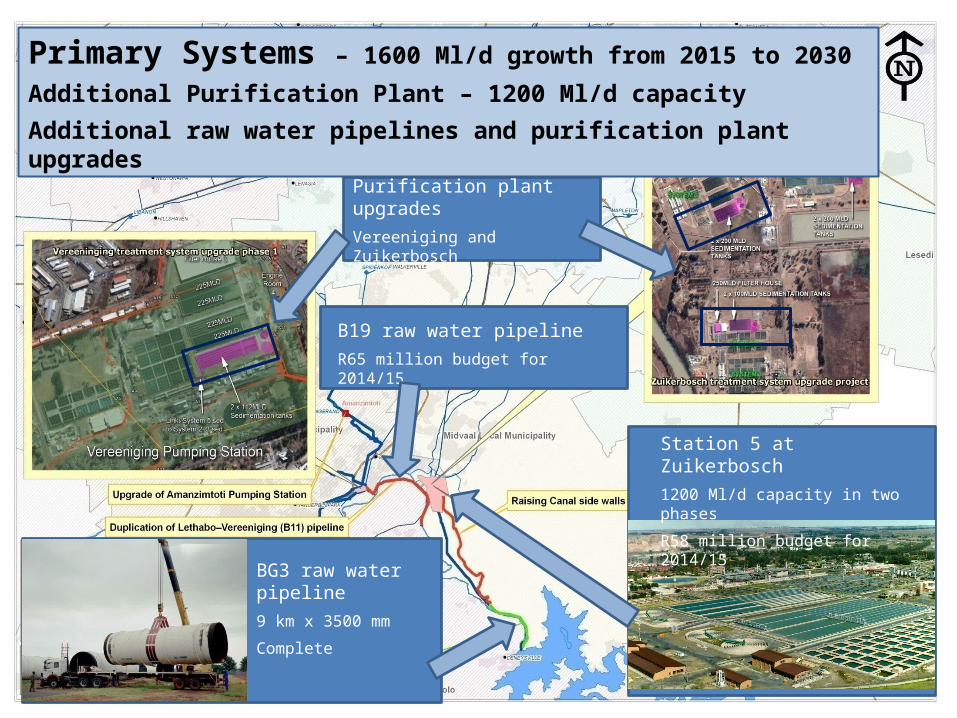
BG3 raw water pipeline
9 km x 3500 mm
Complete
Station 5 at Zuikerbosch
1200 Ml/d capacity in two phases
R58 million budget for 2014/15
B19 raw water pipeline
R65 million budget for 2014/15
Primary Systems – 1600 Ml/d growth from 2015 to 2030
Additional Purification Plant – 1200 Ml/d capacity
Additional raw water pipelines and purification plant upgrades
Purification plant upgrades
Vereeniging and Zuikerbosch
20
Primary system – 1600 Ml/d growth
Palmiet system – 600 Ml/d growth
Mapleton system – 300 Ml/d growth
Eikenhof system – 400 Ml/d growth
Zwartkopjes system – 300 Ml/d growth
Projected growth in peak day demand = 1600 Ml/d over 15 years
Growth split between four booster systems
North west JhbWest RandRustenburg
Central JhbSouthern areas
Northern JhbTshwaneEkurhuleni
Eastern TshwaneEkurhuleniMpumalanga
Augmenting for 2015 to 2030 cycle
21
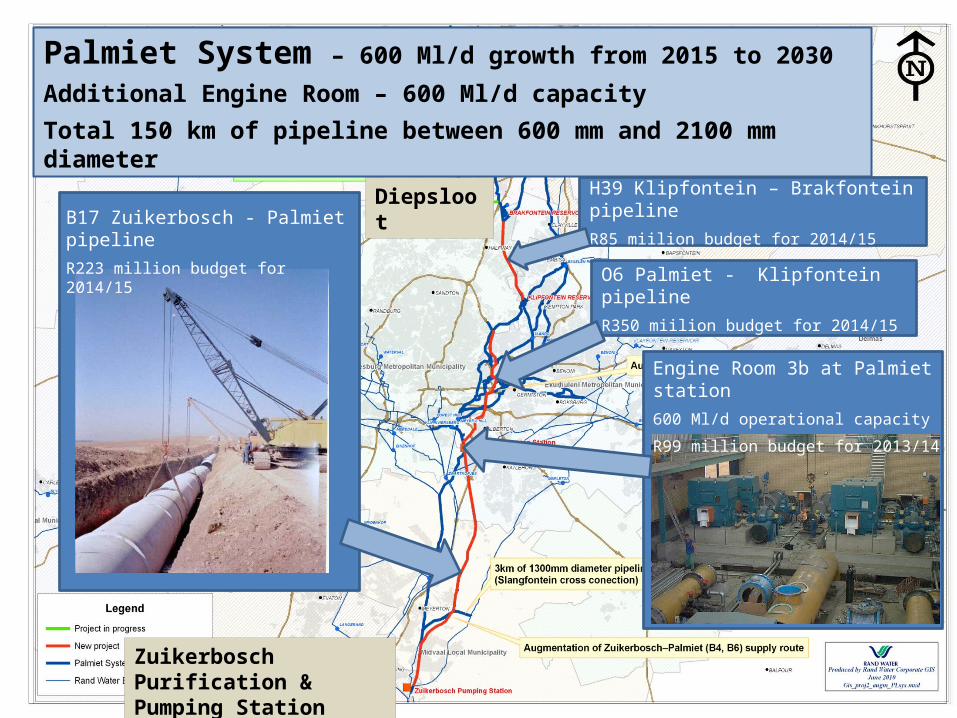
B17 Zuikerbosch - Palmiet pipeline
R223 million budget for 2014/15 O6 Palmiet - Klipfontein pipeline
R350 miilion budget for 2014/15
Engine Room 3b at Palmiet station
600 Ml/d operational capacity
R99 million budget for 2013/14
Palmiet System – 600 Ml/d growth from 2015 to 2030
Additional Engine Room – 600 Ml/d capacity
Total 150 km of pipeline between 600 mm and 2100 mm diameter
Zuikerbosch Purification & Pumping Station
Diepsloot H39 Klipfontein – Brakfontein pipeline
R85 miilion budget for 2014/15

Palmiet Augmentation
22
Pipelines for augmentationItem Description Existing lines
augmentedDiameter
(mm)Length(km)
Required(year)
1.1 Zuikerbosch to Palmiet pipeline B4, B6, B10 2100 46 2017
1.2 Slangfontein cross connection B9 1300 3 2015
1.3 Klipfontein to Brakfontein pipeline (partial)
H12, H21, H27 1700 14.7 2017
1.4 Palmiet – Klipfontein pipeline (phase 1) O2 2100 18 2017
1,5 Palmiet – Klipfontein pipeline (phase 2) O2, part O5 1800 6 2025
1.6 Kwaggaspoort – Gomsand pipeline H22, H28 1000 9.7 2015
1.7 Shamrock Road – Northridge pipeline G28 1200 3.2 2014
1.8 Northridge – Airfield pipeline H3 900 5.8 2017
1.9 Brakfontein – Lyttelton pipeline H12 portion 1500 26 2022
1.10 Lyttelton – Kwaggaspoort p/line H14 portion 1200 6 2022
1.11 Brakfontein – Kwaggaspoort pipeline H25, H30 1700 21 2027
1.12 Kwaggaspoort – Hartebeesthoek pipeline H22, H28, H42 1200 15 2032
1.13 Hartebeesthoek – Rosslyn pipeline H18, H29 ptn 1400 7 2030
1.14 Rosslyn – Soshanguwe pipeline H16, H29 ptn 1200 8 2030
1.15 Kensington – Yeoville pipeline New route 1200 8 2022
Palmiet Augmentation
23
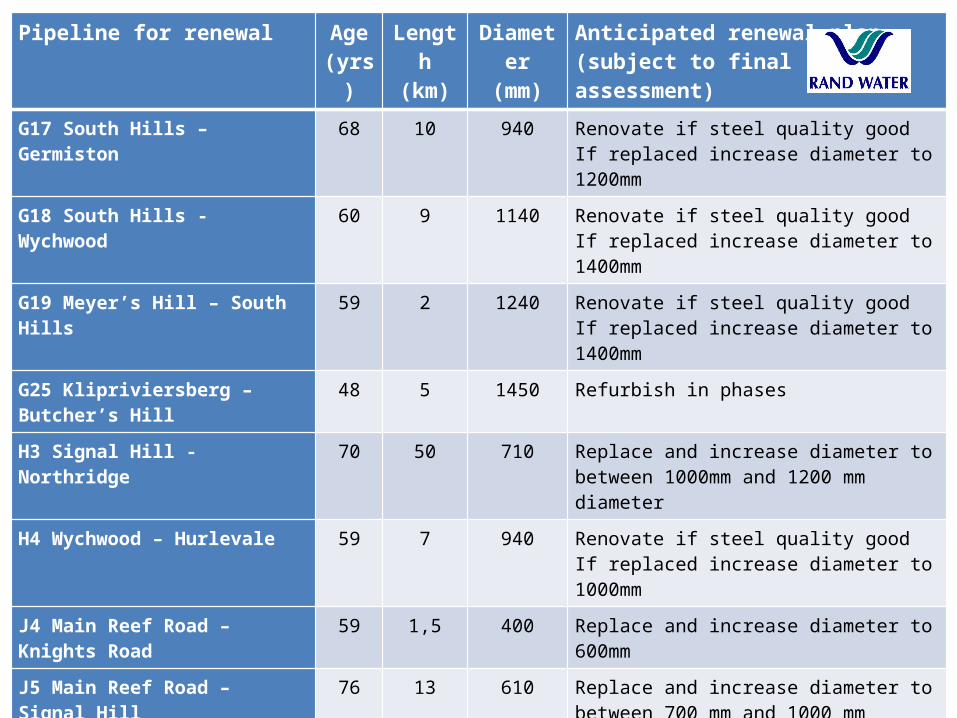
Pipeline for renewal Age(yrs)
Length(km)
Diameter(mm)
Anticipated renewal plan(subject to final assessment)
G17 South Hills – Germiston 68 10 940 Renovate if steel quality goodIf replaced increase diameter to 1200mm
G18 South Hills - Wychwood 60 9 1140 Renovate if steel quality goodIf replaced increase diameter to 1400mm
G19 Meyer’s Hill – South Hills 59 2 1240 Renovate if steel quality goodIf replaced increase diameter to 1400mm
G25 Klipriviersberg – Butcher’s Hill 48 5 1450 Refurbish in phases
H3 Signal Hill - Northridge 70 50 710 Replace and increase diameter to between 1000mm and 1200 mm diameter
H4 Wychwood – Hurlevale 59 7 940 Renovate if steel quality goodIf replaced increase diameter to 1000mm
J4 Main Reef Road – Knights Road 59 1,5 400 Replace and increase diameter to 600mm
J5 Main Reef Road – Signal Hill 76 13 610 Replace and increase diameter to between 700 mm and 1000 mm diameter
J6 Keswick Road – Churchill Avenue 65 2,2 760 Replace and increase diameter to 1000mm
J7 Keswick Road duplication 60 0,9 730 Abandon
O2 Palmiet - Klipfontein 42 33 1800 Refurbish in phases
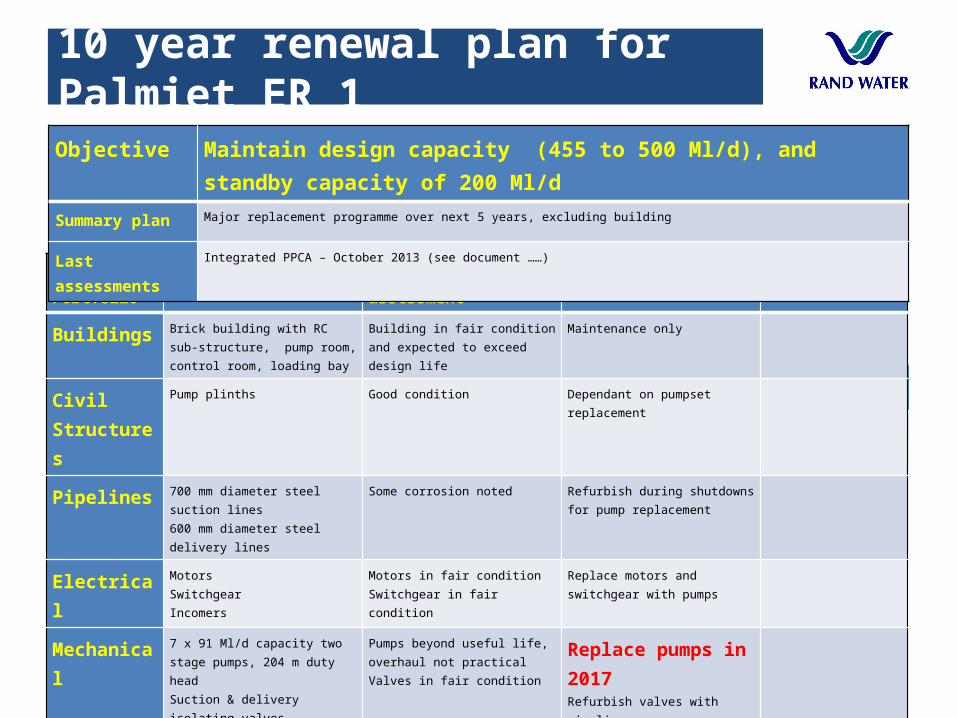
10 year renewal plan for Palmiet ER 1
24
Objective Maintain design capacity with slight increase from 455 Ml/d to 500 Ml/d, and standby capacity of 200 Ml/d
Summary plan Major replacement programme over next 5 years, excluding building
Last assessments Integrated PPCA – October 2013 (see document ……)
Asset Portfolio Summary of assets Results of latest assessment Renewal proposals Estimated cost
Buildings Brick building with RC sub-structure, pump room, control room, loading bay
Building in fair condition and expected to exceed design life
Maintenance only
Civil Structures
Pump plinths Good condition Dependant on pumpset replacement
Pipelines 700 mm diameter steel suction lines600 mm diameter steel delivery lines
Some corrosion noted
Refurbish during shutdowns for pump replacement
Electrical MotorsSwitchgearIncomers
Motors in fair conditionSwitchgear in fair condition
Replace motors and switchgear with pumps
Mechanical 7 x 91 Ml/d capacity two stage pumps, 204 m duty headSuction & delivery isolating valvesOverhead crane – 10T capacity
Pumps beyond useful life, overhaul not practicalValves in fair condition
Replace pumps in 2017Refurbish valves with pipelines
Process Not applicable N/A N/A
Automation Control deskPLC panels
Automation not to current RW standards
Upgrade to current standards, existing project …….
Objective Maintain design capacity (455 to 500 Ml/d), and standby capacity of 200 Ml/d
Summary plan Major replacement programme over next 5 years, excluding building
Last assessments Integrated PPCA – October 2013 (see document ……)

25
Primary system – 1600 Ml/d growth
Palmiet system – 600 Ml/d growth
Mapleton system – 300 Ml/d growth
Eikenhof system – 400 Ml/d growth
Zwartkopjes system – 300 Ml/d growth
Projected growth in peak day demand = 1600 Ml/d over 15 years
Growth split between four booster systems
North west JhbWest RandRustenburg
Central JhbSouthern areas
Northern JhbTshwaneEkurhuleni
Eastern TshwaneEkurhuleniMpumalanga
Augmenting for 2015 to 2030 cycle
26
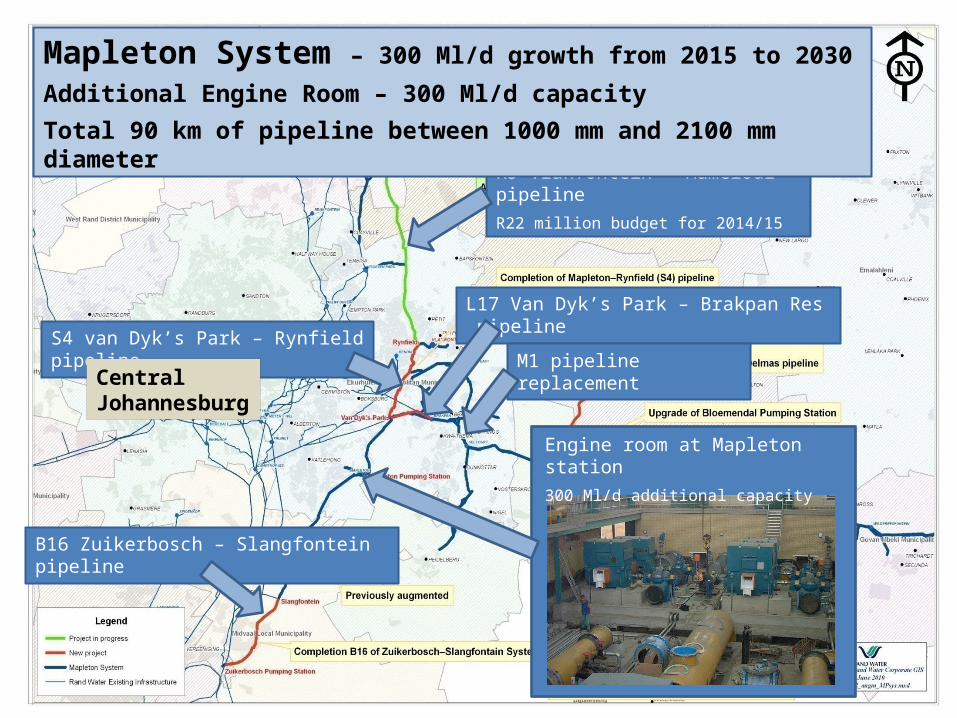
R5 Vlakfontein – Mamelodi pipeline
R22 million budget for 2014/15
L17 Van Dyk’s Park – Brakpan Res pipeline
Engine room at Mapleton station
300 Ml/d additional capacity
S4 van Dyk’s Park – Rynfield pipeline
Mapleton System – 300 Ml/d growth from 2015 to 2030
Additional Engine Room – 300 Ml/d capacity
Total 90 km of pipeline between 1000 mm and 2100 mm diameter
Central Johannesburg
B16 Zuikerbosch – Slangfontein pipeline
M1 pipeline replacement

27
Soweto priority for WDM
Lanseria
Southern and Central areas – 300 Ml/d growth from 2015 to 2030
Western and North Western areas – 400 Ml/d growth from 2015 to 2030
H40 Weltevreden – Cosmo City pipeline
C6 Zwartkopjes – East Rand pipeline replacement
A6 Vereeniging – Zwartkopjes pipeline replacement
B1, B2 pipeline refurbishment
CONTENT
1. Demand growth forecast
2. Augmentation & renewal plan to 2030
3. Capital budget
28

Capital budget for 2014/15
29
• Augmentation projects – R1,6 billion• Renewal projects – R1 billion• Current replacement value – R80 billion
Annual budget 2014/15
• Forecast average demand growth of 1.75% per annum to 2030
• Equates to about R1,4 bn per annum
Theoretical augmentation spend
• Should spend 1% - 2% pa on renewal• Equates to R0,8 – R1,6 billion per annum
Theoretical renewal spend

5-year Capital Expenditure (2015/19) forecast of R13 billion for continuing business
System Augmentation (Rm)
Renewal(Rm)
Total (Rm)
Eikenhof 492 694 1186
Mapleton 956 734 1690
Palmiet 2,106 929 3,035
Primary systems 3,641 2,096 5,737
Zwartkopjes 453 954 1,407
Total 7,647 (59%) 5,406 (41%) 13,053 (100%)
30
Note: the share of spend going to renewal of existing infrastructure has increased from 30% to 40% over the recent past. It is intended to increase this share further to ensure continued functionality of ageing infrastructure
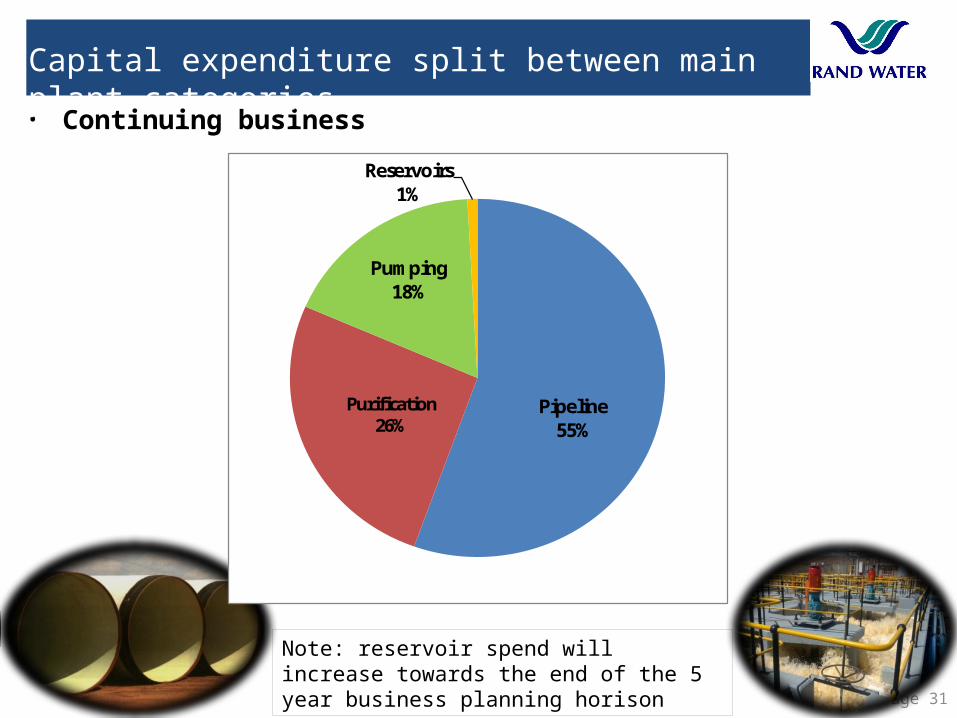
• Continuing business
Pipeline55%
Purification26%
Pumping18%
Reservoirs1%
Page 31
Capital expenditure split between main plant categories
Note: reservoir spend will increase towards the end of the 5 year business planning horison

2008/09
2009/10
2010/11
2011/12
2012/13
2013/14
2014/15
2015/16
2016/17
2017/18
2018/19
0
500
1000
1500
2000
2500
3000
Financial year
R m
illio
n
Capital expenditure forecast
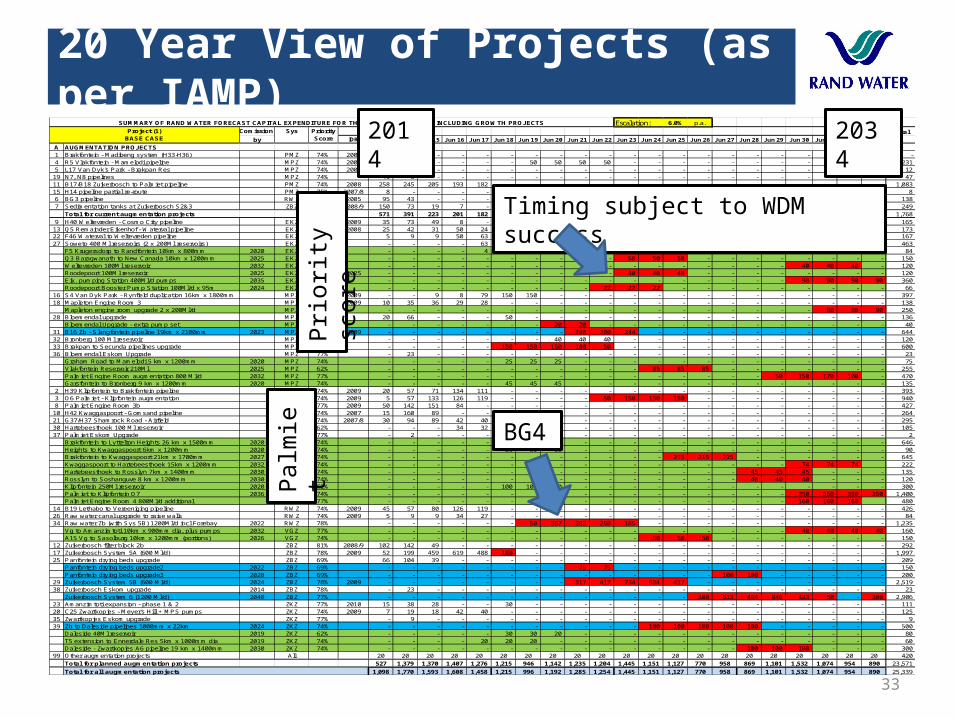
20 Year View of Projects (as per IAMP)
33
Escalation: 6.0% p.a.
Comission 1.00 1.06 1.12 1.19 1.26 Totalby IDR Jun 13 Jun 14 Jun 15 Jun 16 Jun 17 Jun 18 Jun 19 Jun 20 Jun 21 Jun 22 Jun 23 Jun 24 Jun 25 Jun 26 Jun 27 Jun 28 Jun 29 Jun 30 Jun 31 Jun 32 Jun-33
A AUGMENTATION PROJECTS1 Brakfontein - Madibeng system (H33-H36) PMZ 74% 2005 - - - - - - - - - - - - - - - - - - - - - - 4 R5 Vlakfontein - Mamelodi pipeline MPZ 74% 2005 7 24 - - - - 50 50 50 50 - - - - - - - - - - - 231 5 L17 Van Dyk's Park - Brakpan Res MPZ 74% 2007 12 - - - - - - - - - - - - - - - - - - - - 12
19 N7, N8 pipelines MPZ 74% 41 6 - - - - - - - - - - - - - - - - - - - 47 11 B17/B18 Zuikerbosch to Palmiet pipeline PMZ 74% 2008 258 245 205 193 182 - - - - - - - - - - - - - - - - 1,083 15 H14 pipeline partial re-route PMZ 75% 2007/8 8 - - - - - - - - - - - - - - - - - - - - 8 6 BG3 pipeline RWZ 74% 2005 95 43 - - - - - - - - - - - - - - - - - - - 138 7 Sedimentation tanks at Zuikerbosch S2&3 ZBZ 81% 2008/9 150 73 19 7 - - - - - - - - - - - - - - - - - 249
Total for current augmentation projects 571 391 223 201 182 - 50 50 50 50 - - - - - - - - - - - 1,768 9 H40 Weltevreden - Cosmo City pipeline EKZ 74% 2009 35 73 49 8 - - - - - - - - - - - - - - - - - 165
13 Q5 Remainder Eikenhof - Waterval pipeline EKZ 74% 2008 25 42 31 50 24 - - - - - - - - - - - - - - - - 173 22 F46 Waterval to Weltevreden pipeline EKZ 74% 5 9 9 50 63 30 - - - - - - - - - - - - - - - 167 27 Soweto 400 Ml reservoirs (2 x 200Ml reservoirs) EKZ 62% - - - - 63 80 80 80 80 80 - - - - - - - - - - - 463
F5 Krugersdorp to Randfontein 10km x 800mm 2020 EKZ 74% - - - - 4 20 30 30 - - - - - - - - - - - - - 84 Q3 Baragwanath to New Canada 10km x 1200mm 2025 EKZ 74% - - - - - - - - - - 50 50 50 - - - - - - - - 150 Weltevreden 100Ml reservoir 2032 EKZ 62% - - - - - - - - - - - - - - - - - 40 40 40 - 120 Roodepoort 100Ml reservoir 2025 EKZ 62% 2025 - - - - - - - - - - 40 40 40 - - - - - - - - 120 Eik. pumping Station 400Ml/d pumps 2035 EKZ 77% - - - - - - - - - - - - - - - - - 90 90 90 90 360 Roodepoort Booster Pump Station 100Ml/d x 95m 2024 EKZ 77% - - - - - - - - - 22 22 22 - - - - - - - - - 66
16 S4 Van Dyk Park - Rynfield duplication 16km x 1800mm MPZ 74% 2009 - - 9 8 79 150 150 - - - - - - - - - - - - - - 397 18 Mapleton Engine Room 3 MPZ 77% 2009 10 35 36 29 28 - - - - - - - - - - - - - - - - 138
Mapleton engine room upgrade 2 x 200Ml/d MPZ 77% - - - - - - - - - - - - - - - - - - 80 80 90 250 28 Bloemendal upgrade MPZ 77% 20 66 - - - 50 - - - - - - - - - - - - - - - 136
Bloemendal Upgrade - extra pump set MPZ 77% - - - - - - - 20 20 - - - - - - - - - - - - 40 31 B16 Zb - Slangfontein pipeline 19km x 2100mm 2023 MPZ 62% 2009 - - - - - - - - 200 200 244 - - - - - - - - - - 644 32 Bronberg 100 Ml reservoir MPZ 62% - - - - - - - 40 40 40 - - - - - - - - - - - 120 33 Brakpan to Secunda pipelines upgrade MPZ 74% - - - - - 150 150 150 100 50 - - - - - - - - - - - 600 36 Bloemendal Eskom Upgrade MPZ 77% - 23 - - - - - - - - - - - - - - - - - - - 23
Graham Road to Mamelodi 5 km x 1200mm 2020 MPZ 74% - - - - - 25 25 25 - - - - - - - - - - - - - 75 Vlakfontein Reservoir 210Ml 2025 MPZ 62% - - - - - - - - - - - 85 85 85 - - - - - - - 255 Palmiet Engine Room augmentation 800 Ml/d 2032 MPZ 77% - - - - - - - - - - - - - - - - 50 150 170 100 - 470 Garsfontein to Bronberg 9 km x 1200mm 2020 MPZ 74% - - - - - 45 45 45 - - - - - - - - - - - - - 135
2 H39 Klipfontein to Brakfontein pipeline PMZ 74% 2009 20 57 71 134 111 - - - - - - - - - - - - - - - - 393 3 O6 Palmiet - Klipfontein augmentation PMZ 74% 2009 5 57 133 126 119 - - - - 50 150 150 150 - - - - - - - - 940 8 Palmiet Engine Room 3b PMZ 77% 2009 50 142 151 84 - - - - - - - - - - - - - - - - - 427
10 H42 Kwaggaspoort - Gomsand pipeline PMZ 74% 2007 15 160 89 - - - - - - - - - - - - - - - - - - 264 21 G37/H37 Shamrock Road - Airfield PMZ 74% 2007/8 30 94 89 42 40 - - - - - - - - - - - - - - - - 295 30 Hartebeesthoek 100 Ml reservoir PMZ 62% - - - 34 32 40 - - - - - - - - - - - - - - - 105 37 Palmiet Eskom Upgrade PMZ 77% - 2 - - - - - - - - - - - - - - - - - - - 2
Brakfontein to Lyttelton Heights 26 km x 1500mm 2020 PMZ 74% - - - - - 215 216 215 - - - - - - - - - - - - - 646 Heights to Kwaggaspoort 6km x 1200mm 2020 PMZ 74% - - - - - 30 30 30 - - - - - - - - - - - - - 90 Brakfontein to Kwaggaspoort 21km x 1700mm 2027 PMZ 74% - - - - - - - - - - - - 215 215 215 - - - - - - 645 Kwaggaspoort to Hartebeesthoek 15km x 1200mm 2032 PMZ 74% - - - - - - - - - - - - - - - - - 74 74 74 222 Hartebeesthoek to Rosslyn 7km x 1400mm 2030 PMZ 74% - - - - - - - - - - - - - - - 45 45 45 - - - 135 Rosslyn to Soshanguve 8 km x 1200mm 2030 PMZ 74% - - - - - - - - - - - - - - - 40 40 40 - - - 120 Klipfontein 250Ml reservoir 2020 PMZ 62% - - - - - 100 100 100 - - - - - - - - - - - - - 300 Palmiet to Klipfontein O7 2036 PMZ 74% - - - - - - - - - - - - - - - - - 350 350 350 350 1,400 Palmiet Engine Room 4 800Ml/d additional PMZ 77% - - - - - - - - - - - - - - - - - 160 160 160 480
14 B19 Lethabo to Vereeniging pipeline RWZ 74% 2009 45 57 80 126 119 - - - - - - - - - - - - - - - - 426 26 Raw water canal upgrade to raise walls RWZ 74% 2009 5 9 9 34 27 - - - - - - - - - - - - - - - - 84 34 Raw water Zb (with Sys 5B) 1200Ml/d incl Forebay 2022 RWZ 78% - - - - - - 50 367 383 250 185 - - - - - - - - - - 1,235
Vg to Amanzimtoti 10km x 900mm dia, plus pumps 2032 VGZ 77% - - - - - - - - - - - - - - - - - 40 40 40 40 160 A15 Vg to Sasolburg 10km x 1200mm (portions) 2026 VGZ 74% - - - - - - - - - - - 50 50 50 - - - - - - - 150
12 Zuikerbosch filter block 2b ZBZ 81% 2008/9 102 142 49 - - - - - - - - - - - - - - - - - - 292 17 Zuikerbosch System 5A (600 Ml/d) ZBZ 78% 2009 52 199 459 619 488 180 - - - - - - - - - - - - - - - 1,997 25 Panfontein drying beds upgrade ZBZ 69% 66 104 39 - - - - - - - - - - - - - - - - - - 209
Panfontein drying beds upgrade2 2022 ZBZ 69% - - - - - - - - 75 75 - - - - - - - - - - - 150 Panfontein drying beds upgrade3 2028 ZBZ 69% - - - - - - - - - - - - - - 100 100 - - - - - 200
29 Zuikerbosch System 5B (600 Ml/d) 2024 ZBZ 78% 2009 - - - - - - - - 317 417 734 634 417 - - - - - - - - 2,519 38 Zuikerbosch Eskom upgrade 2014 ZBZ 78% - 23 - - - - - - - - - - - - - - - - - - - 23
Zuikerbosch System 6 (1200 Ml/d) 2040 ZBZ 77% - - - - - - - - - - - - - 300 523 464 846 423 50 - 300 2,906 23 Amanzimtoti expansion - phase 1 & 2 ZKZ 77% 2010 15 38 28 - - 30 - - - - - - - - - - - - - - - 111 20 C25 Zwartkopjes - Meyer's Hill + MPS pumps ZKZ 74% 2009 7 19 18 42 40 - - - - - - - - - - - - - - - - 125 35 Zwartkopjes Eskom upgrade ZKZ 77% - 9 - - - - - - - - - - - - - - - - - - - 9 39 Zb to Daleside pipelines 1000mm x 22km 2024 ZKZ 74% - - - - - - - - - - - 100 100 100 100 100 - - - - - 500
Daleside 40Ml reservoir 2019 ZKZ 62% - - - - - 30 30 20 - - - - - - - - - - - - - 80 T5 extension to Ennerdale Res 5km x 1000mm dia 2019 ZKZ 74% - - - - 20 20 20 - - - - - - - - - - - - - - 60 Daleside - Zwartkopjes A6 pipeline 19 km x 1400mm 2030 ZKZ 74% - - - - - - - - - - - - - - - 100 100 100 - - - 300
99 Other augmentation projects All 20 20 20 20 20 20 20 20 20 20 20 20 20 20 20 20 20 20 20 20 20 420 Total for planned augmentation projects 527 1,379 1,370 1,407 1,276 1,215 946 1,142 1,235 1,204 1,445 1,151 1,127 770 958 869 1,101 1,532 1,074 954 890 23,571
Total for all augmentation projects 1,098 1,770 1,593 1,608 1,458 1,215 996 1,192 1,285 1,254 1,445 1,151 1,127 770 958 869 1,101 1,532 1,074 954 890 25,339
SUMMARY OF RAND WATER FORECAST CAPITAL EXPENDITURE FOR THE PERIOD 2013 TO 2033 INCLUDING GROWTH PROJECTS
Project (1)BASE CASE
Sys PriorityScore 2014 2034
Pal
mie
t
Timing subject to WDM success
Prio
rity
scor
e
BG4
THANK YOU
34