raising capital through private equity and venture capital presentation by bruce norlund of economic...
TRANSCRIPT

Raising Capital Through
Private Equity and Venture Capital
Presentation
by
Bruce Norlund
of
Economic Policy Reform & Competitiveness – Chemonics
Ulaanbaatar, Mongolia
Topics Covered
History and structure of the private equity industry
Stages in venture capital financing
Building a winning business plan
Cash flow forecasting
Valuation
Deal structuring
Legal, regulatory and control issues
Question and Answer Session
Origins, History and Development of the Private Equity Industry
Private “Risk Capital” is not newMarcus Crassus of Ancient RomeChristopher Columbus
“Professional” Venture Capital Investing fairly recent phenomenon

Modern History
VC = $157 Billion in U.S.Over $240 Billion Worldwide
20001999
1998
High-tech ventureCapital takes hold inSilicon Valley
VC = $26 billion
1988
VC = $3.7 billion
1980
Small business Investment Incentive Act
19791978
Employee Retirement Income Security Act (ERISA)
VC = $481 million
19561946
Thermo Electron Launches first “incubator”
J.H. Whitney & Co., and American Research & Development launch first venture capital fund
2004

Bootstrapping
Avoid seeking capital as long as possible
Techniques: Prepaid licenses, royalties or advances from customers Development of product while working elseware Customer funded research Free access to hardware Business alliances Compensating systems

Participants in the Industry
Commercial Banks
Equity Markets
Non-Financial Corporations
Venture Capitalists
Angel Investors
Founder, Family & Friends
Micro - Lenders

Angel Investors
Wealthy individuals
Business people who have “cashed out”
Angel Syndicates
Angels continued
Oldest, largest and most often used source of outside funds for
entrepreneurial firms
In the U.S. alone – 3 million angels – investing $50 Billion every year
Fund 30-40 times as many firms as formal venture capital funds
Ford, Apple, Amazon.com
Bring many advantages to their investments
Difficult to find
Market may double in next decade

Angels’ CharacteristicsValue Adding
Geographically DispersedMore permissive investors
Investment CharacteristicsSeek smaller deals
Prefer start-ups and early-stageInvest in all industry sectors
Like high-tech firms
Added BonusesLeveraging effect
Give loan guaranteesNo high fees
Little follow-on money
Want a say in the firm
Could turn out to be “devils”
No national reputation to
leverage
Business Angels
Advantages
Disadvantages
Venture Capitalists
Venture Capital Funds
Insurance Companies
Pension Funds
Divisions of Merchant Banks
Corporations

VCs in Asia
OPIC Asia Fund
JP Morgan Partners (Asia Opportunity Fund)
H&Q Asia Pacific
HSBC
Baring Private Equity Asia
Olympus Capital
Central Asia Small Enterprise Fund
Schroder Capital Partners (Asia) Ltd.
AsiaTech Ventures Ltd
PPM Ventures (Asia) Ltd
Latitude Capital Group
Canadian World Fund Limited
China Fund
Emerging Markets Telecommunication
Gabelli Global Multimedia Trust
Greater China Fund
Jardine Fleming China Region Fund
Korea Equity Fund
Latin America Equity Fund
Latin American Discovery Fund
Morgan Stanley Asia Pacific Fund
Morgan Stanley Emerging Markets
Saffron Fund
Scudder New Asia Fund
Templeton China World Fund
Templeton Dragon Fund
Templeton Emerging Markets Fund
Pantheon Capital (Asia)
Carlyle Group
Prudential (Asia)
Warburg Pincus
Asia Pacific Fund
Asia Tigers Fund

Investors’ Criteria Strong Management Team
Large and growing market for goods or services – good IDEAS
Compounded annual rates of return that investors typically expect, based on the stage of the venture:
Start-up 50%-70% - No revenues First Stage 40%-60% - Starting to
generate revenues Second Stage 30%-40% - Starting to generate
profits Third Stage 10%-30% - Strong market
position – ready to expand further
Participation and board membership Founder’s ongoing commitment Planned exit (explicit) Well prepared documentation and financials

Transaction types Depends on the “Stage” of the Deal
Traditional Start-up
Growth-Equity
Turn-Around Investment
Leveraged or Management Buyout
Industry Consolidation
Exits

Stages in Venture Capital Financing
“Start-Up” or First Round
Development or Second Round
Expansion or Third Round
Growth or Fourth Round
Leverage Buy-Outs
Turnaround Situations
Public Offerings

“Private Equity”… a Real Alternative for Companies That Want to Grow
Term – typically 3 – 7 years
No interest payable, normally the investor prefers no dividends to be paid
out.
Money is injected into the company via a share capital increase.
The new investor takes no guarantees or collateral, but shares in the risks
and rewards of ownership.

How PE Finance Works
2001 2002 2003 2004 2005 2006
Value of the Company USDm USDm USDm USDm USDm USDm
Value of founder’s shares
(67%) 2.00 2.80 3.92 5.49 7.68 10.76
Value of new investor’s shares
(33%) 1.00 1.40 1.96 2.74 3.84 5.38
Total (100%) 3.00 4.20 5.88 8.23 11.52 16.13 +40% pa
40% 40% 40% 40% 40%
ValuationValuation

Raising Capital Process Overview Step 1 – Strategy
Step 2 – Preparation of the Information Memorandum
Step 3 – Targeting Investors
Step 4 – Presentation to Investors
Step 5 – Negotiation with Investors
Step 6 – Structuring the Transaction
Step 7 – Investor Due Diligence
Step 8 – Closing
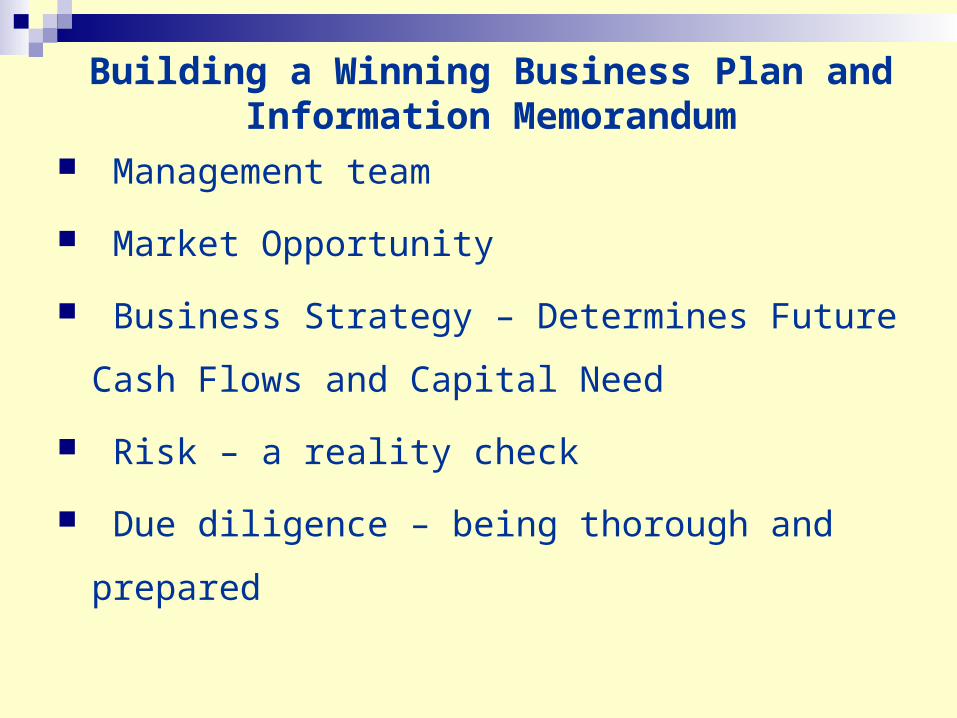
Building a Winning Business Plan and Information Memorandum
Management team
Market Opportunity
Business Strategy – Determines Future Cash Flows
and Capital Need
Risk – a reality check
Due diligence – being thorough and prepared
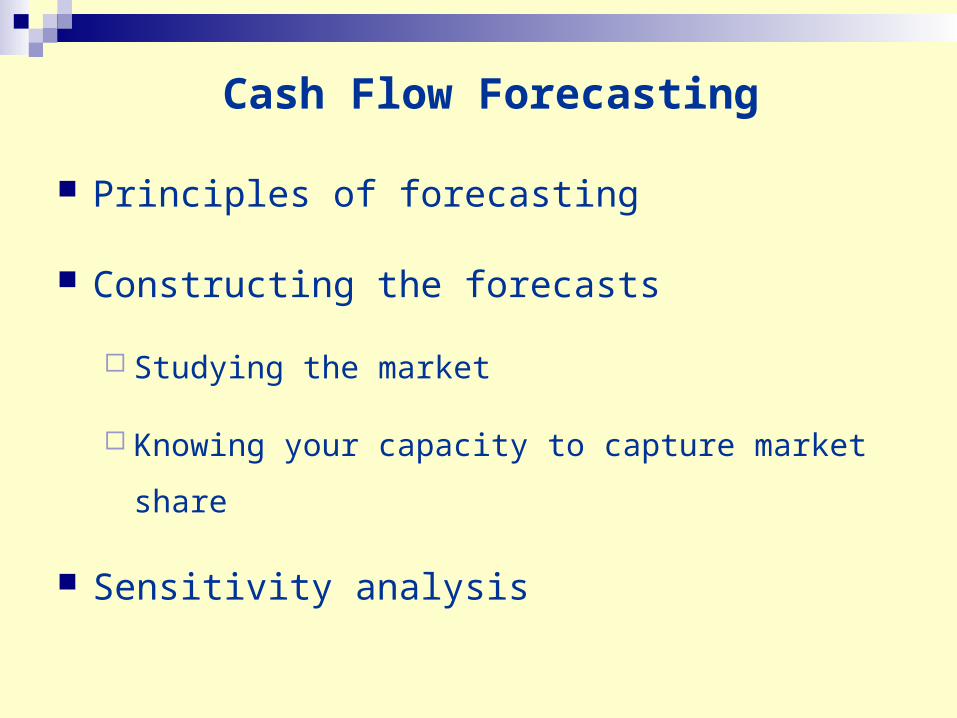
Cash Flow Forecasting
Principles of forecasting
Constructing the forecasts
Studying the market
Knowing your capacity to capture market share
Sensitivity analysis

Fundamental Analysis
Overview of firm and its strategies
Evaluate the structure of the industry
Evaluate firm’s current economic position
Predict future course of firm
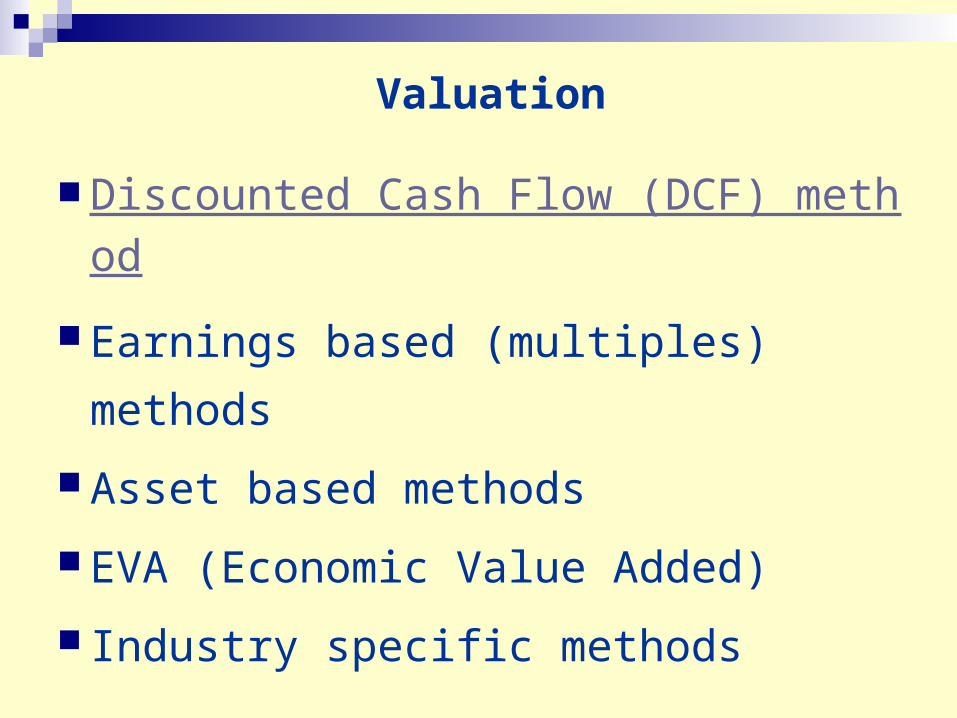
Valuation
Discounted Cash Flow (DCF) method
Earnings based (multiples) methods
Asset based methods
EVA (Economic Value Added)
Industry specific methods

The Need For Company Valuations
To support company owners seeking additional equity finance
To guide stock market investors
To guide strategic buyers
To support company owners “Cashing Out”

Discounted Cash Flow Method (DCF)
DCF relies on the principle “Time Value of Money”
Based on the overwhelming evidence that a company’s value is strongly correlated to the sum of its discounted cash flows.
All the cash flows including capital expenditure are discounted over a chosen period of time.

Discounting and the
Time Value of Money
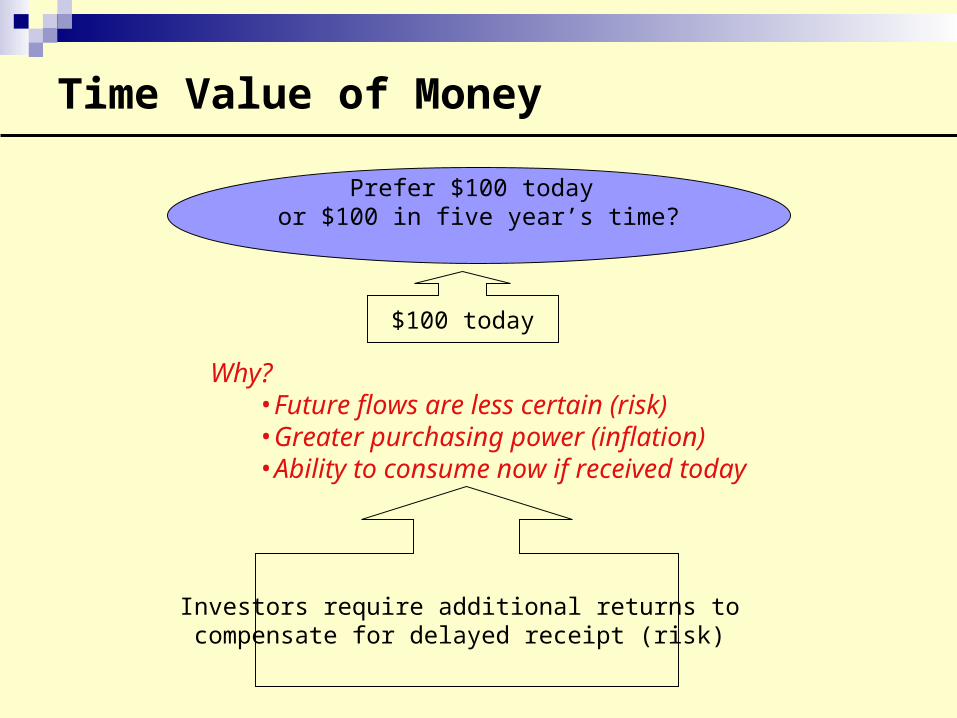
Time Value of Money
Prefer $100 today or $100 in five year’s time?
Investors require additional returns to compensate for delayed receipt (risk)
$100 today
Why?•Future flows are less certain (risk)•Greater purchasing power (inflation)•Ability to consume now if received today
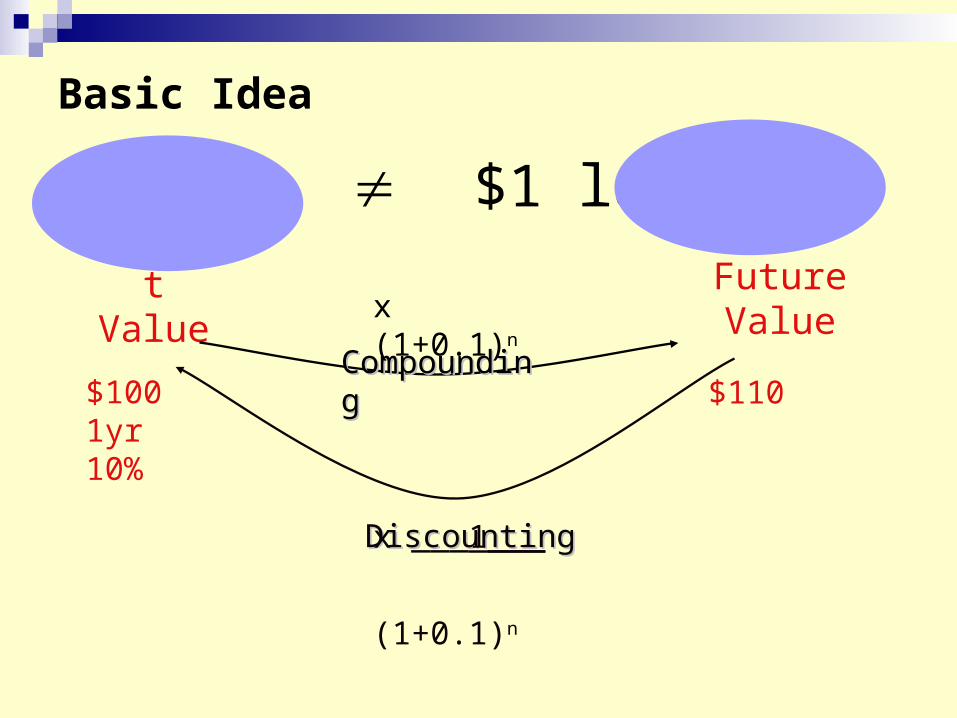
Basic Idea
$1 now $1 laterPresent Value
Future Value
CompoundingCompounding
DiscountingDiscounting
$1001yr 10%
$110
x (1+0.1)n
x ___1___
(1+0.1)n

Compounding
To calculate the future value (FV) of a single future cash flow
Present Value t0 X n
r
1
r = required return/time value of money/discount rate
n = number of time periods form today
= Future Value tn
Compound Factor

Simple FV Example
Question 1
What is the Future Value (FV) in 3 years of $1000 deposited today in a bank at an interest rate of 10%?
First – Break apart the question:
PV = $1000
Rate = 10%
Time = 3 Years

Future Value Table
FVIF i,n or the Compound Sum of $1
n 1% 2% 3% 4% 5% 6% 7% 8% 9% 10%1 1.01 1.02 1.03 1.04 1.05 1.06 1.07 1.08 1.09 1.12 1.02 1.04 1.061 1.082 1.102 1.124 1.145 1.166 1.188 1.213 1.03 1.061 1.093 1.125 1.158 1.191 1.225 1.26 1.295 1.3314 1.041 1.082 1.126 1.17 1.216 1.262 1.311 1.36 1.412 1.4645 1.051 1.104 1.159 1.217 1.276 1.338 1.403 1.469 1.539 1.6116 1.062 1.126 1.194 1.265 1.34 1.419 1.501 1.587 1.677 1.7727 1.072 1.149 1.23 1.316 1.407 1.504 1.606 1.714 1.828 1.9498 1.083 1.172 1.267 1.369 1.477 1.594 1.718 1.851 1.993 2.1449 1.094 1.195 1.305 1.423 1.551 1.689 1.838 1.999 2.172 2.358
10 1.105 1.219 1.344 1.48 1.629 1.791 1.967 2.159 2.367 2.59411 1.116 1.243 1.384 1.539 1.71 1.898 2.105 2.332 2.58 2.85312 1.127 1.268 1.426 1.601 1.796 2.012 2.252 2.518 2.813 3.13813 1.138 1.294 1.469 1.665 1.886 2.133 2.41 2.72 3.066 3.45214 1.149 1.319 1.513 1.732 1.98 2.261 2.579 2.937 3.342 3.79715 1.161 1.346 1.558 1.801 2.079 2.397 2.759 3.172 3.642 4.177

Compounding Interest
Deposit $1,000 now for three years at 10% interest per year
Final value assuming compound interest?
Base annual interest on opening balance + Interest to date
t0 t1 t2 t3
+10% interest
= $100
$1000 $1,331$1,100 $1,210+10% interest
= $110
+10% interest
= $121
X 1.1 X 1.1 X 1.1
Final value = $1,000 x 1.13 = $1,331
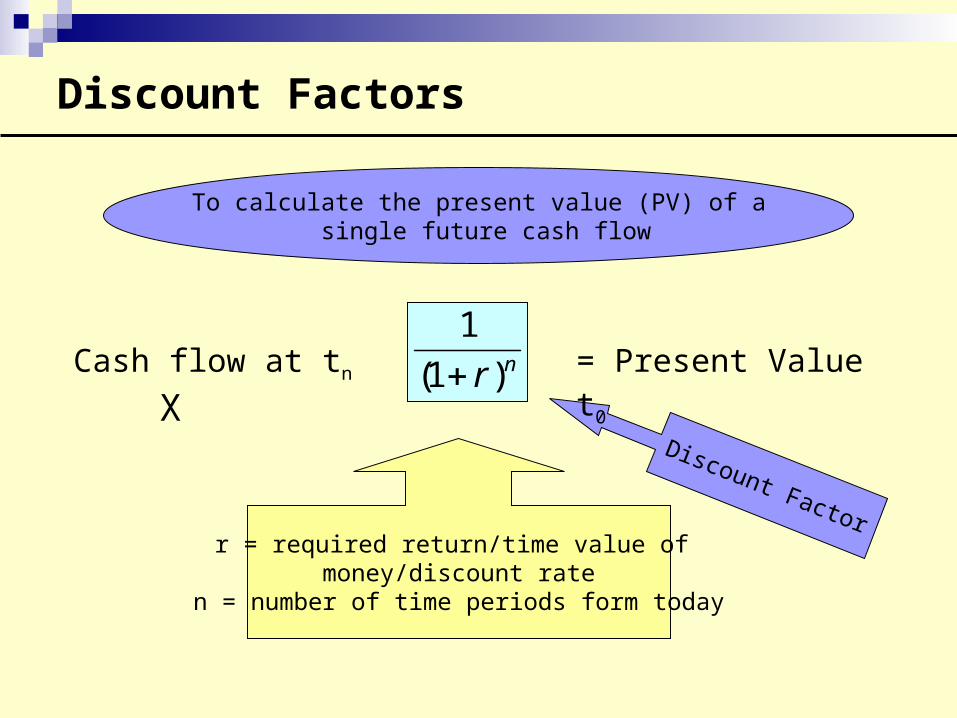
Discount Factors
To calculate the present value (PV) of a single future cash flow
Cash flow at tn X nr)1(
1
r = required return/time value of money/discount rate
n = number of time periods form today
Discount Factor
= Present Value t0

Simple PV Example
Question 2
What is the Present Value (PV) of $100 paid to us 10 years from now with a discount rate of 10%?
First – Break apart the question:
FV = $100
Rate = 10%
Time = Year 10

Periods/Interest Rate 1% 2% 3% 4% 5% 6% 7% 8% 9% 10% 11% 12% 13% 14% 15% 16%
1 0.99 0.9803 0.9708 0.9615 0.9523 0.9433 0.9345 0.9259 0.9174 0.909 0.9009 0.8928 0.8849 0.8771 0.8695 0.8622 0.9802 0.9611 0.9425 0.9245 0.907 0.8899 0.8734 0.8573 0.8416 0.8264 0.8116 0.7971 0.7831 0.7694 0.7561 0.74313 0.9705 0.9423 0.9151 0.8889 0.8638 0.8396 0.8162 0.7938 0.7721 0.7513 0.7311 0.7117 0.693 0.6749 0.6575 0.64064 0.9609 0.9238 0.8884 0.8548 0.8227 0.792 0.7628 0.735 0.7084 0.683 0.6587 0.6355 0.6133 0.592 0.5717 0.55225 0.9514 0.9057 0.8626 0.8219 0.7835 0.7472 0.7129 0.6805 0.6499 0.6209 0.5934 0.5674 0.5427 0.5193 0.4971 0.47616 0.942 0.8879 0.8374 0.7903 0.7462 0.7049 0.6663 0.6301 0.5962 0.5644 0.5346 0.5066 0.4803 0.4555 0.4323 0.41047 0.9327 0.8705 0.813 0.7599 0.7106 0.665 0.6227 0.5834 0.547 0.5131 0.4816 0.4523 0.425 0.3996 0.3759 0.35388 0.9234 0.8534 0.7894 0.7306 0.6768 0.6274 0.582 0.5402 0.5018 0.4665 0.4339 0.4038 0.3761 0.3505 0.3269 0.3059 0.9143 0.8367 0.7664 0.7025 0.6446 0.5918 0.5439 0.5002 0.4604 0.424 0.3909 0.3606 0.3328 0.3075 0.2842 0.2629
10 0.9052 0.8203 0.744 0.6755 0.6139 0.5583 0.5083 0.4631 0.4224 0.3855 0.3521 0.3219 0.2945 0.2697 0.2471 0.226611 0.8963 0.8042 0.7224 0.6495 0.5846 0.5267 0.475 0.4288 0.3875 0.3504 0.3172 0.2874 0.2606 0.2366 0.2149 0.195412 0.8874 0.7884 0.7013 0.6245 0.5568 0.4969 0.444 0.3971 0.3555 0.3186 0.2858 0.2566 0.2307 0.2075 0.1869 0.168413 0.8786 0.773 0.6809 0.6005 0.5303 0.4688 0.4149 0.3676 0.3261 0.2896 0.2575 0.2291 0.2041 0.182 0.1625 0.145214 0.8699 0.7578 0.6611 0.5774 0.505 0.4423 0.3878 0.3404 0.2992 0.2633 0.2319 0.2046 0.1806 0.1597 0.1413 0.125115 0.8613 0.743 0.6418 0.5552 0.481 0.4172 0.3624 0.3152 0.2745 0.2393 0.209 0.1826 0.1598 0.14 0.1228 0.107916 0.8528 0.7284 0.6231 0.5339 0.4581 0.3936 0.3387 0.2918 0.2518 0.2176 0.1882 0.1631 0.1414 0.1228 0.1068 0.09317 0.8443 0.7141 0.605 0.5133 0.4362 0.3713 0.3165 0.2702 0.231 0.1978 0.1696 0.1456 0.1252 0.1077 0.0929 0.080218 0.836 0.7001 0.5873 0.4936 0.4155 0.3503 0.2958 0.2502 0.2119 0.1798 0.1528 0.13 0.1108 0.0945 0.0808 0.069119 0.8277 0.6864 0.5702 0.4746 0.3957 0.3305 0.2765 0.2317 0.1944 0.1635 0.1376 0.1161 0.098 0.0829 0.0702 0.059620 0.8195 0.6729 0.5536 0.4563 0.3768 0.3118 0.2584 0.2145 0.1784 0.1486 0.124 0.1036 0.0867 0.0727 0.0611 0.051321 0.8114 0.6597 0.5375 0.4388 0.3589 0.2941 0.2415 0.1986 0.1636 0.1351 0.1117 0.0925 0.0767 0.0638 0.0531 0.044222 0.8033 0.6468 0.5218 0.4219 0.3418 0.2775 0.2257 0.1839 0.1501 0.1228 0.1006 0.0826 0.0679 0.0559 0.0462 0.038123 0.7954 0.6341 0.5066 0.4057 0.3255 0.2617 0.2109 0.1703 0.1377 0.1116 0.0906 0.0737 0.0601 0.0491 0.0401 0.032924 0.7875 0.6217 0.4919 0.3901 0.31 0.2469 0.1971 0.1576 0.1264 0.1015 0.0817 0.0658 0.0532 0.043 0.0349 0.028325 0.7797 0.6095 0.4776 0.3751 0.2953 0.2329 0.1842 0.146 0.1159 0.0922 0.0736 0.0588 0.0471 0.0377 0.0303 0.024426 0.772 0.5975 0.4636 0.3606 0.2812 0.2198 0.1721 0.1352 0.1063 0.0839 0.0663 0.0525 0.0416 0.0331 0.0264 0.02127 0.7644 0.5858 0.4501 0.3468 0.2678 0.2073 0.1609 0.1251 0.0976 0.0762 0.0597 0.0468 0.0368 0.029 0.0229 0.018128 0.7568 0.5743 0.437 0.3334 0.255 0.1956 0.1504 0.1159 0.0895 0.0693 0.0538 0.0418 0.0326 0.0255 0.0199 0.015629 0.7493 0.5631 0.4243 0.3206 0.2429 0.1845 0.1405 0.1073 0.0821 0.063 0.0484 0.0373 0.0288 0.0223 0.0173 0.013530 0.7419 0.552 0.4119 0.3083 0.2313 0.1741 0.1313 0.0993 0.0753 0.0573 0.0436 0.0333 0.0255 0.0196 0.0151 0.0116
Present Value Interest Factor Table

PV Example Continued
Discount Factor = 0.386
Per tables 10% for 10 years = 0.386
PV x FV nr) (11
$38.60 x $100 10.10) (1
1
Cost of Capital
Difficult to predict
Small changes can have a dramatic effect on the estimated Value created
Discount Factor/Required Rate of Return/Expected Rate of Return

Theory of DCF Company Valuation
70
90100
130140
150160
20
36
43
6974
8085
50 5457
6166
7075
Operating Value
Debt Value
Equity Value
Cash Flow to Debt Holders
Operating Cash Flow
Cash Flow to Equity Owners

Value of Corporation
Value of anything = PV of expected future cash flows
Corporation use Free Cash Flows
EBIT + Depreciation - Taxes - NWC - Capital Spending Free Cash Flows

DCF Example
To apply DCF we have to consider:Time value of money concept.
The “free cash flows” of the business – cash from operating activities available to all investors, both debt and equity, after tax and after investment activities.
The rate of return demanded by investors.

DCF Formula
PV0 = the value of firm at time 0
Et(*) = the expectation, at time t, of *, conditional on information available at time t
CFt = the cash flow available for distribution to the owners of firm’s equity at time t
rt = the Required Return for the equity of the firm, to discount the period t cash flow to time 0
n
t r
TVE
r
CFET
T
Tt
tt
ttPV
1 )1(
)(
)1(
)(0

Bringing the Cash Flows to Today: Project C
Year 0 Year 1 Year 2 Year 3 Year 4 Year 5
150$ 300$ 450$ 600$ 1,875$ x x x x x
0.909 0.826 0.751 0.683 0.621$136.35
$247.80
$337.95
$409.80
$1,164.38
2,296.28$ Total
Value of Cash Flows

DCF Example (Continuation)Year Free Cash Flow
$mDiscount
Factor at 30%Present Value
$m
2001 10.0 1/1.3 = 0.77 7.70
2002 15.0 1/(1.3)2 = 0.59 8.85
2003 16.0 1/(1.3)3 = 0.46 7.36
2004 16.0 1/(1.3)4 = 0.35 5.60
2005 17.0 1/(1.3)5 = 0.27 4.59
Net Present Value 34.1
2005* 17 x 1/0.3 = 56.7
1/(1.3)5 = 0.27
“Terminal” Value 15.3
TOTAL VALUE OF THE BUSINESS 49.4
DEBT <10.0>
VALUE OF EQUITY 39.4
*Assume the business will continue as a going concern generating same cash

Earnings Based Methods
Basic idea is to re-apply ratios of other companies to the company you want to value.
Different Multiples Used P/E, P/B, P/S, etc.
Earnings is normally EBIT but EBITDA also used.
Need comparable accounting policies to be meaningful.
Finding a “comparable” enterprise is always subjective.

Asset Based Methods Generally asset values do not take into account the value management has
created or the value of using the assets (i.e. the intangibles).
Provide a crude basic figure other valuations can be compared with.
3 main methods. Book value - an accounting figure – useful for valuing banks. Net Realizable Value or Break-up Value (what the assets can be sold
for individually) – useful in bankruptcy, absolute minimum a vendor can accept.
Replacement Cost – useful for calculating “Market Entry” value, can be a starting point for an investor.
Other methods (DCF, dividend yield and earnings) DO account for the value management creates.

Economic Value Added (EVA)
Shareholder wealth created when:
(IRR - CC) x invested capital = NPV> 0

Industry Specific Valuation Methods
Such methods normally take the form of indicators that have been proven to create value.
Examples include:Occupancy rates for hotels and airlines.
Subscribers or user numbers for telecoms, cable companies, utilities.

Gas Distribution – Valuation Example
Price paid per user by multinationals in Western Europe $ 1,200 Adjustment for purchasing power climate $ <200> Adjustment for Romania country risk $ <300>
Valuation price per user $ 700 Number of users connected 50,000 Value of gas distribution Company $ 700 x 50,000
$ 35 mil

The Process of Raising Private Equity

The Process of Raising Private Equity
There is a process!
There are rules and protocols.
Credibility is everything.

Step 1 - Strategy
Develop a well thought out, well presented strategy.
Obtain research data and use as basis for projections.
Prepare different scenarios.
Balance vision with realism.
Document as a “Strategic Plan.”

Step 2 – Preparation of the Information Memorandum
The key presentation document written specifically for investors. It is NOT the same as a business plan. Company history and strategy; Market and industry dynamic; Financial forecasts and financing requirement; The investment opportunity and associated risks; Company organization and operations.
An Information Memorandum is written according to accepted industry practices.
Only given to investors if they sign a “Confidentiality Agreement.”

Step 3 – Targeting Investors
Decide on the preferred type of investor:
“FINANCIAL” Angel Investors Venture Capital Funds Private Equity Funds Multilaterals (IFC, EBRD, EIB)
“STRATEGIC” Companies in the same line of business who want to expand. Companies in the similar line of business who want complementary
business
Step 4 – Presentations to Investors The entrepreneur should:
Be fluent in describing the strategy.
Be rehearsed; key facts, figures and other knowledge should be memorized.
Be very familiar with the financial forecasts and financing requirement.
State how the investor may ultimately exit the investment (IPO, purchase by the company over time, sale of the venture to a strategic investor).
Be prepared to answer all conceivable questions about the company.

Step 5 – Negotiations With Investors
Key negotiation points:
Company valuation What percent of the company for the investor’s cash? Rights of the shareholders (especially minority shareholder rights). Management incentives to own more shares based on performance
targets. Amount of debt the company should have.
Ideally, a competitive situation.
If interested – investor will issue a “Term Sheet”

Step 6 – Structuring the Transaction
Consideration of:The most suitable long term combination of equity and
debt;Current interest rates for debt;The amount required;Leasing available;The supply of capital available and practical
considerations.
Preliminary Transaction Structure.

Step 7 – Investor Due Diligence
As an equity investor is taking no collateral and has no guarantees, he needs to do much more “detective work” before he invests his money.
Typically an investor hires one of the “Big 5” and/or a large legal firm, to perform special verification procedures.
These can include: An audit of IAS financial statements. Physical asset verification. Review of all legal aspects.

Step 8 - Closing
Money is paid, the share ownership changes, agreements are drafted by the lawyers to govern these changes and to govern future behavior.
Typical agreements include:
Share Purchase Agreement. Shareholders’ Agreement
Negotiations can be long! It is important to maintain control of the process at this stage.

Legal, Regulatory and Control Issues
Documentation
Public company issues
Financial assistance and other regulatory issues
Monitoring

The Mind of an Investor
The investor will share the risks of ownership so he wants:TRUSTTRANSPARENCY
“The Economist” (February 2001) reported that Russian stocks are undervalued by US$ 58 bn. due to lack of transparency and other corporate governance procedures”
Key Criteria Investors Look For:
Management. With vision and determination Who delegate responsibility and have genuine team dynamics. Who are open and transparent
High level of future growth.
High return potential with a good exit plan (for example by becoming dominant player).
Well prepared documentation and financials.
Investors look for “pro-business” governments
Established a strong and sensible regulatory frameworkConducive to the conduct of businessAssurance of investor’s rightsIAS and Internationally accepted lawsCorporate Governance
Only when these are in place can you achieve SUSTAINABLE economic growth

Gov’t Continued
Economic and regulatory reform is never easy – investors want to see commitment and progress
Must be far-sighted Do not OVER GOVERN Bankruptcy laws Developing the country’s human capital
Constantly upgrading to prepare people to operate in a Global Economy
Training

Gov’t Continued
Taxation Bureaucracy “Stampele Hell” Business Licensing Get connected
eGovernment for more cost effective managementLeapfrog methods

Gov’t Continued
Impress Investors with a “Global” Mindset
Model SUCCESS
Success breads Success!