raising cane's: one love, one community
DESCRIPTION
2015 University of Arlington - Raising Cane's Campaign. ADVT 4301TRANSCRIPT

PRESENTED BY RAISING CREATIVES - THE UNIVERSITY OF TEXAS AT ARLINGTON


Presented to:
Ms. Jennifer Anderson, Vice President of MarketingRaising Cane’s
Prepared by:Elizabeth Morales, Kim Nguyen, Christopher Orta,
Jessica Combs, Ashley Bennett, Robert Hayes, Seongho Kim, Jonathan Love, Claudia Sitiriche
Raising Creatives
May 06, 2015
Raising Canes: One Love, One Community Campaign

May 6, 2015
Jennifer Anderson, Vice President of Marketing Raising Cane’s6800 Bishop RdPlano, Texas 75024
Dear Ms. Anderson,
Raising Creatives is pleased to submit for your consideration the enclosed proposal in response to the new and emerging markets roll out of your Raising Cane’s brand and locations. Our proposal will provide you with a detailed overview on how to address the competition and our strategy to roll out Raising Cane’s in new and emerging markets without compromising the brand’s values and identity.
We look forward to hearing from you and answering any questions that you may have. Please feel free to contact me at (214) 385-5959 or by email at [email protected].
Sincerely,
Elizabeth B. MoralesAccount Supervisor
Encl.
LETTER OF TRANSMITTAL

EXECUTIVE SUMMARY
1
Fast food is one of today’s fastest growing markets. The fried chicken industry has been around for years, but fresh, never frozen chicken is fairly new and popular. It has long been a dream of founder, Todd Graves to be able to serve a simple chicken meal in a new and fresh way. Raising Cane’s restaurants, make that dream a reality.
Today over 215 locations are found across the US, and the QSR industry is estimated to yield over 160 billion dollars per year. (“Fast Food Industry Analysis 2015: Cost and Trends,” 2015) Eight in 10 Americans report eating fast food at least monthly, with almost half eating fast food at least weekly.(Dugan, 2013) Research provided by Raising Cane’s shows 16-34 year olds as the core consumers driving up their share gains. This age group is known as Generation Y (Millennials) and Generation Z and which is the focus of our campaign.
According to our research Gen Y and Gen Z are free spirited generations that value happiness, passion, diversity, sharing, and discovery. (CEB: Iconoculture Consumer Insights, 2013) Gen Y and Gen Z find true value in the experiences they co-create with the brand. These generations see beyond just a brand label and their bottom line; they care more about the brand’s purpose and philanthropic efforts. They are digital savvy generations with entrepreneurial aspirations. (Huspeni, 2013)They are also more conscious of what goes into their food and how it is prepared. (“Fast Food Industry Analysis 2015: Cost and Trends,” 2015)
Raising Cane’s provides a simple menu dedicated to their fresh, never frozen chicken finger meals. The Perfect Box is what Raising Cane’s is most commonly known for which includes 4 chicken fingers, fries, coleslaw, 1 Cane’s sauce, Texas Toast, and a regular drink. In addition, Raising Cane’s menu also

2
CLIENT CHALLENGETo create a brand intro. campaign that will increase brand awareness and increase restaurant sales by driving traffic through trial and repeat visits in new and emerging markets.
includes a 3 Finger Combo, The Caniac Combo, The Sandwich Combo, and a kid’s meal. This makes the menu very minimal, yet very specialized and perfected to meet everyone’s appetite and budget.
Raising Cane’s is individualistic and fresh, and we at Raising Creatives have embraced that quality by offering design options to their consumers. Our team has embraced the spirit of Raising Cane’s and incorporated it into a campaign we like to call “One Love, One Community.”
Our implementation plan will be carried out in three phases, the pre-launch, launch, and branded. These three phases will span over the course of 12 months and will primarily focus on OOH, digital, promotions, and events in an effort to build love for Raising Cane’s food, love for the brand’s purpose, and to forge positive, lasting relationships between Raising Cane’s and the community it serves.
“One Love, One Community” not only encapsulates what Raising Cane’s stands for, but based on our research, it will resonate among our targeted audience.
TABLE OF CONTENTEXECUTIVE SUMMARY
RESEARCH
01
07
CLIENT CHALLENGE
INSIGHTS
CREATIVE: ADVERTISING / IMC
MEDIA PLAN / BUDGET
EVALUATION / TESTING
CAMPAIGN OBJECTIVES &STRATEGIES
SWOT
MARKETING OBJECTIVES & MIX
02
08
37
76
83
33
29
30

CURRENT USERS
SEASONALITY
Raising Cane’s user base over the period of October thru December 2013, declined from a prior years bump. However, in recent months Raising Cane’s has managed to sustain its prior year user base level while McDonald’s has declined. Cane’s customers visited more often in December.
Heavy QSR users are more important to Cane’s as past month users stepped up their frequency while past 3-month usage contracted. Moderate/Light QSR users pulled back somewhat, with both December usage and frequency slightly down, driving lower Cane’s share with moderate light users. Women contributed somewhat more to Cane’s share increase, with frequency up. Male share sustained. 16-34 year olds increased their December frequency, diving overall share gain, while fewer 35-64 year olds were past months Cane’s customers.
High Season for Raising Cane’s is in the Fall. This rise in sales is attributed to the correlation of football season and the purchase of Raising Cane’s Chicken Finger Tailgate platters.
Low season tends to be during the summer months due to school not being in session or lower enrollment. January is also considered a low sales month, this is attributed to less expendable income due to expenditures during the holiday season.
AUG SEP OCT NOV DEC JAN FEB MAR APR MAY JUN JUL
3

GEOGRAPHICAL EMPHASISAccording to the Raising Cane’s website, the first Raising Cane’s restaurant, also known as “The Mothership” was opened in Baton Rouge, Louisiana. Today, there are over 200 Raising Cane’s restaurants located in 17 states. Texas has the most Raising Cane’s restaurants with 71 units, while Louisiana comes in at 2nd with 62 units. A portion of their restaurant units are located in or near a college community allowing it to draw a large percentage of sales from the student population.
TX LA OK OH NV MS KY AZ NE MO VA MN SC AL CO GA MA
71 62 15 13 9 8 8 7 6 5 3 2 2 2 1 1 1
Total: 216 stores
RASING CANE’S STORE IN EACH STATE
4

COMPETITIVE SALES
WINGSTOP
ZAXBY’S
593
596
RAISING CANE’S 181
CHICK-FIL-A 1,775
500 1000 1500 2000
NUMBER OF STORES (2013)
WINGSTOP
AVG. SALESPER STORE
OVERALL SALES
ZAXBY’S
RAISING CANE’S
CHICK-FIL-A
0.97
72%
5%
8%
15%
1.8
2.1
2.8
AVERAGE SALES PER STORE (millions)
540.2
1,073.4
5,052.6
370.0
5
QUALITY FOOD
Raising Cane’s77%
Chick-fil-A53%
Raising Cane’s73%
Chick-fil-A79%
Chick-fil-A49%
Chick-fil-A62%
Chick-fil-A74%
Chick-fil-A75%
El Pollo Loco43%
Chick-fil-A66%
Raising Cane’s59%
Raising Cane’s43%
Raising Cane’s55%
Raising Cane’s73%
Zaxby’s62%
Zaxby’s39%
Zaxby’s47%
Zaxby’s58%
Zaxby’s42%
Zaxby’s51%
Zaxby’s59%
Wingstop60%
Boston Market36%
Bojangles’47%
Bojangles’52%
Wingstop40%
Bojangles’40%
Wingstop50%
Bojangles’53%
Wingstop23%
Wingstop41%
Wingstop50%
Bojangles’40%
Buffalo Wild Wings40%
Bojangles’50%
El Pollo Loco52%
Bojangles’22%
El Pollo Loco40%
Buffalo Wild Wings48%
El Pollo Loco37%
Wingstop36%
Buffalo Wild Wings48%
Boston Market48%
Buffalo Wild Wings20%
Boston Market39%
El Pollo Loco46%
Boston Market36%
El Pollo Loco32%
El Pollo Loco42%
Popeye’s44%
Raising Cane’s18%
Popeye’s36%
Boston Market42%
Church’s Chicken33%
Popeye’s29%
Boston Market39%
Buffalo Wild Wings42%
KFC15%
Buffalo Wild Wings33%
KFC38%
Popeye’s30%
Boston Market27%
Popeye’s35%
Church’s Chicken38%
Church’s Chicken15%
KFC33%
Popeye’s37%
KFC28%
KFC22%
KFC29%
KFC35%
Popeye’s14%
Church’s Chicken31%
Church’s Chicken35%
Buffalo Wild Wings27%
Church’s Chicken22%
Church’s Chicken26%
FAST SERVICE VALUE CLEANLINESSHEALTHY FOOD FRIENDLY SERVICE ATMOSPHERE
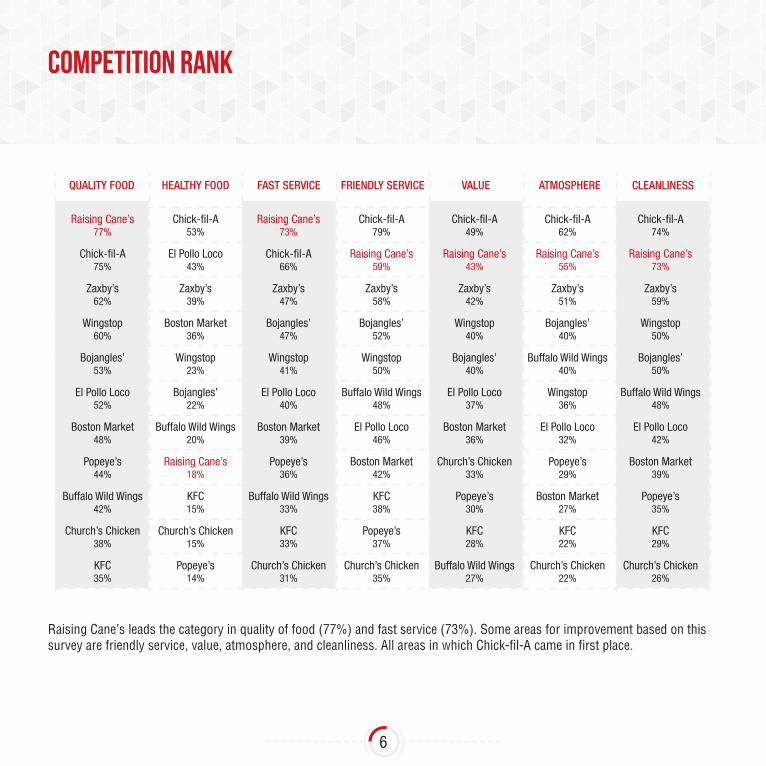
COMPETITION RANK
Raising Cane’s leads the category in quality of food (77%) and fast service (73%). Some areas for improvement based on this survey are friendly service, value, atmosphere, and cleanliness. All areas in which Chick-fil-A came in first place.
6

7
RESEARCHOBJECTIVES
Find out ...1. Who are Raising Cane’s main competitors?2. How are competitors using digital and
mobile technology?3. What are the demographics for Millennials
(Gen Y) and Gen Z? 4. What food trends are popular among
Millennials and Gen Z?5. What influences Millennials and Gen Z’s
purchase decisions?6. What wins over Millennials and Gen Z’s
brand loyalty?7. What social media platforms are popular
among Millennials and Gen Z?
SUMMARY OF FINDINGSBased on our research we found that Raising Cane’s primary competitors based on consumer preference are Chick-fil-A, Zaxby’s, and Wingstop. Chick-fil-A leads the way in competition for Raising Cane’s as the two battle for the number one spot among consumer preference. Chick-fil-A utilizes Facebook, Twitter and YouTube and launched mobile pay in 2014. Zaxby’s uses Twitter, Facebook, Instagram and provides online ordering. Wingstop incorporates Facebook, Twitter, Pinterest and Instagram as their social media platforms and has online ordering capabilities as well.
The primary target audience composed of people between the ages of 16-34, otherwise referred to Gen Y (Millennials) and Gen Z considers happiness, passion, diversity, sharing, and discovery as their strongest values. They care more about sustainability and transparency than older generations. Instead of recognizing a brand by a name or logo, they find true value in the experiences they co-create with a brand. Millennials and Gen Z are looking for new and more engaging social media platforms in which they can interact with the brand in real time. Engaging and convenient mobile and digital is key to this tech savvy generations. Among this audience mobile pay will be the preferred method of payment by 2017.
METHODSSecondary research was our primary source of information. Facts and quantitative data were gathered from reliable sources such as: National Restaurant Association, QSR Magazine, QSR Web, Forbes, Marketforce.Com, Adweek, and the individual competitor websites.
We wanted to understand how to turn our target audience composed of millennials and Gen Z’s in our new and emerging markets into loyal Caniacs. We found out where, when and how to reach them in the most relevant and exciting way.

8
INSIGHTS

TA AGES 18 - 34
POPULATION GEN Y: 76.6 MILLIONGEN Z: 61.7 MILLION *
%MILLENNIALS
GENZ
GEN Z - - - - 61.8 M
GEN Y - - - - 76.6 M
GEN
X - - - - 54 M
BOOM - 75.6 M
SILEN
T - - -
39.9 M
24.9%
20.1%
MILLENNIALZMILLENNIALZMILLENNIALZMILLENNIALZMILLENNIALZ
9
TA AGES 18 - 34
POPULATION GEN Y: 76.6 MILLIONGEN Z: 61.7 MILLION *
%MILLENNIALS
GENZ
GEN Z - - - - 61.8 M
GEN Y - - - - 76.6 M
GEN
X - - - - 54 M
BOOM - 75.6 M
SILEN
T - - -
39.9 M
24.9%
20.1%
MILLENNIALZMILLENNIALZMILLENNIALZMILLENNIALZMILLENNIALZ
10
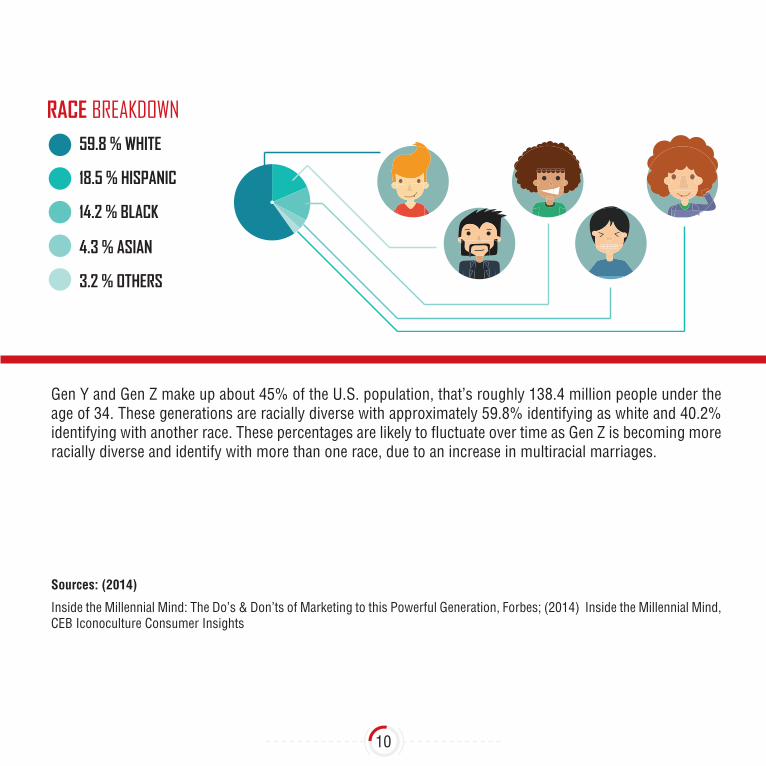
Gen Y and Gen Z make up about 45% of the U.S. population, that’s roughly 138.4 million people under the age of 34. These generations are racially diverse with approximately 59.8% identifying as white and 40.2% identifying with another race. These percentages are likely to fluctuate over time as Gen Z is becoming more racially diverse and identify with more than one race, due to an increase in multiracial marriages.
Sources: (2014)
Inside the Millennial Mind: The Do’s & Don’ts of Marketing to this Powerful Generation, Forbes; (2014) Inside the Millennial Mind, CEB Iconoculture Consumer Insights
GEN Y & GEN ZCONSUMPTION PATTERNS
GEN Y & GEN Z
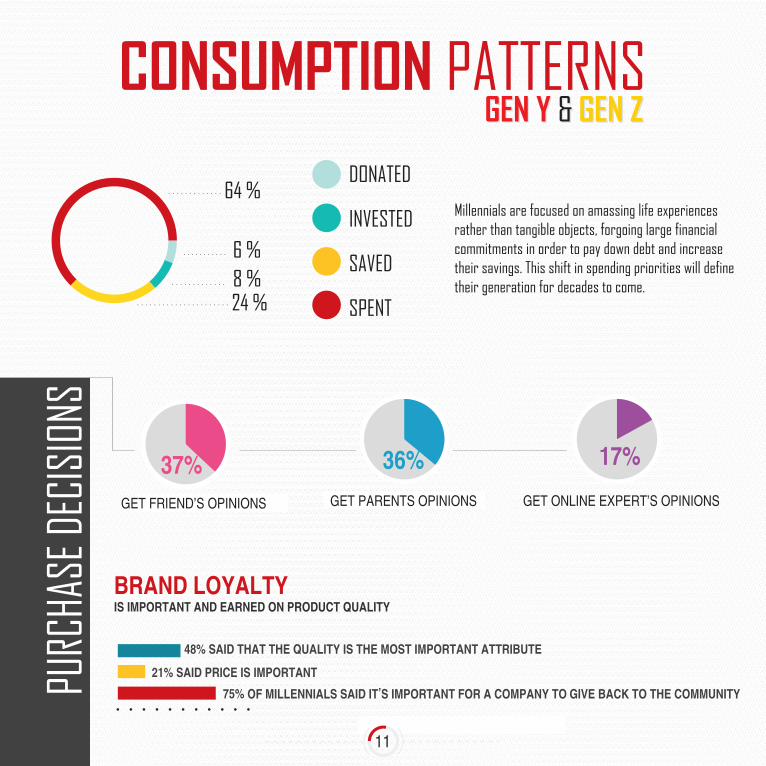
Millennials are focused on amassing life experiences rather than tangible objects, forgoing large financial commitments in order to pay down debt and increase their savings. This shift in spending priorities will define their generation for decades to come.
PURC
HASE
DEC
ISIO
NS
GET FRIEND’S OPINIONS
37%GET PARENTS OPINIONS
36%GET ONLINE EXPERT’S OPINIONS
17%
11

GEN Y & GEN ZCONSUMPTION PATTERNS
GEN Y & GEN Z
Millennials are focused on amassing life experiences rather than tangible objects, forgoing large financial commitments in order to pay down debt and increase their savings. This shift in spending priorities will define their generation for decades to come.
PURC
HASE
DEC
ISIO
NS
GET FRIEND’S OPINIONS
37%GET PARENTS OPINIONS
36%GET ONLINE EXPERT’S OPINIONS
17%
12
BRANDED CONTENT ON SOCIAL SITES WORKS FOR MILLENNIALS IF IT IS....
58% 53% 51% 48% 47% 46% 46%BRIEF ENTERTAINING FUNNY FRESH/NEW UNIQUE INFORMATIVE RELEVANT
Almost half of all millennials agree that branded content on social media works for them if the content is brief, entertaining, funny, fresh/new, unique, informative/educational and relevant to who they are. Brief content was the top concern among millennials with 58% preferring their branded content brief. On the other end of the spectrum, 46% of millennials prefer their branded content to be relevant to who they are.
Sources: (2014)
Inside the Millennial Mind: The Do’s & Don’ts of Marketing to this Powerful Generation, Forbes; (2014) Inside the Millennial Mind, CEB Iconoculture Consumer Insights

SOCIAL MEDIA
ONLINE ADS
DIRECT MAIL
33%
34%
28%
13%
14%OUTDOOR ADS
43%
29%
16%
16%
9%
Y Z
PREFER A COOL PRODUCT
PREFER A COOL EXPERIENCE
Reaching Y & Z
HOW THEY PREFER TO BE CONTACTED...
77% 60%
GEN Y GEN Z
13

SOCIAL MEDIA
ONLINE ADS
DIRECT MAIL
33%
34%
28%
13%
14%OUTDOOR ADS
43%
29%
16%
16%
9%
Y Z
PREFER A COOL PRODUCT
PREFER A COOL EXPERIENCE
Reaching Y & Z
HOW THEY PREFER TO BE CONTACTED...
77% 60%
GEN Y GEN Z
14
60% of Generation Z would prefer a cool product while 77% Generation Y would prefer a cool experience. When reaching both generation Y and Z, email and social media are the most preferred methods of contact. However, 43% of generation Y prefer email versus only 33% of generation Z. 34% of Generation Z prefers contact through social media while only 29% of generation Y prefer social media. Both groups ranked outdoor ads as their least preferred method of contact.
When it comes to the content of the ad itself, Generation Y prefers ads that create emotion while generation Z desires ads with celebrities or athletes.
Sources: (2014)
The Huffington Post, ‘Contrasting Generation Y and Z” 2014

13:120%
Response Rate
WHEN USED AS PART OF AN INTERGRATED CAMPAIGN
WHEN USED BY ITSELF
PREFER DIRECT MAIL FOR MAKING PURCHASE DECISIONS
PURCHASE AS A RESULT OF DIRECT MAIL
CONSUMERS WHO RECEIVE DIRECT MAIL INTERACT WITH THE SENDER
92%
65%
40%
Combining direct mail with digital advertising,yields a higher response rate than digital alone by
Return on Investment
EMAIL DIRECT MAIL
0.12% 3-6%
25%
15

16
Is direct mail still relevant? 20% of direct mail pieces yield a return on investment when used as part of an integrated campaign.
Direct mail receives a 3-6% response rate versus email which only receives .12%. 40% of consumers who receive direct mail interact with the sender.
When it comes to making purchasing decisions, 92% of people surveyed prefer direct mail. 65% of consumers have made a purchase as a result of direct mail. Combing direct mail with digital advertising yields a higher response rate than digital alone.
Sources: (2014)
Harvard Business Review, “Why Email Marketing is King”2012

17
SOCIAL MEDIASOCIAL MEDIASOCIAL MEDIASOCIAL MEDIASOCIAL MEDIASOCIAL MEDIASOCIAL MEDIASOCIAL MEDIA
GET FRIEND’S OPINIONS
GET PARENTS OPINIONS
GET ONLINE EXPERTS OPINIONS
91% FACEBOOK
73% INSTAGRAM
56% SNAPCHAT
44% TWITTER
31% TUMBLR
23% PINTEREST
15% VINE
37%
36%
17%
OF MILLENNIALS

18
Tech devices are very important to millennials and how they consume their social media. 87% of millennials use between 2 and 3 tech devices per day and 81% have a smartphone. 39% will purchase a tablet in the next 5 years and 30% will buy a wearable device in that same time. 49% of millennials own a television.
Among the most widely used social media sites, Facebook, Instagram and Snapchat are the most used among millennials who are making a purchasing decision, with 91%, 73% and 56% of millennial users, respectively. On the lower end of that list, 23% of millennials use Pinterest and 15% use Vine to make purchasing decisions.
Gen-Z users are leaning more towards Instagram and Twitter for their social media. Facebook drops down to 14% while Instagram continues to grow. These numbers continue to grow as the generation grows older and older.Source: Business Horizons, “Social media: The new hybrid element of the promotion mix” 2014Social Media Update 2014: Demographics of Key Social Networking PlatformsTeens & Social: What’s the Latest? MarketingCharts
GEN Z
TUMBLR
VINE
SNAPCHAT
14%
32%
13%
24%
4%
2%
8%
SOCIAL MEDIASOCIAL MEDIASOCIAL MEDIASOCIAL MEDIASOCIAL MEDIASOCIAL MEDIASOCIAL MEDIASOCIAL MEDIA
GET FRIEND’S OPINIONS
GET PARENTS OPINIONS
GET ONLINE EXPERTS OPINIONS
91% FACEBOOK
73% INSTAGRAM
56% SNAPCHAT
44% TWITTER
31% TUMBLR
23% PINTEREST
15% VINE
37%
36%
17%
OF MILLENNIALS

19
Fast Casual37.5 %
Casual29 %
Fast Food26 %
Family22 %
Fine Dining18 %
Upscale Casual16.5 %
Online Ordering Use By Restaurant Type Among food service segments, fast casual and fast food are the most common restaurant types to receive online orders
Percen t o f Res tauran ts Repor t i ng an Inc reasein Sa les
Percen t o f Res tauran ts Wi th I nc reased Order Frequency
THE IMPACT OF ONL INE ORDER ING
5
0
10
15
20
25
30
35
40
45
5
0
10
15
20
25
30
35
40
45
1 4 .2 CATER ING
28 .5 DEL IVERY
42 .5 TAKE-OUT
29 .1 INCREASED VOLUME32 .3 INCREASED VOLUME
& IMPROVED SERV ICE
26 .8 IMPROVED SERV ICE

Percen t o f Res tauran ts Repor t i ng an Inc reasein Sa les
Percen t o f Res tauran ts Wi th I nc reased Order F requency
5
0
10
15
20
25
30
35
40
45
5
0
10
15
20
25
30
35
40
45
14 .2 CATER ING
28 .5 DEL IVERY
42 .5 TAKE-OUT
29 .1 INCREASED VOLUME
32 .3 INCREASED VOLUME& IMPROVED SERV ICE
26 .8 IMPROVED SERV ICE
20
32.3% of restaurants report an increase in volume and service from online ordering. 29.1% only saw an increase in volume and 26.8% only saw an increase in improved service. Through online orders, restaurants saw 42.5% increase in take-out orders, a 28.5% increase in delivery orders and a 14.2% increase in catering orders.
Among food service segments, fast casual and casual restaurants are the most common types to receive online orders, with 37.5% and 26% respectively. Upscale casual restaurants received the least online orders with 16.5%.
Source: The Center for Hospitality Research, “The Current State of Online Food Ordering in the U.S. Restaurant Industry” Vol 11 No 17
Fast Casual37.5 %
Casual29 %
Fast Food26 %
Family22 %
Fine Dining18 %
Upscale Casual16.5 %
Online Ordering Use By Restaurant Type Among food service segments, fast casual and fast food are the most common restaurant types to receive online orders
Percen t o f Res tauran ts Repor t i ng an Inc reasein Sa les
Percen t o f Res tauran ts Wi th I nc reased Order Frequency
THE IMPACT OF ONL INE ORDER ING
5
0
10
15
20
25
30
35
40
45
5
0
10
15
20
25
30
35
40
45
1 4 .2 CATER ING
28 .5 DEL IVERY
42 .5 TAKE-OUT
29 .1 INCREASED VOLUME32 .3 INCREASED VOLUME
& IMPROVED SERV ICE
26 .8 IMPROVED SERV ICE

Music Streaming Services
ACTIVE LISTENERS
PANDORA
I HEART RADIO
SPOTIFY
80
60
40
20
0
37% OF HIGH SCHOOL GRADUATES USE PANDORA DAILY
7% OF U.S. ADULTS USE IHEARTRADIO DAILY.
14% OF HIGH SCHOOL GRADUATES USE SPOTIFY DAILY
Facts
PANDORA IS THE
#1 MUSIC Streaming Service
31%
9%
6%
Music Streaming Services in GeneralON AVERAGE, MOST U.S. RESIDENTS LISTEN TO ROUGHLY FOUR HOURS OF AUDIO EACH DAY.
MOBILE ADVERTISING HAS A CLICK-THROUGH RATE OF 1%
#1 MUSIC
21

Music Streaming Services
ACTIVE LISTENERS
PANDORA
I HEART RADIO
SPOTIFY
80
60
40
20
0
37% OF HIGH SCHOOL GRADUATES USE PANDORA DAILY
7% OF U.S. ADULTS USE IHEARTRADIO DAILY.
14% OF HIGH SCHOOL GRADUATES USE SPOTIFY DAILY
Facts
PANDORA IS THE
#1 MUSIC Streaming Service
31%
9%
6%
Music Streaming Services in GeneralON AVERAGE, MOST U.S. RESIDENTS LISTEN TO ROUGHLY FOUR HOURS OF AUDIO EACH DAY.
MOBILE ADVERTISING HAS A CLICK-THROUGH RATE OF 1%
#1 MUSIC
22
Of the three most popular music streaming services, Pandora has the most listeners at 31% percent of the market – roughly 77 million users. 37% of recent high school grads use Pandora daily and the average U.S. adult spends an average of 25 minutes a day listening. This yield to huge marketing revenue – an estimated 152.9 million dollars in 2014.
I Heart Radio comes in second as most used music streaming service at 9% of the market. 7% of U.S. adults reported using iHeart Radio on a daily basis. Spotify comes in third at 6% of market with roughly 57 million active users. Heavy users of the Spotify app log an average of 155 minutes a day.
On average, most U.S. residents listen to roughly 4 hours of audio each day.
Source:
Media Review: Music Streaming Services Market Profile, ClearVoice Research.

Thumbs UpBY THE NUMBERS
12
9
6
3
0
2005 2006 2007 2008 2009 2010 2011 2012 2013
WHAT IS A “THUMB?”Thumbing a song cues a station to play more songs with similar elements like lyrics and tempo.Thumbing down a song prevents the song from being played again on your station.
THUMBS INTERACTION GROWTH
IN JUST ONE MONTHMillennials are responsible for nearly 60% of our monthly thumbs.
41%MEN
59%WOMEN
THUMBS BY GENDER
TOP 10 MOBILE PROPERTIES
PANDORA
APPLE
ZYNGA
PRODEGE
MIDASPLAYER
GOOGLE SITES
NETFLIX
EA GAMES
SNAPCHAT
U.S. 18+ Average Minutes Per Visitor
1,272
1,171
689
499
496
438
372
336
249
189
Source: comScore, Mobile Metric, U.S., Age +, October 2014
23

Thumbs UpBY THE NUMBERS
12
9
6
3
0
2005 2006 2007 2008 2009 2010 2011 2012 2013
WHAT IS A “THUMB?”Thumbing a song cues a station to play more songs with similar elements like lyrics and tempo.Thumbing down a song prevents the song from being played again on your station.
THUMBS INTERACTION GROWTH
IN JUST ONE MONTHMillennials are responsible for nearly 60% of our monthly thumbs.
41%MEN
59%WOMEN
THUMBS BY GENDER
24

Mobile Apps
Percent of Restaurant Types with Mobile Apps
22.0 %18.2 %6.5 %5.0 %6.7 %
Fast FoodFast CasualMidscale Full ServiceCasual DiningFine Dining
PAYMENT52% More than half of consumers would use an electronic payment system if available
55% More than half of restaurants say electronic payment systems will become more popular
ORDERING41%Of customers would use a self-service ordering terminal if available
39% Of customers would use an electronic ordering system, including iPad menus and wine lists if available
36% Of customers have placed an order online
82%Of quick service restaurants say online and smartphone ordering will become more popular
40% Of full service restaurants say electronic ordering systems will become more popular
THE OPPORTUNITYIN MOBILE APPLICATIONS
16%
35.2%
Approximately 16 PERCENT of allrestaurants offer a mobile app, creating agreat opportunity for establishments to compete in this largely untapped marketplace
ONLY 35.2 PERCENTof restaurants who offer mobile appshave order placement capabilities
THAT’S 7% OF THE ENTIRE DAY
TIME SPENT LISTENING IS 10%ADVERTISEMENTS
USERS SPEND AN AVERAGE OF 107 MINUTES USING SPOTIFY
41% OF USERS ARE EARLY ADOPTERS
40% OF USERS ARE 18-24 YEARS OLD
USER ENGAGEMENT
25

Mobile Apps
Percent of Restaurant Types with Mobile Apps
22.0 %18.2 %6.5 %5.0 %6.7 %
Fast FoodFast CasualMidscale Full ServiceCasual DiningFine Dining
PAYMENT52% More than half of consumers would use an electronic payment system if available
55% More than half of restaurants say electronic payment systems will become more popular
ORDERING41%Of customers would use a self-service ordering terminal if available
39% Of customers would use an electronic ordering system, including iPad menus and wine lists if available
36% Of customers have placed an order online
82%Of quick service restaurants say online and smartphone ordering will become more popular
40% Of full service restaurants say electronic ordering systems will become more popular
THE OPPORTUNITYIN MOBILE APPLICATIONS
16%
35.2%
Approximately 16 PERCENT of allrestaurants offer a mobile app, creating agreat opportunity for establishments to compete in this largely untapped marketplace
ONLY 35.2 PERCENTof restaurants who offer mobile appshave order placement capabilities
26

27
FOOD TRUCKSFOOD TRUCKSThe wheels on the
GO ROUND & ROUNDFad or Lasting Trend?
OF THOSE FAMILIAR WITH MOBILE FOOD TRUCKSSAY THE TREND IS HERE TO STAY
OF FOOD TRUCK PATRONS SAY THEY EXPECT TO CURB THEIR VISITS OVER THE NEXT YEAR
PEOPLE ARE NOT AWARE OF ORHAVE NEVER SEEN A MOBILE FOOD TRUCK
91%ONLY 7%
1 IN 5
CONSUMERS & THE MOBILE RESTAURANT
?
WELL KNOWNOF CUSTOMERS FOUND OUT ABOUT MOBILEFOOD TRUCKS BY JUST “HAPPENING UPON THEM”61%
LOCATION IS CRUCIAL
OF CONSUMERS WHO FOLLOW THEIR FAVORITE FOOD TRUCKS ON SOCIAL MEDIACHECK THEIR PAGES AT LEAST ONCE A WEEK 84%

84% OF CONSUMERS WHO FOLLOW FOOD TRUCKS ON SOCIAL MEDIA, 84% CHECK THEIR FAVORITE'S PAGES AT LEAST ONCE A WEEK
THE COST OF STARTING A FOOD TRUCK BUSINESS IS A FRACTION OF WHAT IT TAKES TO OPEN A BRICK-AND-MORTAR RESTAURANT
TRADITIONALRESTAURANT
MOBILERESTAURANT
STARTUP COSTS$125,000 - $500,000
$30,000 - $80,000
ACQUIRING A PERMIT CAN BE TRICKY. SOME PLACES (LIKE NEW YORK) REQUIRE MORE THAN ONE, AND MAY HAVE A CAP ON THE NUMBER THAT CAN BE ISSUED.
PERMITS
LOS ANGELES $695
COLORADO SPRINGS $115
WITH A TRUCK AS THE MAIN HUB, MOBILE RESTAURANTS ARE AT THE MERCY OF FLUCTUATING GAS PRICES, WHICH ARE EXPECTED TO INCREASE OVER THE NEXT YEAR
GAS PRICES
CURRENT GAS PRICE $2.14
28
People who are familiar with food trucks tend to think that they are a lasting trend; 91% in fact believe food trucks are here to stay. Moreover only 7% of those same people say they will stop visiting food trucks over the next year. 1 out of 5 people have never frequented a food truck. Location may play a factor into this: 61% of customers found out about mobile trucks by stumbling upon them.
Food truck fans are loyal, especially online. 84% of food truck fans follow their favorites and check their social media pages at least once a week.
Source:
Case Study: On the Go - Insights into Food Truck Regulation in US Cities - Regulatory Reform for the 21st Century City

SWOT
S W
OT
STRENGTH• Quality chicken finger meals• Community involvement
WEAKNESS• Social Media and digital presence
needs improvement • Lack of national recognition in
comparison to leading competitors
OPPORTUNITY• Young brand with the opportunity to
develop an image and growth• Deeper community involvement• Create mobile engagement
THREAT• Some competitors have a more
established and dominant presence physically and digitally
• New competitors entering the market
29

30
MARKETING OBJECTIVES
MARKETING STRATEGIES
• To increase brand awareness in new and emerging markets• Increase restaurant sales by driving traffic through trial and repeat visits
• Motivate a visit by educating consumers about raising Cane’s commitment to quality• Show customers how Raising Cane’s can be involved in their communities
The primary target audience composed of people between the ages of 16-34, otherwise referred to Gen Y (Millennials) and Gen Z considers happiness, passion, diversity, sharing, and discovery as their strongest values. They care more about sustainability and transparency than older generations. Instead of recognizing a brand by a name or logo, they find true value in the experiences they co-create with a brand. Millennials and Gen Z are looking for new and more engaging social media platforms in which they can interact with the brand in real time. Engaging and convenient mobile and digital is key to these tech savvy generations. Among this audience mobile pay will be the preferred method of payment by 2017.
To target heavy to moderate QSR users between the ages of 16-34.
Advertising will be focused in new and emerging spot markets throughout the year based on the new restaurant opening schedule.
The consumer will choose to support Raising Cane’s because of their quality of food, friendly crew, and their support for the community.
TARGET MARKET
USAGE
GEOGRAPHY
BENEFIT

31
MARKETING MIX
Quality chicken finger meals and community involvement will be the focus of their promotions. This will be achieved through targeted OOH, digital, social networking, and event sponsorships.
We plan to increase Raising Cane’s community and collegiate sponsorship events. We want to promote service events to represent Raising Cane’s service to the community, an entrepreneurship program to represent Raising Cane’s entrepreneurial spirit, and sporting events to promote Raising Cane’s food for tailgating/social event catering. These sponsorship events will provide Raising
Cane’s with a greater reach of our target audience.
Digital and social networking will be essential for Raising Cane’s promotion. Currently Raising Cane’s utilizes Facebook, Twitter, and YouTube as social media platforms.
Raising Cane’s will not undergo any physical changes as part of the marketing objectives. Their chicken fingers perform well in their category of quick service chicken, ranking number 2 (73%) behind Chick-fil-A who’s currently at number 1 (74%) in Market Force’s 2015 QSR study for favorite chicken chain.
PROMOTION
PRODUCT
Chick-fil-ARaising Cane’s
Zaxby’sWingstop
Bojangles’ Famous Chicken ‘nEl Pollo Loco
Boston MarketBuffalo Wild Wings
PopeyesChurch’s Chicken
KFC
74%
73%
61%
55%
50%
46%
45%
43%
39%
32%
31%
Composite Loyalty Index
32
Raising Cane’s product prices will not increase or decrease. Although the prices tend to be slightly higher when compared to competitor pricing, consumers still consider the product to be somewhat of a value. Also, the price difference separates Raising Cane’s products from others in the market as the price point is a representation of the higher quality product being served at Raising Cane’s. Raising Cane’s prides itself on serving the highest quality chicken finger meals that are always fresh, never frozen; the price is indicative of this quality product. If prices are decreased the consumer may perceive that the quality of the product has decreased as well.
PRICING
Raising Cane’s serves its quality chicken finger meals to their community through freestanding buildings which include the convenience of drive-through lanes. Raising Cane’s plans to expand nationally in order to reach more of its target audience and increase market share.
PLACE
Recommendations were made based on research conducted in reference to the targeted audience. We are aiming at targeting Gen Y and Gen Z, both generations have higher incidences of entrepreneurship or the desire to become one. They are very digital savvy generations, although Gen Z is inclined to want more personal communication. Both generations desire to be engaged and entertained in a concise manner as they tend to be on the go. They are loyal to brands that speak to their values. They are sharing generations and it amplifies with Gen Z as they desire to help others.
RATIONALE
SOURCESMarket Force Study Reveals America’s Favorite Quick-Service Restaurants, MarketForce (4 March 2015)
MarketingProfs: America’s Favorite Food Chains.

CAMPAIGN OBJECTIVES & STRATEGY
FOCUS
PHASE 1PRE-LAUNCH
PHASE 2LAUNCH
PHASE 3BRANDED
OBJECTIVE
Introduce Raising Cane’s in a new or emerging market
The objective of the pre-launch phase is to target customers within a 10 mile
DMA of an upcoming store and therefore create awareness of the
brand by 40%
Increase sales by driving traffic through trial and repeat visits
The objective of the launch phase is to stimulate 65% of the target audience in
the specified DMA to try the product within the first year, creating brand preference within the consumer and
increasing immediate and future sales
Increase brand loyalty
The purpose of the branded phase is to develop and establish the Raising Cane’s brand personality within the surrounding
community in such a way that loyalty for the brand is increased to 70%
The first phase of the campaign raises awareness of the brand name, what they do, and how to get more information on Raising Cane’s one love, fresh, never frozen chicken fingers. The “Dare2Dip” theme will peak potential consumer interests. The second phase is meant to entice potential consumers to try the product and educate the consumer on the quality of the food and fun nature of the brand, while beginning to establish brand loyalty. The final phase increases awareness and educates the consumer on Raising Cane’s love for the community by setting up positive community interactions like community service events and grants.
We will position Raising Cane’s as a brand that puts a positive message above meeting the bottom line. Raising Cane’s is committed to serving fresh, never frozen high quality chicken finger meals to the community it serves. The chain has a vested interest in philanthropic efforts and supporting the communities it belongs to.
We can encompass our campaign as a whole into one phrase, “One Love, One Community.” Raising Cane’s “One Love” being high quality chicken finger meals the restaurants share with the consumer and “One Community” because of Raising Cane’s commitment and integration with the communities they serve.
STRATEGY
Positioning
TAGLINE
33

CREATIVE BRIEF
Raising Cane’s wants a three phase campaign that will be effective in new and emerging markets. Raising Cane’s faces the challenge of being a young brand in these ma as it competes with other fast casual/ quick service restaurants. There is a shift in the market towards healthier options, sustainability, mobile app ordering, and mobile options in the form of food trucks are gaining popularity over QSR’s.
Raising Cane’s brand youth, community involvement, and commitment to quality provides them the opportunity to really make an impact on its consumer base. Its origin story is one that can resonate among Millennials and Gen Z as research shows these generations tend to have an entrepreneurial mindset and aspire to become an entrepreneur.
The primary objective of this campaign is to increase brand awareness in new and emerging markets. The secondary objective is to increase restaurant sales by driving traffic through trial and repeat visits. These objectives will be met by motivating a visit by educating the consumer on Raising Cane’s commitment to quality and showing customers that Raising Cane’s has a vested interest in being actively involved in their communities.
Raising Cane’s is a fun brand committed to serving the highest quality chicken finger meals and contributing to the community.
Primary Target: HH with no children; Ages 16-34
The target audience considers happiness, passion, diversity, sharing, and discovery as their strongest values as opposed to an older target audience. Instead of recognizing a brand by a name or a logo, millennials will find true value in the experiences they co-create with the brand. They are loyal to brands that speak to their values. They are sharing generations and it amplifies with Gen Z’s desire to help others. Gen Y and Gen Z both have higher incidences of entrepreneurship or the desire to become one.
They are very digital savvy generations, although Gen Z is inclined to want more personal communication. Both generations desire to be engaged and entertained in a concise manner as they tend to be on the go. Millennials and Gen Z are looking for new and more engaging social media platforms in which they can interact with the brand in real time.
Engaging and convenient mobile and digital is key to this target audience. Mobile pay will be the preferred method of payment by 2017 among this audience.
BACKGROUND
OBJECTIVE
PRIMARY MESSAGE
Target Audience
34

35
Raising Cane’s has a long standing record of commitment not only to fulfilling Todd Graves’ “ONE LOVE” dream, but to serving the community. Both his entrepreneurial spirit and commitment to serving the community resonate with Millennials and Gen Z that have similar desires, therefore; making the brand relatable. Todd Graves is somewhat of a hero or role model to these generations. The decor and service provide the restaurants with an inviting and fun environment.. This allows for higher eat in rates than some of its competitors. Once the consumer tries the actual product they realize it is real chicken as opposed to processed chicken served at some of the other competitors.
The top 3 competitors for Raising Cane’s are:
Chick-fil-A: A premium chicken, quick service restaurant that positions itself as a conservative brand with an opinion. Their core value is to make a positive influence in their community and the people in them.
Zaxby’s: Their mission is to consistently create encore experiences that enrich the lives one person at a time. Zaxby’s is primarily located in the Southeastern U.S. and serves chicken wings, fingers, sandwiches, and salads.
WingStop: Has positioned itself as “The Wing Experts”. They believe their customers deserve the best and have developed a menu that is attractive to the vast majority of consumers. Through the development of proprietary sauces and seasonings, they offer the customer a unique variety of flavor selections while focusing on a single entree - Buffalo style wings. They treat the customer to the highest level of service while providing food that is always fresh and cooked to order.
Supporting Rational and Emotional Reasons to Believe and Buy
COMPETITORS

36
We are using existing food images, Raising Cane’s logo, sexy chickens created out of Raising Cane’s chicken fingers, simulated steam, Cane, people showing love for the food, each other and the community
POP Creative: Interior/Exterior Menu Panels, napkin skin, speaker post
Outdoor Creative: Emphasis placed on directional in three phases (pre-opening, opening, branded)
Digital: Present unique way to incorporate social and website
• Social Media: Facebook, Twitter, Instagram, YouTube
• Mobile/Digital: Social music platforms, app
• OOH billboards, mobile advertising (food truck & bus wraps)
• W.O.M.
VISUAL
MANDATORIES
MEDIA CHANNELS
Phase 1: Edgy, playful, tempting
Phase 2: Love for our food and community
TONE
37
SEP OCT NOV DECJ AN FEB MAR APR MAYJ UNE JULY
Phase II: Launch Phase III: Branded
Phase I: Pre-Launch
Finish
AUG
CREATIVEAdvertising/ IMC Recommendations
OBJECTIVES
STRATEGIES
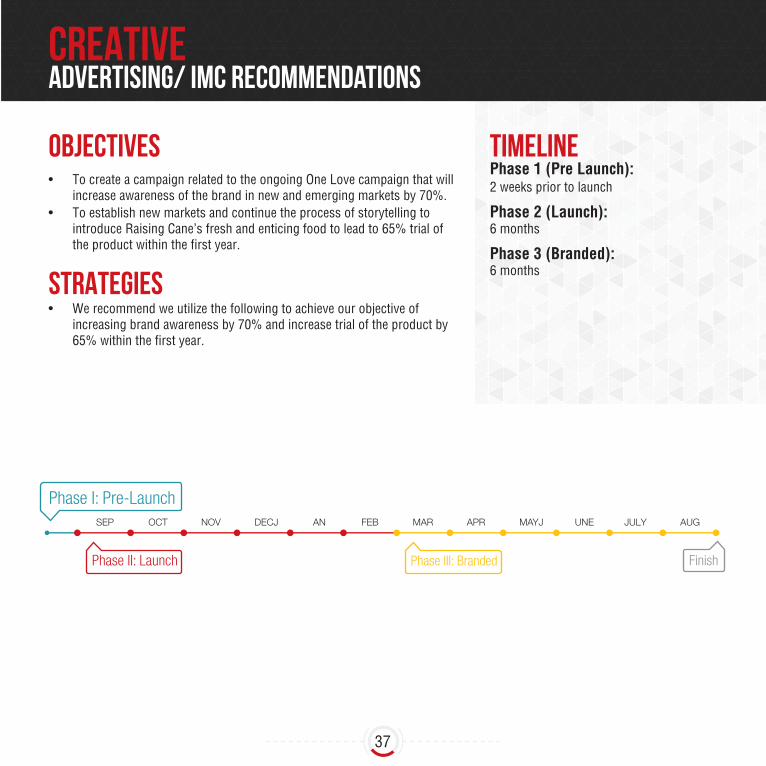
• To create a campaign related to the ongoing One Love campaign that will increase awareness of the brand in new and emerging markets by 70%.
• To establish new markets and continue the process of storytelling to introduce Raising Cane’s fresh and enticing food to lead to 65% trial of the product within the first year.
• We recommend we utilize the following to achieve our objective of increasing brand awareness by 70% and increase trial of the product by 65% within the first year.
Phase 1 (Pre Launch):2 weeks prior to launch
Phase 2 (Launch): 6 months
Phase 3 (Branded):6 months
TIMELINE

38
PHASEPHASEPHASEPHASEI

39
Direct Mailer introducing Raising Cane’s and redeemable for Raising Cane’s branded sunglasses in store. This will influence behavior by driving them to visit the restaurant to redeem their glasses, therefore; stimulating trial and purchase of Raising Cane products while there.
CREA
TIVE
DIRE
CT M
AILE
RPHASE

40
FRON
TBA
CK

41
Social Media Campaign will help shape consumers perception of Raising Cane’s to be a young, fun brand serving quality chicken fingers. Posts will focus on making the food mouthwatering and appetizing to the consumer and informing them of the upcoming opening of the restaurant in their community.
CREA
TIVE
SOCI
AL M
EDIA
CAM
PAIG
NPHASE

42
GRAND OPENING
CREA
TIVE
GRAN
D OP
ENIN
G BA
NNER
PHASE

43
PHASEPHASEPHASEPHASEII
44
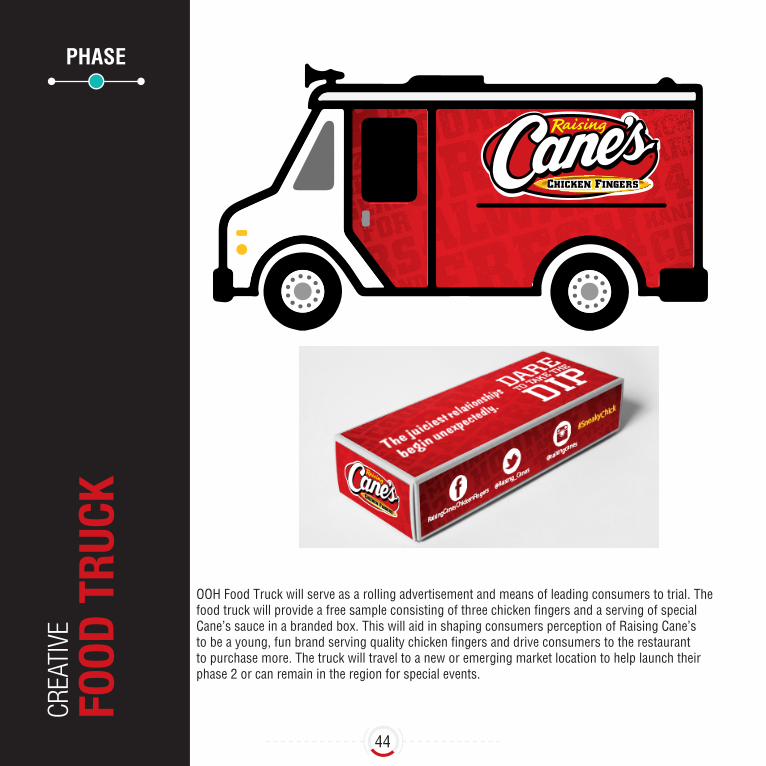
OOH Food Truck will serve as a rolling advertisement and means of leading consumers to trial. The food truck will provide a free sample consisting of three chicken fingers and a serving of special Cane’s sauce in a branded box. This will aid in shaping consumers perception of Raising Cane’s to be a young, fun brand serving quality chicken fingers and drive consumers to the restaurant to purchase more. The truck will travel to a new or emerging market location to help launch their phase 2 or can remain in the region for special events.
CREA
TIVE
FOOD
TRU
CKPHASE
PHASEPHASEPHASEPHASE

45
Digital ads will be used on popular music platforms among Millennials and Gen Z such as I Heart Radio, Spotify, and Pandora. These will depict similar ads as our OOH, may include short video or audio.
CREA
TIVE
PAND
ORA
/ SPO
TIFY
DIG
ITAL
AD
PHASE
46
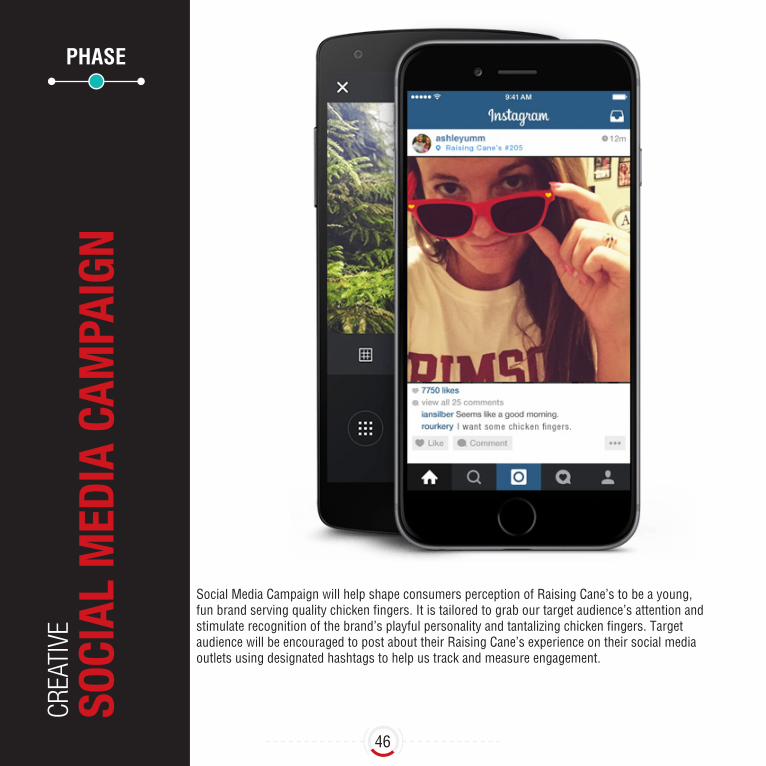
Social Media Campaign will help shape consumers perception of Raising Cane’s to be a young, fun brand serving quality chicken fingers. It is tailored to grab our target audience’s attention and stimulate recognition of the brand’s playful personality and tantalizing chicken fingers. Target audience will be encouraged to post about their Raising Cane’s experience on their social media outlets using designated hashtags to help us track and measure engagement.
CREA
TIVE
SOCI
AL M
EDIA
CAM
PAIG
NPHASE

47
OOH billboards will work towards increasing brand awareness and shaping consumers perception of the Raising Cane’s brand as a young, fun brand serving quality chicken fingers. They will utilize enticing copy and display the Raising Cane’s chicken fingers in a fun and enticing way that will engage the consumer and generate word of mouth buzz.
CREA
TIVE
BILL
BOAR
DPHASE

48
OOH campus banners near football stadium and arena will work towards increasing brand awareness and shaping consumers perception of the Raising Cane’s brand as a young, fun brand serving quality chicken fingers. They will utilize enticing copy and display the Raising Cane’s chicken fingers in a fun and enticing way that will engage the consumer and generate word of mouth buzz.
CREA
TIVE
COLL
EGE
CAM
PUS
SIGN
POS
TSPHASE

49
#DARE2DIP#DARE2DIP
PHASE

50
#DARE2DIP#DARE2DIP
PHASE

51
PHASE

52
Go ahead! Get Saucy!Made with 100% recycled material.
Tantalize your taste buds.Made with 100% recycled material.
Let’s get saucy!Made with 100% recycled material.
Make me messy.Made with 100% recycled material.
Let’s take a dip, we won’t tell.Made with 100% recycled material.

53
PHASE

54
SO SWEET YOU CAN TAKE IT HOME TO MOMMA’S.
SO SWEET YOU CAN TAKE IT HOME TO MOMMA’S.
Becauseyou’re
enoughSWEET
So sweetyour dentist
wouldAPPROVE
For lifesbittermoments...
BECAUSE YOU’RE SWEET ENOUGH.
PHASE

55
LIKE OUR JUGS?LIKE OUR JUGS?
US TOO!US TOO!
LIKE IT HOT&JUICY?
LIKE IT HOT&JUICY?
Grab one gallon today!
Available inLemonadeand Tea
PHASE

56
DARE 2 DOWNLOADDARE 2 DOWNLOAD
PET T
O
OPEN
EARN REWARDSSHOP CANESPLACE ORDERSNEW ITEMS!
THE APP
PHASE

57
PHASE

58
PUBL
IC R
ELAT
IONS
EVEN
T M
ARKE
TING
&
PROM
OTIO
N
College Sporting Event Tailgates. Two key games will be selected to host a tailgate party. These parties will be done in partnership with a local radio station. Free food and a live DJ will create the perfect tailgating party for some lucky local Caniac’s. These Caniac’s will be selected at random from new enrollees during the pre-launch and early launch time period.
PHASE

59
PHASEPHASEPHASEPHASEIII

PHASEPHASEPHASEPHASE
60
PROM
OTIO
NS
SOCI
AL M
EDIA
CAM
PAIG
N
Social media campaign will help shape consumers perception of Raising Cane’s to be a young, fun brand serving quality chicken fingers. During this phase the campaign will shift to recognizing Raising Cane’s and Caniac’s love for the food and the community to establish brand identity and their position in helping the community. It is tailored to grab our target audience’s attention and stimulate recognition of the brand’s playful personality and tantalizing chicken fingers through use of short videos and post with graphics on social media platforms. Caniac’s will be encouraged to share their own experiences to stimulate brand loyalty.
PHASE

61
PROM
OTIO
NS
BILL
BOAR
D
OOH Billboard will work towards increasing brand awareness and shaping consumers perception of the Raising Cane’s brand as a young, fun brand serving quality chicken tenders. The courtship will move on to relationship and make the shift to “One Love.” The OOH will utilize images depicting love for Raising Cane’s products and the community.
PHASE

62
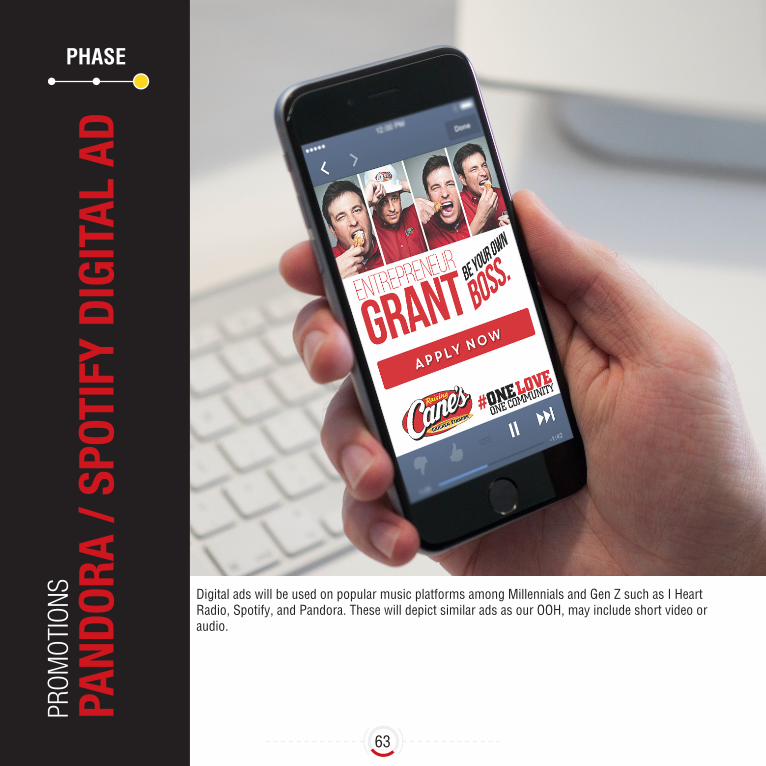
63
PROM
OTIO
NS
PAND
ORA
/ SPO
TIFY
DIG
ITAL
AD
Digital ads will be used on popular music platforms among Millennials and Gen Z such as I Heart Radio, Spotify, and Pandora. These will depict similar ads as our OOH, may include short video or audio.
PHASE

64
PROM
OTIO
NS
CAM
PUS
CUBE
KIO
SK
College campus cube kiosk will work towards increasing brand awareness and shaping consumers perception of the Raising Cane’s brand that cares about the community and its customers.
PHASE

65
CREA
TIVE
BILL
BOAR
D
OOH Billboard will work towards increasing brand awareness and shaping consumers perception of the Raising Cane’s brand as a young, fun brand serving quality chicken tenders. The courtship will move on to relationship and make the shift to “One Love.” The OOH will utilize images depicting love for Raising Cane’s products and the community.
PHASE

66

67

68

69
OBJECTIVETo increase enrollment of new customers by 40% in the Caniac Club within the first year of opening a restaurant in a new or emerging market.
STRATEGYWe recommend we utilize a mobile app to achieve our objective of increasing Caniac Club membership by 40% within the first year.

70

71
CREA
TIVE
BUS
WRA
P
OOH bus wrap will work towards increasing brand awareness and shaping consumers perception of the Raising Cane’s brand as a young, fun brand serving quality chicken fingers. They will utilize enticing copy and display the Raising Cane’s chicken fingers in a fun and enticing way that will engage the consumer and generate word of mouth buzz.
PHASE

72
PUBL
IC R
ELAT
IONS
ADDE
D VA
LUE
Added Value through radio station partnerships
PHASE
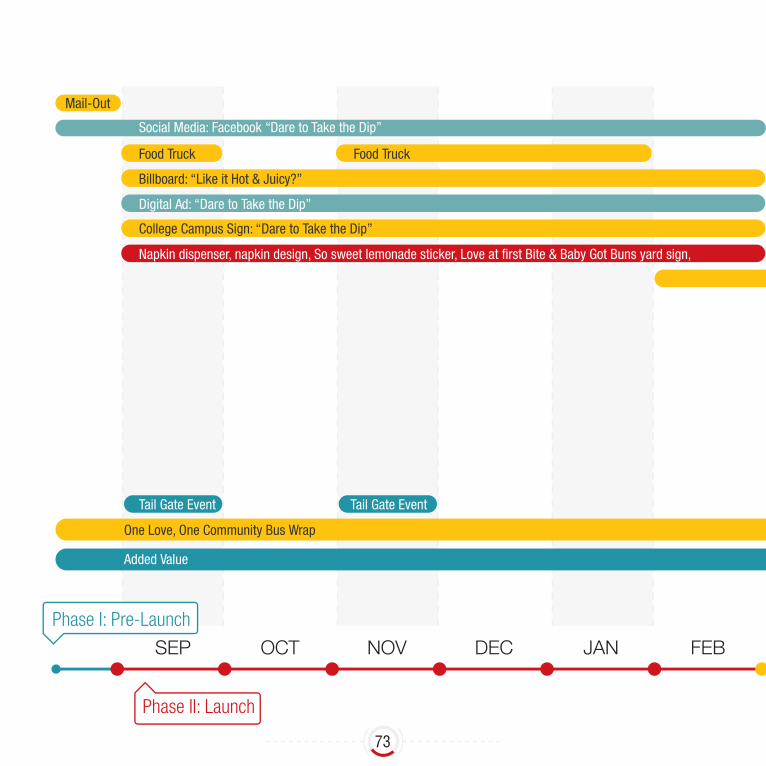
73
SEP OCT NOV DEC JAN FEB
Phase II: Launch
Phase I: Pre-Launch
Mail-Out
Social Media: Facebook “Dare to Take the Dip”
Digital Ad: “Dare to Take the Dip”
Food Truck Food Truck
Billboard: “Like it Hot & Juicy?”
College Campus Sign: “Dare to Take the Dip”
Added Value
One Love, One Community Bus Wrap
Tail Gate EventTail Gate Event

74
Traditional
Digital
Public Relations
POP
MEDIA CHANNEL
MAR APR MAY JUNE JULY
Phase III: Branded Finish
Billboard: “Entrepreneur Grant”
“Entrepreneur Grant”
Social Media: “Entrepreneur Grant”
Digital Ad on Pandora, Spotify & Facebook: “Entrepreneur Grant”
College Cube Tower Kiosk: “Entrepreneur Grant”
Volunteer ONE LOVE Tshirt
Social Media: “Volunteer ONE LOVE” Tshirt
Big EVENT
AUG

75
Advertising/ IMC RationaleRecommendations were made based on research conducted in reference to the targeted audience. We are aiming at targeting millennials and generation Z, both generations have higher incidences of entrepreneurship or the desire to become one. They are very digital savvy generations, although gen Z is inclined to want more personal communication. Both generations desire to be engaged and entertained in a concise manner as they tend to be on the go. They are loyal to brands that speak to their values. They are sharing generations and it amplifies with gen z as they desire to help others.
This provides various opportunities for Raising Cane’s as the target audience’s values align to a certain extent with that of the brand. Focusing on engaging consumers on a personal level whether in person or with a digital interactive presence while providing opportunities to give back to the community will be a step forward in establishing relationships and fostering brand loyalty among its target audience.

76
MEDIA CAMPAIGN
The August 2016 - September 2017“One Love, One Community” campaign will use an optimized media combination of traditional (billboards, bus wraps) and non-traditional media (digital, food truck, social media) to optimize our reach and frequency in new and emerging markets as well as to generate buzz around Raising Cane’s brand.
“One Love, One Community” planned to run from August 2016 - September 2017• Phase 1: Pre-Launch - August 2016 - September 2016• Phase 2: Launch September 2016 - January 2017• Phase 3: February 2017- September 2017
OVERVIEW
DURATION
SEP OCT NOV DECJ AN FEB MAR APR MAYJ UNE JULY
Phase II: Launch Phase III: Branded
Phase I: Pre-Launch
Finish
AUG
• Achieve 85% reach with an average of 6 during Targeted months in order to increase brand awareness in new and emerging markets.
• Generate buzz through outdoor, social media and internet advertising in order to increase restaurant sales by driving traffic through trial and repeat visits.
• Pulse media by maintaining a year-long presence within new and emerging markets with extra emphasis placed in strategic areas at strategic times.
• Motivate a visit by educating consumers about raising Cane’s products (chicken fingers, tea, sauce, etc) and their commitment to quality through media placement before launch.
• Show customers how Raising Cane’s can be involved in their communities through social media interaction, events in the community, and opportunities such as grants.
OBJECTIVES
STRATEGIES
Two different markets were chose to showcase the allocation of media through the campaign. The first market San Antonio, Texas, ranks 37 on the Designated Market Area (DMA) market list. The second market selected ranks 104 on the DMA market list. These markets were chosen from two ends of the DMA market in order to compare and contrast; reach, frequency, total GRP, share and budget of each market.

77
TARGET AUDIENCE
SCOPE
KEY TIME PERIODS
Primary Target: HH with with no kids; 16-34 yr olds. Secondary Target: HH with no kids: 34-64 yr olds.
About 70% of media used for “One Love, One Community” will consist of social media, internet media and mobile technology. The rationale behind this is because according to The Next Web there are roughly 79 million Millennials in the United States. With that said 59% of Millennials go online through computers, tablets and mobile phones for news, entertainment and socialization.
The year long “One Love, One Community” media campaign is designated to Achieve 85% reach with an average frequency of 7 during peak months order to increase brand awareness in new and emerging markets.
The spot market only campaign will target new and emerging markets. Within these spot markets the focus will be placed on one primary target audience: HH with no children; Ages 16-34. A second audience exists, however due to market reports on millennial(z) focus will be placed on the primary.
PHASE I: Pre-Launch
PHASE II: Launch
PHASE III: Branded
• Direct Mailer• Social Media “Dare to Take the Dip”
• Food Truck• Billboard “Dare to Take the Dip”• Digital Ad “Dare to Take the Dip”• Banner Ad “Dare to Take the Dip”• College Stadium Sign• Social Media “Dare to Take the Dip”• Billboard “Love at First Bite”
• Introduce Entrepreneur Grant promotion• Billboard “Entrepreneur Grant”• Digital Ad “Entrepreneur Grant”• Social Media “Entrepreneur Grant”
August 22, 2016 - September 4, 2016
September 2016 - January 2017
February 2017 - September 2017

78
• August will be an important month for media placement. The first two weeks or Pre-Launch of the campaign will serve as a period where building brand awareness in a new and emerging market will be key in order to increase it by 40%.
• Mid-August, a direct mailer will introduce Raising Cane’s location and product. Additionally the direct mailer will serve as a tactic that will educate potential consumers on Raising Cane’s one love, never frozen, quality chicken fingers as well as their other products. This tactic will also serve as a way to get customers into the restaurant by encouraging to redeem the direct mailout for a pair of branded sunglasses in store.
• Heavy placement of OOH media will dominate the pre-launch month of the campaign. Bus Wraps will run starting August 31 in order to generate buzz and awareness around the brand.
• Social Media Campaign will aid in shaping consumers perception of Raising Cane’s to be a fun brand serving quality chicken fingers.
• The second phase serves as a means of enticing potential consumes to try the product and continue educating the consumers on the quality of the food and fun nature of the brand through OOH media, social media and digital media.
• After lunch a banded food truck will support the main restaurant. The food truck will provide free samples of quality chicken and a serving of cane’s sauce. The truck will travel to new and emerging market locations to help launch their phase 2 or can remain the the region for special events at colleges, sport games and involvement with the community.
• Digital ads will be used on popular platforms among Millennials and Gen Z such as I Heart Radio, Spotify, and Pandora.
• Social Media: Consumers will be encouraged to post on social media (facebook, twitter, instagram, etc) about their Raising Cane’s experience using designated hashtags that can be found throughout the brands social media portals and store POP.
• OOH billboards will be placed in areas where a 85% reach can be achieved. Most OOH will be placed in launch month with a few pushed through the summer months where sales are usually higher overall.
• Continued social media campaign. During this phase social media will be used to recognize Raising Cane’s love for the community by establish brand identity and their position in helping the community
• OOH that will heavily push the Entrepreneurial Grant. A business savvy and community involved raising cane’s consumers will have the chance to win a grant in order to start up their dream business.
PHASE I: PRE-LAUNCH
PHASE II: LAUNCH
PHASE III: BRANDED

79
CLIENT & MARKET IMPERATIVESPer Raising Cane’s request, the campaign will use required POP media such as interior/exterior menu panels, napkin skins, and speaker post.
Client suggested optional POP such as door clings, drive-thru clings, yard signs and and reader boards/video reader board, which will be used in the campaign.
The client also suggested the use of OOH media to correlate with the three campaign phases; pre-launch(phase 1), opening (phase 2), and Branded (Phase 1 and Phase 2). In addition to the clients suggestions the campaign will utilize bus wraps, food trucks as part of the OOH requirements.
MFP Goal SheetSAN ANTONIO, TEXAS
SEP
OCT
NOV
DEC
JAN
FEB
MAR
APR
MAY
JUNE
JULY
TOTAL 5015 100
AUG
85.0
80.0
85.0
70.0
65.0
80.0
70.0
60.0
40.0
40.0
40.0
30.0
8.0
8.0
8.0
7.0
7.0
7.0
6.0
6.0
5.0
4.0
4.0
7.0
680
640
680
490
455
560
420
360
200
160
160
210
13.6
12.8
13.6
9.8
9.1
11.2
8.4
7.2
4.0
3.2
3.2
4.2
REACH FREQ GRPS %SHARE
AD MEDIA TACTICS
OUTDOOR$(000)
DIGITAL SPOT$(000)
DIRECT MAIL$(000)
PLAN TOTALGRPS
$(000)REACH
AVG. FREQ.

MFP FLOW CHART
80
MFP YEAR AT GLANCE
SEP
OCT
NOV
DEC
JAN
FEB
MAR
APR
MAY
JUNE
JULY
TOTAL 5015 17,405.44 -12,390.44 0 348.60 -348.60
AUG
85.0
80.0
85.0
70.0
65.0
80.0
70.0
60.0
40.0
40.0
40.0
30.0
91.4
91.4
91.3
91.1
90.8
91.4
91.4
91.1
91.1
91.0
90.8
91.5
8.0
8.0
8.0
7.0
7.0
7.0
6.0
6.0
5.0
4.0
4.0
7.0
16.1
16.1
16.0
15.8
15.5
16.1
16.1
15.8
15.8
15.7
15.5
16.1
680
640
680
490
455
560
420
360
200
160
160
210
1475
1475
1459
1442
1409
1475
1475
1442
1442
1426
1409
1476
-795
-835
-778
-952
-954
-915
-1055
-1082
-1242
-1265
-1249
-1266
0.0
0.0
0.0
0.0
0.0
0.0
0.0
0.0
0.0
0.0
0.0
0.0
30.2
30.2
29.3
28.3
26.3
30.3
30.3
28.3
28.3
27.3
26.3
33.6
-30.2
-30.2
-29.3
-28.3
-26.3
-30.3
-30.3
-28.3
-28.3
-27.3
-26.3
-33.6
REACH AVG FREQ GRPS $ (000)
GOAL EST GOAL EST GOAL EST BALANCE GOAL EST BALANCE
1,31120.3
16410.0
1649.9
1649.9
1489.0
1318.0
996.0
16410.0
16410.0
1318.0
1318.0
1157.0
996.0
13.4
1,31120.3
1,31120.3
1,31120.3
1,31120.3
1,31120.3
1,31120.3
1,31120.3
1,31120.3
1,31120.3
1,31120.3
1,31120.3
GRPSCOST
GRPSCOST
GRPSCOST
15,729243.6
13.4
1,675101.7
AUG SEPT OCT NOV DEC JAN FEB MAR APRIL MAY JUN JULY TOTAL ACROSS
1,47633.791.516.1
1,47530.291.416.1
1,47530.291.416.1
1,45829.391.316.0
1,44228.391.115.8
1,40926.390.815.5
1,47530.391.416.1
1,47530.391.416.1
1,44228.391.115.8
1,44228.391.115.8
1,42527.391.015.7
1,40926.390.815.5
17,405348.7
GRPSCOST
TARGET DEMO: ALL ADULTS AGES 18 - 34

81
MFP Goal Sheet Lincoln & Hastings-Krny
SEP
OCT
NOV
DEC
JAN
FEB
MAR
APR
MAY
JUNE
JULY
TOTAL 5015 100
AUG
85.0
80.0
85.0
70.0
65.0
80.0
70.0
60.0
40.0
40.0
40.0
30.0
8.0
8.0
8.0
7.0
7.0
7.0
6.0
6.0
5.0
4.0
4.0
7.0
680
640
680
490
455
560
420
360
200
160
160
210
13.6
12.8
13.6
9.8
9.1
11.2
8.4
7.2
4.0
3.2
3.2
4.2
REACH FREQ GRPS %SHARE
MFP YEAR AT GLANCE
SEP
OCT
NOV
DEC
JAN
FEB
MAR
APR
MAY
JUNE
JULY
TOTAL 5015 1,689.43 3325.57 0 214.76 -214.76
AUG
85.0
80.0
85.0
70.0
65.0
80.0
70.0
60.0
40.0
40.0
40.0
30.0
47.1
47.1
45.4
43.5
38.8
47.1
47.1
43.5
43.5
41.3
49.4
47.6
8.0
8.0
8.0
7.0
7.0
7.0
6.0
6.0
5.0
4.0
4.0
7.0
3.5
3.5
3.3
3.0
2.6
3.5
3.5
3.0
3.0
2.8
2.6
3.5
680
640
680
490
455
560
420
360
200
160
160
210
165
165
149
132
100
165
165
132
132
116
101
166
514
474
531
357
355
394
254
227
67
44
59
43
0.0
0.0
0.0
0.0
0.0
0.0
0.0
0.0
0.0
0.0
0.0
0.0
19.3
19.3
18.3
17.4
15.4
19.3
19.3
17.4
17.4
16.4
15.4
19.9
19.3
19.3
18.3
17.4
15.4
19.3
19.3
17.4
17.4
16.4
15.4
19.9-
-
-
-
-
-
-
-
-
-
-
-
REACH AVG FREQ GRPS $ (000)
GOAL EST GOAL EST GOAL EST BALANCE GOAL EST BALANCE
OUTDOOR$(000)
DIGITAL SPOT$(000)
DIRECT MAIL$(000)
PLAN TOTALGRPS
$(000)REACH
AVG. FREQ.

82
1,3079.5
1,3079.5
1,3079.5
1,3079.5
1,3079.5
1,3079.5
1,3079.5
1,3079.5
1,3079.5
1,3079.5
1,3079.5
1,3079.5
1649.9
1649.9
1649.9
1488.9
1318.0
995.9
1649.9
1649.9
1317.9
1317.9
1156.9
995.9
13.4
GRPSCOST
GRPSCOST
GRPSCOST
15,685113.7
10.5
1,675100.5
AUG SEPT OCT NOV DEC JAN FEB MAR APRIL MAY JUN JULY TOTAL ACROSS
TARGET DEMO: ALL ADULTS AGES 18 - 34
16619.947.63.5
16519.347.13.5
16519.347.13.5
14818.345.43.3
13217.443.53.0
9915.438.82.6
16519.347.13.5
16519.347.13.5
13217.443.53.0
13217.443.53.0
11516.441.32.8
10015.439.42.6
1,689214.8
GRPSCOST
BUDGETOUT OF HOME
DIGITAL
POINT OF PURCHASE
EVENTS
DIRECT MAIL
CONTIGENCY
TOTAL $ 476,850
BillboardBus WrapFood Truck
$ 243,000
$ 100,000
$ 9,500
$ 12,000
$ 3,000
$ 20,850
$ 8,500
$ 80,000
Billboard$ 243,000
Bus Wrap$ 8,500
Food Truck$ 80,000
Digital$ 100,000
POP$ 9,500
Events$ 12,000
Direct Mail$ 3,000
Contigency$ 20,850

83
TESTING
EVALUATION
TESTING TECHNIQUES POTENTIAL RESULTS
PRE
POST
Phone & Online Surveys Gain insight on what is important and appeals to target audience in specific market
Focus Groups & Intercepts Gain insight on the effectiveness of concept and copy developed through pretesting insights
OBJECTIVES EVALUATION TECHNIQUES POTENTIAL RESULTS
Increase brand awareness Track social media engagement analytics
Compare pre and post advertising website traffic
Track Caniac Club membership from targeted market
In-store/online survey asking customers about how they heard about the new
A substantial increase in brand, tag line, and general Raising Cane’s awareness, accompanied by increased internet traffic
Increase store traffic Offer incentive with mailer to claim free glasses
Track store traffic and sales using database
More foot/drive-thru traffic in new or emerging market Raising Cane’s restaurants.
Increase in Caniac Club Membership
Track Caniac Club membership from targeted market
Track app downloads and usage
Increase in Caniac Club membership, app downloads and activity
Strong connection between community and Raising Cane’s
In-store / online / event survey rating people’s perceptions of Raising Cane’s involvement in the community
More customers from the community will relate Raising Cane’s to the “One Love, One Community” tagline.

84
SOURCES• What Matters to Millennials: 6 Insights You Cant Ignore: http://www.ideastogo.com/6-
millennial-insights-you-cant-ignore
• How To Engage Millennials In Customer Insight And Marketing: https://www.visioncritical.com/how-engage-millennials-customer-insight-and-marketing/
• Inside The Millennial Mind: http://www.executiveboard.com/exbd/marketing-communications/iconoculture/millenials/index.page?
• How Millennials Use and Control Social Media: http://www.americanpressinstitute.org/publications/reports/survey-research/millennials-social-media/
• Millennials Media Consumption Explained In 5 Charts: http://digiday.com/brands/millennial-media-consumption-habits-debunked-5-charts/
• Everything You Need To Know About Gen Z: http://www.businessinsider.com/afp-generation-z-born-in-the-digital-age-2015-2
• Move Over Millennials Here Comes Gen Z: http://adage.com/article/cmo-strategy/move-millennials-gen-z/296577/
• Generation Z: Rebels With A Cause: http://www.forbes.com/sites/onmarketing/2013/05/28/generation-z-rebels-with-a-cause/
• Food Trucks: Full Speed Ahead or Already Yielding? http://www.fastcasual.com/articles/food-trucks-full-speed-ahead-or-already-yielding/
• Food Trucks Changing The Dining Scene: http://www.huffingtonpost.com/2012/10/26/food-trucks_n_2017376.html
• How Apps Are Changing Fast Food: http://www.computerworld.com/article/2487774/mobile-apps/how-apps-are-changing-fast-food.html
• 5 Things Your Restaurant’s Mobile App Must Include: http://www.fastcasual.com/blogs/5-things-your-restaurants-mobile-app-must-include-infographic/
• 3 Reasons To Go Mobile: http://www.qsrmagazine.com/outside-insights/3-reasons-go-mobile
• The QSR Top 50 Chicken Segment: http://www.qsrmagazine.com/reports/qsr50-2014-chicken-segment-breakdown
• Market Force Study Reveals America’s Favorite Quick Service Restaurants: http://www.marketforce.com/press-releases/item/americas-favorite-quick-serve-restaurants-qsr/