raisin market of california (2012)
TRANSCRIPT
RAISINADMINISTRATIVECOMMITTEERAISINADMINISTRATIVECOMMITTEE
MarketingPolicy&IndustryStatistics
2012
MarketingPolicy&IndustryStatistics
2012
Raisin Administrative Committee
Marketing Policy & Industry Statistics 2012 – 2013 Marketing Season
As Presented and Approved by the RAC on October 3, 2012 and Submitted to the Secretary.
2445 Capitol St., Suite 200 Fresno, CA 93721
(559) 225-0520 FAX: (559) 225-0652
e-mail: [email protected] website: www.raisins.org
1
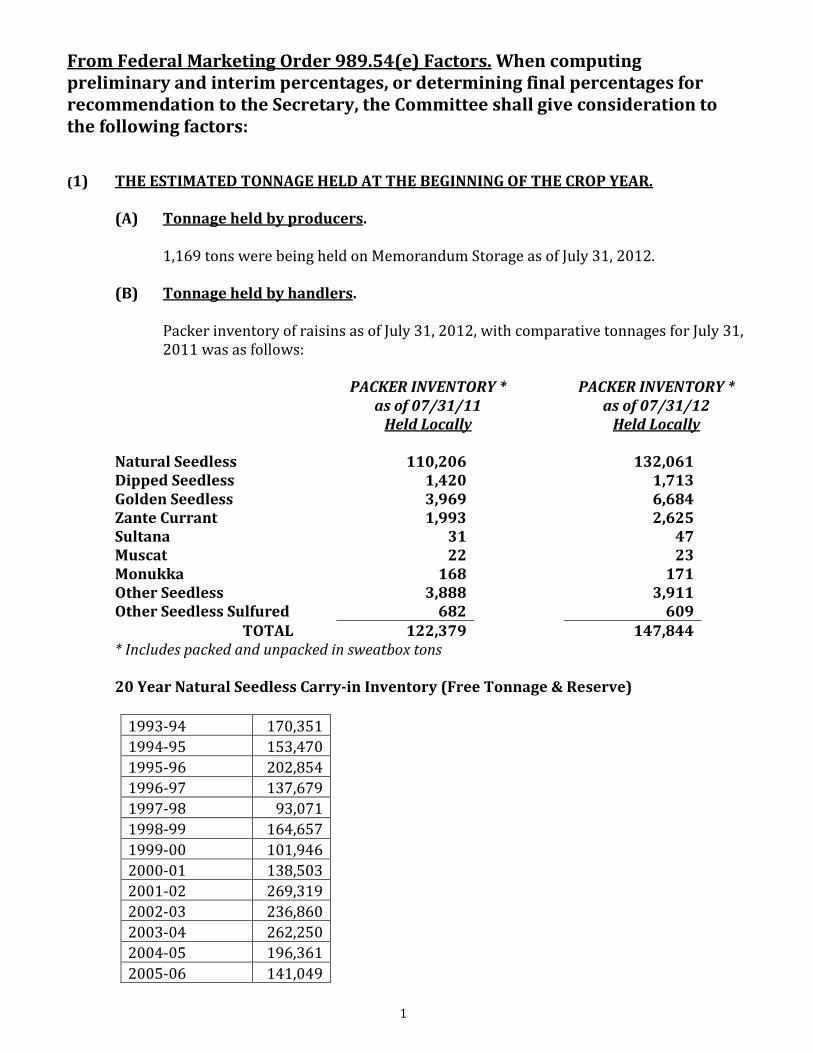
From Federal Marketing Order 989.54(e) Factors. When computing preliminary and interim percentages, or determining final percentages for recommendation to the Secretary, the Committee shall give consideration to the following factors: (1) THE ESTIMATED TONNAGE HELD AT THE BEGINNING OF THE CROP YEAR.
(A) Tonnage held by producers.
1,169 tons were being held on Memorandum Storage as of July 31, 2012.
(B) Tonnage held by handlers.
Packer inventory of raisins as of July 31, 2012, with comparative tonnages for July 31, 2011 was as follows:
PACKER INVENTORY *
as of 07/31/11 Held Locally
PACKER INVENTORY * as of 07/31/12
Held Locally Natural Seedless 110,206 132,061 Dipped Seedless 1,420 1,713 Golden Seedless 3,969 6,684 Zante Currant 1,993 2,625 Sultana 31 47 Muscat 22 23 Monukka 168 171 Other Seedless 3,888 3,911 Other Seedless Sulfured 682 609
TOTAL 122,379 147,844 * Includes packed and unpacked in sweatbox tons
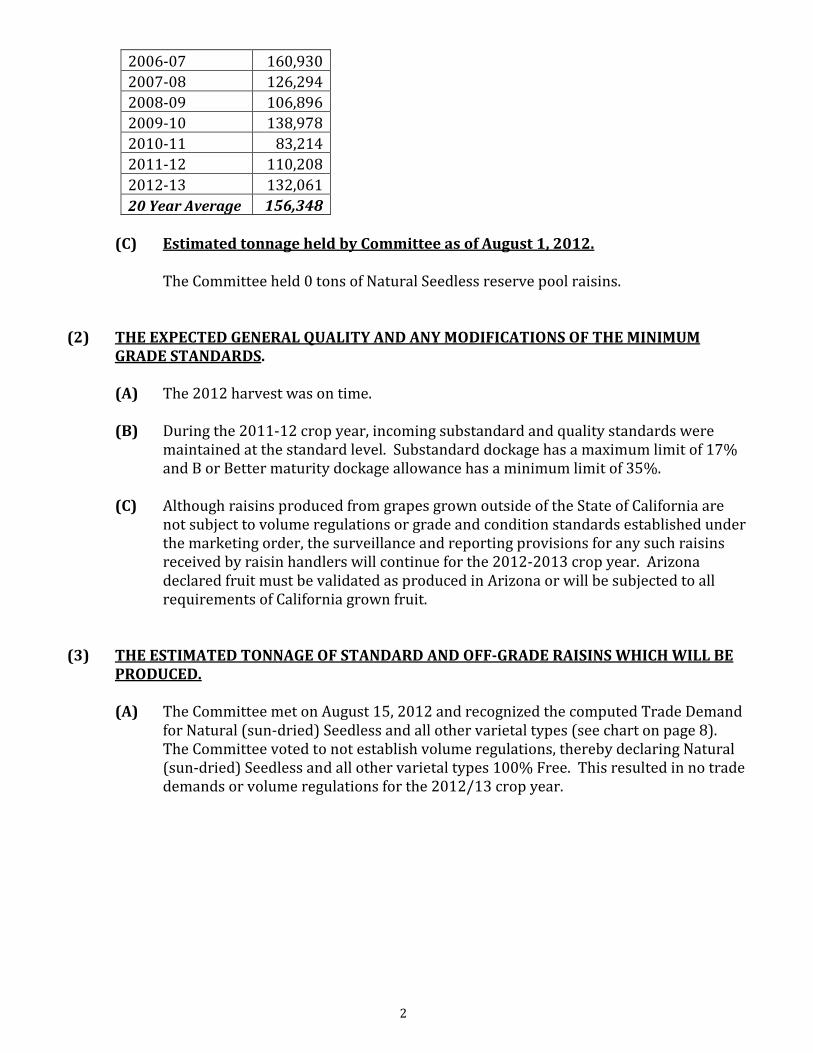
20 Year Natural Seedless Carry-in Inventory (Free Tonnage & Reserve)
1993-94 170,351 1994-95 153,470 1995-96 202,854 1996-97 137,679 1997-98 93,071 1998-99 164,657 1999-00 101,946 2000-01 138,503 2001-02 269,319 2002-03 236,860 2003-04 262,250 2004-05 196,361 2005-06 141,049
2
2006-07 160,930 2007-08 126,294 2008-09 106,896 2009-10 138,978 2010-11 83,214 2011-12 110,208 2012-13 132,061 20 Year Average 156,348
(C) Estimated tonnage held by Committee as of August 1, 2012.
The Committee held 0 tons of Natural Seedless reserve pool raisins.
(2) THE EXPECTED GENERAL QUALITY AND ANY MODIFICATIONS OF THE MINIMUM
GRADE STANDARDS.
(A) The 2012 harvest was on time.
(B) During the 2011-12 crop year, incoming substandard and quality standards were maintained at the standard level. Substandard dockage has a maximum limit of 17% and B or Better maturity dockage allowance has a minimum limit of 35%.
(C) Although raisins produced from grapes grown outside of the State of California are
not subject to volume regulations or grade and condition standards established under the marketing order, the surveillance and reporting provisions for any such raisins received by raisin handlers will continue for the 2012-2013 crop year. Arizona declared fruit must be validated as produced in Arizona or will be subjected to all requirements of California grown fruit.
(3) THE ESTIMATED TONNAGE OF STANDARD AND OFF-GRADE RAISINS WHICH WILL BE
PRODUCED.
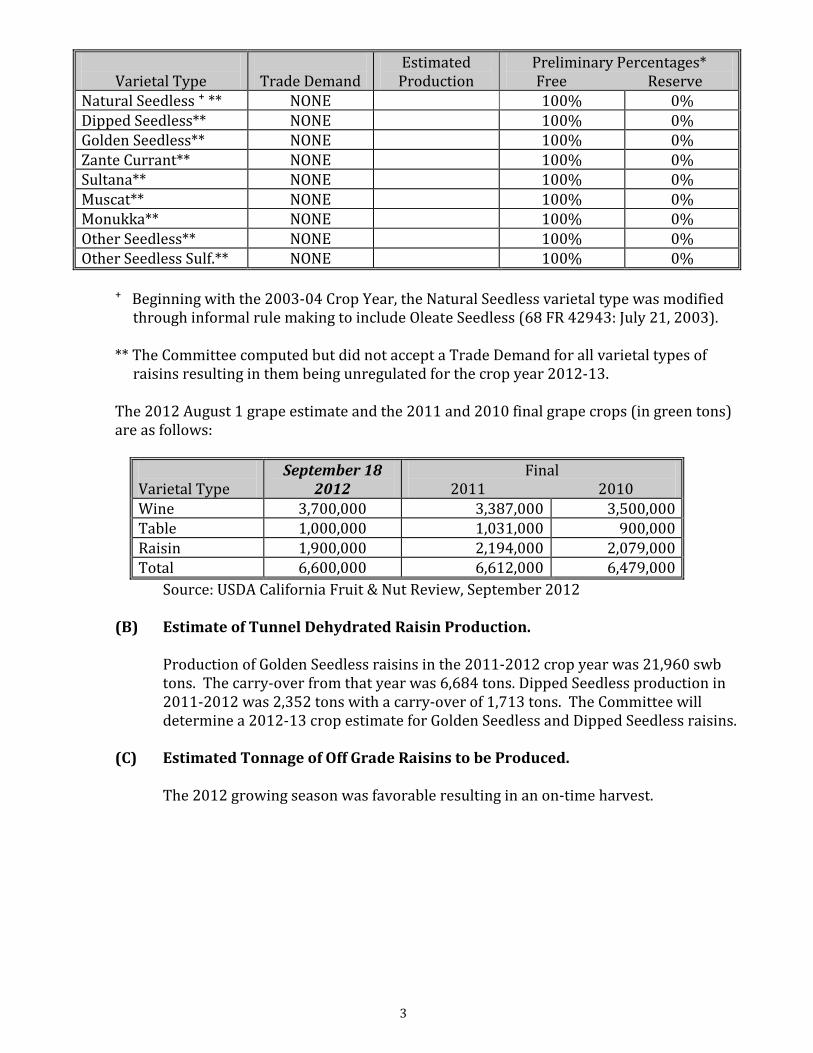
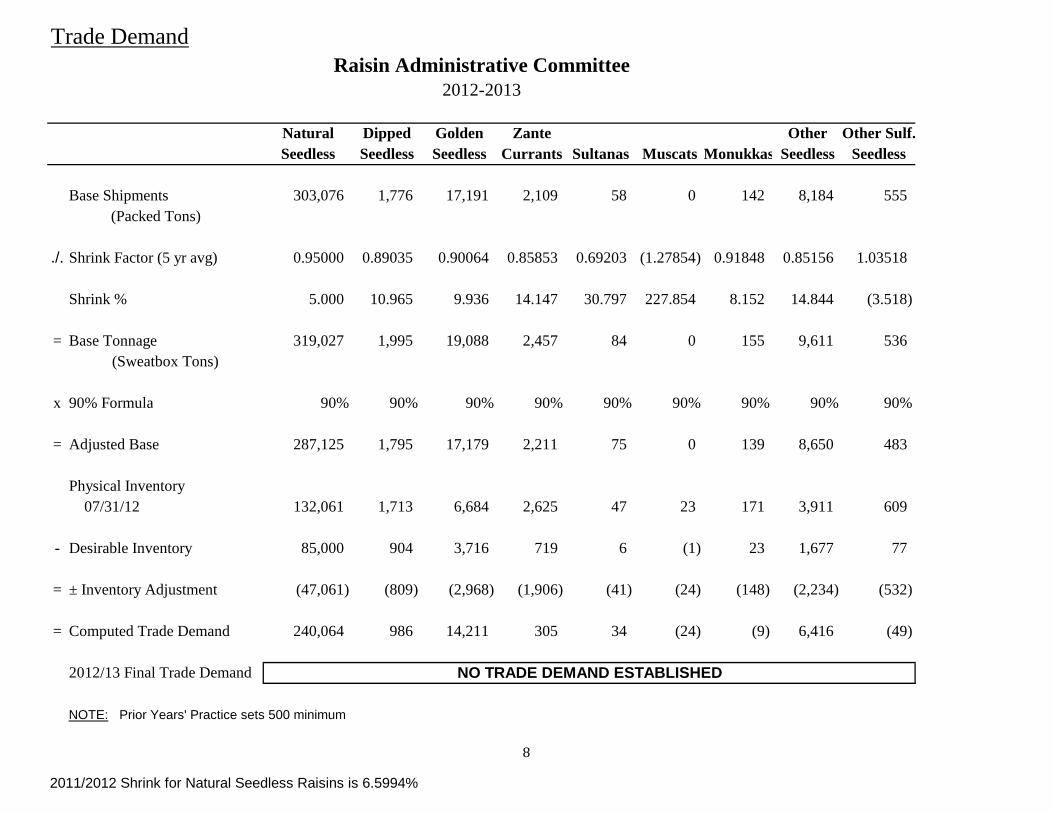
(A) The Committee met on August 15, 2012 and recognized the computed Trade Demand for Natural (sun-dried) Seedless and all other varietal types (see chart on page 8). The Committee voted to not establish volume regulations, thereby declaring Natural (sun-dried) Seedless and all other varietal types 100% Free. This resulted in no trade demands or volume regulations for the 2012/13 crop year.
3
Varietal Type
Trade Demand
Estimated Production
Preliminary Percentages* Free Reserve
Natural Seedless ⁺ ** NONE 100% 0% Dipped Seedless** NONE 100% 0% Golden Seedless** NONE 100% 0% Zante Currant** NONE 100% 0% Sultana** NONE 100% 0% Muscat** NONE 100% 0% Monukka** NONE 100% 0% Other Seedless** NONE 100% 0% Other Seedless Sulf.** NONE 100% 0%
⁺ Beginning with the 2003-04 Crop Year, the Natural Seedless varietal type was modified
through informal rule making to include Oleate Seedless (68 FR 42943: July 21, 2003).
** The Committee computed but did not accept a Trade Demand for all varietal types of raisins resulting in them being unregulated for the crop year 2012-13.
The 2012 August 1 grape estimate and the 2011 and 2010 final grape crops (in green tons) are as follows:
Varietal Type
September 18 2012
Final 2011 2010
Wine 3,700,000 3,387,000 3,500,000 Table 1,000,000 1,031,000 900,000 Raisin 1,900,000 2,194,000 2,079,000 Total 6,600,000 6,612,000 6,479,000
Source: USDA California Fruit & Nut Review, September 2012
(B) Estimate of Tunnel Dehydrated Raisin Production.
Production of Golden Seedless raisins in the 2011-2012 crop year was 21,960 swb tons. The carry-over from that year was 6,684 tons. Dipped Seedless production in 2011-2012 was 2,352 tons with a carry-over of 1,713 tons. The Committee will determine a 2012-13 crop estimate for Golden Seedless and Dipped Seedless raisins.
(C) Estimated Tonnage of Off Grade Raisins to be Produced.
The 2012 growing season was favorable resulting in an on-time harvest.
4
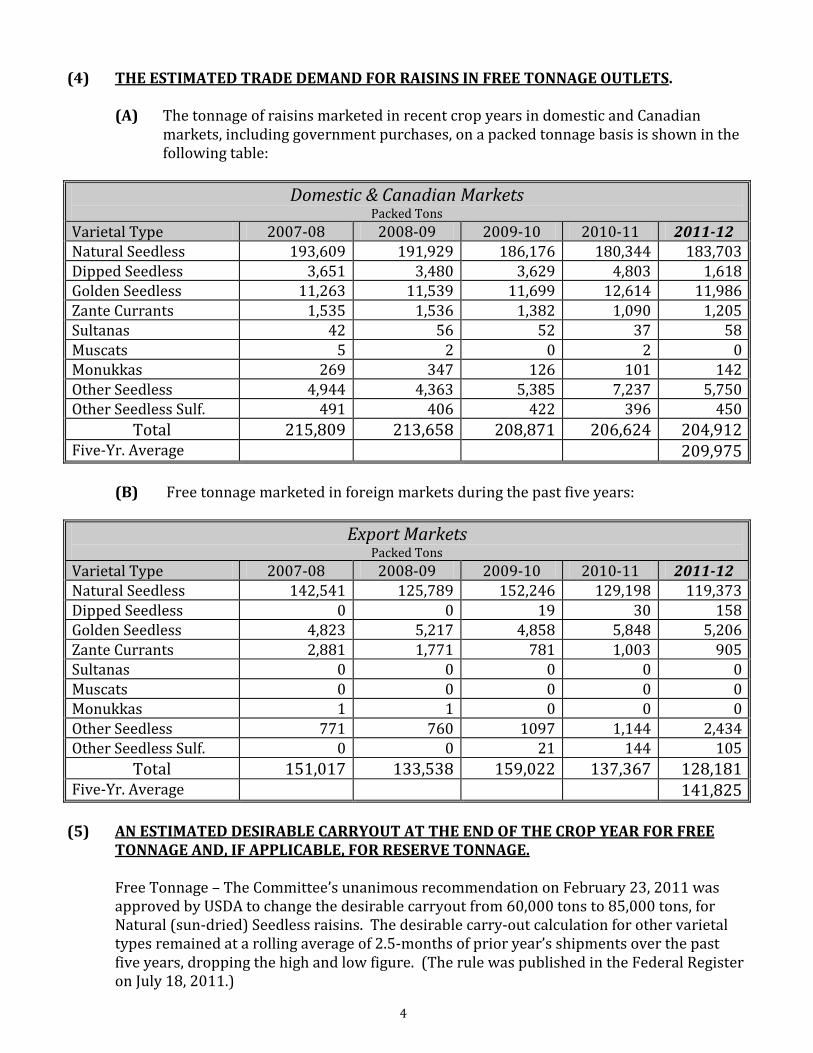
(4) THE ESTIMATED TRADE DEMAND FOR RAISINS IN FREE TONNAGE OUTLETS.
(A) The tonnage of raisins marketed in recent crop years in domestic and Canadian markets, including government purchases, on a packed tonnage basis is shown in the following table:
Domestic & Canadian Markets
Packed Tons Varietal Type 2007-08 2008-09 2009-10 2010-11 2011-12 Natural Seedless 193,609 191,929 186,176 180,344 183,703 Dipped Seedless 3,651 3,480 3,629 4,803 1,618 Golden Seedless 11,263 11,539 11,699 12,614 11,986 Zante Currants 1,535 1,536 1,382 1,090 1,205 Sultanas 42 56 52 37 58 Muscats 5 2 0 2 0 Monukkas 269 347 126 101 142 Other Seedless 4,944 4,363 5,385 7,237 5,750 Other Seedless Sulf. 491 406 422 396 450
Total 215,809 213,658 208,871 206,624 204,912 Five-Yr. Average 209,975
(B) Free tonnage marketed in foreign markets during the past five years:
Export Markets Packed Tons
Varietal Type 2007-08 2008-09 2009-10 2010-11 2011-12 Natural Seedless 142,541 125,789 152,246 129,198 119,373 Dipped Seedless 0 0 19 30 158 Golden Seedless 4,823 5,217 4,858 5,848 5,206 Zante Currants 2,881 1,771 781 1,003 905 Sultanas 0 0 0 0 0 Muscats 0 0 0 0 0 Monukkas 1 1 0 0 0 Other Seedless 771 760 1097 1,144 2,434 Other Seedless Sulf. 0 0 21 144 105
Total 151,017 133,538 159,022 137,367 128,181 Five-Yr. Average 141,825
(5) AN ESTIMATED DESIRABLE CARRYOUT AT THE END OF THE CROP YEAR FOR FREE
TONNAGE AND, IF APPLICABLE, FOR RESERVE TONNAGE.
Free Tonnage – The Committee’s unanimous recommendation on February 23, 2011 was approved by USDA to change the desirable carryout from 60,000 tons to 85,000 tons, for Natural (sun-dried) Seedless raisins. The desirable carry-out calculation for other varietal types remained at a rolling average of 2.5-months of prior year’s shipments over the past five years, dropping the high and low figure. (The rule was published in the Federal Register on July 18, 2011.)
5
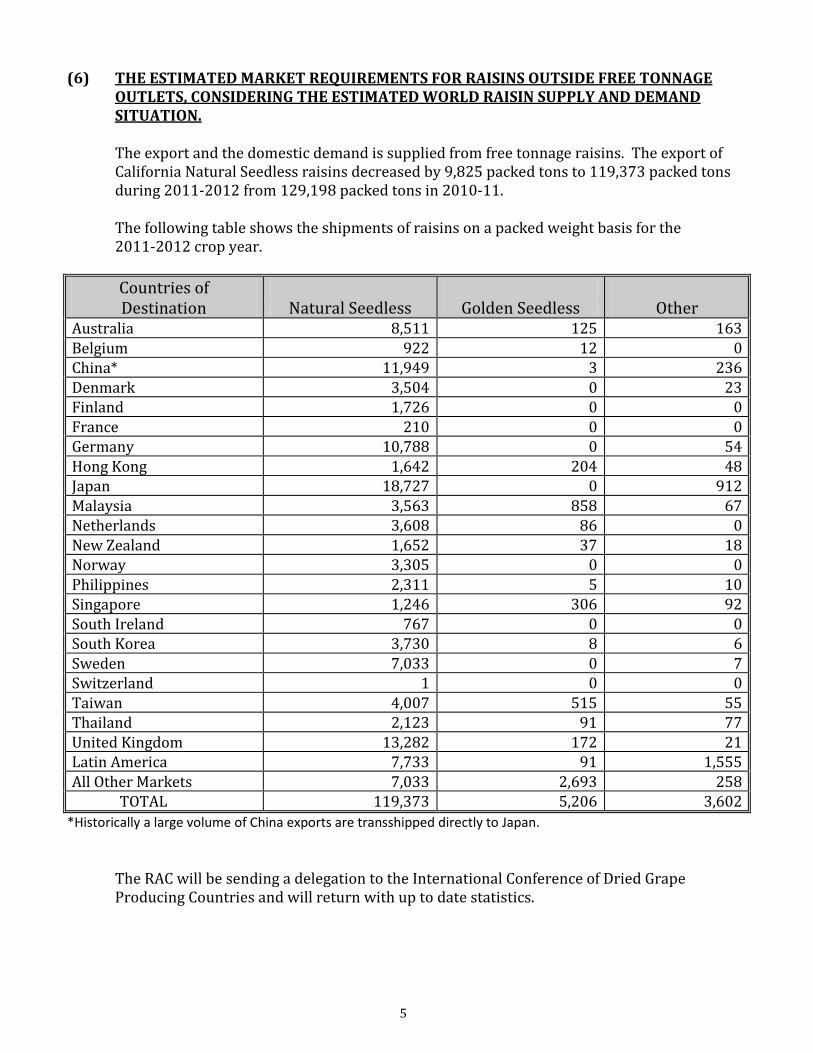
(6) THE ESTIMATED MARKET REQUIREMENTS FOR RAISINS OUTSIDE FREE TONNAGE
OUTLETS, CONSIDERING THE ESTIMATED WORLD RAISIN SUPPLY AND DEMAND SITUATION.
The export and the domestic demand is supplied from free tonnage raisins. The export of California Natural Seedless raisins decreased by 9,825 packed tons to 119,373 packed tons during 2011-2012 from 129,198 packed tons in 2010-11.
The following table shows the shipments of raisins on a packed weight basis for the 2011-2012 crop year. Countries of Destination
Natural Seedless
Golden Seedless
Other
Australia 8,511 125 163 Belgium 922 12 0 China* 11,949 3 236 Denmark 3,504 0 23 Finland 1,726 0 0 France 210 0 0 Germany 10,788 0 54 Hong Kong 1,642 204 48 Japan 18,727 0 912 Malaysia 3,563 858 67 Netherlands 3,608 86 0 New Zealand 1,652 37 18 Norway 3,305 0 0 Philippines 2,311 5 10 Singapore 1,246 306 92 South Ireland 767 0 0 South Korea 3,730 8 6 Sweden 7,033 0 7 Switzerland 1 0 0 Taiwan 4,007 515 55 Thailand 2,123 91 77 United Kingdom 13,282 172 21 Latin America 7,733 91 1,555 All Other Markets 7,033 2,693 258
TOTAL 119,373 5,206 3,602 *Historically a large volume of China exports are transshipped directly to Japan.
The RAC will be sending a delegation to the International Conference of Dried Grape Producing Countries and will return with up to date statistics.
6
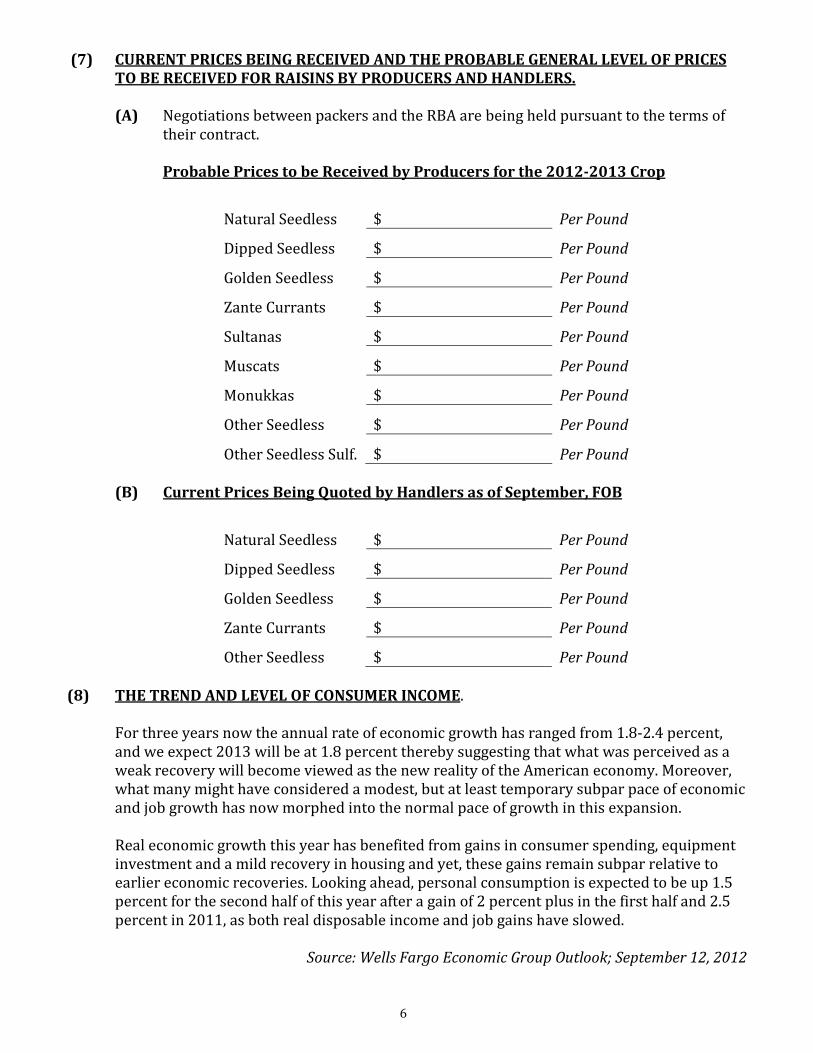
(7) CURRENT PRICES BEING RECEIVED AND THE PROBABLE GENERAL LEVEL OF PRICES TO BE RECEIVED FOR RAISINS BY PRODUCERS AND HANDLERS.
(A) Negotiations between packers and the RBA are being held pursuant to the terms of
their contract.
Probable Prices to be Received by Producers for the 2012-2013 Crop
Natural Seedless $ Per Pound
Dipped Seedless $ Per Pound
Golden Seedless $ Per Pound
Zante Currants $ Per Pound
Sultanas $ Per Pound
Muscats $ Per Pound
Monukkas $ Per Pound
Other Seedless $ Per Pound
Other Seedless Sulf. $ Per Pound
(B) Current Prices Being Quoted by Handlers as of September, FOB
Natural Seedless $ Per Pound
Dipped Seedless $ Per Pound
Golden Seedless $ Per Pound
Zante Currants $ Per Pound
Other Seedless $ Per Pound (8) THE TREND AND LEVEL OF CONSUMER INCOME.
For three years now the annual rate of economic growth has ranged from 1.8-2.4 percent, and we expect 2013 will be at 1.8 percent thereby suggesting that what was perceived as a weak recovery will become viewed as the new reality of the American economy. Moreover, what many might have considered a modest, but at least temporary subpar pace of economic and job growth has now morphed into the normal pace of growth in this expansion. Real economic growth this year has benefited from gains in consumer spending, equipment investment and a mild recovery in housing and yet, these gains remain subpar relative to earlier economic recoveries. Looking ahead, personal consumption is expected to be up 1.5 percent for the second half of this year after a gain of 2 percent plus in the first half and 2.5 percent in 2011, as both real disposable income and job gains have slowed.
Source: Wells Fargo Economic Group Outlook; September 12, 2012
7
Historically, California raisins maintain good market demand even in weaker economic times.
(9) ANY OTHER PERTINENT FACTORS BEARING ON THE MARKETING OF SUCH RAISINS
INCLUDING THE ESTIMATED SUPPLY AND DEMAND FOR OTHER VARIETAL TYPES AND REGULATIONS APPLICABLE THERETO.
8
Natural Dipped Golden Zante Other Other Sulf.Seedless Seedless Seedless Currants Sultanas Muscats Monukkas Seedless Seedless
Base Shipments 303,076 1,776 17,191 2,109 58 0 142 8,184 555 (Packed Tons)
./. Shrink Factor (5 yr avg) 0.95000 0.89035 0.90064 0.85853 0.69203 (1.27854) 0.91848 0.85156 1.03518
Shrink % 5.000 10.965 9.936 14.147 30.797 227.854 8.152 14.844 (3.518)
= Base Tonnage 319,027 1,995 19,088 2,457 84 0 155 9,611 536(Sweatbox Tons)
x 90% Formula 90% 90% 90% 90% 90% 90% 90% 90% 90%
= Adjusted Base 287,125 1,795 17,179 2,211 75 0 139 8,650 483
Physical Inventory 07/31/12 132,061 1,713 6,684 2,625 47 23 171 3,911 609
- Desirable Inventory 85,000 904 3,716 719 6 (1) 23 1,677 77
= ± Inventory Adjustment (47,061) (809) (2,968) (1,906) (41) (24) (148) (2,234) (532)
= Computed Trade Demand 240,064 986 14,211 305 34 (24) (9) 6,416 (49)
2012/13 Final Trade Demand
NOTE: Prior Years' Practice sets 500 minimum
2011/2012 Shrink for Natural Seedless Raisins is 6.5994%
Trade DemandRaisin Administrative Committee
2012-2013
NO TRADE DEMAND ESTABLISHED
9
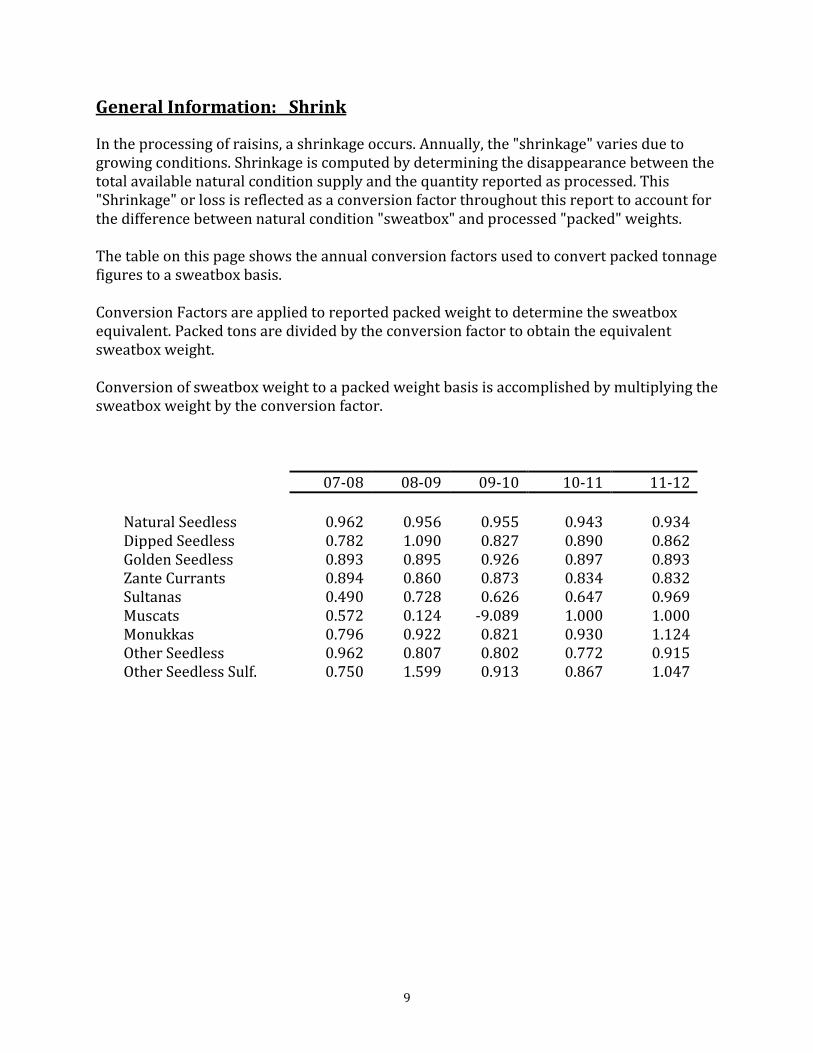
General Information: Shrink
In the processing of raisins, a shrinkage occurs. Annually, the "shrinkage" varies due to growing conditions. Shrinkage is computed by determining the disappearance between the total available natural condition supply and the quantity reported as processed. This "Shrinkage" or loss is reflected as a conversion factor throughout this report to account for the difference between natural condition "sweatbox" and processed "packed" weights. The table on this page shows the annual conversion factors used to convert packed tonnage figures to a sweatbox basis. Conversion Factors are applied to reported packed weight to determine the sweatbox equivalent. Packed tons are divided by the conversion factor to obtain the equivalent sweatbox weight. Conversion of sweatbox weight to a packed weight basis is accomplished by multiplying the sweatbox weight by the conversion factor.
07-08 08-09 09-10 10-11 11-12 Natural Seedless 0.962 0.956 0.955 0.943 0.934 Dipped Seedless 0.782 1.090 0.827 0.890 0.862 Golden Seedless 0.893 0.895 0.926 0.897 0.893 Zante Currants 0.894 0.860 0.873 0.834 0.832 Sultanas 0.490 0.728 0.626 0.647 0.969 Muscats 0.572 0.124 -9.089 1.000 1.000 Monukkas 0.796 0.922 0.821 0.930 1.124 Other Seedless 0.962 0.807 0.802 0.772 0.915 Other Seedless Sulf. 0.750 1.599 0.913 0.867 1.047
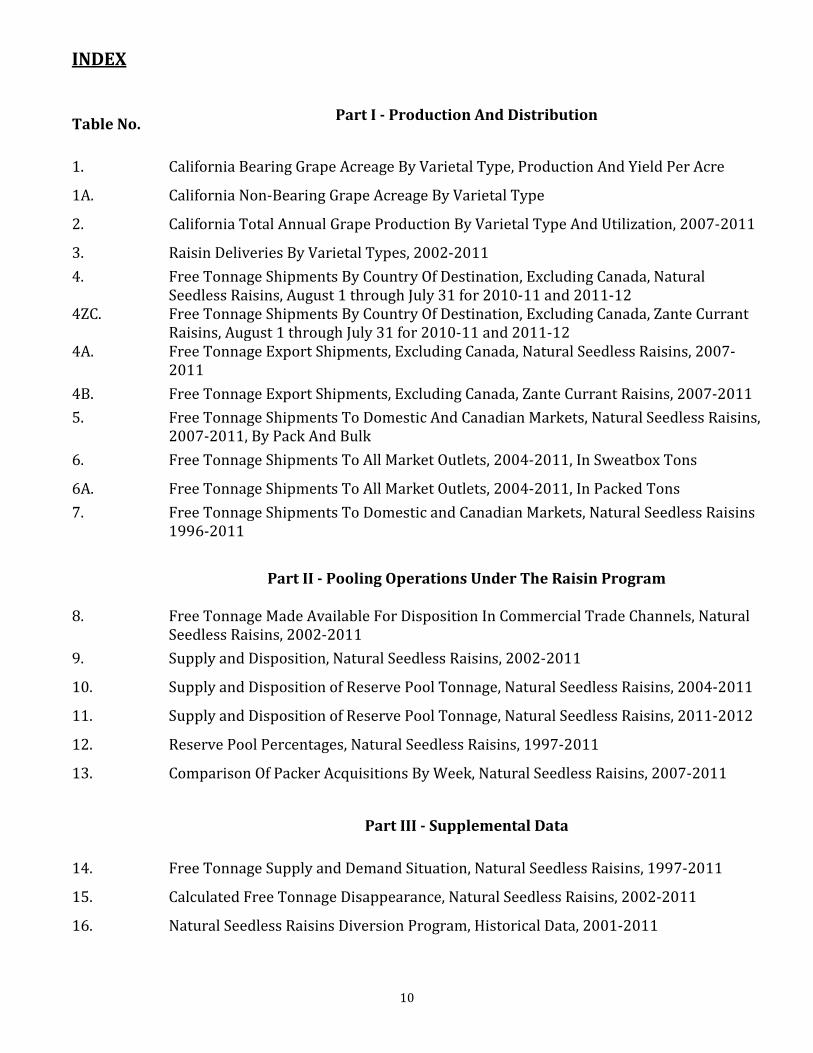
INDEX
10
Table No. Part I - Production And Distribution
1. California Bearing Grape Acreage By Varietal Type, Production And Yield Per Acre
1A. California Non-Bearing Grape Acreage By Varietal Type
2. California Total Annual Grape Production By Varietal Type And Utilization, 2007-2011
3. Raisin Deliveries By Varietal Types, 2002-2011 4. Free Tonnage Shipments By Country Of Destination, Excluding Canada, Natural
Seedless Raisins, August 1 through July 31 for 2010-11 and 2011-12 4ZC. Free Tonnage Shipments By Country Of Destination, Excluding Canada, Zante Currant
Raisins, August 1 through July 31 for 2010-11 and 2011-12 4A. Free Tonnage Export Shipments, Excluding Canada, Natural Seedless Raisins, 2007-
2011 4B. Free Tonnage Export Shipments, Excluding Canada, Zante Currant Raisins, 2007-2011 5. Free Tonnage Shipments To Domestic And Canadian Markets, Natural Seedless Raisins,
2007-2011, By Pack And Bulk 6. Free Tonnage Shipments To All Market Outlets, 2004-2011, In Sweatbox Tons
6A. Free Tonnage Shipments To All Market Outlets, 2004-2011, In Packed Tons 7. Free Tonnage Shipments To Domestic and Canadian Markets, Natural Seedless Raisins
1996-2011
Part II - Pooling Operations Under The Raisin Program 8. Free Tonnage Made Available For Disposition In Commercial Trade Channels, Natural
Seedless Raisins, 2002-2011 9. Supply and Disposition, Natural Seedless Raisins, 2002-2011
10. Supply and Disposition of Reserve Pool Tonnage, Natural Seedless Raisins, 2004-2011
11. Supply and Disposition of Reserve Pool Tonnage, Natural Seedless Raisins, 2011-2012
12. Reserve Pool Percentages, Natural Seedless Raisins, 1997-2011
13. Comparison Of Packer Acquisitions By Week, Natural Seedless Raisins, 2007-2011
Part III - Supplemental Data 14. Free Tonnage Supply and Demand Situation, Natural Seedless Raisins, 1997-2011
15. Calculated Free Tonnage Disappearance, Natural Seedless Raisins, 2002-2011
16. Natural Seedless Raisins Diversion Program, Historical Data, 2001-2011
INDEX
11
Part IV – Members, Alternates and Staff Page No. 34 RAC Officers, Members, Alternates and Staff 2012-2013
Part V – Misc. California Raisin Research Projects 36 California Raisins Health and Nutrition Research by California Raisin Marketing Board
47 California Raisin Marketing Board Funded Crop Production Research 2011-2012
48 California Raisin Marketing Board Funded Crop Production Research 2010-2011
49 California Raisin Marketing Board Funded Crop Production Research 2009-2010
50 California Raisin Marketing Board Funded Crop Production Research 2008-2009
51 California Raisin Marketing Board Funded Crop Production Research 2007-2008
52 California Raisin Marketing Board Funded Crop Production Research 2006-2007
53 California Raisin Marketing Board Funded Crop Production Research 2005-2006
54 California Raisin Marketing Board Funded Crop Production Research 2004-2005
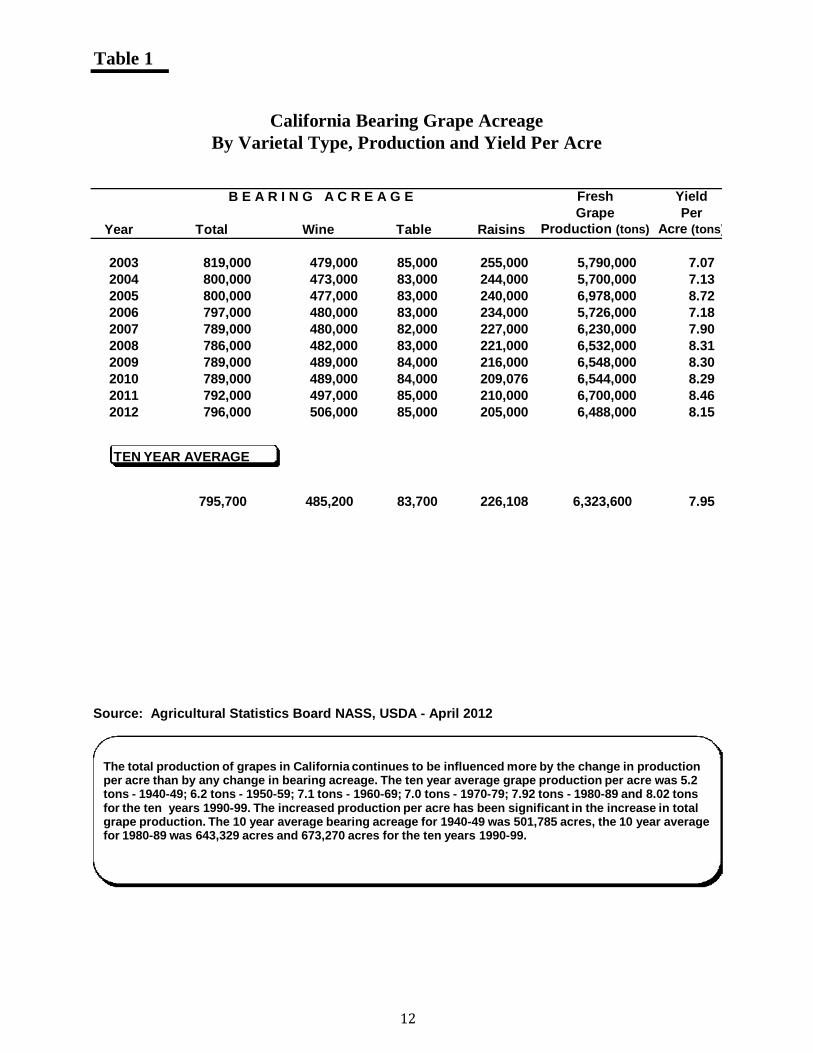
Table 1
Fresh YieldGrape Per
Year Total Wine Table Raisins Production (tons) Acre (tons)
2003 819,000 479,000 85,000 255,000 5,790,000 7.072004 800,000 473,000 83,000 244,000 5,700,000 7.132005 800,000 477,000 83,000 240,000 6,978,000 8.722006 797,000 480,000 83,000 234,000 5,726,000 7.182007 789,000 480,000 82,000 227,000 6,230,000 7.902008 786,000 482,000 83,000 221,000 6,532,000 8.312009 789,000 489,000 84,000 216,000 6,548,000 8.302010 789,000 489,000 84,000 209,076 6,544,000 8.292011 792,000 497,000 85,000 210,000 6,700,000 8.462012 796,000 506,000 85,000 205,000 6,488,000 8.15
795,700 485,200 83,700 226,108 6,323,600 7.95
Source: Agricultural Statistics Board NASS, USDA - April 2012
California Bearing Grape AcreageBy Varietal Type, Production and Yield Per Acre
B E A R I N G A C R E A G E
TEN YEAR AVERAGE
The total production of grapes in California continues to be influenced more by the change in production per acre than by any change in bearing acreage. The ten year average grape production per acre was 5.2 tons - 1940-49; 6.2 tons - 1950-59; 7.1 tons - 1960-69; 7.0 tons - 1970-79; 7.92 tons - 1980-89 and 8.02 tons for the ten years 1990-99. The increased production per acre has been significant in the increase in total grape production. The 10 year average bearing acreage for 1940-49 was 501,785 acres, the 10 year average for 1980-89 was 643,329 acres and 673,270 acres for the ten years 1990-99.
12
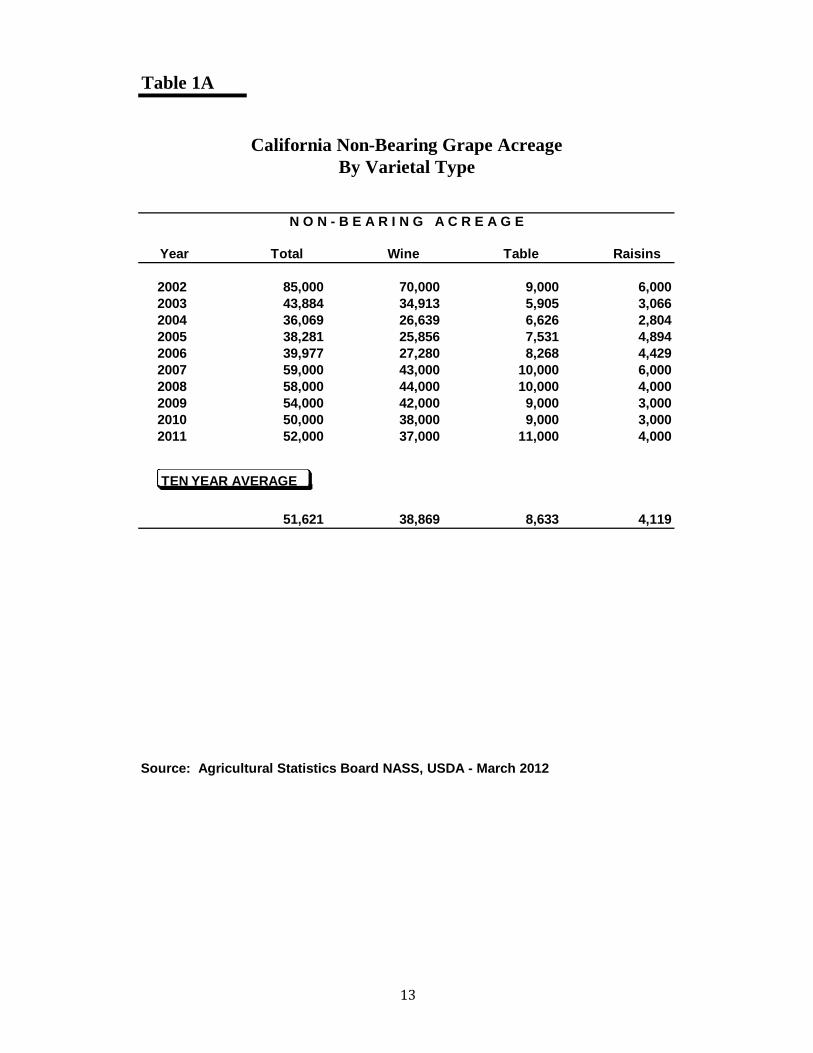
Table 1A
California Non-Bearing Grape AcreageBy Varietal Type
N O N - B E A R I N G A C R E A G E
Year Total Wine Table Raisins
2002 85,000 70,000 9,000 6,0002003 43,884 34,913 5,905 3,0662004 36,069 26,639 6,626 2,8042005 38,281 25,856 7,531 4,8942006 39,977 27,280 8,268 4,4292007 59,000 43,000 10,000 6,0002008 58,000 44,000 10,000 4,0002009 54,000 42,000 9,000 3,0002010 50,000 38,000 9,000 3,0002011 52,000 37,000 11,000 4,000
51,621 38,869 8,633 4,119
Source: Agricultural Statistics Board NASS, USDA - March 2012
TEN YEAR AVERAGE
13
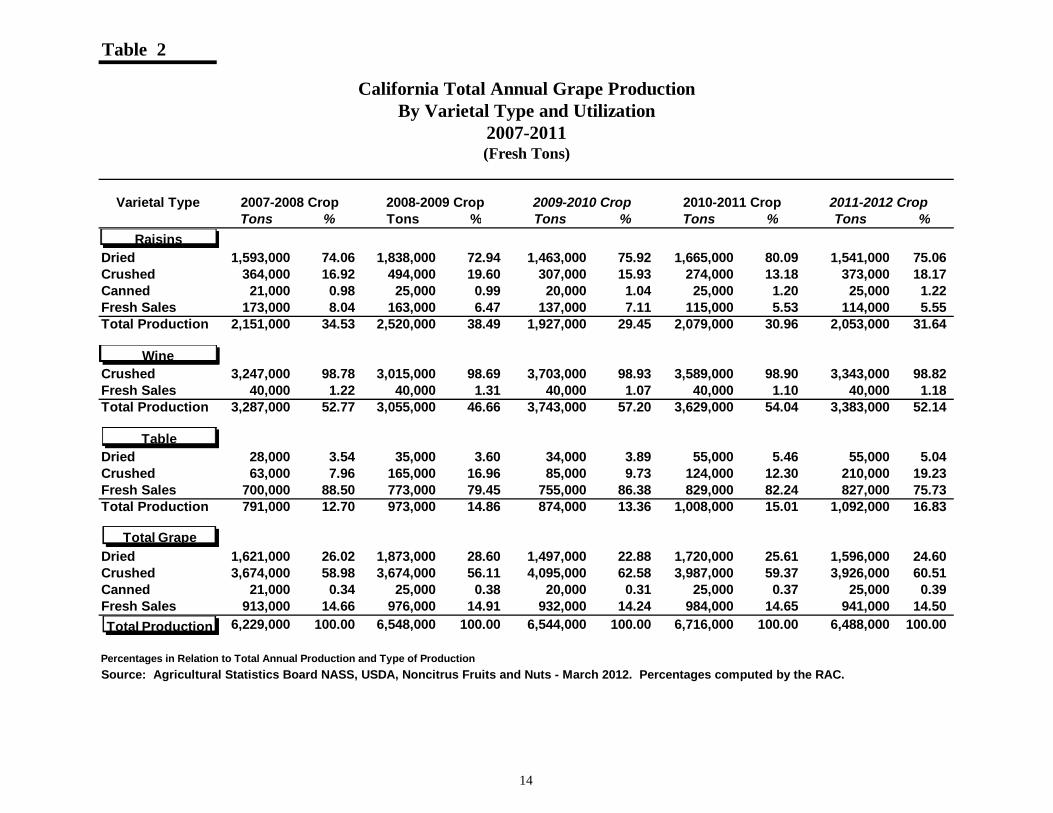
Table 2
Varietal Type 2007-2008 Crop 2008-2009 Crop 2009-2010 Crop 2010-2011 Crop 2011-2012 CropTons % Tons % Tons % Tons % Tons %
Dried 1,593,000 74.06 1,838,000 72.94 1,463,000 75.92 1,665,000 80.09 1,541,000 75.06Crushed 364,000 16.92 494,000 19.60 307,000 15.93 274,000 13.18 373,000 18.17Canned 21,000 0.98 25,000 0.99 20,000 1.04 25,000 1.20 25,000 1.22Fresh Sales 173,000 8.04 163,000 6.47 137,000 7.11 115,000 5.53 114,000 5.55Total Production 2,151,000 34.53 2,520,000 38.49 1,927,000 29.45 2,079,000 30.96 2,053,000 31.64
Crushed 3,247,000 98.78 3,015,000 98.69 3,703,000 98.93 3,589,000 98.90 3,343,000 98.82Fresh Sales 40,000 1.22 40,000 1.31 40,000 1.07 40,000 1.10 40,000 1.18Total Production 3,287,000 52.77 3,055,000 46.66 3,743,000 57.20 3,629,000 54.04 3,383,000 52.14
Dried 28,000 3.54 35,000 3.60 34,000 3.89 55,000 5.46 55,000 5.04Crushed 63,000 7.96 165,000 16.96 85,000 9.73 124,000 12.30 210,000 19.23Fresh Sales 700,000 88.50 773,000 79.45 755,000 86.38 829,000 82.24 827,000 75.73Total Production 791,000 12.70 973,000 14.86 874,000 13.36 1,008,000 15.01 1,092,000 16.83
Dried 1,621,000 26.02 1,873,000 28.60 1,497,000 22.88 1,720,000 25.61 1,596,000 24.60Crushed 3,674,000 58.98 3,674,000 56.11 4,095,000 62.58 3,987,000 59.37 3,926,000 60.51Canned 21,000 0.34 25,000 0.38 20,000 0.31 25,000 0.37 25,000 0.39Fresh Sales 913,000 14.66 976,000 14.91 932,000 14.24 984,000 14.65 941,000 14.50
6,229,000 100.00 6,548,000 100.00 6,544,000 100.00 6,716,000 100.00 6,488,000 100.00
Percentages in Relation to Total Annual Production and Type of ProductionSource: Agricultural Statistics Board NASS, USDA, Noncitrus Fruits and Nuts - March 2012. Percentages computed by the RAC.
California Total Annual Grape ProductionBy Varietal Type and Utilization
2007-2011(Fresh Tons)
Raisins
Wine
Table
Total Grape
Total Production
14
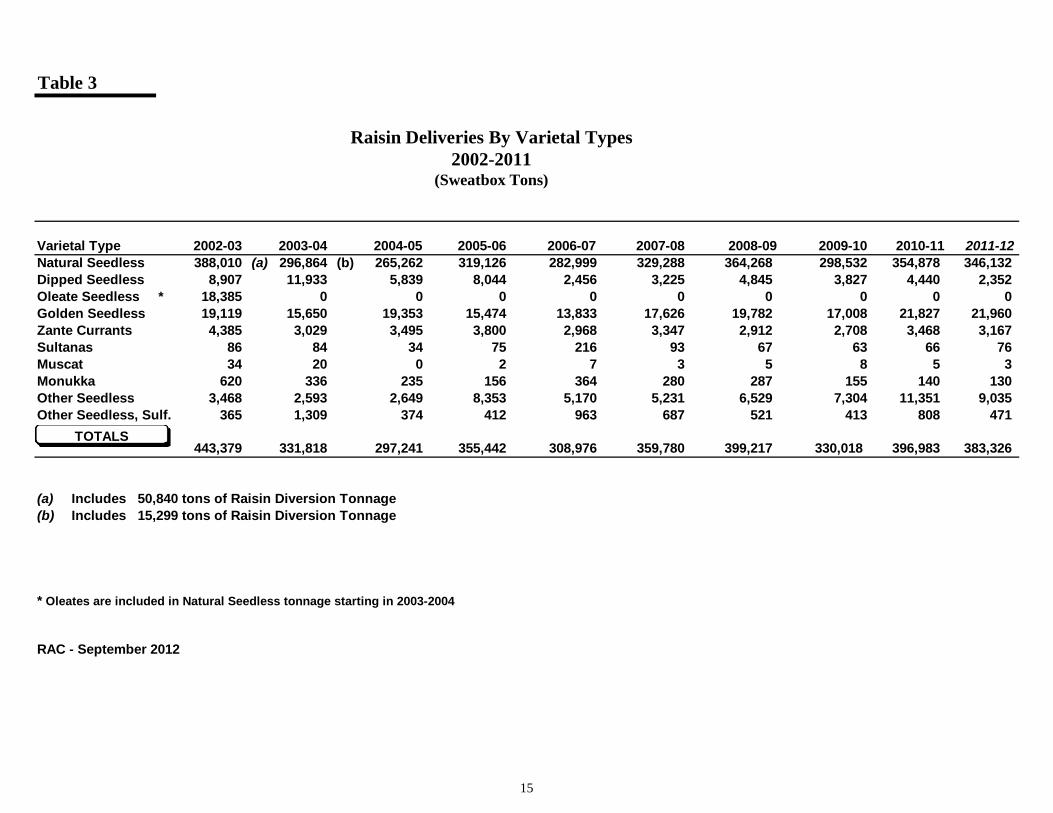
Table 3
Raisin Deliveries By Varietal Types2002-2011
(Sweatbox Tons)
Varietal Type 2002-03 2003-04 2004-05 2005-06 2006-07 2007-08 2008-09 2009-10 2010-11 2011-12Natural Seedless 388,010 (a) 296,864 (b) 265,262 319,126 282,999 329,288 364,268 298,532 354,878 346,132Dipped Seedless 8,907 11,933 5,839 8,044 2,456 3,225 4,845 3,827 4,440 2,352Oleate Seedless * 18,385 0 0 0 0 0 0 0 0 0Golden Seedless 19,119 15,650 19,353 15,474 13,833 17,626 19,782 17,008 21,827 21,960Zante Currants 4,385 3,029 3,495 3,800 2,968 3,347 2,912 2,708 3,468 3,167Sultanas 86 84 34 75 216 93 67 63 66 76Muscat 34 20 0 2 7 3 5 8 5 3Monukka 620 336 235 156 364 280 287 155 140 130Other Seedless 3,468 2,593 2,649 8,353 5,170 5,231 6,529 7,304 11,351 9,035Other Seedless, Sulf. 365 1,309 374 412 963 687 521 413 808 471
443,379 331,818 297,241 355,442 308,976 359,780 399,217 330,018 396,983 383,326
(a) Includes 50,840 tons of Raisin Diversion Tonnage(b) Includes 15,299 tons of Raisin Diversion Tonnage
* Oleates are included in Natural Seedless tonnage starting in 2003-2004
RAC - September 2012
TOTALS
15
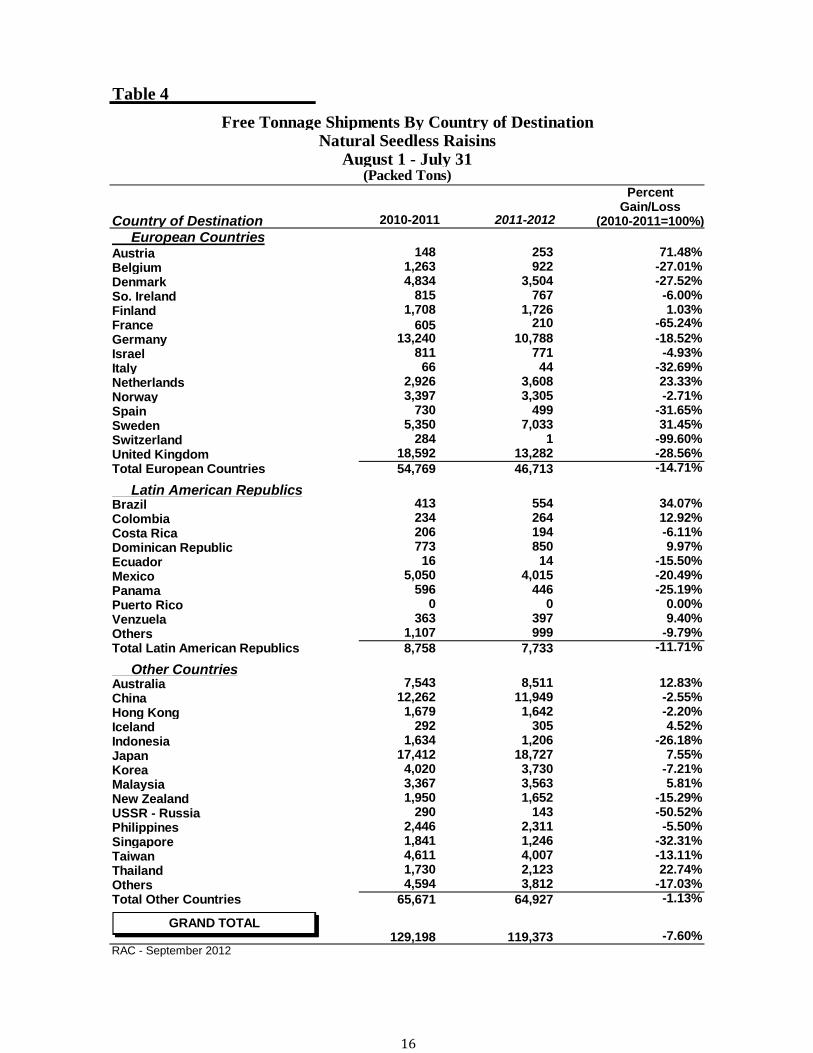
Table 4Free Tonnage Shipments By Country of Destination
Natural Seedless RaisinsAugust 1 - July 31
(Packed Tons)Percent
Gain/LossCountry of Destination 2010-2011 2011-2012 (2010-2011=100%) European CountriesAustria 148 253 71.48%Belgium 1,263 922 -27.01%Denmark 4,834 3,504 -27.52%So. Ireland 815 767 -6.00%Finland 1,708 1,726 1.03%France 605 210 -65.24%Germany 13,240 10,788 -18.52%Israel 811 771 -4.93%Italy 66 44 -32.69%Netherlands 2,926 3,608 23.33%Norway 3,397 3,305 -2.71%Spain 730 499 -31.65%Sweden 5,350 7,033 31.45%Switzerland 284 1 -99.60%United Kingdom 18,592 13,282 -28.56%Total European Countries 54,769 46,713 -14.71%
Latin American RepublicsBrazil 413 554 34.07%Colombia 234 264 12.92%Costa Rica 206 194 -6.11%Dominican Republic 773 850 9.97%Ecuador 16 14 -15.50%Mexico 5,050 4,015 -20.49%Panama 596 446 -25.19%Puerto Rico 0 0 0.00%Venzuela 363 397 9.40%Others 1,107 999 -9.79%Total Latin American Republics 8,758 7,733 -11.71%
Other CountriesAustralia 7,543 8,511 12.83%China 12,262 11,949 -2.55%Hong Kong 1,679 1,642 -2.20%Iceland 292 305 4.52%Indonesia 1,634 1,206 -26.18%Japan 17,412 18,727 7.55%Korea 4,020 3,730 -7.21%Malaysia 3,367 3,563 5.81%New Zealand 1,950 1,652 -15.29%USSR - Russia 290 143 -50.52%Philippines 2,446 2,311 -5.50%Singapore 1,841 1,246 -32.31%Taiwan 4,611 4,007 -13.11%Thailand 1,730 2,123 22.74%Others 4,594 3,812 -17.03%Total Other Countries 65,671 64,927 -1.13%
129,198 119,373 -7.60%RAC - September 2012
GRAND TOTAL
16
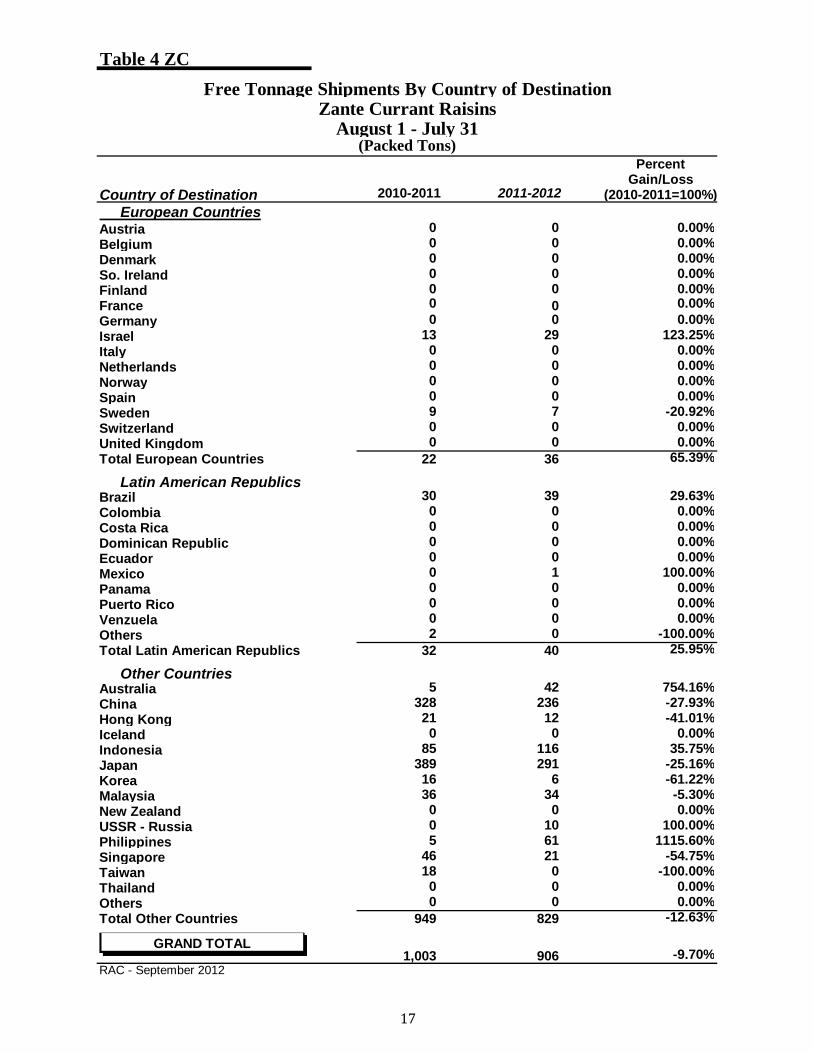
Table 4 ZCFree Tonnage Shipments By Country of Destination
Zante Currant RaisinsAugust 1 - July 31
(Packed Tons)Percent
Gain/LossCountry of Destination 2010-2011 2011-2012 (2010-2011=100%) European CountriesAustria 0 0 0.00%Belgium 0 0 0.00%Denmark 0 0 0.00%So. Ireland 0 0 0.00%Finland 0 0 0.00%France 0 0 0.00%Germany 0 0 0.00%Israel 13 29 123.25%Italy 0 0 0.00%Netherlands 0 0 0.00%Norway 0 0 0.00%Spain 0 0 0.00%Sweden 9 7 -20.92%Switzerland 0 0 0.00%United Kingdom 0 0 0.00%Total European Countries 22 36 65.39%
Latin American RepublicsBrazil 30 39 29.63%Colombia 0 0 0.00%Costa Rica 0 0 0.00%Dominican Republic 0 0 0.00%Ecuador 0 0 0.00%Mexico 0 1 100.00%Panama 0 0 0.00%Puerto Rico 0 0 0.00%Venzuela 0 0 0.00%Others 2 0 -100.00%Total Latin American Republics 32 40 25.95%
Other CountriesAustralia 5 42 754.16%China 328 236 -27.93%Hong Kong 21 12 -41.01%Iceland 0 0 0.00%Indonesia 85 116 35.75%Japan 389 291 -25.16%Korea 16 6 -61.22%Malaysia 36 34 -5.30%New Zealand 0 0 0.00%USSR - Russia 0 10 100.00%Philippines 5 61 1115.60%Singapore 46 21 -54.75%Taiwan 18 0 -100.00%Thailand 0 0 0.00%Others 0 0 0.00%Total Other Countries 949 829 -12.63%
1,003 906 -9.70%RAC - September 2012
GRAND TOTAL
17
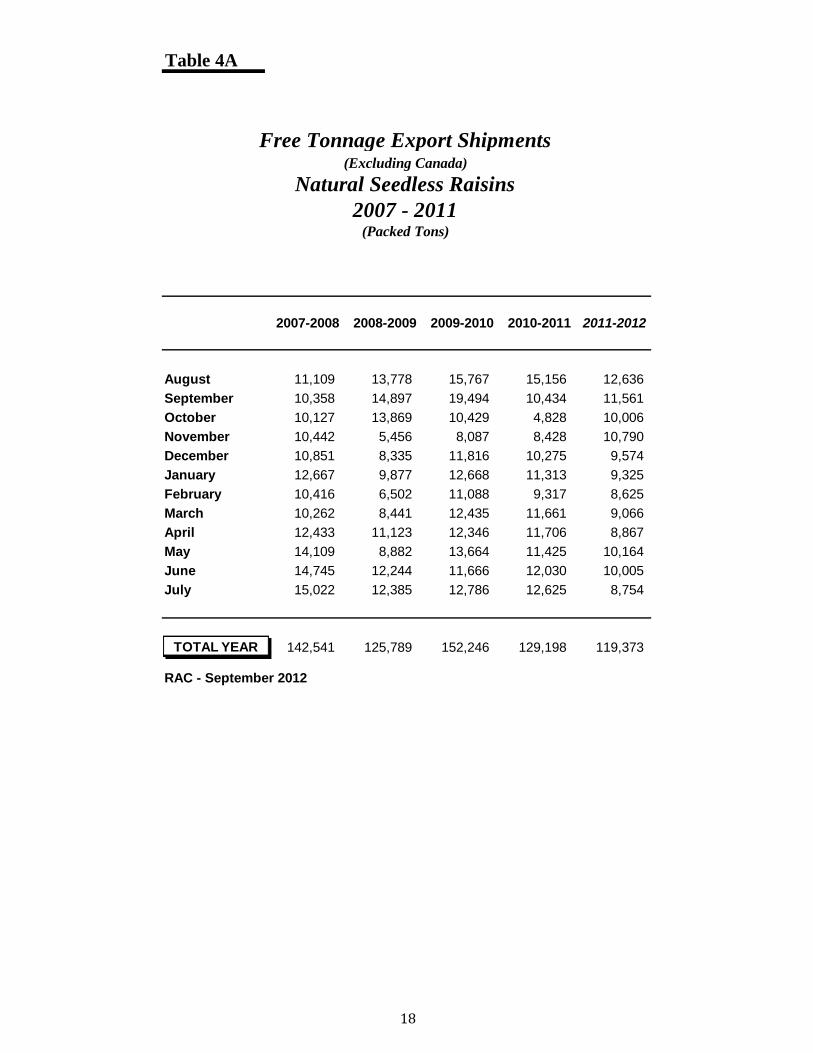
Table 4A
Free Tonnage Export Shipments(Excluding Canada)
Natural Seedless Raisins2007 - 2011
(Packed Tons)
2007-2008 2008-2009 2009-2010 2010-2011 2011-2012
August 11,109 13,778 15,767 15,156 12,636September 10,358 14,897 19,494 10,434 11,561October 10,127 13,869 10,429 4,828 10,006November 10,442 5,456 8,087 8,428 10,790December 10,851 8,335 11,816 10,275 9,574January 12,667 9,877 12,668 11,313 9,325February 10,416 6,502 11,088 9,317 8,625March 10,262 8,441 12,435 11,661 9,066April 12,433 11,123 12,346 11,706 8,867May 14,109 8,882 13,664 11,425 10,164June 14,745 12,244 11,666 12,030 10,005July 15,022 12,385 12,786 12,625 8,754
142,541 125,789 152,246 129,198 119,373
RAC - September 2012
TOTAL YEAR
18
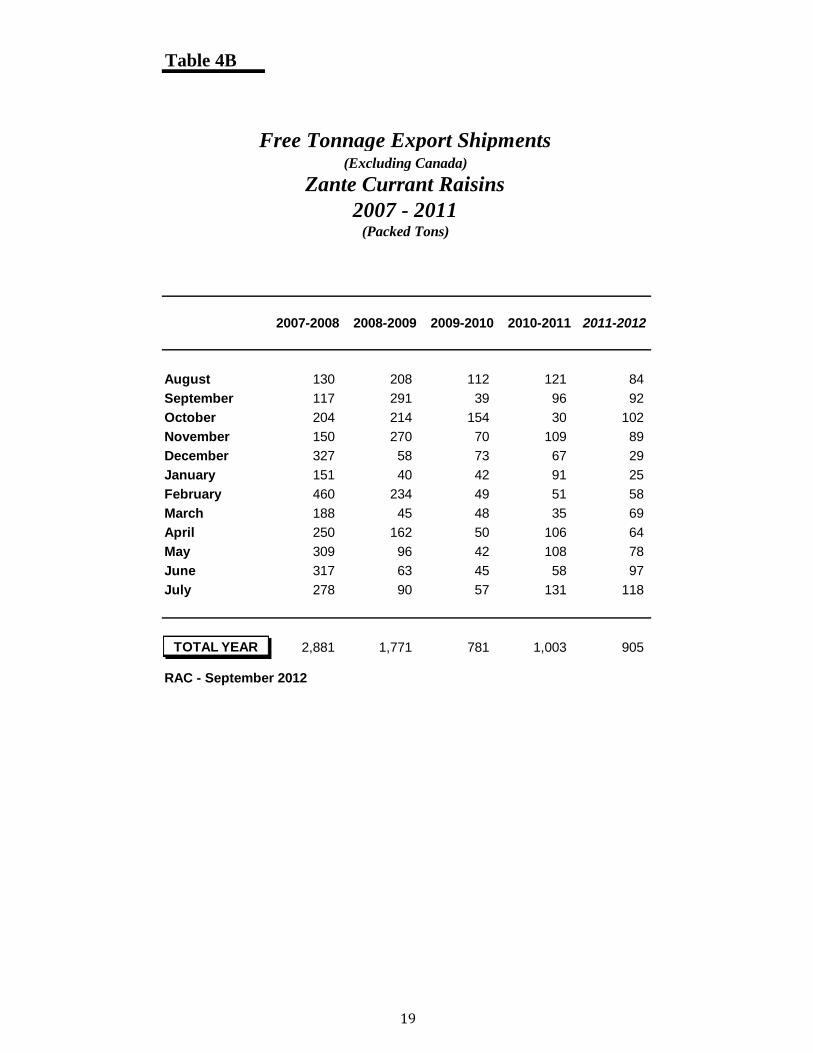
Table 4B
Free Tonnage Export Shipments(Excluding Canada)
Zante Currant Raisins2007 - 2011
(Packed Tons)
2007-2008 2008-2009 2009-2010 2010-2011 2011-2012
August 130 208 112 121 84September 117 291 39 96 92October 204 214 154 30 102November 150 270 70 109 89December 327 58 73 67 29January 151 40 42 91 25February 460 234 49 51 58March 188 45 48 35 69April 250 162 50 106 64May 309 96 42 108 78June 317 63 45 58 97July 278 90 57 131 118
2,881 1,771 781 1,003 905
RAC - September 2012
TOTAL YEAR
19
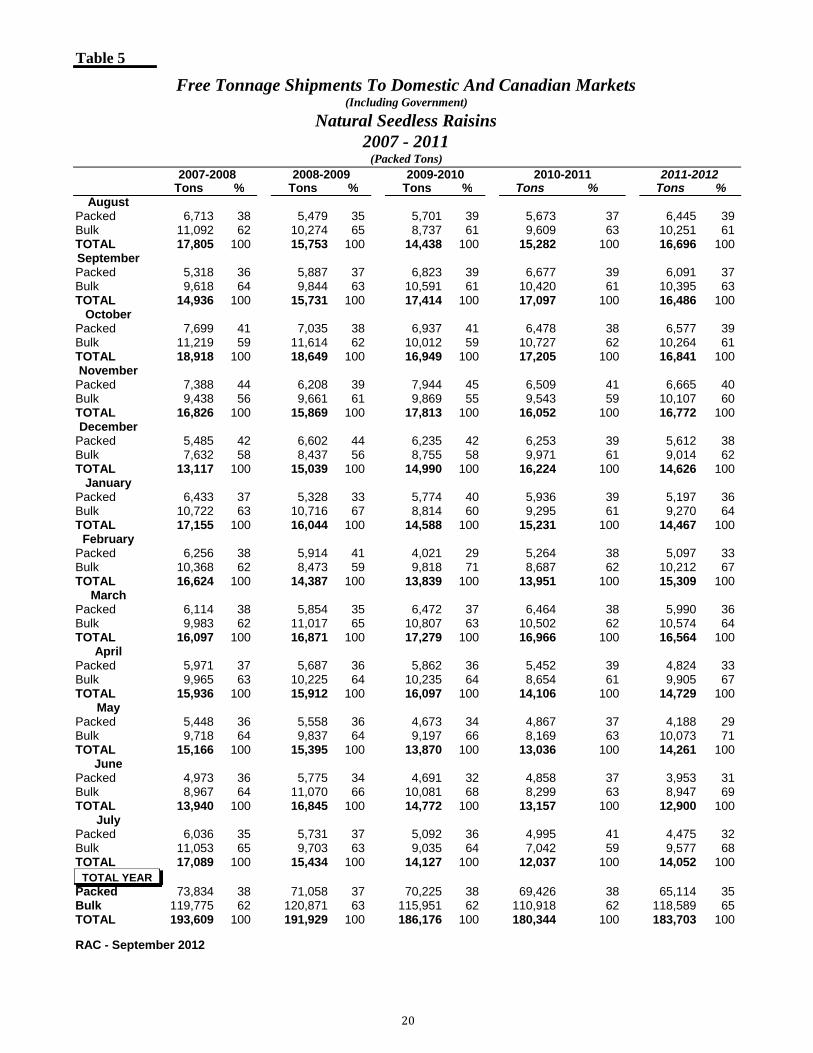
Table 5
Free Tonnage Shipments To Domestic And Canadian Markets(Including Government)
Natural Seedless Raisins2007 - 2011
(Packed Tons)2007-2008 2008-2009 2009-2010 2010-2011 2011-2012
Tons % Tons % Tons % Tons % Tons %August
Packed 6,713 38 5,479 35 5,701 39 5,673 37 6,445 39Bulk 11,092 62 10,274 65 8,737 61 9,609 63 10,251 61TOTAL 17,805 100 15,753 100 14,438 100 15,282 100 16,696 100SeptemberPacked 5,318 36 5,887 37 6,823 39 6,677 39 6,091 37Bulk 9,618 64 9,844 63 10,591 61 10,420 61 10,395 63TOTAL 14,936 100 15,731 100 17,414 100 17,097 100 16,486 100
OctoberPacked 7,699 41 7,035 38 6,937 41 6,478 38 6,577 39Bulk 11,219 59 11,614 62 10,012 59 10,727 62 10,264 61TOTAL 18,918 100 18,649 100 16,949 100 17,205 100 16,841 100November
Packed 7,388 44 6,208 39 7,944 45 6,509 41 6,665 40Bulk 9,438 56 9,661 61 9,869 55 9,543 59 10,107 60TOTAL 16,826 100 15,869 100 17,813 100 16,052 100 16,772 100December
Packed 5,485 42 6,602 44 6,235 42 6,253 39 5,612 38Bulk 7,632 58 8,437 56 8,755 58 9,971 61 9,014 62TOTAL 13,117 100 15,039 100 14,990 100 16,224 100 14,626 100
JanuaryPacked 6,433 37 5,328 33 5,774 40 5,936 39 5,197 36Bulk 10,722 63 10,716 67 8,814 60 9,295 61 9,270 64TOTAL 17,155 100 16,044 100 14,588 100 15,231 100 14,467 100
FebruaryFebruaryPacked 6,256 38 5,914 41 4,021 29 5,264 38 5,097 33Bulk 10,368 62 8,473 59 9,818 71 8,687 62 10,212 67TOTAL 16,624 100 14,387 100 13,839 100 13,951 100 15,309 100
MarchPacked 6,114 38 5,854 35 6,472 37 6,464 38 5,990 36Bulk 9,983 62 11,017 65 10,807 63 10,502 62 10,574 64TOTAL 16,097 100 16,871 100 17,279 100 16,966 100 16,564 100
AprilPacked 5,971 37 5,687 36 5,862 36 5,452 39 4,824 33Bulk 9,965 63 10,225 64 10,235 64 8,654 61 9,905 67TOTAL 15,936 100 15,912 100 16,097 100 14,106 100 14,729 100
MayPacked 5,448 36 5,558 36 4,673 34 4,867 37 4,188 29Bulk 9,718 64 9,837 64 9,197 66 8,169 63 10,073 71TOTAL 15,166 100 15,395 100 13,870 100 13,036 100 14,261 100
JunePacked 4,973 36 5,775 34 4,691 32 4,858 37 3,953 31Bulk 8,967 64 11,070 66 10,081 68 8,299 63 8,947 69TOTAL 13,940 100 16,845 100 14,772 100 13,157 100 12,900 100
JulyPacked 6,036 35 5,731 37 5,092 36 4,995 41 4,475 32Bulk 11,053 65 9,703 63 9,035 64 7,042 59 9,577 68TOTAL 17,089 100 15,434 100 14,127 100 12,037 100 14,052 100
Packed 73,834 38 71,058 37 70,225 38 69,426 38 65,114 35Bulk 119,775 62 120,871 63 115,951 62 110,918 62 118,589 65TOTAL 193,609 100 191,929 100 186,176 100 180,344 100 183,703 100
RAC - September 2012
TOTAL YEAR
20
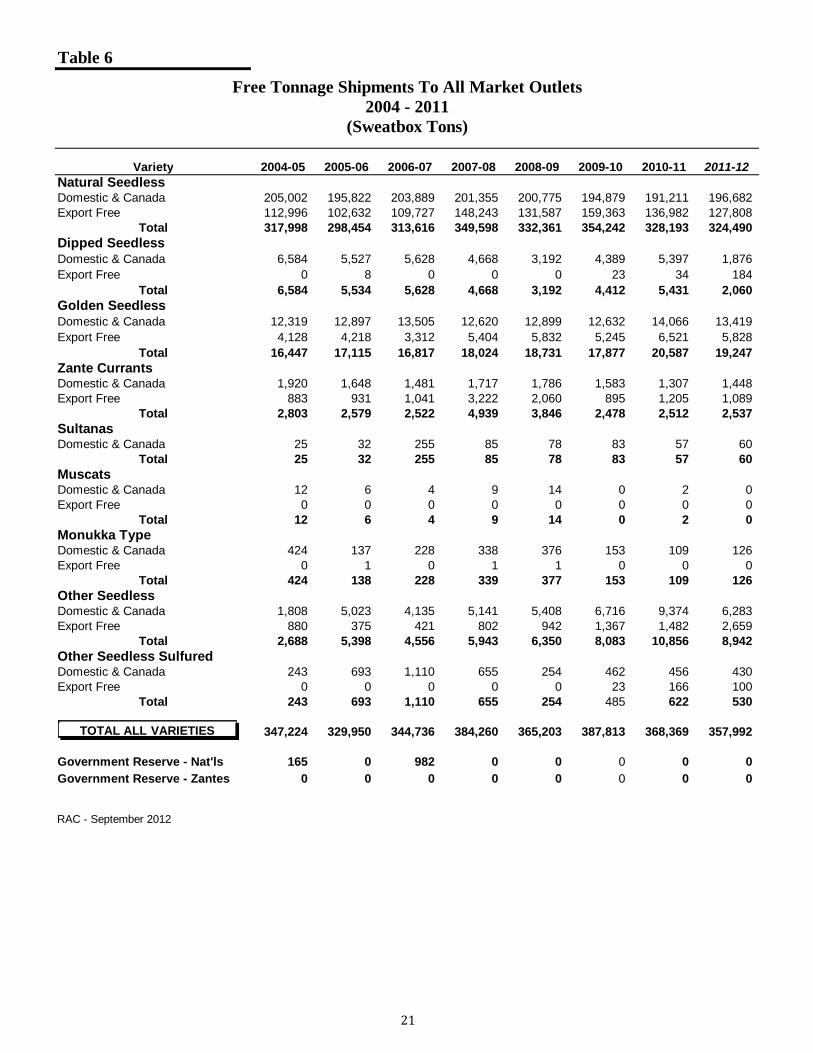
Table 6
Free Tonnage Shipments To All Market Outlets2004 - 2011
(Sweatbox Tons)
Variety 2004-05 2005-06 2006-07 2007-08 2008-09 2009-10 2010-11 2011-12Natural SeedlessDomestic & Canada 205,002 195,822 203,889 201,355 200,775 194,879 191,211 196,682Export Free 112,996 102,632 109,727 148,243 131,587 159,363 136,982 127,808
Total 317,998 298,454 313,616 349,598 332,361 354,242 328,193 324,490Dipped SeedlessDomestic & Canada 6,584 5,527 5,628 4,668 3,192 4,389 5,397 1,876Export Free 0 8 0 0 0 23 34 184
Total 6,584 5,534 5,628 4,668 3,192 4,412 5,431 2,060Golden SeedlessDomestic & Canada 12,319 12,897 13,505 12,620 12,899 12,632 14,066 13,419Export Free 4,128 4,218 3,312 5,404 5,832 5,245 6,521 5,828
Total 16,447 17,115 16,817 18,024 18,731 17,877 20,587 19,247Zante CurrantsDomestic & Canada 1,920 1,648 1,481 1,717 1,786 1,583 1,307 1,448Export Free 883 931 1,041 3,222 2,060 895 1,205 1,089
Total 2,803 2,579 2,522 4,939 3,846 2,478 2,512 2,537SultanasDomestic & Canada 25 32 255 85 78 83 57 60
Total 25 32 255 85 78 83 57 60MuscatsDomestic & Canada 12 6 4 9 14 0 2 0Export Free 0 0 0 0 0 0 0 0
Total 12 6 4 9 14 0 2 0Monukka TypeDomestic & Canada 424 137 228 338 376 153 109 126Export Free 0 1 0 1 1 0 0 0
Total 424 138 228 339 377 153 109 126Other Seedless Domestic & Canada 1,808 5,023 4,135 5,141 5,408 6,716 9,374 6,283Export Free 880 375 421 802 942 1,367 1,482 2,659
Total 2,688 5,398 4,556 5,943 6,350 8,083 10,856 8,942Other Seedless SulfuredDomestic & Canada 243 693 1,110 655 254 462 456 430Export Free 0 0 0 0 0 23 166 100
Total 243 693 1,110 655 254 485 622 530
347,224 329,950 344,736 384,260 365,203 387,813 368,369 357,992
Government Reserve - Nat'ls 165 0 982 0 0 0 0 0Government Reserve - Zantes 0 0 0 0 0 0 0 0
RAC - September 2012
TOTAL ALL VARIETIES
21
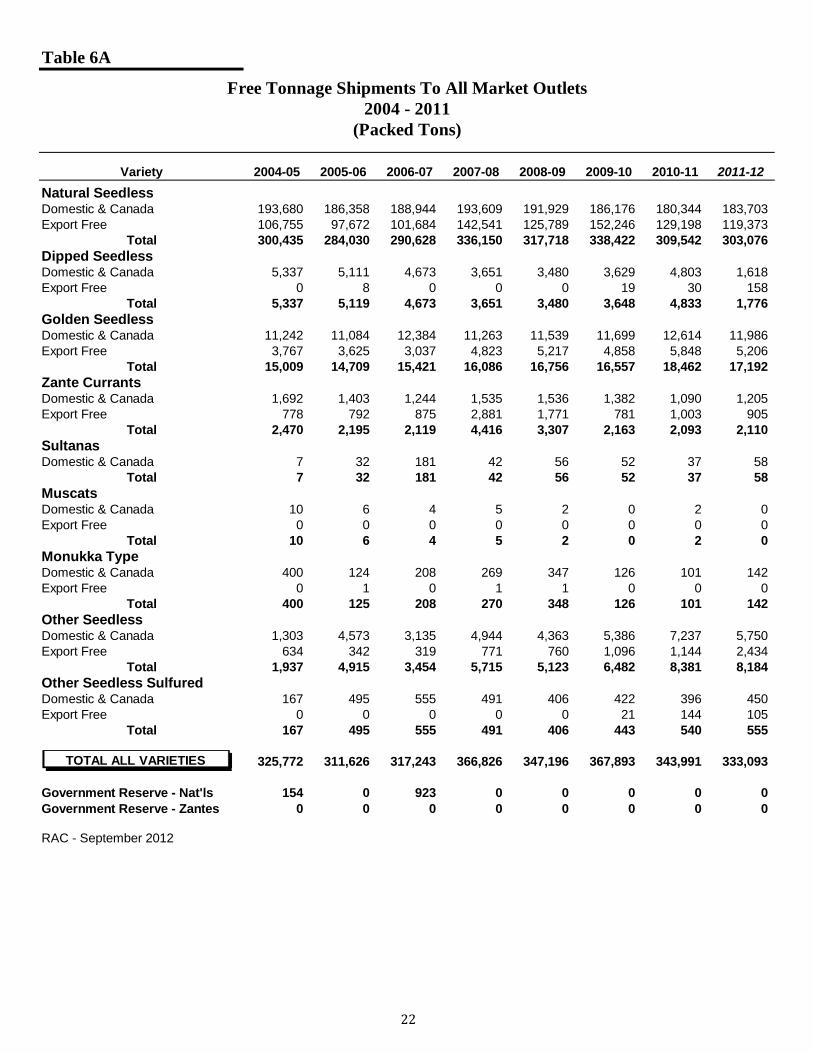
Table 6A
Free Tonnage Shipments To All Market Outlets2004 - 2011
(Packed Tons)
Variety 2004-05 2005-06 2006-07 2007-08 2008-09 2009-10 2010-11 2011-12Natural SeedlessDomestic & Canada 193,680 186,358 188,944 193,609 191,929 186,176 180,344 183,703Export Free 106,755 97,672 101,684 142,541 125,789 152,246 129,198 119,373
Total 300,435 284,030 290,628 336,150 317,718 338,422 309,542 303,076Dipped SeedlessDomestic & Canada 5,337 5,111 4,673 3,651 3,480 3,629 4,803 1,618Export Free 0 8 0 0 0 19 30 158
Total 5,337 5,119 4,673 3,651 3,480 3,648 4,833 1,776Golden SeedlessDomestic & Canada 11,242 11,084 12,384 11,263 11,539 11,699 12,614 11,986Export Free 3,767 3,625 3,037 4,823 5,217 4,858 5,848 5,206
Total 15,009 14,709 15,421 16,086 16,756 16,557 18,462 17,192Zante CurrantsDomestic & Canada 1,692 1,403 1,244 1,535 1,536 1,382 1,090 1,205Export Free 778 792 875 2,881 1,771 781 1,003 905
Total 2,470 2,195 2,119 4,416 3,307 2,163 2,093 2,110SultanasDomestic & Canada 7 32 181 42 56 52 37 58
Total 7 32 181 42 56 52 37 58MuscatsDomestic & Canada 10 6 4 5 2 0 2 0Export Free 0 0 0 0 0 0 0 0
Total 10 6 4 5 2 0 2 0Monukka TypeDomestic & Canada 400 124 208 269 347 126 101 142Export Free 0 1 0 1 1 0 0 0
Total 400 125 208 270 348 126 101 142Other Seedless Domestic & Canada 1,303 4,573 3,135 4,944 4,363 5,386 7,237 5,750Export Free 634 342 319 771 760 1,096 1,144 2,434
Total 1,937 4,915 3,454 5,715 5,123 6,482 8,381 8,184Other Seedless SulfuredDomestic & Canada 167 495 555 491 406 422 396 450Export Free 0 0 0 0 0 21 144 105
Total 167 495 555 491 406 443 540 555
325,772 311,626 317,243 366,826 347,196 367,893 343,991 333,093
Government Reserve - Nat'ls 154 0 923 0 0 0 0 0Government Reserve - Zantes 0 0 0 0 0 0 0 0
RAC - September 2012
TOTAL ALL VARIETIES
22
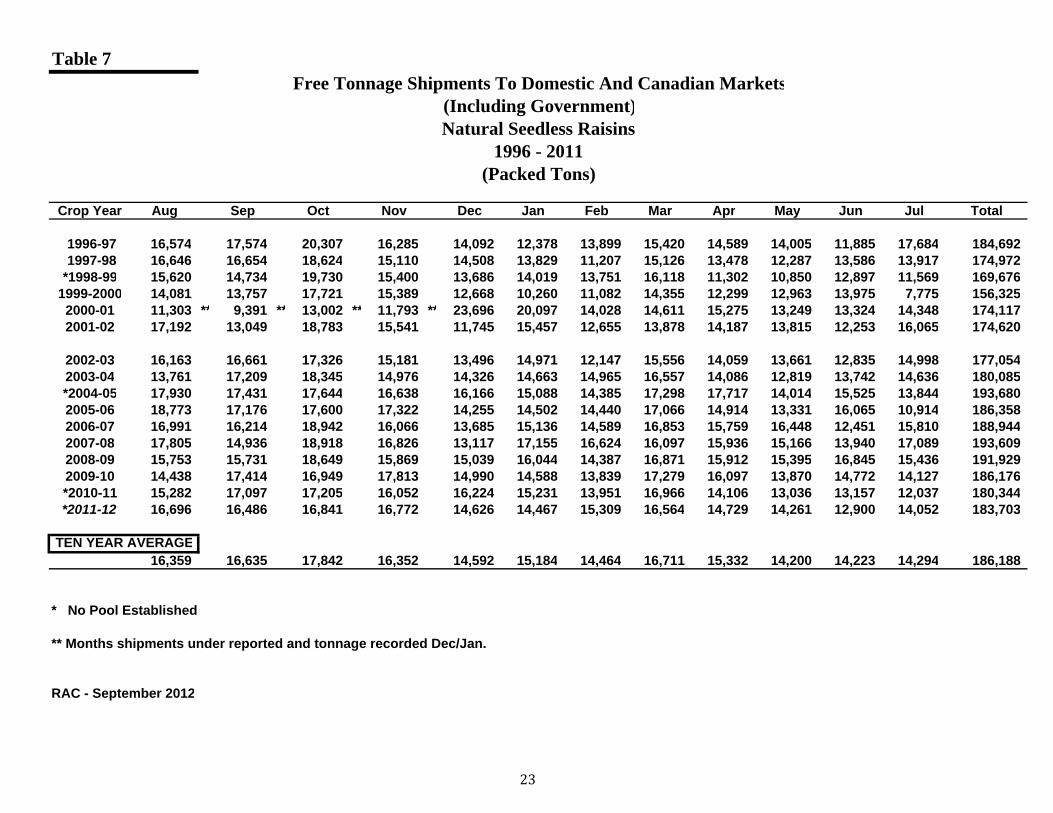
Table 7Free Tonnage Shipments To Domestic And Canadian Markets
(Including Government)Natural Seedless Raisins
1996 - 2011(Packed Tons)
Crop Year Aug Sep Oct Nov Dec Jan Feb Mar Apr May Jun Jul Total
1996-97 16,574 17,574 20,307 16,285 14,092 12,378 13,899 15,420 14,589 14,005 11,885 17,684 184,692 1997-98 16,646 16,654 18,624 15,110 14,508 13,829 11,207 15,126 13,478 12,287 13,586 13,917 174,972*1998-99 15,620 14,734 19,730 15,400 13,686 14,019 13,751 16,118 11,302 10,850 12,897 11,569 169,676
1999-2000 14,081 13,757 17,721 15,389 12,668 10,260 11,082 14,355 12,299 12,963 13,975 7,775 156,3252000-01 11,303 ** 9,391 ** 13,002 ** 11,793 ** 23,696 20,097 14,028 14,611 15,275 13,249 13,324 14,348 174,1172001-02 17,192 13,049 18,783 15,541 11,745 15,457 12,655 13,878 14,187 13,815 12,253 16,065 174,620
2002-03 16,163 16,661 17,326 15,181 13,496 14,971 12,147 15,556 14,059 13,661 12,835 14,998 177,0542003-04 13,761 17,209 18,345 14,976 14,326 14,663 14,965 16,557 14,086 12,819 13,742 14,636 180,085*2004-05 17,930 17,431 17,644 16,638 16,166 15,088 14,385 17,298 17,717 14,014 15,525 13,844 193,6802005-06 18,773 17,176 17,600 17,322 14,255 14,502 14,440 17,066 14,914 13,331 16,065 10,914 186,3582006-07 16,991 16,214 18,942 16,066 13,685 15,136 14,589 16,853 15,759 16,448 12,451 15,810 188,9442007-08 17,805 14,936 18,918 16,826 13,117 17,155 16,624 16,097 15,936 15,166 13,940 17,089 193,6092008-09 15,753 15,731 18,649 15,869 15,039 16,044 14,387 16,871 15,912 15,395 16,845 15,436 191,9292009-10 14,438 17,414 16,949 17,813 14,990 14,588 13,839 17,279 16,097 13,870 14,772 14,127 186,176*2010-11 15,282 17,097 17,205 16,052 16,224 15,231 13,951 16,966 14,106 13,036 13,157 12,037 180,344*2011-12 16,696 16,486 16,841 16,772 14,626 14,467 15,309 16,564 14,729 14,261 12,900 14,052 183,703
16,359 16,635 17,842 16,352 14,592 15,184 14,464 16,711 15,332 14,200 14,223 14,294 186,188
* No Pool Established
** Months shipments under reported and tonnage recorded Dec/Jan.
RAC - September 2012
TEN YEAR AVERAGE
23
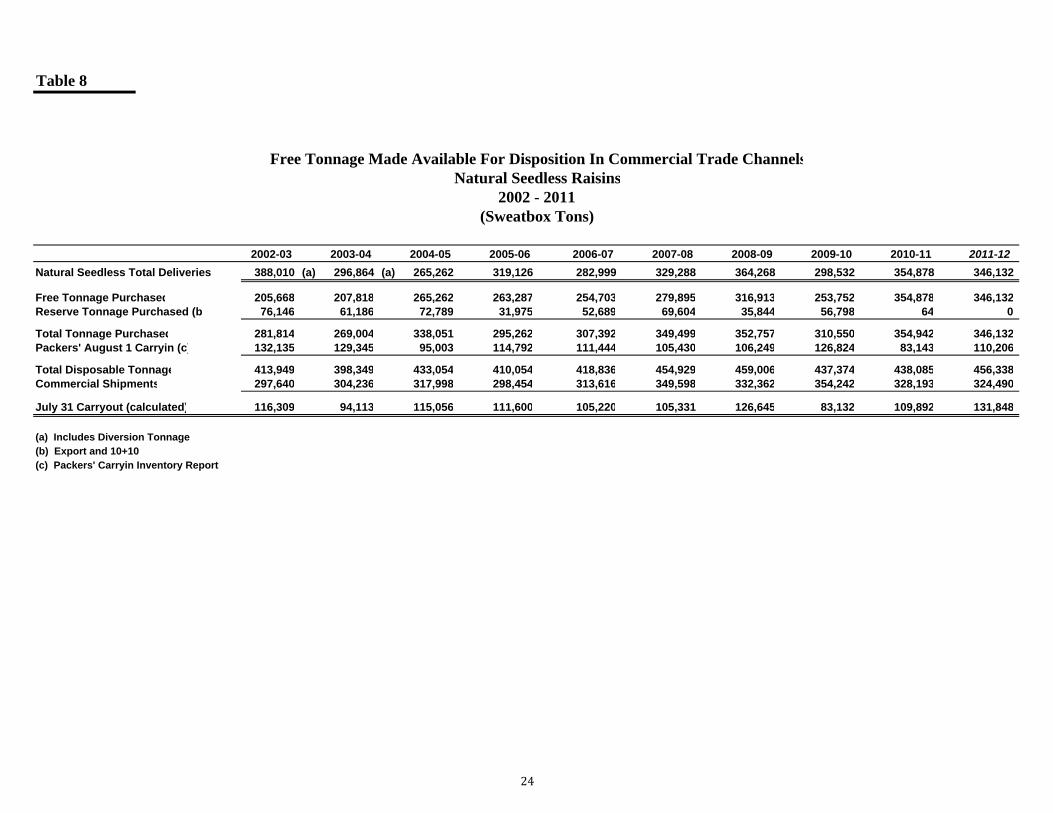
Table 8
Free Tonnage Made Available For Disposition In Commercial Trade ChannelsNatural Seedless Raisins
2002 - 2011(Sweatbox Tons)
2002-03 2003-04 2004-05 2005-06 2006-07 2007-08 2008-09 2009-10 2010-11 2011-12Natural Seedless Total Deliveries 388,010 (a) 296,864 (a) 265,262 319,126 282,999 329,288 364,268 298,532 354,878 346,132
Free Tonnage Purchased 205,668 207,818 265,262 263,287 254,703 279,895 316,913 253,752 354,878 346,132Reserve Tonnage Purchased (b 76,146 61,186 72,789 31,975 52,689 69,604 35,844 56,798 64 0
Total Tonnage Purchased 281,814 269,004 338,051 295,262 307,392 349,499 352,757 310,550 354,942 346,132Packers' August 1 Carryin (c) 132,135 129,345 95,003 114,792 111,444 105,430 106,249 126,824 83,143 110,206
Total Disposable Tonnage 413,949 398,349 433,054 410,054 418,836 454,929 459,006 437,374 438,085 456,338Commercial Shipments 297,640 304,236 317,998 298,454 313,616 349,598 332,362 354,242 328,193 324,490
July 31 Carryout (calculated) 116,309 94,113 115,056 111,600 105,220 105,331 126,645 83,132 109,892 131,848
(a) Includes Diversion Tonnage(b) Export and 10+10(c) Packers' Carryin Inventory Report
24
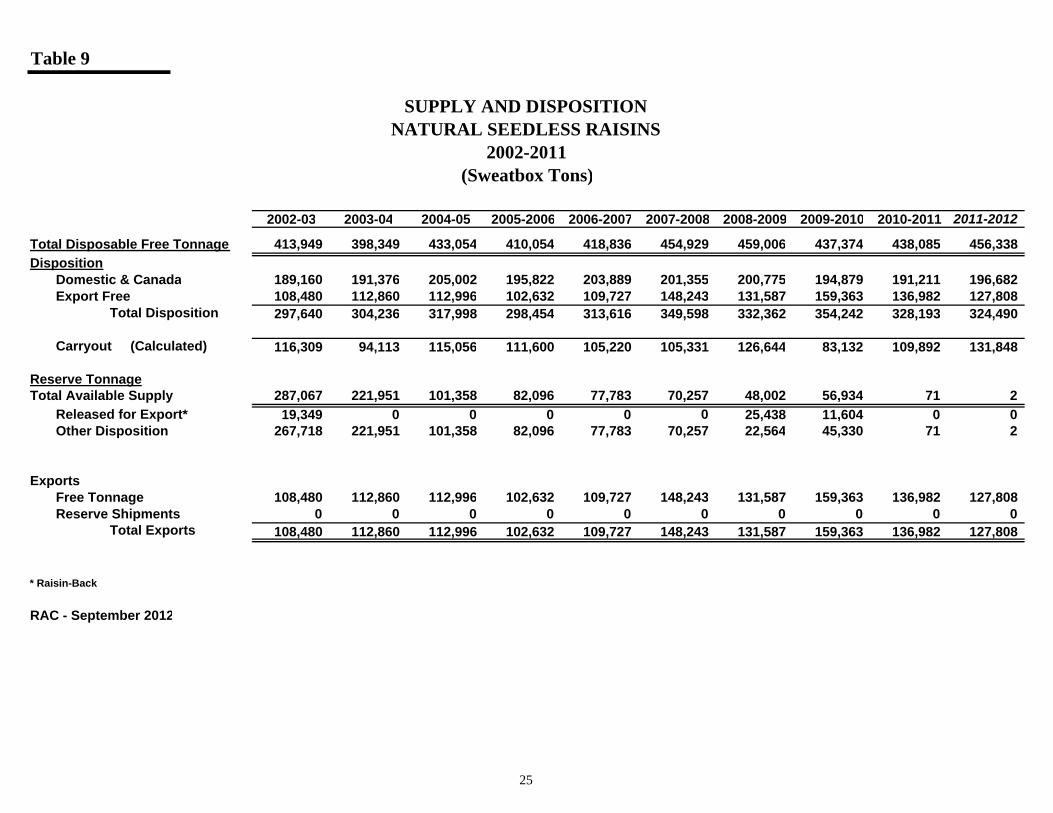
Table 9
SUPPLY AND DISPOSITIONNATURAL SEEDLESS RAISINS
2002-2011(Sweatbox Tons)
2002-03 2003-04 2004-05 2005-2006 2006-2007 2007-2008 2008-2009 2009-2010 2010-2011 2011-2012
Total Disposable Free Tonnage 413,949 398,349 433,054 410,054 418,836 454,929 459,006 437,374 438,085 456,338Disposition
Domestic & Canada 189,160 191,376 205,002 195,822 203,889 201,355 200,775 194,879 191,211 196,682Export Free 108,480 112,860 112,996 102,632 109,727 148,243 131,587 159,363 136,982 127,808
Total Disposition 297,640 304,236 317,998 298,454 313,616 349,598 332,362 354,242 328,193 324,490
Carryout (Calculated) 116,309 94,113 115,056 111,600 105,220 105,331 126,644 83,132 109,892 131,848
Reserve TonnageTotal Available Supply 287,067 221,951 101,358 82,096 77,783 70,257 48,002 56,934 71 2
Released for Export* 19,349 0 0 0 0 0 25,438 11,604 0 0Other Disposition 267,718 221,951 101,358 82,096 77,783 70,257 22,564 45,330 71 2
ExportsFree Tonnage 108,480 112,860 112,996 102,632 109,727 148,243 131,587 159,363 136,982 127,808Reserve Shipments 0 0 0 0 0 0 0 0 0 0
Total Exports 108,480 112,860 112,996 102,632 109,727 148,243 131,587 159,363 136,982 127,808
* Raisin-Back
RAC - September 2012
25
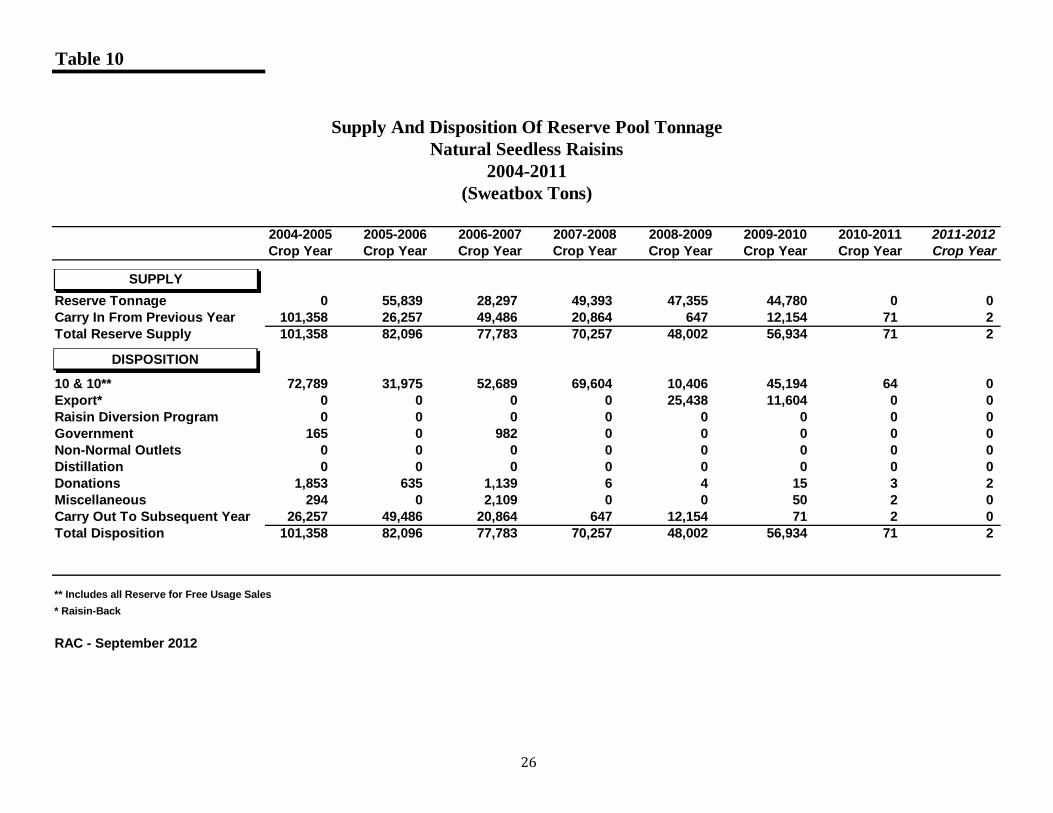
Table 10
Supply And Disposition Of Reserve Pool TonnageNatural Seedless Raisins
2004-2011(Sweatbox Tons)
2004-2005 2005-2006 2006-2007 2007-2008 2008-2009 2009-2010 2010-2011 2011-2012Crop Year Crop Year Crop Year Crop Year Crop Year Crop Year Crop Year Crop Year
Reserve Tonnage 0 55,839 28,297 49,393 47,355 44,780 0 0Carry In From Previous Year 101,358 26,257 49,486 20,864 647 12,154 71 2Total Reserve Supply 101,358 82,096 77,783 70,257 48,002 56,934 71 2
10 & 10** 72,789 31,975 52,689 69,604 10,406 45,194 64 0Export* 0 0 0 0 25,438 11,604 0 0Raisin Diversion Program 0 0 0 0 0 0 0 0Government 165 0 982 0 0 0 0 0Non-Normal Outlets 0 0 0 0 0 0 0 0Distillation 0 0 0 0 0 0 0 0Donations 1,853 635 1,139 6 4 15 3 2Miscellaneous 294 0 2,109 0 0 50 2 0Carry Out To Subsequent Year 26,257 49,486 20,864 647 12,154 71 2 0Total Disposition 101,358 82,096 77,783 70,257 48,002 56,934 71 2
** Includes all Reserve for Free Usage Sales* Raisin-Back
RAC - September 2012
SUPPLY
DISPOSITION
26
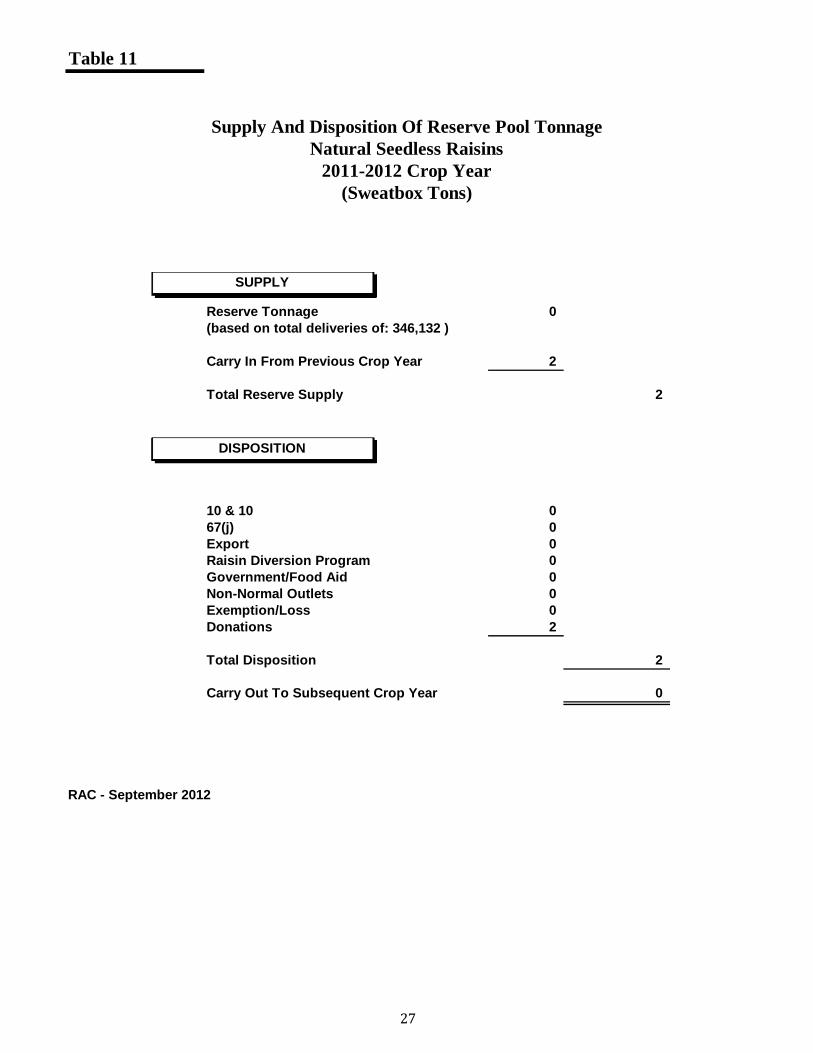
Table 11
Reserve Tonnage 0(based on total deliveries of: 346,132 )
Carry In From Previous Crop Year 2
Total Reserve Supply 2
10 & 10 067(j) 0Export 0Raisin Diversion Program 0Government/Food Aid 0Non-Normal Outlets 0Exemption/Loss 0Donations 2
Total Disposition 2
Carry Out To Subsequent Crop Year 0
RAC - September 2012
Supply And Disposition Of Reserve Pool TonnageNatural Seedless Raisins
2011-2012 Crop Year(Sweatbox Tons)
SUPPLY
Total Reserve SupplyDISPOSITION
27
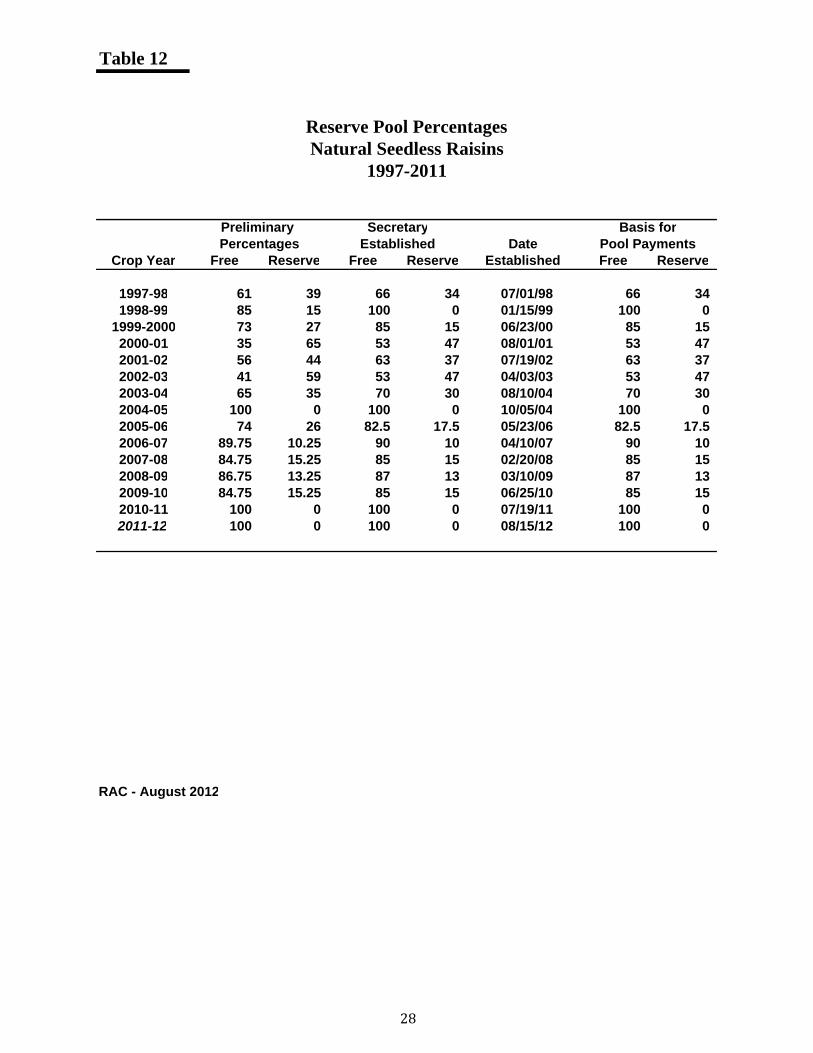
Table 12
Reserve Pool PercentagesNatural Seedless Raisins
1997-2011
Preliminary Secretary Basis forPercentages Established Date Pool Payments
Crop Year Free Reserve Free Reserve Established Free Reserve
1997-98 61 39 66 34 07/01/98 66 341998-99 85 15 100 0 01/15/99 100 0
1999-2000 73 27 85 15 06/23/00 85 152000-01 35 65 53 47 08/01/01 53 472001-02 56 44 63 37 07/19/02 63 372002-03 41 59 53 47 04/03/03 53 472003-04 65 35 70 30 08/10/04 70 302004-05 100 0 100 0 10/05/04 100 02005-06 74 26 82.5 17.5 05/23/06 82.5 17.52006-07 89.75 10.25 90 10 04/10/07 90 102007-08 84.75 15.25 85 15 02/20/08 85 152008-09 86.75 13.25 87 13 03/10/09 87 132009-10 84.75 15.25 85 15 06/25/10 85 152010-11 100 0 100 0 07/19/11 100 02011-12 100 0 100 0 08/15/12 100 0
RAC - August 2012
28
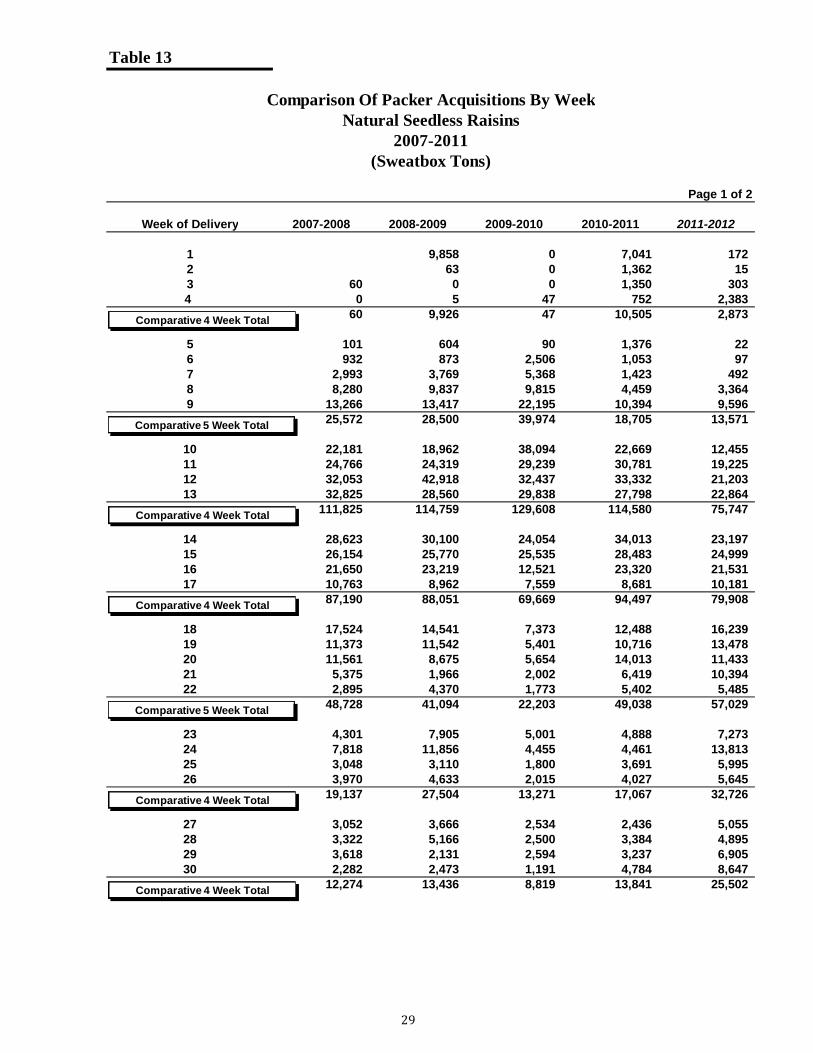
Table 13
Comparison Of Packer Acquisitions By WeekNatural Seedless Raisins
2007-2011(Sweatbox Tons)
Page 1 of 2
Week of Delivery 2007-2008 2008-2009 2009-2010 2010-2011 2011-2012
1 9,858 0 7,041 1722 63 0 1,362 153 60 0 0 1,350 3034 0 5 47 752 2,383
60 9,926 47 10,505 2,873
5 101 604 90 1,376 226 932 873 2,506 1,053 977 2,993 3,769 5,368 1,423 4928 8,280 9,837 9,815 4,459 3,3649 13,266 13,417 22,195 10,394 9,596
25,572 28,500 39,974 18,705 13,571
10 22,181 18,962 38,094 22,669 12,45511 24,766 24,319 29,239 30,781 19,22512 32,053 42,918 32,437 33,332 21,20313 32,825 28,560 29,838 27,798 22,864
111,825 114,759 129,608 114,580 75,747
14 28,623 30,100 24,054 34,013 23,19715 26,154 25,770 25,535 28,483 24,99916 21,650 23,219 12,521 23,320 21,53117 10,763 8,962 7,559 8,681 10,181
87,190 88,051 69,669 94,497 79,908
18 17,524 14,541 7,373 12,488 16,23919 11,373 11,542 5,401 10,716 13,47820 11,561 8,675 5,654 14,013 11,43321 5,375 1,966 2,002 6,419 10,39422 2,895 4,370 1,773 5,402 5,485
48,728 41,094 22,203 49,038 57,029
23 4,301 7,905 5,001 4,888 7,27324 7,818 11,856 4,455 4,461 13,81325 3,048 3,110 1,800 3,691 5,99526 3,970 4,633 2,015 4,027 5,645
19,137 27,504 13,271 17,067 32,726
27 3,052 3,666 2,534 2,436 5,05528 3,322 5,166 2,500 3,384 4,89529 3,618 2,131 2,594 3,237 6,90530 2,282 2,473 1,191 4,784 8,647
12,274 13,436 8,819 13,841 25,502
29
Comparative 5 Week Total
Comparative 4 Week Total
Comparative 4 Week Total
Comparative 4 Week Total
Comparative 4 Week Total
Comparative 4 Week Total
Comparative 5 Week Total
29
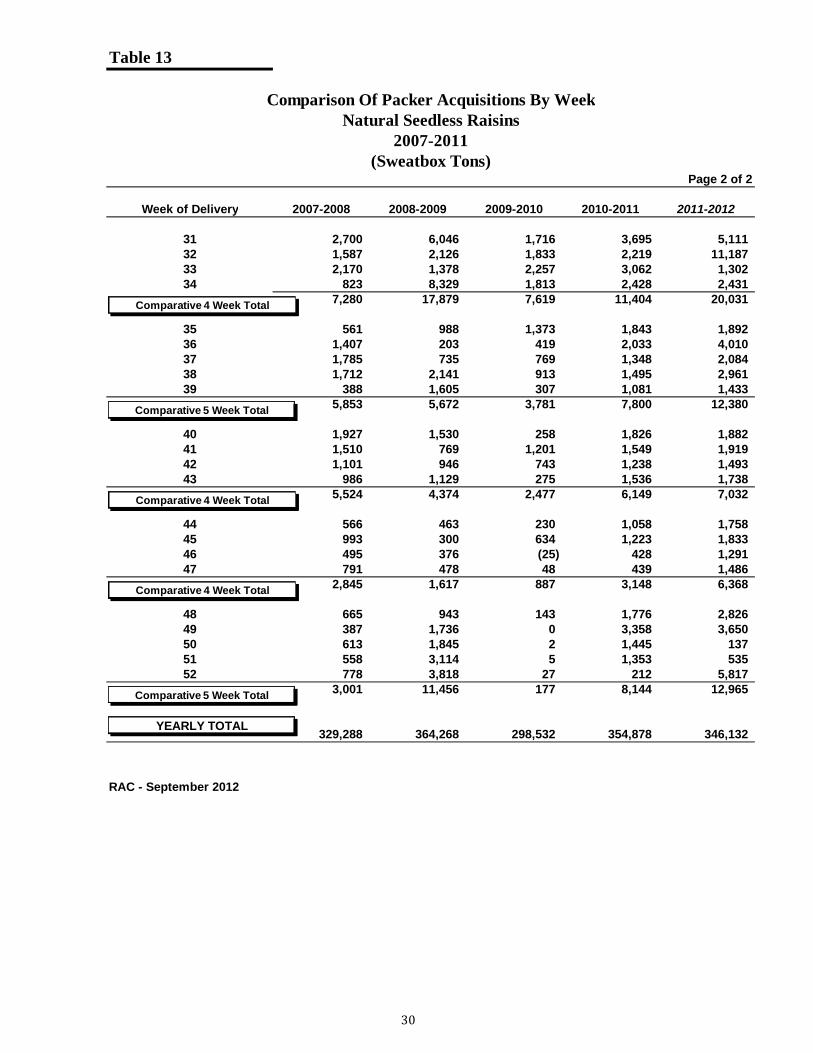
Table 13
Comparison Of Packer Acquisitions By WeekNatural Seedless Raisins
2007-2011(Sweatbox Tons)
Page 2 of 2
Week of Delivery 2007-2008 2008-2009 2009-2010 2010-2011 2011-2012
31 2,700 6,046 1,716 3,695 5,11132 1,587 2,126 1,833 2,219 11,18733 2,170 1,378 2,257 3,062 1,30234 823 8,329 1,813 2,428 2,431
7,280 17,879 7,619 11,404 20,031
35 561 988 1,373 1,843 1,89236 1,407 203 419 2,033 4,01037 1,785 735 769 1,348 2,08438 1,712 2,141 913 1,495 2,96139 388 1,605 307 1,081 1,433
5,853 5,672 3,781 7,800 12,380
40 1,927 1,530 258 1,826 1,88241 1,510 769 1,201 1,549 1,91942 1,101 946 743 1,238 1,49343 986 1,129 275 1,536 1,738
5,524 4,374 2,477 6,149 7,032
44 566 463 230 1,058 1,75845 993 300 634 1,223 1,83346 495 376 (25) 428 1,29147 791 478 48 439 1,486
2,845 1,617 887 3,148 6,368
48 665 943 143 1,776 2,82649 387 1,736 0 3,358 3,65050 613 1,845 2 1,445 13751 558 3,114 5 1,353 53552 778 3,818 27 212 5,817
3,001 11,456 177 8,144 12,965
329,288 364,268 298,532 354,878 346,132
RAC - September 2012
Comparative 4 Week Total
Comparative 4 Week Total
Comparative 4 Week Total
Comparative 5 Week Total
Comparative 5 Week Total
YEARLY TOTAL
30
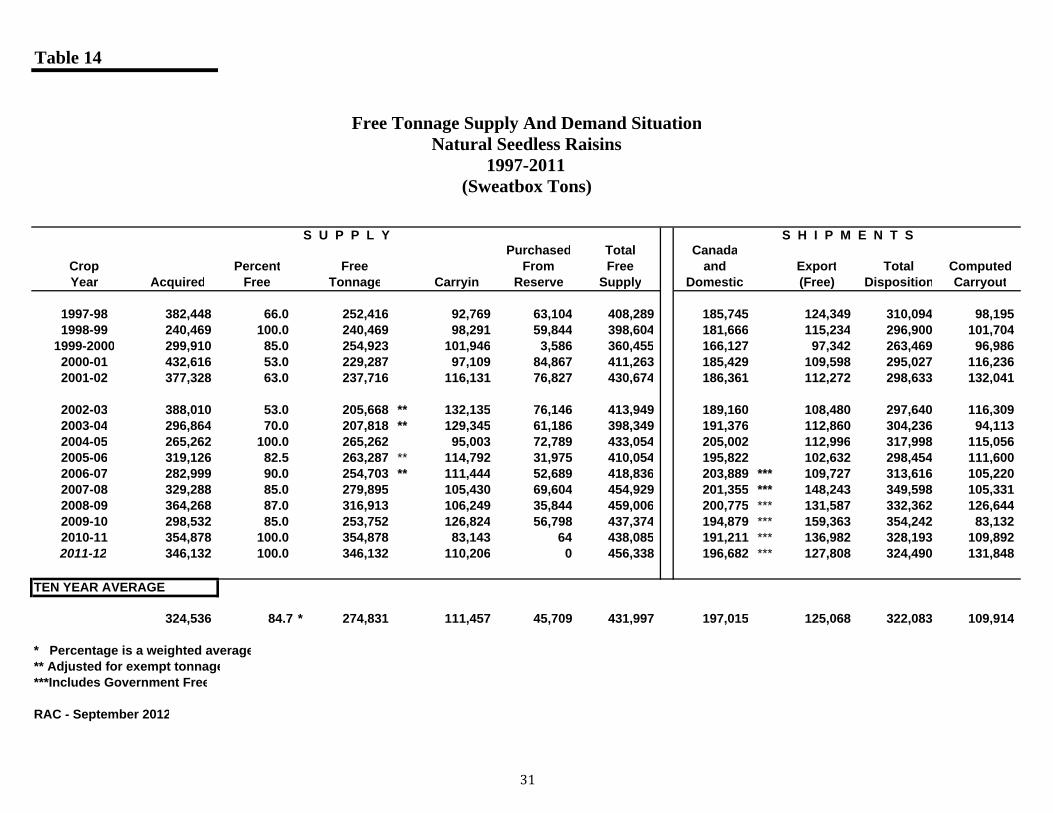
Table 14
Free Tonnage Supply And Demand SituationNatural Seedless Raisins
1997-2011(Sweatbox Tons)
S U P P L Y S H I P M E N T SPurchased Total Canada
Crop Percent Free From Free and Export Total ComputedYear Acquired Free Tonnage Carryin Reserve Supply Domestic (Free) Disposition Carryout
1997-98 382,448 66.0 252,416 92,769 63,104 408,289 185,745 124,349 310,094 98,1951998-99 240,469 100.0 240,469 98,291 59,844 398,604 181,666 115,234 296,900 101,704
1999-2000 299,910 85.0 254,923 101,946 3,586 360,455 166,127 97,342 263,469 96,9862000-01 432,616 53.0 229,287 97,109 84,867 411,263 185,429 109,598 295,027 116,2362001-02 377,328 63.0 237,716 116,131 76,827 430,674 186,361 112,272 298,633 132,041
2002-03 388,010 53.0 205,668 ** 132,135 76,146 413,949 189,160 108,480 297,640 116,3092003-04 296,864 70.0 207,818 ** 129,345 61,186 398,349 191,376 112,860 304,236 94,1132004-05 265,262 100.0 265,262 95,003 72,789 433,054 205,002 112,996 317,998 115,0562005-06 319,126 82.5 263,287 ** 114,792 31,975 410,054 195,822 102,632 298,454 111,6002006-07 282,999 90.0 254,703 ** 111,444 52,689 418,836 203,889 *** 109,727 313,616 105,2202007-08 329,288 85.0 279,895 105,430 69,604 454,929 201,355 *** 148,243 349,598 105,3312008-09 364,268 87.0 316,913 106,249 35,844 459,006 200,775 *** 131,587 332,362 126,6442009-10 298,532 85.0 253,752 126,824 56,798 437,374 194,879 *** 159,363 354,242 83,1322010-11 354,878 100.0 354,878 83,143 64 438,085 191,211 *** 136,982 328,193 109,8922011-12 346,132 100.0 346,132 110,206 0 456,338 196,682 *** 127,808 324,490 131,848
324,536 84.7 * 274,831 111,457 45,709 431,997 197,015 125,068 322,083 109,914
* Percentage is a weighted average** Adjusted for exempt tonnage***Includes Government Free
RAC - September 2012
TEN YEAR AVERAGE
31
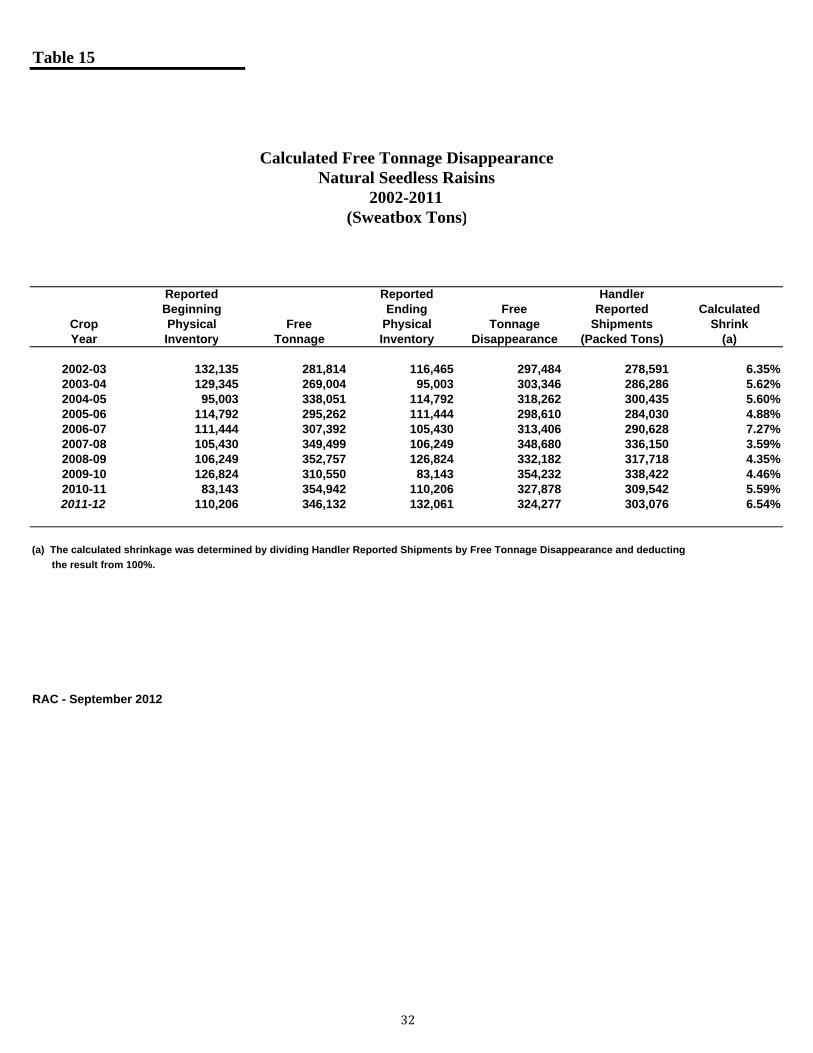
Table 15
Calculated Free Tonnage DisappearanceNatural Seedless Raisins
2002-2011(Sweatbox Tons)
Reported Reported HandlerBeginning Ending Free Reported Calculated
Crop Physical Free Physical Tonnage Shipments ShrinkYear Inventory Tonnage Inventory Disappearance (Packed Tons) (a)
2002-03 132,135 281,814 116,465 297,484 278,591 6.35%2003-04 129,345 269,004 95,003 303,346 286,286 5.62%2004-05 95,003 338,051 114,792 318,262 300,435 5.60%2005-06 114,792 295,262 111,444 298,610 284,030 4.88%2006-07 111,444 307,392 105,430 313,406 290,628 7.27%2007-08 105,430 349,499 106,249 348,680 336,150 3.59%2008-09 106,249 352,757 126,824 332,182 317,718 4.35%2009-10 126,824 310,550 83,143 354,232 338,422 4.46%2010-11 83,143 354,942 110,206 327,878 309,542 5.59%2011-12 110,206 346,132 132,061 324,277 303,076 6.54%
(a) The calculated shrinkage was determined by dividing Handler Reported Shipments by Free Tonnage Disappearance and deducting the result from 100%.
RAC - September 2012
32
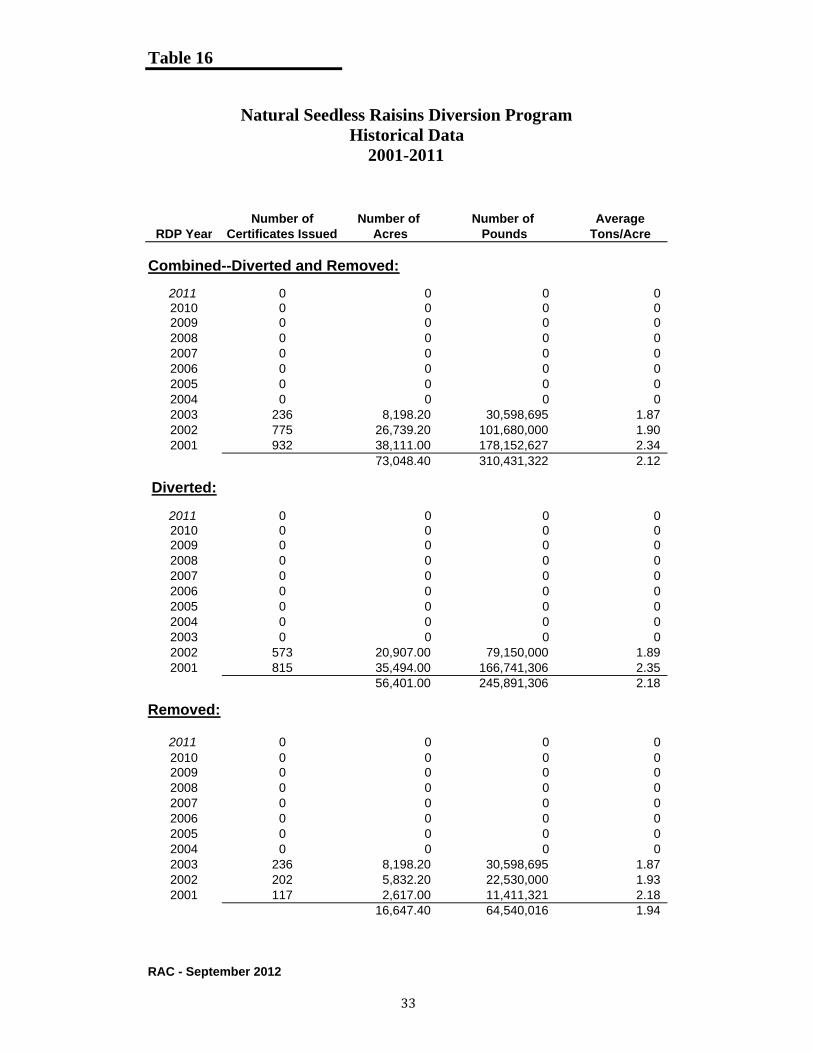
Table 16
Number of Number of Number of AverageRDP Year Certificates Issued Acres Pounds Tons/Acre
Combined--Diverted and Removed:
2011 0 0 0 02010 0 0 0 02009 0 0 0 02008 0 0 0 02007 0 0 0 02006 0 0 0 02005 0 0 0 02004 0 0 0 02003 236 8,198.20 30,598,695 1.872002 775 26,739.20 101,680,000 1.902001 932 38,111.00 178,152,627 2.34
73,048.40 310,431,322 2.12
Diverted:
2011 0 0 0 02010 0 0 0 02009 0 0 0 02008 0 0 0 02007 0 0 0 02006 0 0 0 02005 0 0 0 02004 0 0 0 02003 0 0 0 02002 573 20,907.00 79,150,000 1.892001 815 35,494.00 166,741,306 2.35
56,401.00 245,891,306 2.18
Removed:
2011 0 0 0 02010 0 0 0 02009 0 0 0 02008 0 0 0 02007 0 0 0 02006 0 0 0 02005 0 0 0 02004 0 0 0 02003 236 8,198.20 30,598,695 1.872002 202 5,832.20 22,530,000 1.932001 117 2,617.00 11,411,321 2.18
16,647.40 64,540,016 1.94
RAC - September 2012
Natural Seedless Raisins Diversion ProgramHistorical Data
2001-2011
33
34
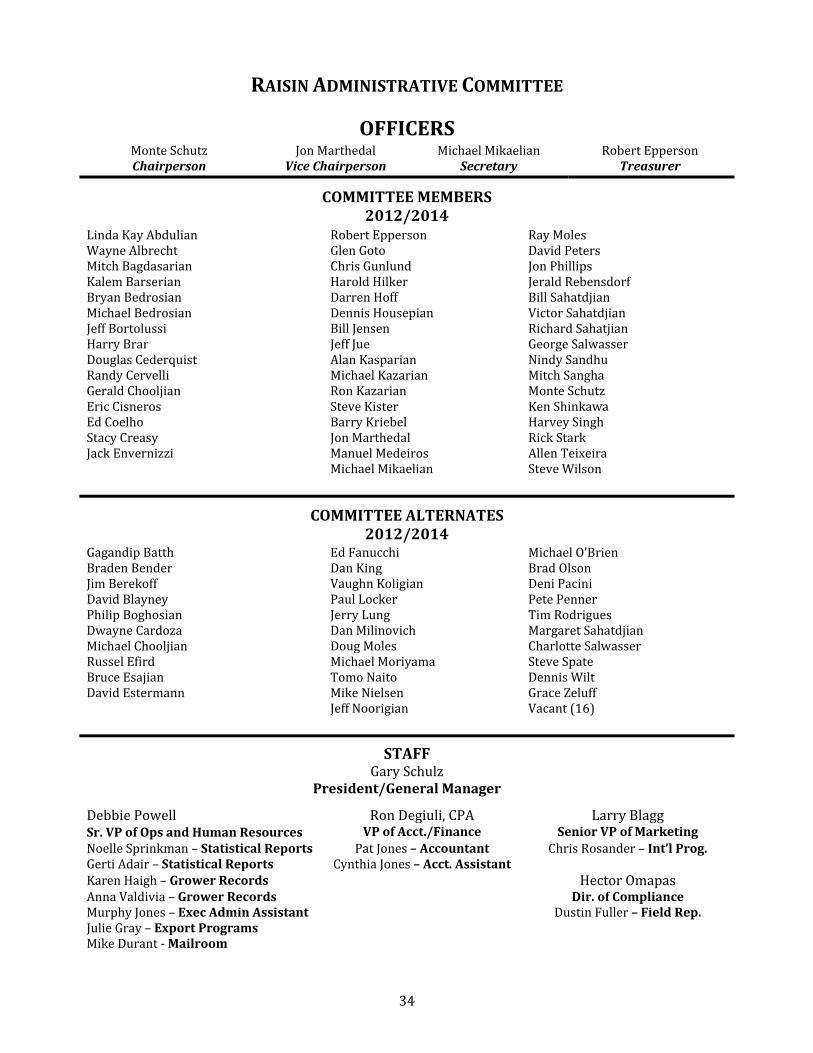
RAISINADMINISTRATIVECOMMITTEE
OFFICERSMonteSchutzChairperson
JonMarthedalViceChairperson
MichaelMikaelianSecretary
RobertEppersonTreasurer
COMMITTEEMEMBERS2012/2014
LindaKayAbdulianWayneAlbrechtMitchBagdasarianKalemBarserianBryanBedrosianMichaelBedrosianJeffBortolussiHarryBrarDouglasCederquistRandyCervelliGeraldChooljianEricCisnerosEdCoelhoStacyCreasyJackEnvernizzi
RobertEppersonGlenGotoChrisGunlundHaroldHilkerDarrenHoffDennisHousepianBillJensenJeffJueAlanKasparianMichaelKazarianRonKazarianSteveKisterBarryKriebelJonMarthedalManuelMedeirosMichaelMikaelian
RayMolesDavidPetersJonPhillipsJeraldRebensdorfBillSahatdjianVictorSahatdjianRichardSahatjianGeorgeSalwasserNindySandhuMitchSanghaMonteSchutzKenShinkawaHarveySinghRickStarkAllenTeixeiraSteveWilson
COMMITTEEALTERNATES2012/2014
GagandipBatthBradenBenderJimBerekoffDavidBlayneyPhilipBoghosianDwayneCardozaMichaelChooljianRusselEfirdBruceEsajianDavidEstermann
EdFanucchiDanKingVaughnKoligianPaulLockerJerryLungDanMilinovichDougMolesMichaelMoriyamaTomoNaitoMikeNielsenJeffNoorigian
MichaelO’BrienBradOlsonDeniPaciniPetePennerTimRodriguesMargaretSahatdjianCharlotteSalwasserSteveSpateDennisWiltGraceZeluffVacant(16)
STAFFGarySchulz
President/GeneralManager
DebbiePowell RonDegiuli,CPA LarryBlaggSr.VPofOpsandHumanResources VPofAcct./Finance SeniorVPofMarketingNoelleSprinkman–StatisticalReports PatJones – Accountant ChrisRosander–Int’lProg.GertiAdair–StatisticalReports CynthiaJones – Acct.Assistant KarenHaigh–GrowerRecords HectorOmapasAnnaValdivia–GrowerRecords Dir.ofComplianceMurphyJones–ExecAdminAssistant DustinFuller–FieldRep.JulieGray–ExportPrograms MikeDurant‐Mailroom
THE FOLLOWING PAGES ARE PROVIDED FOR
INFORMATIONAL PURPOSES ONLY
AND
ARE NOT THE OFFICIAL POLICY OF THE
RAISIN ADMINISTRATIVE COMMITTEE.
California Raisins Health and Nutrition Research Updated September 2012
36
Antioxidants 1. “A Randomized, Un-blinded, Single Research Site, Comparator Study of Raisins Versus Alternative Snacks on Cardiovascular Risk Factors In Generally Healthy Subjects” Harold Bays MD, FACP, FACE, FNLA This was a randomized, un-blinded, single research site, comparator study of raisins versus alternative snacks on cardiovascular risk factors in generally healthy subjects. Study participants were instructed to orally consume one prepackaged serving of raisins (90 kcal/serving), or one prepackaged comparator snack (100 kcal/serving) orally administered three times daily before breakfast, lunch, and dinner with 8 oz. of non-caloric fluid (preferably water) over 12 weeks. Hypothesis of this study was that routine raisin consumption over 12 weeks would improve cardiovascular risk factors compared to generally equal calorie alternative snacks. The objective of this study was to compare the effects of raisins three times per day versus alternative snacks three times per day on cardiovascular risk factors in generally healthy subjects. Primary objective/endpoints were change at week 12 for raisin versus control snacks regarding:
• Fasting plasma glucose levels • Plasma glucose levels 2 hours after administration of 75 g oral glucose • Body weight
Secondary objective/endpoints were change at week 12 for raisin versus control snacks regarding:
• Hemoglobin A1c • Blood pressure (systolic and diastolic) • Body mass index
Other endpoints included laboratory of special interest
• Potassium • Alanine aminotransferase (ALT) • Aspartate aminotransferase (AST) • Alkaline phosphatase (Alk Phos) • Fasting serum insulin (Insulin was not an apriori “endpoint of special interest” in the
protocol. It was added at time of study analysis due to its potential relevance to other measured metabolic parameters.)
Conclusion: Overall, this study supports regular consumption of raisins as reducing the important cardiovascular risk factors of postprandial plasma glucose and blood pressure, which may help account for the favorable effects of grapes (and thus potentially raisins) on possibly reducing the risk for cardiovascular disease.
California Raisins Health and Nutrition Research Updated September 2012
37
2. “Raisin Effects on Biomarkers of Coronary Heart Disease in Elderly Men and Women” Maria Luz Fernandez, PhD, University of Connecticut A randomized, controlled study with 17 men and women aged 50-70 years were involved in the study. They were encouraged to walk or to walk and eat 1 cup of raisins per day or just eat 1 cup of raisins per day. The intervention improved the lipid risk profile for all groups by resulting in a reduction in both total cholesterol and LDL-C. The authors suggested that the increase in fiber intake was a likely contributor to the reduction in LDL-C for RAISIN and RAISIN + WALK. The reduction in blood pressure for RAISIN and RAISIN + WALK may have resulted from antioxidant effects of the raisin polyphenols. In conclusion, risk factors for CVD were affected significantly by consuming raisins or increasing steps walked. Blood pressure, plasma total cholesterol and LDL-C were significantly decreased by all interventions, while walking lowered plasma TG. Raisins lowered the risk for inflammatory damage by decreasing one of the markers of inflammation associated with diabetes and coronary heart disease (tumor necrosis factor – alpha -TNF-α.). 3. “Raisins, Cyclo-oxygenase – 2 and Cancer Prevention” Andrew J. Dannenberg, M.D., NewYork-Presbyterian Hospital/ Weill Medical College of Cornell University, New York, NY. One of the antioxidant compounds in raisins and some other fruits and vegetables is catechin. When catechins were fed to tumor-prone mice by the noted cancer researcher Dr. Andrew Dannenberg and his colleagues, there was a 70 percent reduction in the number of tumors compared to control animals (not fed additional catechin). This type of study adds to the body of evidence linking phytochemical components of fruits and vegetables to reduction in the risk of colorectal cancer, colorectal adenomas and other gastrointestinal tumors. 4. “Antioxidant Capacity and Cholesterol Concentration in Human Subjects” Carl L. Keen, Ph.D., Professor and Chair, Department of Nutrition, University of California – Davis, Davis, California. Subjects eating raisins (4 servings) daily for 4 weeks increased the plasma antioxidant capacity. This in turn decreased the level of circulating oxidized low-density lipoprotein (LDL), so-called bad cholesterol, in subjects. High levels of LDL cholesterol are associated with increased cardiovascular disease. Oxidized LDL is especially problematic because the oxidized particles in the bloodstream are more likely to add to plaque on the artery wall. These data clearly show raisins are an important part of a diet that encourages 8 to 13 servings of fruit and vegetables loaded with important phytochemicals and antioxidants. 5. "Value of Raisins for Reduction of Oxidative Stress, Endothelial Dysfunction, and Inflammation in Obesity"
Janet Walberg Rankin, Ph.D., Professor in Human Nutrition, Foods, and Exercise, Virginia Tech., Blacksburg, Virginia.
California Raisins Health and Nutrition Research Updated September 2012
38
Research expert on oxidative stress and disease, Janet Walberg Rankin, studied the effect of raisins with their important antioxidant contribution on oxidative stress and inflammation in overweight subjects. It is well known that oxidative stress triggers an inflammatory response that increases disease risk. Together with graduate student Mary Whitlock, Dr. Rankin looked at whether the modest, easily accessible raisin can benefit obese individuals. They showed lowered levels of markers of inflammation, C-reactive peptide (CRP) and interleukin-6 (IL-6). These findings are important because those eating high fat meals or who are obese have elevated levels of CRP and IL-6. High levels of these components adversely affect proper blood vessel functioning. Thus, those with high oxidative stress tend to have blood vessels that do not appropriately dilate and relax. Foods, such as raisins, that are good sources of antioxidants, especially flavonoids and phenolics, can be helpful in fighting oxidation stress and improving blood vessel function. 6. “Raisin effects on in vitro demineralization of teeth” Clifton Carey, PhD, Director of Administration, American Dental Association – Paffenbarger Research Center Strong evidence exists that food particles retained on the teeth will lead to Demineralization of the tooth enamel and dental caries. (caries) (Kashket et al, 1996). This led to the idea that foods which are perceived as ‘sticky’ will be more cariogenic than non-sticky snack foods. Raisins have been perceived by the general public and by pediatric dentists as the ninth stickiest food out of a list of twenty-one popular snacks. Despite this, there is no evidence that raisins contribute to the demineralization of teeth. In fact measurement of food that is on the tooth 5 minutes after swallowing showed that foods that are less soluble in oral fluids are retained for longer times. Specifically, raisins although perceived as quite sticky, they are easily cleared from the oral cavity. These observations suggest that raisins may not contribute to tooth demineralization significantly because the sugars are removed from the dentition before the plaque mass has the opportunity to generate sufficient acid to lower the pH below 5.5. There is also research that shows that raisins contain compounds that inhibit the in vitro growth of S. mutans, thus making raisins less cariogenic than other foods. However, the in vitro research with 10% raisin juice showed that it had the potential to demineralize tooth enamel but that this was less than orange juice with its citric acid. 7. “Raisins as a Functional Food for Oral Health” Christine D. Wu, M.S., Ph.D., Professor, Department of Periodontics, University of Illinois, College of Dentistry, Chicago, Illinois. Raisins contain compounds including oleanolic acid that inhibit in vitro growth of Streptococcus mutans, one of the major bacteria in the mouth responsible for tooth decay. Oleanolic acid and other compounds in raisins also inhibit organisms associated with periodontal disease, including Porphyromonas gingivalis and Fusobacterium nucleatum. Oleanolic acid is effective in suppressing in vitro plaque formation by Streptococcus mutans. Prevention of plaque formation on the tooth surface is critical both for preventing tooth decay and promoting healthy gums.
California Raisins Health and Nutrition Research Updated September 2012
39
Food Preservation 8. “Phenolic Content, Antioxidant Activity and Antimicrobial Properties of Raisins in Food Systems” Luis Cisneros-Zevallos, Ph.D., Assistant Professor, Department of Horticultural Sciences, Texas A&M University, College Station, Texas. Raisins have a considerable concentration of phenolic compounds. This analysis showed that they were quinic and gallic acid, chlorogenic and caffeic acids, catechin, and epicatechin. Golden raisins have more of many of these compounds because the antioxidant effect of the sulfite used in golden raisins inhibits the loss of these compounds. Raisin juice extracts and concentrates also have significantly increased numbers of these compounds, so they have the potential to reduce the growth of harmful microorganisms and prevent browning of cut produce. According to studies conducted by Luis Cisneros-Zevallos and his team at Texas A&M, raisin extracts were shown to reduce the growth of known food pathogens such as Listeria monocytogenes and Escherichia coli 0157:H7 in a variety of model food systems. This has great importance to food safety and to the produce industry as a non-food additive solution to help extend the shelf life of food and reduce food-borne disease. 9. "Inhibition of Lipid Oxidation by Raisin Paste in Cooked Ground Meat" Daren Cornforth, Ph.D., Professor, Nutrition & Food Sciences, Utah State University, Logan, Utah. Raisins are recognized as a good source of dietary antioxidants. Adding raisin paste or extract to cooked ground beef or pork at just 1% to 2% of the weight improved its flavor after storage due to inhibition of rancidity by the antioxidants. Addition of the raisin extract to chicken at the same levels was also effective but did cause the meat to darken. In all cases the addition of the small amount of raisins did not affect the flavor of the meat. 10. “Evaluation of the Potential Anti-Microbial Properties of Raisins and Their Application in Food Safety and Preservation” Mark A. Daeschel, Ph.D., Professor, Food Microbiology and Safety, Oregon State University, Corvallis, Oregon. Pathogenic bacteria, including Escherichia coli 0157:H7, Staphylococcus aureus and Listeria monocytogenes, were inhibited in jerky systems containing 25% or 50% raisins. Raisins were shown to have the same preservative properties as sodium nitrite in meat systems. Raisins’ innate combination of antioxidants, sugar and acids were shown to be as effective as the sodium nitrite in inhibiting organisms that cause food- borne disease and in maintaining food safety. This is good news because producers of jerky, sausages, hot dogs and other cured meats may be able to reduce or eliminate the use of nitrite additives. Use of raisins to replace sodium nitrite in cured meats has many health benefits. First, the nitrite may form cancer-causing nitrosamines during digestion. Second, unlike the sodium nitrite, raisins
California Raisins Health and Nutrition Research Updated September 2012
40
add no sodium. This is important for those on sodium-restricted diets. Third, addition of raisins may improve the overall nutritional profile of cured meats, such as jerky, since the raisins provide antioxidants and make it possible to produce a palatable product that is lower in fat. Fiber 11. “Raisin Dietary Fiber: Composition and Characteristics” Mary Ellen Camire, Ph.D., Professor, Department of Food Science and Human Nutrition, University of Maine, Orono, Maine. Dietary fiber and other components may reduce the risk of heart disease and cancer by binding bile acids and causing their elimination from the body. Camire’s study confirms that eating fibrous foods, such as raisins, caused the elimination of bile acids. This in turn stimulates the body to replace the excreted bile acids using its own cholesterol, thus potentially lowering serum cholesterol and the risk of coronary heart disease. Furthermore, bile acids that are bound by fibers such as those in raisins will not be metabolized in the gut to a more toxic form that can cause harmful changes on the colonic wall, and this may potentially reduce cancer risk. 12. “Raisins as a Source of Inulin” Medallion Labs, Minneapolis, Minnesota. California raisins are a good source of inulin, a naturally occurring fiber-like carbohydrate that helps keep the colon healthy. Independent laboratory analysis by Medallion Labs, a laboratory known for their analytical work for nutrition labeling in the U.S., showed that a standard 1/4-cup serving of California raisins contains 1.5 grams of inulin. Recommended daily intake levels of inulin have yet to be established. However, inulin is one of the soluble fibers. Health benefits of inulin are the subject of active research and new functions are being documented. Some of these include its effects on cholesterol levels and gut health. Its role as a prebiotic has received much attention because prebiotics are important to support immune function both in the gut and in the body. 13. “Beneficial Effects of Raisins on Colonic Function with Possible Implications for the Prevention of Colon Cancer” Gene A. Spiller, Ph.D., Head, Sphera Foundation and Health Research Studies Center, Los Altos, California. The combination of dietary fiber and tartaric acid in sun-dried raisins plays an important role in colon function and health. The study was designed to test the hypothesis that eating 2 to 4 servings of raisins per day may improve colonic health. Research by Dr. Spiller found a positive correlation between consuming sun-dried raisins and a reduction in some colon cancer risk factors. For example, raisins increased fecal weight and caused material to move through the colon faster (called faster transit time). Increased transit time and increased fecal weight is important not only to have a properly functioning gastrointestinal tract and to reduce constipation and
California Raisins Health and Nutrition Research Updated September 2012
41
hemorrhoids, it also means that any toxic materials that might be in the diet or produced by metabolism in the gut will have little time to adversely affect the colon wall. Raisins reduced the alkalinity in the colon. Both the faster transit and lowered pH are associated with reduced colon cancer risk. The authors concluded that 2 servings of raisins per day caused moderate but beneficial changes in colon function. Nutrient Composition 14. “The Impact of Pre-exercise Snacks on Exercise Intensity, Stress, and Fatigue in Children” Debra R. Keast, PhD; Carol E. O’Neil, PhD, MPH, RD; Julie M. Jones, PhD, CNS, LN Objective: This study examined the association of dried fruit consumption with nutrient intake, diet quality, and anthropometric indicators of overweight/obesity. Design: Analyses of dietary and anthropometric data collected from adult (19+ years) participants (n=13,292) of the 1999-2004 National Health and Nutrition Examination Survey were conducted. Dried fruit consumers were defined as those consuming amounts ≥⅛ cup-equivalent fruit/day and identified using 24-hour recalls. Diet quality was measured using the Healthy Eating Index-2005 (HEI-2005). Covariate-adjusted means, standard errors, prevalence rates and odds ratios were determined to conduct statistical tests for differences between dried fruit consumers and non-consumers. Results: Seven percent of the population consumed dried fruit. Adult shortfall nutrients for which there were mean intake differences (p<0.01) between consumers and non-consumers were: fiber (+6.6 g/d), vitamin A (+173µg RAE/d), vitamin E (+1.5 mg AT/d), vitamin C (+20 mg/d), calcium (+103 mg/d), magnesium (+72 mg/d), and potassium (+432 mg/d). Dried fruit consumers had improved MyPyramid food intake, including lower SoFAAS intake, and a higher SoFAAS score (11.1±0.2 vs 8.2±0.1) than non-consumers. The total HEI-2005 score was significantly higher (p<0.01) in consumers (59.3±0.5) than non-consumers (49.4±0.3). Covariate-adjusted weight (78.2±0.6 kg vs 80.7±0.3 kg), body mass index (27.1±0.2 vs 28.1±0.2), and waist circumference (94.0±0.5 vs 96.5±0.2) were lower (p<0.01) in consumers than non-consumers, respectively. Conclusions: Dried fruit consumption was associated with improved nutrient intakes, a higher overall diet quality score, and lower body weight/adiposity measures.
California Raisins Health and Nutrition Research Updated September 2012
42
Glycemic Effects, Sustainable Energy and Healthy Snacks 15. “Effects of Carbohydrate Supplementation Form on Gastrointestinal Tolerance and Running Performance” Brandon Too, Sarah Cicai, Kali Hockett, Elizabeth Applegate, Brian A. Davis and Gretchen A. Casazza Purpose: We examined the effects of raisins and sport chews on running performance and gastrointestinal (GI) tolerance. Methods: This study recruited 11 competitive male (29.3 ± 2.4 yrs) endurance runners and triathletes to complete an 80-min sub-maximal (75% VO2peak) running bout followed immediately by a 5K time trial and a 10K time trial 24 hours later. Subjects ingested 3 randomized treatments (raisins, sport chews, and water only) with each treatment separated by 7 days. Heart rate (HR), respiratory exchange ratio (RER), blood glucose, lactate, free fatty acids (FFA), glycerol, insulin, electrolytes and creatine kinase, GI symptoms and rating of perceived exertion (RPE) were recorded every 20 minutes during the sub-maximal exercise test and at the end of the 5K. We also measured whole body muscle soreness and fatigue and mood disturbance via questionnaires. Results: VO2, HR, body weight changes, muscle soreness and fatigue, total mood disturbance and RPE during the submaximal exercise bout did not differ due to treatment. However, RER was highest during the sport chews treatment, followed by the raisins and water was the lowest (0.92 ± 0.01, 0.91 ± 0.01, 0.89 ± 0.01 for raisin, chews and water respectively). FFA and glycerol were higher with water than both CHO treatments. Blood glucose was higher for both carbohydrate treatments compared to water. Plasma creatine kinase was higher for all exercise time points with raisins versus chews and water. Time to complete the 5K time trial was faster for both carbohydrate treatments (20.6 ± .8, 20.7 ± .8, 21.6 ± .8 min for raisin, chews and water respectively). GI disturbance was mild (less than 1 out of 6) for all treatments with only belching higher in both CHO treatments compared to water. Conclusion: Both the raisins and sport chews maintained high blood glucose levels and improved running performance compared to water only. Running performance between the raisins and sport chews were similar and their GI tolerance was good. Raisins provided a good, natural carbohydrate source that had similar physiological and performance benefits as a commercially available product. 16. “The Impact of Pre-exercise Snacks on Exercise Intensity, Stress, and Fatigue in Children” Jennifer M. Sacheck, Tamar Kafka, Helen Rasmussen, Jeffrey B. Blumberg, and Christina D. Economos Purpose: Few studies have examined how the composition of snacks affects athletic performance in children. We investigated whether the macronutrient and flavonoid content of 3 pre-exercise
California Raisins Health and Nutrition Research Updated September 2012
43
snacks differentially affected exercise intensity, stress, and postgame fatigue in young soccer players. Methods: At 1 h prior to a 50-min soccer game, 115 children (9.1 ± 0.9 y) were randomly assigned to consume 1 of 3 isocaloric snacks: 1) nutrient dense/high flavonoid (HF) raisin/nut bar; 2) low flavonoid (LF) peanut butter graham bar; or 3) low flavonoid/high sugar (LF/HS) rice cereal bar. Blood glucose and salivary cortisol and IgA were measured before consuming the snack and immediately following the game. Game exercise intensity was measured by accelerometry. Self-administered questionnaires were used to assess diet quality and physical and mental fatigue after the game. Results: The children spent approximately 33% of the game in moderate to vigorous activity and 49% of the game in sedentary activity. The snack consumed was not related to exercise intensity. Mean post-exercise blood glucose (P<0.001) and cortisol (P<0.05) increased and IgA levels decreased (P<0.001) from pre-game values. The pre-exercise snack did not predict the post-exercise outcome for any of these parameters after controlling for pre-exercise values of the biomarkers, age, gender, BMI, exercise intensity, game-time water consumption, and diet quality. Children who reported symptoms of fatigue were more likely to have consumed the LF/HS snack (P<0.05). Conclusion: The pre-exercise snacks formulated for this study did not affect blood sugar or salivary biomarkers of stress following a soccer game in young children. The nutrient content of the single snack did not differentially influence these biomarkers or the exercise intensity; however subjective feelings of fatigue may be associated with low flavonoid/high sugar snacks. Future investigations are warranted to further explore the effects of pre-exercise snacks on exercise, performance, stress and fatigue in children. 17.“Glycemic Index in the Management of Type 2 Diabetes Mellitus” Carla Miller, PhD, RD, Ohio State University The glycemic index of the diet decreased following a 9-week intervention in which 109 diabetics were instructed to increase their intake of fruit and dried fruit, total dietary fiber (including soluble and insoluble fiber) and the percentages of energy from protein and total fat (including saturated and monounsaturated fat) improved. IN addition to a changed GI of the diet, there was a significant reduction in body weight and body mass index (weight (kg)/height (m2)) in both men and women and a significant reduction in waist circumference in men. More fruit including raisins and other dried fruit was consumed following the intervention, which is consistent with the dietary pattern recommended in the Dietary Guidelines 2005. These studies show the importance of fruit, including dried fruit, and dietary fiber in the diet of diabetics. Thus, a carbohydrate-controlled portion of raisins can readily be incorporated into a well-constructed diabetic diet.
California Raisins Health and Nutrition Research Updated September 2012
44
18. “Determination of the Glycemic and Insulinemic Responses to Raisins and the Application of Raisins as a Pre-exercise Snack for Persons with Impaired Glucose Tolerance” Craig Mattern, Assistant Professor, State University of New York at Brockport Raisins fed as a pre-exercise food to 22 exercisers (approximately half with normal and abnormal glucose tolerance) resulted in similar increases in blood glucose to those observed with a popular energy bar. These observed increases in blood glucose for raisins and energy bar were less than a standardized glucodex solution. The blood insulin response to the pre-exercise meal with raisins, especially in a sedentary population, produced statistically lower insulin values than the standardized glucose solution or the energy bar. All three test substances including Raisins resulted in similar mobilization of free fatty acids from adipose tissue during exercise. Thus, raisins resulted in a similar glucose response during exercise when compared to an energy bar and were less than the standardized glucose solution. The good news is that the insulin responses to raisin ingestion prior to, and in the early phases of exercise, were more favorable than those observed with the energy bar. Thus, raisins can be an excellent food for use by exercisers to help deliver the right kind of carbohydrates. 19. "Determination of the Glycemic and Insulinemic Indexes of Raisins in Three Populations" Steve Hertzler, Ph.D., Assistant Professor of Nutrition, The Ohio State University, Columbus, Ohio. The glycemic index (G.I.) and insulin index (I.I.) of raisins was determined on three different populations. In 10 sedentary adults, the G.I. of raisins was determined to be an average of 49.4. A nearly identical G.I. value for raisins was found for 10 prediabetic individuals. In the 11 endurance athletes, the G.I. of raisins was 62.3. As expected, the highest insulin index was found in prediabetic subjects (I.I. = 54.4) and the lowest was found in sedentary subjects (I.I. = 47.3). While the I.I. for athletes was 51.9, the overall insulin excursion in trained athletes was not nearly as great, showing the effects of training on insulin sensitivity and glucose utilization. Interestingly, California raisins in this study came in as a moderate glycemic food, which is different from the ‘high’ classification they are given in published tables. Data for published tables have not been collected on California raisins, and the population studied is not from the United States. 20. "Raisin Consumption and Exercise Performance of Endurance Athletes" Mark Kern, Ph.D., Department of Exercise and Nutritional Sciences, University of California – San Diego, San Diego, California. Raisins were shown to be a good alternative to sports gels in a study conducted with endurance athletes under two different conditions. In studies by Mark Kern, San Diego State professor and author of the CRC Desk Reference on Sports Nutrition (2005, CRC Press), endurance-trained cyclists (4 males and 4 females) completed two feeding-performance trials where changes in metabolism and cycling performance were compared after consumption of raisins (a moderate to low glycemic index food) versus a commercial sports gel (a high glycemic index food). There were no differences in performance in the 45 minute cycling trial (at 75% VO2max). No gastrointestinal
California Raisins Health and Nutrition Research Updated September 2012
45
discomfort was reported with either the gel or raisins. Measures of metabolic substrates after exercise were the same with both the sports gel and raisins except there were more free fatty acids after the pre-exercise ingestion of raisins. This increase in the free fatty acids indicates that raisins subtly, but favorably, improved metabolism. The authors concluded that raisins have similar performance effects to commercial sports gel products, but raisins are a better alternative since they provide more micronutrients, an acid-neutralizing load to the kidneys and are a more cost-effective and convenient food for use during exercise. 21. "The Effects of a Raisin-Peanut Pre-Event Meal on Indices of Energy and Fatigue in Young, Trained Soccer Players (10-12 Years of Age) Playing a Standard Game” Gene A. Spiller, Ph.D., Head, Sphera Foundation and Health Research and Studies Center, Los Altos, California. Feeding raisins along with peanuts and water to 10 to12 year old children prior to a soccer game resulted in lower increases in blood glucose and insulin than a snack of a white bagel and lemonade. This is important because it means a more steady fuel supply to the exercising muscle of the young players. Lower insulin levels are advantageous because high levels of circulating insulin can promote the laying down of fat and may lead to insulin resistance, a concern among U.S. children today, where rates of obesity and type-2 diabetes are increasing dramatically. Satiety 22. "The Effects of a Pre-Meal Raisin Snack on Satiety and Food Intake in Children” Dr. G. Harvey Anderson, Professor, Nutritional Sciences and Physiology. Department of Nutritional Sciences, University of Toronto. Three experiments were conducted to determine how raisin snacks influences appetite and calorie intake in 8-11 year old children. First Experiment Children were asked to visit the lab for three times and during each visit they were asked to eat until comfortably full one of three snacks: (1) raisins, (2) grapes or (3) a mix of almonds with raisins. In a half an hour, a lunch meal with pizza was provided to kids and again they were asked to eat it until they felt comfortably full. The results of this experiment indicated that after the raisin snack, kids consumed about 21% less pizza compared with other snacks. The total calories received from the snack and lunch meal were lower after raisins compared to other snacks. Second Experiment The equicaloric (150 kcal) snacks were provided to children and food intake was measured with a pizza meal in 30 min, similarly as in the first experiment. When total calories consumed were calculated after the snack and pizza meal, the calories after the snack with raisins were similar to those after just water, while other snacks led to higher calorie intake when compared with water. It was concluded that raisins was the only snack that does not increase calorie intake when provided before a lunch meal.
California Raisins Health and Nutrition Research Updated September 2012
46
Third Experiment All children received the same breakfast (skim milk, cereals and orange juice), morning snack (medium apple) and the lunch (turkey sandwich with a cup of 2% milk). Then in the afternoon (between 3:30 and 4 pm in the lab) they ate, until comfortably full, one of the four after-school snacks: (1) raisins, (2) grapes, (3) potato chips and (4) chocolate chip cookies. The results of this experiment demonstrated that calorie intake after raisins was the lowest compared to other snacks. Thus, children consumed about 1.5 times more calories with grapes or potato chips, and about twice more calories with cookies. Conclusion The results of this project indicate that raisins compared to other popular snacks reduce appetite and provide the lowest energy intake.
FUNDED CROP PRODUCTION RESEARCH
47
FY 2011-2012 • Breeding rootstocks resistant to aggressive root-knot nematodes
Principle Investigator: Peter Cousins
• Development of improved raisin grapes for mechanical harvest including types resistant to powdery mildew Principle Investigator: David Ramming
• Node position, shoot emergence, and yield components of cane-pruned raisin grapes Principle Investigator: Matthew Fidelibus
• Advancing maturity of raisin cultivars using potassium sprays applied just prior or during the ripening phase Principle Investigator: William Peacock
FUNDED CROP PRODUCTION RESEARCH
48
FY 2010-2011
• Advancing maturity of raisin cultivars using potassium sprays applied just prior or during the ripening phase, by Bill Peacock
• Sustainable Controls for Vine Mealybug – 2010, by Kent Daane
• Crop yield and economics of San Joaquin Valley vineyards under alternative weed management strategies, by Anil Shrestha
• Identifying and correlating populations to fruit damage in raisin production systems, by Stephen Vasquez
• Node position, shoot emergence, and yield components of cane-pruned raisin grapes, by Matthew Fidelibus
• Breeding Rootstocks Resistant to Aggressive Root-Knot Nematodes, by Peter Cousins
• Development of improved raisin grapes for mechanical harvest including types resistant to powdery mildew, by David Ramming
FUNDED CROP PRODUCTION RESEARCH
49
FY 2009-2010 • Breeding Rootstocks Resistant to Aggressive Root-Knot Nematodes, by Peter
Cousins
• Advancing maturity of raisin cultivars using potassium sprays applied to fruit just prior or during the ripening phase, by Bill Peacock
• Development of improved raisin grapes for mechanical harvest including types resistant to powdery mildew, by David Ramming
• Sustainable Controls for Vine Mealybug, by Kent Daane
• Movento, Much More Than an Insect Growth Regulator, by M. McKenry
• Identifying raisin moth damage in raisin production systems, by Stephan Vasquez
• Evaluation of abscission agents for grapes, by Matthew Fidelibus
FUNDED CROP PRODUCTION RESEARCH
50
FY 2008-2009 • Evaluation of novel abscission agents to facilitate mechanical harvesting of
raisin grapes, by Matthew Fidelibus
• Grapevine Cultivar and Drying Method Effects on Raisin Yield and Quality, by Matthew Fidelibus and Hildegarde Heymann
• Development of improved raisin grapes for mechanical harvest including types resistant to powdery mildew, by David Ramming
• Breeding Rootstocks Resistant to Aggressive Root-Knot Nematodes, by Peter Cousins
• Spider mite management, by N. Mills
• Sustainable Controls for Vine Mealybug: Mating Disruption, by Kent Daane
• Sustainable Controls for Vine Mealybug: Biological Control, by Kent Daane
FUNDED CROP PRODUCTION RESEARCH
51
FY 2007-2008 • Water use of Thompson Seedless grapevines growing in a weighing lysimeter
and trained to an overhead trellis system used for dried on the vine (DOV) raisin production, by Larry Williams
• Evaluation of novel abscission agents to facilitate mechanical harvesting of raisin grapes, by Matthew Fidelibus
• Grapevine cultivar and drying method effects on raisin yield and quality, by David Ramming
• Development, Testing and Introduction of Grape Rootstocks with Broad and Durable Nematode Resistance, by Howard Ferris and M. Andrew Walker
• Breeding Rootstocks Resistant to Aggressive Root-Knot Nematodes, by Peter Cousins
• Sustainable Controls for Vine Mealybug: Mating Disruption, by Kent Daane
FUNDED CROP PRODUCTION RESEARCH
52
FY 2006-2007 • Cost of Feasibility of Mechanically Harvested Continuous Tray Dried Raisins, by
Stephan Vasquez
• Overhead Arbor Trellis Systems: Canopy Structure and Function in Relation to Irrigation Requirements, by Matthew Fidelibus, Lawrence Schwanki, and Stephan Vasquez
• Evaluation of novel abscission agents to facilitate mechanical harvesting of raisin grapes, by Matthew Fidelibus and Carlos Crisosto
• Development of improved raisin grapes for mechanical harvest including types resistant to powdery mildew, by David Ramming
• Sustainable Controls for Vine Mealybug: Mating Disruption, by Kent Daane and Walt Bentley
• Development, Testing and Introduction of Grape Rootstocks with Broad and Durable Nematode Resistance, by Howard Ferris and M. Andrew Walker
• Grapevine Cultivar and Drying Method Effects on Raisin Yield and Quality, by Matthew Fidelibus and Hildegarde Heymann
• Breeding Rootstocks Resistant to Aggressive Root-Knot Nematodes, by Peter Cousins
FUNDED CROP PRODUCTION RESEARCH
53
FY 2005-2006 • Raisin Research on DOV Using the Within Row Alternate Bearing Method
(WRAB DOV), by Bill Peacock
• Evaluation of Training Systems, Trellises, Row Direction, and Grape Cultivars for Dry-on-Vine (DOV) Raisin Production, by Matthew Fidelibus
• Evaluation of Canopy Separation and Defoliation Practices for Mechanized Raisin Harvest on Traditional Trellises, by Matthew Fidelibus and Stephan Vasquez
• Overhead Arbor Trellis Systems: Canopy Structure and Function in Relation to Irrigation Requirements, by Matthew Fidelibus and Stephan Vasquez
• Physiological Implications of Harvest Pruning Raisin Grapes, by Matthew Fidelibus and D. Smart
• Development of Improved Raisin Grapes for Mechanical Harvest including Types Resistant to Powdery Mildew, by David Ramming
• Development, Testing and Introduction of Grape Rootstocks with Broad and Durable Nematode Resistance, by Howard Ferris and M. Andrew Walker
• Breeding Rootstocks Resistant to Aggressive Root-Knot Nematodes, by Peter Cousins
• Sustainable Controls for Vine Mealybug: Mating Disruption, by Kent Daane
FUNDED CROP PRODUCTION RESEARCH
54
FY 2004-2005 • Development of Improved Raisin Grapes for Mechanical Harvest Including
Types Resistant to Powdery Mildew, by David Ramming
• Breeding Rootstocks Resistant to Aggressive Root-Knot Nematodes, by Peter Cousins
• Development, Testing and Introduction of Grape Rootstocks with Broad and Durable Nematode Resistance, by Howard Ferris and M. Andrew Walker
• Developing Sustainable Control Options for the Vine Mealybug in California, by Kent Danne
• Investigation of the Grape Mealybug Complex and its Natural Enemies to Improve Biological Control, by Kent Daane and Mark Battany
• Use of Vine Mealybug Sex Pheromone for Monitoring and Mating Disruption, by Walt Bentley and Kent Daane
• Leafroll Disease Revisited, by D.A. Golino
• Develop and Implement Control Methods for Eutypa Dieback, by Doug Gubler
• Investigations Into Pathogenicity of Phomopsis viticola as a Cause of Cankers and Bud Death in Grapes, by George Leavitt
• Pheromones for Sampling Major Mealybug Pests in California Vineyards, by Jocelyn Millar
• Physiological Implications of Harvest Pruning Raisin Grapes, by Matthew Fidelibus
• Evaluation of Training Systems, Trellises, Row Direction, and Grape Cultivars in Dry-on-the-Vine (DOV) Raisin Production, by Matthew Fidelibus
• Evaluation of Canopy Separation and Defoliation Practices for Mechanized Raisin Harvest on traditional Trellises, by Matthew Fidelibus
• Evaluation of Nematode Resistant Rootstalks for Use with Early Ripening Raisin Varieties Grown for Dried-on-the-Vine Raisin Production, by Stephan Vasquez
• Raisin Research on DOV Using the Within Row Alternate Bearing Method (WRAB DOV), by Bill Peacock