rainwater harvesting potential for industrial units …
TRANSCRIPT

AMIERJ ISSN 2278-5655 Volume–VII, Issue–II Feb – March 2018
Aarhat Multidisciplinary International Education Research Journal (AMIERJ) Page 55
EduIndex Impact Factor 5.18 UGC Approved Journal No 48178, 48818
RAINWATER HARVESTING POTENTIAL FOR INDUSTRIAL UNITS IN PIMPARI
CHINCHWAD MIDC, MAHARASHTRA, INDIA
MR. DATTATRAY P. MANE
Research scholar, Tilak Maharashtra Vidyapeeth,Gultekadi, Pune, (MH), India.
AND
DR. ARUN D. ANDHALE
Principal, R.S.S., Savitribai Phule Mahila Mahavidyalaya,Satara.. (MH), India.
Abstract –
India is a developing country which recently experienced a rapid growth in the industrial sector. Pimpri –
Chinchwad is one of the major industrial area in Maharashtra.
Water is an important and essential requirement for industrial growth. Pmpri-Chinchwad industrial area
receives water supply from Pawana dam in Maval tahashil of Pune districts.
Now day’s water supply to rural and urban population, agriculture and industries is burning issue in many
parts of Maharashtra. As the industries are growing rapidly it is an urgent need to look in to the issue of
accurate management of water in industrial units. Therefore we have focused the electronic zone of Pimpri-
chinchwad MIDC to study of water management. Basically the assessment of industrial water use also
domestic its use in those industrial units was made through the filling up the questioner in the electronic
zone. The use of excess water in industrial process also domestic use of water, its scarcity and deficit were
assessed in the study. This study provides to plan for other alternatives of water supply by applying
rainwater harvesting techniques. The study also calculates rainwater harvesting potential for industrial
units. Therefore industrial units look forward as their own alternative water supply source.
The study reveals the amount of water used by every industrial units under study. As well as proper utility of
water, problems related to water supply, water management and alternative to overcome the related
problem.
Key words - Industrial Field survey, Industrial Water Management, Industrial Water use and need,
Rainwater harvesting.
Introduction –
The day by day water requirement of all the sector industry, agriculture and domestic uses is increasing as
they are growing rapidly in most of the big cities in India are getting piped water from far-off places. This is
putting tremendous pressure on the local population whose water is being snatched to feed urban and
industrial growth.
Increasing industrial water use has been the increase in conflict between society and the industry on issues
ranging from to water scarcity. In areas where there is water scarcity, industries are under tremendous
pressure from society and government alike to reduce water use. In India, The main sources of water for
the industrial sector are groundwater and surface water. Selection of source of water depends on the
availability of sufficient and regular supply and the cost of water from the source. Industrial sector require
huge amount of water. Since the surface water supply from the any other source like municipal, and
industrial development authority sources is not sufficiently guaranteed, industrial units to depend on
groundwater.

AMIERJ ISSN 2278-5655 Volume–VII, Issue–II Feb – March 2018
Aarhat Multidisciplinary International Education Research Journal (AMIERJ) Page 56
EduIndex Impact Factor 5.18 UGC Approved Journal No 48178, 48818
With a view to optimize water usage we are looking at alternatives, which are sustainable, reliable and cost
effective. Rainwater harvesting appeared as a potential source of supply. Rainwater harvesting provides the
long-term answers to the problem of water scarcity. (Geography of water resourses- R.K.Gurjar, b.C.Jat,
Rawat Pub) To asses and understand the industrial water use following twenty eight industrial units are
selected to study the varies problems in water management and industrial campuses assed to get the potential
of water from the rain.
Location of study area -
The city of Pimpri-Chinchwad is situated near the western margin of the Deccan Plateau on the leeward side
of the Sahyadri ranges and Western Ghats, 560 m above sea level, on the banks of the rivers Mula, Pawana
and Indrayani.
Industrial development in the Pimpri-Chinchwad region started in 1954 when Hindustan Antibiotics, then
rapid industrialization over the next few years. The Maharashtra Industrial Development Corporation
acquiring (MIDC) is started the process of industrial development in 1956. specially this belt is indicate the
automobile industry but variety of industries like pharmaceuticals, chemicals, telecommunications and even
Information Technology companies now setting up there on large scale Electronic zone industrial area is one
the important industrial sub area In Pimpri Chinchwad MIDC .
Location of Pimpri- Chinchwad MIDC
Methodology –
Selection Of site and data collection to understand the water management in the different industrial units the
28 industries from Electronic Zone area were selected for the study by using stratified random sampling
method. And the assessment of industrial water use and management was made through the filling up the
questionnaires and prepare interviews in the industries. One questionnaire dedicate for rainwater harvesting.
Results and Discussion -
Water management and Rainwater harvesting potential in Electronic Zone –
The Electronic zone area has 80 number of small, medium and large scale industry. The industrial units of
electronics spare parts, heavy duty fabrication, and coats industry. These manufacturing industry require
huge amount of water in there industrial process. In this area industries are mainly producing the electronics

AMIERJ ISSN 2278-5655 Volume–VII, Issue–II Feb – March 2018
Aarhat Multidisciplinary International Education Research Journal (AMIERJ) Page 57
EduIndex Impact Factor 5.18 UGC Approved Journal No 48178, 48818
parts, testing and customized machinery in large scale on fabrication work. They requires water for cooling
process, acid wash process, painting process, Tank testing. Also seven tank testing process. The graph no. 1
show the annual water use in industry with the bifurcation of internal use like domestic and industrial
process.( Ref. Table No.01) The industrial domestic water use includes the water used for drinking,
cleaning, and for the supply of toilets seats.
Table No.-1) Electronic Zone - Annul Water Use In Ltr.
Sr.No. Name Of Industry Industrial Annul Domestic Annual Total
1 Rasco Industry 365000 547500 912500
2 Mogora Cosmic Ltd 730000 1460000 2190000
3 S H Pithkar Ortho tools 365000 1095000 1460000
4 Lonlife Sciences Ltd. 292000 1095000 1387000
5 Jayashree Electron 0 1825000 1825000
6 Power Formers Eng. 0 1095000 1095000
7 Tri-o Enterprises 0 547500 547500
8 Savm Electronics P. Ltd 0 912500 912500
9 Prasad Mcab p Ltd. 365000 1095000 1460000
10 Asain Power system P. Ltd 0 730000 730000
11 Alok Chemicle P. Ltd. 730000 1095000 1825000
12 Svs Industries 0 547500 547500
13 Zeutch Engineers P. Ltd 365000 547500 912500
14 Mithsagar Electronic P. Ltd 0 730000 730000
15 Jabro Engineers 292000 547500 839500
16 Power Win House 0 912500 912500
17 Jaldoot material and handling P. Ltd 365000 1095000 1460000
18 Sakshi metal and tools P. Ltd 438000 1095000 1533000
19 Jayashree Electrical P. Ltd 0 1460000 1460000
20 Frontline Electronics 0 1460000 1460000
21 Deairj Tech India 365000 730000 1095000
22 Mitoubhi Electrical 0 547500 547500
23 Cpgemini 0 730000 730000
24 Shree Industries 0 730000 730000
25 Scope T and M Ltd 0 1642500 1642500
26 Fablectiani Engineers 0 255500 255500
27 Try Engineers 0 912500 912500
28 Sru Tech Engineering 0 255500 255500

AMIERJ ISSN 2278-5655 Volume–VII, Issue–II Feb – March 2018
Aarhat Multidisciplinary International Education Research Journal (AMIERJ) Page 58
EduIndex Impact Factor 5.18 UGC Approved Journal No 48178, 48818
TABLE NO. 02 - OBSERVETION OF WATER MANAGEMENT
Domestic Industrial
1 Rasco Industry Unplan Yes Yes No No NA
2 Mogora Cosmic Ltd Plan No No No No Drip
3 S H Pithkar Ortho tools Plan No No No No NA
4 Lonlife Sciences Ltd. Plan No No No No Drip
5 Jayashree Electron Plan No No No No Drip
6 Power Formers Eng. Plan No No No No Traditional
7 Tri-o Enterprises Unplan Yes No No No NA
8 Savm Electronics P. Ltd Unplan Yes No No No Traditional
9 Prasad Mcab p Ltd. Unplan Yes Yes No No Traditional
10 Asain Power system P. Ltd Unplan Yes No No No NA
11 Alok Chemicle P. Ltd. Unplan Yes Yes No No NA
12 Svs Industries Unplan Yes No No No NA
13 Zeutch Engineers P. Ltd Unplan Yes Yes No No NA
14 Mithsagar Electronic P. Ltd Unplan Yes No No No NA
15 Jabro Engineers Unplan Yes Yes No No NA
16 Power Win House Unplan Yes No No No Traditional
17 Jaldoot material and handling P. Ltd Unplan Yes Yes No No NA
18 Sakshi metal and tools P. Ltd Plan No No No No Drip /Sprinkler
19 Jayashree Electricle P. Ltd Plan No No No No Drip /Sprinkler
20 Frontline Electronics Plan No No No No Drip /Sprinkler
21 Deairj Tech India Plan Yes No No No Traditional
22 Mitoubhi Electricle Plan Yes No No No Traditional
23 Cpgemini Plan No No No No Drip
24 Shree Industries Plan No No No No Traditional
25 Scope T and M Ltd Plan Yes No No No Traditional
26 Fablectiani Engineers Plan Yes No No No NA
27 Try Engineers Plan Yes No No No Traditional
28 Sru Tech Engineering Plan No No No No NA
Garden IrrigationName Of IndustrySr. No.Water
Management
Recycling Of
Used water
Pipeline
linkeges
Extra / Excess Use Of water
Following problems are observed in industrial units –
1) Lack of the awareness of water management only 12 industries are does not having planning for water
use and water management. It is indication of lack of awareness of water management in industry.
2) Extra and excess use by Workers due to lack of awareness of water using, also none of automatic flushing
system observe in industry that’s why flushing is uncontrolled. 17 industries excess use of water in domestic
use. This observation indicates the flushing cannot be save water and excess or extra use of water is
increasing as compare to requirement.
3) Water use in industrial process leads to water loss. 6 industries use excess use of water in industrial
processes. Industry does not have regulatory mechanism of water use in processes. 9 industry use traditional
method of water use which is leads to wastage of water in huge amount.
AMIERJ ISSN 2278-5655 Volume–VII, Issue–II Feb – March 2018
Aarhat Multidisciplinary International Education Research Journal (AMIERJ) Page 59
EduIndex Impact Factor 5.18 UGC Approved Journal No 48178, 48818
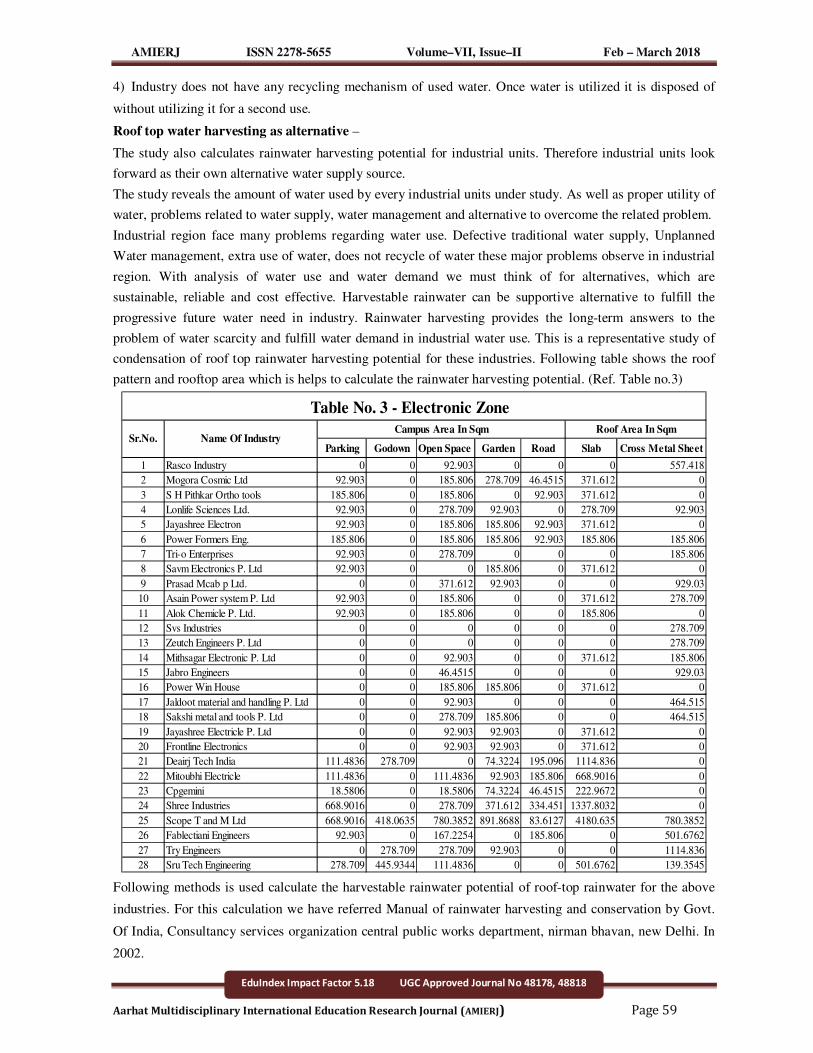
4) Industry does not have any recycling mechanism of used water. Once water is utilized it is disposed of
without utilizing it for a second use.
Roof top water harvesting as alternative –
The study also calculates rainwater harvesting potential for industrial units. Therefore industrial units look
forward as their own alternative water supply source.
The study reveals the amount of water used by every industrial units under study. As well as proper utility of
water, problems related to water supply, water management and alternative to overcome the related problem.
Industrial region face many problems regarding water use. Defective traditional water supply, Unplanned
Water management, extra use of water, does not recycle of water these major problems observe in industrial
region. With analysis of water use and water demand we must think of for alternatives, which are
sustainable, reliable and cost effective. Harvestable rainwater can be supportive alternative to fulfill the
progressive future water need in industry. Rainwater harvesting provides the long-term answers to the
problem of water scarcity and fulfill water demand in industrial water use. This is a representative study of
condensation of roof top rainwater harvesting potential for these industries. Following table shows the roof
pattern and rooftop area which is helps to calculate the rainwater harvesting potential. (Ref. Table no.3)
Parking Godown Open Space Garden Road Slab Cross Metal Sheet
1 Rasco Industry 0 0 92.903 0 0 0 557.418
2 Mogora Cosmic Ltd 92.903 0 185.806 278.709 46.4515 371.612 0
3 S H Pithkar Ortho tools 185.806 0 185.806 0 92.903 371.612 0
4 Lonlife Sciences Ltd. 92.903 0 278.709 92.903 0 278.709 92.903
5 Jayashree Electron 92.903 0 185.806 185.806 92.903 371.612 0
6 Power Formers Eng. 185.806 0 185.806 185.806 92.903 185.806 185.806
7 Tri-o Enterprises 92.903 0 278.709 0 0 0 185.806
8 Savm Electronics P. Ltd 92.903 0 0 185.806 0 371.612 0
9 Prasad Mcab p Ltd. 0 0 371.612 92.903 0 0 929.03
10 Asain Power system P. Ltd 92.903 0 185.806 0 0 371.612 278.709
11 Alok Chemicle P. Ltd. 92.903 0 185.806 0 0 185.806 0
12 Svs Industries 0 0 0 0 0 0 278.709
13 Zeutch Engineers P. Ltd 0 0 0 0 0 0 278.709
14 Mithsagar Electronic P. Ltd 0 0 92.903 0 0 371.612 185.806
15 Jabro Engineers 0 0 46.4515 0 0 0 929.03
16 Power Win House 0 0 185.806 185.806 0 371.612 0
17 Jaldoot material and handling P. Ltd 0 0 92.903 0 0 0 464.515
18 Sakshi metal and tools P. Ltd 0 0 278.709 185.806 0 0 464.515
19 Jayashree Electricle P. Ltd 0 0 92.903 92.903 0 371.612 0
20 Frontline Electronics 0 0 92.903 92.903 0 371.612 0
21 Deairj Tech India 111.4836 278.709 0 74.3224 195.096 1114.836 0
22 Mitoubhi Electricle 111.4836 0 111.4836 92.903 185.806 668.9016 0
23 Cpgemini 18.5806 0 18.5806 74.3224 46.4515 222.9672 0
24 Shree Industries 668.9016 0 278.709 371.612 334.451 1337.8032 0
25 Scope T and M Ltd 668.9016 418.0635 780.3852 891.8688 83.6127 4180.635 780.3852
26 Fablectiani Engineers 92.903 0 167.2254 0 185.806 0 501.6762
27 Try Engineers 0 278.709 278.709 92.903 0 0 1114.836
28 Sru Tech Engineering 278.709 445.9344 111.4836 0 0 501.6762 139.3545
Table No. 3 - Electronic Zone
Campus Area In Sqm Roof Area In SqmSr.No. Name Of Industry
Following methods is used calculate the harvestable rainwater potential of roof-top rainwater for the above
industries. For this calculation we have referred Manual of rainwater harvesting and conservation by Govt.
Of India, Consultancy services organization central public works department, nirman bhavan, new Delhi. In
2002.

AMIERJ ISSN 2278-5655 Volume–VII, Issue–II Feb – March 2018
Aarhat Multidisciplinary International Education Research Journal (AMIERJ) Page 60
EduIndex Impact Factor 5.18 UGC Approved Journal No 48178, 48818
CALCULATION OF AMOUNT OF RAINWATER
Rainwater Harvesting Potential Cum =
(Area of roof top in sqm) x( Annual rain fall in meter)
x (Run off coefficient) x (Constant co-efficient 0.80)
Table no – 04 - Run off co-efficient
Sr.No Roof Catchments Run off Co- efficient
1 Tiles 0.8 - 0.9
2 Corrugated Metal sheets 0.7 - 0.9
3 Asphaltic or concrete pavement (Parking, Roads) 0.70 - 0.95
4 Unimproved land areas 0.10 - 0.30
5 Parks 0.10 – 0.25
6 Annual Rainfall 0.7 – 0.8
As per the calculation following table no. 5 ,6 and 7 shown the calculation of harvestable rainwater in
electronic zone .
Parking Godown Open Space Garden Road
1 Rasco Industry 0 0 17.837376 0 0 17.837376
2 Mogora Cosmic Ltd 56.485024 0 35.674752 44.59344 28.242512 164.995728
3 S H Pithkar Ortho tools 112.970048 0 35.674752 0 56.485024 205.129824
4 Lonlife Sciences Ltd. 56.485024 0 53.512128 14.86448 0 124.861632
5 Jayashree Electron 56.485024 0 35.674752 29.72896 56.485024 178.37376
6 Power Formers Eng. 112.970048 0 35.674752 29.72896 56.485024 234.858784
7 Tri-o Enterprises 56.485024 0 53.512128 0 0 109.997152
8 Savm Electronics P. Ltd 56.485024 0 0 29.72896 0 86.213984
9 Prasad Mcab p Ltd. 0 0 71.349504 14.86448 0 86.213984
10 Asain Power system P. Ltd 56.485024 0 35.674752 0 0 92.159776
11 Alok Chemicle P. Ltd. 56.485024 0 35.674752 0 0 92.159776
12 Svs Industries 0 0 0 0 0 0
13 Zeutch Engineers P. Ltd 0 0 0 0 0 0
14 Mithsagar Electronic P. Ltd 0 0 17.837376 0 0 17.837376
15 Jabro Engineers 0 0 8.918688 0 0 8.918688
16 Power Win House 0 0 35.674752 29.72896 0 65.403712
17 Jaldoot material and handling P. Ltd 0 0 17.837376 0 0 17.837376
18 Sakshi metal and tools P. Ltd 0 0 53.512128 29.72896 0 83.241088
19 Jayashree Electricle P. Ltd 0 0 17.837376 14.86448 0 32.701856
20 Frontline Electronics 0 0 17.837376 14.86448 0 32.701856
21 Deairj Tech India 67.7820288 160.5364 0 11.891584 118.6185504 358.8285472
22 Mitoubhi Electricle 67.7820288 0 21.4048512 14.86448 112.970048 217.021408
23 Cpgemini 11.2970048 0 3.5674752 11.891584 28.242512 54.998576
24 Shree Industries 406.692173 0 53.512128 59.45792 203.3460864 723.0083072
25 Scope T and M Ltd 406.692173 240.8046 149.8339584 142.69901 50.8365216 990.8662368
26 Fablectiani Engineers 56.485024 0 32.1072768 0 112.970048 201.5623488
27 Try Engineers 0 160.5364 53.512128 14.86448 0 228.912992
28 Sru Tech Engineering 169.455072 256.8582 21.4048512 0 0 447.7181376
Sr.No. Name Of IndustryCampus Area In cum Total
In cum
Table No. 5 - Electronic Zone Campus Area Calculation of RWH

AMIERJ ISSN 2278-5655 Volume–VII, Issue–II Feb – March 2018
Aarhat Multidisciplinary International Education Research Journal (AMIERJ) Page 61
EduIndex Impact Factor 5.18 UGC Approved Journal No 48178, 48818
Table No. 6 -Electronic Zone Rooftop Area Calculation of RWH
Roof Area In cum Sr.No. Name Of Industry
Slab Cross Metal Sheet
Total
In cum
1 Rasco Industry 0 321.072768 321.072768
2 Mogora Cosmic Ltd 214.048512 0 214.048512
3 S H Pithkar Ortho tools 214.048512 0 214.048512
4 Lonlife Sciences Ltd. 160.536384 53.512128 214.048512
5 Jayashree Electron 214.048512 0 214.048512
6 Power Formers Eng. 107.024256 107.024256 214.048512
7 Tri-o Enterprises 0 107.024256 107.024256
8 Savm Electronics P. Ltd 214.048512 0 214.048512
9 Prasad Mcab p Ltd. 0 535.12128 535.12128
10 Asain Power system P. Ltd 214.048512 160.536384 374.584896
11 Alok Chemicle P. Ltd. 107.024256 0 107.024256
12 Svs Industries 0 160.536384 160.536384
13 Zeutch Engineers P. Ltd 0 160.536384 160.536384
14 Mithsagar Electronic P. Ltd 214.048512 107.024256 321.072768
15 Jabro Engineers 0 535.12128 535.12128
16 Power Win House 214.048512 0 214.048512
17 Jaldoot material and handling P. Ltd 0 267.56064 267.56064
18 Sakshi metal and tools P. Ltd 0 267.56064 267.56064
19 Jayashree Electrical P. Ltd 214.048512 0 214.048512
20 Frontline Electronics 214.048512 0 214.048512
21 Deairj Tech India 642.145536 0 642.145536
22 Mitoubhi Electrical 385.2873216 0 385.2873216
23 Cpgemini 128.4291072 0 128.4291072
24 Shree Industries 770.5746432 0 770.5746432
25 Scope T and M Ltd 2408.04576 449.5018752 2857.547635
26 Fablectiani Engineers 0 288.9654912 288.9654912
27 Try Engineers 0 642.145536 642.145536
28 Sru Tech Engineering 288.9654912 80.268192 369.2336832
AMIERJ ISSN 2278-5655 Volume–VII, Issue–II Feb – March 2018
Aarhat Multidisciplinary International Education Research Journal (AMIERJ) Page 62
EduIndex Impact Factor 5.18 UGC Approved Journal No 48178, 48818
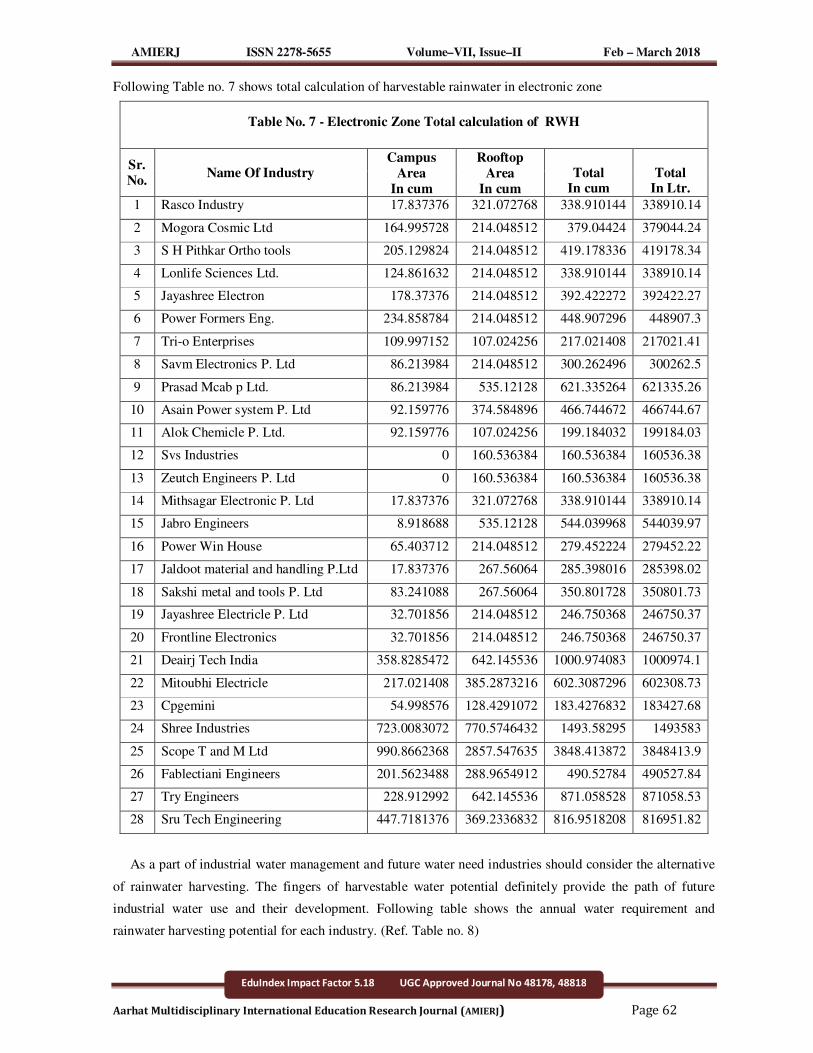
Following Table no. 7 shows total calculation of harvestable rainwater in electronic zone
Table No. 7 - Electronic Zone Total calculation of RWH
Sr.
No. Name Of Industry
Campus
Area
In cum
Rooftop
Area
In cum
Total In cum
Total In Ltr.
1 Rasco Industry 17.837376 321.072768 338.910144 338910.14
2 Mogora Cosmic Ltd 164.995728 214.048512 379.04424 379044.24
3 S H Pithkar Ortho tools 205.129824 214.048512 419.178336 419178.34
4 Lonlife Sciences Ltd. 124.861632 214.048512 338.910144 338910.14
5 Jayashree Electron 178.37376 214.048512 392.422272 392422.27
6 Power Formers Eng. 234.858784 214.048512 448.907296 448907.3
7 Tri-o Enterprises 109.997152 107.024256 217.021408 217021.41
8 Savm Electronics P. Ltd 86.213984 214.048512 300.262496 300262.5
9 Prasad Mcab p Ltd. 86.213984 535.12128 621.335264 621335.26
10 Asain Power system P. Ltd 92.159776 374.584896 466.744672 466744.67
11 Alok Chemicle P. Ltd. 92.159776 107.024256 199.184032 199184.03
12 Svs Industries 0 160.536384 160.536384 160536.38
13 Zeutch Engineers P. Ltd 0 160.536384 160.536384 160536.38
14 Mithsagar Electronic P. Ltd 17.837376 321.072768 338.910144 338910.14
15 Jabro Engineers 8.918688 535.12128 544.039968 544039.97
16 Power Win House 65.403712 214.048512 279.452224 279452.22
17 Jaldoot material and handling P.Ltd 17.837376 267.56064 285.398016 285398.02
18 Sakshi metal and tools P. Ltd 83.241088 267.56064 350.801728 350801.73
19 Jayashree Electricle P. Ltd 32.701856 214.048512 246.750368 246750.37
20 Frontline Electronics 32.701856 214.048512 246.750368 246750.37
21 Deairj Tech India 358.8285472 642.145536 1000.974083 1000974.1
22 Mitoubhi Electricle 217.021408 385.2873216 602.3087296 602308.73
23 Cpgemini 54.998576 128.4291072 183.4276832 183427.68
24 Shree Industries 723.0083072 770.5746432 1493.58295 1493583
25 Scope T and M Ltd 990.8662368 2857.547635 3848.413872 3848413.9
26 Fablectiani Engineers 201.5623488 288.9654912 490.52784 490527.84
27 Try Engineers 228.912992 642.145536 871.058528 871058.53
28 Sru Tech Engineering 447.7181376 369.2336832 816.9518208 816951.82
As a part of industrial water management and future water need industries should consider the alternative
of rainwater harvesting. The fingers of harvestable water potential definitely provide the path of future
industrial water use and their development. Following table shows the annual water requirement and
rainwater harvesting potential for each industry. (Ref. Table no. 8)
AMIERJ ISSN 2278-5655 Volume–VII, Issue–II Feb – March 2018
Aarhat Multidisciplinary International Education Research Journal (AMIERJ) Page 63
EduIndex Impact Factor 5.18 UGC Approved Journal No 48178, 48818
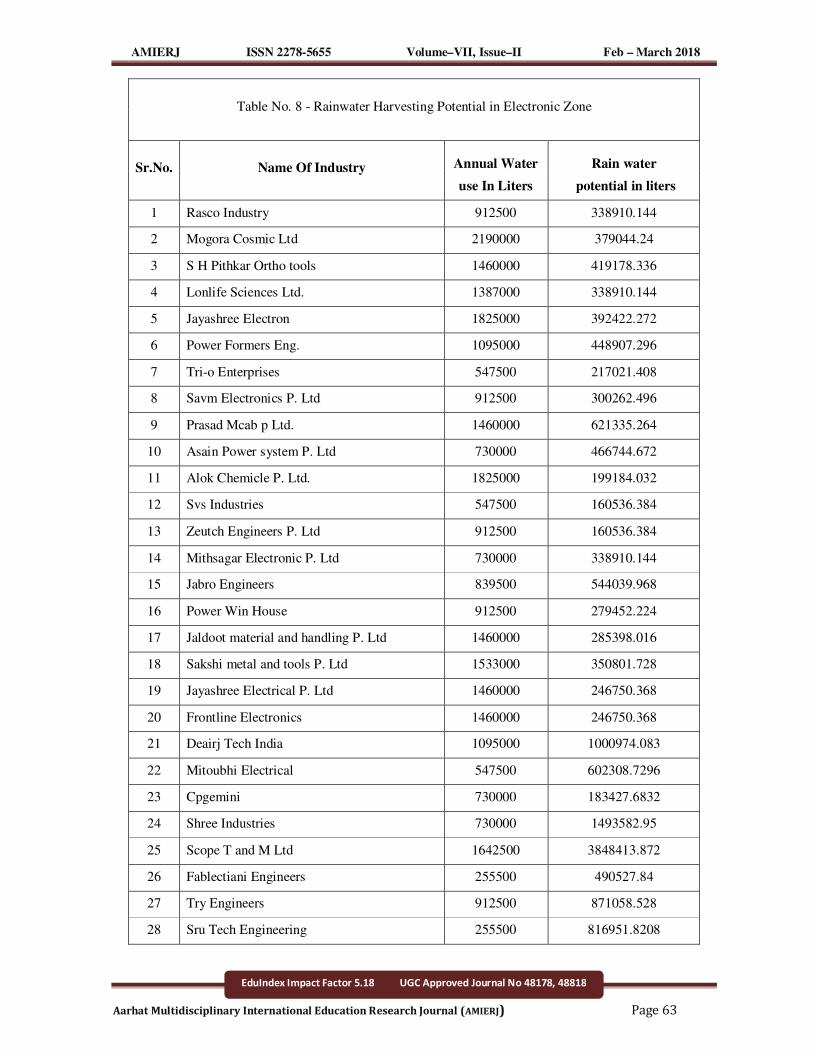
Table No. 8 - Rainwater Harvesting Potential in Electronic Zone
Sr.No. Name Of Industry Annual Water
use In Liters
Rain water
potential in liters
1 Rasco Industry 912500 338910.144
2 Mogora Cosmic Ltd 2190000 379044.24
3 S H Pithkar Ortho tools 1460000 419178.336
4 Lonlife Sciences Ltd. 1387000 338910.144
5 Jayashree Electron 1825000 392422.272
6 Power Formers Eng. 1095000 448907.296
7 Tri-o Enterprises 547500 217021.408
8 Savm Electronics P. Ltd 912500 300262.496
9 Prasad Mcab p Ltd. 1460000 621335.264
10 Asain Power system P. Ltd 730000 466744.672
11 Alok Chemicle P. Ltd. 1825000 199184.032
12 Svs Industries 547500 160536.384
13 Zeutch Engineers P. Ltd 912500 160536.384
14 Mithsagar Electronic P. Ltd 730000 338910.144
15 Jabro Engineers 839500 544039.968
16 Power Win House 912500 279452.224
17 Jaldoot material and handling P. Ltd 1460000 285398.016
18 Sakshi metal and tools P. Ltd 1533000 350801.728
19 Jayashree Electrical P. Ltd 1460000 246750.368
20 Frontline Electronics 1460000 246750.368
21 Deairj Tech India 1095000 1000974.083
22 Mitoubhi Electrical 547500 602308.7296
23 Cpgemini 730000 183427.6832
24 Shree Industries 730000 1493582.95
25 Scope T and M Ltd 1642500 3848413.872
26 Fablectiani Engineers 255500 490527.84
27 Try Engineers 912500 871058.528
28 Sru Tech Engineering 255500 816951.8208
AMIERJ ISSN 2278-5655 Volume–VII, Issue–II Feb – March 2018
Aarhat Multidisciplinary International Education Research Journal (AMIERJ) Page 64
EduIndex Impact Factor 5.18 UGC Approved Journal No 48178, 48818
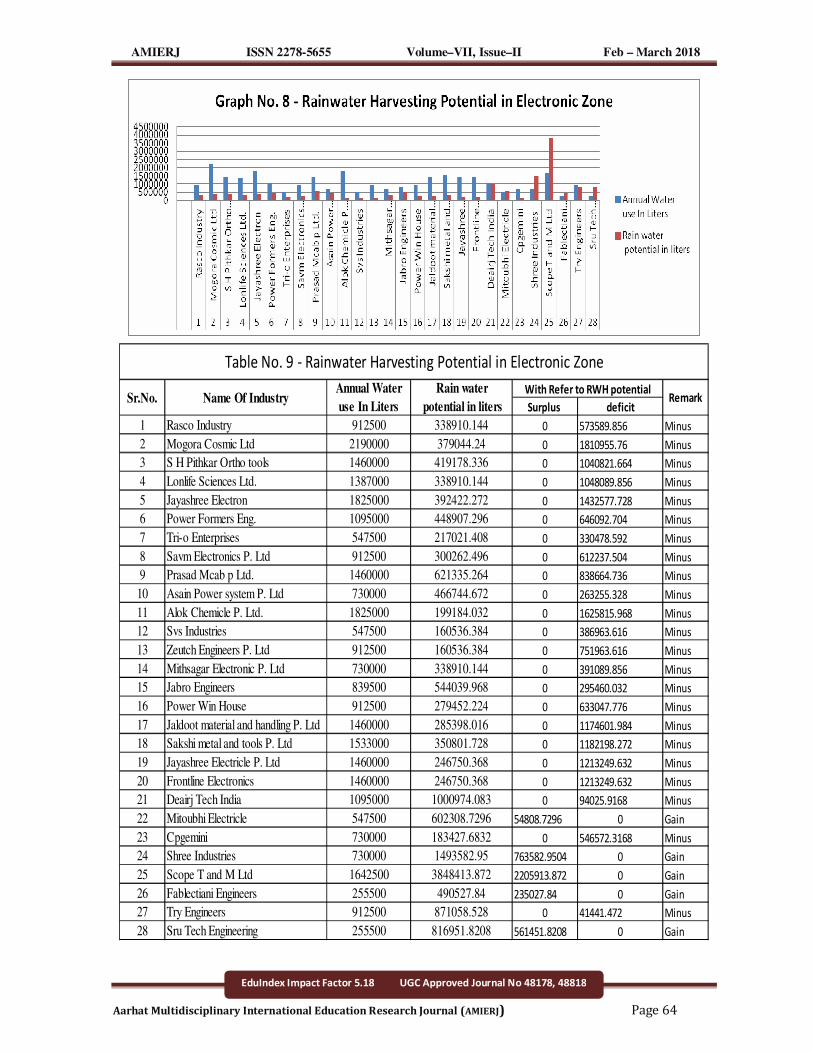
Surplus deficit
1 Rasco Industry 912500 338910.144 0 573589.856 Minus
2 Mogora Cosmic Ltd 2190000 379044.24 0 1810955.76 Minus
3 S H Pithkar Ortho tools 1460000 419178.336 0 1040821.664 Minus
4 Lonlife Sciences Ltd. 1387000 338910.144 0 1048089.856 Minus
5 Jayashree Electron 1825000 392422.272 0 1432577.728 Minus
6 Power Formers Eng. 1095000 448907.296 0 646092.704 Minus
7 Tri-o Enterprises 547500 217021.408 0 330478.592 Minus
8 Savm Electronics P. Ltd 912500 300262.496 0 612237.504 Minus
9 Prasad Mcab p Ltd. 1460000 621335.264 0 838664.736 Minus
10 Asain Power system P. Ltd 730000 466744.672 0 263255.328 Minus
11 Alok Chemicle P. Ltd. 1825000 199184.032 0 1625815.968 Minus
12 Svs Industries 547500 160536.384 0 386963.616 Minus
13 Zeutch Engineers P. Ltd 912500 160536.384 0 751963.616 Minus
14 Mithsagar Electronic P. Ltd 730000 338910.144 0 391089.856 Minus
15 Jabro Engineers 839500 544039.968 0 295460.032 Minus
16 Power Win House 912500 279452.224 0 633047.776 Minus
17 Jaldoot material and handling P. Ltd 1460000 285398.016 0 1174601.984 Minus
18 Sakshi metal and tools P. Ltd 1533000 350801.728 0 1182198.272 Minus
19 Jayashree Electricle P. Ltd 1460000 246750.368 0 1213249.632 Minus
20 Frontline Electronics 1460000 246750.368 0 1213249.632 Minus
21 Deairj Tech India 1095000 1000974.083 0 94025.9168 Minus
22 Mitoubhi Electricle 547500 602308.7296 54808.7296 0 Gain
23 Cpgemini 730000 183427.6832 0 546572.3168 Minus
24 Shree Industries 730000 1493582.95 763582.9504 0 Gain
25 Scope T and M Ltd 1642500 3848413.872 2205913.872 0 Gain
26 Fablectiani Engineers 255500 490527.84 235027.84 0 Gain
27 Try Engineers 912500 871058.528 0 41441.472 Minus
28 Sru Tech Engineering 255500 816951.8208 561451.8208 0 Gain
Table No. 9 - Rainwater Harvesting Potential in Electronic Zone
Sr.No. Name Of IndustryAnnual Water
use In Liters
Rain water
potential in liters
With Refer to RWH potentialRemark
AMIERJ ISSN 2278-5655 Volume–VII, Issue–II Feb – March 2018
Aarhat Multidisciplinary International Education Research Journal (AMIERJ) Page 65
EduIndex Impact Factor 5.18 UGC Approved Journal No 48178, 48818
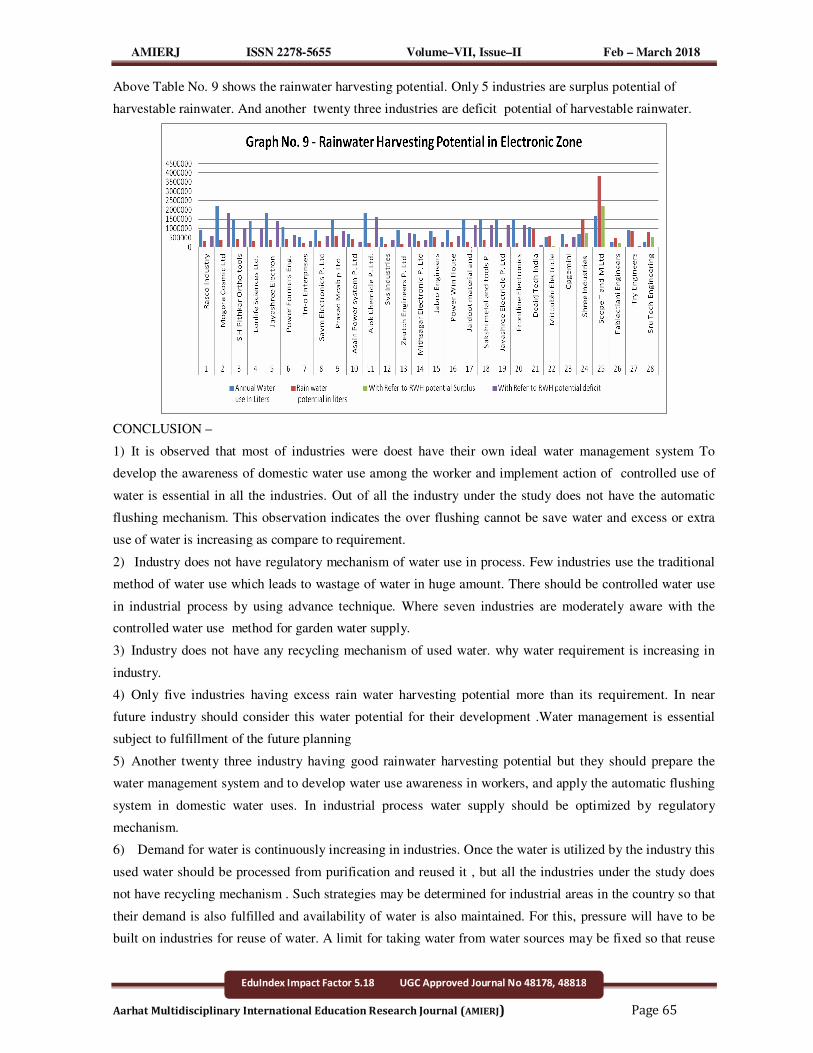
Above Table No. 9 shows the rainwater harvesting potential. Only 5 industries are surplus potential of
harvestable rainwater. And another twenty three industries are deficit potential of harvestable rainwater.
CONCLUSION –
1) It is observed that most of industries were doest have their own ideal water management system To
develop the awareness of domestic water use among the worker and implement action of controlled use of
water is essential in all the industries. Out of all the industry under the study does not have the automatic
flushing mechanism. This observation indicates the over flushing cannot be save water and excess or extra
use of water is increasing as compare to requirement.
2) Industry does not have regulatory mechanism of water use in process. Few industries use the traditional
method of water use which leads to wastage of water in huge amount. There should be controlled water use
in industrial process by using advance technique. Where seven industries are moderately aware with the
controlled water use method for garden water supply.
3) Industry does not have any recycling mechanism of used water. why water requirement is increasing in
industry.
4) Only five industries having excess rain water harvesting potential more than its requirement. In near
future industry should consider this water potential for their development .Water management is essential
subject to fulfillment of the future planning
5) Another twenty three industry having good rainwater harvesting potential but they should prepare the
water management system and to develop water use awareness in workers, and apply the automatic flushing
system in domestic water uses. In industrial process water supply should be optimized by regulatory
mechanism.
6) Demand for water is continuously increasing in industries. Once the water is utilized by the industry this
used water should be processed from purification and reused it , but all the industries under the study does
not have recycling mechanism . Such strategies may be determined for industrial areas in the country so that
their demand is also fulfilled and availability of water is also maintained. For this, pressure will have to be
built on industries for reuse of water. A limit for taking water from water sources may be fixed so that reuse

AMIERJ ISSN 2278-5655 Volume–VII, Issue–II Feb – March 2018
Aarhat Multidisciplinary International Education Research Journal (AMIERJ) Page 66
EduIndex Impact Factor 5.18 UGC Approved Journal No 48178, 48818
and recycling gain importance. Stress has to be laid on conservation of rain water. Industrial units can use
rain water in different forms. This water supply can be complementary to the traditional supply of water and
it would save water. It can also be implemented through study of water management.
Abbreviations -
1) Ltr. – Liter
2) Sqm. – Square Meter
3) Cum. – Cubic Meter
4) RWH – Rainwater Harvesting
Reference –
1) Geography of Water Resources – R.K.Gurjar ,B.C. Jat ( Rawat Publication ,Delhi)
2) General Guidelines for water audit and water conservation – Center water commission – GOV-India
2005 Rainwater harvesting and artificial recharge - CGWB- 2011
3) Integrated water recourse management Vol. I, II – CWRDM – Alliied Publishers Pvt. Ltd.
4) Water Management in India – M.Dinesh Kumar (Gyan Pub. Delhi)
5) Water Management in India - P.C. Bancil ( concept pub. Company, new Delhi) 2004.
6) Manual of rainwater harvesting and conservation By Govt. Of India, Consultancy services organization
central public works department, New Delhi. In 2002.
7) http://www.indiawaterportal.org
8) http://www.rainwaterharvesting.org
9) https://www.pcmcindia.gov.in
10) http://www.maharashtradirectory.com