rainpall derivatives for hong kong disneyland ng … · 2016-12-31 · rainpall derivatives for...
TRANSCRIPT

RAINPALL DERIVATIVES FOR HONG KONG DISNEYLAND
by
NG WING-SZE CECILIA 吳泳詩
MBA PROJECT REPORT
Presented to
The Graduate School
In Partial Fulfilment
of the requirements for the Degree of
MASTER OF BUSINESS ADMINISTRATION
FULL-TIME MBA PROGRAMME
THE CHINESE UNIVERSITY OF HONG KONG
May 2003
The Chinese University of Hong Kong holds the copyright of this project. Any person(s) intending to use a part or whole of the materials in the project in a proposed publication must seek copyright release from the Dean of the Graduate School.
3
APPROVAL
Name: Ng Wing-Sze Cecilia
Degree: Master of Business Administration
Title of Project: Rainfall Derivatives for Hong Kong Disneyland
Name of Supervisor: Yeh Jason
Signature of Supervisor: O w ^ v ^ Q ' J, ( ^ ^
d ‘ J
Date Approved:

dQTiMTiTll NgKSJ-lBRARY SYSTEMyW
ii
ABSTRACT
The fifth Walt Disney Parks and Resorts, Hong Kong Disneyland (HKDL), will be
built on Penny's Bay, Lantau Island, Hong Kong. It will feature multiple theme parks,
first-rate accommodations and bustling nighttime centers for dining, shopping and
entertainment. The park is scheduled to open in late 2005 or early 2006.
Revising on its business model and risk management program, it is surprised that
HKDL does not cope with the weather factor for cash flow stability. Precipitation risk
exposure draws attention to this study as its high frequency of occurrence in Hong
Kong. The new emergent weather risk transfer alternative — weather derivatives — is
going to be the focus of this study for HKDL to hedge against rainfall risk
The weather derivatives market is growing. HKDL needs careful analysis to get the
best utilization of this newly financial instrument. This paper is going to introduce the
possibilities, required analytical techniques and recommendations for Hong Kong
Disneyland to hedge with the rainfall derivatives.

iii
TABLE OF CONTENT
ABSTRACT ii
TABLE OF CONTENT iii
CHAPTER
1. COMPANY PROFILE 1
The Walt Disney Parks
Hong Kong Disneyland
Location 1 Park Developer & Operator 2 Financing 2 Infrastructure 3 Schedule of Operation 4
2. HONG KONG DISNEYLAND BUSINESS MODEL.... 6
Revenue Model 7
Customer Base 7
Pricing Strategy 8
Financial Performance Variable 9
Risk Management Program 10
IV
The Walt Disney Company Risk Management 10 HKDL Risk Management 13 Risk Management on Book Record 13
3. PRECIPITATION RISK EXPOSURE 15
Introduction to Precipitation 15
Distinguish between Weather and Climate 16
Rainfall Risk Exposure 16
Precipitation in Hong Kong 17
Overview 17 Rainstorm Warning System 18
Practices on Rainy Days 2 0
Theme Park Industry 20 The Ocean Park 21
Rainfall Risk Mitigation 2 1
4. WEATHER DERIVATIVES 24
Evolution 2 4
The Birth of Weather Derivatives 24 Weather Risk Management Association 24 Year 1999 25 Year 2000 25 Year 2001 26 Year 2002 26 Precipitation Derivatives 27
Market & Market Players 2 8

IV
Types of Product 3 0
Index Derivatives 30 Event-Basis Derivatives 32
5. Hedging Against Rainfall Risk with Weather Derivatives
33
Formation of Hedging Strategy 3 4
Hedging Objectives 3 4
Hedging Target 3 5
Dimension of Precipitation Impacts 3 5
Normal Revenue without Rainfall Risk 4 0
Revenue Forecasting for Year 1 41
Specifications on the Contracts 46
6. General Recommendations to HKDL for hedging with
all kinds of Rainfall Derivatives 49
Choice of Market and Counter Parties 49
Index Model Design 5 0
Dimensions of Variables & Time Scale 5 0
Accumulated Rainfall Index 51
Methodologies of Rainfall Measurements 5 4
v i
Location of Rainfall Measuring Stations 54 Measuring Instrument 56 Historical Data Consistency 58 Data Availability and Reliability 59
Choice of Strike Level 5 9
Tick Size and Maximum Payments 6 2
Pricing Approach 6 3
7. Example of Rainfall Derivatives 66
Black/Red Rainstorm Signal Call 6 6
Specifications 66 Revenue model under Different Scenario 68
8. Portfolio Management 70
Risk Management Information System 7 0
Issues on Book Keeping 71
9. CONCULSION 72
vii
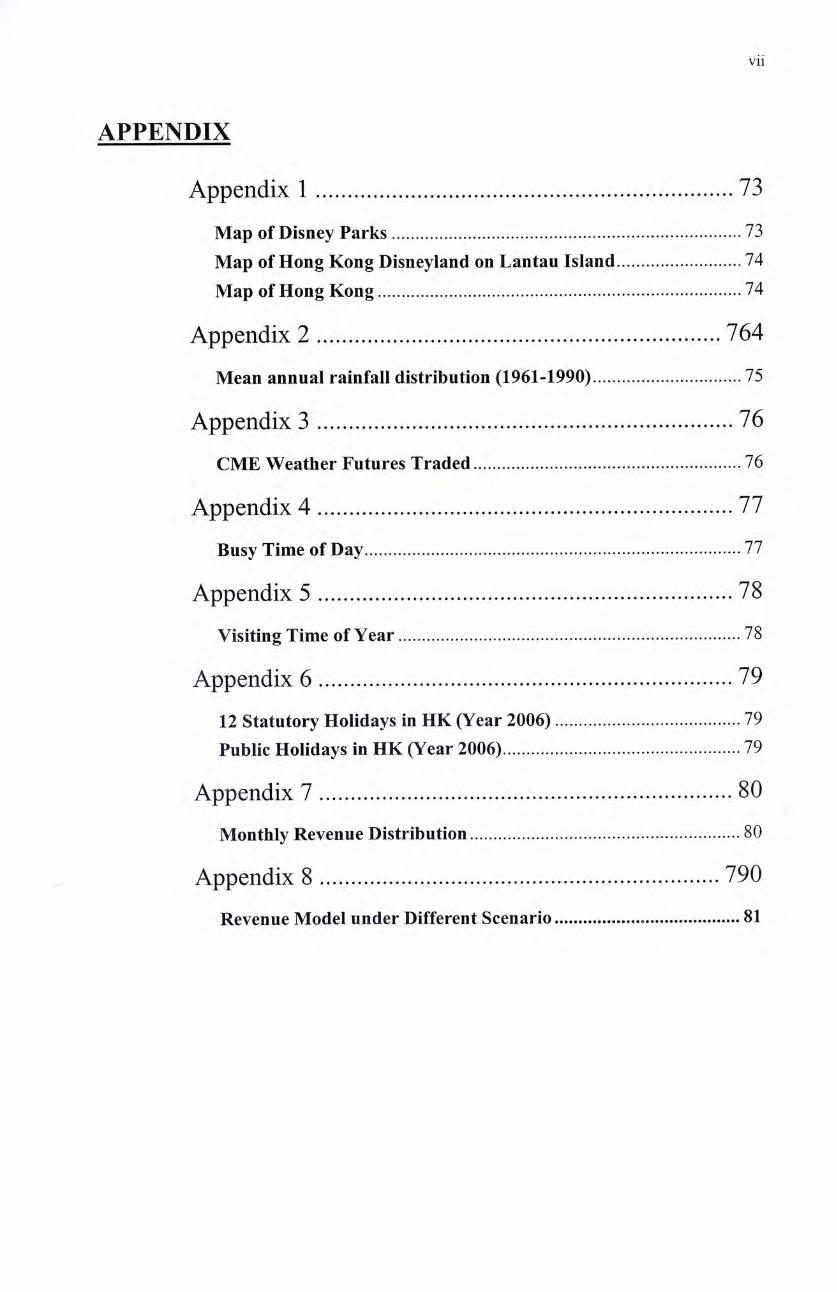
APPENDIX
Appendix 1 73
Map of Disney Parks 73 Map of Hong Kong Disneyland on Lantau Island 74 Map of Hong Kong 74
Appendix 2 764
Mean annual rainfall distribution (1961-1990) 75
Appendix 3 76
CME Weather Futures Traded 76
Appendix 4 77
Busy Time of Day 77
Appendix 5 78
Visiting Time of Year 78
Appendix 6 79
12 statutory Holidays in HK (Year 2006) 79 Public Holidays in HK (Year 2006) 79
Appendix 7 80 Monthly Revenue Distribution ."� 80
. Appendix 8 790 Revenue Model under Different Scenario 81
viii
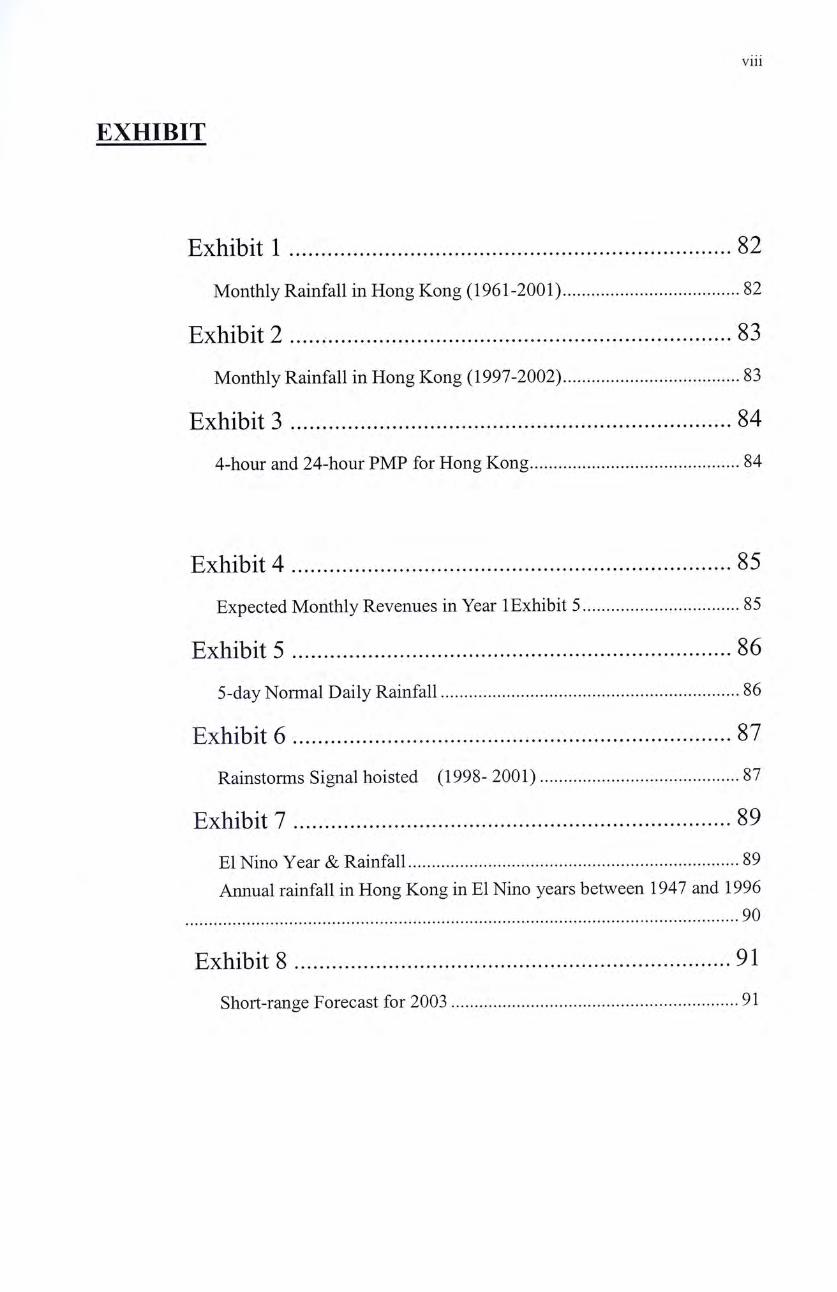
EXHIBIT
Exhibit 1 82
Monthly Rainfall in Hong Kong (1961-2001) 82
Exhibit 2 83
Monthly Rainfall in Hong Kong (1997-2002) 83
Exhibit 3 84 4-hour and 24-hour PMP for Hong Kong 84
Exhibit 4 85 Expected Monthly Revenues in Year 1 Exhibit 5 85
Exhibit 5 86 5-day Normal Daily Rainfall 86
Exhibit 6 87 Rainstorms Signal hoisted (1998- 2001) 87
Exhibit 7 89 El Nino Year & Rainfall 89
乂 Annual rainfall in Hong Kong in El Nino years between 1947 and 1996 90
Exhibit 8 91 Short-range Forecast for 2003 91

ix
BIBLIOGRAPHY
Books 92
Periodicals 92
Official Press Release 93
Websites 93
Interview 94
J
1
CHAPTER 1
COMPANY PROFILE
The Walt Disney Parks
Walt Disney Parks and Resorts currently offers four captivating destination resorts in
three countries^- the United States, Japan and France 一 each featuring multiple theme
parks, first-rate accommodations and bustling nighttime centers for dining, shopping
and entertainment. Hong Kong Disneyland will be the fifth destination.
Hong Kong Disneyland
Location J
Hong Kong Disneyland will be built on the reclaimed land at Penny's Bay on Lantau
Island^. It is scheduled to occupy about 126-hectares of the site for Phase I, and can be
expanded to 180 hectares at a future date. The park will be linked to the airport and
the rest of the city by MTR line, highway and public ferry piers.
1 Appendix 1 Map of Disney Parks 2 Appendix 1 Map of Hong Kong Disneyland
2
Park Developer & Operator
Hong Kong International Theme Parks Ltd (HKITP), a joint-venture company
between Hong Kong Special Administrative Region Government and the Walt Disney
Company, takes to built and operate Hong Kong Disneyland.
The Government will own 57% of the shares in the company initially, while Disney
will own 43% of the shares. Third party investors may be interested in investing in
HKITP in the future. This will allow the Government and Disney to sell down their
shares. However, Disney will be required to hold a minimum of (33%) 1.9 billion
shares in the project. The Government will not be subject to a minimum holding
requirement after the park's opening.
Financing
The estimated cost of building Hong Kong Disneyland is $14.1 billion. This will
comprise $8.4 billion in debt (including capitalized interest) and $5.7 billion in equity
for an optimal debt-to-equity ratio of 60:40.
Of the $5.7 billion equity, the Government will inject $3.25 billion (3.25 billion
shares @ $1 a share) and Disney will inject $2.45 billion. The debt component will
3
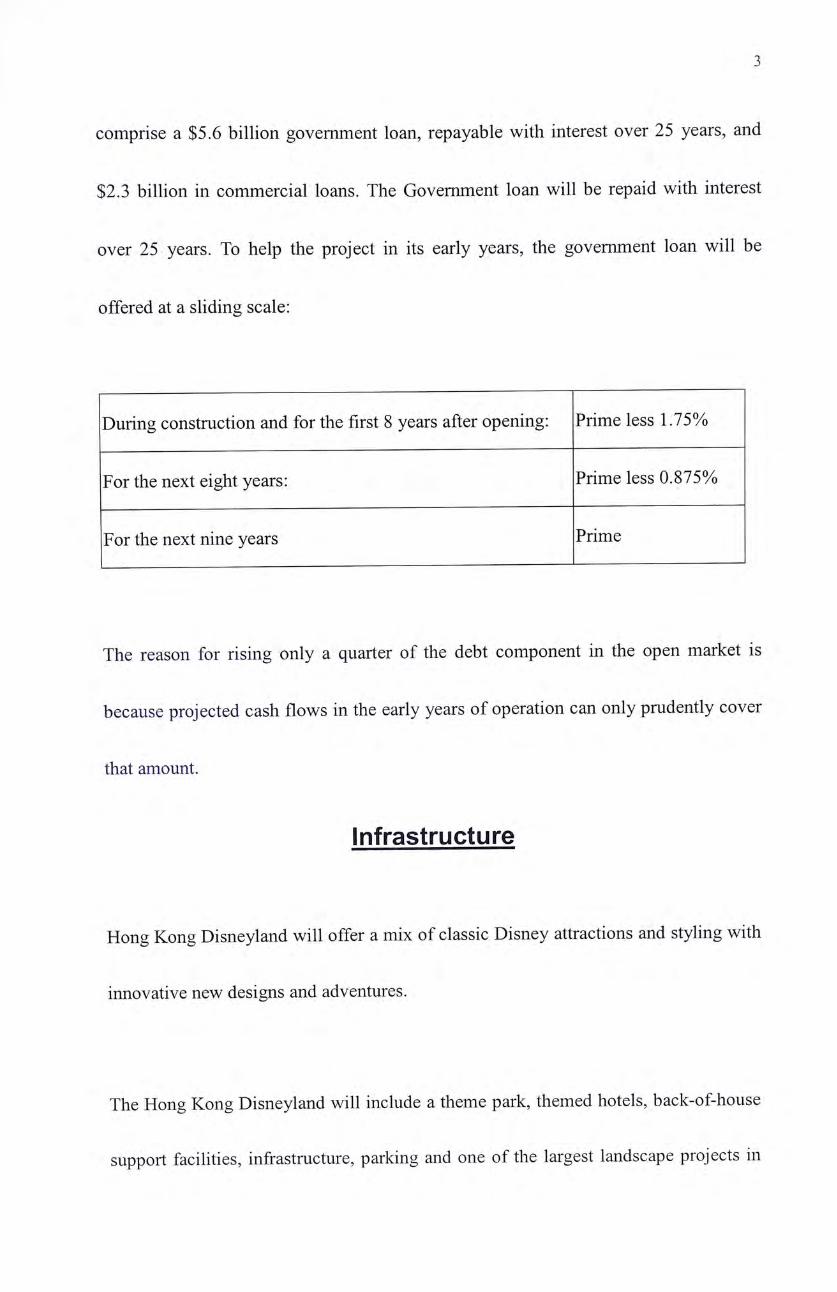
comprise a $5.6 billion government loan, repayable with interest over 25 years, and
$2.3 billion in commercial loans. The Government loan will be repaid with interest
over 25 years. To help the project in its early years, the government loan will be
offered at a sliding scale:
During construction and for the first 8 years after opening: Prime less 1.75%
For the next eight years: Prime less 0.875%
For the next nine years Prime
The reason for rising only a quarter of the debt component in the open market is
because projected cash flows in the early years of operation can only prudently cover
that amount.
Infrastructure
Hong Kong Disneyland will offer a mix of classic Disney attractions and styling with
innovative new designs and adventures.
The Hong Kong Disneyland will include a theme park, tliemed hotels, back-of-house
support facilities, infrastructure, parking and one of the largest landscape projects in
4
Hong Kong.
The Park is divided into four lands, namely: Main Street U.S.A; Adventureland;
Fantasyland; and Tomorrowland. Each of the lands has its theme and transports you to
different place and time.
The resort also will feature two hotels 一 the elegant Victorian-themed Hong Kong
Disneyland Hotel and the Art Deco-inspired Hollywood Hotel.
All the structures in the Park average less than two stories with the exception of the
Park icons like Sleeping Beauty Castle, Space Mountain and the two hotels, which
range from five to eight-story buildings, with 2100 rooms provided.
Schedule of Operation
The theme park site has officially begun construction in January 2003. It is scheduled
to open in late 2005 or early 2006 for the Phrase 1.
The operating hours still not yet announced.

5
The annual capacity in the Phrase I operation is 10 million visitors.
The Phrase II construction and operation has not yet decided at this moment.
According to Don Robison, CEO ofHKITP, spoke in U'^ Jan 2003, HKITP will only
consider the Phrase II expansion only upon meeting the full capacity, which is
expected in the year 2012.
There is an option for the Land Payment, valid for 20 years after opening (and subject
to extension in certain circumstances) to buy the Phase II site for $2.8 billion (1999
price to be adjusted in accordance with change of general price index).
6
CHAPTER 2
HONG KONG DISNEYLAND BUSINESS MODEL
Being as the world-class theme park, carrying all the strengths of the Disney, Hong
Kong Disneyland is expected to attract millions of guest per year. The attractiveness
infrastructure and excellent service and experience to visitors comprise the key
success factors to HKDL. The revenue mainly comes from the admission fee and the
guest spending in the Park. The spending in the Park includes souvenir sales, food and
beverage, and rent & service charge from the hotels.
In order to sound profitable, costs should not be neglected. There is little room for
operating expense keeping low, while maintaining good service quality and extremely
high safety level. The Promotional programs, however, can be the room. Globally
promotion favors from both HKSAR and the Walt Disneyland can release the burden
on HKITP.
7
Revenue Model
Revenue = Sales of Admission Tickets + Visitors Spending in HKDL
Unlike the Walt Disney Company, which have diversified investments, revenue of the
HKDL is solely comes from the Sales of admission tickets and Visitors Spending in
HKDL. HKITP only operates the theme Park & Resorts Businesses.
The Admission fees are generally fixed with a wide variety of tickets customized to
the many different needs and desires of customers. Annual Passport for general
publics and Group Discount tickets to travel agency are some of the admissions fees
structure.
Visitor Spending in HKDL include service charges from hotels and functional events;
and merchandise sales for the in-Park retailed stores and restaurants.
Customer Base
The Customers components consist 2 categories: Locals and Tourists, where local
visitors refer to residents in Hong Kong. The main implication to their contribution is
8
the spending pattern. Locals tends to spend less in the Park while most likely no
spending in the hotels. Tourists tend to spend more in the park while contributing
slightly lower admission revenue to HKDL due to Group tickets.
The Customers base can also distinguish by Adult and Child. The Admission Fees
have a fundamental difference. Usually the Child ticket is about 50-70% discount.
The spending pattern also different with Child and Adult, while Adult absorbed child
expenditure.
Pricing Strategy
The Hong Kong Disneyland will carry the lowest pricing among all Disneyland Parks.
For the Global Themed Parks Industry, the adult admission fee ranges from
HKD$200 - 700 currently. The admission fee for HKDL, under the preliminary
consideration in Jan 2003, will set between $200- 250 Hong Kong Dollars.
In the Mainland China, the fee for comparable parks is lower, however, still over
HKD$100 on average. Therefore, the proposed admission fee believed to be attractive
enough for incoming tourists.
9
Financial Performance Variable
Financial Performance = f {Company Strategies, Labor Relationship,
Technology,Customer Taste, Competitive Force, Economic Environment, Legal
Environment, Political & Military Environment, Adverse Weather}
This model is developed from the Walt Disney Company 2002 Annual Report,
forward-looking statement. The Company identified these variables that may affect
future performance. They also regarded the accuracy of forward-looking statements is
illustrative, but by no means exhaustive. Among the above variables, they can be
categorized into: Partially Controllable Variables and Uncontrollable Variables.
Company Strategies, Labor Relationship, Technology, Customer Taste and
Competitive Force can be defined as Partially Controllable Variables. They are
variables that HKDL can try its best effort to tackle and stabilize the financial
performance.
Economic Environment, Legal Environment, Political & Military Environment and
Adverse Weather can be defined as Uncontrollable Variables. They belong to

10
Microenvironments, and HKDL is difficult to tackle by its competitively small
attribution. Excluding Weather, all these variables are initiated by human activities
and can be “controlled,,, given that majority people in the community acts together.
This point is arguable; however, it is not going to have deep analysis in this paper.
The focus should be that: Unlike other variables, weather is uncontrollable by human
activities. There are some evidences that human activities had altered the climate,
however, they are mostly in adverse consequences and human do it unconsciously in a
lengthy time period. To tackle the adverse weather risk, people at the best, can only
make the best forecasting, and take actions to mitigate the impacts at this moment.
Risk Management Program
The Walt Disney Company Risk Management
As it has for nearly eight decades, The Walt Disney Company continues to pursue
steady earnings growth through prudent investment, effective cost management and
fiscal responsibility. This philosophy has served the company and its long-term
investors well through both difficult and prosperous times. Even under economic
softness, Disney still recorded an 8% increase in the Parks and Resorts revenue for
11
2003 first quarter, and 20 % increase in segment operating income.
The Company employs and established sets of policies and procedures to manage its
exposure to changes in interest rates, foreign currencies and the fair market value of
certain of its investments in debt and equity securities using a variety of financial
instruments.
Interest Rate Risk
The objective in managing exposure to interest rate changes is to limit the impact of
interest rate changes on earnings and cash flows and to lower overall borrowing costs.
To achieve these objectives, they primarily use interest rate swaps to manage net
exposure to interest rate changes related to the Company's portfolio of borrowings.
The Company maintains fixed rate debt as a percentage of its net debt between a
minimum and maximum percentage, which is set by policy.
Foreign Exchange Risk
The objective in managing exposure to foreign currency fluctuations is to reduce
earnings and cash flow volatility in order to allow management to focus on core
business issues and challenges.

12
Accordingly, the Company enters into various contracts that change in value as
foreign exchange rates change to protect the value of its existing foreign currency
assets, liabilities, commitments and forecasted foreign currency revenues. The
Company utilizes option strategies and forward contracts that provide for the sale of
foreign currencies to hedge probable, but not firmly committed, revenues. The
Company also uses forward contracts to hedge foreign currency assets and liabilities
in the same principal currencies. The principal currencies hedged are European euro,
British pound, Japanese yen and Canadian dollar. By policy, the Company maintains
hedge coverage between minimum and maximum percentages of its forecasted
Foreign exchange exposures generally for periods not to exceed five years. The gains
and losses on these contracts offset changes in the value of the related exposures.
Fair Market Value Risk
The Company enters into foreign currency and interest rate transactions and other
financial instruments to minimize the exposure to changes in fair market value of
certain investments in debt and equity securities. The Company does not enter into
these transactions for speculative purposes.
13
HKDL Risk Management
Hong Kong Disneyland is expected to follow about the same strategies of the Walt
Disney Company strategies on the Risk Management. As described in the previous
section, the risk management program currently employs does not cover all the
financial performance fluctuation variance, but already cover the economic
environment that can tackle by financial instruments. For the other variables, since the
measurements, which try to tackle it, are non-monetary measurable, it is embedded
into operating strategies but not clearly stated in the annual reports.
Risk Management on Book Record
Option premiums and unrealized losses on forward contracts and the accrued
differential for interest rate and cross-currency swaps to be received under the
agreements are recorded on the balance sheet as other assets. Unrealized gains on
forward contracts and the accrued differential for interest rate and cross-currency
swaps to be paid under the agreements are included in accounts payable and other
accrued liabilities. Realized gains and losses from hedges are classified in the income
14
Statement consistent with the accounting treatment of the items being hedged. The
Company accrues the differential for interest rate and cross-currency swaps to be paid
or received under the agreements as interest and exchange rates shift as adjustments to
interest expense over the lives of the swaps. Gains and losses on the termination of
effective swap agreements, prior to their original maturity, are deferred and amortized
to interest expense over the remaining term of the underlying hedged transactions.
Cash flows from hedges are classified in the Consolidated Statements of Cash Flows
under the same category as the cash flows from the related assets, liabilities or
forecasted transactions.

15
CHAPTER 3
PRECIPITATION RISK EXPOSURE
Introduction to Precipitation
Precipitation comes as rain and in several frozen forms as sleet, snow, hail and
freezing rain. The climatologically definition to Precipitation is the accumulated depth
of rain or drizzle and also the melted water content of snow or other forms of frozen
precipitation, including hail, that have fallen in the past 24 hours or since the previous
observation.
Precipitation has intrinsic nature. It is homogenously distributed, and is a localized
event, markedly discontinuous or spotty in both time and space.
16
Distinguish between Weather and Climate
Climate is what we expect, weather is what we get. “Climate” is differentiating from
"weather" simply in terms of timescale. Weather is dynamic and seemingly a constant
state of change. Observation over 1- to 10-day timescale is considered weather.
Climate is describing a longer time scale of weather, says by seasonal change, to
yearly change. Climate is much more predictable. Average and accumulations are
issues of climate rather than weather. In statistical concept, Climate is the mean state
of the atmosphere; weather is the noise about that mean.
Rainfall Risk Exposure
Following to Button J.A. (2002) definition to weather and climate risk, it is the
possibility of injury, damage, or adverse financial results as a consequence of
atmospheric events or processes at any timescale. Precipitation Risk is a pure,
non-systemic and non- diversifiable risk. This risk can neither be manipulated nor
controlled by any physical measures.
According to the Bureau of Economic Analysis, Department of Commerce (2000), the
17
weather sensitive components is the same as the GDP components in the Amusement
and recreation services industry segment. This shows that weather is directly related
to amusement park revenue. Precipitations can influence individuals' leisure activities,
which then directly affect to any amusement parks.
Among different forms of precipitation, rainfall is the most frequent occurrence in
Hong Kong and anywhere.
Precipitation in Hong Kong
Overview
The mean annual rainfall ranges from around 1300 millimeters at Waglan Island to
more than 3000 millimeters in the vicinity ofTai Mo Shm\ The mean annual rainfall,
form 1961-2001 is 2214.3mm at the Hong Kong Observatory Station. About 80
percent of the rain falls between May and September. The wettest month is August,
when rain occurs about four days out of seven and the average monthly rainfall at the
3 Appendix 2 Mean Annual Rainfall Distribution (1961-1990)
18
observatory is 391.4 millimeters. The driest month is January, when the monthly
average is only 23.4 millimeters and rain falls only about six days a month.4
Waterspouts and hailstorms occur infrequently, while snow and tornadoes are rare.
Rainstorm Warning System
The rainstorm warning system is designed to alert the public about the occurrence of
heavy rain which is likely to bring about major disruptions, and to ensure a state of
readiness within the essential services to deal with emergencies. It is independent of
other severe weather warnings such as tropical cyclone warning and landslip warning,
which will be issued separately where necessary.
According to Hong Kong Observatory, there are three levels of warning:
AMBER, RED and BLACK.
Amber Rainstorm Warning
Heavy rain has fallen or is expected to fall generally over Hong Kong, exceeding 30
4 Exhibit 1 Monthly Rainfall in Hong Kong (1961 -2001)
19
millimeters in an hour. There will be flooding in some low-lying and poorly drained
areas. Members of the public are advised to pay attention to weather changes as these
might lead to situations of Red or Black Rainstorm Warning.
Red Rainstorm Warning
Heavy rain has fallen or is expected to fall generally over Hong Kong, exceeding 50
millimeters in an hour, and is likely to continue. There are likely to be serious road
flooding and traffic congestion, people who have to travel should carefully consider
weather and road conditions, and avoid easily flooded areas.
Black Rainstorm Warning
Very heavy rain has fallen or is expected to fall generally over Hong Kong, exceeding
70 millimeters in an hour, and is likely to continue. It means that there are likely to be
serious road flooding and traffic congestion. People should stay indoors or take
shelter in a safe place until the heavy rain has passed. Under Safety and Liability
Consideration, all outdoor facilities will be closed and outdoor activities will be
suspended.

20
Practices on Rainy Days
HKDL is expected to have similar rainy days practice to the theme park industry in
the world and its benchmark competitor,the Ocean Park, in Hong Kong.
Theme Park Industry
All of the Theme Parks open on rainy days, with the exception of Water Parks that
close if there is a threat of lightning. Indoor activities and shopping in the Parks is
unaffected.
The parks promote rainy days visits by pointing out the advantages, such as shorter
lines and the attractiveness of their indoor facilities.
On the Human Resource Management aspect, the Walt Disney Parks workers are
required by contract to call their managers or schedulers when it's raining, or even
threatening to rain, and see if their shifts have been cancelled. Most cut staffing
because there will be limited capacity, plus smaller crowds on rainy days. Some
locations close altogether, and workers are called off. Those who fail to call in and

21
verify their shifts run into the risk that they will arrive to find no one there - and they
are no pay for that.
The Ocean Park
The Ocean Park will remain open from 10am to 6pm but some outdoor mechanical
rides may be suspended in rainy days and the hoisting of Red Rainstorm Warning.
If the Black Rainstorm Warning or Typhoon No. 8 Signals, which always along with
rainfall, is hoisted during the operating hours, the Park will remain open with limited
operations. Guests in the Ocean Park are recommended to stay in in-door area. If the
signal is in effect prior to the opening of the Park, the Park will delay opening for 2
hours after the signal is lowered with limited operations.
Rainfall Risk Mitigation
Rainfall probably causes injury, damage to property, or adverse financial results.
General and traditional rainfall risk management covers actions taken both before (ex
22
ante) and after (ex post) the risk occurs. Examples of ex ante strategies includes
modification in infrastructure design and ticket structure. Indoor facilities and
entrainments with cover lining areas are provided. All-round-year admission passport
and advanced booking tickets at discounts are provided. Business diversification is
another risk mitigation strategy. These can be both ex ante and ex post. The focus of
the business can change if prolonged rainfall for the year occurs, and the business can
be diversified into other sector like broadcasting Disney Cartoons which currently
under the control of the Disney Company. Another ex ante is simply absorbed the
reduction in revenue and quoted in the Annual Report, as an extraordinary event.
An insurance contract is a well-established part of mainstream risk management
culture and the risk has been prudently mitigated. The coverage of weather-related
risk is usually with built-in nature. Historically, the case with weather exposure will
form a part of a general "fire and flied perils' policy. The Ocean Park had received a
payment of recoveries from insurance company related to claims for loss of revenue
to the Park and additional costs of working expenses as a result of the effects of
Typhoon HELEN in August 1995.5 catastrophic bond is available in the market.
The Cat Bonds are high-yield corporate bonds whose payments depend on the
5 Ocean Park Hong Kong, Annual Report, 1995

23
occurrence of a natural catastrophe such as a hurricane or earthquake. Insurance
against weather events with high frequency of occurrence, like rainfall, is rare and
always at a very high premium.
The new emergent weather risk transfer alternative comes as weather derivatives. It
provides a lower cost but covers frequent event occurrence protections.
24
CHAPTER 4
WEATHER DERIVATIVES Evolution
The Birth of Weather Derivatives
The first users of weather derivatives, back in 1997, were US energy companies
looking to hedge against the risk of below-average winter temperatures, and the
resultant drop in demand for electricity or heating gas. As the US begins to open its
energy sector to competition, companies are finding it increasingly hard to pass costs
on to consumers, and therefore need to manage the Volume Risk of, say, generating
capacity going unused, or the costs of having to store surplus heating oil.
Weather Risk Management Association
Weather Risk Management Association, founded in 1999 by some of the leading
companies in the industry, is the international trade organization dedicated to

25
promoting the industry both to those within it and to end-users. Today, the association
is comprised of over 70 weather risk management companies from around the world.
WRMA promotes the industry by initiating surveys, advocating the standardization of
contracts and other documentation used for transactions and sponsoring forums and
conferences around the world for members to meet and discuss a range of topics such
as international markets, data collection issues and tax and legal matters.
Year 1999
In 1999, the Chicago Mercantile Exchange (“CME,,)launched the first public
exchange-traded, temperature-related weather derivatives. Winter season heating
degree-day (HDD) and summer season cooling degree-day (CDD)^ futures are traded
on the CME for ten U.S. cities.
Year 2000
In 2000 the overall number of contracts rose by 115% from the previous year. Asia
experienced growth of 957% of year 1999- seeing almost as much overall activity as
6 HDD is how much the average of the daily high temperature and low temperature is less than a reference temperature. Similarly, CDD is that greater than the reference temperature.
26
in Europe. It is also significant that the number of products and the range of industries
showing an interest in weather derivatives are growing.
A combined precipitation and temperature deal for the agriculture industry is outlined
in this issue, and the review of the Asian market shows that many of the deals now
being struck are outside the traditional arena for this market - energy 一 in such areas
as leisure, retail and beverages.
Year 2001
In December 2001 the London International Financial Futures Exchange (LIFFE)
began offering weather futures indexed to average temperature in Berlin, London and
Paris.
Year 2002
A recent survey compiled by Weather Risk Management Association (WRMA) and
PricewaterhouseCoopers shows that the number of weather transactions grew 43
percent from April 1,2001, to March 31, 2002, with 3,937 transactions that had a total
value of $4.3 billion, which is a 72 percent increase over the year before. ^
7 Appendix 3 CME Weather Futures Traded

27
According to the WRMA's recent survey, more transactions are now outside the
United States. The European market recorded a total of 765 contracts with a total
notional value of more than $601 million, compared with 172 contracts worth a total
of more than $49 million. The Australian market is also growing. In the 2001 survey,
Australia record six contracts worth more than $2 million. This year, there have been
15 contracts worth more than $25 million.
In May 2002, the CME announced that Wolverine Trading, L.P. ("Wolverine") would
serve as a Lead Market Maker in the CME's weather futures contracts.
Precipitation Derivatives
Weather derivatives using rain as an index usually refer to the accumulated rainfall
over the period of a contract, e.g. the total number of inches of rainfall measured over
the life of the contract.
In 2000, the Sacramento Municipal Utility District (SMUD, 2000) executed the first
well-published US precipitation contract. It was a collar contract. SMUD has proved
28
to be successfully hedge.
In 2001, a German electric utility, Elektrizitatswerk Dahlenburg, executed the first
European rainfall-indexed weather contract.
Some more other precipitation contracts may have been concluded but may not have
been published due to confidentiality issues.
Market & Market Players
Over-the-counter (OTC) market is the primary market. Two parties can transact in
privacy and need not make their transactions public. OTC market allows buyer and
seller to construct a derivative of their choice.
The primary customer for weather derivatives has been the utility company in the
U.S., but there is a push to expand to target customers in the agricultural arena, as
well as to other weather-sensitive industries.
Key players-including Aquila, Dynegy, and Reliant-have left while other companies,
especially investment banking and reinsurance companies, continue to enter the
29
market. These new entrants are offering different types of contracts to better meet the
needs of those outside the energy industry.
It is looking forward to deal with the problem of the Liquidity of the derivatives to
enlarging the market.
The only buyers of this risk have traditionally been insurance and reinsurance
companies. They tend to simply take risk onto their books, charge relatively high
• 8
premiums, and protect themselves by diversifying their risk portfolios. Frank Caifa,
associate director new markets at Swiss Re in New York, says that reinsurers typically
write protection for events over two or three standard deviations from the mean, with
a less than a 1% chance of the insured loss occurring. According to Manos Cito^, head
of product and business development at US inter-dealer broker Prebon Yamane, based
in New Jersey, the re-insurers are starting to trade nearer the mean. He accused the
problem to the currently insufficient deal flow to allow reinsurers to build up large
enough trading books.
8 From Mark Nicholls Reports, Winter Warms Weather Traders 9 From Mark Nicholls Reports, Winter Warms Weather Traders
30
Types of Product
Index Derivatives
There are four common types of Index derivatives used in the weather risk
management market. Payments are keyed to the difference between the index and the
strike level.
Swaps
Swaps are contracts where two parties agree to exchange their risk. This will produce
a more stable cash flow when the weather conditions are volatile. In simple terms one
party agrees to pay the other if the index settles above a certain level while the other
agrees to pay if the index settles below that level.
Swaps usually have no premium and provide protection from adverse weather in
return for giving up some of the upside of a favorable season.
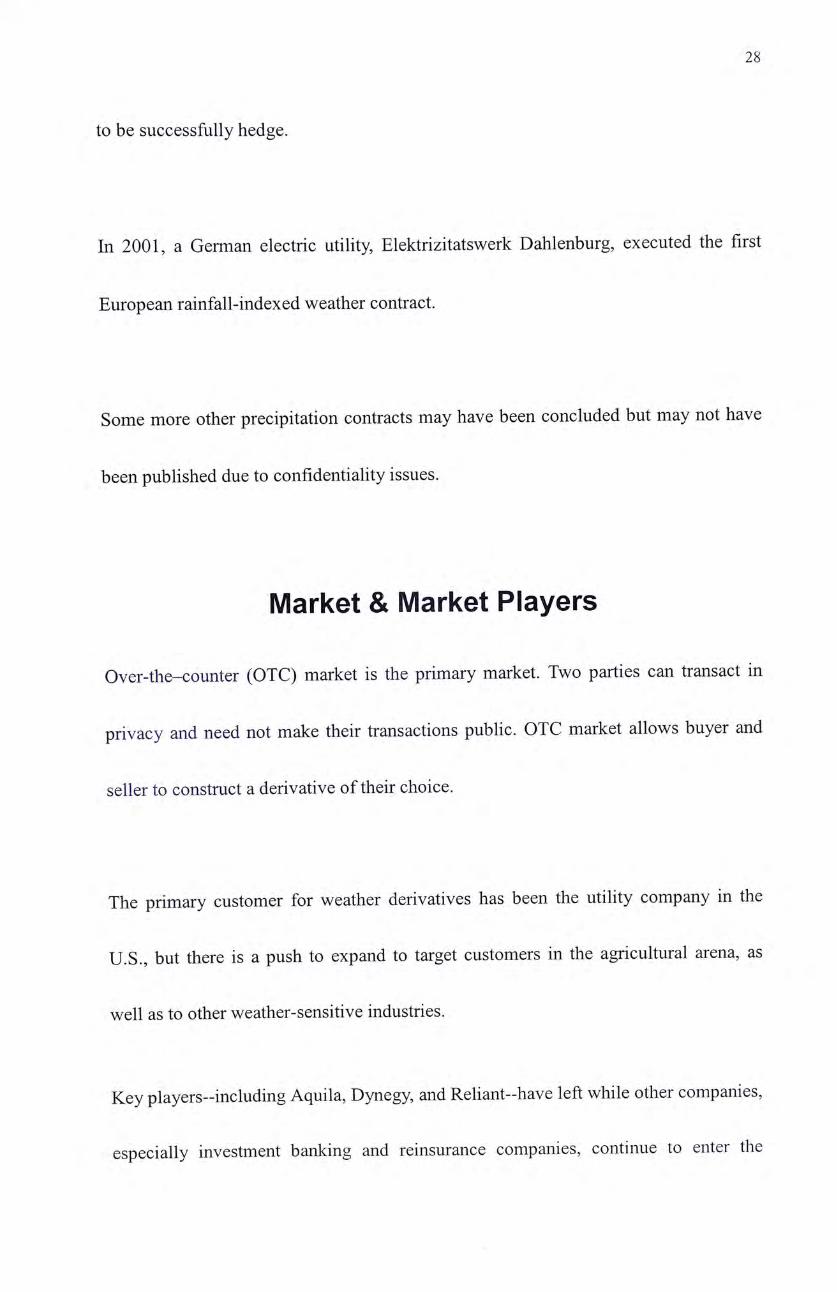
Collars
A collar is similar to a swap in that
/ protection against adverse weather is | /
a / /
provided in return for giving up some of the / 谢jke strike underlter value
31
returns generated in favorable conditions.
The difference to a Swap is that the payments to and from the parties takes place
outside an upper and lower level. This allows revenues to fluctuate within a "normal"
range of weather conditions, but protects either party against extreme weather. Collars
will often include a premium for one of the parties.
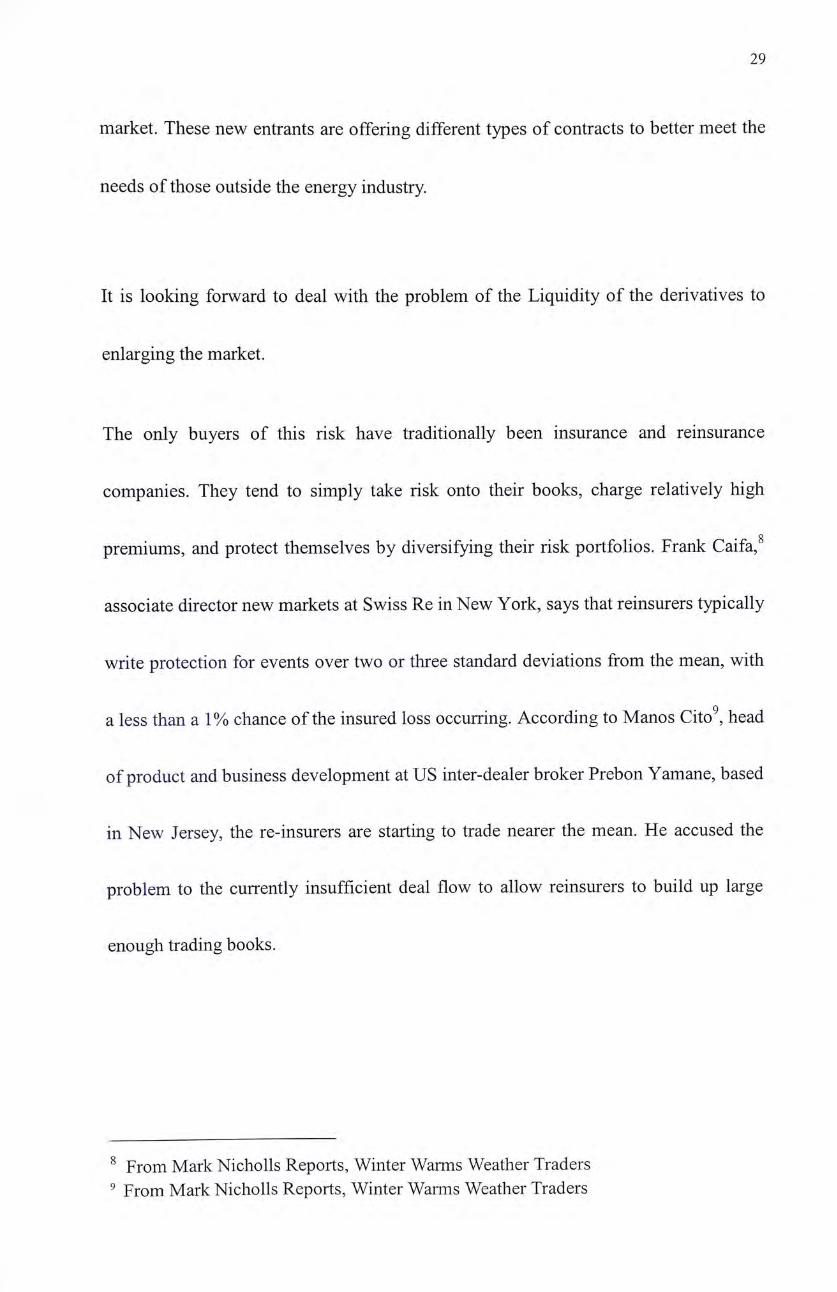
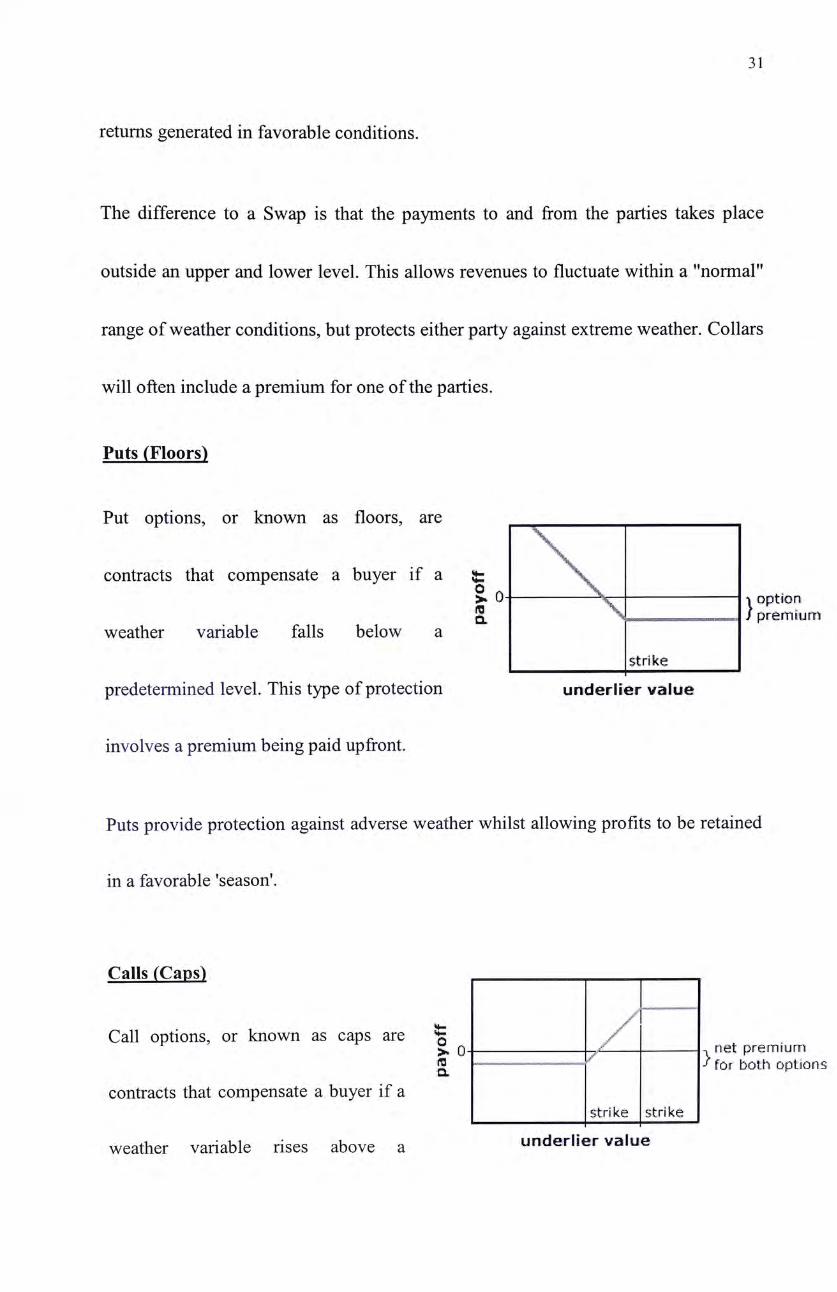
Puts (Floors)
Put options, or known as floors, are
contracts that compensate a buyer if a fc \ > 0 ^ option S 、 ! / premium
weather variable falls below a strike
predetermined level. This type of protection underlier value
involves a premium being paid upfront.
Puts provide protection against adverse weather whilst allowing profits to be retained
in a favorable 'season'.
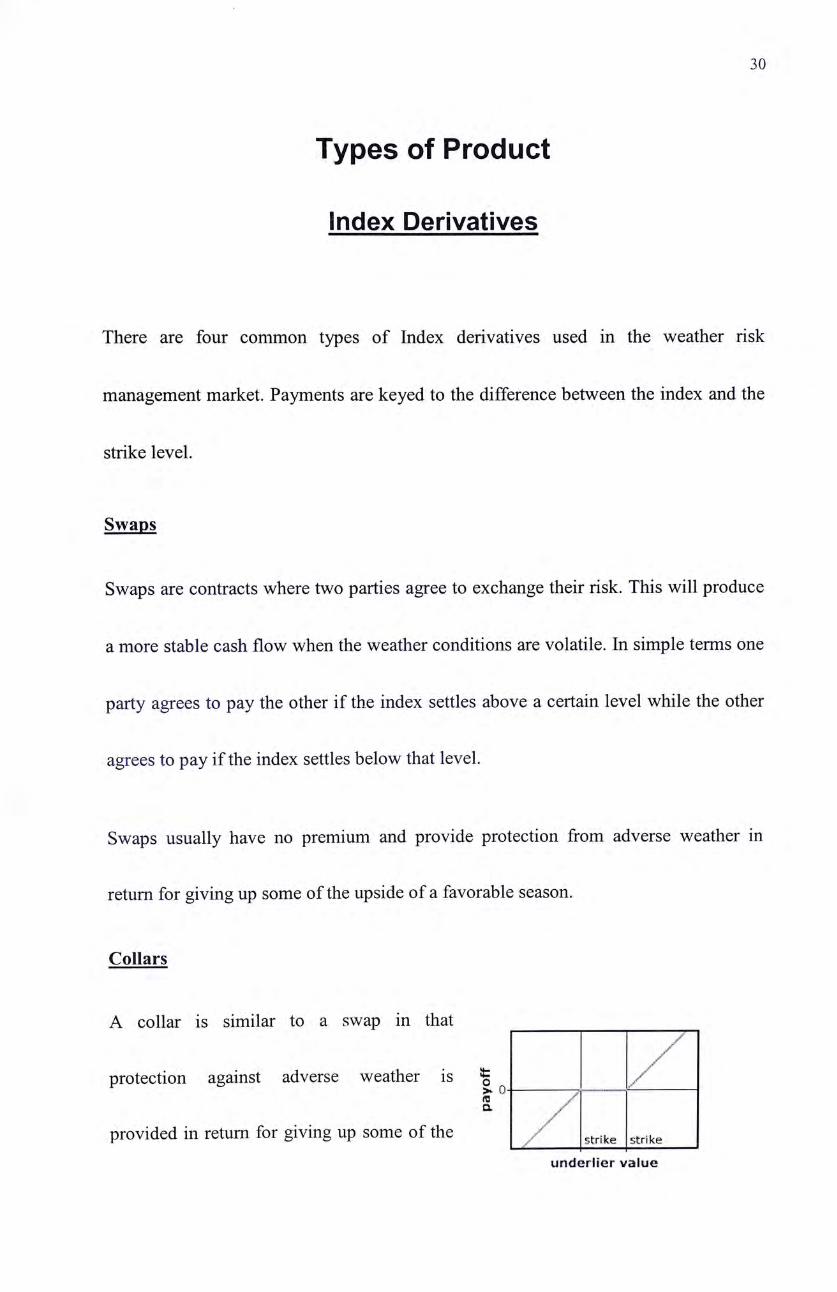
Calls (Caps)
Call options, or known as caps are % ‘ > 0 飞 net premEum
/ 欣 both options contracts that compensate a buyer if a
strike strike I I ' weather variable rises above a underlrer value

32
predetermined level. This type of contract involves an upfront premium.
Calls provide protection against adverse weather in the same way that puts do, still
allowing for increased profits in a favorable period. In the weather derivative market,
Calls always have a maximum payoff limit, something like Bull Spread Call Strategy.
It is a hybrid of financial instrument and insurance product.
Event-Basis Derivatives
Digital / Binary Derivative
If the weather event occurs, say rainfall on particular day, the full payment amount is
provided to the hedger; while no occurrence, no payment. The key variables that
determine the premium for the contract are the payment amount and the probability of
payoff. Precipitation events, say hosting of the Black Rainstorm Warning Signal, is an
example. It is simply like the traditional insurance.
Critical -day contract
Payments will be provided if the number of events exceeds a predetermined strike
level. For example,the event is 50mm of cumulative rainfall between 07:00 - 12:00
hours; cap strike level is 5 times a year.
33
CHAPTER 5
Hedging Against Rainfall Risk with Weather Derivatives
With the knowledge of rainfall risk exposure, Hong Kong Disneyland should consider
the risk level and hedging against it.
As discuss in Chapter 3, the modification in business models is essential to HKDL.
Any business should consider all scenarios of operating difficulties and try to
eliminating or mitigating to the lowest level of the adverse outcomes. Buying
insurance is likely unavoidable for theme parks. Insurance normally exclude the
frequent occurrence events coverage. Though exists, the premium is unacceptably
high, and the expected payoff would far below the premium paid. More importantly,
there are constrains - “proof of loss", of claim to be legitimately payable would
present a practical problem for weather risk management. According to Arditti R
Lcai,io about 50% hedge is worse than not hedge.
10 From John Hull, Fundamentals of Futures and Options Markets, ed., Prentice-Hall, 2002
34
As mentioned, the rainfall risk is describing the probabilities of injury, damage, or
adverse financial results. The injury and damage is somewhat measurable impacts,
which can be hedge with built-in insurance contracts, whilst the adverse financial
results from rainfall should best hedge with weather derivatives.
By appropriate formation of weather derivatives hedging strategies and accurate risk
evaluation, HKDL can bear a low cost to get the greatest protections.
Formation of Hedging Strategy
Formation of HKDL hedging strategies against rainfall risk will be investigated under
the sequence of determining the hedging objectives and target, determining and
evaluating the each hedging alternative, and finally discuss the weather derivatives
portfolio management.
Hedging Objectives
Recalling the Objectives of Risk Management Programs carrying out in the Walt
Disneyland Company, it is simply to limit the impact of the risk exposure on earnings
35
and cash flows. It does not enter into the financial instrument transactions for
speculative purposes.
For HKDL ‘s weather risk management, the topic of rainfall risk should follow the
same objective. The objective should be:
"Prudent investment with the most efficient protections against rainfall impacts
on revenue,,.
Hedging Target
Come after the objective settled, the hedging target is to maintain the stability of cash
inflows under different dimensions of rainfall pattern.
Dimension of Precipitation Impacts
• Accumulated Rainfall
參 Number of days of Rainfall in terms of severity
參 Rainfall Duration Hours
• Rainfall at Specific Time Slots
36
Accumulated Rainfall
Accumulated Rainfall shows the aggregate impact to HKDL over a period of time.
For the year with high total rainfall in Hong Kong, the motivations for tourists
traveling here would become lower.
For a high monthly-accumulated rainfall, the impact to local visitors is most obvious.
They may plan and take some other indoor activities.
For a high daily rainfall, the impact is varied by school and public holidays; weekends;
and normal weekdays.
There can be also other intervals for accounting the rainfall impacts, like 5-day
interval.
Probable Maximum Precipitation (PMP)
PMP is the greatest amount of rain that can possibly fall in a given duration over an
area of given size according to hydrometeorological principles. Hong Kong
Disneyland and associated Disney themed hotel, retail, dining and entertainment
developments will occupy about 1.26 square km of the site for Phrase 1. According to

37
the PMP data! ,the rainfall is inversely proportional to the area. That means within 4
hours and 24 hours, HKDL may receive over 490mm and 1250mm respectively.
HKDL would thus face sufficient risk in these dimension of measuring the rainfall
impacts.
Number of days of Rainfall in terms of severity
Different severity of rainfall has various degrees of impacts.
Slightly rain, say between 0.1mm-25mm daily, may have much lower impact to
revenue than heavier one. Moreover, in terms of spending pattern, slightly rain may
have positive correlation to HKDL revenue. Since the tourists and locals may well
plan for the visiting, slightly rainfall may not in a strong essence in turning down the
plan. Rather, they may spend more in the Park due to avoiding wet rides and outdoor
activities. Restaurant and souvenirs shops will benefits from slightly rainfall.
Medium rainfall, say between 25-50mm daily, may start to have negative correlation
to the revenue. The plan of visiting may turn down due to avoiding less entertainment
11 Exhibit 3 4-hour and 24-hour PMP for Hong Kong
38
can enjoy in the rainy day.
Heavy rainfall, say above 50mm daily, may have much more adverse impacts to
HKDL. The turning down of visiting plan not only due to less entertainment can enjoy,
but also the inconvenience for traveling anywhere, especially outdoor activities.
With 70mm per hour rainfall, Black Rainstorm Warning Signal will hoist. The Black
Rainstorm Warning Signal hoisting is the most adverse rainfall risk exposure to
HKDL. Under the signal hoisted, all the facilities in HKDL Park have to suspend,
while just occupant in the hotels is unaffected. The spending and admission fees
received are nearly zero, even though the signal turns down within the operating hours.
The Red Rainstorm Warning Signal hoisting (hourly rainfall excess 50mm) also
greatly affects the attendance. Although the HKDL will not be forced to close, there
are also recommendations from the HKSAR and the traveling agency to visitors for
delay or canceling the visiting schedule on that day.
Rainfall Duration
Short duration of rain may not have significant impacts to HKDL, in contrast, it may
positive impacts on the spending in shops and restaurant as the same reason as slightly
39
rain.
For a longer rain duration hours, the impacts may be significant. Visitors may
terminate, shorten, or delay the visit to avoid wet days. For consecutive rainy days,
locals will not plan to go to HKDL under the wet weather risk even the rainfall is not
heavy. Also tourists may delay the schedule of visiting HKDL on rainy days and for
consecutive rainy days, the visiting schedule may have to cancel due to the short stay
in Hong Kong.
Rainfall at Specific Time Slots
Raining in different time slots can have different degrees of impact to HKDL. From
1
the experience of Disneyland , the people in the park will reach the perk level after
11am. Near to the closing time is the perk hour for the people in shops.
Raining in the morning hours of the day, potential visitors may decide to cancel the
visiting schedule. Given that it starts raining during the operating hours, the revenue
from spending in food and beverages may increase, as visitors willing spend in the
12 Appendix 4 Busy Time of Day
40
restaurant instead of get wet for outgoing activities. Rainfall in the late afternoon, say
4 pm onwards, the adverse impact is insignificant. Rather, the rainfall may promote
the visitors for early shopping and thus revenues from retail increase.
Raining in weekdays and weekends also contribute various degrees of impacts to
HKDL. From the experience of Disneyland, Tuesday, Wednesday and Thursday are
the least busy days. Weekends can be twice as busy as weekdays. Long public
holidays and School holidays can be 3 times as busy.
Normal Revenue without Rainfall Risk
The Normal Revenue without rainfall risk is a fundamental factor to determine
whether to hedge or not. If the loss of rainfall is relatively small proportion to the
revenue, then HKDL should not spend attention and take actions on it.
Since the HKDL has not yet operated,normal revenue can be only retrieved by
estimation from the HKITP. Upon the operation, all the figures should be updated
again on a regular basis for appropriate hedging.
41
Revenue Forecasting for Year 1
Attendance Rate (Ni &N;r、Forecast
The attendance rate of HKDL in its first year of operation is estimated at 5.2
million. 13 It is estimated that Hong Kong Disney will attract 3.4 million incoming
tourists in Year 1, of those, 1.4 million will be 'new' or 'additional' tourists induced to
visit Hong Kong because of the Disney theme park. The expected number of annual
local Visitor and the expected number of annual Tourist Visitor respectively are
E(NaL)=l,800,000
E(NaT) = 3,400,000
Admission Fees (P) Forecast
The admission fees, under the preliminary consideration in Jan 2003, will set between
$200- $250 Hong Kong Dollars. As discuss before, the adult and child tickets would
be different and there may have some discounts under certain circumstance.
13 HKSAR press release, November 2, 1999
42
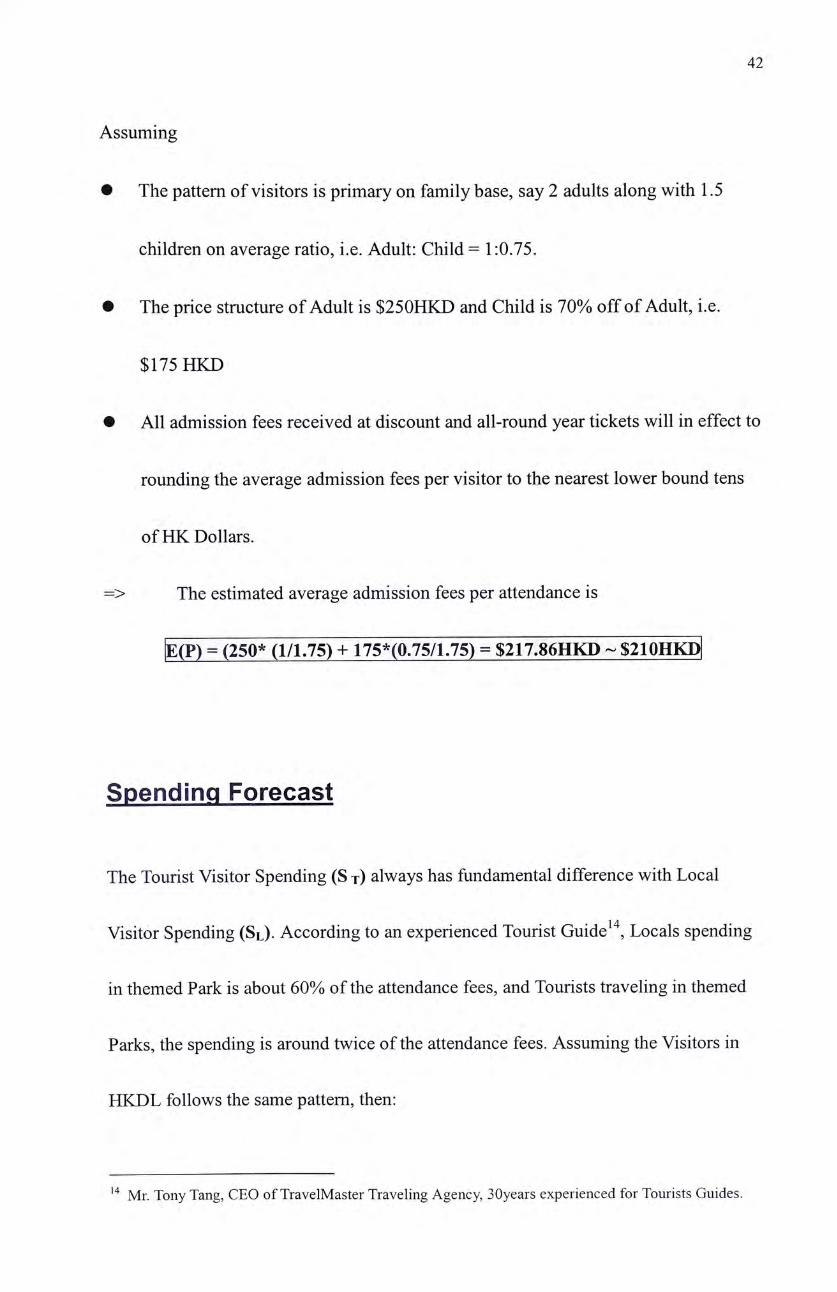
Assuming
• The pattern of visitors is primary on family base, say 2 adults along with 1.5
children on average ratio, i.e. Adult: Child = 1:0.75.
參 The price structure of Adult is $250HKD and Child is 70% off of Adult, i.e.
$175 HKD
• All admission fees received at discount and all-round year tickets will in effect to
rounding the average admission fees per visitor to the nearest lower bound tens
of HK Dollars.
=> The estimated average admission fees per attendance is
E(P) = (250* (1/1.75) + 175*(0.75/1.75) = $217,86HKD � $ 2 1 0 H K D
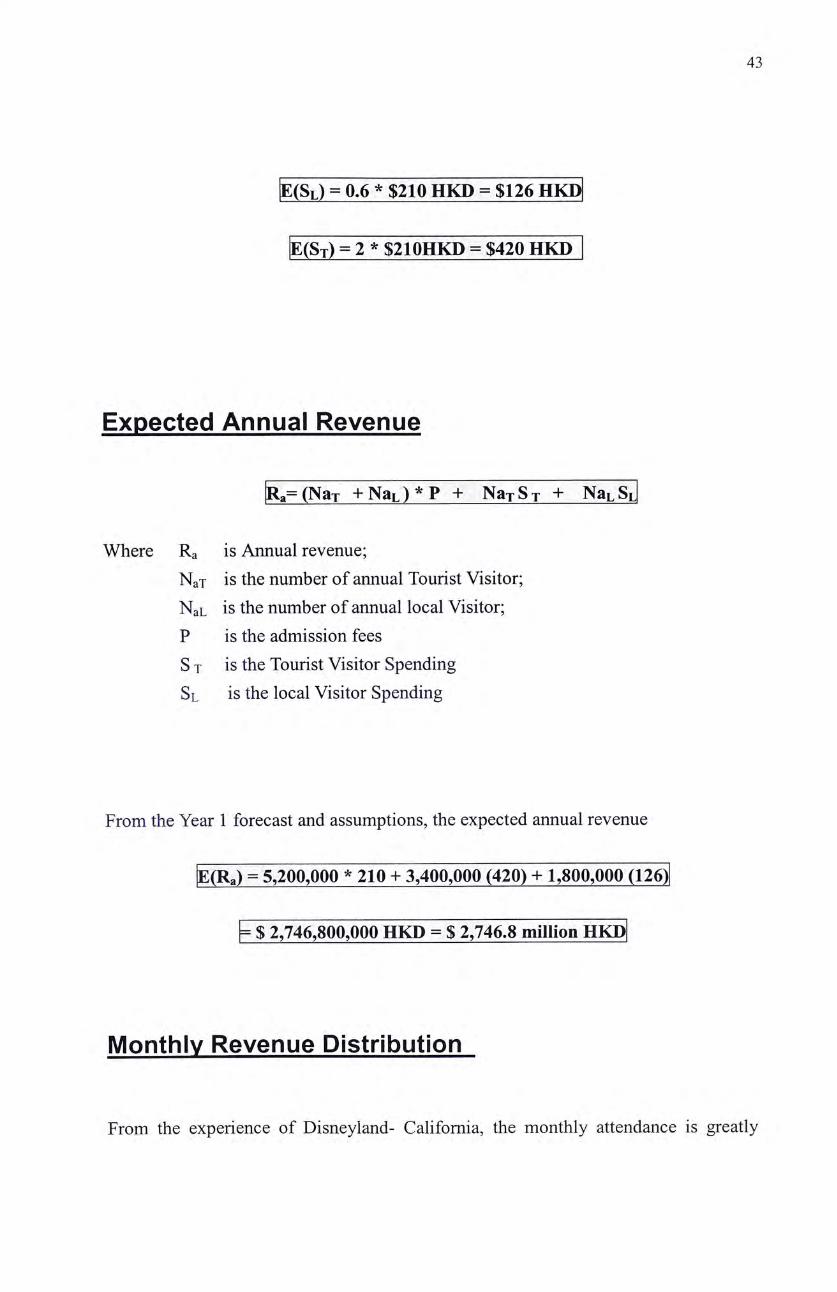
Spending Forecast
The Tourist Visitor Spending (S j) always has fundamental difference with Local
Visitor Spending (SL). According to an experienced Tourist G u i d e L o c a l s spending
in themed Park is about 60% of the attendance fees, and Tourists traveling in themed
Parks, the spending is around twice of the attendance fees. Assuming the Visitors in
HKDL follows the same pattern, then:
14 Mr. Tony Tang, CEO of TravelMaster Traveling Agency, 30years experienced for Tourists Guides.
43
E(SL) = 0,6 * $210 HKD = $126
E(ST) = 2 * $210HKD = $420 HKlT
Expected Annual Revenue
Ra= (NaT + N a L ) * P + N h t S t + Nhl sZ
Where Ra is Annual revenue;
NaT is the number of annual Tourist Visitor; NaL is the number of annual local Visitor; P is the admission fees S t is the Tourist Visitor Spending Sl is the local Visitor Spending
From the Year 1 forecast and assumptions, the expected annual revenue
E(Ra) = 5,200,000 * 210 + 3,400,000 (420) + 1,800,000 (126)
= $ 2,746,800,000 HKD = $ 2,746.8 million m ^
Monthly Revenue Distribution
From the experience of Disneyland- California, the monthly attendance is greatly

44
affected by Holidays and festivals in U S � 5 The attendance of HKDL is also expected
to vary by month. The locals visiting patterns is expected to follow the HK public
holidays, weekends and summer holidays. While the tourists visiting pattern is
expected to follow the historical pattern of Tourist Arrival to HK.
— R M = ( N T + N L ) * P + N T S T + N L S J T
Where Rm is Monthly revenue;
Nt is the number of monthly Tourist Visitor; Nl is the number of monthly local Visitor; P is the admission fees
S t is the Tourist Visitor Spending Sl is the local Visitor Spending
Local Visitors Monthly Distribution
The Local Visitor in Month i (Vu) is fraction of the year's total Local Visitors (VLa).
= Vta * VlZT
Where VIn define as Local Visitor Month Index
15 Appendix 5 Time of year to visit

45
From the experience of Disneyland, public holidays and school holidays can be 3
times as busy as usual and the weekends can be twice as the weekdays. Therefore,
Local Visitors Monthly Index (VILI) is the Month i Rating (Rti) over the total rating
in the year (Rta)
Rti= 3ph + 2wii + 3sh + wd
VLLI=Rti/Rta
16 17
Ratings of the public holidays (ph), weekends (wn), the summer holidays (sh),
and "normal" weekdays (wd) are 3, 2, 3, 1 respectively. In order to eliminate the
multicollinearity problem, the number of weekends has excluded the public holidays,
and the summer holidays eliminate all weekends and public holidays effect when
rating ‘ Tourist Visitors Monthly Distribution
The monthly distribution of Tourist Arrival to Hong Kong uses as the proxy to
forecast the monthly distribution of Tourists Visitors to HKDL.
According to the Census & Statistics Department, HKSAR, the 30% of the arrivals
16 Appendix 6 Statutory & Public Holidays in HK
口 Mid-July and August, schoolwork load is trace, and students usually back to school partially. Assume whole month of July to be summer holiday by considering motivations to HKDL.
46
are only short stay, or for transfer plane purpose. In analysis of the tourist Visitors
Monthly Distribution, the monthly distribution of Tourists distribution by purpose is
assumed to be constant over the year.
1H Expected Monthly Revenue in Year 1
Specifications on the Contracts
The content of the contract should be specified under the standard formatting. For
weather derivatives, the buyer, HKDL, should receive a standard International Swap
Derivatives Association Inc (ISDA) contract. The Specifications should contain:
• The transaction type
• Examples: Put/ Call/ Swap/ Collar/
• Nature of the contract
• Examples: Europe/ American/ Asian/
參 Contract Period
• 3 months/ 6 months/
• Index Model
18 Exhibit 4 Expected Monthly Revenue in Year 1 Appendix 7 Monthly Revenue Distribution
47
• Examples: Monthly-accumulated rainfall/ 5-day accumulated rainfall/
Monthly number of days with daily rainfall greater than 25mm/
• Calculation dates
• Examples: Every of month to end of the month/ every date between 1-5,
5-10, etc/ raining time between 00:00 to 10:00/
參 Weather stations
• Examples: The HKO headquarter/ Penny's Bay/weighted average between
several selected stations/
• Measuring instruments
• Examples: Autographic Tipping-bucket rain-gauge/ Autographic
Tilting-siphon rain-gauge/
• Rounding Formula
• Examples: Round to nearest mm/ to the nearest upper bound mm/
• Strike Points
• Examples: Accumulated monthly 380mm rainfall/ 5 days rainfall greater
than 25mm/
• Notional (tick size) amount
• Examples: $5,000 HKD pay every 1mm over strike/ $30,000 pay per
number of days excess 5 days with >25 mm rainfall/
48
參 Maximum payoff amount
• Examples: Max p a y o f f : $300,000 HKD/
參 Premium charged
• Examples: $10,000 per contract/
參 Settlement of the contract
• Examples: Settle at the exercise date/ Any period of time during the contract
period/ 2 days after the event happened
• Restrictions on Traded
• Examples: Allowed free trading/ Not negotiable/
49
CHAPTER 6
General Recommendations to HKDL for hedging with all kinds
of Rainfall Derivatives
Choice of Market and Counter Parties
There are Weather Derivatives market trading in CME and LIFFE. Most of the
contracts are temperature-related. The critical issue is that the data for calculating the
index is source from US and Europe, which is irrelevant to HKDL, as weather has
localized nature.
The tailor made contract is most appropriate for HKDL to hedge with rainfall risk.
Over-the-counter (OTC) market is the best and only choice for HKDL. The OTC
market allows HKDL and seller to construct a derivative of their choice.
Well-known investment banks and reinsurance companies with worthy credibility
50
should be the choice. HKDL should ensure that the counter party would be presented,
willing and able to pay what is due.
The counter party should best have experience in weather derivatives trading such that
the process of contract designs between the two parties can be shorten and smoothen
and comes out a reasonable premium and payoff for the contract.
Index Model Design
Dimensions of Variables & Time Scale
Though HKDL suffers from rainfall risk at various dimensions with different degrees
of impact, the index model of the derivatives should not be complex and including all
factors within a contract.
It is convenience for buying one type of contract that covers the risk at all dimensions.
However, this will result in lack of liquidity and flexibility. Since the contract is
tailor-made to HKDL, a comprehensive index modeling may only sounds interest to
HKDL but not other parties. First drawback is that HKDL may face difficulties in
51
finding a suitable underwriter. Secondly, there could exist a liquidity problem. While
the Index model is built from the belief of rainfall impacts to HKDL, given that the
sense of contribution at various dimension changed, the contract has already be fixed,
and HKDL had no means for prefect hedge.
Therefore, HKDL would better design several different types of contract to hedge the
rainfall risk under different dimension of measuring rainfall risk, i.e. The Index
should contains only one variable.
The Time Scale of the Index should not be too long or too short.
Accumulated Rainfall Index
The annual accumulated rainfall is not the best choice. The adverse impacts of the
high annual rainfall can be mitigated by other means. The opportunity cost of using
derivatives may be high.
Daily rainfall never is the choice. Its impact is instant, potential visitors may simply
delay the visit. The revenue may just shift to another day only. HKDL is difficult to

52
decide when it should exercise the American options, or has to frequently buy
European contracts.
On the monthly basis, it may be the choice for European Options. HKDL just can
exercise the options within the month and realize the profit immediately. For the
American options, the Contract Period can be one year, and if any month have
monthly accumulated rainfall over the predetermine strike in that specific month,
HKDL can exercise the options. The period covered is not too long or too short. It can
significantly reflect the rainfall adverse impacts.
As mentioned in Chapter 5, Time slots can be one of the dimensions to account for the
risk. The weekday/weekend and holidays can significantly affect visiting plan. The
accumulated rainfall in 5-day period^^ would more effectively for the index of
American Options. For any consecutive 5 days, they would include at least Friday,
Saturday, or Sunday. It also probably includes the holidays. American options can
decide the exercise date within the contract period. Since the potential revenue drops
is the determinant of the strike point and tick size, in contrast, rainfall is its
underlining variables. HKDL can decide whether to exercise the options after
19 Exhibit 5 5-day Normal Daily Rainfall
53
reviewing the actual impacts on revenue. Given that the revenue do not drop
significantly under the rainy days, say between Tuesday to Saturday, HKDL do not
need to exercise the options immediately while there may still have coming perk
visiting date, say Sunday. The 5-day period have this advantage over 7-day periods
that 7-day period do not have room for HKDL to designed once the perk days past.
Critical-day Index
For the critical-day Index, number of the events occurs is the variables. For HKDL,
the Index can be the number of days the Black/Red Rainstorm Signals hoists. This
should be on annual basis as the annual occurrence rate is not high. If the time scale
drops down to monthly basis, it is quite not economic effective. From the historical
data20, the annual number of Black/Red Rainstorm Signals hoisted is below ten with
spread between Aprils to October. HKAL should best hedge with this Index in annual
basis.
HKDL can also employ the number of days with rainfall over 25mm. Choosing
25mm as the reference level because lower than that the impacts is insignificant,
20 Exhibit 6 Rainstorms Signal hoisted (1998-2001)
54
1
while over than that, the days per month is not high historically. The highest month
is August with 4.7 days, given the index level is 25mm or more daily. This already
provided sufficient protection to HKDL. For this kind of Index, it should be on
monthly base. HKDL is allowed to buy the contract on monthly basis with different
strike level reflecting to the historical phenomenon.
Methodologies of Rainfall Measurements
Location of Rainfall Measuring Stations^^
The first rainfall station was set up in 1906 in the police compound at Tai Po. The fact
that the annual rainfall totals at this station differed as much as 20% from those
recorded at the Observatory suggested a considerable spatial variation in the rainfall
over Hong Kong and, as a result, other outstations were set up at the Botanical Garden,
Matilda Hospital and at various reservoirs in the 1910's. By 1938, the number of
rainfall stations reached 21. By 1958, the rain-gauge network was expanded to 80
stations.
21 Exhibit 1 Monthly Rainfall in Hong Kong (1961-2001) 22 From Hong Kong Observatory, Rainfall Measurements and Hydrometeorology in Hong Kong,
http: //www. we ather. gov. hk/ws ervic e/tsheet/rfhydro. htm

55
Currently the Observatory operates about 80 rainfall stations in the territory. Except
for the Observatory Headquarters and meteorological stations manned by Observatory
staff, voluntary observers, building contractors and engineering consultants, carry out
manual rainfall observations.
Since existing outstations exclude Penny's Bay, where the Theme Park located,
HKDL should suggest the Hong Kong Observatory set one there. Penny's Bay
metrological station would both critical to Hong Kong Weather Reporting System as
well as HKDL's rainfall options calculation. Since Penney's Bay is close to the airport,
and weather information would serve for aviation weather report too.
There is a geographical basis risk of rainfall measuring because of the variance of
rainfall distribution. The mean annual rainfall ranges from around 800 millimeters at
to more than 3000 millimeters^^. Too many rainfall reporting station may result in
basis risk, while concentrate on one, say Penney's Bay, may not representative
enough for visiting decision-making.
For HKDL to design the rainfall derivatives contract, the Rainfall Measuring Station
23 Appendix 2 Mean annual rainfall distribution (1961-1990)
56
can either simply choose HKO alone, which the historical data and all rainfall
statistical analysis are based from the collection of this station. Alternatively, the
choice can be the combination average of Penny's Bay Station and HKO Station.
Measuring Instrument
Several types of rain gauges are in officially used in HKO.
> Ordinary rain-gauge
• It is read manually using a measuring cylinder.
> Monthly gauge
• Similar to an ordinary gauge except that it has a larger collecting chamber.
> Autographic Tilting-siphon rain-gauge
• The recording chart on an autographic rain-gauge is mounted on a drum
which is driven by clockwork and typically rotates round a vertical axis
once per day.
> Autographic Tipping-bucket rain-gauge
• The rainwater in a collector displaces a float so that a marking pen attached
to the float makes a continuous trace on the paper. The two buckets in a rest
57
on a pivot so that when one bucket has received 0.5 mm of rain it tips by
gravity, empties the rainwater and allows the other bucket to start collection.
During the tip, an electrical switch is closed and triggers a nearby
autographic recorder.
Over 20 rain gauges of the HKO are now using Autographic Tipping-bucket rain
gauge with microprocessor technology to telemeter the electrical signals. This
automation allows rainfall observations to be reported almost instantaneously, greatly
facilitating the operation of the rainstorm and flood warnings as well as increasing the
amount of data available for hydrometeorological analysis.
The Geotechnical Engineering Office also operates a network of remote rain-gauges.
Rainfall information in various parts of Hong Kong is shown on a video terminal and
a graphic display unit at the Central Forecasting Office of the Observatory.
The calculation of the index for the HKDL rainfall contract should employs the same
measuring instrument as HKO station as the published historical data are collected
from HKO station.
58
Historical Data Consistency^'*
Rainfall observation in Hong Kong started as early as 1853. The Royal Engineers
made the observations until 1862, after which these were carried out in the
Government Civil Hospital and the Army Medical Department. Following the Hong
Kong Observatory establishment in 1883, it took over the responsibilities for rainfall
measurements. Hourly rainfall data are available from 1884 up to the present time.
Because of the Second World War, publication of observations was suspended from
1940 to 1946. During the period of Japanese occupation, Observatory staff
imprisoned in various camps had carried out rainfall observations. The original
records written on cigarette packets and scrap pieces of paper, though fragmentary,
are still available. After the War, rainfall measurements resumed at the Observatory
and at various reservoirs operated by the Waterworks Office (now the Water Supplies
Department).
With the efforts of HKO, it is assumed that the discontinuity, recording errors,
consistency and any other potential basis have been modified in a scientific ways.
24 From Hong Kong Observatory, Rainfall Measurements and Hydrometeorology in Hong Kong, http ://w WW. weather, gov.hk/ws ervice/tsheet/rfhydro. htm
59
Data Availability and Reliability
The available historical database is quite large and lengthy. However, since it is from
different authorities with different measuring instruments, stations and standard over
time, measuring basis risk exist.
The official rainfall data and statistics published by Hong Kong Observatory starts
from 196125, and details in rainfall update every hours. There are also rainfall
forecasts for as short as the coming hour to as long as the year forecast. All the
historical rainfall data and statistic available are collected at Hong Kong Observatory
Station. For simplicity convincible sake, HKDL should employ these data for
evaluating the Strike points and tick size.
Choice of Strike Level
For a low strike level, say lower than the expected normal precipitation level, HKDL
can highly protected against rainfall risk on revenue fluctuation. The draw back is a
Appendix 2, Exhibit 1 &2, for more please visit the HKO website: http://www.weather.gov.hk/contente.htm

60
high premium for the derivatives. HKDL should evaluate their tolerance level that
they can absorb to the particular risk. By adding a certain risk loading to the forecast
point, such that increasing the strike level of the derivatives, HKDL may pay lower
premium, still with effective hedging effects.
By looking at the rainfall means of 1961-2001, it is significant lower than the rainfall
means of 1997-2001. However, the standard derivation between these 6 years is quite
large, comparable to its mean.^^ This suggests that the variability of rainfall pattern is
significant.
Historical data shows that in the El Nino year, the rainfall in Hong Kong would
probably increase. Out of the 10 wettest years in the past 50 years, 7 (70 %) of them
coincided with the existence of El Nino events. Out of the 17 El Nino years between
1947 and 1996, there is more precipitation in 13 (76%) of them]?. The standard
deviation of the El Nino year rainfall is 319.8mm with the mean of the 50 years.
Therefore, while the year HKDL wants to hedge with rainfall derivatives is expected
to be El Nino year, the expected rainfall should adjust with 319.8mm rainfall
26 Exhibit 2 Monthly Rainfall in Hong Kong (1997-2002) 27 Exhibit 7 El Nino Year & Rainfall

61
increment.
Therefore, it comes solution to determine a suitable strike level as followed:
Strike = Expected rainfall + a ^Standard Derivatives,where a is the coefficient
St = E(Rr) + a (7
Expected Rainfall = Mean rainfall (1961to current) + El Nino Adjustment
Here suggested applying the mean rainfall of 1961- current as the sample mean, but
using the most recent 5 years data as the sample data to calculate the standard
derivation.
a should choose positive, say 0.5, to increase the strike level while within the
tolerance level.
In addition to this method of forecasting, every year, HKO will have a short-range
climate forecast published.^^ The probability of above the normal annual rainfall can
give a glance to determine the hedging amount.
28 Exhibit 8 HKO 2003 short-range Climate Forecast
62
The Choice of Strike Level for Critical-day Index type options, historical mean can
apply. The chosen index most likely with low annually occurrence. For example, the
mean annual number of Black & Red Rainstorm hoisted is only 6.8 times. The total
number of days with rainfall over 25mm daily is only 25.3.
Tick Size and Maximum Payments
The tick size comes from the expected amount of loss from the risk. A great tick size
will have a high up-front cost, and will be approaching to speculations characteristics,
violating the hedging objective. The encounter loss from hedging may even higher
than the loss from the rainfall. A low notional amount would not provide adequate
protection upon adverse rainfall events occurs.
Economic Loss for one day of hoisting the Black/Red Rainstorm Signal should
calculate from the expected Profit in that month divided by the number of days in that
month. The Profit is calculated from the expected revenue times the profit margin.
The Profit Margin for the Walt Disney Company is 9.5%^^ Since the HKDL decided
29 2002 Annual Report, Revenue is $25,329mil ; Cost & Expense is $22,924 mil
63
to employ low pricing strategy, the estimated profit margin for HKDL is 7%.
Expected Economic Loss for one day Black Rainstorm Signal hoisted in August 2005
二 $292, 593,237 HKD *7%/31
�$660 ,700 HKD
Therefore, for an August Critical-day Options, with index using the number
Black/Red Rainstorm Signal hoisted in the month, the tick size should be $660,000
per signal hoisted.
Maximum payments may arise from the request of the writer. Maximum payments
can ensure the writer to have the ability to set off the contract. With the existence of
upper bound payment, the premium charge is usually lower. For call Options with
upper bound payments, it is simply like Bull Spread.
Pricing Approach
Index-based pricing approaches are those methods that attempt to estimate the
distribution of the settlement index, from detrended historical index values. Bum
analysis, that looking at the past performance of the contract are most open employ
64
pricing strategies in weather derivatives. However, the derivatives for HKDL may too
new and such analysis is not applicable.
Risk loaded price may also be useful. Premium charged Pr is based on the expected
payoff E(P) plus a fraction X of the risk loading R. For a long contract period t, the
expected payoff should also be discounted at risk-free rate r.
P r = E (P) / ( l+r ) t+ XR
The payoff is equal to the tick size times the index or the number of events occurred
over the strike level.
The expected payoff is calculated from summation of the payoff times the probability
of occurrence. According to Button, J.A., (2002), the rainfall probability usually
calculated by the gamma density and probability functions.
p ( X ) = 丄 ⑷ 〜 h a�0,?i>0 r �
Where X is the amount of rainfall;
r ( a ) 二 「 少 “ — •0

65
The Normal Distribution functions, Log normal distributions can also apply.
The loading can be measured from the standard derivation of the portfolio payoff with
and without the contract. Another possible way to measure the risk loading is using
Value-at-Risk (VAR) techniques, the difference between two quantiles such as the
median and the 5% quantile.
66
CHAPTER 7
Example of Rainfall Derivatives
Straightly follows the rainfall risk hedging strategies, here comes to the
implementation of designing appropriate rainfall derivatives for HKDL. The Utility of
the derivatives is under investigated. Here for an example:
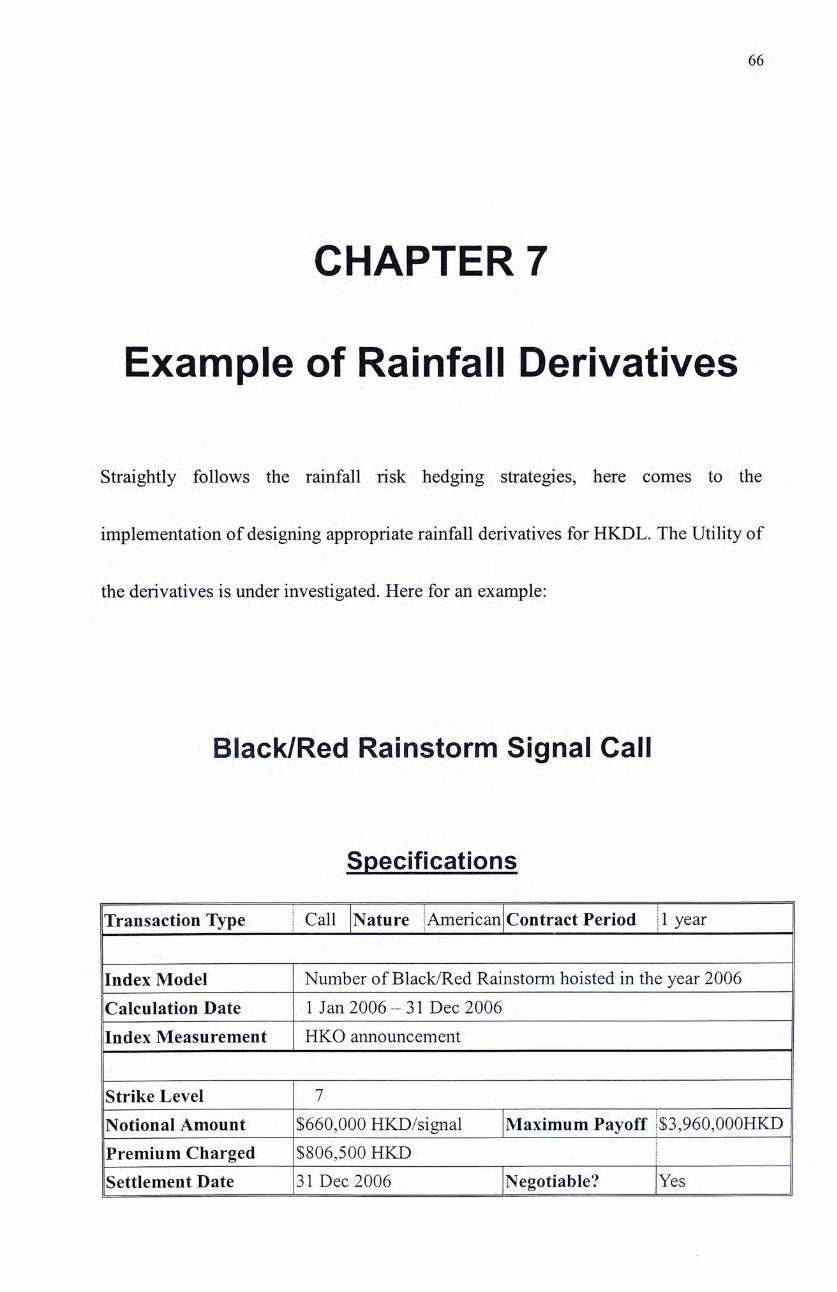
Black/Red Rainstorm Signal Call
Specifications
Transaction Type | Call Nature |American Contract Period 11 year
Index Model Number of Black/Red Rainstorm hoisted in the year 2006 Calculation Date 1 Jan 2006 一 31 Dec 2006 Index Measurement HKO announcement
Strike Level 7 Notional Amount $660,000 HKD/signal |Maximum Payoff |$3,960,000Hk5~ Premium Charged $806,500 HKD Settlement Date 31 Dec 2006 Negotiable? Yes

67
• Mean of annual Signals hoisted = 6.8 = � S t r i k e = 1
• Expected Economic Loss for one day Black Rainstorm Signal hoisted in August
2006 = $292, 593,237 HKD *7%/31 �$660,700 HKD
• Use August as the reference as the signals most likely occurs in August and
the loss in August is the greatest
O Round down to $660,000 HKD as the tick size (Notional Amount)
• The probability for over 13 signals is low (mean + 2 a ) , in order to purchase the
calls at a low price while effectively hedge the risk, maximum payoff set at this
level.
• Expected payoff = 8 ^ 12 p(Ni) = 600,952 ; o = 3.11*660,000 - 20,552,600
• The data source from 1998-2002
• Premium = 600,952 + 0.01*20,552,600 = 806,478 � $ 8 0 6 , 5 0 0 HKD
• Expected Profit without Rainstorms risk
=Expected Annual Revenue*0.07
=$2,746,800,000*0.07
=$192,276,000
參 Expected Loss per Rainstorm Signal hoisted
68
=Expected Annual Revenue * Estimated Profit Margin
/ contract period
=192,276,000*0.07/360
=$534,100 HKD
• Expected Annual Revenue use since the signal most likely spread over the
year.
• 360 days is used instead of 365 as to comprise the US accounting standard.
Revenue model under Different Scenario
Appendix 8 shows the revenue pattern under different scenario:
參 The number of Black/Red Rainstorms Signals hoisted in 2006
• Revenue without Rainstorms risk
參 Revenue with Rainstorms risk
• Revenue with Rainstorms risk, has been hedged with Calls
On the same graph, it shows the payoff profile of the Calls as well

69
70
CHAPTERS
Portfolio Management
Risk Management Information System
In the achievement of excellence in Rainfall Risk Management, Hong Kong
Disneyland needs well-designed software and an intuitive graphical user interface to
eliminate repetitive, time-consuming and cumbersome tasks while streamlining
workflow for optimum performance and ease of operation.
Hong Kong Disneyland should, therefore, better employ a vendor with diverse
backgrounds and multinational exposures of RMIS to manage the investment.
By careful choice of vendor, HKDL can achieve measurable results from using RMIS
software to improve their performance in risk management, make better policy
decisions, and control risk-financing cost.
71
Issues on Book Keeping
Realized gains and losses from hedges are classified in the income statement
consistent with the accounting treatment of the items being hedged, extraordinary
Profit & Loss. Gains and losses on the termination of effective swap agreements, prior
to their original maturity,are deferred and amortized to Extraordinary Expense over
the remaining term of the underlying hedged transactions. Cash flows from hedges are
classified in the Consolidated Statements of Cash Flows under the same category as
the cash flows from the related assets, liabilities or forecasted transactions.
72
CHAPTER 10
CONCULSION
The Rainfall risk can significantly affect the cash flow stability of Hong Kong
Disneyland. In order to perfectly hedge such risk exposure, an appropriate hedging
strategy along with crystal clear objective and target are needed.
The choice of dimension of the precipitation impacts and the magnitude of the
adverse impacts on such dimension should then be investigated. Following a good
choice of market and counterparties, it can facilitate the utilization and reduce the
credit risk. An excellent contract design and management of the portfolio allow Hong
Kong Disneyland to perfectly hedging against the risk.
It is with great expectation that Hong Kong Disneyland will able to hedge against
rainfall risk and able to use the similar techniques on dealing with other weather risk
exposures with the newly powerful risk transfer instruments — weather derivatives.
73
APPENDIX
Appendix 1
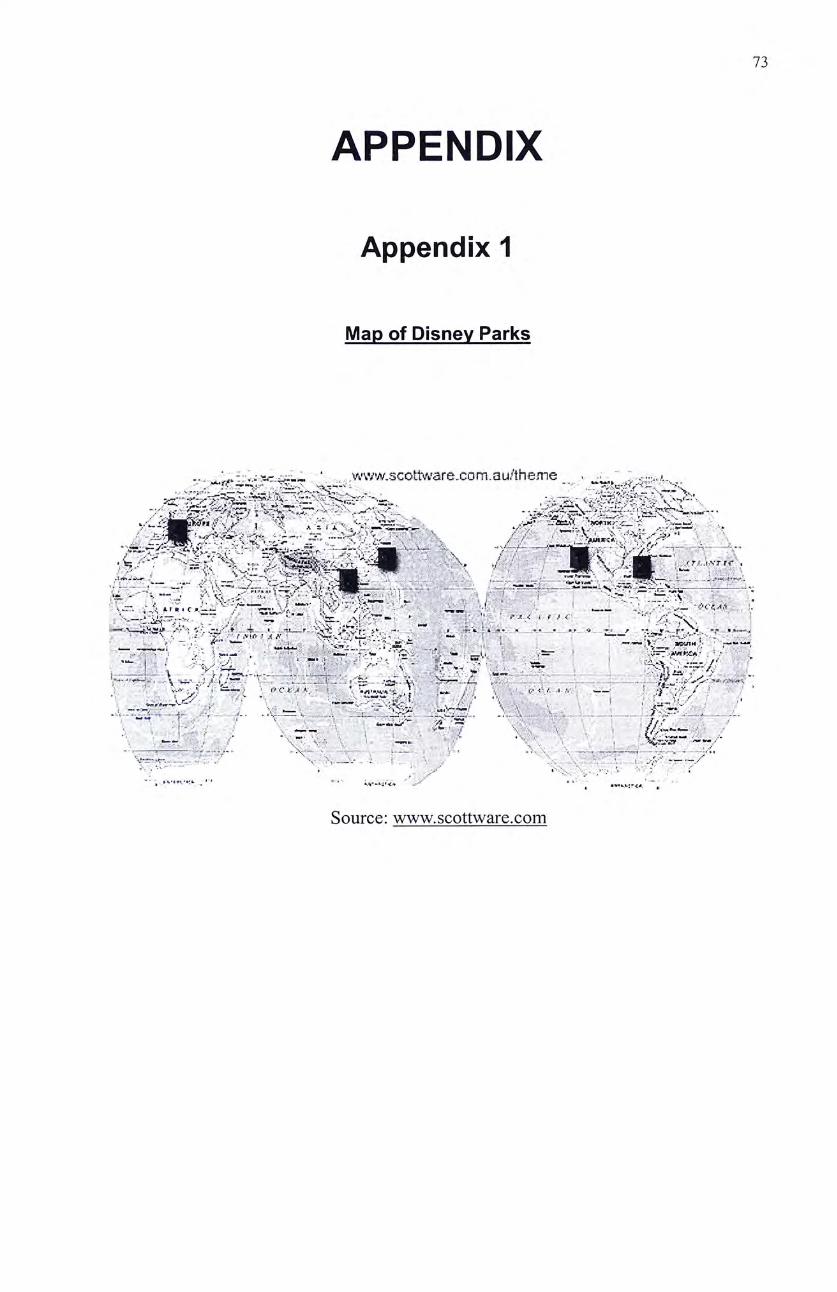
Map of Disney Parks
--• ::,、• „. vAvw.scottv/arexom.ou/theme ‘ “二 " ;. . �
變 : 鬆 镇 》 ; 邏 缝 辨 t ” y j ® � 办 々 ^ ^ ‘ ? 卿 … : " 、 、 ” 、’ / ^ ^辦 i 〜、< 八兴 > ” ^ 乂
. 支 一 . , > 、 乂 气 — 二 " 、 • 产 > ;,》 ‘ ’ 、 . .
?二 C , S i 、 ™ ‘;< . - 一 - 心 “ 广 - , 一 ;•
^ , • > . t J MHUUM J , ? ^^^ ^ , ‘ ‘ . * 、'‘ • % V—» / - 、 , ,* ‘ J J «r « , \ ’ • 、‘',‘广'^uft- 4 “, ‘? ; V. , . » . S 一, 、' , KM r ‘ ,‘',’/'', t^ . i < L • ^ < . .i /, ? V
, f j / ( V"么•:。/,:〈、;•:•,4:' > • � � V \ I 广 、 ” ^ ‘ . , ! - f i ^ t i ^ ^ ^ /
‘ 、、‘ ‘ “ " 、 “ \、, 、 < < ^ • J •、> "A a im > ‘ ,v ‘ 、“ 、" <, X V -WXA ‘ ‘ ‘ ‘ » < -:-.• -• >v ..々 ...."/•n»iW/W<X.-.V/;vW»:i)W»:0»»W»>«-««<"f',: “ A 0» , ^ ''>«»» , r- V 、 S , , V / . - V 、 、 > '''''''々,, "> f ,广严 ^— — /
:':‘•、• • ’ : ,、, •、’:•>.:•',,.‘ ’‘ :‘ < …、• • ‘ ,、’ • .v/•' 、.〜..•
Source: www.scottware.com
74
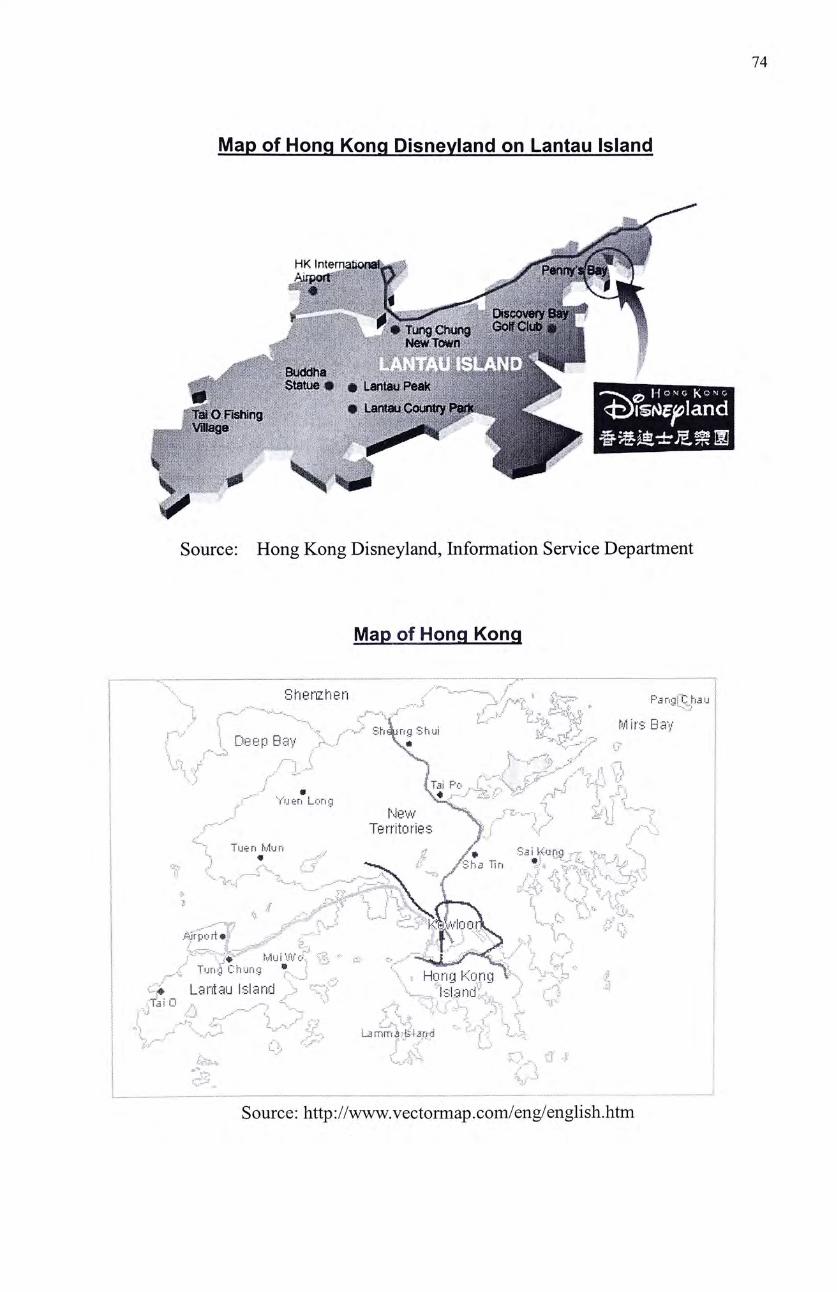
Map of Hong Kong Disneyland on Lantau Island
Source: Hong Kong Disneyland, Information Service Department
Map of Hong Kong
;: — •“—f I Shenzhen / , : Pan. chaul i ......,,,, , , ‘ \ I .,“J s… — “ _ s B a y I : / - 1 � D e e p 8av , ‘ ‘ , | 冬 \ .广.、丄:、 / 5>:;, ,.vxv 1 :: ..-.:..、 ./'' / 、... :: "•: .•“ 'vs'j. /.:."; ••‘ …… \ \ \ •• / -A ;•� ._�. ^ .; ... >..••�.< . / • • … j ^ >.v/ ? < :••• $ .,.v.,v/ ij ...•••... . .y 乂:: i. ;:
i " I , , , \ \ / ; T^f h ‘ I \ r Yuer! Long - ‘ \ \ S New X ‘ ‘ \ r"" ' ' Territorie | ‘ \ Tu«rgMun , S5!kunq i ^ ^ ^ ./'ShJ Tir. ^ ‘ 姜
I \ , , . , , i i kfetooX. ‘ i • MurVo ‘ ‘ j 1 , … 丁 ‘ 则 cnu.-w 键 〜 、,Honq Kong I , I i c-i Lantau Island , i,:jand '' \ \ 声 。 , , J
i i 'X./.W一 ^rrnns feiaud |
1 " 、..::’ ( i 暴 . ‘......!::.>,1 ff .., 1 \ .. / 5; f \ L . \ \ X i 广 • ;
Source: http://www.vectormap.com/eng/english.litm
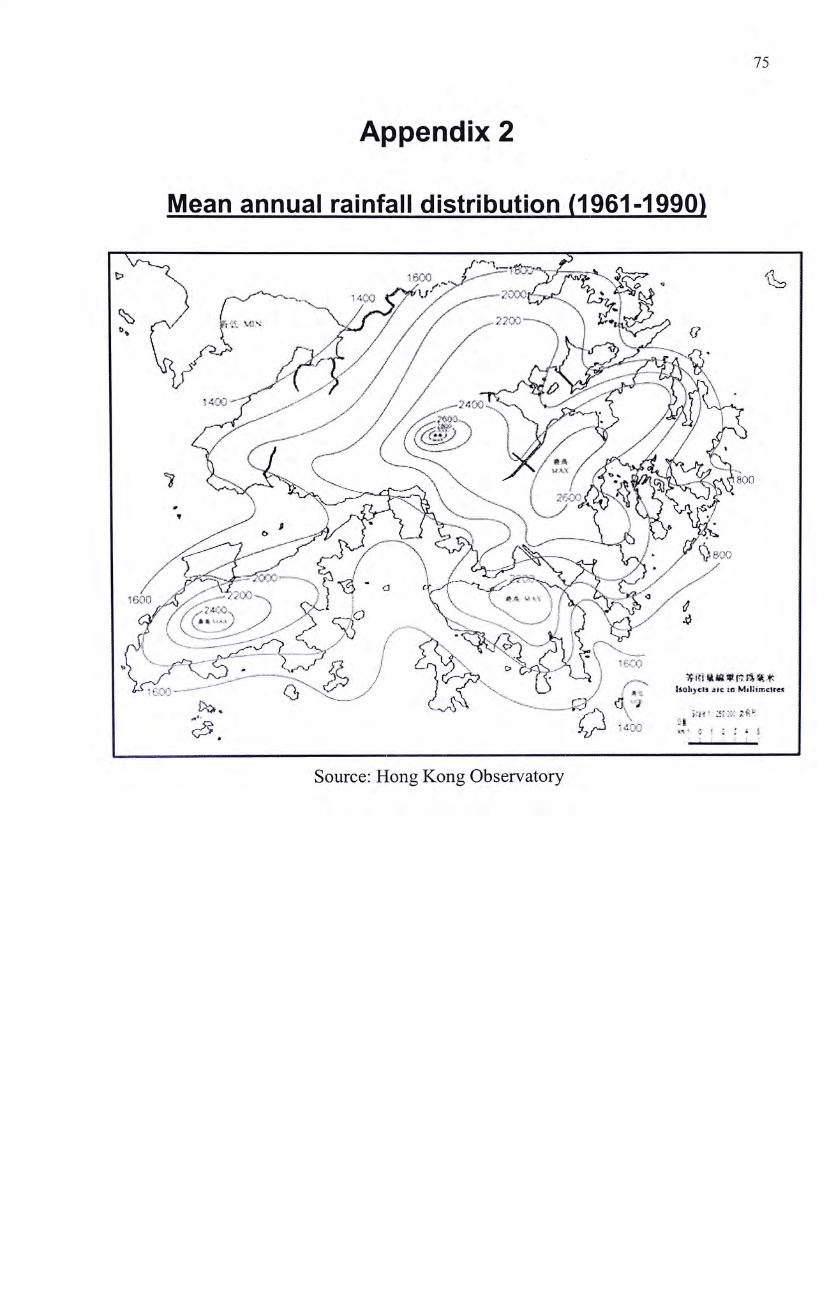
75
Appendix 2
Mean annual rainfall distribution (1961-1990)
) 〜 、 、 j z s t v " , — • 叙 衬 % 》 p / 卜 、 y j y / / 脚 、 ) " ^ � ^ ^ g
A'///
“ ” � f \ y I < � \ L-> / f 发: 3sol)ct« c !o MilJirocUes
Q •
Source: Hong Kong Observatory

76
Appendix 3
CME Weather Futures Traded
CME Weather Futures Traded
I 1000 J — — — — — . —
1 圓 H § 動
S 400 Q I « 200 o I 1 卜 0-1 1 i , I I ,
Year 2000 Year 2001 YTD 6/02
Period
Source; Chicago Mercanlile l-xcluitige i l . 16.02)
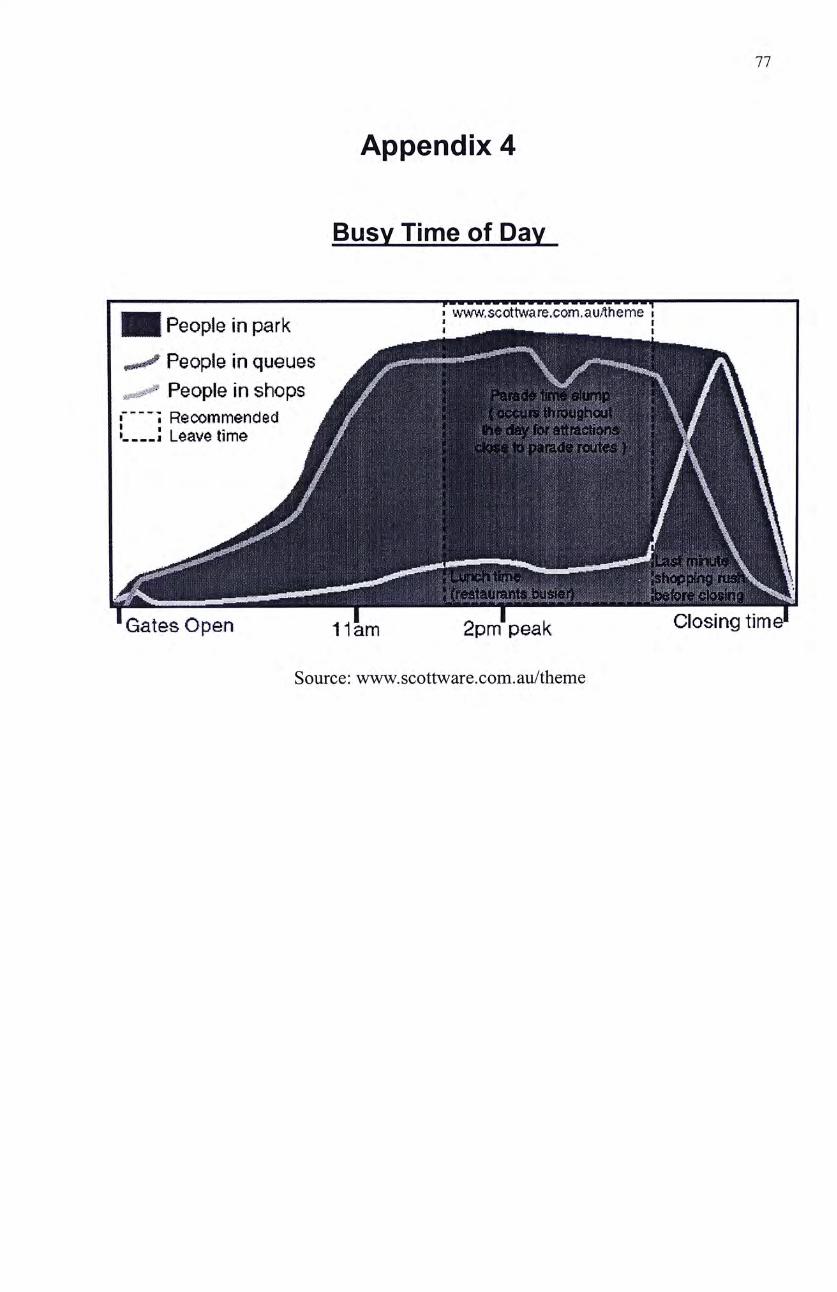
77
Appendix 4
Busy Time of Day
People in park • •
People in queues 斤,>,<一 People in shops � - -�Recommendec i L—; Leave time 變
•Gates Open r iam 2pm'peak Closing time*
Source: www.scottware.com.au/theme

78
Appendix 5
Visiting Time of Year
1 New Years 1 1 Longer queues 二 I B j ' ^ j M # Holiday 4th of Shorter qieues Holidays�糖 H i g M
July V Thanksgiving _111|111||[
Spring Break Labour Holiday V W ^ B ^ B
Presidents' ^ H j 颂 I | H B B • > m I ^ iLm A/x
mUnin 3 0
5nSr ] f " 2 0 I Lh ^ r\ r 怕
JAN I FEB I MAR I APR I tvlAY I J UN I JUL I AUG I SEP I OCT I NOV I DEC
NOTE: This graph is initial for Disneyland - California however it will also be fairly accurate for Walt Disney World attendance
(Magic Kingdom, EPCOT, MGM Studios & Animal Kingdom). The Tokyo Disneyland and Disneyland Paris theme parks
attendance patterns will differ due to holidays that don't match with the USA.
In addition to the above graph:
• Tuesday, Wednesday and Thursday are the least busy days. • Weekends can be twice as busy as weekdays. • Long Weekends can be 3 times as busy! • School holidays for USA (especially LA) can make it 3 times as Busy! • As a rule, if schools out or there's a holiday of some sort where workers
are on holidays....Disneyland will be busy!!
Source: www.scottware.com.au/theme
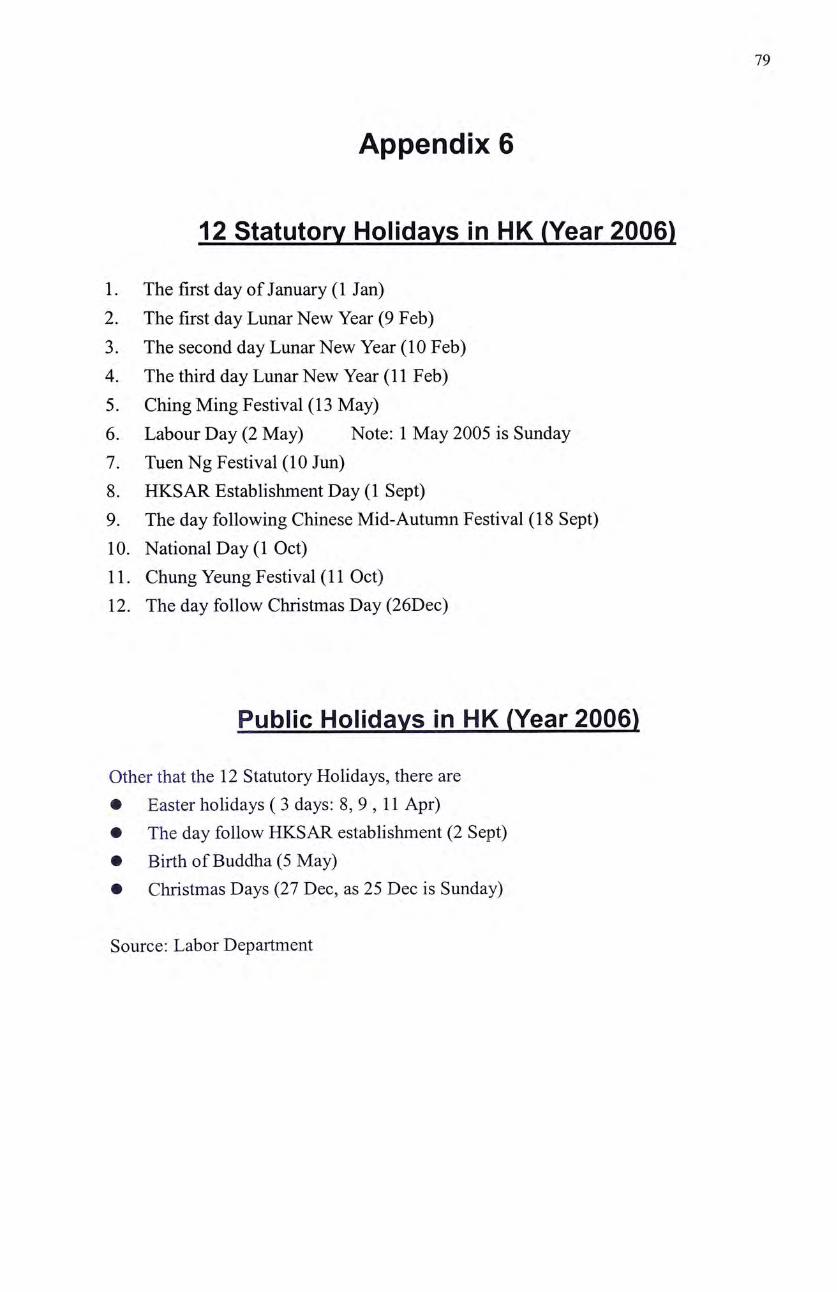
79
Appendix 6
12 Statutory Holidays in HK (Year 2006)
1. The first day of January (1 Jan) 2. The first day Lunar New Year (9 Feb) 3. The second day Lunar New Year (10 Feb) 4. The third day Lunar New Year (11 Feb) 5. Ching Ming Festival (13 May) 6. Labour Day (2 May) Note: 1 May 2005 is Sunday 7. Tuen Ng Festival (10 Jun) 8. HKSAR Establishment Day (1 Sept) 9. The day following Chinese Mid-Autumn Festival (18 Sept) 10. National Day (1 Oct) 11. Chung Yeung Festival (11 Oct) 12. The day follow Christmas Day (26Dec)
Public Holidays in HK (Year 2006)
Other that the 12 Statutory Holidays, there are • Easter holidays ( 3 days: 8, 9 , 11 Apr) • The day follow HKSAR establishment (2 Sept) • Birth of Buddha (5 May) 參 Christmas Days (27 Dec, as 25 Dec is Sunday)
Source: Labor Department

80
Appendix 7
Monthly Revenue Distribution
Monthly Revenue
800,000,000 n ^ r ; — ; ,, • Total Revenue
600,000,000 ^ ^ -I 400,000,000 ‘ • Local Visitors 论 200,000,000 Spending
r r ^ T ^ T T ^ ^ ‘ ^ _ Tourist Visitors Spending
、少 +合凌令 C ^ ^ ^ • Admission Fees
Month
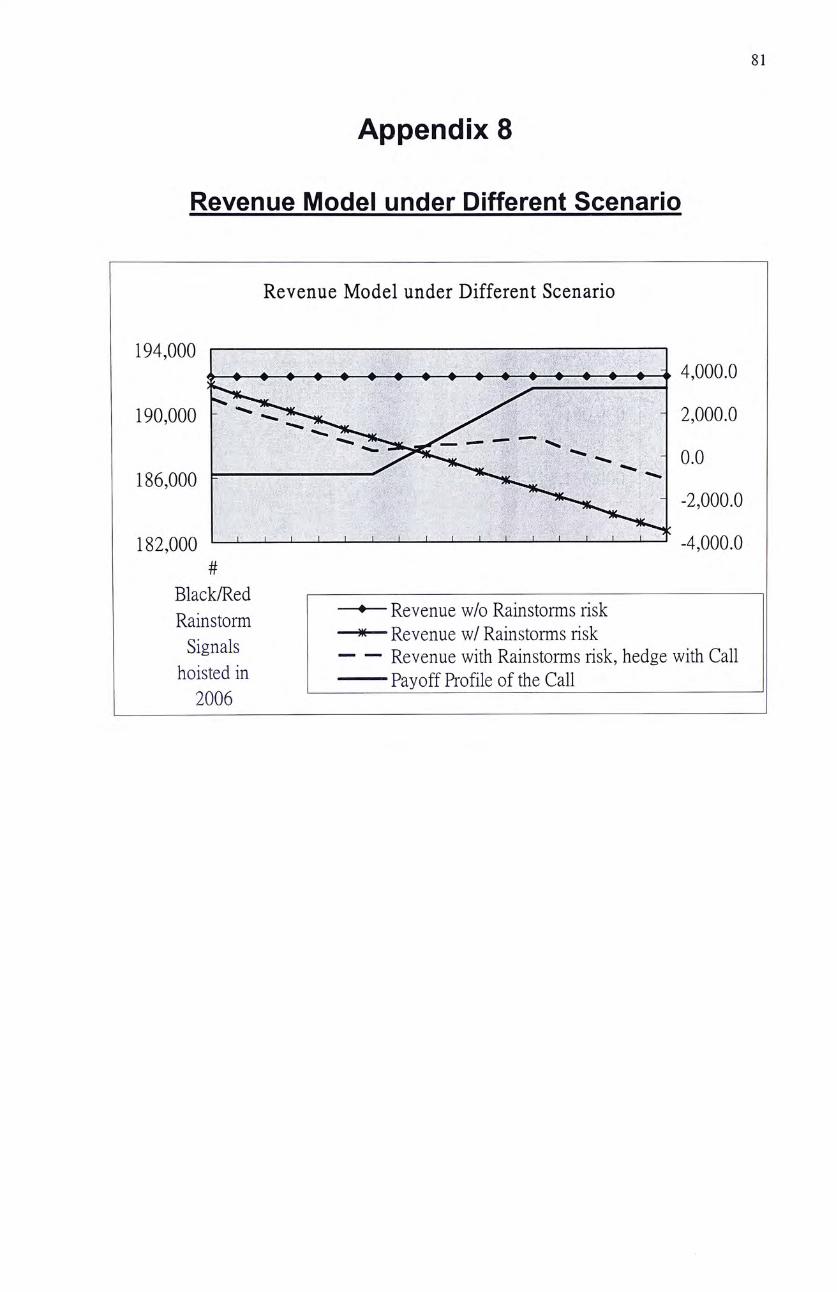
81
Appendix 8
Revenue Model under Different Scenario
Revenue Model under Different Scenario
194,000 I— I • 參 • • • • » u 4,000.0
190,000 — ^ ^ • 2,000.0
g 灰;>、、-0.0 186,000 =——: ^ :,,、
0 nnn n , 一 - 2 , 0 0 0 . 0
182,000 ^ ‘ ~ ‘ r ‘ 1 -丨,�丨• ‘ .•丨..,…”�卜…丨"….t . T -4,000.0 #
Black/Red • ‘ ~ • ~ Revenue w/o Rainstorms risk Rainstorm ^ … . . i
~ ~ Revenue w/ Rainstorms risk igna s Revenue with Rainstorms risk, hedge with Call
hoisted in Payoff Profile of the Call 2006
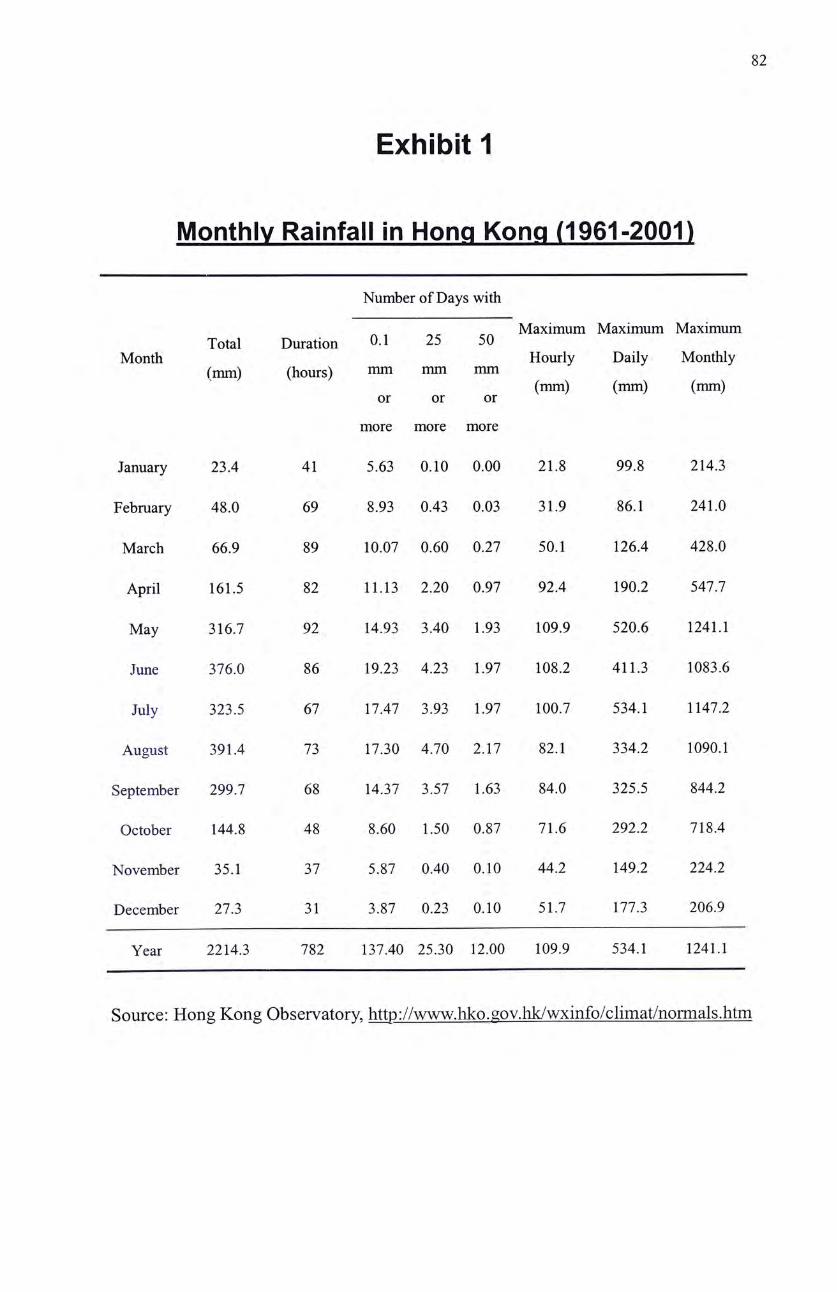
82
Exhibit 1
Monthly Rainfall in Hong Kong (1961-2001)
Number of Days with
Maximum Maximum Maximum Total Duration 0.1 25 50
Month Hourly Daily Monthly (mm) (hours) mm mm mm
(mm) (mm) (mm)
or or or
more more more
January 23.4 41 5.63 0.10 0.00 21.8 99.8 214.3
February 48.0 69 8.93 0.43 0.03 31.9 86.1 241.0
March 66.9 89 10.07 0.60 0.27 50.1 126.4 428.0
April 161.5 82 11.13 2.20 0.97 92.4 190.2 547.7
May 316.7 92 14.93 3.40 1.93 109.9 520.6 1241.1
June 376.0 86 19.23 4.23 1.97 108.2 411.3 1083.6
July 323.5 67 17.47 3.93 1.97 100.7 534.1 1147.2
August 391.4 73 17.30 4.70 2.17 82.1 334.2 1090.1
September 299.7 68 14.37 3.57 1.63 84.0 325.5 844.2
October 144.8 48 8.60 1.50 0.87 71.6 292.2 718.4
November 35.1 37 5.87 0.40 0.10 44.2 149.2 224.2
December 27.3 31 3.87 0.23 0.10 51.7 177.3 206.9
Year 2214.3 782 137.40 25.30 12.00 109.9 534.1 1241.1
Source: Hong Kong Observatory, http://www.hko.gov.hk/wxinfo/climat/nomials.litm
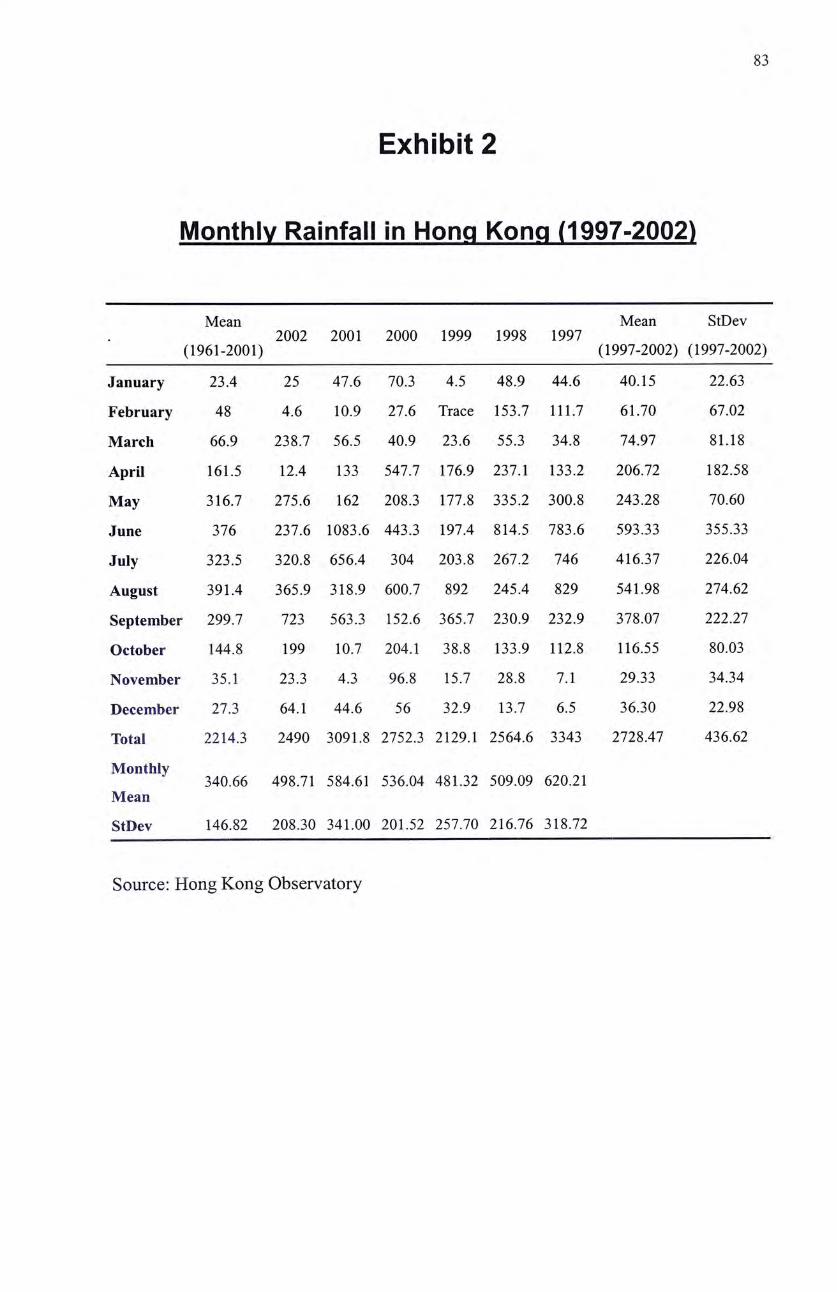
83
Exhibit 1
Monthly Rainfall in Hong Kong (1997-2002)
Mean Mean StDev . 2002 2001 2000 1999 1998 1997
(1961-2001) (1997-2002) (1997-2002)
January 23.4 25 47.6 70.3 4.5 48.9 44.6 40.15 22.63
February 48 4.6 10.9 27.6 Trace 153.7 111.7 61.70 67.02
March 66.9 238.7 56.5 40.9 23.6 55.3 34.8 74.97 81.18
April 161.5 12.4 133 547.7 176.9 237.1 133.2 206.72 182.58
May 316.7 275.6 162 208.3 177.8 335.2 300.8 243.28 70.60
June 376 237.6 1083.6 443.3 197.4 814.5 783.6 593.33 355.33
July 323.5 320.8 656.4 304 203.8 267.2 746 416.37 226.04
August 391.4 365.9 318.9 600.7 892 245.4 829 541.98 274.62
September 299.7 723 563.3 152.6 365.7 230.9 232.9 378.07 222.27
October 144.8 199 10.7 204.1 38.8 133.9 112.8 116.55 80.03
November 35.1 23.3 4.3 96.8 15.7 28.8 7.1 29.33 34.34
December 27.3 64.1 44.6 56 32.9 13.7 6.5 36.30 22.98
Total 2214.3 2490 3091.8 27523 2129.1 2564.6 3343 2728.47 436.62
Monthly 340.66 498.71 584.61 536.04 481.32 509.09 620.21
Mean
StDev 146.82 208.30 341.00 201.52 257.70 216.76 318.72
Source: Hong Kong Observatory
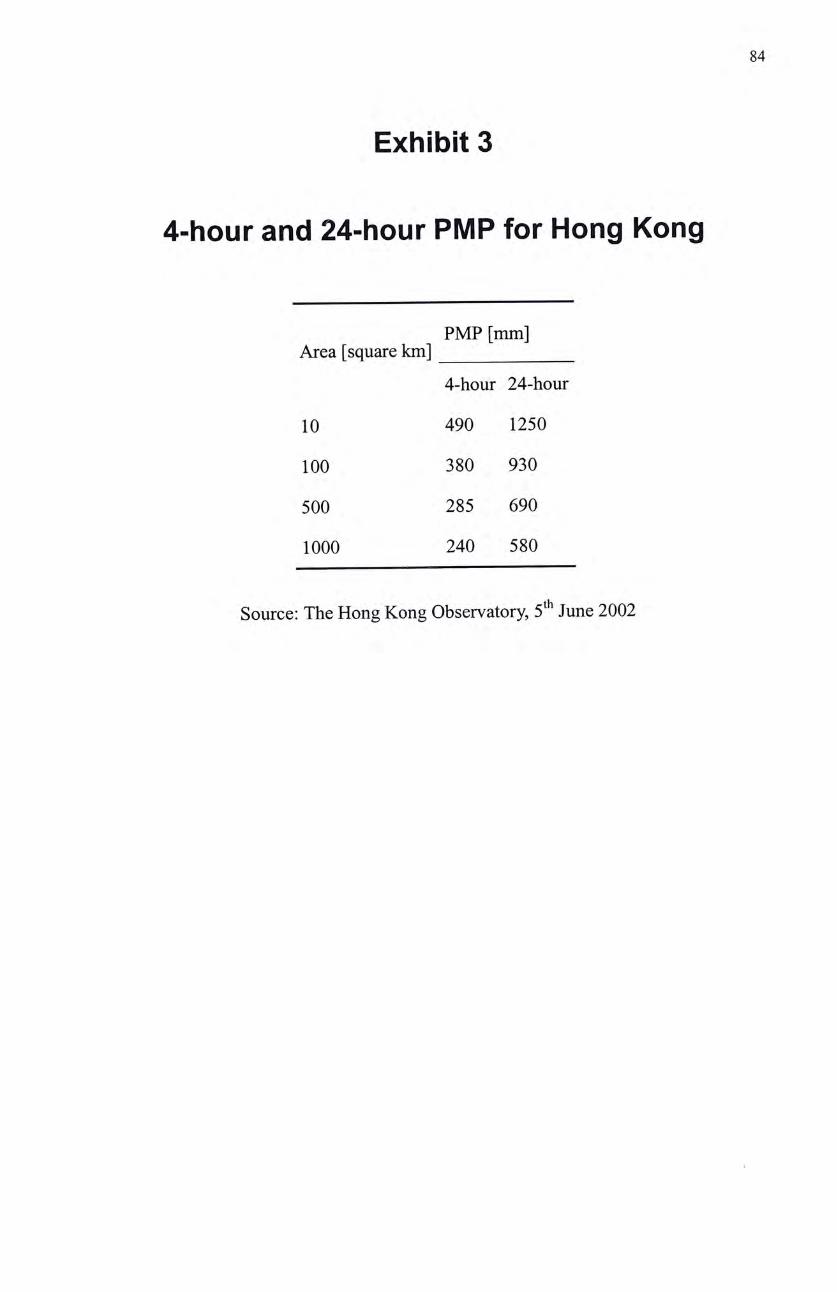
84
Exhibit 1
4-hour and 24-hour PMP for Hong Kong
PMP [mm; Area [square km]
4-hour 24-hour
10 490 1250
100 380 930
500 285 690
1000 240 580
Source: The Hong Kong Observatory, June 2002
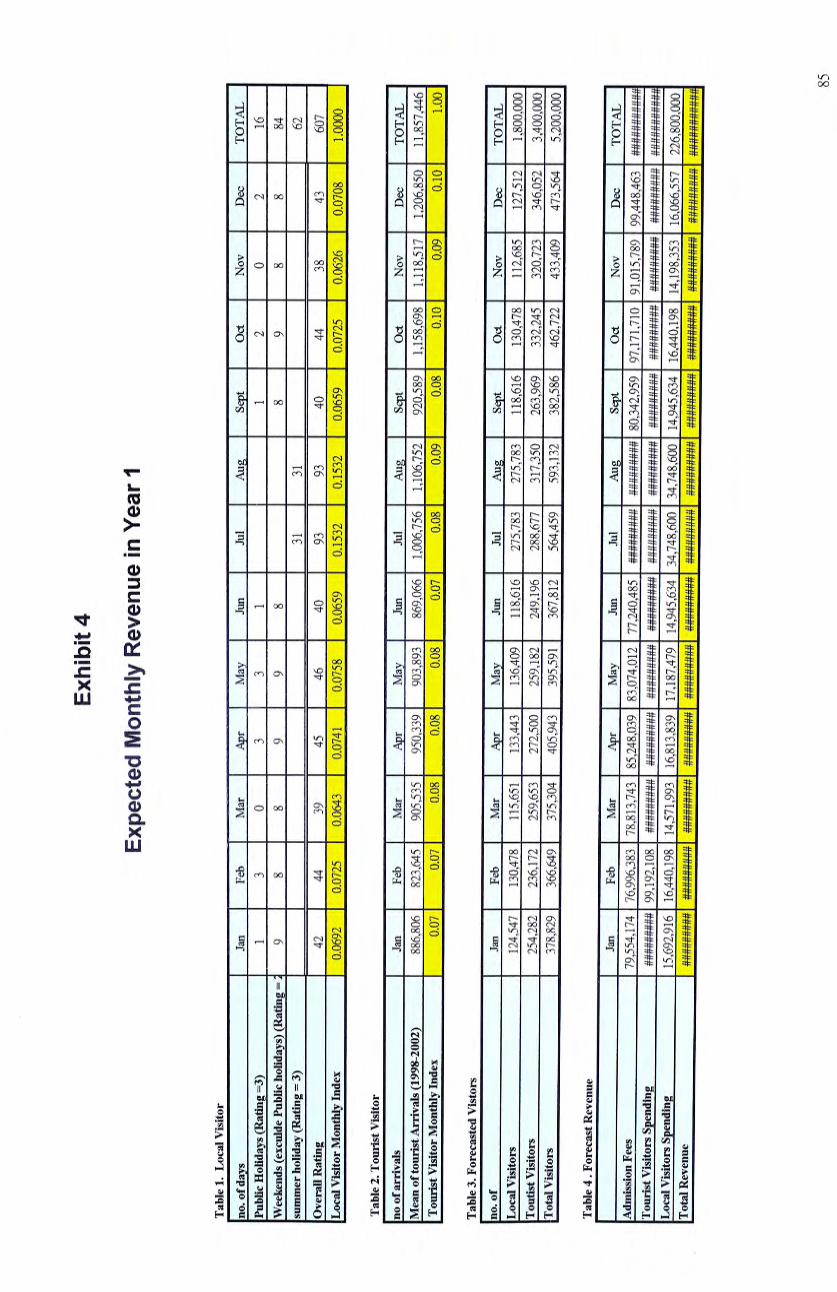
Exhi
bit 4
Expe
cted
Mon
thly
Rev
enue
in Y
ear 1
Table
1. L
ocal
Visi
tor
no. o
f day
s ^
F^
Mar
A
pr
May
Ju
n ^
Aug
Se
pt
Od
Nov
D
ec
TOTA
L Pu
blic
Hol
iday
s (R
atin
g ==
3)
1 3
0 3
3 1
1 2
0 2
16
Wee
kend
s (ex
culd
e Pu
blic
hol
iday
s) (R
atin
g = :
9
8 8
9 9
8 8
9 8
8 84
su
mm
er h
olid
ay (R
atin
g =
3)
^ ^
62
Ove
raU
Rat
ing
^ 44
^
45
46
40
93
93
40
44
38
43
607
L^ca
l Visi
tor
Mon
thly
Inde
x 0.0692
0.0725
0.0643
0,0741
0.0758
0.0659
0.1532
一
0.1532
0.0659
“ 0.0725
—0.0626
0.0708
1.0000
Table
2. T
ouris
t Visi
tor
no of
arriv
als
^ ^
Mar
Ap
r M
^ ^
M
A^
Ort
Nov
^ TO
TAL
Mea
n of
tour
ist A
rriv
als (1998-2002)
886,806
823,645
905,535
950,339
903,893
869,066
1,006,756
1,106,752
920,589
1,
158,698一
1,118,517
1,206,850
11,857,446
Tour
ist V
isito
r M
onth
ly In
dex
0.07
0.
07 |
0.
08
0.08
| 0.
08
0.57
0.
08
0.09
0.
08
0.10
—
0.09
—
0.
10
1,00
Table
3. F
orec
asted
Vist
ors
no- o
f ^
Feb
^ ^
^ ^
A^
^ O
^ De
c TO
TAL
Loca
l Visi
tors
12
4,54
7 13
0,47
8 11
5,65
1 13
3,44
3 13
6.40
9 11
8,61
6 27
5,78
3"
275,
783
118,
616
DO
,478
11
2,68
7 12
7,51
2 “
1,80
0,00
0 To
utist
Visi
tors
25
4,28
2 23
6,17
2 25
9,65
3 27
2,50
0 25
9.18
2 24
9.19
6 9-S
R.67
7 31
7,35
0 一
26
3.96
9 ^3
2,24
5 32
0,72
7 34
6,05
2 3,
400,
000
Tota
l Visi
tors
37
8,82
9 36
6,64
9 37
5,30
4 40
5,94
3 39
5,59
1 36
7,81
2 56
4,45
9 59
3,13
2 38
2,58
6 46
2,72
2 43
3,40
9 47
3,56
4 5,2
0q!q
0q"
Table
4 .
Fore
cast
Reve
nue
^ ^
Me
Apr
May
^
M
^ ^
O^
Nov
Dec
""“T
OTAL
Ad
miss
ion F
ees
79,55
4,174
76
,996,3
83
78,81
3,743
85
,248.0
39 1
7,07
4,012
77
,240,4
85
####
####
# “#
####
####
80
,342
^ 97
,171,7
10
91,01
5,789
##
####
##W
To
urist
Visi
tors
Spe
nding
##
####
###
99,19
2,108
##
####
###
####
####
# ##
####
###
m#m
#m
####
####
# ##
####
###
####
##W
##
####
###_
####
####
# Jg
gggg
gg^
Loca
l Visi
tors
Spen
ding
15’69
2’916
16
,440,1
98
14,57
1,993
16
.813.8
39
17.1S
7.47Q
nn
14
.945.6
.34
16,44
0,198
~98
,353
16
,066
557
226
80
^ |T
otalR
even
ue
####
####
#| ##
####
###!
###
####
##!
####
####
#1 #
####
####
1 ##
####
###!
###
####
##[
####
####
#| ##
####
###[
###
####
##|
####
####
#| ##
####
###|
####
####
^ 85

86
Exhibit 5
5-dav Normal Daily Rainfall
5-Day Normals of Daily Rainfall for Hong Kong, 1961-1990
S 15 n] nnn j “ ~ • t a 川 in in BH niJ •且 J _ l y I 0 I In I
MnilllflhnrhiLBJ
Date Period of the Year
Source: Hong Kong Observatory
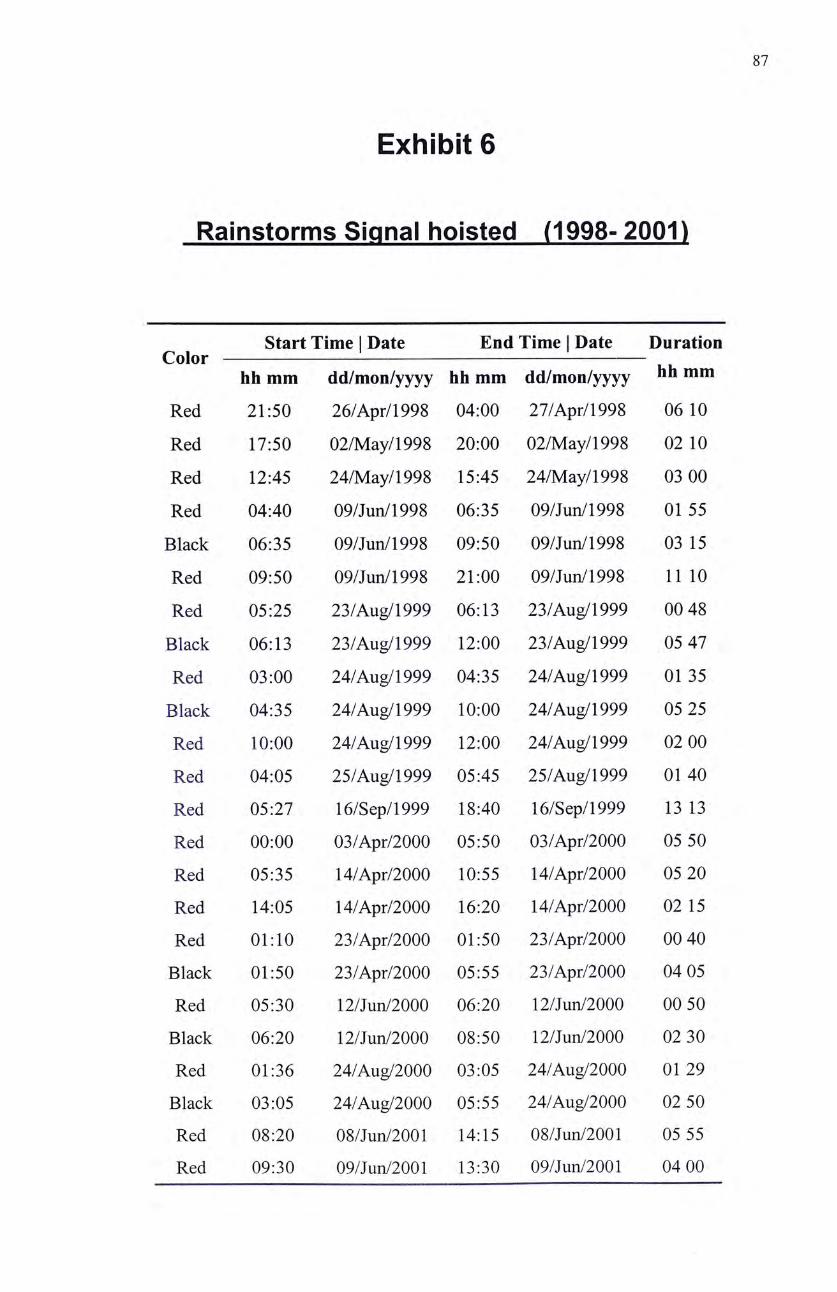
87
Exhibit 1
Rainstorms Sicinal hoisted (1998- 2001)
start Time Date End Time | Date Duration Color
hh mm dd/mon/yyyy hh mm dd/mon/yyyy hh mm
Red 21:50 26/Apr/1998 04:00 27/Apr/1998 06 10
Red 17:50 02/May/1998 20:00 02/May/1998 02 10
Red 12:45 24/May/1998 15:45 24/May/1998 03 00
Red 04:40 09/Junyi998 06:35 09/Jun/1998 01 55
Black 06:35 09/Jun/1998 09:50 09/Junyi998 03 15
Red 09:50 09/Jun/1998 21:00 09/Junyi998 11 10
Red 05:25 23/Aug/1999 06:13 23/Aug/1999 00 48
Black 06:13 23/Aug/1999 12:00 23/Aug/1999 05 47
Red 03:00 24/Aug/1999 04:35 24/Aug/1999 01 35
Black 04:35 24/Aug/1999 10:00 24/Aug/1999 05 25
Red 10:00 24/Aug/1999 12:00 24/Aug/1999 02 00
Red 04:05 25/Aug/1999 05:45 25/Aug/1999 01 40
Red 05:27 16/Sep/1999 18:40 16/Sep/1999 13 13
Red 00:00 03/Apr/2000 05:50 03/Apr/2000 05 50
Red 05:35 14/Apr/2000 10:55 14/Apr/2000 05 20
Red 14:05 14/Apr/2000 16:20 14/Apr/2000 02 15
Red 01:10 23/Apr/2000 01:50 23/Apr/2000 00 40
Black 01:50 23/Apr/2000 05:55 23/Apr/2000 04 05
Red 05:30 12/Jun/2000 06:20 12/Jun/2000 00 50
Black 06:20 12/Jun/2000 08:50 12/Jun/2000 02 30
Red 01:36 24/Aug/2000 03:05 24/Aug/2000 01 29
Black 03:05 24/Aug/2000 05:55 24/Aug/2000 02 50
Red 08:20 08/Jun/2001 14:15 08/Jun/2001 05 55
Red 09:30 09/Jun/2001 13:30 09/Jun/2001 04 00
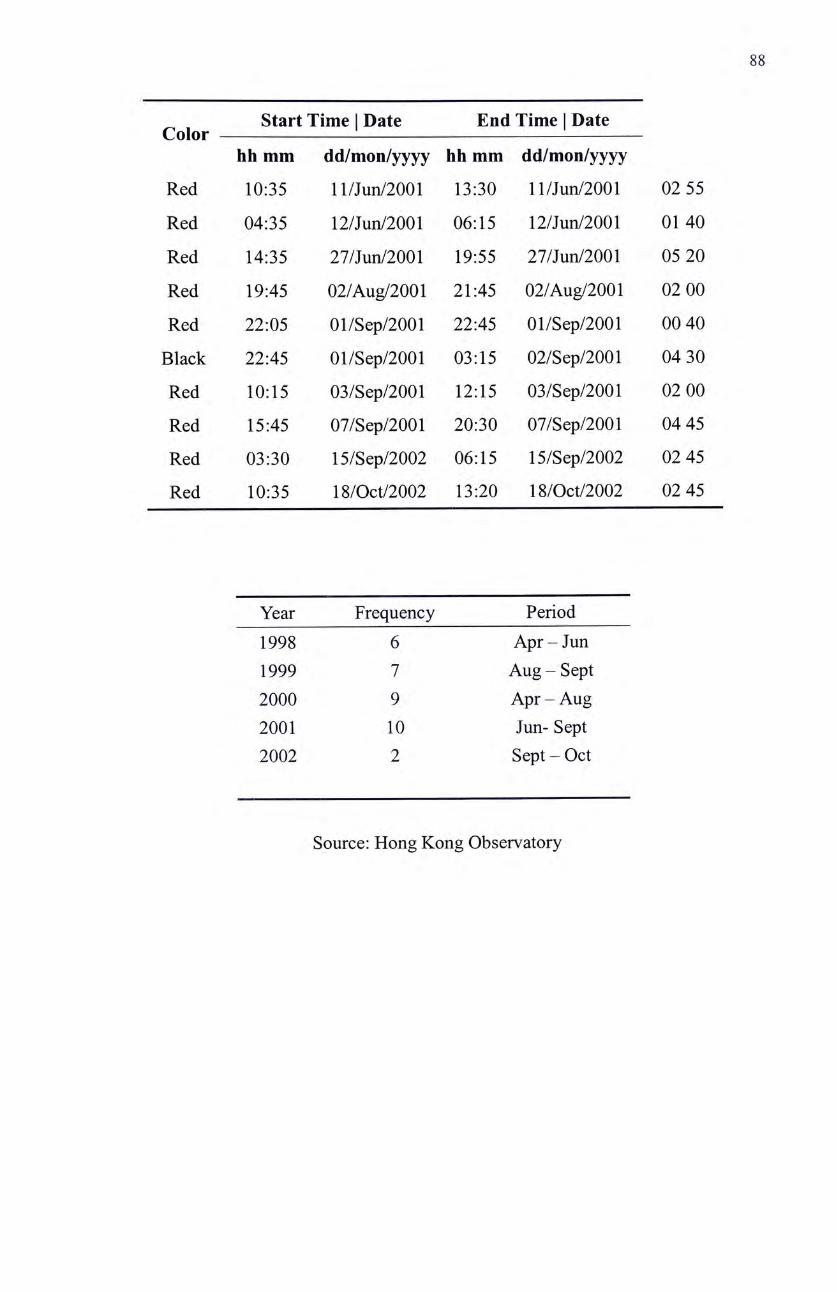
88
Start Time I Date End Time | Date Color
hh mm dd/mon/yyyy hh mm dd/mon/yyyy
Red 10:35 ll/Jun/2001 13:30 ll/Jun/2001 02 55
Red 04:35 12/Jun/2001 06:15 12/Jun/2001 01 40
Red 14:35 27/Jun/2001 19:55 27/Jun/2001 05 20
Red 19:45 02/Aug/2001 21:45 02/Aug/2001 02 00
Red 22:05 Ol/Sep/2001 22:45 Ol/Sep/2001 00 40
Black 22:45 Ol/Sep/2001 03:15 02/Sep/2001 04 30
Red 10:15 03/Sep/2001 12:15 03/Sep/2001 02 00
Red 15:45 07/Sep/2001 20:30 07/Sep/2001 04 45
Red 03:30 15/Sep/2002 06:15 15/Sep/2002 02 45
Red 10:35 18/0ct/2002 13:20 18/0ct/2002 02 45
Year Frequency Period
1998 6 Apr - J im 1999 7 Aug - Sept 2000 9 Apr - Aug 2001 10 Jun- Sept 2002 2 Sept — Oct
Source: Hong Kong Observatory
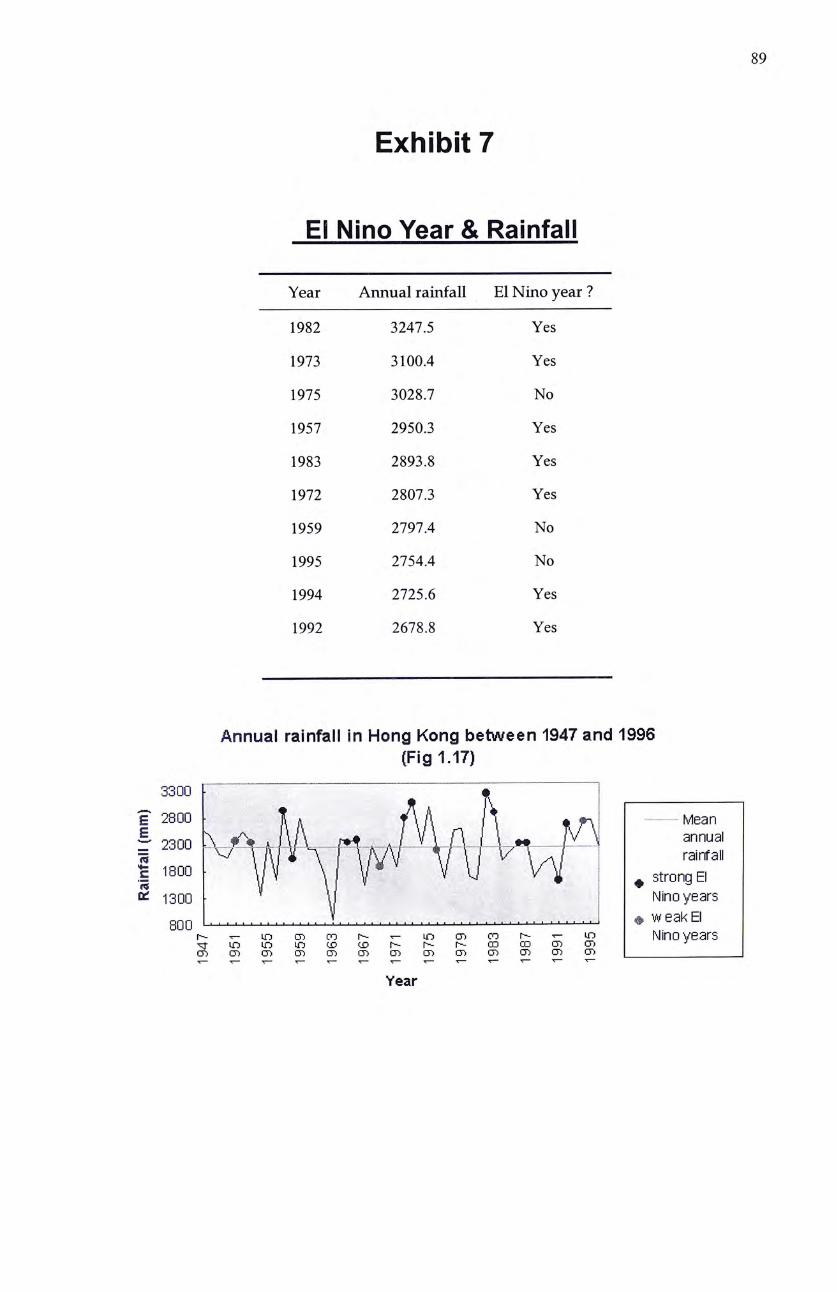
89
Exhibit 7
El Nino Year & Rainfall
Year Annual rainfall El Nino year ?
1982 3247.5 Yes
1973 3100.4 Yes
1975 3028.7 No
1957 2950.3 Yes
1983 2893.8 Yes
1972 2807.3 Yes
1959 2797.4 No
1995 2754.4 No
1994 2725.6 Yes
1992 2678.8 Yes
丨 raiinfsill in Hong Kong between 1947 and 1996 (Fig 1.17)
3300 厂^ 一
i 2 3 0 0 、 叙 * AA r ^ J V \ n \ - /,彳 annual
| i_ 卜 l ^ l f ^ v v V \ r w 产-II ft: 1300 • ^ \ Nino years
gOQ ^ • weak 日 i ^ ^ k D C D c o r - ^ L T j c D c o r - ^ i r i Nino years - ^ i T j i n L n �� 卜 卜 卜 o o c o c ^ m m c o c D o r j c D O " ) � m m m m m c T i T~ T T~ T T T T~ T~ T~ T— T~ T~ T~
Year
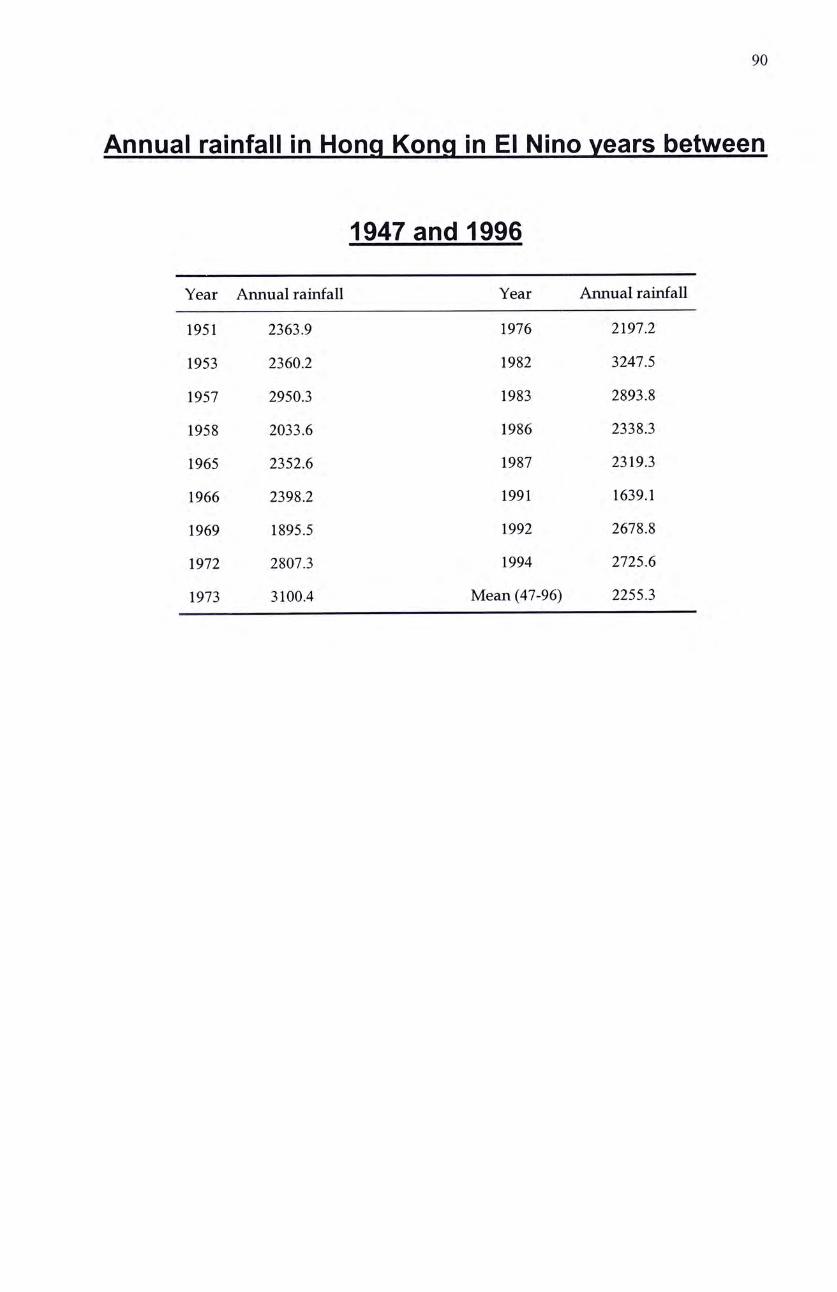
90
Annual rainfall in Hong Kong in El Nino years between
1947 and 1996
Year Annual rainfall Year Annual rainfall
1951 2363.9 1976 2197.2
1953 2360.2 1982 3247.5
1957 2950.3 1983 2893.8
1958 2033.6 1986 2338.3
1965 2352.6 1987 2319.3
1966 2398.2 1991 1639.1
1969 1895.5 1992 2678.8
1972 2807.3 1994 2725.6
1973 3100.4 Mean (47-96) 2255.3
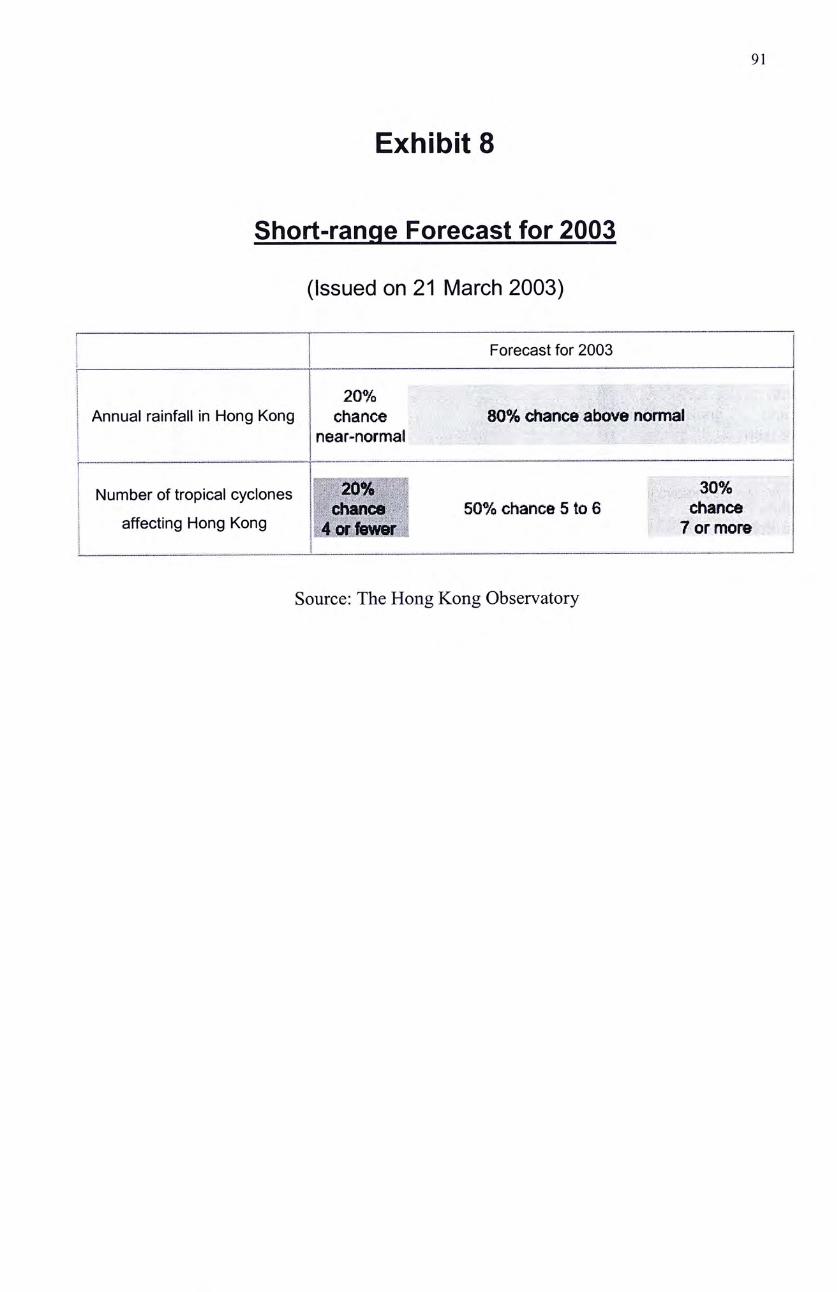
91
Exhibit 8
Short-range Forecast for 2003
(Issued on 21 March 2003)
I ^ - 一 — ~ ― ― ^ ‘ _ _ _ — — — — — — — 1 Forecast for 2003 r - ^ ““ "“ ~ I 20% I ‘ " , ' '' t Annual rainfall in Hong Kong chance 80% chance above normai ! ^ ^ I / /,
1 near-normal I — — — — — — . � — —一 「 — — — — — ] — — • ^ 1 Number of tropical cyclones 20% 30%
chancd 50% chance 5 to 6 chance i affecting Hong Kong 4 or fewer 7 or more i i — — �
Source: The Hong Kong Observatory
92
B 旧 LIOGRAPHY
Books
Robert S. Dischel, CLIMATE RISK AND THE WEATHER MARKET Financial Risk Management with Weather Hedges, Risk Books, Risk Waters Group, 2002
Joel N. Gordes, Climate Change and the Insurance Industry: Uncertainty Among the Risk Community, Environmental Energy Solutions, 1996,45 pp
John Hull, Fundamentals of Futures and Options Markets, ed., Prentice-Hall,
2002
Periodicals
Button, J.A., (2002). “Opportunities and Priorities in a New Era for Weather and Climate Services,,,Bulletin of the American Meteorological Society,Forthcoming
Bureau of Economic Analysis, (2000), Department of Commerce, U.S.
Andreas Richter, (2002), "Catastrophe Risk Management 一 Implications of Default
Risk and Basis Risk"
R.J. Rudden Association, Inc., (2002), "Weather Risk Management - A survivor of the Collapse/Demise of U.S. Energy Merchants"
Mark Nicholls, "Winter warms Weather Traders", Environmental Finance Journal
93
Official Press Release
"Disney Begins Preliminary Work on Theme Park Site To Mobilize for Construction
Beginning in January 2003”,Don Robinson, Group Managing Director, Hong Kong
Disneyland responsible for operations of Hong Kong Disneyland; John Verity, Managing Director, Walt Disney Imagineering Hong Kong in charge of construction ,
November 21, 2002
"Intangible Benefits from Hong Kong Disneyland", Press Release, HKSAR,
November 3, 1999
“Hong Kong Disneyland Final Agreement Signed", Press Release, HKSAR,
December 10, 1999
Bureau of Economic Analysis, Department of Commerce, U.S., 2000
"Weather Risk Management Association Releases Results of Second Annual Industry-Wide Survey", Weather Risk Management Association, June 6, 2002
Websites
Hong Kong Disneyland, http://www.info.gov.hk/disnevland/indexe.htm
Hong Kong Observatory, http://www.hko.gov.hk/index.htm
Labour Department, HKSAR, Code of Practice in times of Typhoons and Rainstorms, http://www.lrpu.labour.gov.hk/piiblicat/rainstorm/index-e.htm
Ocean Park Hong Kong, http://www.oceanpark.com.hk/eng/main/index.html
Risk and Insurance Magazine, http://www.riskandinsurance.com/1001 choice .aspStop
94
Weather Risk, Robin Lancaster, Editor, Energy & Power Risk Management, http: //www, eprmonline. com/weatherO 1 /
Disneyland Attendance Figures,
http://www.scottware.com.au/theme/feature/crowds.htm
WRMA, http://www/wrma.org.
Geoffrey Considine, PhD, Weather Derivatives Group, Aquila Energy. Introduction to Weather Derivatives, http://www.cme.eom/weather/introweather.thml#one
SMUD, (2000), Annual Report, http://www.smud.org/info/reports.html
Mark Nicholls, Winter Warms Weather Traders, http://www.i-wex.com/resources/a221299.htm
Census & Statistics Department, HKSAR, http ://www. info. gov.hk/censtatd/ eng/hkstat/index2.html
The Walt Disney Company Annual Report, 2002 http ://disnev. go.com/corporate/investors/financials/annual.html
Speedwell Weather Derivatives Limited, http://www.weatherderivs.comyWOption.htm
RMIS, http://www.atsrmis.com/aboutus.html
Interview
Tony Tang, CEO of TravelMaster Traveling Agency, 30years experienced for Tourists Guides, Interview, April 12, 2003


EEEbhDhDD
i ••lllllllllil ! SQLjBjqLn >IHnD