raindrop measurements during project shower
TRANSCRIPT

Raindrop Measurements during Project Shower
By D. C. BLANCHARD and A. T. SPENCER
Woods Hole Oceanographic Institution, Woods Hole, Massachusetts
Abstract Raindrop size distributions have been obtained on the island of Hawaii with filter papers and
with a device called a drop recorder. The drop recorder automatically exposes a section of dyed paper tape to the rain at approximately two-minute intervals. The maximum sized drop found on each of the more than 4,000 samples has been plotted as a function of time. It is shown that a fair correlation exists between the maximum sized drop and rain intensity.
Over 300,000 drops m-*< 0.2 mm diameter have been found in very light rains at altitudes of 5 , p o feet on the volcanos of Mauna Kea and Mauna Loa.
I. Introduction
This aper will consist mainly of a presenta- tion o P the raindrop measurements made during Project Shower. There will be little emphasis on what the data might mean in terms of basic cloud physics processes or rela- tionships between such important parameters as liquid water content, intensity of rainfall, and the median volume diameter. There are two reasons for this. First, a detailed study has already been made of the raindro distribu-
mean in terms of precipitation growth (WOOD- COCK & BLANCHARD, 1955) in the very region covered by Project Shower. An analysis of the present data indicates no sig&cant changes in the raindrop distributions and thus any further discussion along those lines is unneces- sary. Secondly, it is felt that the data in the present form would be of great interest to others who may wish to make their own study of the Project Shower papers.
tions (BLANCHARD, 1953) and what i ey might
2. Methods of raindrop sampling Two methods of obtaining raindrop size
distribution were used throughout Project Shower. The first, the filter paper method, had been used successfully in earlier field trips to Hawaii (BLANCHARD, 1953). The second Tellus IX (1957). 4
8-7 0 121 I
method, used for the first time in the present experiments, warrants some discussion in re- gard to its limitations.
This method utilizes an automatic portable device, called a drop recorder, that was design- ed to run off a 12 volt automobile battery. The sequence of operation of the drop recorder is as follows: At approximately two-minute intervals a slidin trap door at the top opens for a 2.7 secon f period. The raindrops that fall through the 33.2 cm* opening impinge on a methylene blue dye treated a er tape. A
prevents splash from the drops that strike in the immediate vicinity. During the two- minute interval between exposures a resistance wire heater dries the paper tape and the tape is advanced to a new exposure position. In t h i s manner a drop recorder was run con- tinuously for IS hours collecting some 450 rain drop distribution samples. At the end of this time the battery voltage was still sufficient to give essentially the same operating charac- teristics as at the start. As a precaution, time marks were placed on the tape at various times during the daily runs. These times were later plotted versus length of tape exposed. The time of any particular sample was obtained from t h i s calibration curve.
One would naturally have some doubt
fine mesh wire screen aroun B;R e opening

5 42
i : e, - a v) - I 2
3 4 5 6 7 8 9
I 0 I 1 I2 13 I4 15 16 17 18 19 20 21 22
23 24 25 26 27 28 29 30 31 32 33 34 35 36 37 38 39 40 41 42 43 44 45 46 47 48 49 50 51 52
Date
D. C. B L A N C H A R D A N D A. T. S P E N C E R
Table I. Filter papers, Hawaii 1954. At Club 299
Time Hawaiiar Standard)
0002 0004 0008
0015 0017
0026 0028
0010
0022
1049 1127.5 I356 1402 I436 '442.5 I525 I536 1551 1629 I548 I 603 I 609 1611.5 1650 1659 I 708 I713 I729 1o15
1156
1217 I323 I332 I334 1356 1415 I128 0810
I020
I210
0833 0857 I550 I746 I750 I753 I756 I758 I 803 1658 1704.5 1713
Position Rainfall intensity mm hr-1
19.4 23.2 26
13.3 16.5
31.5 41.3
6.35
78
0.95 0.79 1.82 1.8 2.01
4.07 4.96 1.47 0.42 0.68 0.45 0.98
1.62 0.70 0.43 0.55 0.84 0.62
2.2
16.3 14.7 8.6 0.29 4.8 9.1
13.6 14.1
1.13 1.15
1.7 0.94 4.17 0.28 7 3.2
0.76 I .68 1.23 0.89
29
8.9
34.6 14.9
Mass of Liquid water
of air w / m 3
1005 1005 1260 4'0 742 774
3550 1490 1950
I57 104 257 213 255 425 427 190 99
129 106
292 228
119 95
141
210
176
I11 I 0 0 0
916 550
59 386 553 920 845 I53 I 60
1270 91 55
188 51
520 247 562
150
131 I 660
I00
I20
893
0.1 0.5
380 I35 305 2 2 5 640 590 890 870 390 760
1080 2400 I 500 2400 690
I 700 1920
98 700 88
470 2850 2580
4'
800 1080
680 870
385 - 270 430 320 128 85
490 I 700 450
36 43 '4
290 950 410 660 890 300 440
1380 355 490
Number
0.7
55 I 4 83
200 I 80 I55 420 215
55
105
215 315 250 750
78
I I 0
220
260 78
10.5 11.5
395 104 170
I7 620 8 2
15
50 47
'3.5 7
530 305 260 124 360 215
34 79 34
2 00
I12
I 1
Tellur IX (1957). 4

543 R A IN D R O P M E A S U RE M E N T S
and at various heights on the Saddle Road.
of drops m-3 within 0.2 mm size interval centered about indicated size (mm).
0.9
76 65
I33 375 230 I54 61
I1
65 7.2
72 22.5 11.5 183
12
315 290 4'0
400 250 740 86 70 15.6
20.5 22.5 16.5
I I 0
360 125 245
130 22
125 69 -
1.1
66 141 113 '83 93 70 75 62 56
8.8
51
251
350 480
I00
132 5 60 520
62 22.5 18 I 1
130 136 225
18.5 44
66 295
I80 I05 73
57 87 82 63 130
I00
45
255 137 73
136 -
117 255
64 6.5
6.1 2.2
65 I9 9.1
'75 5
1.5
I54
140 34 34
14.6 16.3
22
12
225
8.3
126 130 16
6 88 40 73
82 9.7 3.1 7.3
29
4'
83
88 61 I35
10.5 16.5 13.7 23 95
29 16.7
8.2
7.5
83 3.5 5.7 3.4
45
'27 34 -
31 44 56
34 1 0 - '04 75
49 3.3 1.7 4.7
7
I33
- 2.1
18 53 47
13.8 9.7 36
84 80
40 1.5
8.9
60
- 2.3 -
28 -
13.2 I4 46 51 46
25.5 1.5
4.3
16
- 2.5 -
5.4
4.1 '3 I44 6.1 10.8
6.1
2.;
Tellus IX (1957). 4

D . C. B L A N C H A R D A N D A. T. S P E N C E R 5 44
whether a sample obtained with an exposure area of only about 33 cme would be represen- tative. Now this area would be uite insuffi-
or frontal type rains. In these rains the average maximum drop size of about 5 mm diameter would leave a 32 mm diameter spot on the tape. It is apparent that only 2 drops of this size could be collected without the occurrence of overlapping and splashing. However, in the typical Hawaiian orographic rains, the rain-
cient if exposures were made in t R understorm
R ( m m h r - l l FOR F I L T E R P A P C R S
Fig. I . A comparison of rain intensities as computed from drop recorder records and simultaneously exposed filter papers. The filter paper was held within two feet of the
drop recorder.
drop size seldom exceeds 2 mm (a spot diameter of only 9 mm) and so a representative distribution of 60-200 drops can usually be obtained. With such a distribution the calcula- tion of the rain intensity R is considered to be reasonably accurate. Several filter papers (each having an area over 7 times that of an exposure of the drop recorder) were simultaneously exposed alongside a drop recorder. The com- parison of the calculated rain intensities is shown in fig. I. In the earlier Hawaiian ex- periments (BLANCHARD, 1953) a good correla- tion was found between the rain intensity cal- culated from filter papers and that simul- taneously measured with a 0.5 m2 stainless steel funnel.
3. Filter paper samples A very limited number of filter paper
measurements of raindrop distribution were obtained. The filter paper technique was to be extensively used only on mechanical break- down or other failure of the drop recorders. The data from the samples that were obtained are tabulated in table I . All sam les were
exact location may be found by noting from the table the elevation of the sampling position and then referrin to the Location Map else-
crosses t h i s elevation contour. It is perhaps pertinent to discuss brieflythe
samples and factors that may modify these rain distributions. Samples I-, obtained at Club 299, the base of operation of Project Shower, were made in heavy rain that covered the entire Hilo area. At the time of sampling the rain did not extend up into the saddle region between the volcanos. Indeed, the sky was relatively clear in that region and a down- slope breeze existed. The maximum drop size, nearly 4 mm, is far larger than that usually found in the orographic rains that fall on the volcano slopes. The great numbers of drops in samples 7-8 in the 0.1 mm size range may be due, in part, to splash from large dro s striking the flat roof of a building near $e sampling region. The sampling point was about 20 feet horizontally and 8 feet vertically from the edge of the roof. With proper wind drift it is conceivable that some of the small drops counted on the filter paper originated on this roof.
Samples 39-43 were obtained in a Kona storm (SIMPSON, 1952) and thus are not representative of trade wind orographic rainfall.
obtained along the Saddle Road an B thus the
where in this vo s ume to see where the road
4. Drop recorder measurements
Over 4,000 raindrop samples were obtained with three drop recorders which, on several occasions, ran simultaneously at various posi- tions along the Saddle Road. As all these samples have not been evaluated, it was decided
is felt that this would at least
varied and would be a guide to those who wish to consider the maximum raindrop growth
maximum drop size found in
of how the raindrop distribution
Tellus IX (1957)- 4

R A I N D R O P M E A S U R E M E N T S 545 Table 2. Drop Recorder Sampler, Saddle Road, Hawaii, 2 December, 1954.
470 590 117 275
050 050 980 38
220
I95 38 I55 I95 310 78 I95 235 508 235 I55 39 115
580
275 117 940
470 78 39
310 235 195 400 940 I55 I95 235 156
195
660
-
78
430 630 870
2 1 8
-
i 3 3 a
In - I 2 3 4 5 6 7 8 9 I0 I1 I2 I3 I4 I5 16 17 I8 19 20 21 22 23 34 25 26 27 28 29 30 31 32 33 34 35 36 37 38 39 40 4' 42 43 44 45 46 47 48 49 50 5'
123 26 245 26
430 365 154 77 46 278 26 650 205 22.:
'54 155114 123 335320 92 417298 61 232 45 '54 440550 340 233 215 490320 245 519 68 430 I55 46 215 234 91 30
150 IOO 400 210115 310 52
340 205 11.5 31 77275 31 490115 370 77 155 I55 22.t 250 260250
340 77
370 550290
61
I22 - 23 92 180300 31 51 23 61 130138 31 5' 46
340 102113 92 180 46 340 77
272 310387
Time (Hawa-
iian Stan- dard)
0916.3 0918.3 0920.3 0922.4 0924.4 0926.4 0928.7 0930.8 0948.3 0950.7 0952.7 0954.8 0956.7 0958.9
1003 1005.2 1007.3
1011.6 1013.8 1519 1521 1522.8 I525 1526.8 I537 1539.6 I633 I635 I637 1639 1641.3 1643.5 1645.3 1647.5 1649.4 1651.4 1653.4 1656 1658 I 700
I704 I 706
1001.2
1009.5
1701.9
1708.4 1710.4 1712.4 1714.5 1716.4 1718.6
Height Above 8. s. L
4120'
n n
d n n I)
n 2800'
n u 1)
u 4 n
n
n
n
n
H
H
0
n n
n
n
n
n
0
I)
4 n n n n n H n H 1)
b n n n
n n
n
n
n
n n
Rainfall ntensit! nm hr-I
3.3 3.3 2.67 2.2 9.2 6.65 5.05 8.05 0.4 0.32 0.13 5.3 15.9 16 5.83 19.1 4.45 14.7 9.45 6 5.93 0.92 0.38 0.96 0.53 0.19 1.57 0.14 3.7 6.95 5.2 19.9 8.3 25.2 7.9 3.4 3.7 21.5 3.56 4.8 1.32 1.55 2.15 33.9 19.6 12.9 28.6
7 4.9 4.85
12.2
lass of Liquid Water
of air n g b '
370 320 361 332 805 580 524 668 65 50 36 358 910 946 357 1170 348 925 636 440 406 1 I5 56 130 83 34 '75 26.2 408 512 547 1170 605 1310 490 286 33 I 1192 376 44' 184 205 235 1712 952 679 '333 806 532 412 475
~~
Number of drops per ms within 0.2 mm size interval centered about indicated size
0. I
830 830 830
11,300 14,000 3,050 4.700 8.300 2,250 730
7 y * * *
13,500
* * - 830
1,390 280 280
2,800 2,500 13,800 8,000 13,200
-
* * * 9.700 4.700 22,500
4.700 4,200 830
1.400 18,000
-
* * * *
14,800 11,300 8.700 -
0.3
2900 I330 4800 2450 I470 440 2650 440 438 550
275 55 109 109 165 165 495 440 550 275 770 440 1310 880
880 165
I 700 165
930
I 60
220
2200
I200
- I I 0 220 220 1150 990 I800 2300 930 - - 54
- 330 550 1000
0.7 I 0.9 I 1.1 I 1.3 - 2. -
6.
6.
6. 6.
- * Splashing of large drops prevented accurate determination of raindrop concentration.
Tellus IX (1957). 4

5 46
0 d
e,
II) 2
I 2
3 4 5
2 i g cn
1 2 3 4 5
D. C. B L A N C H A R D A N D A. T. S P E N C E R
Mass of Number of drops m-3 within 20 Time Rainfall liquid micron size interval centered about
Date (Hawaiian Position Rate water indicated size (microns). Standard) mm hr-l mg/m3 of ~
air 30 I 50 1 70
0 1711 1) 0.171 197 118 91,650 95,000 76,000
10/26/54 '707 5500' 0.129 99 38,800 77,000 34,000 1) I709 0 0.374 101,360 IZO,OOO 78,000
0 1713 0 0.361 I77 71,640 60,000 62,000 R 1715 n 0.177 118 52,220 56,000 34,000
Number of drops m-3 within 30 micron size interval centered about indicated size (microns)
90 1 I10 I I30 I I50 I I70 I I90 I 210 I 230 1 250 1 270 I 290 I 310 I 330
33,000 27.500 25,200 9.400 2 . 5 5 0 985 365 44,000 26,000 21,500 16,000 8,100 4,400 2,300 1,850 1,940 380 195 100 235 40,000 27,500 16,500 8,800 3,250 1,600 870 880 473 127 37,000 22,500 17,000 13,000 8,000 5,500 2,740 1,620 1,570 400 320 350 39.000 30,000 19,500 11,500 6,400 2,350 875 I45 230
5 0 , I 1 1 I I I 1 40 -
30 -
2 0 -
10 - 8 - 7 - 6 - 5 -
4 - - i 3 -
E 2 - E
c
- rr
I -
.8
.7
.6
.5
.4
. 3
- - - - - -
. 2 -
.I 0 0 3 0.7 1 . 1 1.5 1.9 2.3
D I A M E T E R ( M M ) I N T E N S I T Y V S M A X I M U M DROP S I Z E
FOR DROP R E C O R D E R
Fig. 2.
from the cloud drop spectra and liquid water contents presented elsewhere in t h s volume.
In addition to the above, one may use the maximum drop size to get a rough approxima- tion to the rain intensity R. It is apparent that for a given maximum drop size R may vary considerably especially in transient conditions. Nevertheless the correlation is considerably better than that found in non-orographic rains. Fig. 2 shows this correlation for some samples obtained on 2 December at the 2,800 ft. station. Inasmuch as samples obtained on other days showed essentially the same correlation, it seems reasonable to assume that this may be regarded as typical of Hawaiian orographic rains.
Although extensive runs were made with the dro recorders on a total of 7 days, only
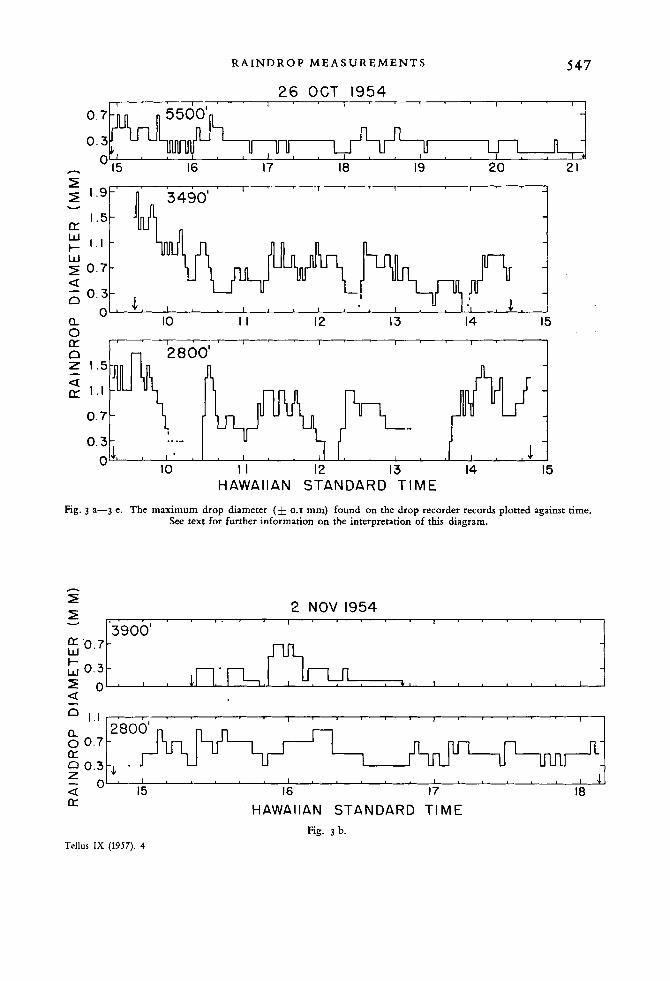
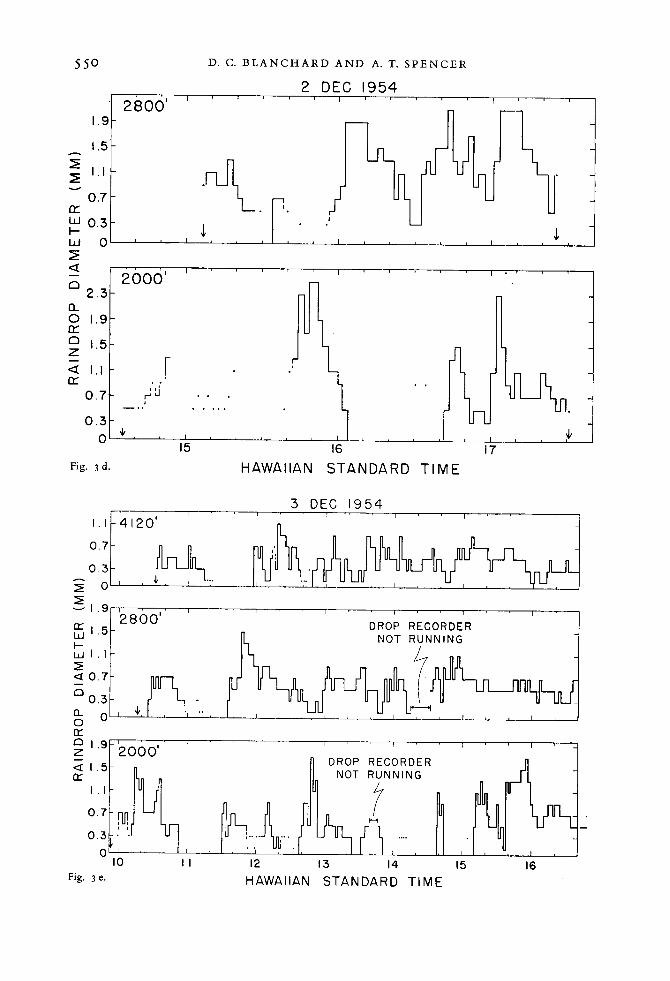
here. Figs. 3 a-3 e illustrate the variation of the largest drops as a function of time. These block ty e diagrams do not directly indicate the time
remembering that a sample was obtained a
vertical lines in the diagram occur at a time midway between adjacent samples.
It will be noticed that isolated points are often found where breaks occur in the block diagrams. Each point represents a sample which contained less than a total of ten drops. Thus,
4 days R ave sufficient interest to be reported
o P observation, but this is easily determined by
proximately every 2 minutes and that t K e
I I ' 1 . 1 . I -
n u , u u n - I , I . I , , I H
0.
0.
h
3900' I ' " ' " ' . " . I
M 7 - -
Y
I .5- LT w
w t- 1 . 1
a
a
-
0.7-
0 0.3- 0.' I , , I I I I . . I I
10 I I 12 13 14 15 * ,
n
0.71, , ) * .. ... 0.3 0 10 I I 12 13 14
H A W A I I A N S T A N D A R D TIME Fig. 3 a-3 e. The maximum drop diameter (* 0.1 mm) found on the drop recorder records plotted against time.
See text for further information on the interpretation of this diagram.
h
5 5 v
2 '0
L
O ' ' 1 5 ' ' " ' 16 I " " ' 17 I " " ' 18 I $ '
- a
H A W A I I A N S T A N D A R D TIME LT
Fig. 3 b. Tellur IX (1957). 4

548 D. C. B L A N C H A R D A N D A. T. S P E N C E R
0.7 ::I h 0.31 = 0- z
HAWAIIAN S T A N D A R D T I M E Fig. 3 c.
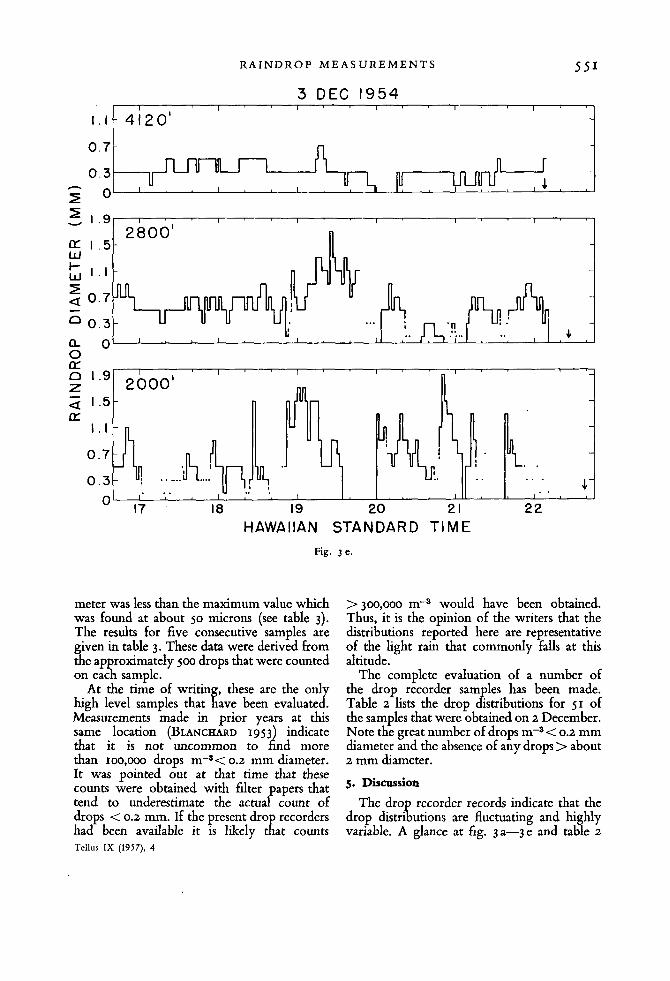
for example, at 2347 on I December at the 2,800 ft. station we find the last samples of a shower in which 10 or more dro s were
exposures, at about 2349 and 2351, showed less than 10 drops each. No rain was noticed on subsequent samples until 0001 when less than 10 dro s were observed.
Near the E eginning and end of the records of figs. 3a-3e (with the exception of the beginning of fig. 3c) a small arrow directed downward will be seen. This arrow points to the time at which the drop recorder was started or stopped as the case may be. In fig.
observed on a single exposure. The fol P owing 2
3c, the record of 1-2 December, all three recorders were set in operation at about 1800 on I December although no rain fell until about 2300.
The rains that fall at high levels on the volcano are often com osed of many small
case was found on 26 October when one of the drop recorders was in operation at the 5,500 ft. level. Examination of the samples revealed that a majority of the spots were less than 200 microns diameter which, from the calibration curve, indicated raindrops less than
dro s that appear to be t ph e winnowed remains of s Yl owers that began at lower levels. Such a
Tellus IX (1957). 4

R A I N D R O P M E A S U R E M E N T S 5 49
D Z 2.3-2000‘‘ a
I - ’ I I I I -
LT 1.9-
I . 5 -
1 . 1 - 0.7 -
0.3-
-
... . .
I I I I I J: in ‘I; -1. /l\.:
Ill I ‘ 1 1 I . ..
HAWAIIAN S T A N D A R D TIME Fig. 3 c.
140 microns. A low power microscope was used for the size determination of the spots and from the subsequent count the data of table 3 were obtained. Here the number of drops per cubic meter are given for a 20 micron band width starting with the range 20-40 microns. Although the blue dye had
been smoothly and fairly uniformly “buffed” into the recording paper it was sufficiently non-uniform to give, under the microsco e
ebbly” ap earance to the paper. TKi ma eitverydi culttogetanyaccuratecount of drops below 20 microns. It is believed that few were present. The number per cubic
fE
Tellus IX (1957). 4
D. C. B L A N C H A R D A N D A. T. S P E N C E R 5 50
Fig. 3 d. HAWAI IAN STANDARD T IME
DROP RECORDER NOT RUNNING
-
10 I I 12 13 14 15 16 Fig. 3 e. HAWAIIAN STANDARD TIME
S S I R A I N D R O P M E A S U R E M E N T S
1 . 1
0.7-
0.3 h
- 4 2 0 ' I I I I I -
-
n i u IILI-I r - I U I I U L J U u 1 . c ,
3 - I . 9
fX 1 . 5 w I- 2 4 0.7
0.3
w I . I
-
a 0 0
I I I I I I 1
n 2800'
I I U LIUULJ UU UL JIiU JU L JUL-
2 1.51
0L-J- 17
a 0 0 uz 0 1.9- I
Z 2 1.5- IT
I I I I I
2000'
. . 4- .. . . .
. .
1 . 1
0.7-
-
. .. I I
18 19 z O I7 a
HAWAIIAN STANDARD TIME Fig. 3 e.
.. u '.I i I
18 19 z 21 22
meter was less than the maximum value which was found at about so microns (see table 3). The results for five consecutive samples are given in table 3. These data were derived from the approximately 500 drops that were counted on each sample.
At the time of writin , these are the onl high level samples that a ave been evaluatei Measurements made in prior years at t h i s same location (BLANCHARD 1953) indicate that it is not uncommon to find more than IOO,OOO drops m-a< 0.2 mm diameter. It was pointed out at that time that these counts were obtained with filter apers that
drops < 0.2 mm. If the present dro recorders tend to underestimate the actu aP count of
had been available it is likely t K at counts Tellus IX (1957), 4
> 300,000 m-3 would have been obtained. Thus, it is the opinion of the writers that the distributions reported here are representative of the light rain that commonly falls at this altitude.
The complete evaluation of a number of the drop recorder sam les has been made. Table 2 lists the drop d%ributions for 51 of the samples that were obtained on 2 December. Note the great number of drops m-3< 0.2 mm diameter and the absence of any drops > about 2 mm diameter.
5. Discussion
The dro recorder records indicate that the
variable. A glance at fig. 3a-3e and table 2 drop distri i utions are fluctuating and highly

D. C. U L A N C H A R D A N D A. T. S P E N C E R 5 52
shows that showers of one-half to one hours duration closely follow one another and a pear
nearly continuous rain. Some of the fluctua- tions in the rain are extremely light and probably would not be picked up by a standard recording rain gauge.
A characteristic common to many of the showers, and one that may be useful in the study of the mechanism of raindrop formation, is the rate of decrease of maximum drop size at the end of a shower. Examples of t h i s may be found on fig. 3 c at the 2,000' station at 0720 and 1000 and at the 2,800' station at 2340 and
to be superimposed on a background of Q. ight,
0540. The diameter of the maximum drop size undergoes a steady decrease at a rate of 0.07-0.1 mm per minute for a period of about 20 minutes. Two explanations for this have been considered (BLANCHARD, I ~ S S ) , but neither has been satisfactory.
A detailed study of the drop distributions and their relationshi s with the rainwater chlorinity and the sa P t nucleus distribution is being carried out. This should supplement and carry further the ideas outlined in an earlier similar study (WOODCOCK & BLANCHARD, 195s).
R E F E R E N C E S
BLANCHARD, D. C., 1953: Raindrop size-distribution in Hawaiian rains. J. Meteor., 10, pp: 457-473.
- 195:: Discussion of raindrop Qstributions made during Project Shower, Hawaii, 1954. To be published by the Pergamon Press in a volume of the papers presented at the Conference of the Physics of Cloud and Precipitation Particles (Woods Hole, September).
SIMPSON, R. H., 1952: Evolution of the Kona storm, a subtropical cyclone. J. Meteor., 9, pp. 24-35.
WOODCOCK, A. H., and BLANCHARD, D. C., 1955: Tests of the salt-nuclei hypothesis of rain formation. Tellus, 7, pp. 437-448.
Tellur IX (1957), 4