rainbow coalitions or inter-minority conflict? - canadian political
TRANSCRIPT

Rainbow Coalitions or Inter-Minority Conflict?
Racial Affinity and Diverse Minority Voters
Abstract: There is a considerable amount of research on racial affinity effects – voters being more likely to support a candidate of the same race - but not whether this applies only to candidates of the voters’ specific ethnocultural group, or also to racialized candidates in
general. Research from the United States, Europe, and Canada suggests that racialized citizens will support a white candidate over a candidate of a different ethno-cultural minority. In other words, the prospects for "rainbow coalitions" on the basis of group identities are poor. To test this, the paper uses new data from a web-based survey experiment with a large panel of visible
minority respondents. Respondents evaluated candidates in a hypothetical election. The key manipulation varied the ethnicity of one of the candidates. While respondents show strong affinity for their own ethnocultural group, they also seem to show some affinity for other
minority candidates, and certainly no inter-minority conflict. “Rainbow coalitions” may be more likely than previous research suggests.
Randy Besco Queen’s University
Prepared for the Canadian Political Science Conference 2013 Do not cite without authors permission

Calls for solidarity and political cooperation between racial and ethnic minority groups have been made by various public figures and activists, generally on the left, for many years. Perhaps most famously, Jesse Jackson called for a “rainbow coalition” at the 1984 Democratic Convention. Initial analysis of the 2008 and 2012 Presidential Elections seemed to suggest that this kind of coalition might be in the offing. As is well known, African-Americans’ support for Barack Obama was nearly unanimous in these elections. At the same time, however, Latino voters have strongly supported Barack Obama (Pew Centre 2012) and, in the 2012 general election, a record 72% of Asian-American also voted for the Democratic Party (National Journal Nov. 8th 2012). At the same time, Republicans worried about losing the support of Latino voters to the Democratic Party sometimes argue for the nomination of Marco Rubio, a Republican Senator from Florida of Cuban decent, as the party’s presidential standard-bearer. Minority candidates, so many people clearly believe, are an important way of attracting the support of minority citizens. Activist and academic advocates of “rainbow coalitions” make the claim that minority communities often share similar experiences and needs. Some adopt a critical approach to identities, such as Spivak’s “strategic essentialism” (1987), and others the more prosaic language of policy gains and electoral calculi (Henry 1980). Interests arising from these shared experiences include issues related to racism and discrimination, immigration, and the recognition of foreign credentials, among others. Yet the political behavior that would underpin such coalitions may rest more on the structure and influence of social identities than on these commonly held issues of concern. The plausibility of minority coalitions, so far as they rest on identities and not policy, hinges on how ethnocultural identities influence voters, and how those identities are understood. The implication is that the ethnocultural background of minority candidates makes them more appealing to voters who sharing that identity. But how are these identities defined, and which matter most? One possibility is that generalised racialized status may be influential: visible minority voters may support visible minority candidates, whether or not a specific ethnocultural identity is shared. On the other hand, citizens may only show a preference for candidates of their own ethnocultural background, undercutting the identity basis for a rainbow coalition.
As visible minority Canadians continue to increase in number and political importance, we should expect a growing number of visible minority candidates and party leaders. However, Canada’s visible minority population is large, but also very diverse -- nearly 1 in 5 Canadians are classified as visible minorities, but the largest sub-group, South Asians, comprises only 25% of the total visible minority population (Statistics Canada 2013). Does this diversity imply division?
If conflict rather than cooperation among minorities is the norm, there are a number of important implications. Most obviously, coalitions on shared issues will be much harder to build. In addition, while minority candidates are more likely to be nominated in diverse areas (Black 2008), their ethnocultural community is likely to constitute only a plurality of the population in these areas. If racialized voters prefer white candidates to candidates from racialized communities other than their own, then this may have a systematically negative impact on candidates from all racialized communities. Perhaps most importantly, inter-minority conflict would make leadership of major parties by minority candidates much more difficult, since a racialized leader would suffer from both the racism of (some) white Canadians and antipathy from other minority groups.
This paper draws on data from a web-based survey of visible minority Canadians. The analysis centers on the results of an experiment that aimed to manipulate the perceived ethnicity of a candidate,

by varying that candidate’s name between stereotypically European or white, Chinese, and South Asian alternatives. The paper discusses existing research from the United States, Europe and Canada, which suggests that the prospects for rainbow coalitions are slim and inter-minority conflict is the norm. The experiment, data and results are then set out, including basic descriptives and regression analyses addressed to specific hypotheses. Here, the focus is on the a) overall influence of ethnocultural background and b) conditional influence of ethnocultural background given respondents’ strength of group identity. Contrary to previous research, the results are surprisingly positive for the prospects of a rainbow coalition in Canadian electoral politics. While respondents are most likely to support a candidate of their own ethnocultural group, there are also positive effects for other minority candidates.
Candidates and the Influence of Social Group Membership Inferring a candidate’s membership in a social group – a simple and easily obtainable piece of information, when compared to forming inferences about policy commitments or performance in office – allows citizens to bring their opinions about social groups or political values to bear on the voting decision. When voters and candidates belong to the same social group and this relationship increases support, this is often referred to as “affinity”. There is a considerable amount of research on voting for candidates of a shared gender (e.g. Kaufmann and Petrocik 1999; Brians 2005; Goodyear-Grant and Croskill 2011) or shared race (e.g. among Black Americans [Sigelman and Sigelman 1982; Philpot and Walton 2007] and Latino-Americans [Baretto 2007; Stokes-Brown 2006]). Studies on racial affinity, primarily focused on African Americans, have found substantial support for the ttheory (Philpot and Walton 2007). Research on American Latinos shows similar results, although research in this area tends to refer to greater support for “co-ethnic” candidates, rather than racial affinity (Baretto 2007; Stokes-Brown 2006). Although research on Latino candidates is less developed than research on Black candidates, the findings confirm the political influence of ethno-cultural background, and that voters are more likely to support candidates from their own social group.
There are two major theoretical explanations for affinity effects, the heuristic and group affect accounts. As Cutler (2002) suggests, candidate demographics are the “simplest shortcut”. The exact content of these heuristics is unclear, but candidate demographics may allow voters to infer policy positions, issue competency, or make self-interested judgements about which candidate will help them the most. In one of the few studies that examined affinity heuristics directly, McDermott (1998) found that affinity effects were explained by the perception of female candidates as leftwing and black candidates as willing to “do more for Blacks”.
A second possible explanation for affinity effects, though not one that has been evaluated by political science affinity research, involves the influence of group affect. Social identity theory (Tajfel 1981) suggests that citizens may be more likely to want a candidate belonging to their social group to win because the success (and not failure) of a fellow group member can have a direct impact on self-esteem. In addition, such “in-group bias” tends to make people rate their own group higher on evaluations in general, and we would expect these group attributions to be reflected in judgements about candidates. Naturally, positive candidate attributes increase the likelihood of support and negative attributes reduce it (Stokes 1966; Rahn et al. 1990). Also, there may be indirect effects reflecting the psychology of persuasion. The source of messages is important for their persuasiveness, and the effectiveness of campaign messages can vary significantly depending on the credibility of their source (Petty and Cacioppo 1981; Iyengar and Valentino 2000). The roots of such source persuasiveness are complex, but certainly source attractiveness and trustworthiness are key factors (Pornpitakpan 2006). If the voter belongs to the same social group as the candidate, therefore, the persuasiveness and effectiveness of campaign messages may be increased.

Which Identity? While the logic of affinity voting appears simple, it depends on the construction of group identities. Since group identities have multiple levels of specificity, it is not obvious which should take priority in the voting situation. Given the history of race as a polarized concept in the United States and other Western countries, the difference between white and non-white may be the most important cleavage in these societies, especially when the electoral decision is constructed as a choice between a white and a racialized candidate.
We might think that racialized citizens suffer from discrimination, or have common interests such as regards immigration and other policies, and that, therefore, citizens see other racialized groups as fellow “victims” or potential allies. Existing research, however, suggests the opposite. Research from Europe, Canada, and the United States all points to a lack of common identification or solidarity between minority groups, and perhaps even preference for association with whites over other minorities. The most explicitly political research on inter-minority relations has been conducted in the United States, with a focus on Blacks and Latinos. One possibility is that minorities of all kinds could form “rainbow coalitions” and, thereby, greatly increase their influence (Jennings 1994, Browning, Marshall and Tab 1984, Kaufmann 2007). However, in general, the prospects for such coalitions are poor in urban politics (McClain and Karnieg 1990) and school district elections (Meier and Stewart 1991), there is evidence that Latinos hold negative stereotypes of Blacks (McClain 2006), and there is apparently little hope for agreement between these groups on policy (Hochschild and Rogers 2000). Overall, the finding that Black-Latino coalitions are rare and fragile is nearly unanimous.
Related social attitudes research comes to similar conclusions – that minority groups prefer to maintain greater social distance from each other than they do from the dominant majority. In the Netherlands, for example, Turkish immigrants preferred to associate with ethnically Dutch people as compared to Surinamese immigrants, and vice versa (Hagendoorn 1995). This pattern has repeated itself in other countries, such as Russia (Hagendoorn et al. 1998) and the Ukraine (Hagendoorn and Poppe 2003).
In Canada, there is a limited amount of research on relationships between racialized minority groups, but the findings are similar. Two studies of social attitudes by Berry and Kalin found that minorities tend to rate whites higher than other minority communities on a whole range of positive attributes, such as honesty and being well educated. Minority groups also view themselves as “more similar” to white anglophones than to other minorities (Berry and Kalin 1979, 1996). The only explicitly political study in Canada to explore this topic is a working paper of municipal council elections by Karen Bird (2011), which found that minorities gave the highest support to a candidate from their own ethnic group, followed by the white candidate, with the other minority candidate being the least popular. Unfortunately, this study was limited in a few important ways. As Bird notes, subjects evaluated just a single candidate rather than being asked to choose between candidates. In addition, the biographies included a manipulation for social and business policy orientation – a useful point to study, but which reduces the room for the use of heuristics. Further, there was only one same-ethnicity pair (South Asian Candidate, South Asian Respondents) and one different-minority-ethnicity pair (South Asian Candidate, Other Visible Minority Respondents) used in the study. Therefore, it is not possible to compare the effect of similar and different minority candidate for the same group of respondents. Nonetheless, the fact that this study finds the same dynamics as American and European studies reinforces our expectation of political conflict, rather than cooperation, among minority groups in Canada. Strength of Ethnic Group Identity The concept at the centre of this inquiry is ethnocultural identity. That is, we expect participants to support the candidate who shares with them a common group identity. At the same time, it is likely that

individuals vary in the extent to which identification with a particular group is personally important to them. Of course, some groups are likely to have stronger ethnocultural identities than others – perhaps recent immigrants, those not educated in Canada, religious non-Christians, those who experience racism or exclusion by Canadians, etc. This is an important consideration as regards the use of heuristics: why assume that a member of your group would agree with you on important issues if you do not feel strongly connected to that group? Similarly, in-group bias is contingent on the strength of group identity. If the group affiliation between candidate and voter is weak, the performance of the candidate is unlikely to affect the voter’s self-esteem.
Although use in political science has been limited, the measurement of the strength of identity has played an important role in sociology, social psychology, and organisational behavior studies, including the Identification with a Psychological Group Scale (IDPG) (Mael and Tetrick 1992). Among other applications, this scale has been widely used for understanding commitment to organisations (Iyer, Bamber, and Barefield 1997, Bartles et al 2006), as well as willingness to cooperate (Dukerich and Golden 2002), responses to unethical behavior (Ploger and Bisel 2013)and participation in social movements (Brewer and Silver 2000). As a more nuanced way to understand social group membership, these concepts may be very useful in political science. Indeed, Greene (2000) argues that the concept of party identification described by authors of the American Voter (Campbell et al 1964) is a precursor to the social psychology research such as Tajfel (1982). To date, the use of such measures in political science has been limited to a series of studies on partisanship (Connaughton
2010, Greene 1999, 2002; Weisberg and Green 2003). Surprisingly, there has been little research applying these concepts to race or ethnicity, although one study of Chinese immigrants to Canada confirmed the validity of the IPGS scale for ethnicity (Kester and Marshell 2003). The fruitful application of the IPGS scale to socio-political identities such as partisanship suggest that it may be very useful in evaluating how the strength of identity moderates the effects of ethnocultural membership.
Overall, political research from the United States and sociological and attitudinal research from Europe and Canada suggests that the key identity categories for affinity effects are specific ethnocultural groups, not racialized status in general. Not only has this research shown political conflict between minorities, each minority group seems to prefer affiliation with the white majority over affiliation with other minorities. Affinity effects, therefore, should be limited to specific ethnocultural backgrounds, rather than racialized status generally, and “rainbow coalitions” are unlikely. Furthermore, affinity effects should be related to the strength of group identity: identity-related considerations – whether coalitional or conflictual – should be more influential for those with stronger identities.
Hypotheses and Method Based on previous research, this study tests five hypotheses. The first focuses on the rainbow coalition thesis – in general, are visible minority citizens more likely to support visible minority candidates than other candidates? If racialized citizens see other racialized citizens as part of a common group of minorities (per the group affect account) or as “like themselves” in relevant ways (per the heuristic account), then there should be affinity effects for visible minorities in general. However, given the research on inter-minority conflict this seems unlikely - so our expectation is that no, there will not be a general visible minority affinity effect.
H1: Ethnocultural minorities will be more likely to choose a visible minority candidate than a White candidate. The second hypothesis is a test of affinity effects on the basis of specific ethnicity. The question
is, are minority voters more likely to support candidates who share their ethnocultural background? Given positive findings for Black and Latino affinity, we should expect affinity effects in Canada as well.

H2: Ethnocultural minorities will be more likely to choose a candidate of their own ethnocultural background than a white candidate. The third hypothesis is based on the inter-minority conflict research, which suggests there will
be no affinity effects between candidates and voters of different ethnocultural minority backgrounds. In fact, minorities seem likely to prefer the white candidates over candidates belonging to a different racialized group.
H3: Ethnocultural minorities will be less likely to choose a candidate with a different minority ethnocultural background than a white candidate. The final two hypotheses repeat the previous two, but suggest the effects – both affinity and
inter-group conflict - will interact with the strength of ethnic group identity. Stronger identification with the ethnocultural group should increase these effects, whatever their direction.
H4: Ethnocultural minorities who have a stronger ethnic group identity will be more likely to choose a candidate of the same ethnocultural background than those with a weaker ethnic group identity. H5: Ethnocultural minorities who have a stronger ethnic group identity will be less likely to choose a candidate of a different ethnocultural background than those with a weaker ethnic group identity.
To test these hypotheses, a survey experiment was performed. Participants were presented with short biographies of two candidates, and asked which they would vote for. The benefit of using a choice between two candidates, rather than asking for an evaluation of a single person, as some studies have done (e.g., Bird 2011; see also Harrell, Soroka, Iyengar, and Valentino 2012), is that it presents a more realistic test for the question at hand. Most obviously, it replicates the structure of a real election where citizens are asked to choose between multiple options, rather than to evaluate a single candidate. In addition, asking respondents to “disapprove” of a single person may actually be setting a higher bar for discriminatory behaviour than simply expressing a preference of one option over another. By simply choosing an alternate option, the design used in this model does not require a “negative” action of rejection a person, which might be more likely to trigger socially desirable behavior.
The candidate bios themselves were not manipulated – Candidate 1 was constant across conditions, and only the name of Candidate 2 varied. As a result we cannot examine the effect of the biographies themselves, and we must assume that there are no important interactions between the content of the biographies and the variables of interest. Keeping this in mind, the biographies were written to present more or less equally qualified candidates to be Members of Parliament, balancing the need to have plausibly different candidates, while not introducing factors that might interact with the treatments. The candidates were “independent”, rather than having party labels, since research suggests that party cues may suppress the effect of other heuristics (Rahn 1993). Each candidate was described as having a career in business and prior, non-controversial community involvement. No pictures were used. This avoids confounding with the effects of candidate attractiveness, and also

reflects the reality of Canadian elections at the local level, where most voters see signs with the local candidate’s name without a picture1. Finally, the order of candidates was randomised.
One notable feature of the biographies is that each contained a “fault” – that is, some less than ideal (from the perspective of electoral politics) personal feature was attributed to each candidate. The importance of this design choice is that, as past research demonstrates (e.g., Crosby, Bromly, and Saxe 1980) discrimination is often evident only when there is an “excuse” or justification for such behaviour. When evaluating a “perfect” individual, even highly prejudiced people might not discriminate because there is no socially acceptable justification. This may be true of consciously prejudiced individuals seeking to avoid social censure; likewise, those with unconscious prejudiced attitudes who, nonetheless, see themselves as tolerant may (unconsciously) exaggerate and over-emphasize a fault in a minority candidate more than they would in regards to a white candidate. Thus, the faults in the biographies provide both a possible external social justification as well as an internal psychological justification for participants who might have discriminatory tendencies. Specifically, Candidate 1 is described as having been laid off twice, before going on to found his own company. Candidate 2, on the other hand, is described as having ran and lost in a previous election. Of course, for reasons of plausibility these are different faults – being laid off is not the same as losing an election. Nonetheless, all we are required to assume is that there is no interaction between the variables and the type of fault (i.e., failure as employee or as a candidate).
The primary treatment was a manipulation of candidate ethnicity. The control group was presented with two candidates, both of whom had stereotypically European names: John Hawkes (Candidate 1) and Arthur Dorre (Candidate 2). The two treatment groups were presented with the same two candidate biographies, but Candidate 2 was given either a traditionally Chinese (Jun Zhang) or South Asian (Satveer Chaudhary) name. While, of course, names themselves are not necessarily a correct signifier of ethnocultural background, pre-testing indicated that respondents accepted the implied ethnicity. The names were chosen from a list of common Chinese and South Asian names in Ontario, drawn from healthcare records (Shah et al 2010). Several of these were selected, and discussed with members of the respective communities, as well as faculty members with relevant experience. Names which were the same as Canadian politicians or candidates were excluded. Those which had highly specific religious associations (ie, Singh) or which might be European (i.e. Lee) were also avoided. Table 1 illustrates the factor structure and reports cell sizes by ethnic self-identification (assignment was randomize). The complete stimulus and candidate-preference question read as follows, with manipulated sections bolded:
Candidate 1 John Hawkes is an entrepreneur, and after being laid off twice he started the successful company Allsort Inc. Despite a busy schedule Mr. Hawkes works with a number of organizations, including Kids Help Phone, and served as Vice Chair of the Municipal Safety Committee. John Hawkes is an independent. Candidate 2 Authur Dorre/Jun Zhang/Satveer Chaudhary is an active local businessman, who was recently honoured as “Businessman of the Year” for his many contributions. Mr. Dorre/ Zhang/Chaudhary helps at the local community centre, and is the fundraising chair for the Hospital Foundation. A former provincial candidate, he lost in the most recent election. Authur Dorre/Jun Zhang/Satveer Chaudhary is an independent. Which candidate would you vote for?
1 Quebec is the exception, where pictures on signs are nearly universal. As described below, however, the data for
this study were collected outside Quebec.

[Table 1 about here]
The survey was conducted with Canadian residents, in English, with no respondents from
Quebec. The sample was drawn from a web-panel, selected using a demographic screening survey. Ethnicity was measured using a self-definition question: “Statistics Canada defines some Canadians as “visible minorities.” Do you consider yourself to belong primarily to any of the following visible minority groups?”. The categories used by Statistics Canada were provided to respondents, including Arab, Black, Chinese, Filipino, Japanese, Korean, Latin American, South Asian, South-East Asian, and West Asian. Participants could also respond that they were Aboriginal or did not belong to any visible minority group. The analysis conducted here includes a total of 1,313 respondents, including 792 visible minority respondents and 521 non-visible minority respondents. While no quotas were used to select participants on the basis of a specific ethnicity, 351 subjects self-identified as having Chinese origins, 151 as having South Asian origins, 290 as having other minority backgrounds, and 521 as having non-visible minority backgrounds.
To measure the strength of this group identity, the survey used a modified set of questions from the “identification with a psychological group” (IDPG) scale (Mael and Tetrick 1992). The scale consists of a number of statements and a five-point response scale from “strongly agree” to “strongly disagree”. Three statements were used in this survey:
When someone criticizes (group) people, it feels like a personal insult. When I talk about (group) people I usually say “we” rather than “they”. When someone praises (group) people it feels like a personal compliment.
The category selected in response to the Statistics Canada ethnicity question defined what was inserted into the question at group. So, for instance, the participant might read: “When someone criticises South Asian people, it feels like a personal insult”. In all cases, general ethnic identifications, rather than specific nationalities, were utilized in order to ensure comparability across groups. Specifically, Japanese, Chinese, and Korean respondents were asked about “Asian”2 people, and Filipino respondents were asked about “South-East Asian” people. Responses to the three strength of identification items were combined into a fifteen-point additive index and scaled 0-1.
Data and Analysis The results are presented in two stages. In the first stage, to convey an intuitive sense of the findings, we consider simple comparisons of percentages across experimental conditions for specific groups of respondents. In the second stage, I analyze estimates of logistic regression equations and construct specific hypothesis tests. The latter allow us to control for a range of observed covariates, both to avoid omitted variable bias (which is critical, given that respondent ethnicity and strength of identification are, of course, observed rather than assigned) and to enhance estimation precision. Throughout the analysis, the primary measure reported is support for Candidate 2 – that is, support for the candidate whose name was manipulated. The key comparisons are across experimental conditions, and therefore we are interested in different levels of support for the different versions of Candidate 2.
2 After some discussion with community members, it was decided that Asian, rather than East Asian was a more
natural sounding category, and would be easily understood in the context.

The first hypothesis is that visible minority respondents in general be more likely to support visible minority candidates. Figure 1 pools all visible minority respondents and reports the percentage supporting Candidate 2 when the candidate is white (i.e., Arthur Dorre) and when the otherwise identical candidate has a South Asian or Chinese name (i.e., Satveer Chaudhary or Jun Zhang). The results confirm Hypothesis 1 - visible minority respondents are clearly more likely to support Candidate 2 when he is a visible minority than when he is an apparently white candidate. Specifically, 7 percent more visible minorities supported Candidate 2 with a visible minority name than with a non-visible-minority name. While the effect is moderate in size, it is, strikingly, certainly not the negative effect that previous research suggested. On its face, this is a sign that rainbow coalitions are more plausible than previously appeared, at least in Canada.
[Figure 1 about here] Focusing on respondents identifying as Chinese and South Asian, we now examine affinity along
ethnocultural lines. Hypothesis 2 asserts that respondents will be more likely to support a candidate who belongs to their own ethnocultural group. As Figure 2 shows, support for Candidate 2 is higher when the candidate has an apparent ethnicity that matches that of the participant than when the same candidate appears to be white. This fits, of course, the results for the first hypothesis. While the point estimates show the same pattern, however, there are clear differences in the size of the effect between Chinese and South Asian respondents. South Asian respondents show quite large affinity effects for the South Asian candidate – in this group, the South-Asian Candidate 2 “beats” the white Candidate 1 by over 11 percentage points. The impact of seeing a Chinese candidate for Chinese origin respondents, on the other hand, is much smaller: the corresponding margin is just 2.4 percentage points. While both results confirm the hypothesis, then, the size of the effect clearly varies.
[Figure 2 about here]
The third hypothesis implies that participants will be more likely to support the white candidate
than a candidate of a different ethnocultural minority. For example, we would expect that fewer participants who identify as Chinese will support the South-Asian version of Candidate 2 than support the white version of Candidate 2. However, the evidence contradicts expectations – support for the candidate of a different minority is higher than for the white candidate. Figure 3 presents the percentage supporting Candidate 2, across his varying apparent ethnic affiliations, separately for Chinese, South Asian and other visible minority respondents (excluding “matches” between voters and candidates, e.g., support among South Asian voters for the South Asian candidate). The size of this generalized affinity effect is smaller than affinity effects for candidates of the voter’s same ethnocultural group, but positive nonetheless. This is surprising and is contrary to evidence – from Canada and elsewhere – that suggests conflict between minority groups. The results here are even clearer than in Figure 1 and provide more evidence pointing toward the plausibility of rainbow coalitions. While the pattern is the same for all groups, similar to the affinity effects in Figure 2, there are clear differences in the size of the effect between ethnic groups: for instance, South Asian respondents again show the largest effect at 6.9 percentage points, whereas other visible minority respondents happen to support the white and Chinese candidate at exactly the same rate.
[Figure 3 about here]
We now analyze a series of logistic regression models, both to provide rigorous tests of the
foregoing hypotheses and to investigate H4 and H5, which have not yet been examined. In the first model, vote choice is the dependent variable, where 1 is support for Candidate 2. The independent

variables are candidate visible minority status (i.e., the experimental treatment level) and participant visible minority status. An interaction between these two variables is also included. Note that, unlike in the preceding figures and discussion, the regression sample also includes white respondents. This increases the precision with which certain model parameters can be estimated. The model is detailed in Appendix 2. The predicted probabilities reported below were generated using the CLARIFY add-on to Stata (Tomz, Wittenberg, and King 2003).
To provide a formal test of the first hypothesis, we compare the predicted probability of visible minority respondents voting for Candidate 2 under two conditions: seeing a white candidate and seeing a visible minority candidate. This considers the possibility of a rainbow coalition broadly defined – it answers the question, are visible minorities more likely to support a visible minority candidate than a white candidate? Similar to the results in Figure 1, the predicted probabilities in Figure 4 show evidence for the plausibility of a rainbow coalition: visible minority respondents are 6.8 percentage points more likely to support a visible minority candidate than an identical white candidate. The difference between the predicted probabilities is significant at the 90-percent confidence level. Contrary to expectations, the predicted probabilities do support the hypothesis. Due to research on inter-minority conflict, we did not expect affinity among visible minorities in general, but this provides evidence in favour of potential rainbow coalitions.
[Figure 4 about here] To test the second hypothesis, concerning affinity along specific ethnocultural lines, support for
the white version of Candidate 2 needs to be compared to support for Candidate 2 when his ethnicity “matches” that of respondents. To do this, I estimate a second model, where candidate and participant ethnicity are broken into dummy variables for specific ethnicities: for candidate ethnicity these are, of course, white, Chinese and South Asian; for participant ethnicity the categories are white, Chinese, South Asian, and other minorities. The reference categories are white candidate and white respondents. The dependent variable remains vote for Candidate 2. Predicted probabilities are generated separately for Chinese respondents and the Chinese candidate and for South Asian Respondents and the South Asian candidate. Results are shown in Figure 5. Both groups show evidence of affinity effects: South-Asian-identifying participants are on average 15.3 percentage points more likely to vote for a South Asian candidate than for an otherwise identical white candidate, while Chinese-Canadians are 5.6 percentage points more likely to support an apparently Chinese candidate. The effects for South Asian affinity are significant at the 90-percent confidence level; the affinity effect for Chinese origin respondents is not significant. This partially confirms the second hypothesis: while there is clear evidence for affinity effects among South Asian identifying respondents, the evidence for affinity effects among Chinese respondents is more equivocal.
[Figure 5 about here]
The third hypothesis is about relations between different minority ethnocultural groups –
whether participants are more likely to support a white candidate over a candidate of a different minority group. I test this hypothesis in two ways – first within (respondents’) ethnic identification groups and then among visible minorities as a whole. Using the same model as underlies Figure 5, we can consider four groups of respondents who see a different minority candidate: Chinese respondents saw the South Asian candidate; South Asian respondents saw the Chinese candidate; other minority respondents saw the South Asian candidate; and other minority respondents saw the Chinese candidate. This generates four pairs of predicted probabilities comparing support for the minority candidate to support for the white control candidate, as shown in Figure 6. The pattern here is the same as depicted in Figure 3: contrary to expectations, support is higher for the candidate of a different

ethnocultural minority background than when the candidate is white. This suggests that racialized citizens have affinity for racialized candidates generally, rather than just for candidates of their own specific ethnocultural group. However, these effects are not estimated with much precision. The two estimated differences for other visible minority respondents are significant only at the 85-percent level; effects for the Chinese and South Asian respondents are far from conventional levels of significance. In any event, the findings are certainly inconsistent with the third hypothesis, if not decisively demonstrating affinity between different ethnocultural groups.
[Figure 6 about here]
The final two hypotheses are restatements of the previous two, with the addition of an
interaction with strength of identity. The fourth hypothesis states that stronger ethnic group identity will strengthen affinity along ethnocultural lines. To test this I introduce the strength of group identification measure to the analysis. In this third model, the dependent variable is, again, support for Candidate 2, with dummy variables for Chinese and South-Asian versions of Candidate 2, and indicators for Chinese, South Asian, and other visible minority ethnocultural identification. To evaluate the moderating effect of strength of ethnocultural identity, a three-way interaction between the strength of identity scale, participant ethnicity and candidate ethnicity is introduced, along with its constituent terms. Since the measurement of “white” identity is quite different conceptually, non-visible minorities are dropped from the model, and other visible minorities (non-Chinese or South Asian) are made the reference category. Then, predicted probabilities for candidate support are generated, at the 25th- and 75th- percentiles (for the sample as a whole) of strength of group identification (0.5 and 0.75).
Figure 7 compares the support for the white and minority versions of Candidate 2 and clearly shows that the affinity effects are considerably stronger for participants with stronger ethnocultural group identities, confirming Hypothesis 4. In fact, both Chinese and South Asian affinity effects are not statistically significant in for “low ID” respondents (i.e., those at the 25th-percentile of the measure). Among “high ID” respondents (i.e., those at the 75th-percentile), the South Asian affinity effect is quite large: South-Asian-identifying respondents are 24.3 percentage points more likely to support a South Asian candidate than a white candidate. In addition, whereas Chinese origin respondents showed no statistically significant affinity effect when strength of identification was not taken into account (as in Figure 5), now strong identifiers are 14 percentage points more likely to support a Chinese candidate than a white candidate, and the effect is statistically significant. By contrast, for weak ethnic group identifiers the point estimates of support are nearly identical for the Chinese and white versions of Candidate 2. In other words, at the 25th-percentile of the strength of ethnic group identification, Chinese origin respondents are indifferent to whether or not the candidate is of their own ethnicity. This is an important finding, since it shows that affinity effects are not limited to South Asian respondents -- such effects also manifest themselves among Chinese respondents at higher levels of strength of ethnic group identification. As Table 2 indicates, the probability of the null is low – the difference in effects are significant at the 90 percent confidence interval. That is, the likelyhood of the expected effect - affinity being higher at high levels of strength of ethnic identity, and lower at low levels of strength of affinity – actually being zero or negative is quite low. This is the case for South Asian affinity but also for Chinese affinity, which was not the case in Figure 5 without the effect of strength of ethnic identity3. These results are a clear confirmation of the fourth hypothesis: participants who identify only weakly with
3 To test the significance of second differences in the three way interaction, CLARIFY is used to generate and store
the distribution of first differences at different levels of the strength of Identity. The proportion of the difference in the two distributions of interaction estimates that is zero or incorrectly signed is referred to as the “probability of the null”, that is, that the difference of the two interactions may be zero. Here I follow Jacobs and Mathews (2012)

their ethnocultural group are much less likely to support a candidate of that ethnicity than those participants who identify strongly with their ethnocultural group.
[Figure 7 and Table 2 about here] The fifth hypothesis states that participants who have a stronger ethnic group identity will be
less likely to choose a candidate of a different ethnocultural background than those with a weaker ethnic group identity. This combines expectations about inter-minority conflict with those of strength of group identity. Given that we found affinity, rather than conflict, between different minorities (Figure 3), this hypothesis now seems unlikely. However, it is possible that people with particularly intense ethnic group loyalties will have more negative opinions about other minority groups, or perhaps group identities are to some extent mutually exclusive – a stronger specific ethnocultural identity means a weaker broader racialized group identity. To test this hypothesis, predicted probabilities are generated for the white and minority versions of Candidate 2 for each of the four combinations of ethnocultural minority participant and candidate pairs, at the 25th- and 75th-percentiles of the strength of identity measure. Since this works out to an unwieldy 16 predicted probabilities, Figure 8 presents the difference between the white and minority candidate – effectively, the size of the treatment effect.
The results are not consistent with Hypothesis 5 – in most cases, it seems that stronger ethnic identification makes visible minority respondents more likely to support the minority candidate, not less. Nonetheless, strength of identity seems to interact with the treatment effects found in Figure 6. In that sense, it confirms the effect of the measure, and similar to the results in Figure 5, a person identifying strongly as South Asian is more likely to support a Chinese candidate than a person identifying weakly as South Asian. In other words, stronger ethnic identity increases affinity for all minorities, not just one’s own minority group. The strength of these effects is clearly weaker than affinity for the same ethnocultural group – strong South Asian identifiers are 24 percentage points more likely to support a South Asian candidate, but only 9 percentage points more likely to support a Chinese candidate -- but they are positive nonetheless. The statistical significance of these results is, in general, quite low: only Chinese respondents’ affinity for the South-Asian version of Candidate 2 is significant at the 90-percent confidence level. That said, again, the lack of a negative effect provides decisive evidence against the hypothesis in question (even if we cannot draw firm conclusions about positive affinity effects across different ethnocultural groups).
[Figure 8 and Table 3 about here]
Nonetheless, statistical significance considerations aside, one exception to note is other visible
minorities’ responses to the South Asian candidate: here, low identifiers seem more likely to support the minority candidate than high identifiers, the reverse of the typical pattern. Also notable is the fact that low identifying Chinese respondents actually seem to prefer the white candidate less than the Chinese candidate – That is, the experimental manipulation from white to Chinese reduced support for Candidate 2 – the only negative effect of this kind in the study. The distance between the two point estimates is 0.11 for the Chinese respondents and 0.09 for the South Asian respondents – nearly identical effect sizes. This is important, given how much larger the South Asian affinity effects were in the Figure 5 – only 0.01 for Chinese respondents and 0.13 for South Asian respondents.
. Discussion and Conclusions This paper explores the role that different kinds of ethnocultural identity play in affinity effects, and begins with the expectation that there will be affinity between candidates and voters of the same

ethnocultural group, but a preference for white candidates over candidates from other ethnocultural minorities. While the existence of ethnocultural affinity is confirmed, there is no evidence of discrimination between minority groups. In fact, affinity effects seem to extend to racialized candidates in general.
Of the five hypotheses, Hypotheses 1, 2 and 4 were confirmed, but , 3, and 5 were not. These findings suggest four broad conclusions. First, there is no discrimination among visible minorities against other minorities, that is, no preference for white candidates over candidates of a different racialized background. Second, there appears to be some affinity across ethnocultural lines: racialized respondents are more likely to support candidates from a different ethnocultural minority group than white candidates. Third, there are affinity effects for candidates of the same ethnocultural group, and these are stronger than affinity effects for other candidates of minority backgrounds. Finally, the likelihood of affinity is conditional on – specifically, positively correlated with -- the strength of ethnic affinity: respondents who identify strongly with their ethnocultural group are much more likely to support a minority candidate than those who identify only weakly.
The first hypothesis is the simplest, but also focuses on the crux of the political issue – do minority candidates attract less support from visible minority citizens identifying with a group other than the group with which the candidate identifies? The evidence here suggests that contrary to expectations we should accept hypothesis - far from discriminating, the predicted probabilities indicate that visible minority respondents are 7 percentage points more likely to support the visible minority candidate than an otherwise identical white candidate, an effect significant at the 90-percent confidence level. If we are looking for evidence of the plausibility of a “rainbow coalition”, this is a good start.
The rejected hypotheses all drew on research that suggested minority group relations are likely to be characterised by conflict – clearly, this is not the case here. Hypotheses 3 and 5 look specifically at willingness to support other minority groups, and are both rejected: visible minority respondents do not discriminate against candidates of different minority backgrounds. This is true of visible minority respondents in general and among those with a relatively strong sense of ethnic group identification. Here, the evidence of cross-ethnicity affinity is weaker – despite positive point estimates across the board in Figure 5, the estimates for Chinese Respondents who saw a South Asian candidate, and the South Asian Respondents who saw a Chinese candidate, are not statistically significant. However, other visible minorities were more likely to support the Chinese candidate (8 percentage points) and the South Asian candidate (7 percentage points), at the 90- and 85-percent confidence levels, respectively. Overall, the evidence points to smaller affinity effects across ethnocultural lines, but certainly no evidence of inter-minority political conflict.
These effects are clearly concentrated among those who have a stronger identification with their ethnocultural group – as Figure 7 illustrated, stronger ethnocultural identity increases the likelihood of supporting the minority candidate. This raises an interesting analytical point: why should attachment to one ethnocultural group increase the likelihood of supporting a candidate form a differ one? It may be that a strong group identity is correlated with the kind of policy positions that heuristics draw on. A person who strongly identifies as South Asian, for example, might be especially concerned about immigration policy, and see the Chinese candidate as likely to agree with their position. Alternatively, a person who has a strong ethnocultural identity may simply be more aware of and sensitive to racial and ethnic differences in general, and therefore give more weight to those kind of cues. Nonetheless, participants clearly differentiate between their own and other ethnocultural minorities – stronger ethnic group identity increases the effect of both, but support for the candidate of the same ethnocultural group is still higher. South Asian strong identifiers, for example, are 9 points more likely to support the Chinese candidate, but 24 points more likely to support the South Asian candidate.

The strength of ethnic identification measure also helps clarify the general applicability of affinity effects. The predicted probabilities for the treatment effect, as Figure 3 illustrates, show no significant affinity for the Chinese candidate by Chinese-identifying participants. It might seem that affinity effects are limited to South Asian participants – a group that, in Canada, is well known as exceptional in terms of political participation. Once we have controlled for the effect of strength of ethnic group identification, however, the predicted probabilities show strong Chinese identifiers as 14 points more likely to support the Chinese candidate. Interestingly, this is still considerably less than the affinity effect for strong South Asian identifiers, despite generating the predicted probabilities at identical levels of the strength of ethnic group identity measures. One possible explanation for this is that the object of identification in the strength of identification measure is different. That is, respondents of Indian origin may not perceive the group “South Asians” in the same way that Chinese respondents perceive “Asian”. But the pattern may also be a function of the concentric nature of identities. No doubt we would find even stronger affinity effects if the candidate and respondents belong to even more specific shared groups, such as shared religious or local-regional group. Nonetheless, the kinds of ethnocultural group identities examined here are both narrow enough to produce changes in political behavior, and wide enough to be of broad social importance.
Despite hopes and aspirations for rainbow coalitions among different minority groups, most research has drawn pessimistic conclusions. This suggests an inability to present a united front on common policy concerns, and negative consequences for racialized candidates. However, the data examined here present quite a different picture. The first preference is clearly one’s own ethnocultural group – but there appears to be no corresponding rejection of other minorities. Importantly, this is so even at higher levels of ethnic identification, and in fact stronger identification with one’s ethnocultural minority group increases the likelihood of supporting a candidate form a different racialized group. This, if nothing else, suggests that the prospects for rainbow coalitions in Canada are considerably brighter than previous research would lead us to expect.

Bibliography
Baiju R Shah, Maria Chiu, Shubarna Amin,, Meera Ramani, Sharon Sadryand Jack V Tu (2010) “Surname
lists to identify South Asian and Chinese ethnicity from secondary data in Ontario, Canada: a validation
study” BMC Medical Research Methodology 2010, 10:42
Barreto, Matt. (2007). “ISí Se Puede! Latino Candidates and the Mobilization of Latino Voters” American Political Science Review 101:7
Berry , J.W. and Rudolf Kalin (1979) “Reciprocity of inter-ethnic attitudes in a multicultural society”. International Journal of Intercultural Relations. 3:1
Kalin, Rudolf, and J.W. Berry (1996) “Interethnic Attitudes in Canada: Ethocentrism, Cosensual Hierarchy, and Reciprocity”. Canadian Journal of Behavioral Science. 28:4
Bird, Karen. (2011) Welcoming Communities. http://p2pcanada.ca/research/the-local-diversity-gap-assessing-the-scope-and-causes-of-visible-minority-under-representation-in-municipal-elections-2/
Black, Jerome. (2008). “The 2006 Federal Election and Visible Minority Candidates: More of the Same?” Canadian Parliamentary Review
Browning, Rufus P., Dale Rogers Marshall, and David H. Tabb. (1990). Racial Politics in American Cities. New York: Longman
Brambor, Thomas, Clark, William Roberts & Golder, Matt. (2006). "Understanding Interaction Models:
Improving Empirical Analyses." Political Analysis 14: 63-82.
Brians, Craig L. 2005. “Women for Women? Gender and Party Bias in Voting for Female Candidates.” American Politics Research 33 (3): 357– 75.
Buchanan, J.M. (1954) “Individual Choice in Voting and the Market.” Journal of Political Economy, 62 pp. 334-343. Connaughton, Stacey “Multiple identification targets in examining partisan identification: A case study of Texas Latinos” Howard Journal of Communications 15(3)
Converse. Philip (1964). “The nature of belief systems in mass publics”. In Ideology and Discontent, ed. David Apter. The Free Press of Glencoe
Crosby, Faye, Stephanie Bromley, Leonard Saxe (1980) “Recent unobtrusive studies of Black and White discrimination and prejudice: A literature review”. Psychological Bulletin 87(3) Cutler, Fred (2002) “The Simplest Shortcut of All: Sociodemographic Characteristics and Electoral Choice” The Journal of Politics. 64: 2

Dukerich, J. M., Golden, B. R., & Shortell, S. M. (2002). “Beauty is in the eye of the beholder: The impact of organizational identification, identity, and image on the cooperative behaviors of physicians” Administrative Science Quarterly, 47, 507–533.
Greene, Steven. 1999. “Understanding Party Identification: A Social Identity Approach.” Political Psychology 20: 393-403
Greene, Steven 2002. “The Social-Psychological Measurement of Partisanship.” Political Behavior 24: 171-197.
Greene, Steven. 2004. “Social Identity Theory and Party Identification.” Social Science Quarterly 65: 136-153
Goodyear-Grant, Elizabeth and Julie Croskill. 2011. “Gender Affinity Effects in Vote Choice in Westminster Systems: Assessing 'Flexible' Voters in Canada.” Politics & Gender. 7:2
Hagadoorn, Louk. 1995. “Intergroup Bias in Multiple Group Systems: The Perception of Ethnic Hierarchies”. European Review of Social Psychology 6:1.
Hagendoorn, L., Drogendijk, R., Tumanov, S. & Hraba, J. (1998). Interethnic preferences and ethnic hierarchies in the former Soviet Union. International Journal of Intercultural Relations, 22(4), 1-22
Harell, Allison and Stuart Soroka. 2010. "Race of Recipient and Support for Welfare in Canada." Working Paper 2010s-42, CIRANO, Scientific Series.
Henry, Charles 1980. "Black and Latino Politics in New York City." In Chris Garcia, ed., Latinos and the Political System. Notre Dame, IN: University of Notre Dame Press
Hershey, Marjorie Randon. 1980."Support for Political Woman: The Effects of Race, Sex, and Sexual Roles." In John C. Pierce and John L. Sullivan, eds., The Electorate Reconsidered. Sage. .
Hochschild, J. and R. Rogers. 2000. Race Relations in a Diversifying Nation, In J. Jackson, ed. New Directions: African Americans in a Diversifying Nation,. Washington D.C.: National Planning Association, pp. 45-85
Huddy, Leonie and Terkildsen, Nayda (1993) “Gender Stereotypes and the Perception of Male and
Female Candidates”37:1
Iyer, V., Bamber, E. M. and Barefield, R. M. (1997). Identification of accounting firm alumni with their former firm: Antecedents and outcomes. Accounting, Organizations, and Society, 22, 315–336.
Kelley, N and Trebilcock, M.J. (1998) The making of the mosaic: A history of Canadian immigration policy. University of Toronto Press.
Iyengar, Shanto, and Nicholase Valentino. (2000). “Who Says What? Source Credibilty as a Mediator in Campaigns Sdvertising”. In Arthur Lupia, Mathew D. McCubbins, and Samuel L. Popkin (eds.). 2000. Elements of Reason: Cognition, Choice, and the Bounds of Rationality. New York: Cambridge University Press.

Jacobs, Alan and Matthews, J. Scott. (2012) ‘Why Do Citizens Discount the Future? Public Opinion and
the Timing of Policy Consequences.’ British Journal of Political Science. 42-4
Jennings, James. (1994). Blacks, Latinos, and Asians in Urban America: status and prospects for politics and activism. Greenwood Press
Kinder, D. R and L.M. Sanders, (1990). “Mimicking political debate with survey questions: The case of white opinion on affirmative action for blacks”. Social Cognition, 8:1
Kaufmann, K. M., and J. R. Petrocik, 1999. “The changing politics of American men: Understanding the sources of the gender gap”. American Journal of Political Science. 43:3
Kuklinski, James, Ellen Riggle, Victor Ottati, Norbert Schwarz and Robert S. Wyer, Jr. (1991) “The
Cognitive and Affective Bases of Political Tolerance Judgments” American Journal of Political Science. 35:
Kaufmann, Karen M. (2007) “Immigration and the Future of Black Power in U.S. Cities” Du Bois Review, 4:1 Lazarsfeld , Paul, Bernard Berelson, and Hazel Gaudet 1944. The People's Choice. How the Voter Makes
up His Mind in a Presidential Campaign. New York: Columbia University Press
Mael, F. A., & Tetrick, L. E. (1992). Identifying organizational identification.Educational and Psychological Measurement, 52 (4), 813-825
McClain, P. D., and A. K. Karnig. 1990. "Black and Hispanic Socioeconomic and Political Competition." American Political Science Review 84:2
McDermott, Monika L. (1998). “Race and Gender Cues in Low-Information Elections.” Political Research Quarterly 51: 895-918
Meier, Kenneth J., and Joseph Stewart, Jr. 1991."Cooperation and Conflict in Multiracial School Districts."The Journal of Politics. 53 :4
Petty, Richard and Cacioppo, John. 1981. Attitudes and Persuasion: Classic and Contemporary Approaches. WC Brown Publishers.
Pew Center (2012). Pew Hispanic Research Centre: Latino Voters in the 2012 Presidential Election.
Poppe, Edwin, and Louk Hagendoorn. (2003. “Titular Identification of Russians in Former Soviet Republics,” Europe-Asia Studies, 55(5)
Ploeger, Nicole A., Ryan S. Bisel “The Role of Identification in Giving Sense to Unethical Organizational Behavior: Defending the Organization”. Management Communication Quarterly.
National Journal, Nov. 8th 2012. “Obama Overwhelmingly Won Asia- American Vote” http://www.nationaljournal.com/magazine/the-power-of-the-asian-american-vote-is-growing-and-it-s-up-for-grabs-20121025
Philpot, Tasha S. and Hanes Walton, Jr. 2007. “One of Our Own: Black Female Candidates and the Voters Who Support Them.” American Journal of Political Science 51:1

Popkin (1991). The Reasoning Voter: Communication and Persuasion in Presidential Campaigns.
Pornpitakpan, Chanthika (2006) “The Persuasiveness of Source Credibility: A Critical Review of Five
Decades' Evidence”. Journal of Applied Social Psychology. 34(2)
Rahn, Wendy M. (1993). “The Role of Partisan Stereotypes in Information Processing about Political Candidates”. American Journal of Political Science 37:2
Rahn, Wendy M., John Aldrich, Eugene Borgida & John Sullivan. 1990. A Social Cognitive Model of Candidate Appraisal. in Information and the Democratic Process, ed. John A. Ferejohn and James H. Kuklinski. Champaign, Il: University of Illinois Press pp. 136–159.
Sigelman, Lee, and Carol K. Sigelman.( 1982). “Sexism, Racism, and Ageism in Voting Behavior: An Experimental Analysis.” Social Psychology Quarterly 45
Brewer, Marylyn, and Michael D. Silver (2000) “Group Distinctiveness, Social Identity, and Collective Mobilization” in Self, Identity, and Social Movements eds. Sheldon Stryker, Timothy J. Owens and Robert W. White. University of Minnesota Press.
Stokes-Brown Atiya Kai . (2006). “Racial identity and Latino vote choice” American Politics Research. 34:5
Spivak ,Gayatri Chakravorty (1987). In Other Worlds: Essays in Cultural Politics. Routledge Press.
Tajfel, Henri. (1981). Human groups and social categories. Cambridge University Press.
Tomz, Michael, Jason Wittenberg, and Gary King. 2003. CLARIFY: Software for Interpreting and Presenting Statistical Results. Journal of Statistical Software. Weisberg, Herbert F., and Steven Greene. 2003. ‘‘The Political Psychology of Party Identification.’’ In Michael MacKuen and George Rabinowitz, eds., Electoral Democracy. Ann Arbor, Mich.: University of Michigan Press.

Appendix 1: Tables and Figures
0.42
0.49
0.30
0.35
0.40
0.45
0.50
0.55
0.60
Visible Minority Candidate
Figure 1—Visible Minority Affinity
White
Candidate
Visible
Minority
Candidate
n=1313
Per
cen
t Su
pp
ort
fo
r C
and
idat
e 2
White Candidate
Visible Minority Candidate
Per
cen
t Su
pp
ort
fo
r C
and
idat
e 2
50.7
41.0
53.1 52.1
30.0
35.0
40.0
45.0
50.0
55.0
60.0
Chinese Respondents South Asian Respondents
Figure 2 - Affinity Effects for Specific Ethnocultural Groups
White Candidate
Chinese Candidate
White Candidate
Chinese Candidate
Chinese Respondents South Asian Respondents

50.7
41.0
36.3 36.3
54.9
47.9
36.3
43.9
30.0
35.0
40.0
45.0
50.0
55.0
60.0
Chinese Respondents/
South Asian
Candidate
South Asian Respondents/
Chinese Candidate
Other Vismin Respondents/
Chinese Candidate
Other Vismin Respondents/
South Asian
Candidate
South Asian Candidate Chinese Respondents
Chinese Candidate Other Vismin Respondents
South Asian Candidate Other Vismin Respondents
Chinese Candidate South Asian Respondents
Figure 3—Affinity for Different Ethnic Groups
0.42
0.49
0.30
0.35
0.40
0.45
0.50
0.55
0.60
Visible Minority Candidate
Figure 4—Visible Minority Affinity Predicted Values
Predicted Probabilities
White Candidate
Visible Minority Candidate
n=1313
n=1313

0.52
0.38
0.57
0.54
0.30
0.35
0.40
0.45
0.50
0.55
0.60
Chinese South Asian
Sup
po
rt f
or
Can
did
ate
2
White
Candidate
Chinese
Candidate
White
Candidate
South Asian
Candidate Chinese Respondents South Asian Respondents
n=1313
Figure 5 – Affinity for Same Ethnic Group
Predicted Probabilities
0.52
0.38
0.34 0.34
0.530.51
0.41 0.41
0.30
0.35
0.40
0.45
0.50
0.55
0.60
Chinese Respondents/ South Asian Candidate
South Asian Respondents/ Chinese
Candidate
Other Vismin Respondents /Chinese
Candidate
Other Vismin Respondents /South
Asian Candidate
n=1313
South Asian Candidate Chinese Respondents
Chinese Candidate Other Vismin Respondents
South Asian Candidate Other Vismin Respondents
Chinese Candidate South Asian Respondents
Figure 6—Affinity for Different Ethnic Group Predicted Probabilities

-0.05
0.04
0.11
0.04
0.06
0.13
0.04 0.05
-0.10
-0.05
0.00
0.05
0.10
0.15
0.20
Chinese Respondents/ South Asian Candidate
South Asian Respondents/
ChineseCandidate
OtherVismin Respondents /South
Asian Candidate
OtherVismin Respondents /Chinese
Candidate
Low ID High ID
South Asian Candidate Chinese Respondents
Figure 8: Difference of Affinity Effect for Different Minority Candidates, by Strength of Ethnic Group Identification
Low ID High ID
Chinese Candidate South Asian Respondents
Low ID High ID
South Asian Candidate Other Vismin Respondents
Low ID High ID
Chinese Candidate Other Vismin Respondents
n=782
0.41
0.37
0.49
0.61
0.52 0.510.53
0.63
0.30
0.35
0.40
0.45
0.50
0.55
0.60
0.65
Low ID South Asian
Respondents/
South Asian Candidate
High ID South Asian
Respondents/
South Asian Candidate
Low ID Chinese Respondents/
ChineseCandidate
High ID Chinese Respondents/
ChineseCandidate
Sup
po
rt f
or
Can
did
ate
2
White Candidate
South Asian Candidate
White Candidate
South Asian Candidate
Low ID South Asian
Respondents High ID South Asian
Respondents
White Candidate
White Candidate
Chinese Candidate
Low ID Chinese Respondents
South Asian Candidate
Low ID South Asian
Respondents
n=782
Figure 7—Affinity for Same Ethnic Groups, by Strength of Identity

Table 1: Factor Structure and Assignment
Participants
White Candidate
Chinese Candidate
South Asian Candidate
Chinese 117 118 116
South Asian 50 51 50
Other Visible Minorities 96 97 97
Non-visible minorities 174 174 173
Table 2: Affinity for Same Ethnic Group by Strength of Ethnicity
Probability of the Null
South Asian Respondents, South Asian Candidate 3.90%
Chinese Respondents, Chinese Candidate 7.30%
Table 3: Affinity for Different Ethnic Group by Strength of Ethnicity
Probability of the Null
Chinese Respondents, South Asian Candidate 9.40%
South Asian Respondents, Chinese Candidate 24%
Other Vismin Respondents, South Asian Candidate 77.50%
Other Vismin Respondents, Chinese Candidate 47.50%
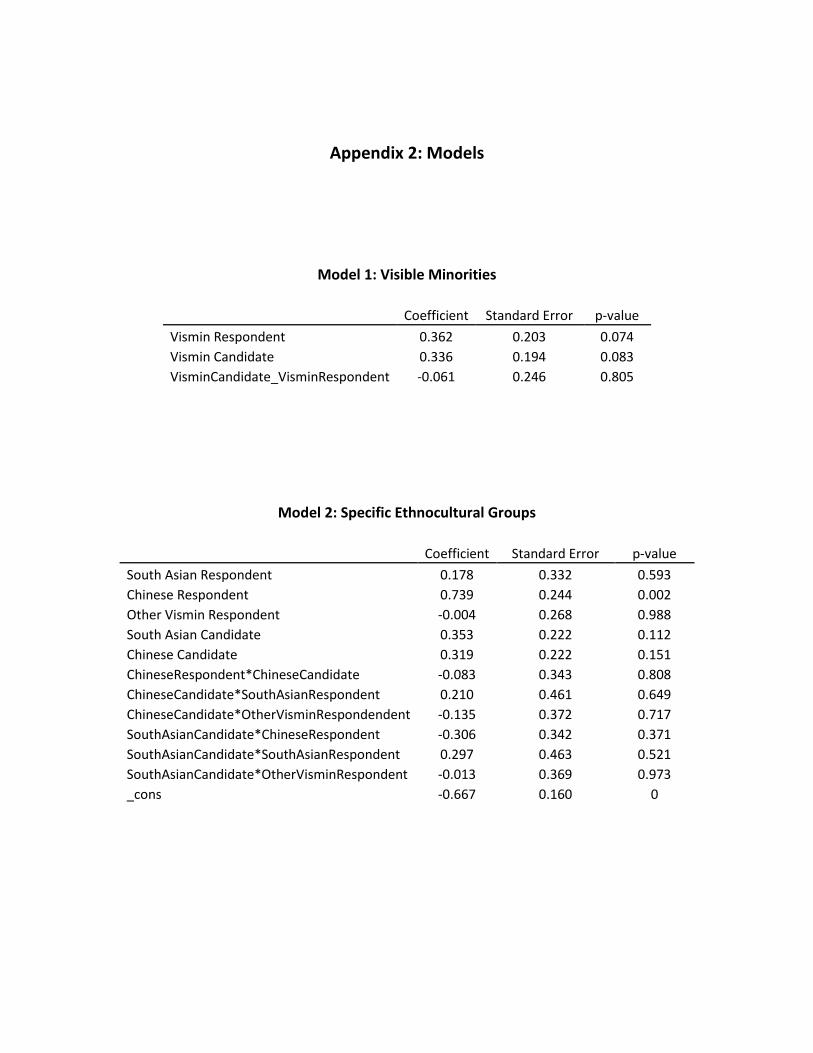
Appendix 2: Models
Model 1: Visible Minorities
Coefficient Standard Error p-value
Vismin Respondent 0.362 0.203 0.074
Vismin Candidate 0.336 0.194 0.083
VisminCandidate_VisminRespondent -0.061 0.246 0.805
Model 2: Specific Ethnocultural Groups
Coefficient Standard Error p-value
South Asian Respondent 0.178 0.332 0.593
Chinese Respondent 0.739 0.244 0.002
Other Vismin Respondent -0.004 0.268 0.988
South Asian Candidate 0.353 0.222 0.112
Chinese Candidate 0.319 0.222 0.151
ChineseRespondent*ChineseCandidate -0.083 0.343 0.808
ChineseCandidate*SouthAsianRespondent 0.210 0.461 0.649
ChineseCandidate*OtherVisminRespondendent -0.135 0.372 0.717
SouthAsianCandidate*ChineseRespondent -0.306 0.342 0.371
SouthAsianCandidate*SouthAsianRespondent 0.297 0.463 0.521
SouthAsianCandidate*OtherVisminRespondent -0.013 0.369 0.973
_cons -0.667 0.160 0

Model 3: Specific Ethnocultural Groups and Strength of Identity
Coefficient Standard Error p-value
Chinese Respondent 1.235 0.889 0.165
South Asian Respondent 1.046 1.097 0.34
South Asian Candidate 1.055 0.949 0.266
Chinese Candidate 0.023 0.970 0.981
IDStrength 0.522 1.051 0.619
SouthAsianRespondent*IDStrength -1.356 1.631 0.406
ChineseCandidate*IDStrength -0.816 1.406 0.562
ChineseCandidate*IDStrength 0.279 1.526 0.855
SouthAsianCandidate*IDStrength -1.154 1.459 0.429
SouthAsianCandidate*ChineseRespondent -2.180 1.317 0.098
ChineseCandidate*SouthAsianRespondent -0.686 1.570 0.662
SouthAsianCandidate*SouthAsianRespondent -2.238 1.518 0.141
ChineseRespondent*ChineseCandidate -1.162 1.360 0.393
ChineseCandidate*ChineseRespondent*IDStrength 2.038 2.183 0.35
ChineseCandidate*SouthAsianRespondent*IDStrength 1.522 2.337 0.515
SouthAsianCandidate*ChineseRespondent*IDStrength 3.012 2.041 0.14
SouthAsianCandidate*SouthAsianRespondent*IDStrength 4.083 2.284 0.074
_cons -0.989 0.678 0.145