rail, public transportation, and tdm needs assessment … · 2012-03-08 · rail, public...
TRANSCRIPT
final report
Rail, Public Transportation, and TDM Needs Assessment
prepared for
Virginia Department of Rail and Public Transportation
prepared by
Cambridge Systematics, Inc. 4445 Willard Avenue, Suite 300 Chevy Chase, Maryland 20815
June 2004

Virginia Department of Rail and Public Transportation Rail, Public Transportation, and TDM Needs Assessment
Cambridge Systematics, Inc. i 7292.014
Table of Contents
Executive Summary ............................................................................................................... ES-1
1.0 The Context for the Rail and Public Transportation and TDM Needs Assessment ......................................................................................................... 1-1 1.1 VTrans2025 – The Vision and Framework ......................................................... 1-1 1.2 The Transportation Equity Act for the 21st Century.......................................... 1-4 1.3 Other Rail and Public Transportation Planning Efforts and
Initiatives in Virginia............................................................................................. 1-6 1.4 A New Transit Vision for Virginia....................................................................... 1-6 1.5 Process Used to Develop the Rail and Public Transportation and TDM
Needs Assessment ................................................................................................. 1-14
2.0 The Demography and Economy of the Commonwealth of Virginia: Factors Impacting on Rail, Public Transportation, and TDM Needs .................. 2-1 2.1 Current Population and Employment and Projected Growth......................... 2-1 2.2 Increasing Numbers of Zero-Car Households................................................... 2-3 2.3 Aging of the Population ........................................................................................ 2-6 2.4 Summary and Implications................................................................................... 2-6
3.0 Inventory and Service Assessment of the Current Virginia Rail and Public Transportation System..................................................................................... 3-1 3.1 Inventory ................................................................................................................. 3-2 3.2 Service Assessment ................................................................................................ 3-34 3.3 Conclusions............................................................................................................. 3-41
4.0 Statewide Rail and Public Transportation Trends and Forecasts ........................ 4-1 4.1 Previous Studies ..................................................................................................... 4-1 4.2 Trends and Forecasts ............................................................................................. 4-11
5.0 Rail, Public Transportation, and TDM Scenarios and Needs............................... 5-1 5.1 Overview of the Scenarios .................................................................................... 5-1 5.2 Virginia Statewide 25-Year Rail, Public Transportation, and TDM
Needs Assessment ................................................................................................. 5-5
6.0 Funding Resources for 2025 Needs Scenarios.......................................................... 6-1 6.1 Funding Resources in Comparison to Estimated Transit Capital Needs....... 6-1 6.2 Funding Resources in Comparison to Estimated Transit Operating Needs . 6-4

Virginia Department of Rail and Public Transportation Rail, Public Transportation, and TDM Needs Assessment
Cambridge Systematics, Inc. iii
List of Tables
ES.1 Summary of Virginia Public Transportation Service and Passenger Usage (2001).................................................................................................. ES-9
ES.2 Summary of the Three Scenarios.................................................................................. ES-11
ES.3 Total Estimated Statewide Public Transportation, Rail, and TDM Capital Needs 2005-2025 (Millions of YOE $) .................................................. ES-13
ES.4 Total Estimated Statewide Public Transportation, Rail, and TDM Operating Needs 2005-2025 (Millions of YOE $) ............................................. ES-14
ES.5 Comparison of Total Transit Capital Needs to Expected Revenues ....................... ES-15
ES.6 Comparison of Total Transit Operating Needs to Expected Revenues .................. ES-16
2.1 Proportion of the Population of Aged 65 Years and Older as Projected by the U.S. Census and VTRC .................................................................................................. 2-6
3.1 Summary of Urban Service Provider Types (2003) ................................................... 3-4
3.2 Summary of Rural and Intercity Providers (2003)..................................................... 3-5
3.3 Summary of Urban Service Provided (2001) .............................................................. 3-7
3.4 Summary of Rural and Total Service Provided (2001).............................................. 3-8
3.5 Revenue Miles Per Capita in the Hampton Roads Region....................................... 3-12
3.6 Summary of Urban Passenger Usage (2001)............................................................... 3-14
3.7 Summary of Rural and Total Public Transportation Ridership (2001) ................... 3-15
3.8 Vehicle Assets and Ages (2001) .................................................................................... 3-16
3.9 Operating Expenditures for Public Transportation (2001) ....................................... 3-22
3.10 Existing Amtrak Operations in Virginia ..................................................................... 3-28
3.11 Virginia TDM Expenditures (FY 1999-2003)............................................................... 3-31
3.12 Virginia DRPT TDM Expenditures .............................................................................. 3-33
Virginia Department of Rail and Public Transportation Rail, Public Transportation, and TDM Needs Assessment
iv Cambridge Systematics, Inc.
List of Tables (continued)
3.13 Average Operating Expenses (2001) ............................................................................ 3-38
3.14 Service Productivity (2001) ........................................................................................... 3-39
4.1 Northern Virginia Bus Fleet Requirements ................................................................ 4-3
4.2 Southside Peak Vehicles and Annual Service Hours ................................................ 4-9
4.3 Northside Peak Vehicles and Annual Service Hours................................................ 4-10
4.4 Projected Commonwealth of Virginia Population Growth (2000-2025)................. 4-11
4.5 Projected Elderly Growth and Households without Automobiles in 2000............ 4-12
4.6 Projected Annual Percentage and Cumulative VMT Growth (2000-2025)............. 4-13
4.7 Annual Percentage Change of Unlinked Transit Trips 1998 to 2001 ...................... 4-14
5.1 Projected Annual Rates of Growth for Population and for Ridership by Scenario (Average Annual Percentage Growth from 2001 to 2025) ............................... 5-5
5.2 Scenario 1 (Loss of Market Share) – Total Estimated Statewide Public Transportation, Rail, and TDM Capital Needs 2005-2025 ($ Millions) ................... 5-8
5.3 Scenario 1 (Loss of Market Share) – Total Estimated Statewide Public Transportation, Rail, and TDM Operating Needs 2005-2025 ($ Millions).............. 5-9
5.4 Scenario 2 (Maintain Market Share) – Total Estimated Statewide Public Transportation, Rail, and TDM Capital Needs 2005-2025 ($ Millions) ................... 5-11
5.5 Scenario 2 (Maintain Market Share) – Total Estimated Statewide Public Transportation, Rail, and TDM Operating Needs 2005-2025 ($ Millions).............. 5-12
5.6 Scenario 3 (Increase Market Share) – Total Estimated Statewide Public Transportation, Rail, and TDM Capital Needs 2005-2025 ($ Millions) ................... 5-15
5.7 Scenario 3 (Increase Market Share) – Total Estimated Statewide Public Transportation, Rail, and TDM Operating Needs 2005-2025 ($ Millions).............. 5-16
6.1 Comparison of Transit Capital Needs to Expected Revenues ................................. 6-4
6.2 Comparison of Transit Operating Needs to Expected Revenues ............................ 6-6
Virginia Department of Rail and Public Transportation Rail, Public Transportation, and TDM Needs Assessment
Cambridge Systematics, Inc. v
List of Figures
ES.1 Transit Service (Vehicle Revenue Miles Per Capita) ................................................. ES-7
ES.2 Virginia Freight Rail Network ...................................................................................... ES-10
2.1 Change in Population from 2000 to 2025 Forecast Data from NPA Data Services, Inc. ................................................................... 2-2
2.2 Percentage of Resident Workers Commuting to Jobs in Other Cities or Counties ................................................................................................ 2-4
2.3 Percentage of Households without an Automobile .................................................. 2-5
3.1 Available Urban Public Transportation ...................................................................... 3-3
3.2 Transit Service (Vehicle Revenue Miles Per Capita) ................................................. 3-10
3.3 Transit Service (Vehicle Revenue Miles Per Capita) Northern Virginia................... 3-11
3.4 Transit Service (Vehicle Revenue Miles Per Capita) Hampton Roads Region .......... 3-11
3.5 Transit Service (Vehicle Revenue Miles Per Capita) Richmond/Petersburg ............. 3-12
3.6 Intercity Bus Services ..................................................................................................... 3-23
3.7 VRE Route and Station Map ......................................................................................... 3-26
3.8 VRE Annual Ridership Growth 1995 to 2002.............................................................. 3-26
3.9 Amtrak Annual Ridership............................................................................................. 3-29
3.10 Current Intercity Passenger Rail Service in Virginia................................................. 3-30

Executive Summary

Virginia Department of Rail and Public Transportation Rail, Public Transportation, and TDM Needs Assessment
Cambridge Systematics, Inc. ES-1
Public Transportation and Rail: Reconnecting Virginians
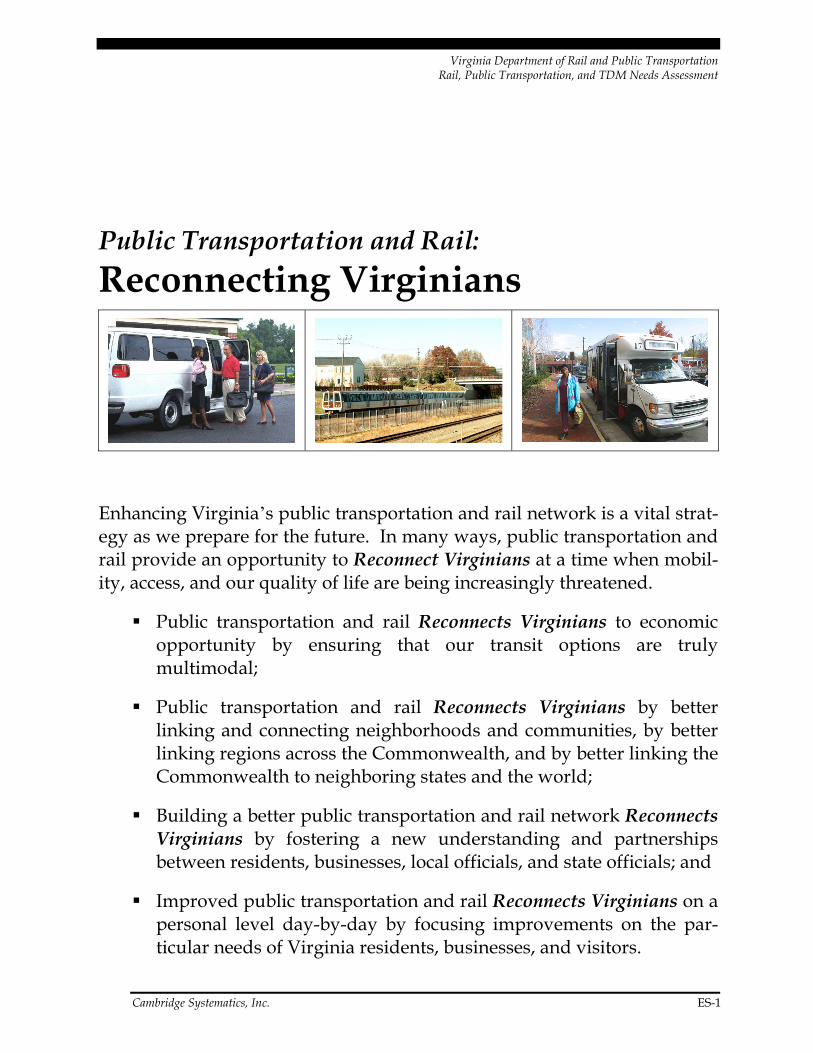
Enhancing Virginia’s public transportation and rail network is a vital strat-egy as we prepare for the future. In many ways, public transportation and rail provide an opportunity to Reconnect Virginians at a time when mobil-ity, access, and our quality of life are being increasingly threatened.
Public transportation and rail Reconnects Virginians to economic opportunity by ensuring that our transit options are truly multimodal;
Public transportation and rail Reconnects Virginians by better linking and connecting neighborhoods and communities, by better linking regions across the Commonwealth, and by better linking the Commonwealth to neighboring states and the world;
Building a better public transportation and rail network Reconnects Virginians by fostering a new understanding and partnerships between residents, businesses, local officials, and state officials; and
Improved public transportation and rail Reconnects Virginians on a personal level day-by-day by focusing improvements on the par-ticular needs of Virginia residents, businesses, and visitors.
Virginia Department of Rail and Public Transportation Rail, Public Transportation, and TDM Needs Assessment
ES-2 Cambridge Systematics, Inc.
Reconnecting Virginians
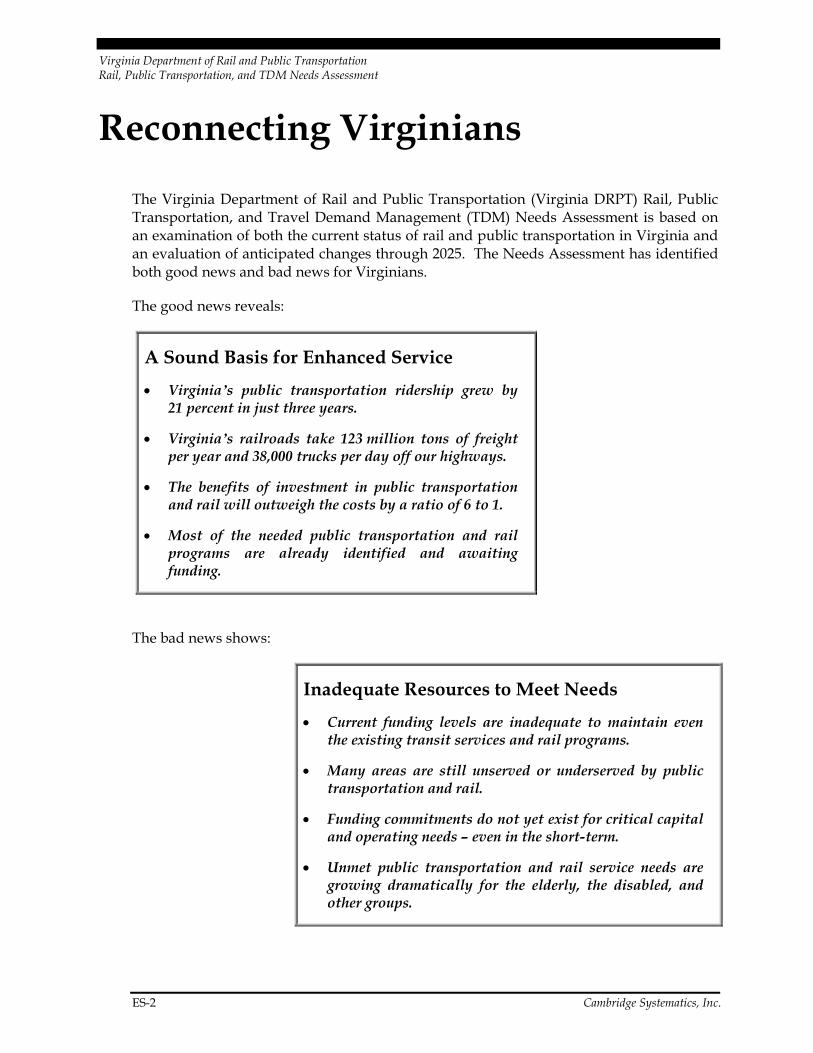
The Virginia Department of Rail and Public Transportation (Virginia DRPT) Rail, Public Transportation, and Travel Demand Management (TDM) Needs Assessment is based on an examination of both the current status of rail and public transportation in Virginia and an evaluation of anticipated changes through 2025. The Needs Assessment has identified both good news and bad news for Virginians.
The good news reveals:
A Sound Basis for Enhanced Service
• Virginia’s public transportation ridership grew by 21 percent in just three years.
• Virginia’s railroads take 123 million tons of freight per year and 38,000 trucks per day off our highways.
• The benefits of investment in public transportation and rail will outweigh the costs by a ratio of 6 to 1.
• Most of the needed public transportation and rail programs are already identified and awaiting funding.
The bad news shows:
Inadequate Resources to Meet Needs
• Current funding levels are inadequate to maintain even the existing transit services and rail programs.
• Many areas are still unserved or underserved by public transportation and rail.
• Funding commitments do not yet exist for critical capital and operating needs – even in the short-term.
• Unmet public transportation and rail service needs are growing dramatically for the elderly, the disabled, and other groups.
Virginia Department of Rail and Public Transportation Rail, Public Transportation, and TDM Needs Assessment
Cambridge Systematics, Inc. ES-3
The Needs Assessment outlines a series of alternative investment strategies through 2025 that build on Virginia’s existing sound rail and public transit network and illustrates how to avoid the consequences of inadequate responses to critical needs.
Context for the Needs Assessment
The Rail, Public Transportation, and TDM Needs Assessment is an important element of an ongoing statewide planning effort, VTrans2025, that will identify an integrated, multi-modal, long-range transportation plan for the Commonwealth of Virginia. The VTrans2025 effort is being supported by the Virginia DRPT, the Virginia Department of Transportation (VDOT), and other modal agencies under the leadership of Governor Mark Warner. The VTrans2025 process provides the vision and framework for long-range transportation planning in Virginia.
VTrans2025 – The Vision and Framework
Most of us share a common “vision” of what we want the future to be like – peace, pros-perity, opportunity, comfort, security, etc. Much of our shared vision of the future is affected directly by our ability to move throughout our communities, our regions, the Commonwealth, and the nation. In other words, our future is in many ways determined by how well our transportation network functions.
Prior planning and investment in the Commonwealth’s transportation infrastructure have supported steady economic growth and a high quality of life, but these advantages are disappearing as increasing travel demand outstrips capacity on the current network, and by the limited transportation choices available to meet changing needs. On a daily basis, we encounter the unwelcome consequences of a transportation network under severe strain. Some of these strains include:
• Longer commutes waste time and money, lower productivity, and keep us away from home and family;
• There are increasing costs for routine local and statewide travel, and increased pain, suffering, and economic loss from vehicle crashes;
• Many people lack useful or affordable options for urgent personal needs;
• Vehicle exhausts and emissions foul the air and waterways;
• Open space is lost and productive agricultural land taken for sprawling development; and
• Increasing costs for maintenance of the transportation network, and high costs for net-work expansion make it difficult to solve mobility problems.
Virginia Department of Rail and Public Transportation Rail, Public Transportation, and TDM Needs Assessment
ES-4 Cambridge Systematics, Inc.
The VTrans2025 effort was initiated by Virginia’s transportation agencies at the direction of the General Assembly and is intended to avoid, and where necessary, reverse these troubling trends. The starting point for VTrans2025 is the establishment of a shared vision and goals for our multimodal transportation network, a vision that will allow us to fully realize an ever-improving quality of life throughout the Commonwealth in the decades ahead. But we have choices in shaping our transportation vision... and choices in how our vision is pursued. The rail, public transportation, and TDM needs assessment describes those choices.
The Benefits of Rail, Public Transportation, and Travel Demand Management
The benefits of enhanced investment in rail, public transportation, and TDM programs to Virginia span a broad range. Some of the most notable benefits include:
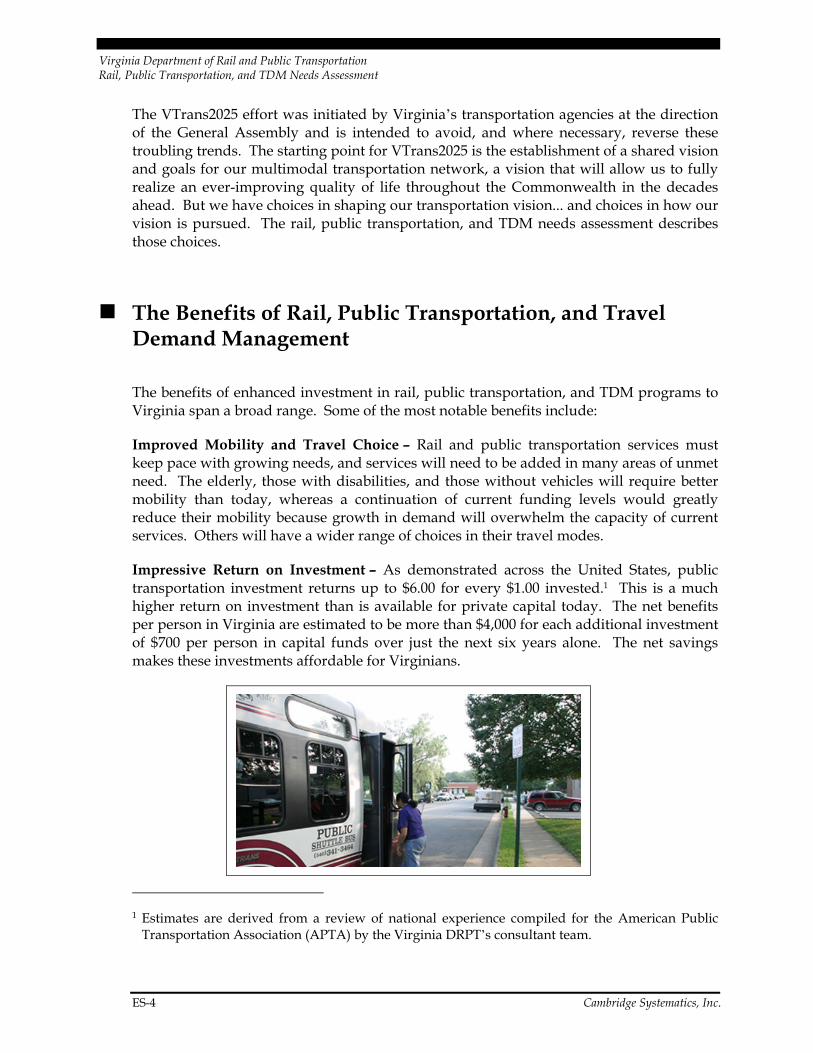
Improved Mobility and Travel Choice – Rail and public transportation services must keep pace with growing needs, and services will need to be added in many areas of unmet need. The elderly, those with disabilities, and those without vehicles will require better mobility than today, whereas a continuation of current funding levels would greatly reduce their mobility because growth in demand will overwhelm the capacity of current services. Others will have a wider range of choices in their travel modes.
Impressive Return on Investment – As demonstrated across the United States, public transportation investment returns up to $6.00 for every $1.00 invested.1 This is a much higher return on investment than is available for private capital today. The net benefits per person in Virginia are estimated to be more than $4,000 for each additional investment of $700 per person in capital funds over just the next six years alone. The net savings makes these investments affordable for Virginians.
1 Estimates are derived from a review of national experience compiled for the American Public
Transportation Association (APTA) by the Virginia DRPT’s consultant team.
Virginia Department of Rail and Public Transportation Rail, Public Transportation, and TDM Needs Assessment
Cambridge Systematics, Inc. ES-5
Reduced Congestion and Reduced “Congestion Tax” – Public transportation serves to reduce congestion on many of the most congested highway facilities in the Commonwealth. Congestion in Virginia is an enormous and burdensome tax on residents and businesses. Congestion cost is computed in terms of excess travel costs. Northern Virginia has the worst congestion in the State according to the Texas Transportation Institute (TTI), but many other Virginia areas are currently experiencing or will experience severe congestion costs over the coming decades. The “congestion tax” is estimated by TTI at $1,600 per year per rush hour driver in the Northern Virginia region alone. This tax can be reduced effectively through transit investments that pay off in economic terms.
Improved Air Quality – For every passenger mile traveled, or for every ton of freight moved, public transportation and rail produces only a fraction of the harmful pollution of auto and SUV travel or heavy truck travel – only five percent as much carbon monoxide, less than eight percent as much volatile organic compounds, and one-half as much carbon dioxide and nitrogen oxides. Successful public transportation and TDM programs are critical to maintaining urban air quality, and also to assuring that future Federal trans-portation funding will not be withheld.
Enhanced Safety – Public transportation and rail are among the safest travel modes, and lives are saved when more people and freight are off the highways and utilizing public transportation and rail.
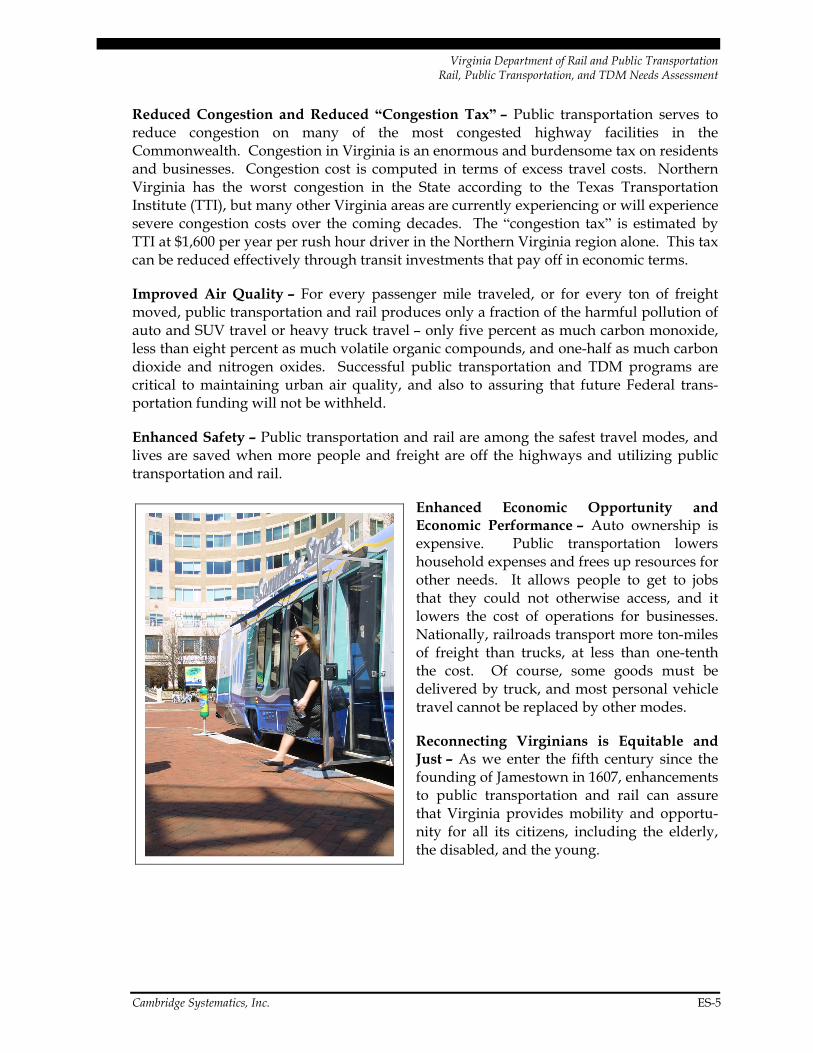
Enhanced Economic Opportunity and Economic Performance – Auto ownership is expensive. Public transportation lowers household expenses and frees up resources for other needs. It allows people to get to jobs that they could not otherwise access, and it lowers the cost of operations for businesses. Nationally, railroads transport more ton-miles of freight than trucks, at less than one-tenth the cost. Of course, some goods must be delivered by truck, and most personal vehicle travel cannot be replaced by other modes.
Reconnecting Virginians is Equitable and Just – As we enter the fifth century since the founding of Jamestown in 1607, enhancements to public transportation and rail can assure that Virginia provides mobility and opportu-nity for all its citizens, including the elderly, the disabled, and the young.
Virginia Department of Rail and Public Transportation Rail, Public Transportation, and TDM Needs Assessment
ES-6 Cambridge Systematics, Inc.
Today’s Rail and Public Transportation System: Focused and Efficient but Limited Services
The existing public transportation services in Virginia are an integral part of the Commonwealth’s multimodal ground transportation system. On a typical weekday, more than 600,000 Virginians board vans, buses, or rail transit vehicles to travel to work, to school, and to shopping. For many of these persons, public transit is their only reliable and affordable mode of travel. Were these systems to cease to function for any reason, the financial and social costs would be tremendous. Not only would there be a loss of at least $336 million in annual transit operating expenditures, but the effects of increased traffic congestion and lost wages by workers no longer able to get to their jobs would be signifi-cant as well.
Transit use in Virginia has been growing dramatically in recent years. Over the period 1998 through 2001 alone, total annual transit ridership statewide increased by about 21 percent. While much of this ridership growth took place in the State’s larger urban areas, increasing transit use has also taken place in the small urban and rural areas of the State where service currently exists. With population and employment in Virginia pro-jected to experience steady increases over the coming decades, demands by the Commonwealth’s citizens for new and improved transit services can also be expected to increase.
Studies reveal that current public transportation in Virginia is very efficient and very effective in the use of the resources provided for service delivery.2 However, there are serious deficiencies and many factors that will widen the gap between currently funded services and actual needs.
The Emerging Gaps
• Public transportation service is totally lacking in many areas of the State, with a large, growing proportion of households without vehicles – Approximately 1.8 million Virginians, or about 17 percent of the total state population, reside in cities, towns, or counties without public transportation service. The number of households without an automobile was more than 200,000 in 2000, with many of these households located in rural or small urban areas where transit service does not exist. These Virginians lack basic access to jobs, health care, and all other basic necessities.
2 Service and needs assessments commissioned by the Virginia DRPT, and similar assessments by
the Northern Virginia Transportation Commission (NVTC).
Virginia D
epartment of Rail and Public Transportation
Rail, Public Transportation, and TDM
Needs A
ssessment
Cambridge System
atics, Inc. ES-7
Figure ES.1 Transit Service (Vehicle Revenue Miles Per Capita)
Virginia Department of Rail and Public Transportation Rail, Public Transportation, and TDM Needs Assessment
ES-8 Cambridge Systematics, Inc.
• Service is inadequate in many other areas – The mere existence of some type of pub-lic transportation service is not enough. Evaluation of service coverage shows many areas with very little service or with service that does not make the needed connec-tions to employment, shopping, and medical centers.
• The elderly population of Virginia is growing rapidly and their critical transporta-tion service needs cannot be met at existing levels of service – The share of elderly residents is projected to increase dramatically over the next 25 years, when about 18 percent of the State’s total population, or about 1.6 million persons, will be age 65 or older. The need for transit services, especially demand-responsive services, to meet the basic mobility needs of the elderly will become an even more critical issue.
• Population and employment will continue to grow strongly, and enhanced public transportation, rail, and other modes must provide needed access, mobility, and connections – Virginia’s population is expected to increase from 7.1 million in 2000 to between 8.5 and 9.3 million by 2025, or by approximately 20 to 30 percent. Employ-ment in the State is expected to increase from 4.4 million to 6.3 million between 2000 and 2025, or by more than 40 percent.
• More and more of Virginia’s residents are working in other jurisdictions than where they live and thus must make longer trips to work. This increases the demand for cross-jurisdictional and regional transit that crosses the boundaries of current ser-vice areas.
• Virginia’s railroads move 30 percent of the freight in the Commonwealth. This highly valuable service is threatened if adequate investment is not made in rail infrastructure.
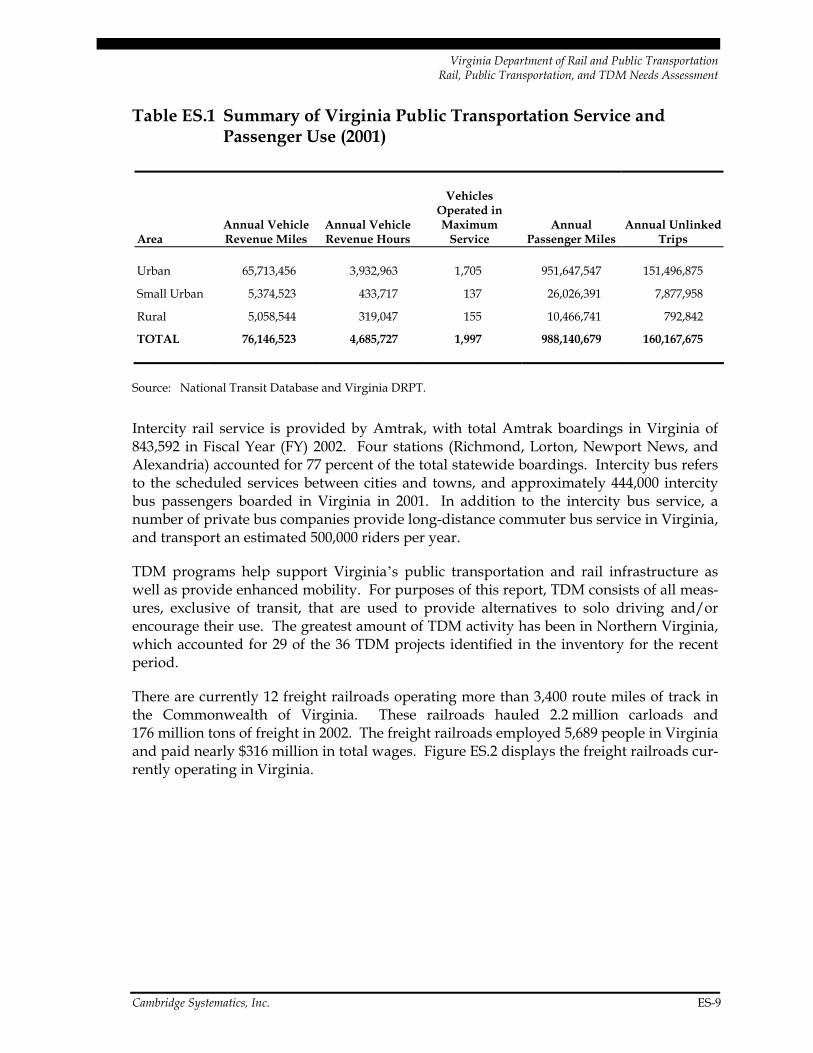
The Commonwealth’s public transportation services are summarized in Table ES.1 by major urban, small urban, and rural providers. The major urban areas are Northern Virginia, Greater Richmond, and Hampton Roads. The public transportation providers operating in 2001 (the latest year for which complete data are available) transported a total of 160 million passengers for approximately 988 million annual passenger miles. Urban systems provided 952 million total passenger miles, or about 96 percent of the statewide total. Small urban systems provided 26 million annual passenger miles and the rural sys-tems accounted for 10.5 million annual passenger miles.
In terms of services provided, which indicates the level of mobility available via transit, the large urban systems accounted for about 66 million annual vehicle revenue miles, or almost 86 percent of the total revenue miles operated in Virginia. The eight small urban systems accounted for about 5.4 million vehicle revenue miles of service, or about seven percent of the statewide total, while the 16 rural systems operated about 5.1 million vehi-cle revenue miles of service in 2001, or about seven percent of the statewide total.
Virginia Department of Rail and Public Transportation Rail, Public Transportation, and TDM Needs Assessment
Cambridge Systematics, Inc. ES-9
Table ES.1 Summary of Virginia Public Transportation Service and Passenger Use (2001)
Area Annual Vehicle Revenue Miles
Annual Vehicle Revenue Hours
Vehicles Operated in Maximum
Service Annual
Passenger Miles Annual Unlinked
Trips
Urban 65,713,456 3,932,963 1,705 951,647,547 151,496,875
Small Urban 5,374,523 433,717 137 26,026,391 7,877,958
Rural 5,058,544 319,047 155 10,466,741 792,842
TOTAL 76,146,523 4,685,727 1,997 988,140,679 160,167,675
Source: National Transit Database and Virginia DRPT.
Intercity rail service is provided by Amtrak, with total Amtrak boardings in Virginia of 843,592 in Fiscal Year (FY) 2002. Four stations (Richmond, Lorton, Newport News, and Alexandria) accounted for 77 percent of the total statewide boardings. Intercity bus refers to the scheduled services between cities and towns, and approximately 444,000 intercity bus passengers boarded in Virginia in 2001. In addition to the intercity bus service, a number of private bus companies provide long-distance commuter bus service in Virginia, and transport an estimated 500,000 riders per year.
TDM programs help support Virginia’s public transportation and rail infrastructure as well as provide enhanced mobility. For purposes of this report, TDM consists of all meas-ures, exclusive of transit, that are used to provide alternatives to solo driving and/or encourage their use. The greatest amount of TDM activity has been in Northern Virginia, which accounted for 29 of the 36 TDM projects identified in the inventory for the recent period.
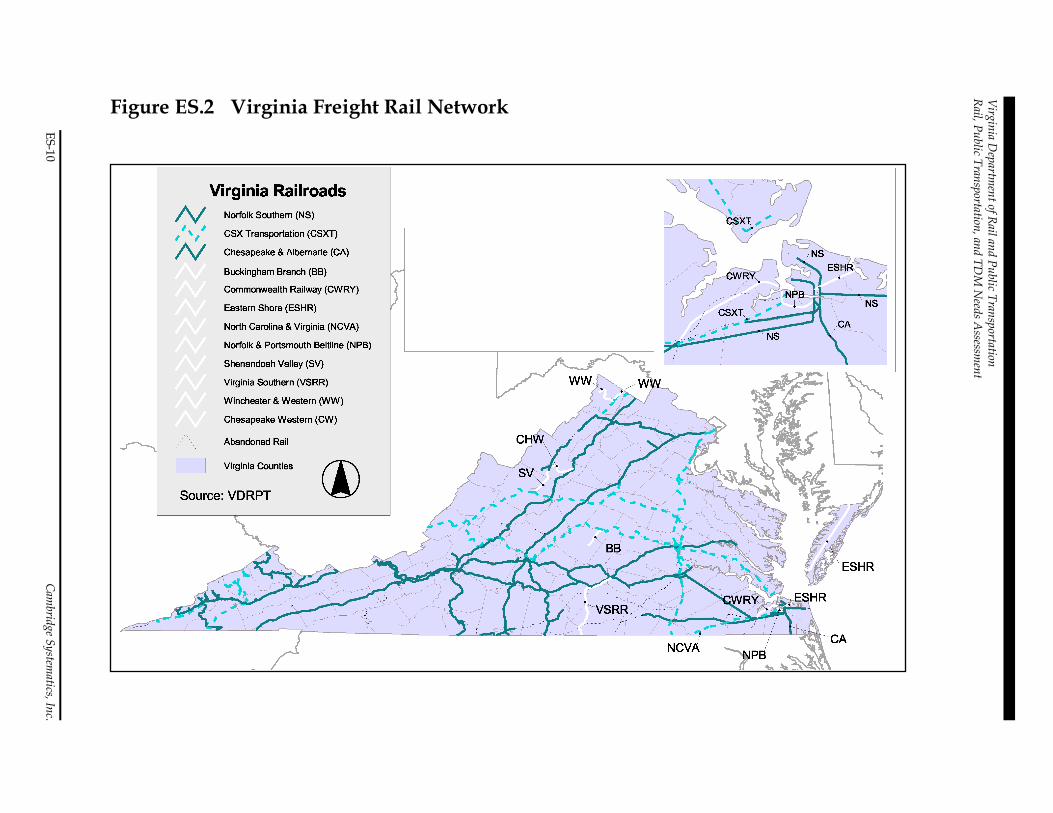
There are currently 12 freight railroads operating more than 3,400 route miles of track in the Commonwealth of Virginia. These railroads hauled 2.2 million carloads and 176 million tons of freight in 2002. The freight railroads employed 5,689 people in Virginia and paid nearly $316 million in total wages. Figure ES.2 displays the freight railroads cur-rently operating in Virginia.
Virginia D
epartment of Rail and Public Transportation
Rail, Public Transportation, and TDM
Needs A
ssessment
ES-10 Cam
bridge Systematics, Inc.
Figure ES.2 Virginia Freight Rail Network
Virginia Department of Rail and Public Transportation Rail, Public Transportation, and TDM Needs Assessment
Cambridge Systematics, Inc. ES-11
Reconnecting Virginians: Three Alternative Paths to a New Vision for Rail, Public Transportation, and Travel Demand Management
The rail, public transportation, and TDM needs estimates are based on three different assumptions regarding the role of rail and public transportation across the Commonwealth of Virginia between 2005 and 2025. The three alternative scenarios are:
• Scenario 1 – Status Quo (Loss of Market Share): Assumes a conservative approach to funding and service levels across the State;
• Scenario 2 – Strategic Investment (Maintain Market Share): Assumes modest improve-ments to existing services across the State; and
• Scenario 3 – Fully Integrated System (Increase Market Share): Aggressively expands and improves rail, public transportation, and TDM services across the State.
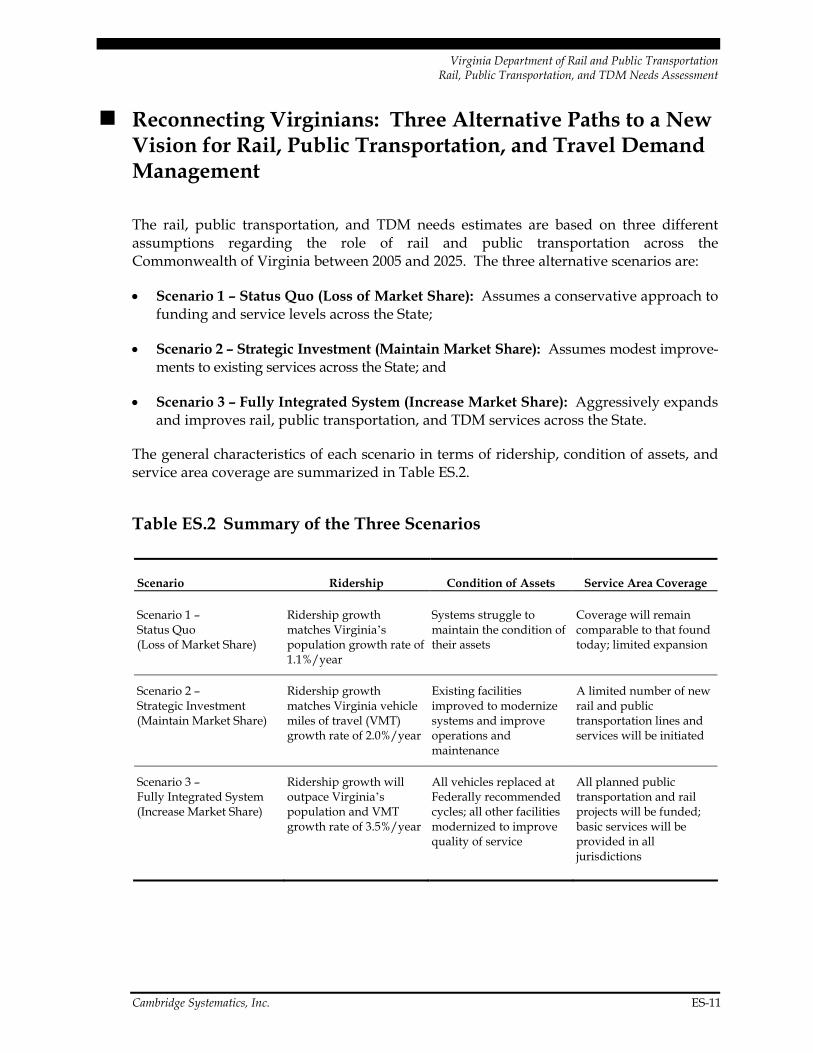
The general characteristics of each scenario in terms of ridership, condition of assets, and service area coverage are summarized in Table ES.2.
Table ES.2 Summary of the Three Scenarios
Scenario Ridership Condition of Assets Service Area Coverage
Scenario 1 – Status Quo (Loss of Market Share)
Ridership growth matches Virginia’s population growth rate of 1.1%/year
Systems struggle to maintain the condition of their assets
Coverage will remain comparable to that found today; limited expansion
Scenario 2 – Strategic Investment (Maintain Market Share)
Ridership growth matches Virginia vehicle miles of travel (VMT) growth rate of 2.0%/year
Existing facilities improved to modernize systems and improve operations and maintenance
A limited number of new rail and public transportation lines and services will be initiated
Scenario 3 – Fully Integrated System (Increase Market Share)
Ridership growth will outpace Virginia’s population and VMT growth rate of 3.5%/year
All vehicles replaced at Federally recommended cycles; all other facilities modernized to improve quality of service
All planned public transportation and rail projects will be funded; basic services will be provided in all jurisdictions

Virginia Department of Rail and Public Transportation Rail, Public Transportation, and TDM Needs Assessment
ES-12 Cambridge Systematics, Inc.
The scenarios outlined above served as the basis for the development of the statewide needs assessment. Public transportation systems across the Commonwealth have histori-cally taken different approaches to forecasting their potential capital and operating needs. In some cases, the forecasts have assumed an aggressive expansion of service, while other systems have relatively limited information available on potential needs. This analysis sought to develop consistency across these estimates by relating each to the three different scenarios. To the degree possible, the needs assessment used existing planning studies. Where such information was not available, needs estimates were developed based on Federally recommended vehicle and other capital asset replacement cycles and the facility modernization requirements that were identified by Virginia’s transit agencies.
Given the long-term nature of these needs estimates, forecasts were grouped into the cate-gories of urban, small urban, and rural systems. System-by-system forecasts are difficult to define given the shifting responsibility for services, the uncertainties of local population and employment forecasts, and uncertainties about local financial resources, particularly for the smaller jurisdictions.
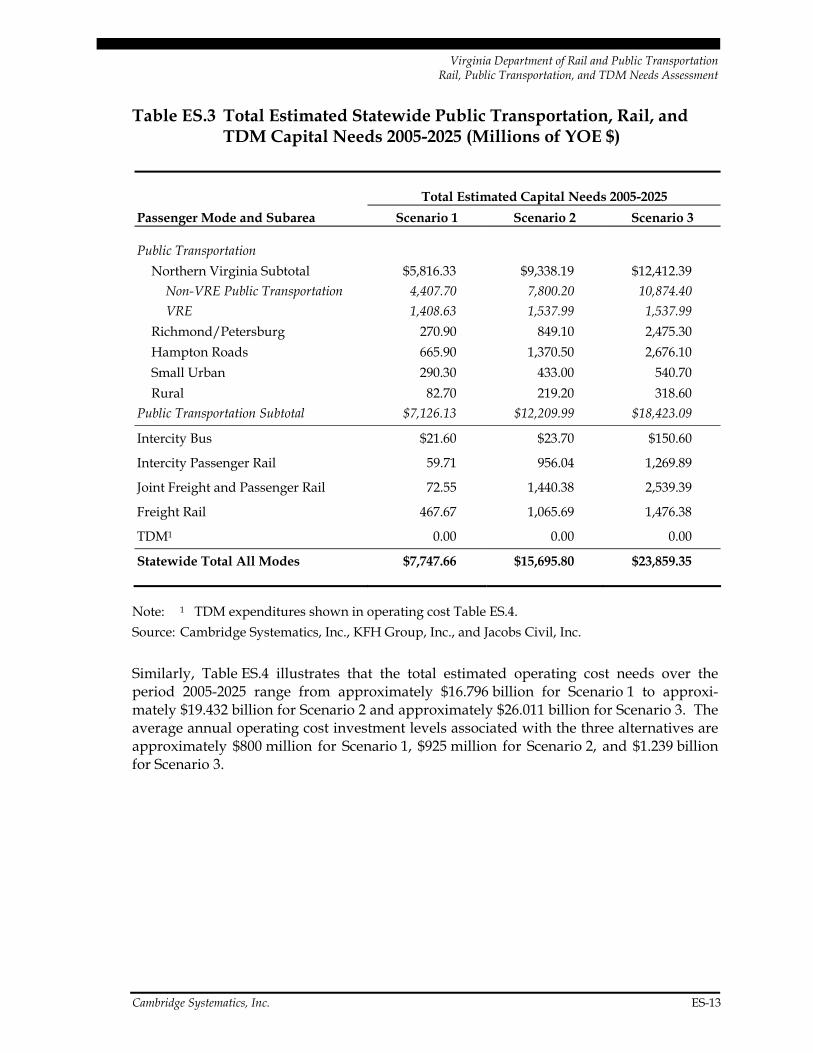
The total capital and operating cost needs associated with each of the three scenarios are based on a 21-year investment period beginning in FY 2005 and ending in FY 2025. All estimated costs are presented in terms of year-of-expenditure (YOE) dollars. Table ES.3 summarizes the estimated capital costs associated with each scenario, while Table ES.4 summarizes the estimated operating costs.
As shown on Table ES.3, the total estimated capital needs over the period 2005-2025 range from approximately $7.748 billion for Scenario 1 – Status Quo to approximately $15.696 billion for Scenario 2 – Strategic Investments and approximately $23.859 billion for Scenario 3 – Fully Integrated System. The average annual capital investment levels asso-ciated with the three alternatives are approximately $369 million for Scenario 1, $747 million for Scenario 2, and $1.136 billion for Scenario 3.
Virginia Department of Rail and Public Transportation Rail, Public Transportation, and TDM Needs Assessment
Cambridge Systematics, Inc. ES-13
Table ES.3 Total Estimated Statewide Public Transportation, Rail, and TDM Capital Needs 2005-2025 (Millions of YOE $)
Total Estimated Capital Needs 2005-2025 Passenger Mode and Subarea Scenario 1 Scenario 2 Scenario 3
Public Transportation Northern Virginia Subtotal $5,816.33 $9,338.19 $12,412.39
Non-VRE Public Transportation 4,407.70 7,800.20 10,874.40 VRE 1,408.63 1,537.99 1,537.99
Richmond/Petersburg 270.90 849.10 2,475.30 Hampton Roads 665.90 1,370.50 2,676.10 Small Urban 290.30 433.00 540.70 Rural 82.70 219.20 318.60
Public Transportation Subtotal $7,126.13 $12,209.99 $18,423.09
Intercity Bus $21.60 $23.70 $150.60
Intercity Passenger Rail 59.71 956.04 1,269.89
Joint Freight and Passenger Rail 72.55 1,440.38 2,539.39
Freight Rail 467.67 1,065.69 1,476.38
TDM1 0.00 0.00 0.00
Statewide Total All Modes $7,747.66 $15,695.80 $23,859.35
Note: 1 TDM expenditures shown in operating cost Table ES.4. Source: Cambridge Systematics, Inc., KFH Group, Inc., and Jacobs Civil, Inc.
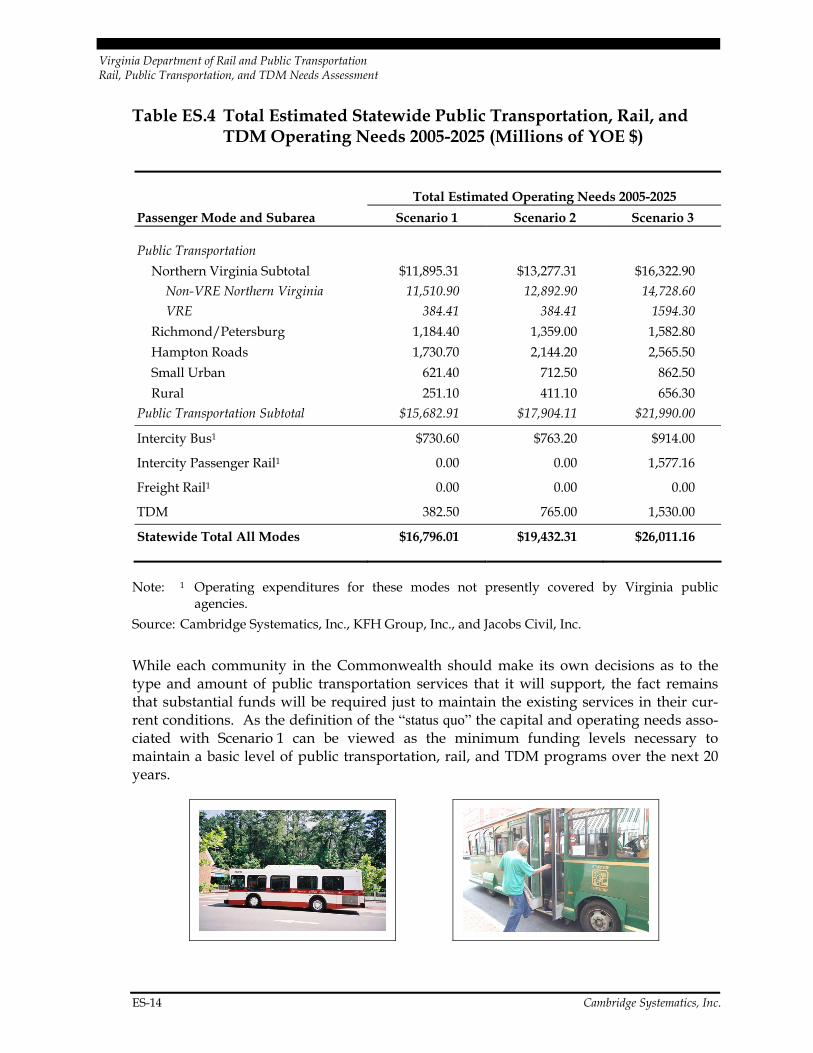
Similarly, Table ES.4 illustrates that the total estimated operating cost needs over the period 2005-2025 range from approximately $16.796 billion for Scenario 1 to approxi-mately $19.432 billion for Scenario 2 and approximately $26.011 billion for Scenario 3. The average annual operating cost investment levels associated with the three alternatives are approximately $800 million for Scenario 1, $925 million for Scenario 2, and $1.239 billion for Scenario 3.
Virginia Department of Rail and Public Transportation Rail, Public Transportation, and TDM Needs Assessment
ES-14 Cambridge Systematics, Inc.
Table ES.4 Total Estimated Statewide Public Transportation, Rail, and TDM Operating Needs 2005-2025 (Millions of YOE $)
Total Estimated Operating Needs 2005-2025 Passenger Mode and Subarea Scenario 1 Scenario 2 Scenario 3
Public Transportation Northern Virginia Subtotal $11,895.31 $13,277.31 $16,322.90
Non-VRE Northern Virginia 11,510.90 12,892.90 14,728.60 VRE 384.41 384.41 1594.30
Richmond/Petersburg 1,184.40 1,359.00 1,582.80 Hampton Roads 1,730.70 2,144.20 2,565.50 Small Urban 621.40 712.50 862.50 Rural 251.10 411.10 656.30
Public Transportation Subtotal $15,682.91 $17,904.11 $21,990.00
Intercity Bus1 $730.60 $763.20 $914.00
Intercity Passenger Rail1 0.00 0.00 1,577.16
Freight Rail1 0.00 0.00 0.00
TDM 382.50 765.00 1,530.00
Statewide Total All Modes $16,796.01 $19,432.31 $26,011.16
Note: 1 Operating expenditures for these modes not presently covered by Virginia public agencies.
Source: Cambridge Systematics, Inc., KFH Group, Inc., and Jacobs Civil, Inc.
While each community in the Commonwealth should make its own decisions as to the type and amount of public transportation services that it will support, the fact remains that substantial funds will be required just to maintain the existing services in their cur-rent conditions. As the definition of the “status quo” the capital and operating needs asso-ciated with Scenario 1 can be viewed as the minimum funding levels necessary to maintain a basic level of public transportation, rail, and TDM programs over the next 20 years.
Virginia Department of Rail and Public Transportation Rail, Public Transportation, and TDM Needs Assessment
Cambridge Systematics, Inc. ES-15
Funding Resources for 2025 Needs Scenarios
Capital and operating funding for public transportation will have to increase substantially over current and historically observed levels between today and 2025 in order to fully implement the recommended needs associated with any of the three alternative scenarios that have been considered.
The normal sources of regular capital assistance funding include a portion of the state transportation formula assistance and Federal transportation formula aid. Local govern-ments also typically provide a match, usually at a level equal to or slightly greater than the state contribution. Extrapolating current and historically observed Federal and state funding levels into the future, it is estimated that a total of approximately $5.413 billion could be reasonably expected to be available to support transit capital investments in Virginia over the period 2005 to 2025. This is equivalent to an average annual funding stream of approximately $258 million per year. By comparison, the total estimated transit capital needs across the Commonwealth over the period 2005-2025 are estimated to range from approximately $7.748 billion for Scenario 1 to approximately $23.859 billion for Scenario 3.
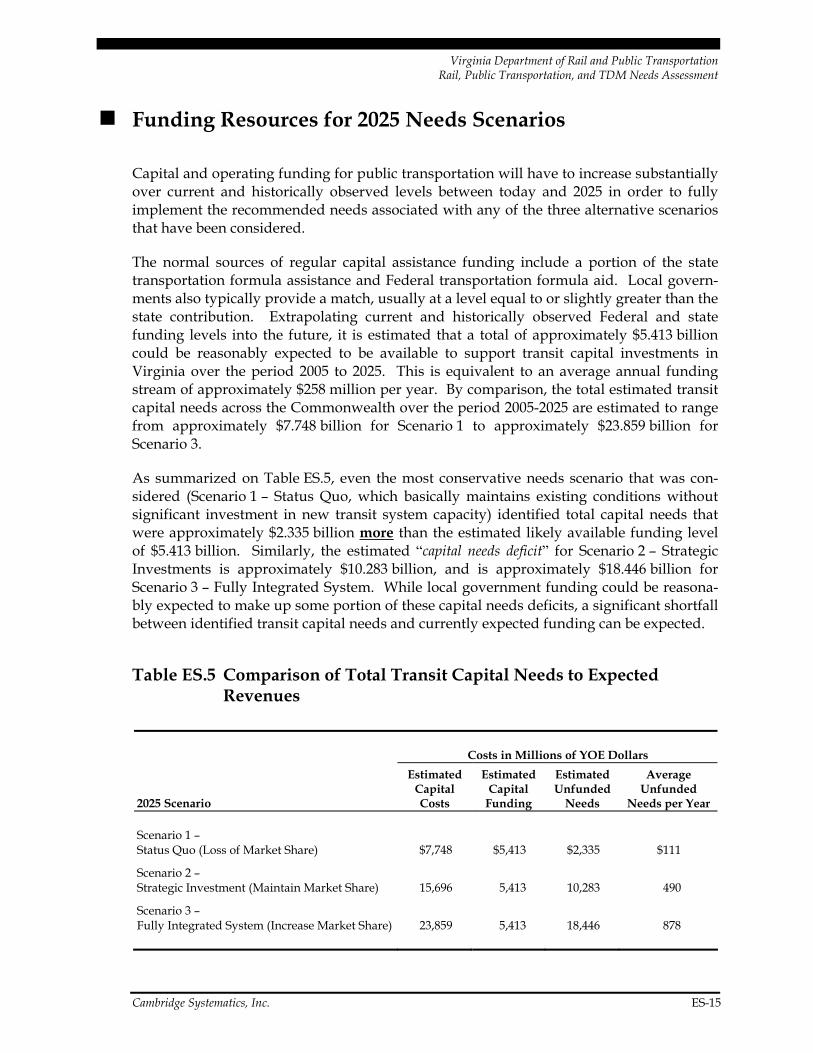
As summarized on Table ES.5, even the most conservative needs scenario that was con-sidered (Scenario 1 – Status Quo, which basically maintains existing conditions without significant investment in new transit system capacity) identified total capital needs that were approximately $2.335 billion more than the estimated likely available funding level of $5.413 billion. Similarly, the estimated “capital needs deficit” for Scenario 2 – Strategic Investments is approximately $10.283 billion, and is approximately $18.446 billion for Scenario 3 – Fully Integrated System. While local government funding could be reasona-bly expected to make up some portion of these capital needs deficits, a significant shortfall between identified transit capital needs and currently expected funding can be expected.
Table ES.5 Comparison of Total Transit Capital Needs to Expected Revenues
Costs in Millions of YOE Dollars
2025 Scenario
Estimated Capital Costs
Estimated Capital
Funding
Estimated Unfunded
Needs
Average Unfunded
Needs per Year
Scenario 1 – Status Quo (Loss of Market Share) $7,748 $5,413 $2,335 $111
Scenario 2 – Strategic Investment (Maintain Market Share) 15,696 5,413 10,283 490
Scenario 3 – Fully Integrated System (Increase Market Share) 23,859 5,413 18,446 878
Virginia Department of Rail and Public Transportation Rail, Public Transportation, and TDM Needs Assessment
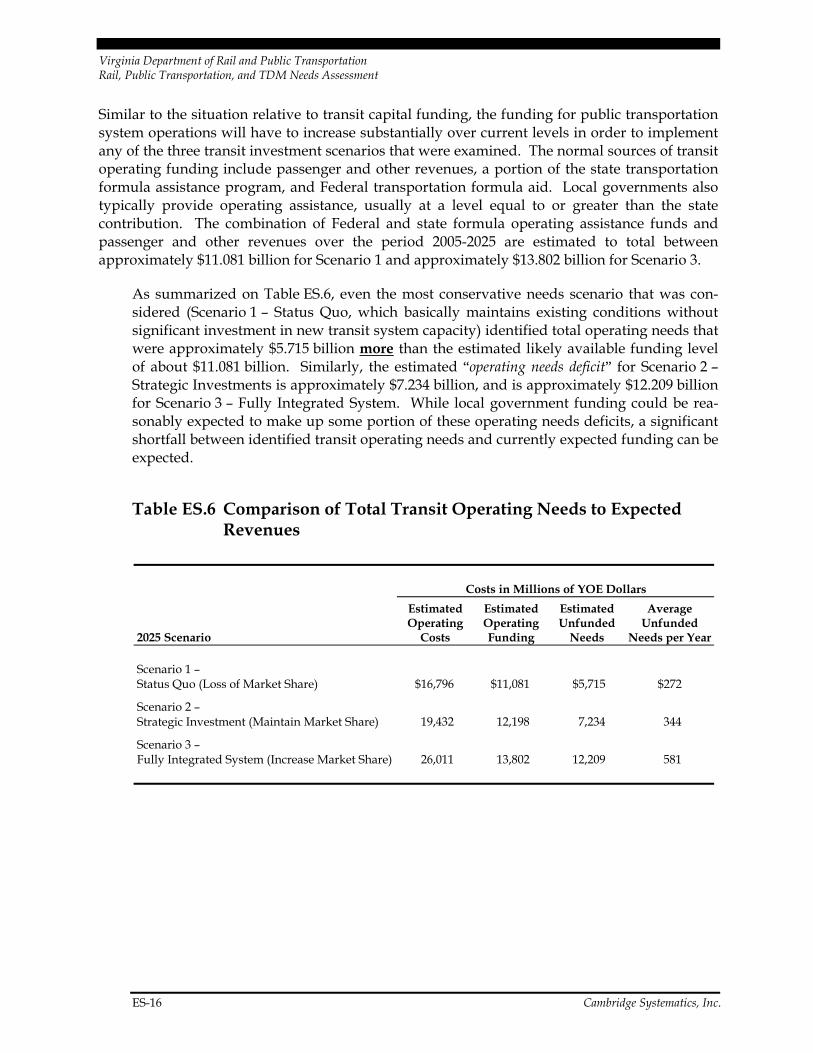
Similar to the situation relative to transit capital funding, the funding for public transportation system operations will have to increase substantially over current levels in order to implement any of the three transit investment scenarios that were examined. The normal sources of transit operating funding include passenger and other revenues, a portion of the state transportation formula assistance program, and Federal transportation formula aid. Local governments also typically provide operating assistance, usually at a level equal to or greater than the state contribution. The combination of Federal and state formula operating assistance funds and passenger and other revenues over the period 2005-2025 are estimated to total between approximately $11.081 billion for Scenario 1 and approximately $13.802 billion for Scenario 3.
As summarized on Table ES.6, even the most conservative needs scenario that was con-sidered (Scenario 1 – Status Quo, which basically maintains existing conditions without significant investment in new transit system capacity) identified total operating needs that were approximately $5.715 billion more than the estimated likely available funding level of about $11.081 billion. Similarly, the estimated “operating needs deficit” for Scenario 2 – Strategic Investments is approximately $7.234 billion, and is approximately $12.209 billion for Scenario 3 – Fully Integrated System. While local government funding could be rea-sonably expected to make up some portion of these operating needs deficits, a significant shortfall between identified transit operating needs and currently expected funding can be expected.
Table ES.6 Comparison of Total Transit Operating Needs to Expected Revenues
Costs in Millions of YOE Dollars
2025 Scenario
Estimated Operating
Costs
Estimated Operating Funding
Estimated Unfunded
Needs
Average Unfunded
Needs per Year
Scenario 1 – Status Quo (Loss of Market Share) $16,796 $11,081 $5,715 $272
Scenario 2 – Strategic Investment (Maintain Market Share) 19,432 12,198 7,234 344
Scenario 3 – Fully Integrated System (Increase Market Share) 26,011 13,802 12,209 581
ES-16 Cambridge Systematics, Inc.
1.0 The Context for the Rail and Public Transportation and TDM Needs Assessment

Virginia Department of Rail and Public Transportation Rail, Public Transportation, and TDM Needs Assessment
Cambridge Systematics, Inc. 1-1
1.0 The Context for the Rail and Public Transportation and TDM Needs Assessment
This is the Needs Assessment for rail and public transportation and travel demand man-agement (TDM) in the Commonwealth of Virginia. The Needs Assessment was devel-oped by the Virginia Department of Rail and Public Transportation (Virginia DRPT) to determine long-term needs through 2025 for investments in rail, public transportation, and TDM. A long-range plan will be developed in 2004 to further determine the desirable path.
The Virginia DRPT Rail and Public Transportation and TDM Needs Assessment is an important element of an overall statewide planning effort, VTrans2025, that will identify an integrated, multimodal, long-range transportation plan for the Commonwealth. The VTrans2025 effort is supported by the Virginia DRPT, the Virginia Department of Transportation (VDOT), and other modal agencies under the leadership of Governor Mark Warner. The needs assessment is being conducted within the context of Virginia and Federal legislation, and takes account of ongoing regional and local planning.
1.1 VTrans2025 – The Vision and Framework
VTrans2025 provides the vision and framework for long-range planning. Most of us share a common “vision” of what we want the future to be like – peace, prosperity, opportunity, comfort, security, etc. Much of our shared vision of the future is affected directly by our ability to move throughout our communities, our regions, the Commonwealth, and the nation. In other words, our future is in many ways determined by how well our trans-portation network functions.
Virginia Department of Rail and Public Transportation Rail, Public Transportation, and TDM Needs Assessment
1-2 Cambridge Systematics, Inc.
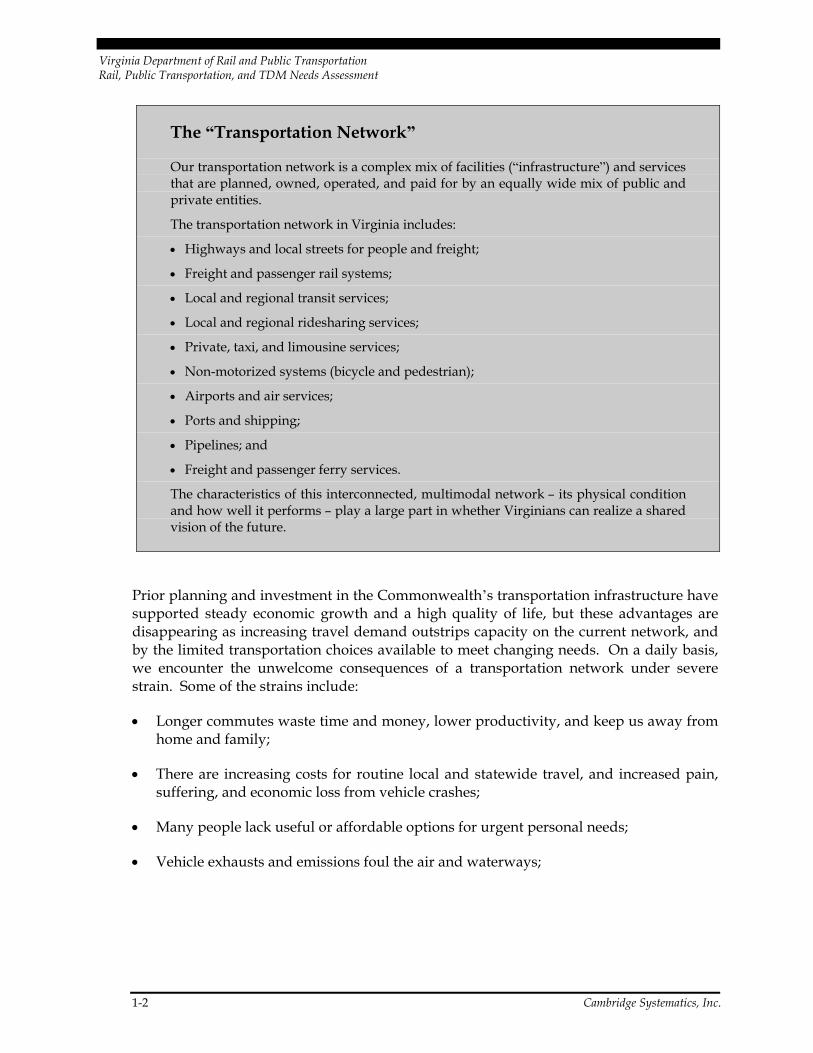
The “Transportation Network”
Our transportation network is a complex mix of facilities (“infrastructure”) and services that are planned, owned, operated, and paid for by an equally wide mix of public and private entities.
The transportation network in Virginia includes:
• Highways and local streets for people and freight;
• Freight and passenger rail systems;
• Local and regional transit services;
• Local and regional ridesharing services;
• Private, taxi, and limousine services;
• Non-motorized systems (bicycle and pedestrian);
• Airports and air services;
• Ports and shipping;
• Pipelines; and
• Freight and passenger ferry services.
The characteristics of this interconnected, multimodal network – its physical condition and how well it performs – play a large part in whether Virginians can realize a shared vision of the future.
Prior planning and investment in the Commonwealth’s transportation infrastructure have supported steady economic growth and a high quality of life, but these advantages are disappearing as increasing travel demand outstrips capacity on the current network, and by the limited transportation choices available to meet changing needs. On a daily basis, we encounter the unwelcome consequences of a transportation network under severe strain. Some of the strains include:
• Longer commutes waste time and money, lower productivity, and keep us away from home and family;
• There are increasing costs for routine local and statewide travel, and increased pain, suffering, and economic loss from vehicle crashes;
• Many people lack useful or affordable options for urgent personal needs;
• Vehicle exhausts and emissions foul the air and waterways;
Virginia Department of Rail and Public Transportation Rail, Public Transportation, and TDM Needs Assessment
Cambridge Systematics, Inc. 1-3
• Open space is lost and productive agricultural land taken for sprawling development; and
• Increasing costs for maintenance of the transportation network, and high costs for net-work expansion make it difficult to solve mobility problems.
The VTrans2025 effort was initiated by Virginia’s transportation agencies at the direction of the General Assembly and is intended to avoid and, where necessary, reverse these troubling trends. The starting point for VTrans2025 is the establishment of a shared vision and goals for our multimodal transportation network, a vision that will allow us to fully realize an ever-improving quality of life throughout the Commonwealth in the decades ahead. But we have choices in shaping our transportation vision …and choices in how our vision is pursued.
VTrans2025 Partnering Agencies
Virginia Department of Transportation (VDOT)
Virginia Department of Rail and Public Transportation (Virginia DRPT)
Virginia Port Authority (VPA)
Virginia Department of Aviation (DOAV)
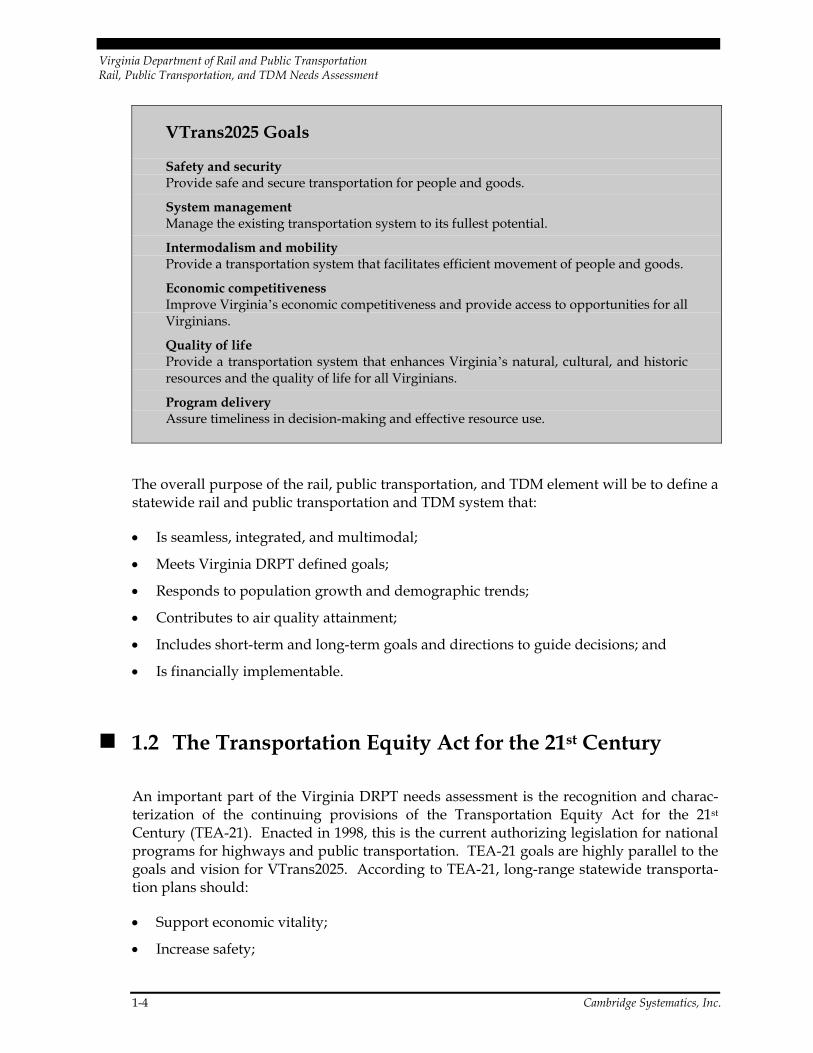
VTrans2025 – Goals
From extensive statewide outreach activities conducted in 2002, a series of general goals have been established that describe what Virginians want and expect from the State’s multimodal transportation network. These represent the fundamental “yardsticks” by which we can judge the success and performance of the transportation network over time. Progress in meeting these goals depends, in part, on:
• A clear understanding of the context and conditions we face today – current circum-stances and emerging trends that affect mobility and ease of access throughout the Commonwealth; and
• The vision we share of our transportation future.
Virginia Department of Rail and Public Transportation Rail, Public Transportation, and TDM Needs Assessment
1-4 Cambridge Systematics, Inc.
VTrans2025 Goals
Safety and security Provide safe and secure transportation for people and goods.
System management Manage the existing transportation system to its fullest potential.
Intermodalism and mobility Provide a transportation system that facilitates efficient movement of people and goods.
Economic competitiveness Improve Virginia’s economic competitiveness and provide access to opportunities for all Virginians.
Quality of life Provide a transportation system that enhances Virginia’s natural, cultural, and historic resources and the quality of life for all Virginians.
Program delivery Assure timeliness in decision-making and effective resource use.
The overall purpose of the rail, public transportation, and TDM element will be to define a statewide rail and public transportation and TDM system that:
• Is seamless, integrated, and multimodal;
• Meets Virginia DRPT defined goals;
• Responds to population growth and demographic trends;
• Contributes to air quality attainment;
• Includes short-term and long-term goals and directions to guide decisions; and
• Is financially implementable.
1.2 The Transportation Equity Act for the 21st Century
An important part of the Virginia DRPT needs assessment is the recognition and charac-terization of the continuing provisions of the Transportation Equity Act for the 21st Century (TEA-21). Enacted in 1998, this is the current authorizing legislation for national programs for highways and public transportation. TEA-21 goals are highly parallel to the goals and vision for VTrans2025. According to TEA-21, long-range statewide transporta-tion plans should:
• Support economic vitality;
• Increase safety;
Virginia Department of Rail and Public Transportation Rail, Public Transportation, and TDM Needs Assessment
Cambridge Systematics, Inc. 1-5
• Increase the mobility of people and freight;
• Improve energy conservation;
• Protect the environment;
• Enhance links in the transportation system; and
• Promote efficiency and preserve the existing transportation system.1
Both the overarching VTrans2025 effort and the component Virginia DRPT needs assess-ment incorporate all of these TEA-21 planning factors. Public transportation and rail in the Commonwealth are critical to the achievement of these TEA-21 planning factors. Public transportation and rail have been demonstrated in previous research to be impor-tant to Virginia’s economic vitality. For example, a study of Northern Virginia found that investment in Metrorail is linked to a major proportion of the region’s economic develop-ment and the State’s economic and fiscal health (source: KPMG Peat Marwick “Fiscal Impact of Metrorail on the Commonwealth of Virginia,” prepared for the Northern Virginia Transportation Commission (NVTC), 1994). Transit and rail investment is equally important for the economic health of the other urban and rural areas of Virginia.
Public transportation and rail provide for safer travel than travel by personal vehicle. Public transportation and rail services are important to personal mobility and freight mobility, respectively, but both also enhance the performance of the highway system by reducing congestion, making overall passenger and freight travel more efficient.
When well used, public transportation and rail are generally acknowledged to be extremely energy efficient and environmentally friendly in comparison to other modes, and investment in public transportation and rail can enhance energy efficiency and envi-ronmental quality. Public transportation and rail investment can help to promote energy independence and reduce air quality issues in all areas.
Enhancing linkages is an important goal of the Virginia DRPT rail and public transporta-tion and TDM needs assessment. Likewise, the investments identified in the needs assessment are those that promote efficiency and preserve the assets and performance of the existing system.
TEA-21 is scheduled to be reauthorized in early 2004 and it is anticipated that the policy context at the Federal level will continue to resemble TEA-21. Virginia’s rail and public transportation plan can be adjusted to the requirements of any new Federal legislation, but the needs for rail and public transportation will be determined by factors within the Commonwealth.
1 Transportation Equity Act for the 21st Century, Section 1204 “Statewide Planning.”
Virginia Department of Rail and Public Transportation Rail, Public Transportation, and TDM Needs Assessment
1-6 Cambridge Systematics, Inc.
1.3 Other Rail and Public Transportation Planning Efforts and Initiatives in Virginia
VTrans2025 and the Federal legislation provide the overall framework for statewide rail and public transportation planning in Virginia, but there is a rich and comprehensive array of other planning efforts that are critical to Virginia and its regions and local areas. These plans form a starting point for this assessment of needs and have been reviewed in detail. Together, these plans influence the inventory, the service assessments, the fore-casts, the assessment of needs, and the development of the Commonwealth’s rail, public transportation, and TDM plan.
The successes of the transit planning efforts underway are already being demonstrated on the ground. Public transportation and rail services are being expanded successfully in several areas of Virginia. In Northern Virginia, the regional and local bus services in many jurisdictions are being expanded rapidly to serve burgeoning demands and to help resolve the serious congestion issues facing the region. The Dulles Toll Road corridor is identified in the Northern Virginia region’s 2020 long-range plan as the primary rail expansion corridor, and is included in the fiscally constrained long-range transportation plan of the Metropolitan Washington Council of Governments (MWCOG). The Virginia Railway Express (VRE) strategic plan calls for a continuation of the successful expansion of service that has been underway for the past decade to serve very strong ridership growth.
Similarly, local and regional bus services are expanding and commuter rail and light rail transit options are being considered for implementation in the Hampton Roads and Richmond areas. New and expanded public transportation services are being imple-mented in the small urban areas and rural areas of the Commonwealth. While the future of the Amtrak system is now being deliberated in Congress, Virginia has already analyzed the potential for improved intercity rail services in a wide range of corridors. The other sections of this needs assessment describe how it is possible to build upon the previous studies and successes with new services and service expansions to assure that rail and public transportation can help Virginia fulfill its transportation vision.
1.4 A New Transit Vision for Virginia
The existing public transportation services in Virginia are an integral part of the Commonwealth’s multimodal ground transportation system. On a typical weekday, more than 600,000 Virginians board vans, buses, or rail transit vehicles to travel to work, to school, and to shopping. For many of these persons, public transit is their only reliable and affordable mode of travel. Were these systems to cease to function for any reason, the costs would tremendous. Not only would there be a loss of at least $336 million in annual transit operating expenditures, but the effects of increased traffic congestion and lost wages by workers no longer able to get to their jobs would be significant as well.
Virginia Department of Rail and Public Transportation Rail, Public Transportation, and TDM Needs Assessment
Cambridge Systematics, Inc. 1-7
Transit use in Virginia has been growing dramatically in recent years. Over the period 1998 through 2001 alone, total annual transit ridership statewide increased by about 21 percent. While much of this ridership growth took place in the State’s larger urban areas, increasing transit use has also taken place in the small urban and rural areas of the State where service currently exists. With population and employment in Virginia pro-jected to experience steady increases over the coming decades, demands by the Commonwealth’s citizens for new and improved transit services can also be expected to increase.
The needs for new transit services are particularly significant in those cities and counties where public transportation does not currently exist. In total, 48 of the Commonwealth’s 136 counties and independent cities, or about 35 percent, currently lack local transit ser-vices. Measured on the basis of population, these communities represent approximately 1.2 million persons, or about 17 percent of Virginia’s total population in 2000 of about 7.1 million people.
It is against this background of ever-increasing usage of existing transit systems, an expanding population base, and a significant portion of the population currently lacking access to public transportation that the following vision and policy framework is pre-sented for the future of the statewide public transportation system in the Commonwealth of Virginia.
The Public Transportation Vision for Virginia
Over the past few years, several of Virginia’s neighboring states, particularly including Maryland and North Carolina, have developed statewide public transportation plans. “Getting on Board: The Maryland Comprehensive Transit Plan,”2 defined a series of investments designed to increase statewide transit ridership from approximately 570,000 riders per day in 1995 to at least one million riders a day by 2020. Similarly, the North Carolina state public transportation plan, Transit 2001,3 presented an action agenda designed to chart a new course for the State in terms of transit service design and delivery; community planning and development; and funding. The stated outcome of this action agenda was to “transform our state into a national leader in transit service and innovation.” From the perspective of regional and national competitiveness, it is thus incumbent on Virginia to keep pace with its peers in terms of ensuring that public transportation ser-vices play an integral role in the Commonwealth’s overall transportation system.
In terms of defining a public transportation “vision” for Virginia, the vision developed as part of the North Carolina Transit 2001 process provides instructive guidance.
2 Maryland Department of Transportation, Maryland Transit Administration, “Getting on Board:
The Maryland Comprehensive Transit Plan,” Baltimore, Maryland, June 2001. 3 North Carolina Department of Transportation, “The Transit 2001 Executive Summary and
Technical Report,” Raleigh, North Carolina, January 1997.
Virginia Department of Rail and Public Transportation Rail, Public Transportation, and TDM Needs Assessment
1-8 Cambridge Systematics, Inc.
“It is in North Carolina’s best interests to...
• “Ensure greater choices and more travel options tailored to the varying needs of residents, visitors, business, and industry.
• “Increase choices in residential arrangements that minimize the burden of travel and allow safe and convenient use of a variety of travel options.
• “Deploy new systems, services, and technologies to ease the travel burden and to extend and increase the efficiency of the current highway system.
• “Take a leadership role in development of a truly seamless multimodal transportation net-work which links:
1. Access to services and facilities for those with limited transportation options in rural areas.
2. A fully functional network of convenient shared-ride transit services in metropolitan regions.
3. Conventional and high-speed rail passenger service in heavily traveled corridors.
“In simplest terms, as we set course for the 21st Century, it is in North Carolina’s long-term best interest to embrace transit options that capture a larger share of the burgeoning travel market!”4
A similar public transportation vision for Virginia should be an important element of the ultimate rail, public transportation, and TDM portion of the VTrans2025 long-range, mul-timodal statewide transportation plan. Building upon this general vision concept defined for the State of North Carolina and the analysis conducted to date relative to the conduct of the Virginia statewide public transportation needs assessment, the following series of goals, policies, and strategies are proposed for consideration by the Virginia DRPT as inputs to the more detailed quantification of the final public transit element of VTrans2025. These suggested goals, policies, and strategies have been adapted from those contained in the Oregon Public Transportation Plan5 and tailored to reflect the unique characteristics of the Commonwealth of Virginia.
4 Ibid., Executive Summary, Page 10. 5 Oregon Department of Transportation, “Oregon Public Transportation Plan: An Element of the
Oregon Transportation Plan,” Salem, Oregon, Adopted April 1997.
Virginia Department of Rail and Public Transportation Rail, Public Transportation, and TDM Needs Assessment
Cambridge Systematics, Inc. 1-9
Goal 1. Provide Mobility, Enhance Livability, and Support Economic Opportunity
The Virginia public transportation system should provide mobility alternatives to meet daily medical, employment, educational, business, and leisure needs without dependence on single-occupant vehicle transportation. The system should enhance livability and eco-nomic opportunities for all Virginians, and lessen the transportation system’s impact on the environment. The public transportation system should provide services and meet transportation needs in a coordinated, integrated, and efficient manner.
Policy 1A. Provide Basic Mobility Within and Between Urban and Rural Parts of the Commonwealth
The Virginia public transportation system should serve urban and metropolitan areas by assuring mobility within urban areas and regions, providing access to jobs, and adding capacity to the regional transportation systems. The public transportation system should provide for intermodal connections assuring easy movement between urban and state-wide transportation systems and contributing to state transportation objectives and level of service goals.
The public transportation system should provide access to rural areas, connecting them with all other parts of the State, and with service within them, so that residents have access to all parts of their communities. Service to and within rural areas and small cities should fit the needs of the community, be economical, convenient to use, and contribute to state transportation objectives and level of service goals.
The public transportation system should provide a basic level of mobility sufficient to meet the essential travel needs of all persons living and traveling throughout Virginia. Basic mobility includes the ability to travel conveniently, economically, safely, and securely to meet medical, employment, educational, business, and leisure needs.
• Strategy 1A.1. Work with local governments to promote the development and use of public transportation, TDM, bicycle, and pedestrian services.
• Strategy 1A.2. Work with local governments to identify and seek funding for high-priority public transportation projects.
• Strategy 1A.3. Promote the development of interurban bus and rail passenger services to improve linkages among urban areas and between Virginia and adjacent states.
• Strategy 1A.4. Encourage adequate and efficient public transportation access to employment, shopping, and other commerce, medical care, housing, and leisure activities, including access for the transportation disadvantaged.
Virginia Department of Rail and Public Transportation Rail, Public Transportation, and TDM Needs Assessment
1-10 Cambridge Systematics, Inc.
Policy 1B. Environmental Protection – Reduce the Effect of Travel on the Environment
The Virginia public transportation system should be designed, operated, and maintained so that public transportation facilities and services lessen the transportation system’s impact on air and water quality, the natural environment, and energy consumption.
• Strategy 1B.1. Minimize transportation-related energy consumption through improved public transportation vehicle efficiencies, the use of clean burning fuels, and increase use of fuel-efficient modes including transit, TDM, bicycling, and walking.
• Strategy 1B.2. Cooperate with the Virginia Department of Environmental Quality (DEQ) and VDOT in carrying out the transportation-related requirements of the Federal and State clean air standards.
Policy 1C. Economic Prosperity
The Virginia public transportation system should strengthen economic opportunities by providing travel options that increase access to jobs.
Policy 1D. Land Use Support Transit and Environmentally Friendly Development Patterns
The Virginia public transportation system and local land use planning should be comple-mentary and coordinated. Public transportation should be both responsive to and facili-tate the implementation of local land use plans and development policies.
• Strategy 1D.1. Encourage public transportation projects that support compact or in-fill development or mixed-use projects.
• Strategy 1D.2. Promote the development of interurban bus and rail passenger services to improve linkages among urban areas and achieve state and local land use goals.
Policy 1E. Enhance the Capacity of the Commonwealth’s Highway System by Providing a Transportation Alternative
The Virginia public transportation system, especially in the Commonwealth’s urbanized areas and large cities, should function as an integral component of and reduce pressure on the overall transportation system.
• Strategy 1E.1. Promote the use of TDM and transportation system management tech-niques that reduce peak-period single-occupant automobile travel and vehicle miles of travel (VMT), spread traffic volumes away from the peak period, and improve traffic flow. Such techniques include high-occupancy vehicle (HOV) lanes with express tran-sit service, carpools, parking management, peak-period pricing, ramp metering,
Virginia Department of Rail and Public Transportation Rail, Public Transportation, and TDM Needs Assessment
Cambridge Systematics, Inc. 1-11
traveler information systems, incident management, bicycling and walking modes, and telecommuting and flexible work hour scheduling.
Goal 2. Provide a Coordinated, Efficient, and Integrated Network of Public Transportation Providers
The Virginia public transportation system should be statewide, well maintained and man-aged, and safe and pleasant to use. The public transportation system should be comprised of a hierarchy starting with (level 1) ridesharing or volunteer programs and moving upward as population and density increase to include (level 2) demand-responsive ser-vices and finally adding (level 3) fixed-route services where appropriate.
The many elements should be designed and operated to work together to accommodate the unique needs of different regions of the State according to their populations, densities, locations, forms, and functions. To ensure coordination and efficiency, different types of services should be provided as part of a single, unified public transportation system. Systems to accommodate those with special travel needs and general public users should be integrated. TDM projects should be encouraged anywhere they can meet an identified need, and not be restricted to metropolitan areas.
Policy 2A. Provide an Alternative to the Single-Occupant Automobile
Public transportation in urbanized areas and large cities should serve as an alternative to the single-occupant vehicle to provide mobility, access employment, reduce congestion, and maintain air quality. The urbanized area public transportation systems should be comprised of commuter rail, heavy and light rail services, if appropriate, fixed-route bus and demand-responsive transit, rideshare matching and TDM services, as well as taxi, special needs transportation services, and other alternatives.
Public transportation should be provided in small cities and towns in a manner appropri-ate for their sizes, densities, and locally identified needs. At a minimum, public transpor-tation should serve the transportation disadvantaged with rideshare, volunteer programs, taxis, or minibus services. Rideshare matching and TDM services should be available in all communities with populations of more than 10,000 persons, and may be available in communities of 5,000 or more persons where there are large employers with a base of at least 500 employees who are not covered by a regional program. General public trans-portation with fixed-route or other service may be available, and all places of 10,000 peo-ple or more should have demand-responsive service.
• Strategy 2A.1. Encourage adequate public transportation access to employment, shop-ping, and other commerce, medical care, housing, and leisure activities, including access for the transportation disadvantaged.
• Strategy 2A.2. Implement the public transportation requirements of the Americans with Disabilities Act of 1990.
Virginia Department of Rail and Public Transportation Rail, Public Transportation, and TDM Needs Assessment
1-12 Cambridge Systematics, Inc.
• Strategy 2A.3. Promote the development of transit centers that are safe, near residen-tial areas, and easily accessible to pedestrians and bicyclists.
• Strategy 2A.4. Define appropriate minimum levels of service for public transportation in communities of various sizes throughout the Commonwealth of Virginia.
• Strategy 2A.5. Encourage modal alternatives to the use of the single-occupant automobile.
• Strategy 2A.6. Pursue revision of regulatory systems as necessary to stimulate the pro-vision of transportation services by private companies in rural areas.
Policy 2B. Provide a Coordinated and Unified Network of Transportation Services to Support Interregional and Intraregional Travel
The intercity bus and rail system should operate to provide a well-coordinated, unified network that enables Virginians and visitors to access services and activities as identified in the minimum levels of service to be defined as described in Strategy 2A.4. The intercity passenger rail system should provide service through Virginia’s main regional and inter-state travel corridors. The intercity passenger bus system should compliment the intercity rail passenger service by augmenting train schedules, providing feeder service, and serving the bulk of intercity travel needs to communities outside of rail corridors.
• Strategy 2B.1. Promote the growth of intercity bus and rail passenger services to link all areas of the State with national and international transportation facilities.
• Strategy 2B.2. Promote the development of interurban bus and rail passenger services to improve linkages among Virginia’s urban areas and to help support local land use goals.
• Strategy 2B.3. Implement the public transportation requirements of the Americans with Disabilities Act of 1990.
• Strategy 2B.4. Preserve corridors for future public transportation development.
• Strategy 2B.5. Facilitate the development and operation of transportation hubs with statewide, interstate, and international functions. Encourage the development of a system of passenger facilities throughout the State that expedite transfers between modes, routes, and carriers.
Goal 3. Support a Cooperative Financing Strategy with Intergovernmental and Private Funding Partnerships
The Virginia public transportation system should be planned, operated, managed, and financed cooperatively by public and private organizations representing statewide, regional, and local interests.
Virginia Department of Rail and Public Transportation Rail, Public Transportation, and TDM Needs Assessment
Cambridge Systematics, Inc. 1-13
Policy 3A. Develop a Sustainable and Cooperative Decision-making and Funding Strategy
The Commonwealth of Virginia’s role in developing, planning, and financing the public transportation system should include the development of a framework for decision-making and coordination among transportation agencies, providing leadership over statewide issues and concerns, building consensus among different regions and transpor-tation organizations, assisting with funding, and providing technical assistance.
• Strategy 3A.1. In partnership with other public and private organizations, develop and maintain intercity bus and rail services contingent on the availability of adequate funding.
• Strategy 3A.2. Broaden the research responsibilities of VDOT and Virginia DRPT to include research for all modes of travel and serve as an information clearinghouse to disseminate pertinent research being done elsewhere.
Policy 3B. Provide Reliable, Flexible, and Stable Funding Resources
State financial support for public transportation should be reliable, flexible, and stable, based on level of service factors, linked to state objectives and financial resources. The Commonwealth of Virginia, in partnership with others, should continue to seek the development of new financing mechanisms that contribute to the overall financial ade-quacy of the public transportation system to meet these objectives.
Policy 3C. Develop and Maintain a Statewide Public Transportation Management System
The Virginia DRPT, in cooperation with affected local, regional, and state organizations, will develop and maintain a statewide Public Transportation Management System (PTMS). The PTMS will supply data and other information to help guide public trans-portation planning, decision-making, and financing.
• Strategy 3C.1. Develop, establish, and implement management systems, as appropriate.
• Strategy 3C.2. Provide management training and technology sharing for public and private transportation providers and operators.
• Strategy 3C.3. Promote and support a continuous, statewide public transportation planning process. At a minimum, all public transit grant recipients in the Commonwealth of Virginia should have an adopted short-range transit development program (TDP) that is no more than five years old. Any such short-range transit plans should be updated no less frequently than once every three years.
Virginia Department of Rail and Public Transportation Rail, Public Transportation, and TDM Needs Assessment
1-14 Cambridge Systematics, Inc.
Policy 3D. Develop a Cooperative Local and State Partnership to Develop and Plan the Commonwealth’s Public Transportation System
The Commonwealth of Virginia should participate with local governments and other organizations to develop the public transportation system. The level of Virginia DRPT’s support should be greater for those projects serving a state level or statewide public transportation function or need.
• Strategy 3D.1. Form partnerships to develop and maintain intercity public transporta-tion services that link small communities and rural areas to basic goods and services, appropriate to community size and the availability of resources.
1.5 Process Used to Develop the Rail and Public Transportation and TDM Needs Assessment
Virginia DRPT has followed a systematic process for developing the needs assessment that has included public involvement and stakeholder outreach; inventory and assessment of the existing systems and services; forecasts of usage and needs; and identification of the investments and the investment levels necessary to meet the needs.
To date, several rounds of public meetings have been held around Virginia to help to flesh out the vision for VTrans2025. Specifically for the rail and public transportation and TDM needs assessment, stakeholder meetings have been held with many of the transit agencies, and additional interactions were sought to review the draft needs assessment. Reviews of this initial work will help inform the development of the overall long-range plan for rail and public transportation, to be developed in 2004 as a part of the development of the VTrans2025 long-range plan.
The development of this needs assessment has also involved an inventory of existing sys-tems and services, and an assessment of the systems and services. Scenarios were devel-oped for alternative future levels of public transportation and rail usage in the Commonwealth, and the resource needs of each scenario have been identified.
2.0 The Demography and Economy of the Commonwealth of Virginia: Factors Impacting on Rail, Public Transportation, and TDM Needs

Virginia Department of Rail and Public Transportation Rail, Public Transportation, and TDM Needs Assessment
Cambridge Systematics, Inc. 2-1
2.0 The Demography and Economy of the Commonwealth of Virginia: Factors Impacting on Rail, Public Transportation, and TDM Needs
The future demographics and economy of Virginia will determine to a great degree the needs for public transportation and rail and TDM systems and services. The Virginia Transportation Research Council (VTRC) prepared an analysis of demographic and eco-nomic trends for VDOT in support of the overall VTrans2025 planning process. As an integral element of VTrans2025, this rail, public transportation, and TDM needs assessment and six-year plan and program summarizes and relies on the analysis in that report. Many of the tables and discussion of data in this section have been excerpted directly from this report. The intention here is to summarize and highlight the demo-graphic issues that are particularly important to assessing the overall rail, public transportation, and TDM needs in the Commonwealth.
Some of the most significant driving factors impacting the future needs for public trans-portation in Virginia include continued population and employment growth, rapid growth in “exurban” counties adjacent to existing urbanized areas, the persistence of or even an increase in the number of zero-car households, an aging population, and a likely increase in longer distance commutes.
2.1 Current Population and Employment and Projected Growth
Virginia’s population is expected to increase from 7.1 million in 2000 to between 8.5 and 9.3 million by 2025, or by approximately 20 to 30 percent. Much of this growth is expected to occur in the most urbanized areas of the State, in particular within the Northern Virginia area, the Richmond/Petersburg area, and the Hampton Roads region. Through 2010, three-quarters of the State’s population growth is expected to occur in four of Virginia’s 21 planning district commissions (PDCs), Northern Virginia, Fredericksburg, Richmond/Petersburg, and Hampton Roads. About half of the total projected population
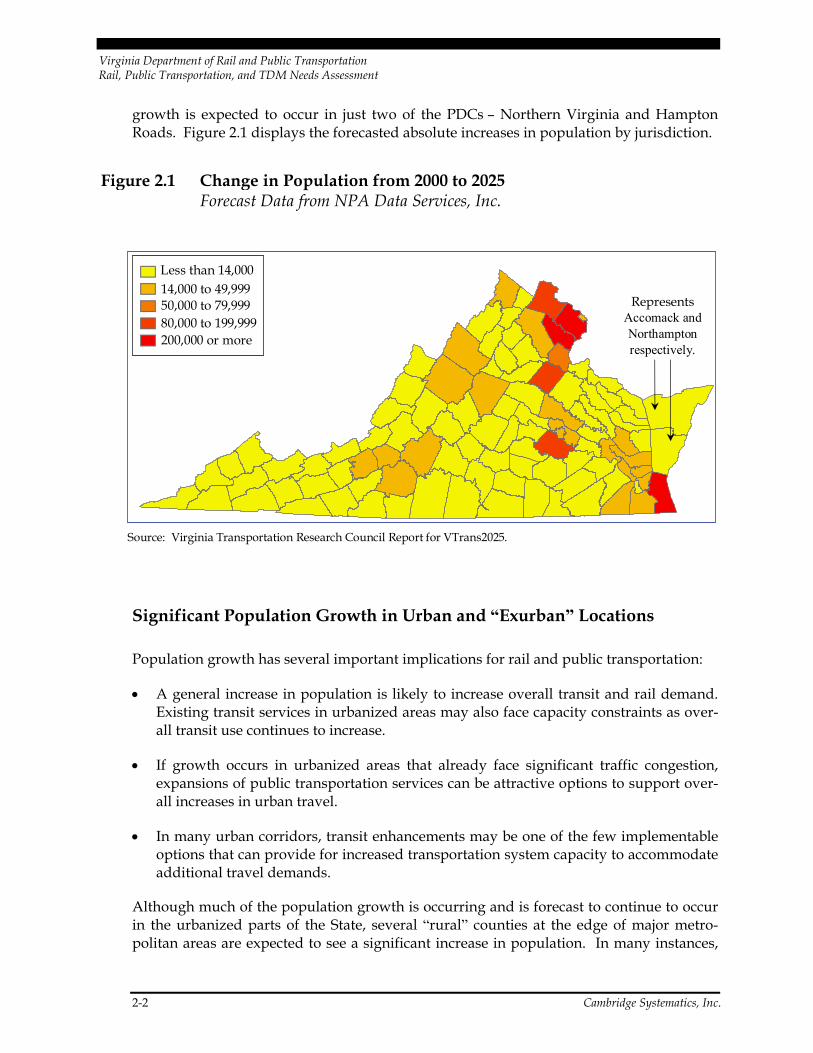
Virginia Department of Rail and Public Transportation Rail, Public Transportation, and TDM Needs Assessment
2-2 Cambridge Systematics, Inc.
growth is expected to occur in just two of the PDCs – Northern Virginia and Hampton Roads. Figure 2.1 displays the forecasted absolute increases in population by jurisdiction.
Figure 2.1 Change in Population from 2000 to 2025Forecast Data from NPA Data Services, Inc.
Source: Virginia Transportation Research Council Report for VTrans2025.
Less than 14,00014,000 to 49,99950,000 to 79,99980,000 to 199,999200,000 or more
Represents Accomack and Northamptonrespectively.
Significant Population Growth in Urban and “Exurban” Locations
Population growth has several important implications for rail and public transportation:
• A general increase in population is likely to increase overall transit and rail demand. Existing transit services in urbanized areas may also face capacity constraints as over-all transit use continues to increase.
• If growth occurs in urbanized areas that already face significant traffic congestion, expansions of public transportation services can be attractive options to support over-all increases in urban travel.
• In many urban corridors, transit enhancements may be one of the few implementable options that can provide for increased transportation system capacity to accommodate additional travel demands.
Although much of the population growth is occurring and is forecast to continue to occur in the urbanized parts of the State, several “rural” counties at the edge of major metro-politan areas are expected to see a significant increase in population. In many instances,
Virginia Department of Rail and Public Transportation Rail, Public Transportation, and TDM Needs Assessment
Cambridge Systematics, Inc. 2-3
these counties are likely to evolve into bedroom communities by 2025, with an ever-growing number of long-distance commuters. Many of these now “rural” counties are likely to face issues of local traffic congestion as well as increasing demand for transit to support long-distance commutes. In addition, the general need for transit to provide basic mobility for the residents of these areas is also likely to increase with overall population growth.
Job Growth and Longer Commutes Across Service Boundaries
Employment in the State is expected to increase from 4.4 million to 6.3 million between 2000 and 2025, or by more than 40 percent. As noted in the VTRC report, relatively lim-ited housing opportunities in some areas of high job growth may result in a much higher number of workers commuting between counties. The expectation is that the length of work trips is likely to increase as higher housing prices in the existing urbanized areas continue to push workers into longer distance travel. This change is likely to increase the demand and desire for longer distance and inter-jurisdictional transit services. As shown in Figure 2.2, more than half of the residents of many jurisdictions across the State are traveling to locations outside of their counties of residence for employment opportunities. In many cases, the boundaries of existing transit service areas make it difficult to meet the demand for these travel patterns.
2.2 Increasing Numbers of Zero-Car Households
As noted in the VTRC report, the number of households without an automobile totaled more than 200,000 in 2000. For some households, transit offers one of the only options available for the provision of basic mobility. This is a particularly critical issue in many rural parts of the State where transit service may not exist at all and where such house-holds have few options to access jobs, healthcare, and other basic necessities. It is impor-tant to note that the percentage or number of zero-car households is not necessarily lower in the urban jurisdictions that currently have high levels of transit service. As shown in Figure 2.3, zero-car households are just more than 10 percent of the total households in Arlington County and the City of Alexandria, more than 15 percent in the cities of Norfolk and Danville, and more than 20 percent in the cities of Richmond and Petersburg. Although the need for transit is often associated with urban locations, many households in rural parts of the State are faced with severely limited mobility because they do not have access to an automobile and transit service does not exist.
Even in many urban jurisdictions, limited transit service availability, including service hours that end early in the evening, make job access a challenge for many residents. Some communities with the most significant need in terms of providing basic mobility to their residents are also those with a limited tax base and an inability to provide basic mobility for those without access to an automobile.
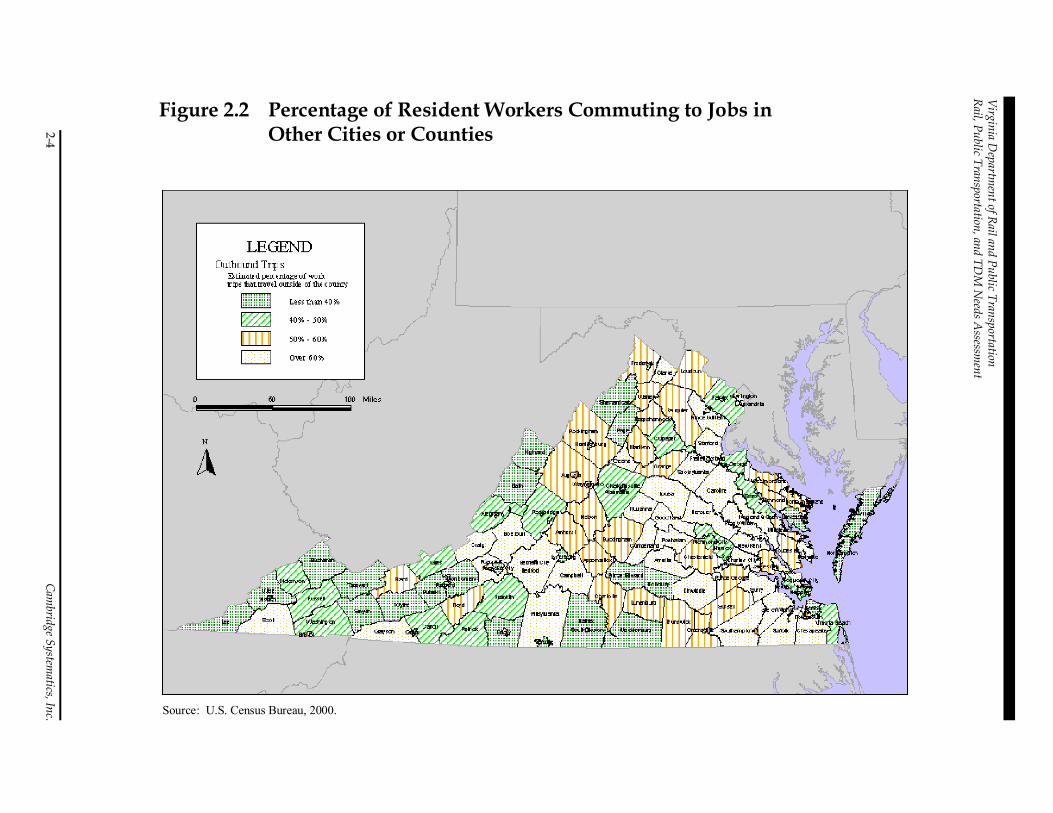
Virginia D
epartment of Rail and Public Transportation
Rail, Public Transportation, and TDM
Needs A
ssessment
2-4 Cam
bridge Systematics, Inc.
Figure 2.2 Percentage of Resident Workers Commuting to Jobs in Other Cities or Counties
Source: U.S. Census Bureau, 2000.
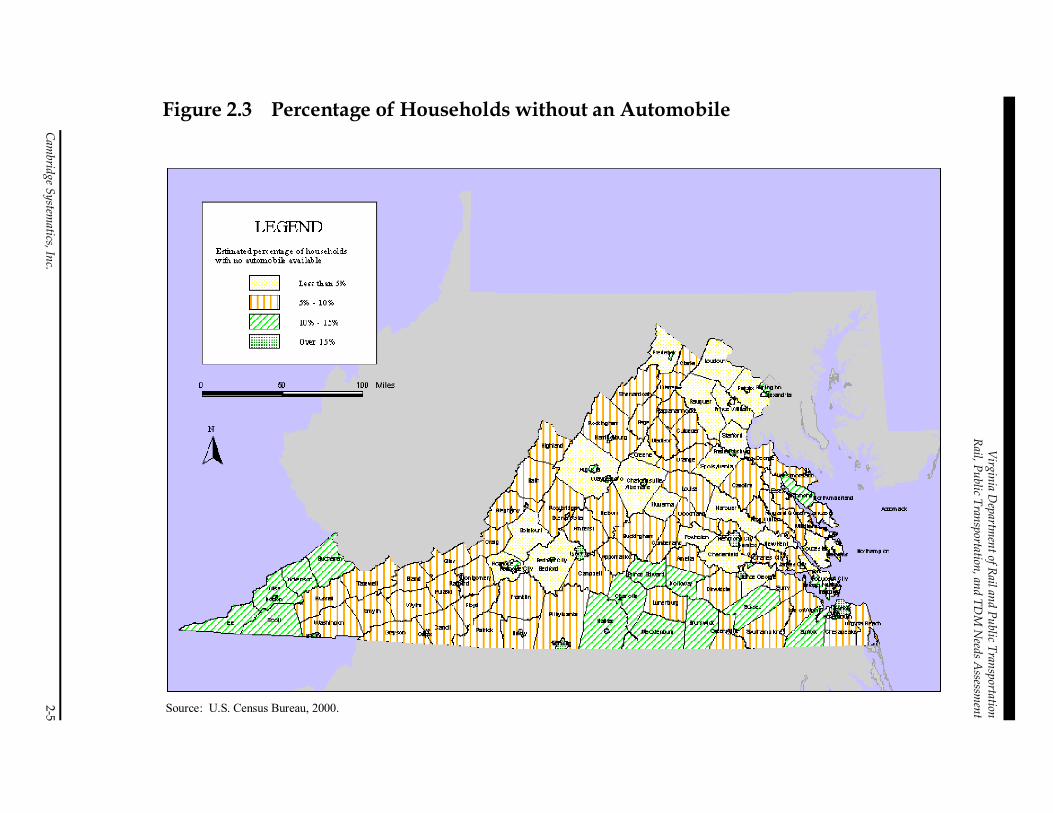
Virginia D
epartment of Rail and Public Transportation
Rail, Public Transportation, and TDM
Needs A
ssessment
Cambridge System
atics, Inc. 2-5
Figure 2.3 Percentage of Households without an Automobile
Source: U.S. Census Bureau, 2000.
Virginia Department of Rail and Public Transportation Rail, Public Transportation, and TDM Needs Assessment
2-6 Cambridge Systematics, Inc.
2.3 Aging of the Population
The aging population is an issue facing transit and transportation agencies across the country. For a number of reasons, many elderly residents facing decreasing mobility must rely on transit services with increasing frequency. Elderly residents or persons with a dis-ability are often unable to operate automobiles safely. Many of the counties in Virginia with the fastest growing elderly populations are in rural locations where transit service is difficult to provide, in some cases may not exist at all, or often has only limited service hours. With the share of elderly residents projected to increase dramatically over the next 25 years, the need for transit services to meet the basic mobility needs of the elderly will become an even more critical issue for the entire State.
The number of persons aged 65 and older is expected to increase from approximately 800,000 in 2000 to more than 1.5 million in 2025. The proportion of elderly residents will vary significantly across the State with some planning districts projected to have the num-ber of elderly residents as high as one in four of their total populations. Overall, the share of residents aged 65 and older is expected to increase from 11.7 percent in 2000 to 17.9 percent in 2025, as shown in Table 2.1. The need for transit services to meet the basic mobility needs of the elderly population will become an even more critical issue.
Table 2.1 Proportion of the Population Aged 65 Years and Older as Projected by the U.S. Census and VTRC
Age Group 2000 2010 2025
Proportion of population between ages 65 and 74 6.2% 6.8% 10.3%
Proportion of population between ages 75 and 84 4.2 4.0 5.6
Proportion of population age 85 or older 1.3 1.6 2.0
Total 11.7% 12.4% 17.9%
Source: Virginia Transportation Research Council Report for VTrans2025.
2.4 Summary and Implications
The Commonwealth of Virginia is facing many challenges in the provision of transporta-tion services. The need for rail, public transportation, and TDM will continue to grow as the State faces the combined effects of an increasing population, longer commutes, an increase in the elderly population, and a large number of zero-car households. The chal-lenges will vary across the State from serving a role for basic mobility to providing
Virginia Department of Rail and Public Transportation Rail, Public Transportation, and TDM Needs Assessment
Cambridge Systematics, Inc. 2-7
congestion relief in growing urban corridors. Some of the more significant implications for expected changes in the State include:
• Statewide population increases projected at 20 to 30 percent and employment growth projected at 40 percent will substantially increase the demand for the provision of more transit service even if transit’s market share of total travel demand remains the same.
• Many residents will need to travel to jurisdictions other than those in which they reside to obtain employment opportunities – increasing the demand for transit ser-vices that cross the existing service area boundaries.
• The demand and need for improved transit services will continue to increase with the urbanization of suburban locations in the Northern Virginia, Hampton Roads, and Richmond/Petersburg metropolitan areas – exacerbated by exurban population growth that will mean increased demand for long-distance transit service.
• Transit is failing to serve a dependent population in many rural jurisdictions – high proportions of households without an automobile are found in locations where transit service does not currently exist.
• Demand and need for transit service – especially demand-responsive service – will continue to increase as the State’s elderly population continues to grow.

3.0 Inventory and Service Assessment of the Current Virginia Rail and Public Transportation System

Virginia Department of Rail and Public Transportation Rail, Public Transportation, and TDM Needs Assessment
Cambridge Systematics, Inc. 3-1
3.0 Inventory and Service Assessment of the Current Virginia Rail and Public Transportation System
The rail and public transportation system in the Commonwealth of Virginia includes local and regional transit, commuter rail, freight rail and intermodal freight, intercity bus and rail, and TDM, and serves as part of the overall statewide, multimodal transportation system. Other modes, such as ports, highways, airports, bicycle and pedestrian facilities, and pipelines all have effects on rail and public transportation.
This section summarizes an inventory and service assessment that has been conducted of the current rail and public transportation systems, services, facilities, assets, financial resources, and plans throughout the Commonwealth of Virginia. For the purposes of this discussion, the Commonwealth’s public transportation providers are divided into three major categories based on service area and population characteristics: major urban, small urban, and rural. The modes covered in addition to these are intercity rail and bus, and freight rail. The freight rail portion of this inventory and assessment is discussed in more detail in the companion Virginia State Rail Plan document.
The information summarized in the inventory and service assessment includes:
• Public Transportation Operators Inventory; • Service and Usage Inventory; • Vehicle Asset and ITS Inventory; • Maintenance and Other Facilities Inventory; • Service and Capital Plans Inventory; • Financial Resources Inventory; • Intercity Bus Services; • Private Commuter Bus Services; • Commuter Rail – VRE; • Amtrak Intercity Rail System; • TDM; • Availability or Coverage of Rail and Public Transportation Service; • Assets and Conditions Assessment; and • Performance Measures Assessment.
Virginia Department of Rail and Public Transportation Rail, Public Transportation, and TDM Needs Assessment
3-2 Cambridge Systematics, Inc.
3.1 Inventory
In the Commonwealth of Virginia, bus services are the predominant public transportation mode, with fixed-route bus services operating on regular routes along major highways and streets, and with demand-responsive public transportation services providing more flexible transportation services on request. At present, two fixed-guideway regional rail systems operate in Virginia, both in the Northern Virginia region: the northern Virginia portions of the Washington Metropolitan Area Transit Authority’s (WMATA) Metrorail system, and the two commuter rail lines of the VRE. Intercity bus services are provided by Greyhound and Carolina Trailways (a wholly owned subsidiary of Greyhound), and intercity rail passenger services are provided by Amtrak. Figure 3.1 provides a picture of where urban public transportation is presently available in Virginia. In some instances, counties are shown in Figure 3.1 as having “No Transit Service,” but small cities within these counties are shown to have service. This is reflective of the fact that while some small cities and towns support public transit services, the routes do not go beyond the boundaries of these jurisdictions into the surrounding counties.
Information has been compiled from a variety of sources, such as the Federal Transit Administration’s (FTA’s) National Transit Database (NTD), the Virginia DRPT’s data files, the NVTC compilations, and information from the individual transit providers. In cases where side-by-side comparisons among systems are not appropriate or useful, the systems are grouped into broader categories.
Public Transportation Operators Inventory
As reported in the FTA’s NTD, there were a total of 36 public transportation providers in the Commonwealth of Virginia as of the end of Federal Fiscal Year (FY) 2001 (September 30, 2001). Three new services have been added since FY 2001: the City of Falls Church, the Town of Kenbridge, and the Community Association for Rural Transportation.
Tables 3.1 and 3.2 provide a summary inventory of the existing public transportation sys-tems and their areas of coverage. Tables 3.1 and 3.2 list the 39 public transportation pro-viders, one intercity rail, and one intercity bus provider in the Commonwealth and the type of service provided by each. In summary, there are 14 providers in major urban areas, nine in small urban areas, 16 in rural areas, one intercity bus provider, and one intercity rail service provider. There are several private subscription commuter bus ser-vices in the Northern Virginia region that operate beyond the service areas of the public systems. All of the urban and small urban providers, except PRTC and Fredericksburg Regional Transit (FRED), offer fixed-route bus/deviated services and supplementary paratransit services.
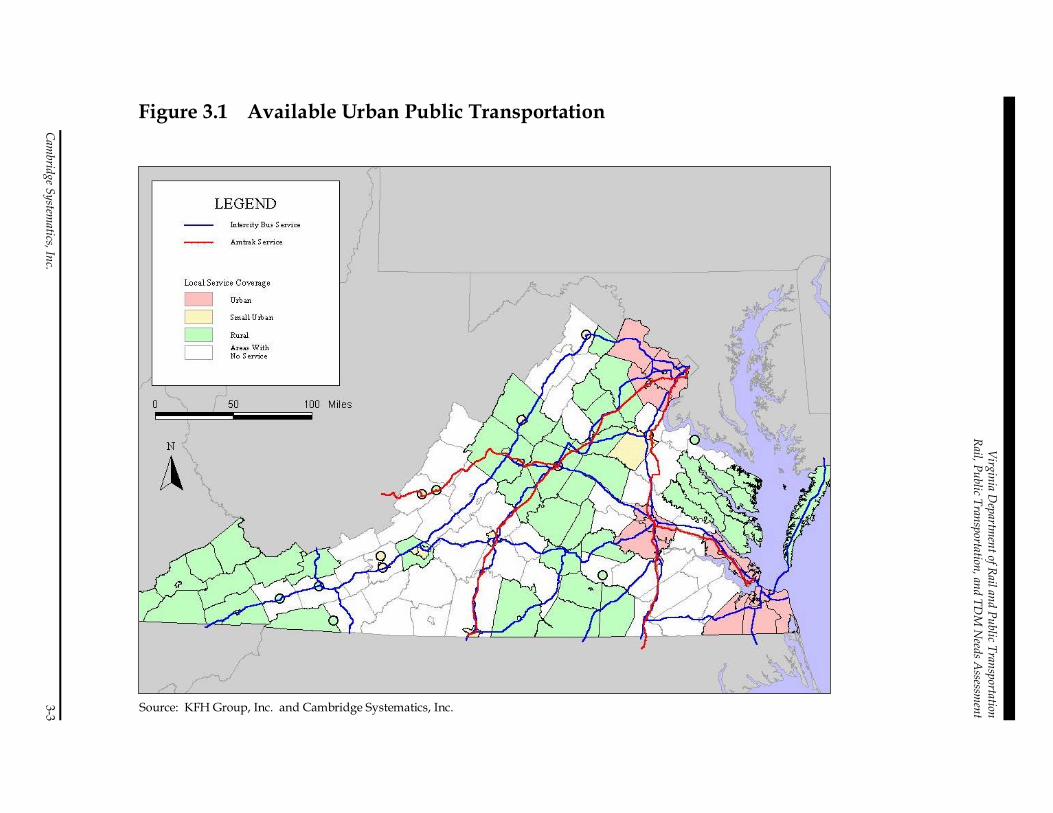
Virginia D
epartment of Rail and Public Transportation
Rail, Public Transportation, and TDM
Needs A
ssessment
Cambridge System
atics, Inc. 3-3
Figure 3.1 Available Urban Public Transportation
Source: KFH Group, Inc. and Cambridge Systematics, Inc.
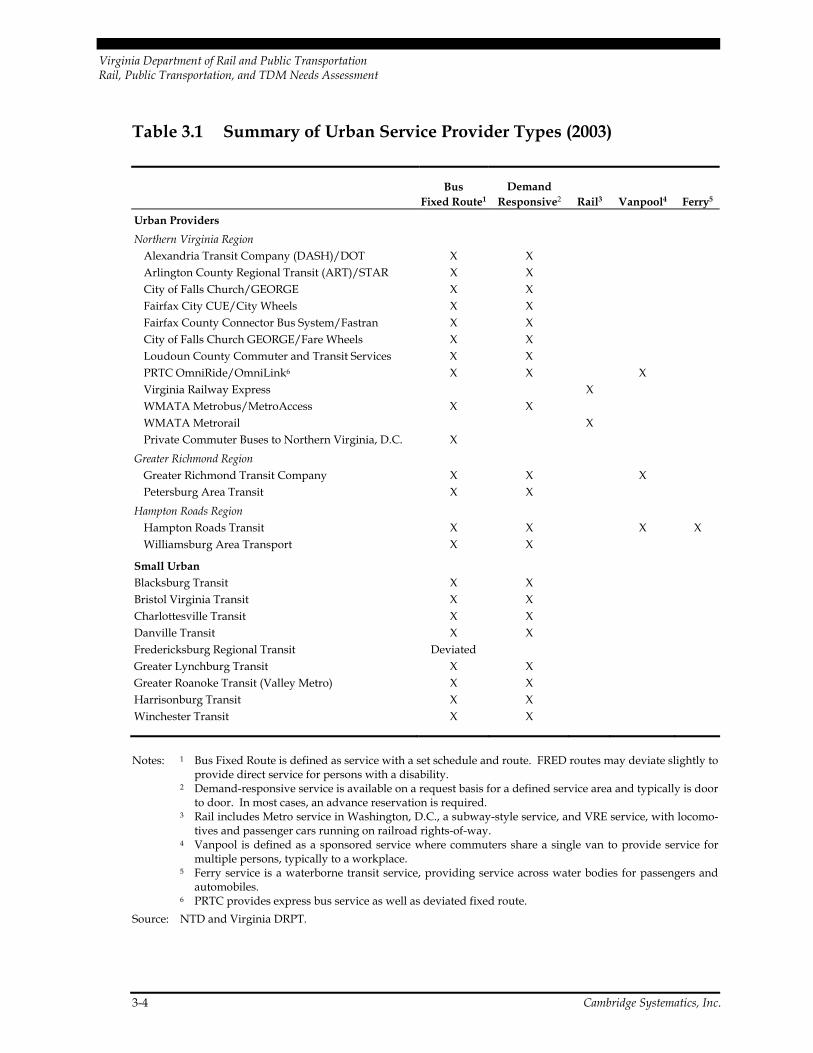
Virginia Department of Rail and Public Transportation Rail, Public Transportation, and TDM Needs Assessment
3-4 Cambridge Systematics, Inc.
Table 3.1 Summary of Urban Service Provider Types (2003)
Bus
Fixed Route1 Demand
Responsive2 Rail3 Vanpool4 Ferry5 Urban Providers Northern Virginia Region
Alexandria Transit Company (DASH)/DOT X X Arlington County Regional Transit (ART)/STAR X X City of Falls Church/GEORGE X X Fairfax City CUE/City Wheels X X Fairfax County Connector Bus System/Fastran X X City of Falls Church GEORGE/Fare Wheels X X Loudoun County Commuter and Transit Services X X PRTC OmniRide/OmniLink6 X X X Virginia Railway Express X WMATA Metrobus/MetroAccess X X WMATA Metrorail X Private Commuter Buses to Northern Virginia, D.C. X
Greater Richmond Region Greater Richmond Transit Company X X X Petersburg Area Transit X X
Hampton Roads Region Hampton Roads Transit X X X X Williamsburg Area Transport X X
Small Urban Blacksburg Transit X X Bristol Virginia Transit X X Charlottesville Transit X X Danville Transit X X Fredericksburg Regional Transit Deviated Greater Lynchburg Transit X X Greater Roanoke Transit (Valley Metro) X X Harrisonburg Transit X X Winchester Transit X X
Notes: 1 Bus Fixed Route is defined as service with a set schedule and route. FRED routes may deviate slightly to provide direct service for persons with a disability.
2 Demand-responsive service is available on a request basis for a defined service area and typically is door to door. In most cases, an advance reservation is required.
3 Rail includes Metro service in Washington, D.C., a subway-style service, and VRE service, with locomo-tives and passenger cars running on railroad rights-of-way.
4 Vanpool is defined as a sponsored service where commuters share a single van to provide service for multiple persons, typically to a workplace.
5 Ferry service is a waterborne transit service, providing service across water bodies for passengers and automobiles.
6 PRTC provides express bus service as well as deviated fixed route. Source: NTD and Virginia DRPT.
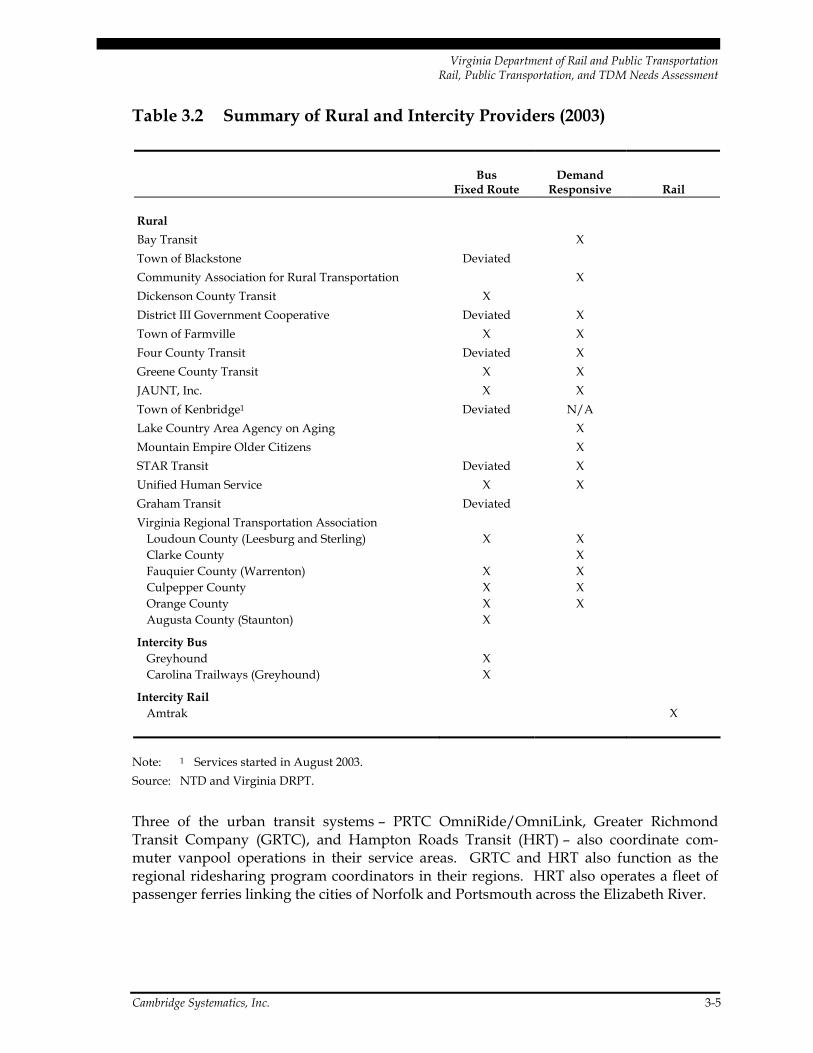
Virginia Department of Rail and Public Transportation Rail, Public Transportation, and TDM Needs Assessment
Cambridge Systematics, Inc. 3-5
Table 3.2 Summary of Rural and Intercity Providers (2003)
Bus
Fixed Route Demand
Responsive Rail
Rural Bay Transit X Town of Blackstone Deviated Community Association for Rural Transportation X Dickenson County Transit X District III Government Cooperative Deviated X Town of Farmville X X Four County Transit Deviated X Greene County Transit X X JAUNT, Inc. X X Town of Kenbridge1 Deviated N/A Lake Country Area Agency on Aging X Mountain Empire Older Citizens X STAR Transit Deviated X Unified Human Service X X Graham Transit Deviated Virginia Regional Transportation Association
Loudoun County (Leesburg and Sterling) X X Clarke County X Fauquier County (Warrenton) X X Culpepper County X X Orange County X X Augusta County (Staunton) X
Intercity Bus Greyhound X Carolina Trailways (Greyhound) X
Intercity Rail Amtrak X
Note: 1 Services started in August 2003. Source: NTD and Virginia DRPT.
Three of the urban transit systems – PRTC OmniRide/OmniLink, Greater Richmond Transit Company (GRTC), and Hampton Roads Transit (HRT) – also coordinate com-muter vanpool operations in their service areas. GRTC and HRT also function as the regional ridesharing program coordinators in their regions. HRT also operates a fleet of passenger ferries linking the cities of Norfolk and Portsmouth across the Elizabeth River.
Virginia Department of Rail and Public Transportation Rail, Public Transportation, and TDM Needs Assessment
3-6 Cambridge Systematics, Inc.
Currently, 13 of the 14 urban systems provide Saturday service, and 11 provide service on Sundays. Of the nine small urban systems, all but one provide service on Saturdays. Only three (Blacksburg Transit, Greater Lynchburg Transit, and Harrisonburg Transit) operate service on Sundays. Approximately half of the rural transit operations provide service on Saturdays, with only two of these systems (Community Association for Rural Transportation and JAUNT, Inc.) operating on Sundays.
Service and Usage Inventory
Tables 3.3 and 3.4, respectively, summarize the 2001 levels of transit service across the State as reported in the FTA’s NTD data and supplementary materials compiled by Virginia DRPT. The large urban systems account for about 66 million annual vehicle revenue miles, or almost 86 percent of the total of approximately 76 million annual vehicle revenue miles operated in Virginia.
Annual vehicle revenue hours operated across all of the systems during FY 2001 totaled approximately 4.7 million, with the major urban systems accounting for 3.9 million vehicle revenue hours, or approximately 83 percent of all hours in the State.
An important factor that must be acknowledged when conducting a public transportation service and usage inventory is that the amount of service provided is not uniformly dis-tributed across all jurisdictions that are identified as receiving service. Thus, while Figure 3.1 identifies those jurisdictions within the Commonwealth where some type of public transportation service is currently being provided, this is very much of a “YES/NO” type of inventory description. The next level of service and usage inventory is to examine the relative amount of service provided within each jurisdiction.
There are a number of quality of service factors that can be applied to the operation of public transportation systems. These include service coverage (availability, frequency, span of operation, and directness), patron convenience (speed, vehicle loading, bus stop spacing, and dependability), and passenger comfort (presence of waiting shelters, vehicle age, and availability of public information). The majority of these factors are best suited to the examination of individual transit routes or specific transit systems as opposed to a statewide assessment of adequacy. At a geographic level of analysis of the scale of the Commonwealth of Virginia, somewhat more general comparative factors are most useful.
For the purposes of the statewide transit needs assessment, the factor of “average revenue miles of service per capita” was employed. This factor takes into account both the amount of public transit service being provided and the degree to which this service is uniformly distributed across a particular jurisdiction, or across multiple jurisdictions in the case of larger transit systems. In the case of the rural and small urban transit systems where only a single transit system is in operation, this factor was calculated on the basis of the total system annual revenue miles and the total population of the particular jurisdictions receiving service.
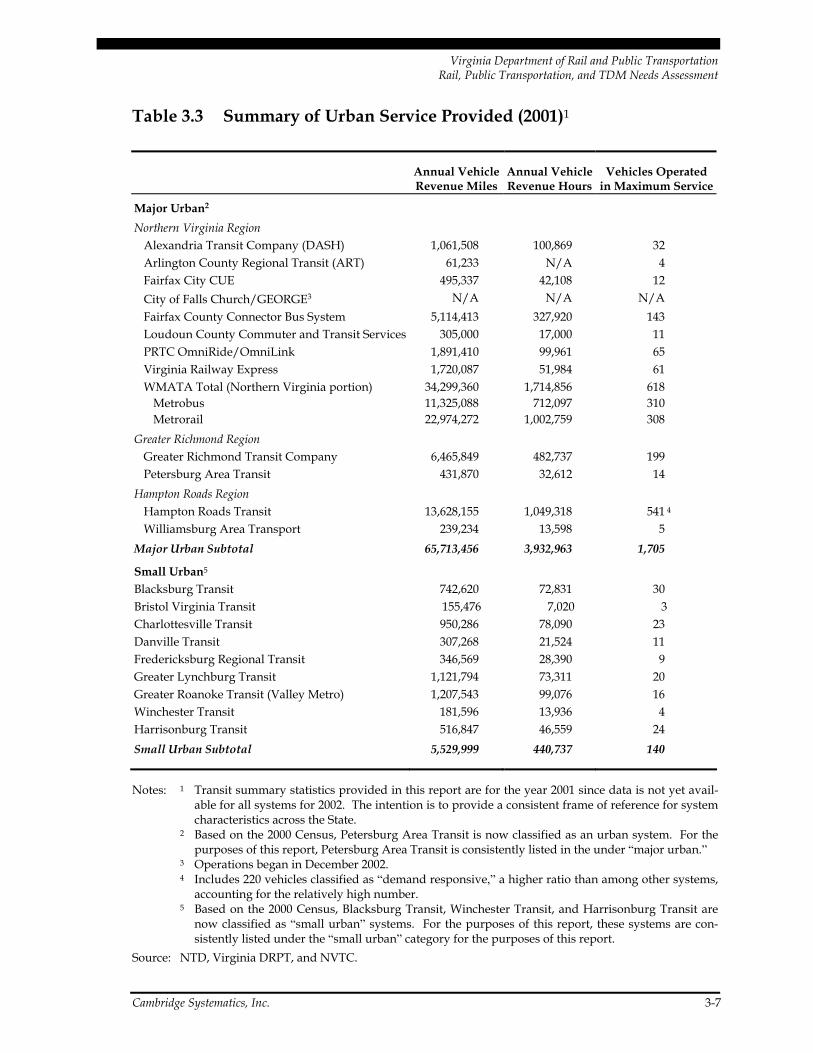
Virginia Department of Rail and Public Transportation Rail, Public Transportation, and TDM Needs Assessment
Cambridge Systematics, Inc. 3-7
Table 3.3 Summary of Urban Service Provided (2001)1
Annual Vehicle Revenue Miles
Annual Vehicle Revenue Hours
Vehicles Operated in Maximum Service
Major Urban2
Northern Virginia Region Alexandria Transit Company (DASH) 1,061,508 100,869 32 Arlington County Regional Transit (ART) 61,233 N/A 4 Fairfax City CUE 495,337 42,108 12 City of Falls Church/GEORGE3 N/A N/A N/A Fairfax County Connector Bus System 5,114,413 327,920 143 Loudoun County Commuter and Transit Services 305,000 17,000 11 PRTC OmniRide/OmniLink 1,891,410 99,961 65 Virginia Railway Express 1,720,087 51,984 61 WMATA Total (Northern Virginia portion) 34,299,360 1,714,856 618
Metrobus 11,325,088 712,097 310 Metrorail 22,974,272 1,002,759 308
Greater Richmond Region Greater Richmond Transit Company 6,465,849 482,737 199 Petersburg Area Transit 431,870 32,612 14
Hampton Roads Region Hampton Roads Transit 13,628,155 1,049,318 541 4 Williamsburg Area Transport 239,234 13,598 5
Major Urban Subtotal 65,713,456 3,932,963 1,705
Small Urban5 Blacksburg Transit 742,620 72,831 30 Bristol Virginia Transit 155,476 7,020 3 Charlottesville Transit 950,286 78,090 23 Danville Transit 307,268 21,524 11 Fredericksburg Regional Transit 346,569 28,390 9 Greater Lynchburg Transit 1,121,794 73,311 20 Greater Roanoke Transit (Valley Metro) 1,207,543 99,076 16 Winchester Transit 181,596 13,936 4 Harrisonburg Transit 516,847 46,559 24 Small Urban Subtotal 5,529,999 440,737 140
Notes: 1 Transit summary statistics provided in this report are for the year 2001 since data is not yet avail-able for all systems for 2002. The intention is to provide a consistent frame of reference for system characteristics across the State.
2 Based on the 2000 Census, Petersburg Area Transit is now classified as an urban system. For the purposes of this report, Petersburg Area Transit is consistently listed in the under “major urban.”
3 Operations began in December 2002. 4 Includes 220 vehicles classified as “demand responsive,” a higher ratio than among other systems,
accounting for the relatively high number. 5 Based on the 2000 Census, Blacksburg Transit, Winchester Transit, and Harrisonburg Transit are
now classified as “small urban” systems. For the purposes of this report, these systems are con-sistently listed under the “small urban” category for the purposes of this report.
Source: NTD, Virginia DRPT, and NVTC.
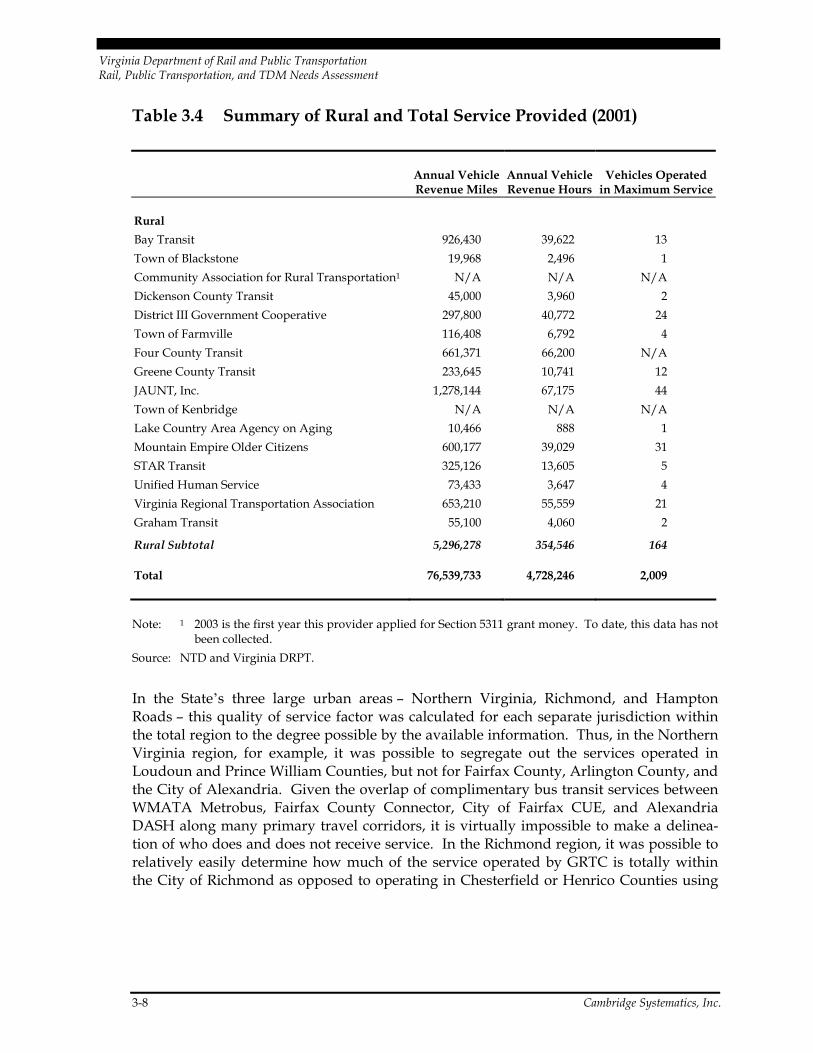
Virginia Department of Rail and Public Transportation Rail, Public Transportation, and TDM Needs Assessment
3-8 Cambridge Systematics, Inc.
Table 3.4 Summary of Rural and Total Service Provided (2001)
Annual Vehicle Revenue Miles
Annual Vehicle Revenue Hours
Vehicles Operated in Maximum Service
Rural Bay Transit 926,430 39,622 13 Town of Blackstone 19,968 2,496 1 Community Association for Rural Transportation1 N/A N/A N/A Dickenson County Transit 45,000 3,960 2 District III Government Cooperative 297,800 40,772 24 Town of Farmville 116,408 6,792 4 Four County Transit 661,371 66,200 N/A Greene County Transit 233,645 10,741 12 JAUNT, Inc. 1,278,144 67,175 44 Town of Kenbridge N/A N/A N/A Lake Country Area Agency on Aging 10,466 888 1 Mountain Empire Older Citizens 600,177 39,029 31 STAR Transit 325,126 13,605 5 Unified Human Service 73,433 3,647 4 Virginia Regional Transportation Association 653,210 55,559 21 Graham Transit 55,100 4,060 2
Rural Subtotal 5,296,278 354,546 164
Total 76,539,733 4,728,246 2,009
Note: 1 2003 is the first year this provider applied for Section 5311 grant money. To date, this data has not been collected.
Source: NTD and Virginia DRPT.
In the State’s three large urban areas – Northern Virginia, Richmond, and Hampton Roads – this quality of service factor was calculated for each separate jurisdiction within the total region to the degree possible by the available information. Thus, in the Northern Virginia region, for example, it was possible to segregate out the services operated in Loudoun and Prince William Counties, but not for Fairfax County, Arlington County, and the City of Alexandria. Given the overlap of complimentary bus transit services between WMATA Metrobus, Fairfax County Connector, City of Fairfax CUE, and Alexandria DASH along many primary travel corridors, it is virtually impossible to make a delinea-tion of who does and does not receive service. In the Richmond region, it was possible to relatively easily determine how much of the service operated by GRTC is totally within the City of Richmond as opposed to operating in Chesterfield or Henrico Counties using
Virginia Department of Rail and Public Transportation Rail, Public Transportation, and TDM Needs Assessment
Cambridge Systematics, Inc. 3-9
information contained in the recent GRTC Comprehensive Operational Analysis (COA).1 Similarly, the most recent COA for HRT2 provided a description of the amount of HRT service operated in each of the agency’s member jurisdictions. Figure 3.2 presents the results of this service level assessment using the factor “annual revenue miles per capita” for all of the public transit systems in the Commonwealth. It should be noted that this information takes into account only fixed-route bus and demand-responsive services. The Metrorail and VRE fixed-guideway rail transit operations in Northern Virginia were not included in this analysis in order not to unnecessarily skew the results. Figures 3.3 through 3.5 present a more detailed illustration of the results of the analysis for the Northern Virginia, Richmond, and Hampton Roads regions, respectively.
As would be expected, there is a considerable variation in the amount of transit service being offered across the Commonwealth, ranging from high-density services in the State’s larger, more heavily developed urban areas to more moderate levels of service in growing exurban counties. What is most striking however, are the significant differences in the relative amount of service provided within the Richmond and Hampton Roads regions between immediately adjacent jurisdictions. In the Richmond region, for example, the average revenue miles per capita factor for the City of Richmond is 29.78, while the same factor for Henrico County is only 1.90, and for Chesterfield County is only 0.30. Stated another way, approximately 91 percent of the total GRTC service operates strictly within the City of Richmond, about eight percent operates in Henrico County, and only about one percent operates in Chesterfield County. Comparing these three jurisdictions on a population basis, Richmond is about 27.5 percent, Henrico County is about 36.4 percent, and Chesterfield County is about 36.1 percent. Clearly, there appears to be a significant imbalance between the relative potential need for public transportation among these three jurisdictions (as measured on the basis of total population) and the amount of service that each is currently receiving.
A similar significant disparity was identified in the Hampton Roads region jurisdictions served by HRT. Based on information contained in the last HRT COA, the percentage of HRT service in each of its member jurisdictions compared to population of those jurisdic-tions is presented in Table 3.5.
There is a wide disparity between the relative amount of transit service provided in even immediately adjacent jurisdictions, such as the City of Norfolk (38.2 percent of HRT ser-vice and 17.4 percent of regional population), the City of Virginia Beach (13.1 percent of HRT service and 31.5 percent of regional population), and the City of Portsmouth (7.5 percent of HRT service and 7.5 percent of regional population).
1 Urbitran Associates, GRTC Comprehensive Operational Analysis, prepared for the Greater
Richmond Transit Company, Richmond, Virginia, April 2001. 2 Abrams-Cherwony & Associates, Comprehensive Operations Analysis for Hampton Roads
Transit, prepared for the Transportation District Commission of Hampton Roads, Norfolk, Virginia, January 2002.
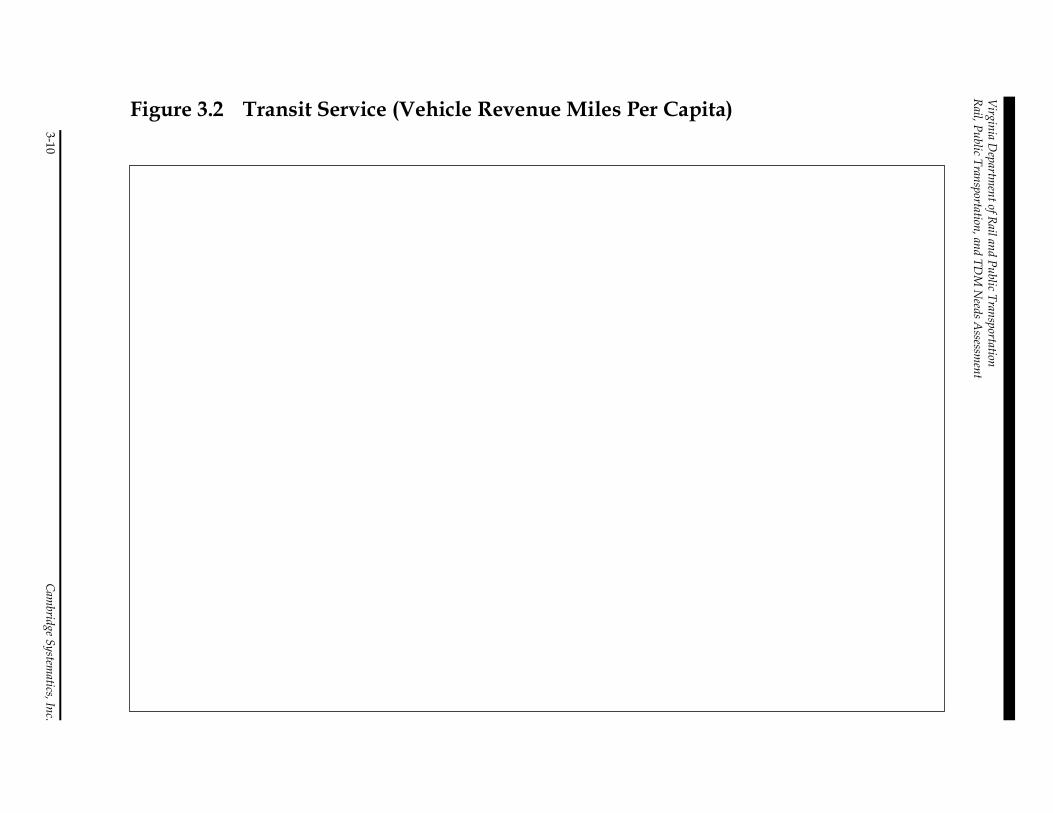
Virginia D
epartment of Rail and Public Transportation
Rail, Public Transportation, and TDM
Needs A
ssessment
3-10 Cam
bridge Systematics, Inc.
Figure 3.2 Transit Service (Vehicle Revenue Miles Per Capita)
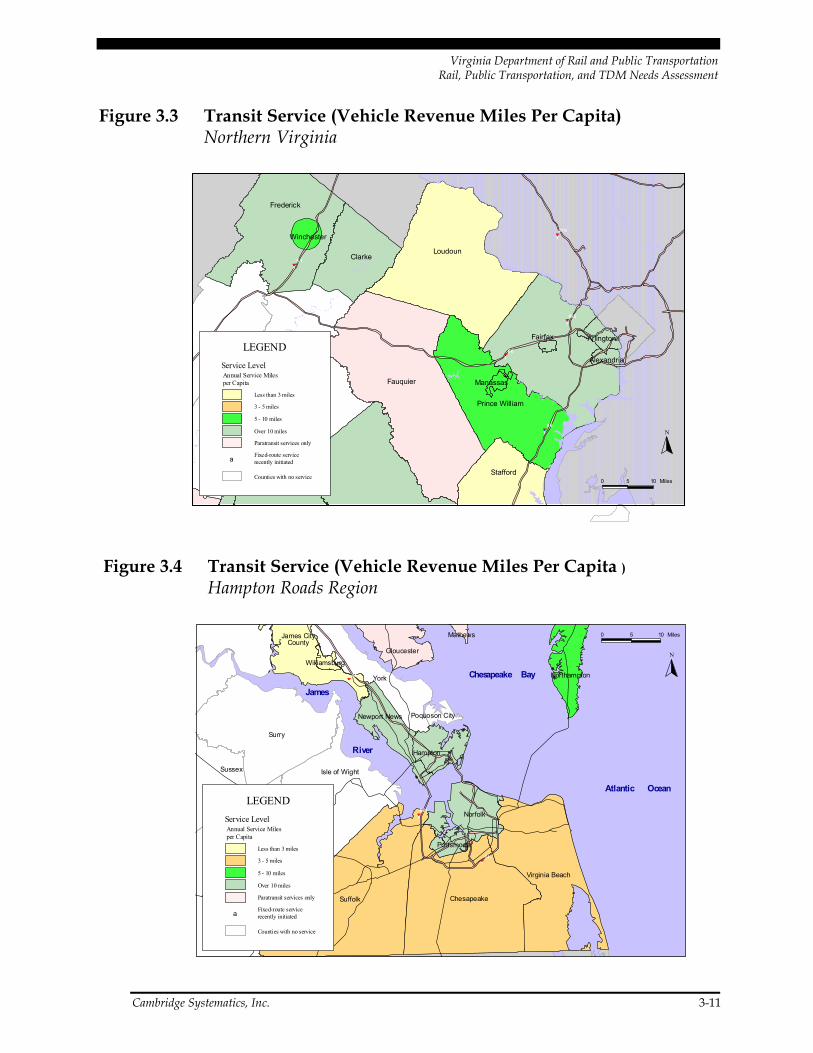
Virginia Department of Rail and Public Transportation Rail, Public Transportation, and TDM Needs Assessment
Cambridge Systematics, Inc. 3-11
Figure 3.3 Transit Service (Vehicle Revenue Miles Per Capita)Northern Virginia
Fauquier
Loudoun
Fairfax
Frederick
Warren
Clarke
Prince William
Stafford
Arlington
Alexandria
Winchester
Manassas
.-,8 1
.-,66
.-,95
.-,495
.-,270
N
0 5 10 Miles
Annual Service Milesper Capita
Less than 3 miles
3 - 5 miles
5 - 10 miles
Over 10 miles
Paratransit services only
Counties with no service
LEGENDService Level
aFixed-route service recently initiated
Suffolk
Surry
Chesapeake
Isle of Wight
York
Southampton Virginia Beach
Norfolk
James CityCounty
Sussex
Hampton
Gloucester
Newport News
Northampton
Portsmouth
Poquoson City
Williamsburg
Franklin City
Mathews
.-, 64
.-, 64
.-,664
0 5 10 Miles
N
Annual Service Milesper Capita
Less than 3 miles
3 - 5 miles
5 - 10 miles
Over 10 miles
Paratransit services only
Counties with no service
LEGENDService Level
aFixed-route service recently initiated
Atlantic Ocean
Chesapeake Bay
James
River
Figure 3.4 Transit Service (Vehicle Revenue Miles Per Capita )Hampton Roads Region
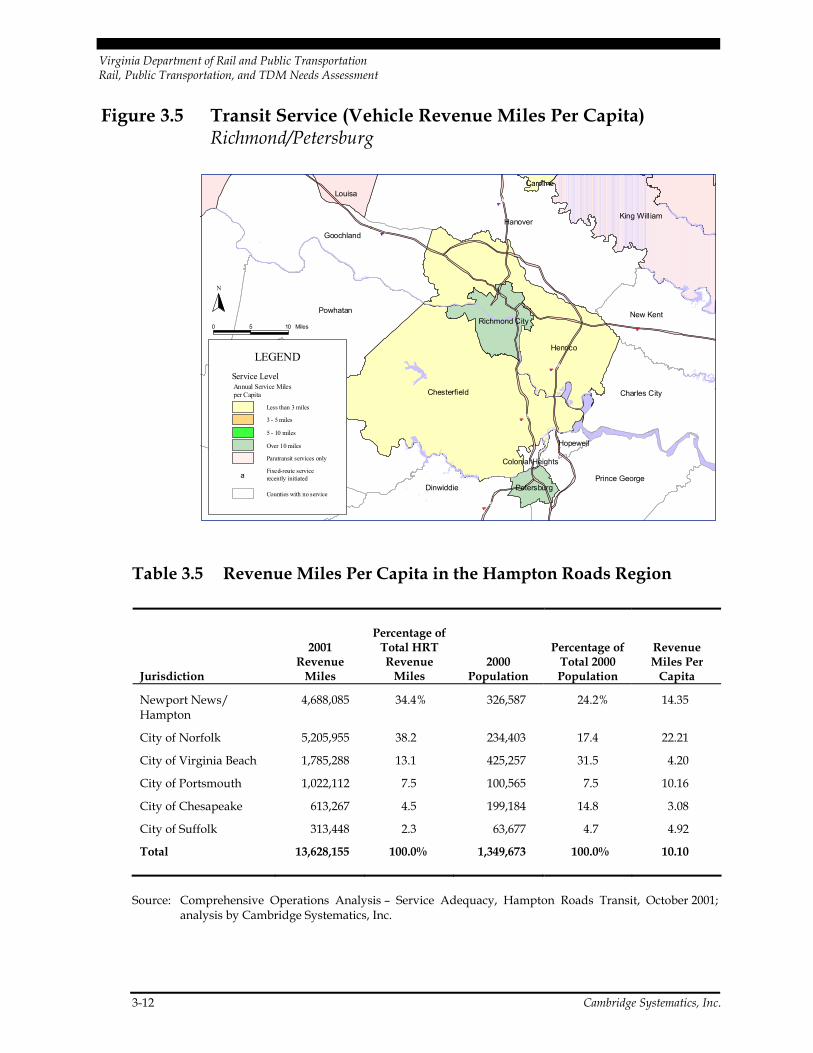
Virginia Department of Rail and Public Transportation Rail, Public Transportation, and TDM Needs Assessment
3-12 Cambridge Systematics, Inc.
Figure 3.5 Transit Service (Vehicle Revenue Miles Per Capita)Richmond/Petersburg
Hanover
Amelia
Chesterfield
Henrico
Powhatan
Goochland
DinwiddiePrince George
King William
New Kent
Charles City
Nottoway
Louisa
Richmond City
Petersburg
Hopewell
Caroline
Colonial Heights
.-,64
.-,64
.-, 95
.-,95
.-,295
.-,85
N
0 5 10 Miles
Annual Service Milesper Capita
Less than 3 miles
3 - 5 miles
5 - 10 miles
Over 10 miles
Paratransit services only
Counties with no service
LEGENDService Level
aFixed-route service recently initiated
Table 3.5 Revenue Miles Per Capita in the Hampton Roads Region
Jurisdiction
2001 Revenue
Miles
Percentage of Total HRT Revenue
Miles 2000
Population
Percentage of Total 2000 Population
Revenue Miles Per
Capita
Newport News/ Hampton
4,688,085 34.4% 326,587 24.2% 14.35
City of Norfolk 5,205,955 38.2 234,403 17.4 22.21
City of Virginia Beach 1,785,288 13.1 425,257 31.5 4.20
City of Portsmouth 1,022,112 7.5 100,565 7.5 10.16
City of Chesapeake 613,267 4.5 199,184 14.8 3.08
City of Suffolk 313,448 2.3 63,677 4.7 4.92
Total 13,628,155 100.0% 1,349,673 100.0% 10.10
Source: Comprehensive Operations Analysis – Service Adequacy, Hampton Roads Transit, October 2001; analysis by Cambridge Systematics, Inc.
Virginia Department of Rail and Public Transportation Rail, Public Transportation, and TDM Needs Assessment
Cambridge Systematics, Inc. 3-13
Thus, in determining the provision of public transportation service within a particular jurisdiction, consideration needs to be given to both the basic existence of such service and the relative amount of service offered within the jurisdiction.
The entire statewide public transportation system operated more than 2,000 bus and rail revenue vehicles in peak-period service in 2001. The large urban, small urban, and rural systems accounted for 85 percent, seven percent, and eight percent, respectively, of the total vehicles operated. Other than 61 commuter rail coaches operated by VRE and 308 Metrorail rapid transit cars operated by WMATA, all of these vehicles were buses or vans of various sizes and seating capacities. To calculate these numbers, a fraction of WMATA vehicles was “allocated” to Northern Virginia (23 percent of the total).
As illustrated in Tables 3.6 and 3.7, the 36 public transportation providers in 2001 trans-ported a total of approximately 160 million unlinked passenger trips during FY 2001.3 Urban systems carried about 151.5 million trips (94.6 percent), the small urban systems carried about 7.9 million trips (4.9 percent), and the rural systems carried about 0.8 million trips (0.5 percent). Urban systems provided 952 million total passenger miles (96.2 percent), small urban systems provided 26 million annual passenger miles (2.6 percent), and the rural systems accounted for 10.5 million annual passenger miles (1.1 percent).
Transit service and use have continued to grow in the Commonwealth over the period 1996 to 2001 in terms of both annual vehicle revenue miles and annual unlinked trips. In terms of transit use, annual unlinked trips for all of the providers across the Commonwealth showed almost a 21 percent increase over the period 1998 through 2001. The total ridership growth for the major urban systems was approximately 21.7 percent. Overall ridership growth on the small urban systems was almost 11 percent over the 1998 to 2001 time period. Within this overall trend, ridership changes at the individual system level over this period were mixed, and ranged from a 103 percent increase for FRED to a decline of -32 percent for Winchester Transit. Based on somewhat incomplete data, the trend in annual unlinked trips on the rural systems over the period 1998 to 2001 appears to have declined by almost four percent. However, the apparent finding of an overall decline in the use of these systems may be because of the absence of complete data for all the rural systems.
3 An unlinked passenger trip is a trip on one transit vehicle regardless of the type of fare paid or
whether a transfer was made from another transit vehicle.

Virginia Department of Rail and Public Transportation Rail, Public Transportation, and TDM Needs Assessment
3-14 Cambridge Systematics, Inc.
Table 3.6 Summary of Urban Passenger Usage (2001)
Annual
Passenger Miles Annual
Unlinked Trips Average Weekday Unlinked Trips1
Major Urban
Northern Virginia Region Alexandria Transit Company (DASH) 8,151,154 2,640,420 9,182 Arlington County Regional Transit (ART) 259,512 N/A N/A
City of Falls Church/GEORGE2 N/A N/A N/A
Fairfax City CUE 3,395,325 970,576 3,423 Fairfax County Connector Bus System 39,296,357 6,112,753 22,571 Loudoun County Commuter and Transit Services 7,300,000 182,508 730 PRTC OmniRide/OmniLink 23,965,012 1,271,921 5,007 Virginia Railway Express 74,695,105 2,428,533 9,792 WMATA Total (Northern Virginia portion) 649,659,132 105,043,722 N/A
Metrobus 169,618,560 21,991,720 N/A Metrorail 480,040,572 83,052,002 N/A
Greater Richmond Region Greater Richmond Transit Company 49,911,335 15,423,050 52,450 Petersburg Area Transit 1,320,068 729,272 2,563
Hampton Roads Region Hampton Roads Transit 93,313,332 16,616,188 61,164 Williamsburg Area Transport 381,215 77,932 269
Major Urban Subtotal 951,647,547 151,496,875
Small Urban Blacksburg Transit 5,525,587 1,995,105 7,855 Bristol Virginia Transit N/A 48,000 est. N/A Charlottesville Transit 3,882,119 1,240,186 4,883 Danville Transit 299,968 225,626 888 Fredericksburg Regional Transit 2,079,414 214,829 846 Greater Lynchburg Transit 6,100,261 1,103,488 4,344 Greater Roanoke Transit (Valley Metro) 7,290,550 1,908,521 7,514 Winchester Transit 336,816 111,664 440 Harrisonburg Transit 511,676 1,078,539 4,246
Small Urban Subtotal 26,026,391 7,925,958 31,016
Notes: 1 For Small Urban and Rural, this number was estimated by dividing annual unlinked trips by 254 weekdays.
2 2003 is the first year of operation. Source: NTD, Virginia DRPT, and NVTC.
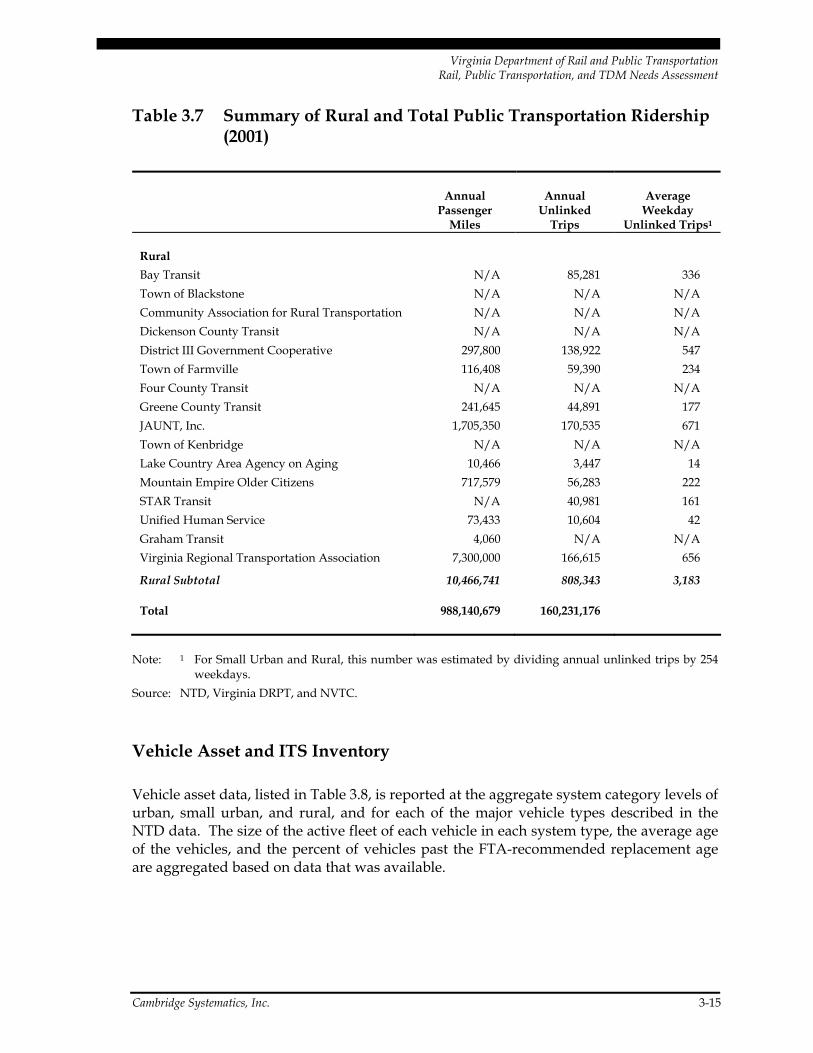
Virginia Department of Rail and Public Transportation Rail, Public Transportation, and TDM Needs Assessment
Cambridge Systematics, Inc. 3-15
Table 3.7 Summary of Rural and Total Public Transportation Ridership (2001)
Annual Passenger
Miles
Annual Unlinked
Trips
Average Weekday
Unlinked Trips1
Rural Bay Transit N/A 85,281 336 Town of Blackstone N/A N/A N/A Community Association for Rural Transportation N/A N/A N/A Dickenson County Transit N/A N/A N/A District III Government Cooperative 297,800 138,922 547 Town of Farmville 116,408 59,390 234 Four County Transit N/A N/A N/A Greene County Transit 241,645 44,891 177 JAUNT, Inc. 1,705,350 170,535 671 Town of Kenbridge N/A N/A N/A Lake Country Area Agency on Aging 10,466 3,447 14 Mountain Empire Older Citizens 717,579 56,283 222 STAR Transit N/A 40,981 161 Unified Human Service 73,433 10,604 42 Graham Transit 4,060 N/A N/A Virginia Regional Transportation Association 7,300,000 166,615 656
Rural Subtotal 10,466,741 808,343 3,183
Total 988,140,679 160,231,176
Note: 1 For Small Urban and Rural, this number was estimated by dividing annual unlinked trips by 254 weekdays.
Source: NTD, Virginia DRPT, and NVTC.
Vehicle Asset and ITS Inventory
Vehicle asset data, listed in Table 3.8, is reported at the aggregate system category levels of urban, small urban, and rural, and for each of the major vehicle types described in the NTD data. The size of the active fleet of each vehicle in each system type, the average age of the vehicles, and the percent of vehicles past the FTA-recommended replacement age are aggregated based on data that was available.
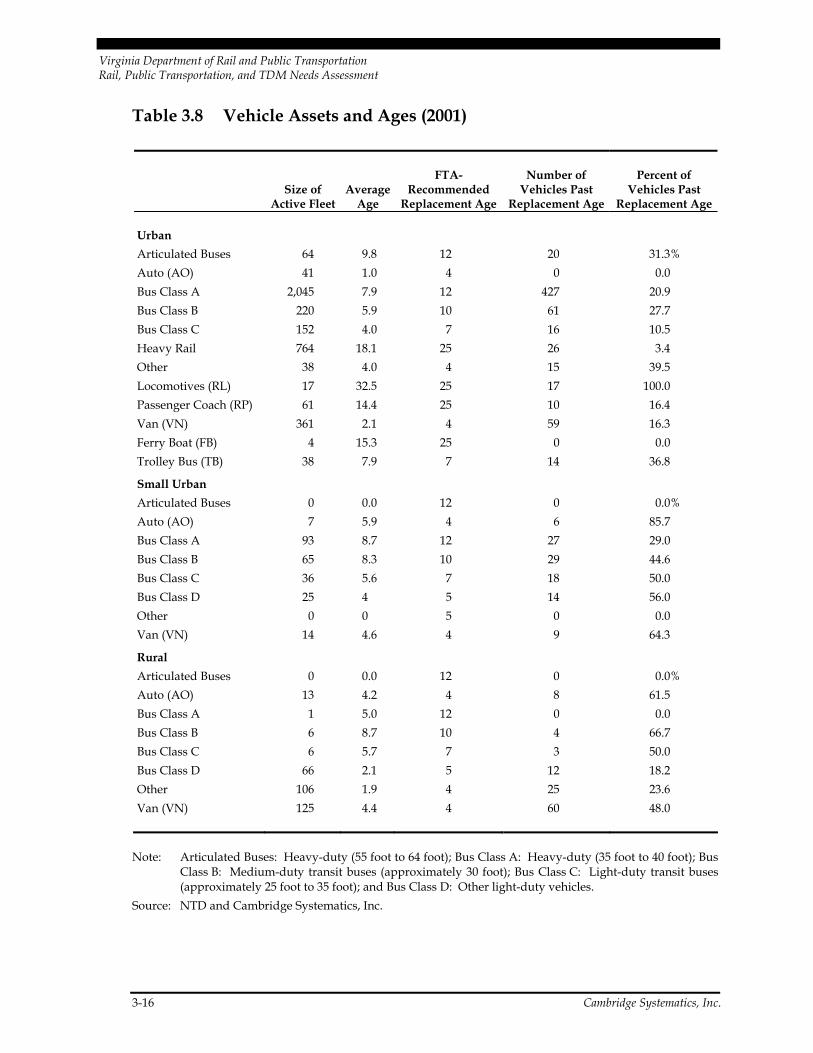
Virginia Department of Rail and Public Transportation Rail, Public Transportation, and TDM Needs Assessment
3-16 Cambridge Systematics, Inc.
Table 3.8 Vehicle Assets and Ages (2001)
Size of
Active Fleet Average
Age
FTA- Recommended
Replacement Age
Number of Vehicles Past
Replacement Age
Percent of Vehicles Past
Replacement Age
Urban Articulated Buses 64 9.8 12 20 31.3% Auto (AO) 41 1.0 4 0 0.0 Bus Class A 2,045 7.9 12 427 20.9 Bus Class B 220 5.9 10 61 27.7 Bus Class C 152 4.0 7 16 10.5 Heavy Rail 764 18.1 25 26 3.4 Other 38 4.0 4 15 39.5 Locomotives (RL) 17 32.5 25 17 100.0 Passenger Coach (RP) 61 14.4 25 10 16.4 Van (VN) 361 2.1 4 59 16.3 Ferry Boat (FB) 4 15.3 25 0 0.0 Trolley Bus (TB) 38 7.9 7 14 36.8
Small Urban Articulated Buses 0 0.0 12 0 0.0% Auto (AO) 7 5.9 4 6 85.7 Bus Class A 93 8.7 12 27 29.0 Bus Class B 65 8.3 10 29 44.6 Bus Class C 36 5.6 7 18 50.0 Bus Class D 25 4 5 14 56.0 Other 0 0 5 0 0.0 Van (VN) 14 4.6 4 9 64.3
Rural Articulated Buses 0 0.0 12 0 0.0% Auto (AO) 13 4.2 4 8 61.5 Bus Class A 1 5.0 12 0 0.0 Bus Class B 6 8.7 10 4 66.7 Bus Class C 6 5.7 7 3 50.0 Bus Class D 66 2.1 5 12 18.2 Other 106 1.9 4 25 23.6 Van (VN) 125 4.4 4 60 48.0
Note: Articulated Buses: Heavy-duty (55 foot to 64 foot); Bus Class A: Heavy-duty (35 foot to 40 foot); Bus Class B: Medium-duty transit buses (approximately 30 foot); Bus Class C: Light-duty transit buses (approximately 25 foot to 35 foot); and Bus Class D: Other light-duty vehicles.
Source: NTD and Cambridge Systematics, Inc.
Virginia Department of Rail and Public Transportation Rail, Public Transportation, and TDM Needs Assessment
Cambridge Systematics, Inc. 3-17
The age of a number of transit vehicles in operation exceed the FTA-recommended replacement age. For the major urban systems in 2001, there were a total of approximately 4,368 total transit vehicles of all types in operation in the Northern Virginia, Greater Richmond, and Hampton Roads regions. For the largest category of vehicles, the 2,045 standard 35- to 40-foot transit buses, the average age was 7.9 years. A total of 427 of the 2,045 full size buses, or about 21 percent, were more than 12 years old, and thus eligible for replacement according to FTA guidelines. Similarly, the average age of the 220 buses in the 30- to 35-foot length group was 5.9 years, and approximately 28 percent of these vehicles were beyond their recommended replacement age.
For the 17 locomotives owned and operated by VRE for its commuter rail operations in Northern Virginia, the average age for all vehicles of 32.5 years exceeded the FTA-recommended replacement age of 25 years. For all of the transit vehicles owned and operated by the systems in the large urban areas, approximately 17 percent of these vehicles were beyond their FTA-recommended replacement age. There were a total of 240 vehicles operated during FY 2001 by the small urban transit systems, with virtually all of these being standard bus or van-type vehicles. About 103 of the 240 vehicles, about 43 percent of the total small urban system fleet, were beyond the FTA-recommended replacement age. It was estimated that nine of the 14 van-type vehicles, about 64 percent of this vehicle category, were beyond the FTA-recommended replacement age of four years.
The State’s rural transit systems operated a total of 323 vehicles of all types during FY 2001. Overall, 112 of the 323 vehicles in the rural transit fleet, or about 35 percent, were estimated to exceed the recommended replacement life.
New technologies offered to travelers and transportation agencies to help alleviate con-gestion and improve highway and transit safety are often referred to as Intelligent Transportation Systems or ITS. There are some ITS system elements for public transportation that are commonly deployed or in progress. For example, advanced trav-eler information systems either are in place or are being deployed in both the large and small urban areas. Similarly, electronic fare payment programs, commonly referred to as “Smartcards,” have been implemented on systems in the Northern Virginia, Richmond, and Hampton Roads regions. Various types of geographic information systems (GIS) and automated vehicle location (AVL) systems either are currently in place, in development, or planned for near-term implementation in many of the State’s urban, small urban, and rural areas. For example, JAUNT, Inc., a rural provider, offers AVL and computerized scheduling. In the Northern Virginia, Richmond, and Hampton Roads regions, all of the major transit systems are active participants in the VDOT operated regional transportation management centers.
Maintenance and Other Facilities Inventory
Other important assets, in addition to vehicle fleets, are the maintenance and administra-tive facilities. A comprehensive asset inventory of all facilities was not conducted. Based upon initial site visits to the large urban systems and telephone interviews with staff of
Virginia Department of Rail and Public Transportation Rail, Public Transportation, and TDM Needs Assessment
3-18 Cambridge Systematics, Inc.
the small urban and rural systems, the following summary findings are made with regard to these facilities.
Major Urban Systems – The maintenance facilities of the urban systems in the Northern Virginia, Richmond, and Hampton Roads regions tend to be quite old and some appear to be at or beyond their functional capacities. For example, the GRTC administrative and maintenance facility occupies a group of structures that date to the late 1800s/early 1900s era and that were originally constructed for streetcar operations. Similarly, the HRT administrative and maintenance facilities in Norfolk include structures originally con-structed in the early 1900s for streetcar operations and a converted 1950s-era automobile dealership. While there are also newer maintenance facilities, such as those associated with the Fairfax County Connector and PRTC services, some of these are operating at or beyond their functional capacities and, in some cases, are extremely limited in terms of their abilities to be expanded at their current locations.
Small Urban Systems – The administrative, operations and maintenance facilities used by the small urban systems vary, but with some exceptions are in good condition with ade-quate current and near-term capacity. Roanoke and Lynchburg have good facilities, with future needs limited to minor renovation. Lynchburg’s maintenance facility originally dates from the 1920s, but has been modernized and upgraded; its administrative facility is adequate but will probably need to be replaced in the 15-20 year time horizon. Roanoke’s maintenance and administrative facilities are adequate to meet current and planned needs – the administrative offices are being renovated this year. Danville’s facility is shared with other city services, and is adequate.
Major near-term needs include Charlottesville Transit and FRED. Charlottesville is in need of a new administrative/maintenance facility in the near-term, with existing capacity problems and potential growth. This facility is already funded. FRED serves a growing area, and has potential for significant expansion. It has very limited administrative space in the existing terminal (though the new intermodal center should include more office space), and presently has no maintenance/operations facility, so it has a significant need.
Other (non-passenger) facility needs are projected to be further in the future. Blacksburg Transit, a busy university-oriented transit system that has just recently been classified as a small urban system, is currently adding to its facility, particularly administrative and training space; and its maintenance facility is in good condition. Depending on system growth, the site may reach a capacity constraint sometime late in the 21-year planning horizon. Harrisonburg Transit, another newly classified small urban system, has been adding to its existing facility, but may face a need in the future for a larger facility, including administrative space. Winchester Transit is another system that has recently become classified as small urban, and it could grow significantly based on population trends, possibly needing a facility in the mid-term future, as it does not currently have a separate maintenance facility, sharing space with the City of Winchester Public Works Department.
Rural Systems – Virginia’s rural systems have benefited from a significant ongoing effort to provide them with both administrative/maintenance and passenger facilities that are appropriate for current and future needs. The Virginia Regional Transportation
Virginia Department of Rail and Public Transportation Rail, Public Transportation, and TDM Needs Assessment
Cambridge Systematics, Inc. 3-19
Association’s (VRTA’s) new facility in Purcellville (opened March 2002) won the intermo-dal facility of the year award from the Community Transportation Association of America at the annual meeting this year. It combines administrative, maintenance and passenger functions. Mountain Empire Older Citizens (MEOC) is constructing an administrative/ maintenance facility, due to open in September 2004. RADAR has a new administrative/ maintenance facility, JAUNT has been awarded funding for a major facility expansion and modernization. Farmville has a recent (2001) facility for administration, training and light maintenance. STAR Transit has been awarded funding for a new administrative, mainte-nance and passenger facility. Graham Transit in Bluefield has a recent facility. These sig-nificant investments have equipped many of the rural systems with facilities that will meet their needs for the foreseeable future. For these new or nearly new facilities, capital needs will be limited to renovation or capacity expansion late in the 21-year planning period.
Transit Transfer Centers and Passenger Service Facilities
In recent years, many of the State’s public transportation systems have also constructed a variety of transit transfer centers and associated passenger service facilities. Based upon initial site visits to the large urban systems and telephone interviews with staff of the small urban and rural systems, the following preliminary findings are presented.
Major Urban Systems – In the large urban areas, a number of significant passenger facil-ity improvements have been implemented over the past few years. In the Northern Virginia region, the Springfield Intermodal Transportation Center brings together Metrorail, Metrobus, Fairfax Connector, OmniRide/OmniLink, Greyhound, Amtrak, and VRE services. Along the Dulles Corridor, the Herndon-Monroe facility serves as both a major park-and-ride lot and a transfer center for Fairfax Connector local and express routes and Metrobus services. In the Hampton Roads region, HRT has constructed major downtown transit transfer centers in Newport News and Hampton, with the Hampton facility also serving as the local Greyhound station. Similarly, the Williamsburg Transportation Center serves as an intermodal transfer center for Amtrak, Greyhound, and Williamsburg Area Transport operations.
Small Urban Systems – Many of Virginia’s small urban systems have already developed transit centers for transferring passengers – in a number of cases, these facilities also serve as the Greyhound intercity bus station as well. A number of the systems are Greyhound’s commission agents in their communities, including FRED, Greater Lynchburg Transit, Charlottesville Transit, and Valley Metro in Roanoke. Some systems are in the planning, design or construction phases of such facilities, and for others there are potential needs.
Existing intermodal passenger facilities include Roanoke’s downtown intermodal facility, which serves Valley Metro and Greyhound and includes offices and a parking garage. Lynchburg has a multimodal center that serves Amtrak, Greyhound and has Lynchburg Transit stops; a second passenger facility is their transfer center at Pittman Plaza. A rebuild of the transfer center is planned in the near-term future. FRED Central in Fredericksburg is the former Greyhound station, which also serves as the administrative
Virginia Department of Rail and Public Transportation Rail, Public Transportation, and TDM Needs Assessment
3-20 Cambridge Systematics, Inc.
office and central transfer point for FRED’s services. A new facility to serve these func-tions has been funded and is under design. Charlottesville is in the architectural/ engineering phases of the development of a new transit center (Greyhound is in a separate facility that was recently renovated). In Bristol, the (Virginia) transit system uses a facility owned by Bristol Tennessee Transit (in Tennessee) as the transfer facility between the two systems, but the transit system would like to provide a restroom and other improvements at this location in the near term. An intermodal facility has also been funded for design and construction in Petersburg.
Future projects under planning include an intermodal transfer center for Blacksburg Transit, which is currently the subject of a planning feasibility study. Potential projects in the longer-term future would include the possibility of an off-street transfer center for Danville, and passenger facilities for Harrisonburg Transit and Winchester, though no plans are currently under consideration for these systems.
Rural Systems – In Virginia, a number of rural transit systems have included passenger facilities in their administrative and/or maintenance facility projects. This is often in con-nection with their role as Greyhound commission ticket agencies. The facilities include waiting areas and counter space for Greyhound passengers, and offer a place where rural transit passengers could transfer to or from Greyhound services. VRTA and CARTS are Greyhound agents, and Bay Transit is planning to be the Greyhound agent for its two new facilities. The new VRTA facility in Purcellville includes a Greyhound agency (as well as Department of Motor Vehicles offices). STAR Transit on Virginia’s eastern shore has received funding for a new facility that will include a Greyhound/Carolina Trailways agency along with administrative and maintenance facilities.
In the near-term future, it is anticipated that VRTA’s planned/proposed facilities in Culpeper and Staunton might include passenger facilities as well, though no design proc-ess has begun. CATS in Staunton is already the Greyhound agent. In Culpeper, Greyhound and VRTA currently use the restored railroad depot as the stop, and this may continue even if a new administrative/maintenance facility is built. VRTA’s Town of Orange TOOT service in Orange also uses the restored railroad depot as a stop/transfer point, though Greyhound’s agent is in a different location. A current planning study for Bay Transit calls for two facilities that will include passenger facilities, one in Warsaw and the other in Gloucester.
Service and Capital Plans Inventory
The Commonwealth of Virginia, its MPOs, and most of the transit operators have pre-pared and planned for 20- and six-year periods in terms of service levels, ridership, and capital improvements. For example, all of the large transit systems have recently pre-pared TDP and/or COA plans outlining capital and operating improvements over the next five to seven years. The plans for services and capital improvements have been solicited from the Commonwealth and the MPOs. The plans have been reviewed and are utilized in the development of ridership forecasts, needs, and the scenarios for statewide investment in rail, public transportation, and TDM.
Virginia Department of Rail and Public Transportation Rail, Public Transportation, and TDM Needs Assessment
Cambridge Systematics, Inc. 3-21
Financial Resources Inventory
The total operating funds expended in FY 2001 by all transit providers in the Commonwealth was approximately $337 million, as shown in Table 3.9. The urban sys-tems accounted for approximately $311 million or almost 92 percent of the total statewide operating budget, with the Northern Virginia region alone accounting for about $241 million or 72 percent of the total statewide operating budget. The small urban sys-tems collectively expended approximately $17.3 million in operating expenses during FY 2001, or about five percent of the total statewide expenditures. The rural systems expended a total of approximately $8.9 million during FY 2001, accounting for less than three percent of total statewide operating expenses.
The largest single source of transit capital funds expended during FY 2001 was from the FTA. Of the total of approximately $517.3 million in capital expenditures for transit in FY 2001, approximately $362.7 million, or about 70 percent was provided by the FTA. State capital expenditures were approximately $56.2 million or about 11 percent of the total. The remaining capital funding contribution from local governments was approxi-mately $98.5 million or about 19 percent of the total.
Capital funding is variable by year. Over the period FY 1999 through FY 2001, both total transit capital expenditures and the share provided by the Commonwealth of Virginia exhibited substantial increases. Total transit capital expenditures increased from approximately $359.5 million in FY 1999 to $517.3 million in FY 2001, a percentage increase of about 44 percent in only two years. Similarly, the level of state capital funding increased from approximately $37.1 million in FY 1999 to approximately $56.2 million in FY 2001. This represents an increase in state funding of about 52 percent in just two years.
Intercity Bus Services
Intercity bus service refers to the services that operate between cities and towns, operating at varied hours but usually daily, with tickets and information provided at terminals or by commission agents in small towns. There are two providers of intercity bus service in Virginia – Greyhound Lines and Carolina Trailways. However, Carolina Trailways is a wholly owned subsidiary of Greyhound, and, in actual practice, the services are operated as a single, integrated network. Figure 3.6 provides a map of the State showing the existing intercity bus route network. In total, Greyhound and Carolina Trailways serve 58 points in Virginia, of which 15 are classified as “limited service” stops, which have no station or agent. Another 13 stops are made at the 13 intermodal facilities located throughout Virginia. All vehicles used by Greyhound and Carolina Trailways are 40- or 45-foot intercity coaches.
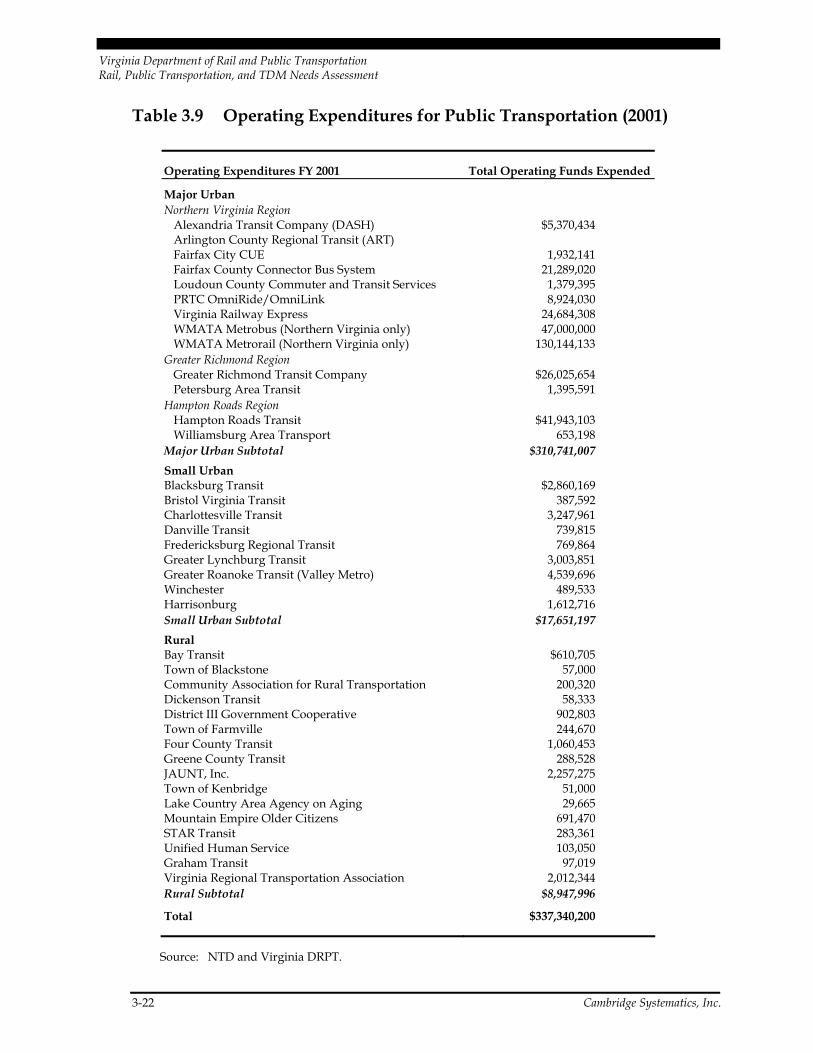
Virginia Department of Rail and Public Transportation Rail, Public Transportation, and TDM Needs Assessment
3-22 Cambridge Systematics, Inc.
Table 3.9 Operating Expenditures for Public Transportation (2001)
Operating Expenditures FY 2001 Total Operating Funds Expended
Major Urban Northern Virginia Region
Alexandria Transit Company (DASH) $5,370,434 Arlington County Regional Transit (ART) Fairfax City CUE 1,932,141 Fairfax County Connector Bus System 21,289,020 Loudoun County Commuter and Transit Services 1,379,395 PRTC OmniRide/OmniLink 8,924,030 Virginia Railway Express 24,684,308 WMATA Metrobus (Northern Virginia only) 47,000,000 WMATA Metrorail (Northern Virginia only) 130,144,133
Greater Richmond Region Greater Richmond Transit Company $26,025,654 Petersburg Area Transit 1,395,591
Hampton Roads Region Hampton Roads Transit $41,943,103 Williamsburg Area Transport 653,198
Major Urban Subtotal $310,741,007 Small Urban Blacksburg Transit $2,860,169 Bristol Virginia Transit 387,592 Charlottesville Transit 3,247,961 Danville Transit 739,815 Fredericksburg Regional Transit 769,864 Greater Lynchburg Transit 3,003,851 Greater Roanoke Transit (Valley Metro) 4,539,696 Winchester 489,533 Harrisonburg 1,612,716 Small Urban Subtotal $17,651,197 Rural Bay Transit $610,705 Town of Blackstone 57,000 Community Association for Rural Transportation 200,320 Dickenson Transit 58,333 District III Government Cooperative 902,803 Town of Farmville 244,670 Four County Transit 1,060,453 Greene County Transit 288,528 JAUNT, Inc. 2,257,275 Town of Kenbridge 51,000 Lake Country Area Agency on Aging 29,665 Mountain Empire Older Citizens 691,470 STAR Transit 283,361 Unified Human Service 103,050 Graham Transit 97,019 Virginia Regional Transportation Association 2,012,344 Rural Subtotal $8,947,996
Total $337,340,200
Source: NTD and Virginia DRPT.
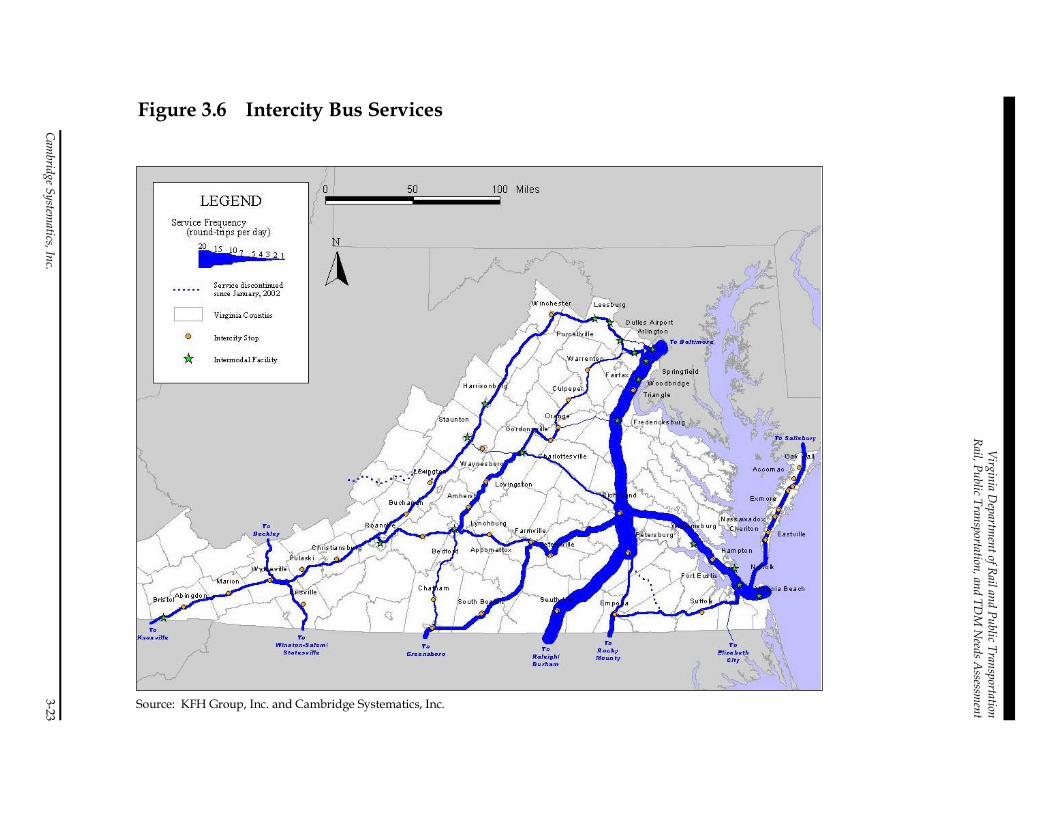
Virginia D
epartment of Rail and Public Transportation
Rail, Public Transportation, and TDM
Needs A
ssessment
Cambridge System
atics, Inc. 3-23
Source: KFH Group, Inc. and Cambridge Systematics, Inc.
Figure 3.6 Intercity Bus Services

Virginia Department of Rail and Public Transportation Rail, Public Transportation, and TDM Needs Assessment
3-24 Cambridge Systematics, Inc.
Figure 3.6 also depicts the frequency on the network. As would be expected, the heaviest service is along the I-95 and I-81 corridors. Carolina Trailways also provides significant service from Richmond to Hampton Roads and to the south and west to Danville and beyond toward Fayetteville and Charlotte in North Carolina. FY 2001 revenue data for Virginia locations can be used to estimate that at least 444,000 intercity bus passengers boarded in Virginia in that year, or an average of 1,200 per day. The actual total may be higher because of round-trip tickets sold elsewhere with Virginia destinations.
Virginia DRPT currently does not provide any direct funding to intercity bus companies to support operations. However, the State has an active program to develop improved multimodal transit passenger facilities that include space for intercity buses and passen-gers. Publicly owned intermodal transit facilities that include intercity bus service are located in Roanoke, Lynchburg, Charlottesville, Harrisonburg, Staunton, Williamsburg, Hampton, Norfolk, Purcellville, Woodbridge, Dulles Airport; and at Metrorail stations in Rosslyn, Springfield, and Vienna.
Planned facilities include the Main Street Terminal project in Richmond, a new intermodal facility in Fredericksburg, an intermodal passenger facility in Petersburg, and the STAR Transit facility on the Eastern Shore. All of these facilities are funded, but have not yet been constructed. In addition, there are plans to include Greyhound facilities in new Bay Transit facilities in Warsaw and Gloucester.
In many of these facilities the public transit operator has become the commission agent for the bus company, selling tickets, providing information, and handling package express. As the agent, the system obtains a commission from the bus company on each ticket sold, and this revenue is an additional source of local match to support local transit operations. Currently, FRED, Greater Lynchburg Transit, Charlottesville Transit, CARTS (in Harrisonburg), CATS (in Staunton), Arlington County (Rosslyn Commuter Store), and Metropolitan Washington Airport Authority (at Dulles International Airport) are Greyhound agents. STAR Transit on the Eastern Shore will become an agent when the terminal is completed. In addition, Virginia DRPT funded a feasibility study for Bay Transit to address the feasibility of reinstating intercity bus service in the Northern Neck and Middle Peninsula areas. It concluded that feeder service operated by the transit agency to connecting points is the most feasible option, and recommended a demonstra-tion project to test demand and operational aspects.
Private Commuter Bus Services
In addition to the intercity bus service operated by Greyhound and Carolina Trailways, a number of private bus companies also provide commuter bus service in Virginia. Com-muter bus services typically are operated during peak hours only, serving major com-muter destinations from park-and-ride lots. However, there is no single source of information for these services, and data on most parameters are not available. Web sites aimed at transit users and ride-share markets were reviewed to identify carriers listed as providing commuter bus service, and these firms were then contacted by consultant team members to obtain information on routes, frequencies, fares, and ridership. Listings in the
Virginia Department of Rail and Public Transportation Rail, Public Transportation, and TDM Needs Assessment
Cambridge Systematics, Inc. 3-25
2002 Bus Industry Directory were also reviewed to identify firms presenting themselves as commuter operators. The six firms identified through this process are: Abbott Bus Lines, Brooks Transit Service; Lee Coaches; National Coach Works; Quick’s Commuter Services; Franklin Motorcoach; and D&B Bus Lines.
Based on the information provided by the bus companies, the combined daily weekday ridership (one-way trips) of these private commuter services is estimated to be approxi-mately 2,030 trips, which is equivalent to about 500,000 per year. These services serve ori-gins beyond the areas served by public commuter bus services (such as PRTC) or VRE commuter rail services, and are focused on destinations in the Northern Virginia region and the District of Columbia. No private commuter bus services were identified with destinations in Richmond or Hampton Roads.
Summary of Virginia’s Passenger Rail System
There are currently two passenger railroads operating in Virginia on approximately 616 miles of track owned by either CSX or Norfolk Southern Railroads. Collectively, these two passenger railroads, VRE and Amtrak, carried nearly 3.8 million passengers during 2002. The following paragraphs summarize the operational characteristics of these two passen-ger railroads.
Commuter Rail – Virginia Railway Express
The VRE operates passenger trains on an 80-mile system connecting Washington, D.C., with Fredericksburg and Manassas, Virginia. From Union Station in the District of Columbia, the Fredericksburg and Manassas lines share the same right-of-way for approximately 9.6 miles, to a point just south of Alexandria, Virginia, where they diverge. VRE is a tenant on three railroads (CSX Transportation, Norfolk Southern, and Amtrak) and contracts with Amtrak to operate the trains. VRE is operated today with a fleet con-sisting of 19 locomotives and 68 active passenger coaches.
VRE service is heavily oriented towards the Washington central business district in the morning peak and in the opposite direction in the evening peak. There is no service on weekends and reduced service on holidays. VRE has connections to Amtrak at six sta-tions. Moreover, certain Amtrak trains honor VRE tickets and become, in effect, addi-tional frequencies between the stations served by the Amtrak train. VRE connects with the Washington Metrorail system at five stations (Union Station, L’Enfant, Crystal City, Alexandria, and Franconia/Springfield) (Figure 3.7). Local bus routes of several operators provide service to and connections with VRE at many stations, particularly those in Fairfax and Prince William Counties, often with free transfers to local buses.
As shown in Figure 3.8, VRE ridership grew from 6,500 daily trips in November 1993 to 7,000 daily trips in 1998, and then sharply rose to more than 11,400 trips per day in November 2001. Current daily ridership is estimated at 14,375 (September 2003 by VRE). Generally, ridership had been growing fairly steadily since FY 1999.
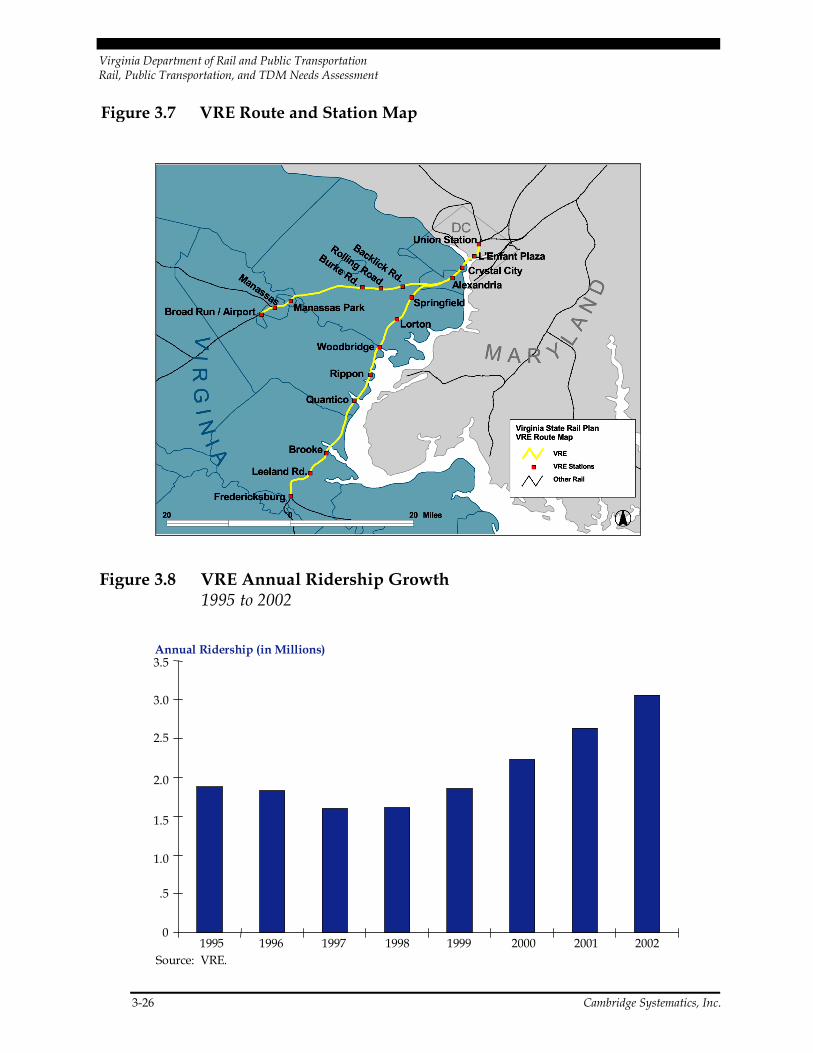
Virginia Department of Rail and Public Transportation Rail, Public Transportation, and TDM Needs Assessment
3-26 Cambridge Systematics, Inc.
Figure 3.7 VRE Route and Station Map
Figure 3.8 VRE Annual Ridership Growth1995 to 2002
0
.5
1.0
1.5
2.0
2.5
3.0
3.5
1995 1996 1997 1998 1999 2000 2001 2002
Annual Ridership (in Millions)
Source: VRE.
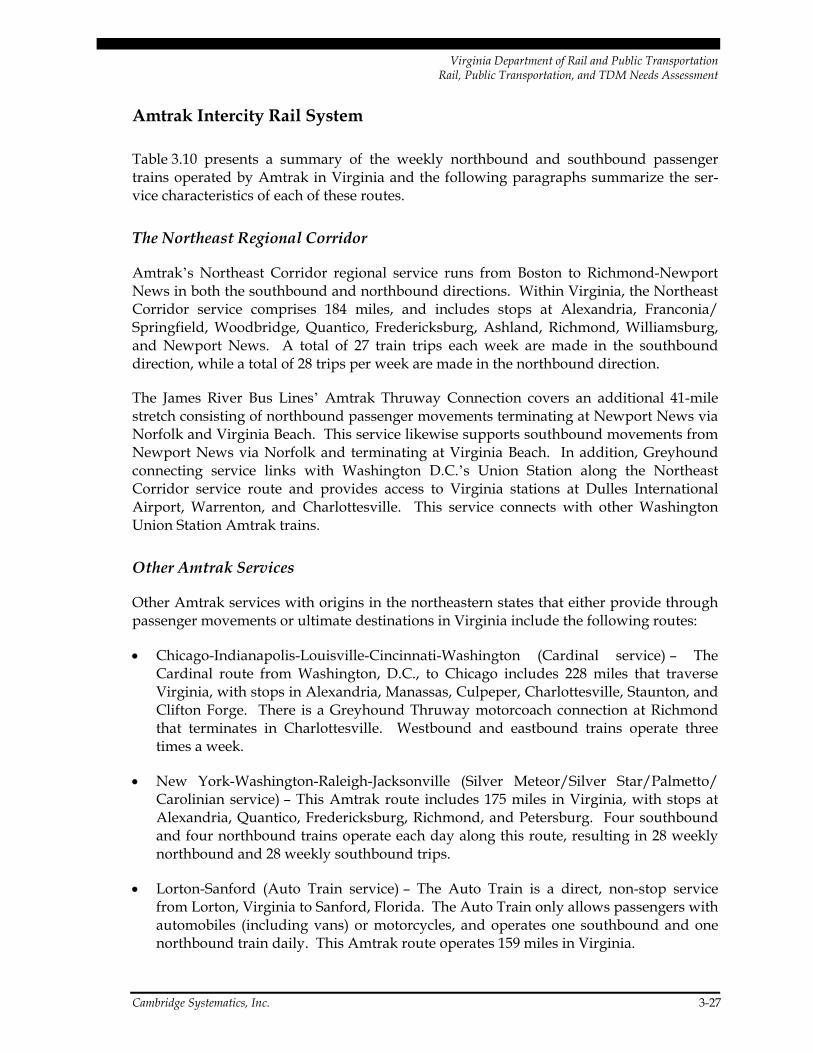
Virginia Department of Rail and Public Transportation Rail, Public Transportation, and TDM Needs Assessment
Cambridge Systematics, Inc. 3-27
Amtrak Intercity Rail System
Table 3.10 presents a summary of the weekly northbound and southbound passenger trains operated by Amtrak in Virginia and the following paragraphs summarize the ser-vice characteristics of each of these routes.
The Northeast Regional Corridor
Amtrak’s Northeast Corridor regional service runs from Boston to Richmond-Newport News in both the southbound and northbound directions. Within Virginia, the Northeast Corridor service comprises 184 miles, and includes stops at Alexandria, Franconia/ Springfield, Woodbridge, Quantico, Fredericksburg, Ashland, Richmond, Williamsburg, and Newport News. A total of 27 train trips each week are made in the southbound direction, while a total of 28 trips per week are made in the northbound direction.
The James River Bus Lines’ Amtrak Thruway Connection covers an additional 41-mile stretch consisting of northbound passenger movements terminating at Newport News via Norfolk and Virginia Beach. This service likewise supports southbound movements from Newport News via Norfolk and terminating at Virginia Beach. In addition, Greyhound connecting service links with Washington D.C.’s Union Station along the Northeast Corridor service route and provides access to Virginia stations at Dulles International Airport, Warrenton, and Charlottesville. This service connects with other Washington Union Station Amtrak trains.
Other Amtrak Services
Other Amtrak services with origins in the northeastern states that either provide through passenger movements or ultimate destinations in Virginia include the following routes:
• Chicago-Indianapolis-Louisville-Cincinnati-Washington (Cardinal service) – The Cardinal route from Washington, D.C., to Chicago includes 228 miles that traverse Virginia, with stops in Alexandria, Manassas, Culpeper, Charlottesville, Staunton, and Clifton Forge. There is a Greyhound Thruway motorcoach connection at Richmond that terminates in Charlottesville. Westbound and eastbound trains operate three times a week.
• New York-Washington-Raleigh-Jacksonville (Silver Meteor/Silver Star/Palmetto/ Carolinian service) – This Amtrak route includes 175 miles in Virginia, with stops at Alexandria, Quantico, Fredericksburg, Richmond, and Petersburg. Four southbound and four northbound trains operate each day along this route, resulting in 28 weekly northbound and 28 weekly southbound trips.
• Lorton-Sanford (Auto Train service) – The Auto Train is a direct, non-stop service from Lorton, Virginia to Sanford, Florida. The Auto Train only allows passengers with automobiles (including vans) or motorcycles, and operates one southbound and one northbound train daily. This Amtrak route operates 159 miles in Virginia.
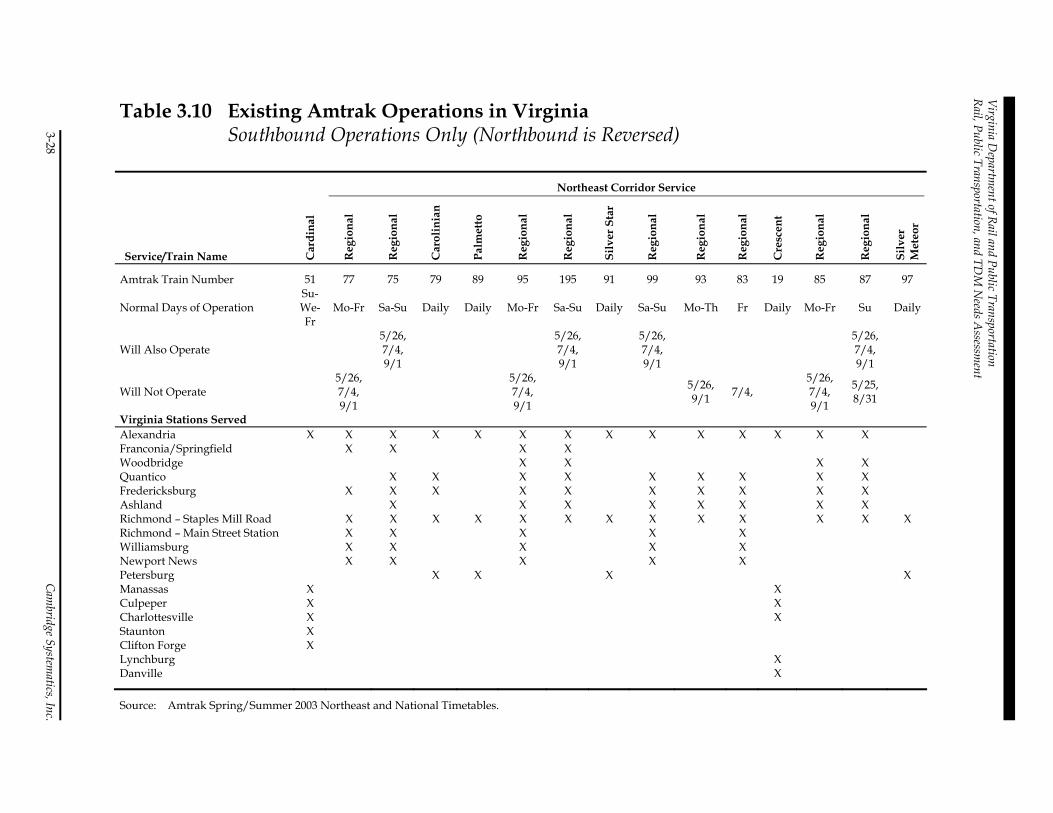
Virginia D
epartment of Rail and Public Transportation
Rail, Public Transportation, and TDM
Needs A
ssessment
3-28 Cam
bridge Systematics, Inc.
Table 3.10 Existing Amtrak Operations in Virginia Southbound Operations Only (Northbound is Reversed)
Northeast Corridor Service
Service/Train Name Car
dina
l
Reg
iona
l
Reg
iona
l
Car
olin
ian
Palm
etto
Reg
iona
l
Reg
iona
l
Silv
er S
tar
Reg
iona
l
Reg
iona
l
Reg
iona
l
Cre
scen
t
Reg
iona
l
Reg
iona
l
Silv
er
Met
eor
Amtrak Train Number 51 77 75 79 89 95 195 91 99 93 83 19 85 87 97
Normal Days of Operation Su- We- Fr
Mo-Fr Sa-Su Daily Daily Mo-Fr Sa-Su Daily Sa-Su Mo-Th Fr Daily Mo-Fr Su Daily
Will Also Operate 5/26, 7/4, 9/1
5/26, 7/4, 9/1
5/26, 7/4, 9/1
5/26, 7/4, 9/1
Will Not Operate 5/26, 7/4, 9/1
5/26, 7/4, 9/1
5/26, 9/1 7/4,
5/26, 7/4, 9/1
5/25, 8/31
Virginia Stations Served Alexandria X X X X X X X X X X X X X X Franconia/Springfield X X X X Woodbridge X X X X Quantico X X X X X X X X X Fredericksburg X X X X X X X X X X Ashland X X X X X X X X Richmond – Staples Mill Road X X X X X X X X X X X X X Richmond – Main Street Station X X X X X Williamsburg X X X X X Newport News X X X X X Petersburg X X X X Manassas X X Culpeper X X Charlottesville X X Staunton X Clifton Forge X Lynchburg X Danville X
Source: Amtrak Spring/Summer 2003 Northeast and National Timetables.
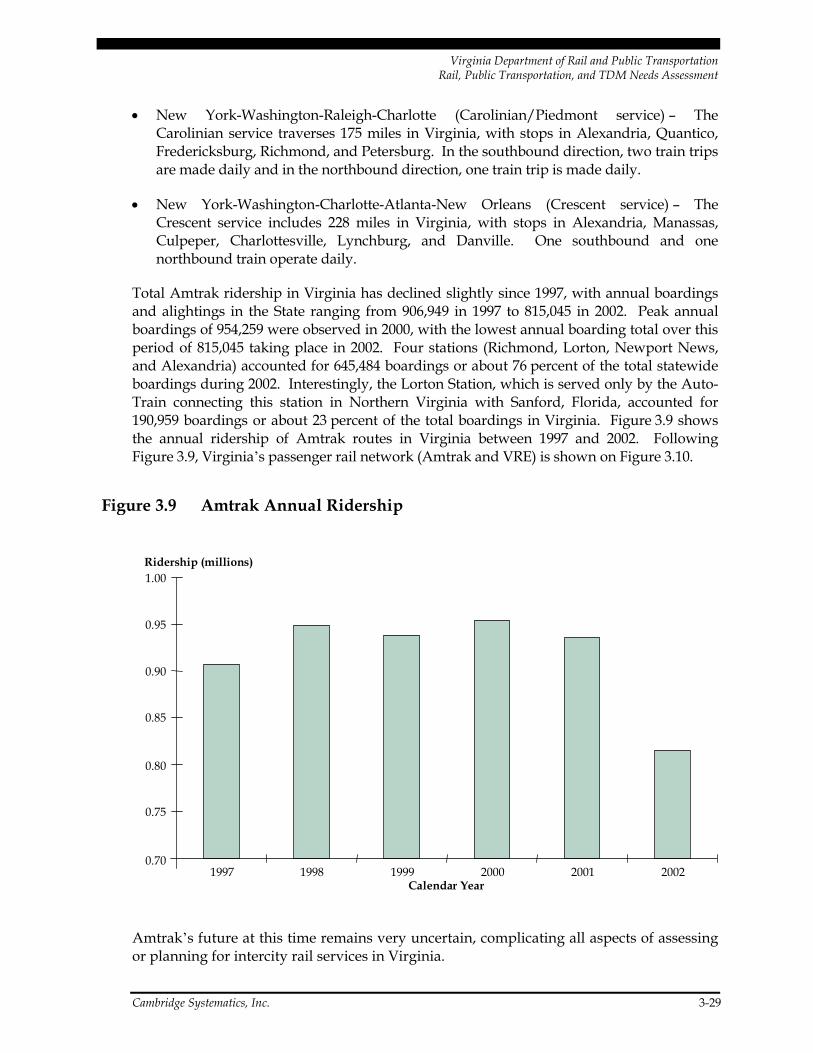
Virginia Department of Rail and Public Transportation Rail, Public Transportation, and TDM Needs Assessment
Cambridge Systematics, Inc. 3-29
• New York-Washington-Raleigh-Charlotte (Carolinian/Piedmont service) – The Carolinian service traverses 175 miles in Virginia, with stops in Alexandria, Quantico, Fredericksburg, Richmond, and Petersburg. In the southbound direction, two train trips are made daily and in the northbound direction, one train trip is made daily.
• New York-Washington-Charlotte-Atlanta-New Orleans (Crescent service) – The Crescent service includes 228 miles in Virginia, with stops in Alexandria, Manassas, Culpeper, Charlottesville, Lynchburg, and Danville. One southbound and one northbound train operate daily.
Total Amtrak ridership in Virginia has declined slightly since 1997, with annual boardings and alightings in the State ranging from 906,949 in 1997 to 815,045 in 2002. Peak annual boardings of 954,259 were observed in 2000, with the lowest annual boarding total over this period of 815,045 taking place in 2002. Four stations (Richmond, Lorton, Newport News, and Alexandria) accounted for 645,484 boardings or about 76 percent of the total statewide boardings during 2002. Interestingly, the Lorton Station, which is served only by the Auto-Train connecting this station in Northern Virginia with Sanford, Florida, accounted for 190,959 boardings or about 23 percent of the total boardings in Virginia. Figure 3.9 shows the annual ridership of Amtrak routes in Virginia between 1997 and 2002. Following Figure 3.9, Virginia’s passenger rail network (Amtrak and VRE) is shown on Figure 3.10.
Figure 3.9 Amtrak Annual Ridership
0.70
0.75
0.80
0.85
0.90
0.95
1.00
1997 1998 1999 2000 2001 2002Calendar Year
Ridership (millions)
Amtrak’s future at this time remains very uncertain, complicating all aspects of assessing or planning for intercity rail services in Virginia.
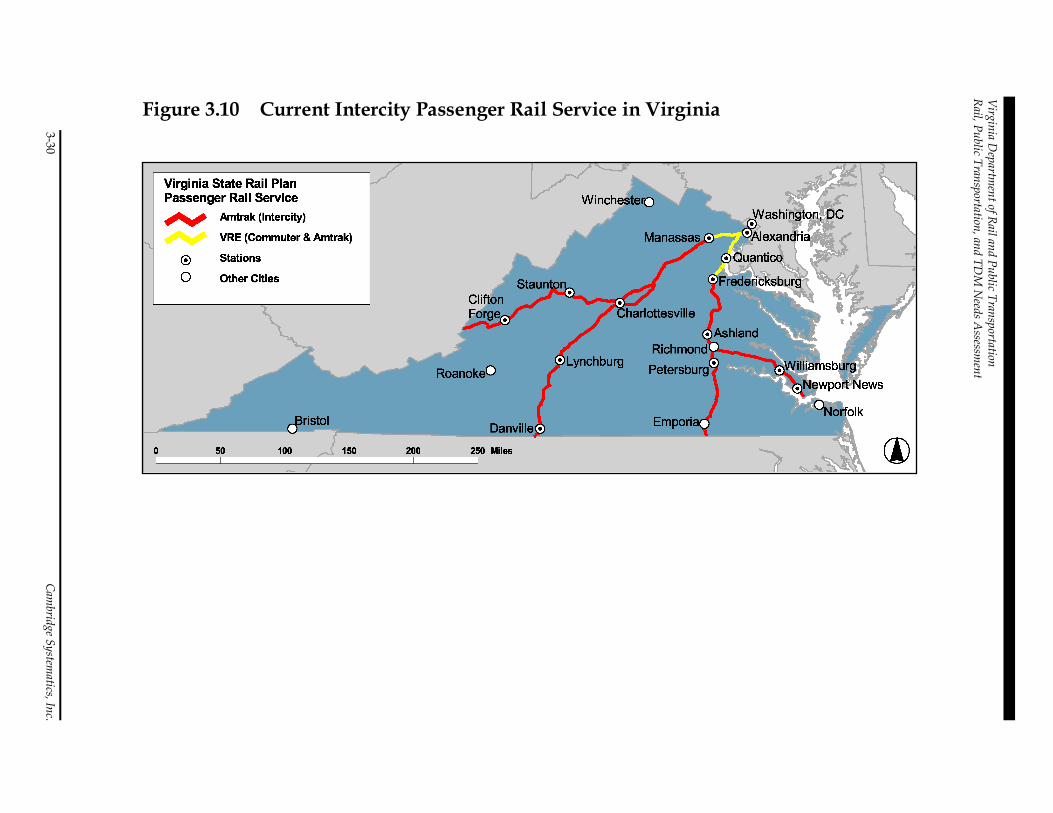
Virginia D
epartment of Rail and Public Transportation
Rail, Public Transportation, and TDM
Needs A
ssessment
3-30 Cam
bridge Systematics, Inc.
Figure 3.10 Current Intercity Passenger Rail Service in Virginia
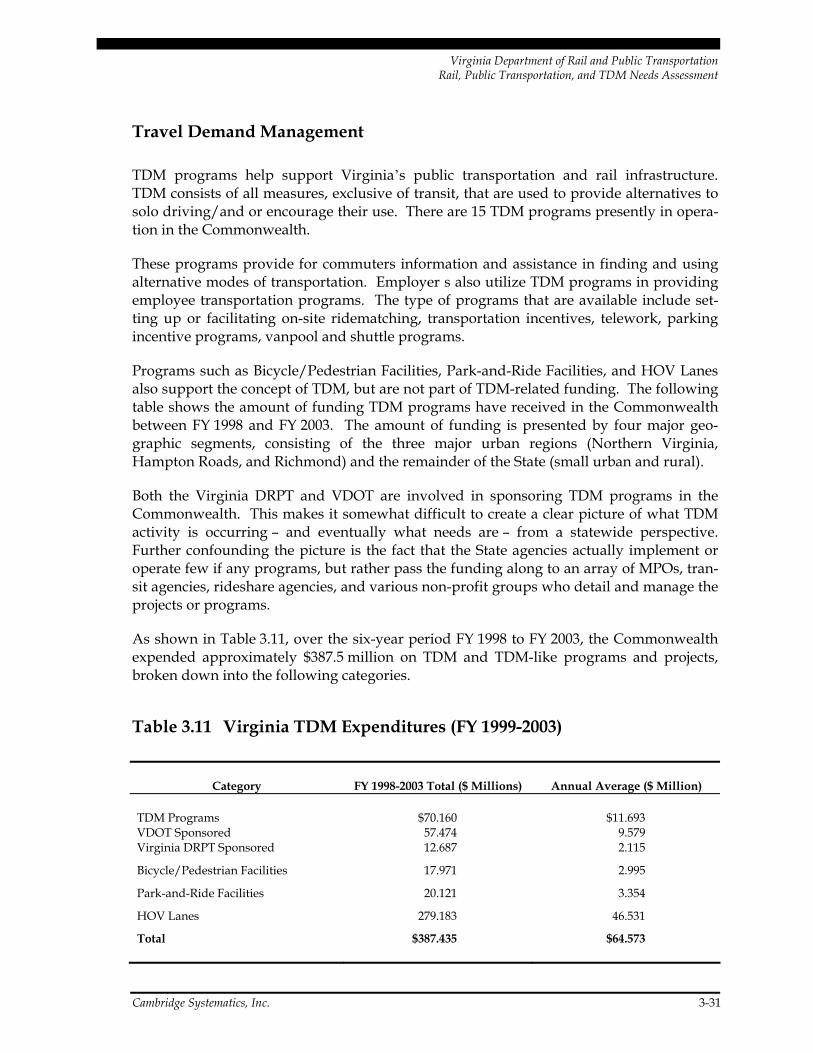
Virginia Department of Rail and Public Transportation Rail, Public Transportation, and TDM Needs Assessment
Cambridge Systematics, Inc. 3-31
Travel Demand Management
TDM programs help support Virginia’s public transportation and rail infrastructure. TDM consists of all measures, exclusive of transit, that are used to provide alternatives to solo driving/and or encourage their use. There are 15 TDM programs presently in opera-tion in the Commonwealth.
These programs provide for commuters information and assistance in finding and using alternative modes of transportation. Employer s also utilize TDM programs in providing employee transportation programs. The type of programs that are available include set-ting up or facilitating on-site ridematching, transportation incentives, telework, parking incentive programs, vanpool and shuttle programs.
Programs such as Bicycle/Pedestrian Facilities, Park-and-Ride Facilities, and HOV Lanes also support the concept of TDM, but are not part of TDM-related funding. The following table shows the amount of funding TDM programs have received in the Commonwealth between FY 1998 and FY 2003. The amount of funding is presented by four major geo-graphic segments, consisting of the three major urban regions (Northern Virginia, Hampton Roads, and Richmond) and the remainder of the State (small urban and rural).
Both the Virginia DRPT and VDOT are involved in sponsoring TDM programs in the Commonwealth. This makes it somewhat difficult to create a clear picture of what TDM activity is occurring – and eventually what needs are – from a statewide perspective. Further confounding the picture is the fact that the State agencies actually implement or operate few if any programs, but rather pass the funding along to an array of MPOs, tran-sit agencies, rideshare agencies, and various non-profit groups who detail and manage the projects or programs.
As shown in Table 3.11, over the six-year period FY 1998 to FY 2003, the Commonwealth expended approximately $387.5 million on TDM and TDM-like programs and projects, broken down into the following categories.
Table 3.11 Virginia TDM Expenditures (FY 1999-2003)
Category FY 1998-2003 Total ($ Millions) Annual Average ($ Million)
TDM Programs VDOT Sponsored Virginia DRPT Sponsored
$70.160 57.474 12.687
$11.693 9.579 2.115
Bicycle/Pedestrian Facilities 17.971 2.995
Park-and-Ride Facilities 20.121 3.354
HOV Lanes 279.183 46.531
Total $387.435 $64.573
Virginia Department of Rail and Public Transportation Rail, Public Transportation, and TDM Needs Assessment
3-32 Cambridge Systematics, Inc.
While the Bicycle/Pedestrian, the Park-and-Ride Facilities, and the HOV Lane projects would generally seem to fall within the broad definition of TDM strategies – i.e., they pro-vide alternatives to single occupant vehicle travel and are in addition to the State’s con-ventional public transportation programs – this TDM inventory and subsequent needs assessment will be more narrowly focused on the TDM category. This is for two reasons. First, virtually all of the projects in the TDM category are programmatic in nature, as dis-tinct from the other three categories that are almost exclusively capital construction proj-ects. Second, it is the conventional TDM category in which Virginia DRPT, the subject of this review, is positioned with its efforts.
However, of the approximately $11.7 million per year that is spent by the State on TDM-specific ventures, Virginia DRPT’s activities account for only $2.1 million, or 18 percent, of the statewide total. A major reason for this difference in proportions has to do with the responsibilities assumed by each agency. VDOT has assumed most of the responsibility for air quality and congestion management requirements in the State, and hence is the distributor of Federal Congestion Management and Air Quality (CMAQ) funds that sup-port many of the TERMS and other mitigation measures invoked by the MPOs (including Bike/Pedestrian, Park-and-Ride, and HOV initiatives). VDOT funds are also used to sup-port the air quality and TDM efforts of the major metropolitan area planning organiza-tions, particularly the MPOs of Washington D.C., Richmond, and Hampton Roads. For example, VDOT supports MWCOG’s Commuter Connection program at a level of about $3.7 million per year, the TRAFFIX program in Hampton Roads at a level of about $1.9 million per year, and the programs of Ridefinders and regional air quality activities in Richmond at a level of about $0.9 per year.
In contrast to VDOT’s focus, Virginia’s TDM activities are substantially focused on the operation and administration of (currently) 14 local ridesharing agencies across the State. The agencies supported and the pattern of funding is detailed in Table 3.12. The funding shown is to support operational costs and activities of these agencies, including staff, ride-share matching systems, outreach and education to employers, neighborhoods and the community, advertising and promotion of all modes, vanpool formation and incentives, transit pass and fare incentive programs, telecommuting, and much more.
The number of agencies served continues to change with time. In FY 1998, 13 agencies were being supported. Since that time – by 1993 – Lord Fairfax PDC had been eliminated, and Valley Commuter Assistance in Front Royal was created. TRAFFIX, the rideshare program in Hampton Roads, is shown in the table but its funding comes from VDOT, and not Virginia DRPT.
Source of funding, and programming decisions sometimes external to Virginia DRPT, results in considerable year to year variation – and certainty – as to how these and other of Virginia DRPT’s TDM initiatives are funded, and hence, also the level of funding in a given year. Virginia DRPT’s annual State Aid to Public Transportation program is sup-ported by several sources of funding, as illustrated in the table that follows. The major source are state TEIF Funds, or Transportation Efficiency Improvement Funds, which are dedicated at a fixed $1.9 million per year (table amounts indicate year to year carryover) for TDM and Ridesharing projects, although as will be seen, these funds have often been used for other purposes.
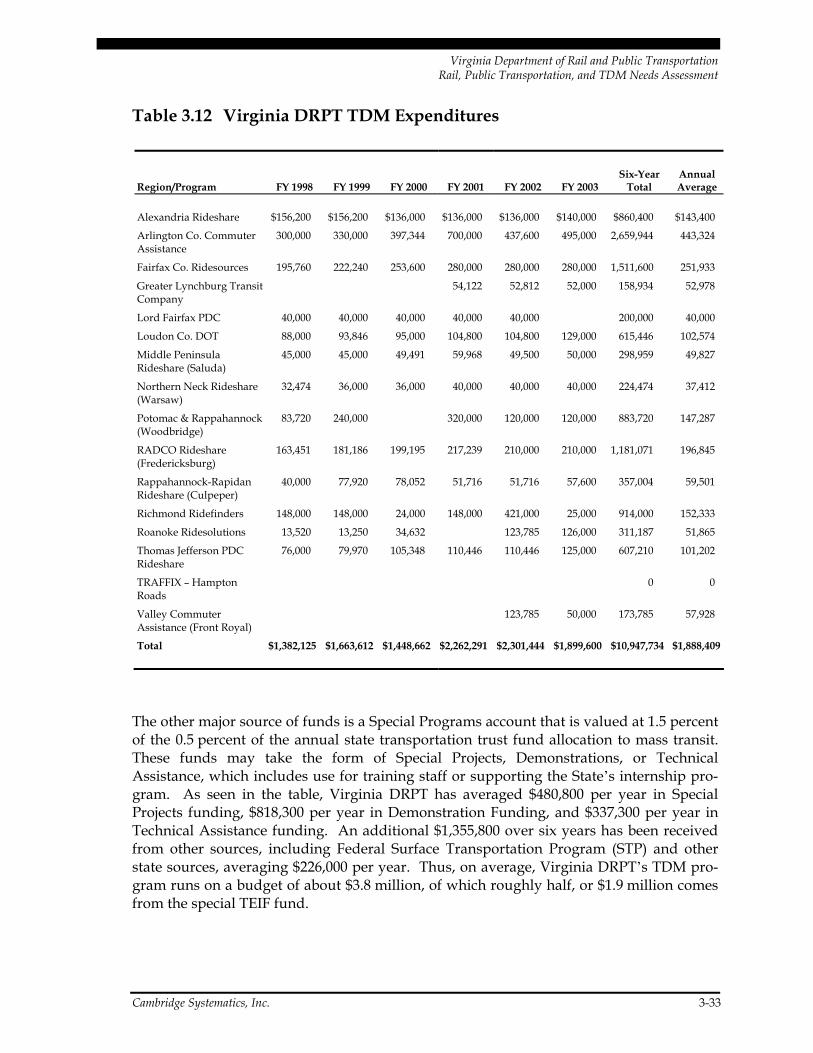
Virginia Department of Rail and Public Transportation Rail, Public Transportation, and TDM Needs Assessment
Cambridge Systematics, Inc. 3-33
Table 3.12 Virginia DRPT TDM Expenditures
Region/Program FY 1998 FY 1999 FY 2000 FY 2001 FY 2002 FY 2003 Six-Year
Total Annual Average
Alexandria Rideshare $156,200 $156,200 $136,000 $136,000 $136,000 $140,000 $860,400 $143,400
Arlington Co. Commuter Assistance
300,000 330,000 397,344 700,000 437,600 495,000 2,659,944 443,324
Fairfax Co. Ridesources 195,760 222,240 253,600 280,000 280,000 280,000 1,511,600 251,933
Greater Lynchburg Transit Company
54,122 52,812 52,000 158,934 52,978
Lord Fairfax PDC 40,000 40,000 40,000 40,000 40,000 200,000 40,000
Loudon Co. DOT 88,000 93,846 95,000 104,800 104,800 129,000 615,446 102,574
Middle Peninsula Rideshare (Saluda)
45,000 45,000 49,491 59,968 49,500 50,000 298,959 49,827
Northern Neck Rideshare (Warsaw)
32,474 36,000 36,000 40,000 40,000 40,000 224,474 37,412
Potomac & Rappahannock (Woodbridge)
83,720 240,000 320,000 120,000 120,000 883,720 147,287
RADCO Rideshare (Fredericksburg)
163,451 181,186 199,195 217,239 210,000 210,000 1,181,071 196,845
Rappahannock-Rapidan Rideshare (Culpeper)
40,000 77,920 78,052 51,716 51,716 57,600 357,004 59,501
Richmond Ridefinders 148,000 148,000 24,000 148,000 421,000 25,000 914,000 152,333
Roanoke Ridesolutions 13,520 13,250 34,632 123,785 126,000 311,187 51,865
Thomas Jefferson PDC Rideshare
76,000 79,970 105,348 110,446 110,446 125,000 607,210 101,202
TRAFFIX – Hampton Roads
0 0
Valley Commuter Assistance (Front Royal)
123,785 50,000 173,785 57,928
Total $1,382,125 $1,663,612 $1,448,662 $2,262,291 $2,301,444 $1,899,600 $10,947,734 $1,888,409
The other major source of funds is a Special Programs account that is valued at 1.5 percent of the 0.5 percent of the annual state transportation trust fund allocation to mass transit. These funds may take the form of Special Projects, Demonstrations, or Technical Assistance, which includes use for training staff or supporting the State’s internship pro-gram. As seen in the table, Virginia DRPT has averaged $480,800 per year in Special Projects funding, $818,300 per year in Demonstration Funding, and $337,300 per year in Technical Assistance funding. An additional $1,355,800 over six years has been received from other sources, including Federal Surface Transportation Program (STP) and other state sources, averaging $226,000 per year. Thus, on average, Virginia DRPT’s TDM pro-gram runs on a budget of about $3.8 million, of which roughly half, or $1.9 million comes from the special TEIF fund.
Virginia Department of Rail and Public Transportation Rail, Public Transportation, and TDM Needs Assessment
3-34 Cambridge Systematics, Inc.
Specialized Services Program (Section 5310)
Another important component of Virginia’s transportation program is the Specialized Services Program. This program provides capital funding, primarily for vehicles, to pri-vate non-profit organizations that provide transportation to the elderly or disabled per-sons. It utilizes Federal funding under Section 5310 of the transportation program, and there is an additional state program that provides additional capital. The Federal funding is provided to the states, including Virginia, on a formula basis. It provides for a Federal share not to exceed 80 percent of the cost of capital, with a local share of 20 percent. In addition, the State-funded program provides more capital funding at a 95 percent state/five percent local match ratio.
Virginia conducts an annual statewide solicitation of projects from eligible organizations. In FY 2004, 103 vehicles funded under the Federal Section 5310 program were included in the Program of Projects. An additional 17 vehicles were funded under the State Specialized Program. Prior to the arrival of any of the FY 2004 vehicles, approximately 217 vehicles previously funded by the program were in service, of which 14 are estimated to be past their suggested replacement date. Although the operation of these vehicles is not funded through Virginia DRPT programs, it is estimated that the 34 agencies oper-ating these vehicles in FY 2002 spent $8,022,826 to operate these vehicles. Much of this funding comes from human service programs providing services to the elderly and to dis-abled persons, often under other Federal programs.
3.2 Service Assessment
An assessment of the adequacy of the existing rail and public transportation systems in the Commonwealth of Virginia was conducted. The assessment focuses on three key areas:
• Availability or Coverage of Rail and Public Transportation Service;
• Assets and Conditions Assessment; and
• Performance Measures Assessment.
Information on the availability of coverage of public transportation services was compiled specifically for this project. Assets and conditions are discussed above in the inventory. In addition, regular public transportation performance assessments are available for spe-cific areas of Virginia, of which the most comprehensive is the NVTC’s “Annual Transit Performance Update,” the latest of which is for 2003. NVTC’s performance update pro-vides extensive comparative statistics across all the Northern Virginia public transporta-tion systems.
Virginia Department of Rail and Public Transportation Rail, Public Transportation, and TDM Needs Assessment
Cambridge Systematics, Inc. 3-35
Availability or Coverage of Rail and Public Transportation Services
The availability of services or coverage of public transportation considers whether public transportation services are reasonably available to the potential users in a specific geo-graphic area or travel market. The use of local and intercity public transportation services is driven in large measure by the simple fact of whether any such services exist in a par-ticular geographic area. Figure 3.1 above illustrates those counties and independent cities in the Commonwealth that do and do not currently have some form of fixed-route or demand-responsive local public transportation service. This figure also illustrates those portions of the State served by intercity bus and rail services.
In those portions of the State where local transit service is operated, 24 jurisdictions with a total population of about 4.05 million persons are provided with “urban” service, 13 jurisdictions with a total population of about 733,000 persons are provided with “small urban” service, and 51 jurisdictions with a total population of about 1.12 million persons are provided with “rural” type service. In total, about 5.90 million residents of the Commonwealth, about 83 percent of the total State population, live in a jurisdiction with some form of local transit service.
Despite a relatively broad reach across the State, transit service does not exist in a number of jurisdictions, including both rural and relatively urban locations. Examples include rural southwestern and southside Virginia as well as rapidly growing suburban jurisdic-tions in the Richmond and Northern Virginia regions. The absence of local transit service is most pronounced in the southern half of the State. In total, 48 of the Commonwealth’s 136 counties and independent cities, or about 35 percent, currently lack local transit ser-vice. Measured on the basis of total population, these communities represent approxi-mately 1.2 million persons, or about 17 percent of Virginia’s total population in 2000 of about 7.1 million.
Although a large percentage of Virginia residents live in a county with some transit ser-vice, this does not mean that the service is accessible to all of these residents. In many communities, service is relatively limited in both geographic coverage and schedule. Fre-quency of service and magnitude of service in terms of revenue vehicle miles and revenue vehicle hours are also important to measure the level of mobility provided to area residents.
In a number of cases, transit service is provided in independent cities, but not in the sur-rounding county, as in the case of Danville, Winchester, and Petersburg. Similarly, there are a number of communities with significant concentrations of population and govern-mental services such as Hopewell, Lexington/Buena Vista, and Martinsville that do not currently have local transit service. Further, a number of rapidly growing suburban juris-dictions do not currently have local service. Specific examples include Hanover County outside of Richmond, with more than 86,000 residents.
As would be expected, a similarly mixed situation exists at the present time with regard to the availability of intercity bus and rail services. All but one of the State’s largest urban areas is served by Amtrak intercity rail service, the exception being the Roanoke/Salem
Virginia Department of Rail and Public Transportation Rail, Public Transportation, and TDM Needs Assessment
3-36 Cambridge Systematics, Inc.
area. Conversely, virtually all of Virginia’s large and small urban areas have access to intercity bus services, with the most notable exception being the City of Martinsville and surrounding Henry County. Figure 3.2 illustrates the coverage of intercity bus services in the Commonwealth. Intercity bus service provides much more complete east-west and north-south coverage across the State than intercity rail service. There are, however, still some potentially desirable intercity travel patterns that are not currently served. For example, persons residing in the Shenandoah Valley who desire to travel north of Winchester along the I-81 corridor to nearby destinations such as Martinsburg, West Virginia, Hagerstown, Maryland, or Harrisburg, Pennsylvania, are unable to do so directly, and must first travel east to Washington, D.C., to transfer to another bus. Simi-larly, a continuous east-west service is not currently provided along the U.S. Route 58 corridor across the southern tier of Virginia. Thus, to travel the approximately 120 miles between South Boston in Halifax County and Franklin in Southampton County, passen-gers would have to take a rather circuitous path through Richmond or Petersburg in order to reach their desired destinations.
Tables illustrating service quantities and service provided by area are included in the inventory information above. The amount of service provided is shown by revenue vehi-cle miles, revenue vehicle hours, service coverage by time of day, and service levels in relation to population and area. The amount of service is important because the mere existence of service does not provide an adequate measure of the availability of transit or its usefulness as a travel mode. In general, measures of service provided are higher in northern Virginia and in the other large urban areas of Richmond and Hampton Roads.
Assets and Conditions Assessment
Conditions of assets and equipment are measured in terms of the average age of the reve-nue vehicles operated by the State’s transit providers or asset in comparison to its esti-mated useful service life. Despite the age of this data, some conclusions can be drawn from Table 3.8. Overall, there are significant numbers of vehicles past the replacement age in all regions and in all vehicle types. The needs assessment will take account of current activities impacting on these vehicle replacement needs, and will develop estimates of the costs of bringing the vehicle fleet into compliance with the FTA-recommended replace-ment ages and achieving a state of good repair for both vehicles and all other assets.
A number of vehicles are being used past the recommended life cycle recommended by the FTA. Large buses, termed Class A, represent the greatest number of vehicles within this category. More than 400 such buses in Virginia (approximately 21 percent of the 2,045 vehicles in this category) have exceeded the recommended replacement age of 12 years. Also notable is the age of VRE equipment. While the VRE locomotives and passenger cars have been rehabilitated to extend their lives, the replacement age of 25 years is exceeded for all locomotives. VRE has developed a strategic plan, which we have summarized, that deals with these needs in detail.
Virginia Department of Rail and Public Transportation Rail, Public Transportation, and TDM Needs Assessment
Cambridge Systematics, Inc. 3-37
The condition of Virginia’s current transit fleet is similar to that observed nationally. As reported in “Expanded State and Local Transit Investment Analysis,”4 the average age of large transit buses (defined as those with more than 35 seats) was approximately 8.1 years using the FTA’s 2000 NTD information. Of the reported 46,930 vehicles in this fleet cate-gory, about 27 percent were reported as being beyond their useful service life of 12 years.
WMATA’s total rail fleet consists of 764 vehicles, with an average age of 18.1 years. Twenty-six Metrorail vehicles, or about 3.4 percent of the total Metrorail fleet are beyond their assumed useful life of 25 years. By comparison, it was reported in “Expanded State and Local Transit Investment Analysis” that the average age of all 10,260 heavy rail transit vehicles in the United States was approximately 22.9 years. Approximately 48 percent of the vehicles in the nation’s heavy rail fleet in 2000 were reported as being beyond their assumed useful life of 25 years. The rail transit vehicles in the WMATA system are thus considerably newer than those in the majority of the nation’s other heavy rail transit systems.
Performance Measures Assessment
A wide range of performance measures can be estimated through the compilation of available data. Performance measures that are included in the inventory tables are annual passenger miles, annual unlinked passenger trips, and average weekday trips, trends, and operating expenses. Additional performance measures include cost per mile, cost per hour, cost per passenger, passengers per mile, and passengers per hour.
As shown in Table 3.13, across all of the large urban transit systems, the average operating expense for fixed-route bus operations was approximately $7.19 per vehicle revenue mile, and about $86.08 per vehicle revenue hour. Demand-responsive services had an average operating cost of approximately $3.10 per vehicle revenue mile, and about $45.12 per vehicle revenue hour. For small urban, the average operating expense for fixed-route bus operations was approximately $3.28 per vehicle revenue mile, and about $40.94 per vehi-cle revenue hour. Across rural operating systems, fixed-route services had an average operating cost of approximately $1.94 per vehicle revenue mile, and about $30.77 per vehicle revenue hour.
4 “Expanded State and National Transit Investment Analysis,” prepared for American Association
of State Highway and Transportation Officials and the American Public Transportation Association, prepared by Cambridge Systematics, Inc. and KFH Group, Inc., June 2002.
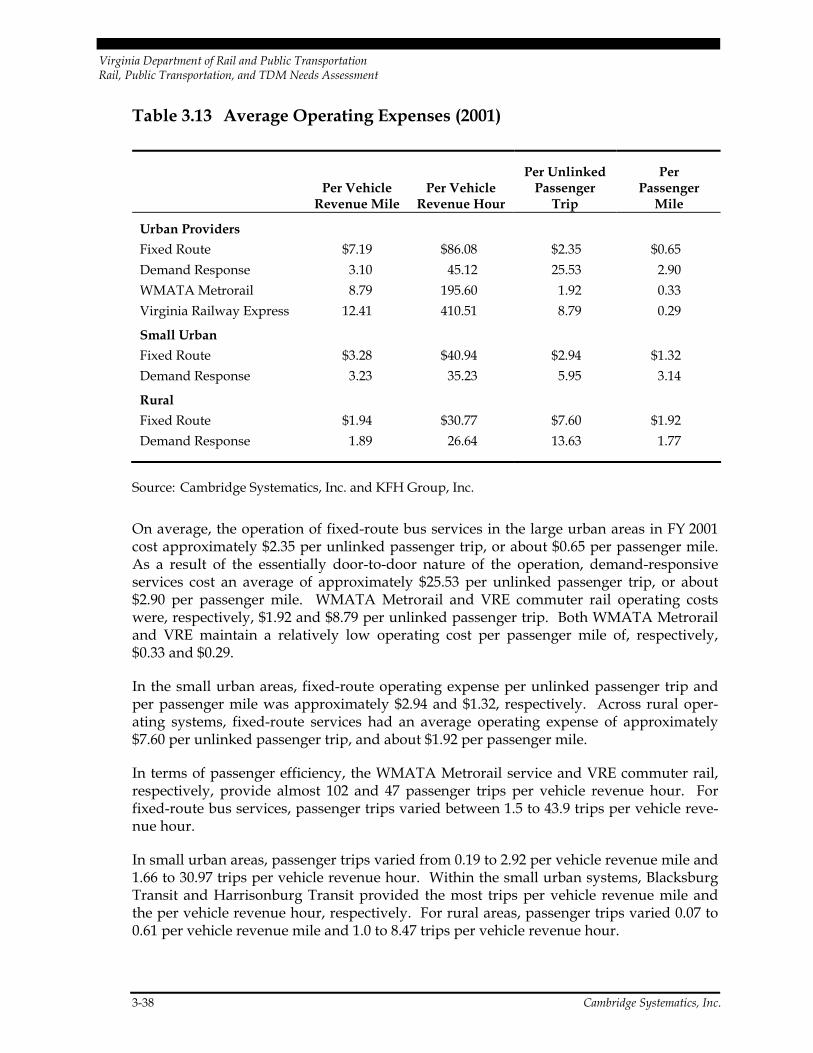
Virginia Department of Rail and Public Transportation Rail, Public Transportation, and TDM Needs Assessment
3-38 Cambridge Systematics, Inc.
Table 3.13 Average Operating Expenses (2001)
Per Vehicle
Revenue Mile Per Vehicle
Revenue Hour
Per Unlinked Passenger
Trip
Per Passenger
Mile
Urban Providers Fixed Route $7.19 $86.08 $2.35 $0.65 Demand Response 3.10 45.12 25.53 2.90 WMATA Metrorail 8.79 195.60 1.92 0.33 Virginia Railway Express 12.41 410.51 8.79 0.29
Small Urban Fixed Route $3.28 $40.94 $2.94 $1.32 Demand Response 3.23 35.23 5.95 3.14
Rural Fixed Route $1.94 $30.77 $7.60 $1.92 Demand Response 1.89 26.64 13.63 1.77
Source: Cambridge Systematics, Inc. and KFH Group, Inc.
On average, the operation of fixed-route bus services in the large urban areas in FY 2001 cost approximately $2.35 per unlinked passenger trip, or about $0.65 per passenger mile. As a result of the essentially door-to-door nature of the operation, demand-responsive services cost an average of approximately $25.53 per unlinked passenger trip, or about $2.90 per passenger mile. WMATA Metrorail and VRE commuter rail operating costs were, respectively, $1.92 and $8.79 per unlinked passenger trip. Both WMATA Metrorail and VRE maintain a relatively low operating cost per passenger mile of, respectively, $0.33 and $0.29.
In the small urban areas, fixed-route operating expense per unlinked passenger trip and per passenger mile was approximately $2.94 and $1.32, respectively. Across rural oper-ating systems, fixed-route services had an average operating expense of approximately $7.60 per unlinked passenger trip, and about $1.92 per passenger mile.
In terms of passenger efficiency, the WMATA Metrorail service and VRE commuter rail, respectively, provide almost 102 and 47 passenger trips per vehicle revenue hour. For fixed-route bus services, passenger trips varied between 1.5 to 43.9 trips per vehicle reve-nue hour.
In small urban areas, passenger trips varied from 0.19 to 2.92 per vehicle revenue mile and 1.66 to 30.97 trips per vehicle revenue hour. Within the small urban systems, Blacksburg Transit and Harrisonburg Transit provided the most trips per vehicle revenue mile and the per vehicle revenue hour, respectively. For rural areas, passenger trips varied 0.07 to 0.61 per vehicle revenue mile and 1.0 to 8.47 trips per vehicle revenue hour.
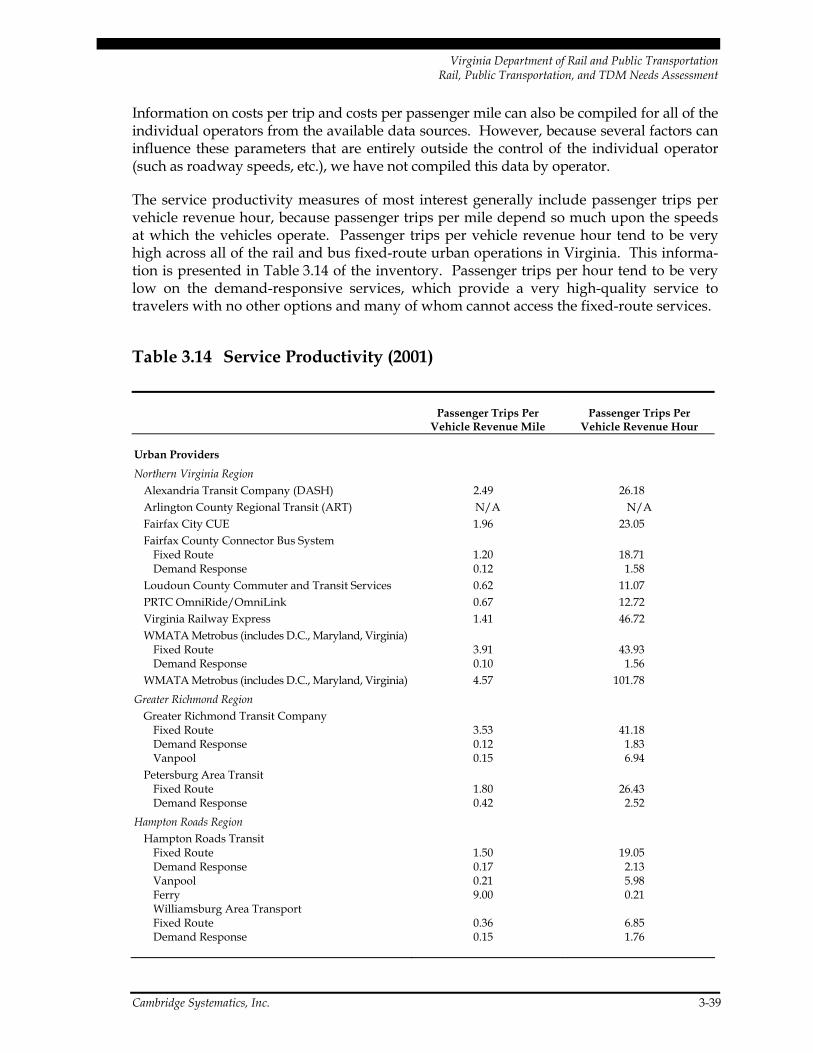
Virginia Department of Rail and Public Transportation Rail, Public Transportation, and TDM Needs Assessment
Cambridge Systematics, Inc. 3-39
Information on costs per trip and costs per passenger mile can also be compiled for all of the individual operators from the available data sources. However, because several factors can influence these parameters that are entirely outside the control of the individual operator (such as roadway speeds, etc.), we have not compiled this data by operator.
The service productivity measures of most interest generally include passenger trips per vehicle revenue hour, because passenger trips per mile depend so much upon the speeds at which the vehicles operate. Passenger trips per vehicle revenue hour tend to be very high across all of the rail and bus fixed-route urban operations in Virginia. This informa-tion is presented in Table 3.14 of the inventory. Passenger trips per hour tend to be very low on the demand-responsive services, which provide a very high-quality service to travelers with no other options and many of whom cannot access the fixed-route services.
Table 3.14 Service Productivity (2001)
Passenger Trips Per
Vehicle Revenue Mile Passenger Trips Per
Vehicle Revenue Hour
Urban Providers Northern Virginia Region
Alexandria Transit Company (DASH) 2.49 26.18 Arlington County Regional Transit (ART) N/A N/A Fairfax City CUE 1.96 23.05 Fairfax County Connector Bus System
Fixed Route 1.20 18.71 Demand Response 0.12 1.58
Loudoun County Commuter and Transit Services 0.62 11.07 PRTC OmniRide/OmniLink 0.67 12.72 Virginia Railway Express 1.41 46.72 WMATA Metrobus (includes D.C., Maryland, Virginia)
Fixed Route 3.91 43.93 Demand Response 0.10 1.56
WMATA Metrobus (includes D.C., Maryland, Virginia) 4.57 101.78 Greater Richmond Region
Greater Richmond Transit Company Fixed Route 3.53 41.18 Demand Response 0.12 1.83 Vanpool 0.15 6.94
Petersburg Area Transit Fixed Route 1.80 26.43 Demand Response 0.42 2.52
Hampton Roads Region Hampton Roads Transit
Fixed Route 1.50 19.05 Demand Response 0.17 2.13 Vanpool 0.21 5.98 Ferry 9.00 0.21 Williamsburg Area Transport Fixed Route 0.36 6.85 Demand Response 0.15 1.76
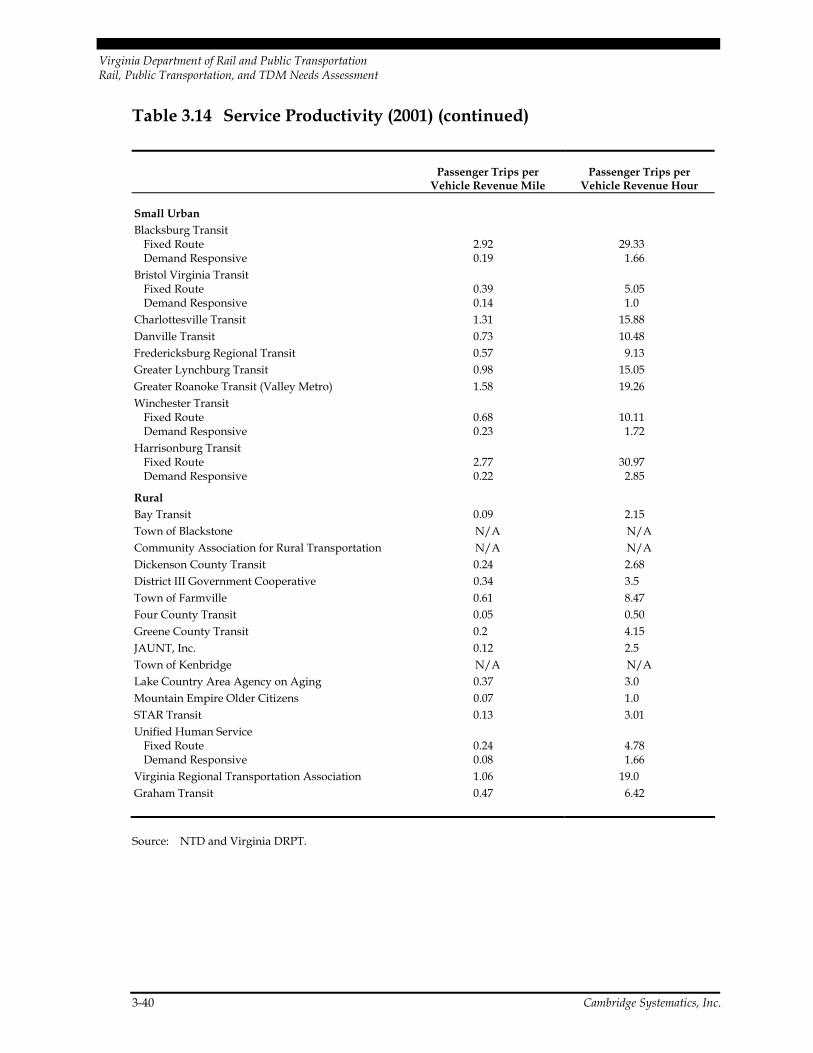
Virginia Department of Rail and Public Transportation Rail, Public Transportation, and TDM Needs Assessment
3-40 Cambridge Systematics, Inc.
Table 3.14 Service Productivity (2001) (continued)
Passenger Trips per
Vehicle Revenue Mile Passenger Trips per
Vehicle Revenue Hour
Small Urban Blacksburg Transit
Fixed Route 2.92 29.33 Demand Responsive 0.19 1.66
Bristol Virginia Transit Fixed Route 0.39 5.05 Demand Responsive 0.14 1.0
Charlottesville Transit 1.31 15.88 Danville Transit 0.73 10.48 Fredericksburg Regional Transit 0.57 9.13 Greater Lynchburg Transit 0.98 15.05 Greater Roanoke Transit (Valley Metro) 1.58 19.26 Winchester Transit
Fixed Route 0.68 10.11 Demand Responsive 0.23 1.72
Harrisonburg Transit Fixed Route 2.77 30.97 Demand Responsive 0.22 2.85
Rural Bay Transit 0.09 2.15 Town of Blackstone N/A N/A Community Association for Rural Transportation N/A N/A Dickenson County Transit 0.24 2.68 District III Government Cooperative 0.34 3.5 Town of Farmville 0.61 8.47 Four County Transit 0.05 0.50 Greene County Transit 0.2 4.15 JAUNT, Inc. 0.12 2.5 Town of Kenbridge N/A N/A Lake Country Area Agency on Aging 0.37 3.0 Mountain Empire Older Citizens 0.07 1.0 STAR Transit 0.13 3.01 Unified Human Service
Fixed Route 0.24 4.78 Demand Responsive 0.08 1.66
Virginia Regional Transportation Association 1.06 19.0 Graham Transit 0.47 6.42
Source: NTD and Virginia DRPT.
Virginia Department of Rail and Public Transportation Rail, Public Transportation, and TDM Needs Assessment
Cambridge Systematics, Inc. 3-41
3.3 Conclusions
Availability is an issue in Virginia for those areas with no public transportation service or low-service levels. The future population, as discussed in Section 2.0, will see more eld-erly, carless households, and other people with mobility needs.
Some the most critical implications of this report are as follows:
• Transit carries more than 160 million trips annually in the Commonwealth of Virginia and accommodates almost one billion person miles of travel, travel that would fall onto the State’s highway system should transit cease to exist;
• The Commonwealth of Virginia offers numerous modes of transit including bus ser-vice, commuter rail service, rail service (Metro), vanpools, and demand responsive;
• Service is provided in numerous jurisdictions across the State, although the level of service varies widely sometimes limited to only demand-responsive service;
• Few transit systems provide Sunday service and a number of systems have limited Saturday and evening service, isolating those who rely on transit service for basic mobility;
• Despite a large proportion of households with limited access to an automobile across the State, many areas still have no transit service available, particularly in rural locations;
• A number of transit systems are facing an aging transit fleet with a significant portion of vehicles that exceed the replacement age recommended by the FTA – an issue chal-lenging transit service providers across the country;
• The vast majority of transit service, transit ridership and funding for transit is found in the largest urban centers in the State, Northern Virginia, Richmond/Petersburg, and Hampton Roads; and
• Limited and incomplete data reporting to Virginia DRPT from transit agencies makes a statewide assessment difficult – annual and timely reporting will better align state-wide funding decisions with a review of existing service availability.
The service assessment thus concludes that options should be examined in which transit plays a more important role in solving the mobility and other challenges facing the Commonwealth. In the needs assessment, transit is evaluated against the future opportu-nities for contributing to the quality of life and the economy of the Commonwealth.

4.0 Statewide Rail and Public Transportation Trends and Forecasts

Virginia Department of Rail and Public Transportation Rail, Public Transportation, and TDM Needs Assessment
Cambridge Systematics, Inc. 4-1
4.0 Statewide Rail and Public Transportation Trends and Forecasts
This section summarizes the key results of previous studies of rail and public transporta-tion ridership forecasts and service needs, and then presents summary trends and fore-casts to guide the definition of long-term needs. The focus of this summary is a description of those short-term and long-range ridership estimates and service require-ments that have been identified in recently completed local and regional transit planning studies across the Commonwealth. While the studies by different agencies have used dif-ferent analysis techniques and different forecast years, these studies provide valuable insights into overall future statewide transit needs and ridership. The trends and forecasts have guided the development of the scenarios that are summarized in the next section.
Section 2.0 discussed how critical factors such as total population growth, the number of persons below the poverty level, the number of persons with disabilities, and the number of persons of age 65 and older are all major indicators of the “need” for future rail, public transportation, and TDM services. Existing long-range regional transportation plans include identified transit investments and expenditures, but these plans are all fiscally constrained, and the actual needs for rail and public transportation improvements are not necessarily fully addressed. Additional planning studies have been conducted, however, that illuminate some aspects of needs and future ridership.
4.1 Previous Studies
The studies that have been conducted by the regional public transportation operators have focused on assessments of long-term needs and future ridership, and many are supportive of transit ridership forecasts growing by up to 100 percent in the forecast period through 2030. These efforts have also identified the capital and operating investments needed to accommodate the ridership forecasts.
Virginia Department of Rail and Public Transportation Rail, Public Transportation, and TDM Needs Assessment
4-2 Cambridge Systematics, Inc.
Northern Virginia Region
Beginning in 2000, the WMATA conducted a comprehensive Regional Bus Study that encompassed all of its existing service area in the District of Columbia, suburban Maryland, and Northern Virginia. This assessment included an examination of both WMATA-operated and local jurisdiction-operated bus services, and responded to the goal set by the WMATA Board of Directors in 1999 of doubling the number of transit riders on the bus and rail systems between 2000 and 2025.
The Regional Bus Study Final Report1 divided the Washington metropolitan area into five subregions for analysis purposes, two of which are in Northern Virginia: Fairfax and Loudoun Counties and the City of Fairfax (referred to as “Outer Virginia”); and Arlington County and the Cities of Alexandria and Falls Church (referred to as “Inner Virginia”). Existing WMATA and local jurisdiction bus routes were evaluated using a set of measures that included hours of service, frequency, travel time, crowding, productivity (passengers carried per hour of service provided), and reliability. Areas with poor service or no ser-vice were also identified.
The overall recommendations of the Regional Bus Study are based upon serving the needs of the region by what is termed a “Family of Services” concept. As described in the Regional Bus Study, “This concept anticipates a hierarchy of services ranging from more flexible, demand-responsive neighborhood service using smaller vehicles to a network of high-performance services using larger buses. The latter would operate on streets that would give buses priority, with some traveling in dedicated lanes. Vehicle types would vary with the need and service area charac-teristics.”2 The Regional Bus Study presents a series of recommendations that would be implemented in two phases: Near Term (from 2004 to 2010) and Long Term (from 2011 to 2025).
It was estimated in the Regional Bus Study that the implementation of the recommenda-tions contained in the Draft Operating Plan would have the following benefits and impacts3:
• Enhanced service quality for current customers.
• Introduction of new services to attract new riders and serve growing activity centers.
• Improvement to cross-county service and connections between counties.
1 Regional Bus Study, Draft Final Report – Deliverable E, Prepared by Multisystems, Inc. for the
Washington Metropolitan Area Transit Authority, September 2002. 2 Ibid, page iii. 3 Ibid, page x.
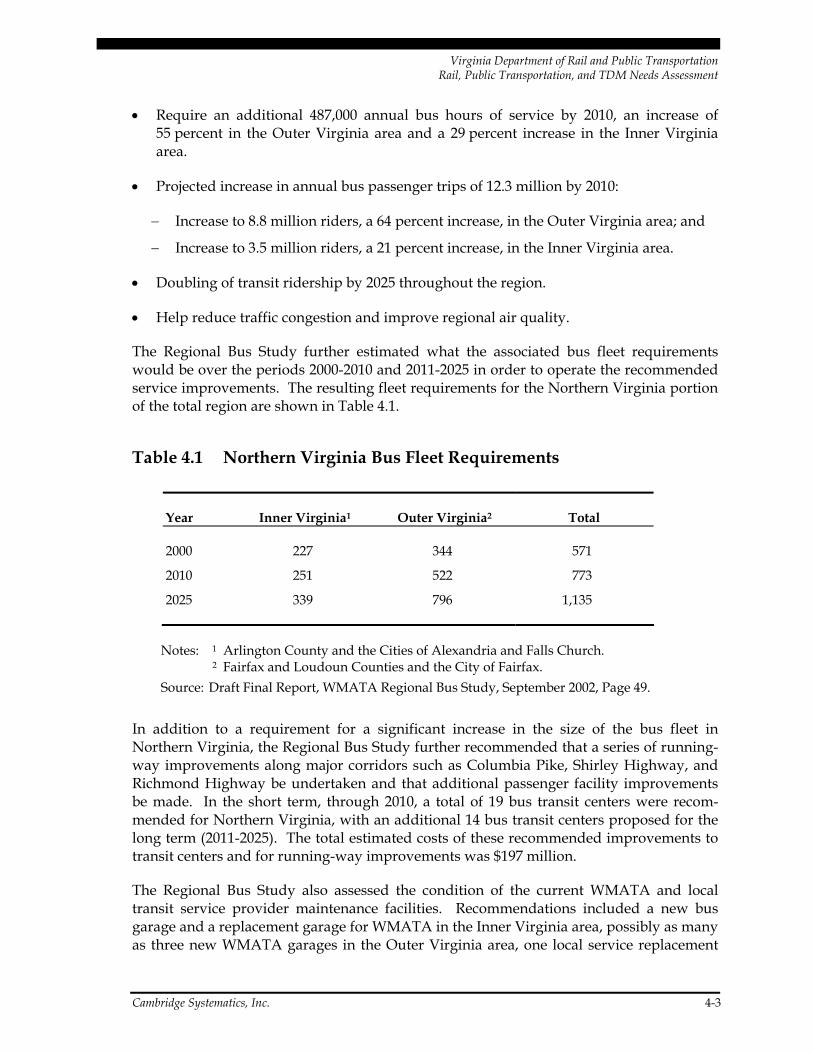
Virginia Department of Rail and Public Transportation Rail, Public Transportation, and TDM Needs Assessment
Cambridge Systematics, Inc. 4-3
• Require an additional 487,000 annual bus hours of service by 2010, an increase of 55 percent in the Outer Virginia area and a 29 percent increase in the Inner Virginia area.
• Projected increase in annual bus passenger trips of 12.3 million by 2010:
− Increase to 8.8 million riders, a 64 percent increase, in the Outer Virginia area; and
− Increase to 3.5 million riders, a 21 percent increase, in the Inner Virginia area.
• Doubling of transit ridership by 2025 throughout the region.
• Help reduce traffic congestion and improve regional air quality.
The Regional Bus Study further estimated what the associated bus fleet requirements would be over the periods 2000-2010 and 2011-2025 in order to operate the recommended service improvements. The resulting fleet requirements for the Northern Virginia portion of the total region are shown in Table 4.1.
Table 4.1 Northern Virginia Bus Fleet Requirements
Year Inner Virginia1 Outer Virginia2 Total
2000 227 344 571
2010 251 522 773
2025 339 796 1,135
Notes: 1 Arlington County and the Cities of Alexandria and Falls Church. 2 Fairfax and Loudoun Counties and the City of Fairfax. Source: Draft Final Report, WMATA Regional Bus Study, September 2002, Page 49.
In addition to a requirement for a significant increase in the size of the bus fleet in Northern Virginia, the Regional Bus Study further recommended that a series of running-way improvements along major corridors such as Columbia Pike, Shirley Highway, and Richmond Highway be undertaken and that additional passenger facility improvements be made. In the short term, through 2010, a total of 19 bus transit centers were recom-mended for Northern Virginia, with an additional 14 bus transit centers proposed for the long term (2011-2025). The total estimated costs of these recommended improvements to transit centers and for running-way improvements was $197 million.
The Regional Bus Study also assessed the condition of the current WMATA and local transit service provider maintenance facilities. Recommendations included a new bus garage and a replacement garage for WMATA in the Inner Virginia area, possibly as many as three new WMATA garages in the Outer Virginia area, one local service replacement
Virginia Department of Rail and Public Transportation Rail, Public Transportation, and TDM Needs Assessment
4-4 Cambridge Systematics, Inc.
garage in Inner Virginia, and a new local service garage in Outer Virginia. The total addi-tional bus vehicle maintenance capacity associated with these planned garages would be approximately 250 vehicles in Inner Virginia and about 400 vehicles in Outer Virginia.
Following up on the Regional Bus Study, WMATA staff undertook an effort to integrate the agency’s individually prepared Infrastructure Renewal, Core Capacity, Regional Bus, and System Expansion Plans. The results of this effort are contained in WMATA’s 10-Year Capital Improvement Program.4 While this document discusses proposed system-wide investments and expenditures from FY 2004 through FY 2013 for items such as the acquisition of 300 new Metrorail cars, several Northern Virginia-specific activities are identified. These include the following:
• Metrorail maintenance facility improvements at West Falls Church ($77.0 million) and Alexandria ($46.2 million).
• Bicycle and pedestrian access enhancements at the Ballston, Franconia/Springfield, Vienna, West Falls Church, Van Dorn, Eisenhower Avenue, Pentagon City, and Dunn Loring Metrorail stations.
• Construction of a new, 125-space Metrobus maintenance facility in Western Fairfax County ($42.8 million).
• Relocation/replacement of the existing Royal Street Division Metrobus maintenance facility to provide a 125-space operation ($46.1 million).
• Construction of a new 100-space Fairfax County bus maintenance facility ($36.9 million).
• Running-way corridor improvements along the Columbia Pike, Route 7, Route 50, and Route 1 corridors (total estimated cost of approximately $9.3 million for 28.7 miles of corridor with 162 individual stop improvements).
The WMATA CIP includes these access and capacity and system expansion projects within the system access and capacity program5:
• “2006: rail to Tyson’s (Corner) and Blue Line reconfiguration to divert one-half of the Blue Line trains across the Yellow Line bridge through L’Enfant Plaza rather than Rosslyn, to accommodate additional Orange Line trains from Tyson’s (and from Dulles/Loudoun County by 2010).
• “2010: rail to Dulles/Loudoun County.” 4 Washington Metropolitan Area Transit Authority, 10-Year Capital Improvement Program,
September 12, 2002. 5 Washington Metropolitan Area Transit Authority, 10-Year Capital Improvement Program,
September 12, 2002, op.cit, page 44.
Virginia Department of Rail and Public Transportation Rail, Public Transportation, and TDM Needs Assessment
Cambridge Systematics, Inc. 4-5
• The addition of spaces at Metrorail station parking garages ($36.9 million).
• Direct Express Service:
− Fairfax County Government Center to Union Station – 2,430 AM peak-period riders.
− Vienna Metrorail to Crystal City – 740 AM peak-period riders.
− Reston/Herndon to Union Station – 750 AM peak-period riders.
− West Falls Church Metrorail to Union Station – 1,310 AM peak-period riders.
− Franconia/Springfield to Farragut Square – 550 AM peak-period riders.
• Local and regionally funded suburban park-and-ride lots (675 additional spaces) and bus transit center facility improvements – 20 separate locations ($20.9 million).
The System Access and Capacity Plan (SAP) also identified the following potential fixed-guideway elements in Northern Virginia at the direction of the compact jurisdictions:
• Columbia Pike/Route 7/Route 50 – Under study for potential trolley/exclusive busway improvements ($100.0 million).
• Route 1 (Jefferson Davis Highway) – Under study for potential trolley/exclusive busway improvements ($75.0 million).
• Route 1 (Richmond Highway) – Initial feasibility study conducted for exclusive busway from Fort Belvoir to Huntington Metrorail Station ($49.8 million).
• I-495 – Priority bus access improvements at Braddock Road, Little River Turnpike, and Route 7 ($45.0 million).
• Shirley Highway (I-95/I-395) – HOV/RapidBus access improvements ($30.0 million).
The final element of WMATA’s CIP is the System Expansion Program (SEP). The specific Virginia expansion projects identified in this portion of the WMATA CIP are as follows:
• Dulles Corridor Rapid Transit Project (24 miles).
• Potomac Yard-Crystal City/Columbia Pike-Baileys Crossroads (9.8 miles).
• I-66 Multimodal Transportation and Environmental Study (10.0 miles).
• Route 1 – Fort Belvoir to Huntington Metrorail Station (7.7 miles).
The current capital cost of these four Virginia expansion projects totaling approximately 51.5 miles in length, was estimated to be approximately $2.0 billion ($FY 2002); however, these costs have been updated and the Dulles project costs ($2.7 billion in 2003 dollars) have been included in the 2003 regional Constrained Long-Range Plan (CLRP).
Virginia Department of Rail and Public Transportation Rail, Public Transportation, and TDM Needs Assessment
4-6 Cambridge Systematics, Inc.
In 2002, the Loudoun County Office of Transportation Services completed the Loudoun County Public Transportation Study.6 This study presented a 10-year transit service improvement plan for Loudoun County. The major recommendations of this plan included:
• Initiation of a five-route, local bus system in eastern Loudoun County, with 68,600 annual vehicle hours of service, and a first year ridership of 324,000.
• With the Dulles Corridor Rapid Transit Project, an initial nine vehicles would provide BRT feeder service into Loudoun County, growing to 14 vehicles by 2012.
• Commuter bus service would be expanded from 12 peak-period vehicles in 2002 to 20 peak-period vehicles by 2004 and about 25 vehicles by 2012, with 2010 annual rider-ship on the Loudoun County to Arlington/Washington service of 489,000, and 100,000 on the Loudoun/Fairfax service.
• Rural service in the western portions of the County would continue as curb-to-curb paratransit with eight vehicles initially, growing to about 15 vehicles by 2012.
• Ridesharing and vanpooling are to be emphasized for areas in the more rural western parts of the County that may not be able to initially support fixed-route commuter service.
Another important transit service provider in the Northern Virginia region is the VRE. VRE issued its Phase 1 Strategic Plan in June 2002 outlining a strategy to respond to con-tinuing passenger growth through 2010.7 The VRE Phase 1 Strategic Plan employed a short-term planning target for 2010 of 18,000 daily trips, an increase on the order of 50 percent from the current ridership of between 12,000 and 13,000 passenger trips on a typical midweek day. VRE currently operates two commuter rail lines serving eight Northern Virginia jurisdictions, stopping at 18 stations and covering 80 route miles. The system’s 11 trainsets currently provide 32 daily trips. The total capital costs needed for the 2010 50 percent ridership growth were estimated in the range of $261 million to $410 million (in 2000 $).
6 Loudoun County Public Transportation Study, Prepared by KFH Group, Inc. and Cambridge
Systematics, Inc. for Loudoun County, Virginia, June 2002. 7 Virginia Railway Express – Phase 1 Strategic Plan, prepared by Parsons Brinckerhoff Quade &
Douglas, Inc. for the Virginia Railway Express, June 2002.
Virginia Department of Rail and Public Transportation Rail, Public Transportation, and TDM Needs Assessment
Cambridge Systematics, Inc. 4-7
Richmond Region
The two primary transit service providers in the Richmond Region are GRTC and the Petersburg Area Transit (PAT). GRTC’s COA was completed in April 20018 and a transit development program for the period 2002-2006 was recently issued by GRTC.9 The COA recommended a series of service changes for the GRTC system, including:
• Enhanced service (typically greater frequency and span of service) on three currently productive routes.
• Improved efficiency (elimination of redundant coverage or outright termination) for four underperforming routes.
• Provision of new access to currently unserved areas by rerouting or initiation of five routes.
• Creation of four new cross-town routes to provide improved coverage and expanded transfer opportunities.
• Construction of a downtown transit transfer center along Grace Street between 7th and 8th Streets in downtown Richmond.
• Construction of four suburban, satellite transfer centers at the Willow Lawn, Southside Plaza, Azalea Mall, and Regency Square shopping centers.
• Other service expansion potentials beyond the current GRTC service area.
The COA included a “Vision Plan” for GRTC that outlined a series of service improve-ments that might be implemented over the next 15 to 20 years:
• Fixed-Route Bus Network – extensions to existing routes, new/expanded circulator or feeder services, new/expanded cross-town connections, and new/expanded express bus routes.
• Bus Rapid Transit (BRT):
− Along the Broad Street Corridor from Downtown Richmond into Henrico County (by 2005) – estimated cost of $94 million to $142 million.
− Along the Midlothian Turnpike Corridor from Downtown Richmond into Chesterfield County (by 2010) – estimated cost of $90 million to $134 million.
8 Greater Richmond Transit Company, Comprehensive Operational Analysis, prepared by
Urbitran Associates, Inc., April 2001. 9 Greater Richmond Transit Company, Transit Development Program 2002-2006, May 2003.
Virginia Department of Rail and Public Transportation Rail, Public Transportation, and TDM Needs Assessment
4-8 Cambridge Systematics, Inc.
• Light Rail Transit (LRT) (to be implemented to replace BRT operations):
− Broad Street Corridor LRT (by 2010) – estimated cost of $320 million.
− Midlothian Turnpike Corridor LRT (by 2015) – estimated cost of $145 million.
• Regional Commuter Rail Service, based on the MPO regional transportation vision plan (implementation period 2015 to 2025) – estimated cost $19 million.
GRTC also recently completed its 2002-2006 Transit Development Program. This docu-ment outlines the five-year capital improvements and service program for FY 2002 through 2006, and further details the recommendations contained in the recently com-pleted COA. Over the period of FY 2002 to FY 2006, GRTC anticipates that ridership on its fixed-route bus system will increase from about 9.78 million passengers in FY 2002 to about 10.14 million passengers in FY 2006. This represents a projected increase of approximately 3.7 percent over this time period. GRTC anticipates a continuing program of capital improvements over this period, both to replace older vehicles and maintain the existing system infrastructure and to expand service as recommended by the COA, and totaling $50.74 million.
PAT operates transit service within the City of Petersburg and the adjoining community of Ettrick in Chesterfield County. The most recent TDP for the agency was published in July 1999.10 The more recently prepared Year 2023 Long-Range Transportation Plan for the Tri-Cities Area prepared by the Crater PDC in January 2001 incorporates the 1999 TDP by reference.
The TDP reported that annual ridership on the PAT system during calendar year 1998 was 630,977 passengers. Although ridership forecasts were not explicitly included in the TDP, fare revenue was projected to increase from approximately $293,500 in FY 2000 to approximately $408,400 in FY 2006. With the average fare per passenger and the overall service levels reported to remain essentially constant over this period, it appears that the TDP assumed an expectation of annual ridership increases totaling about 39 percent over the period from FY 2000 through FY 2006.
The Tri-Cities Area Year 2023 Long-Range Transportation Plan incorporates the 1999 PAT TDP and takes note of the proposals developed by GRTC for two route expansion propos-als that would serve portions of the Tri-Cities Area from the Richmond area immediately to the north along the Route 1 corridor.
10 City of Petersburg, Transit Development Program – Final Report, prepared by Weslin Consulting
Services, Inc., July 1999.
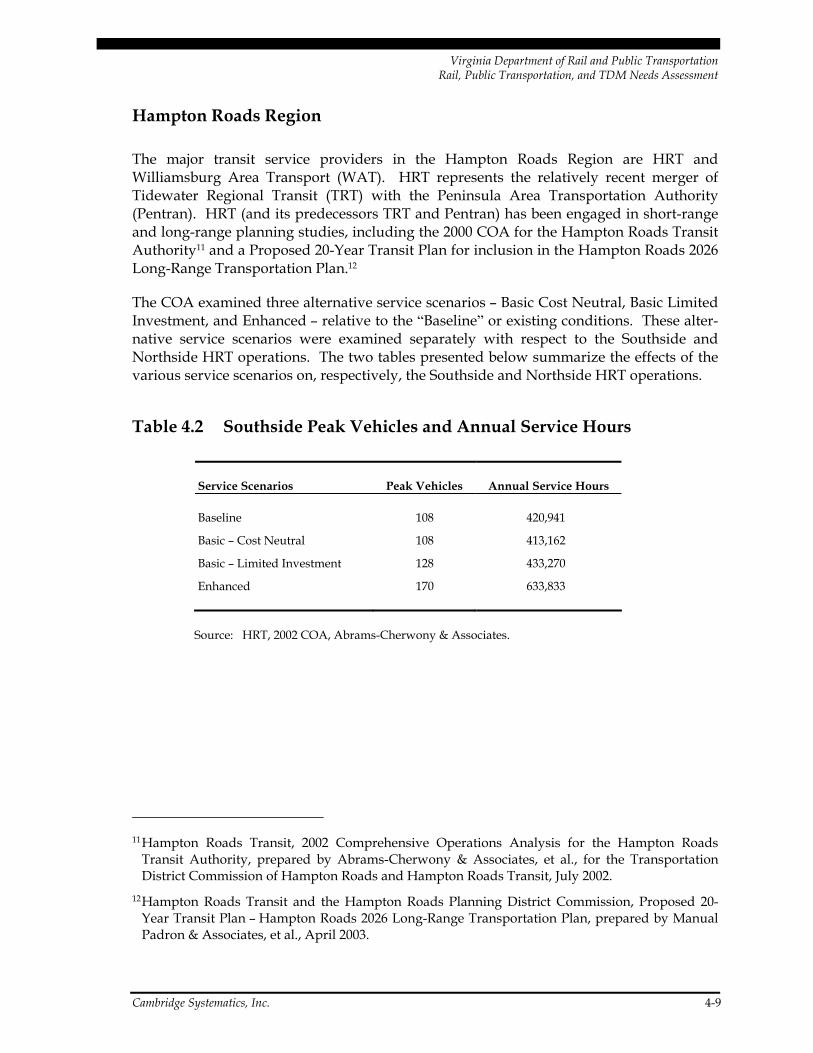
Virginia Department of Rail and Public Transportation Rail, Public Transportation, and TDM Needs Assessment
Cambridge Systematics, Inc. 4-9
Hampton Roads Region
The major transit service providers in the Hampton Roads Region are HRT and Williamsburg Area Transport (WAT). HRT represents the relatively recent merger of Tidewater Regional Transit (TRT) with the Peninsula Area Transportation Authority (Pentran). HRT (and its predecessors TRT and Pentran) has been engaged in short-range and long-range planning studies, including the 2000 COA for the Hampton Roads Transit Authority11 and a Proposed 20-Year Transit Plan for inclusion in the Hampton Roads 2026 Long-Range Transportation Plan.12
The COA examined three alternative service scenarios – Basic Cost Neutral, Basic Limited Investment, and Enhanced – relative to the “Baseline” or existing conditions. These alter-native service scenarios were examined separately with respect to the Southside and Northside HRT operations. The two tables presented below summarize the effects of the various service scenarios on, respectively, the Southside and Northside HRT operations.
Table 4.2 Southside Peak Vehicles and Annual Service Hours
Service Scenarios Peak Vehicles Annual Service Hours
Baseline 108 420,941
Basic – Cost Neutral 108 413,162
Basic – Limited Investment 128 433,270
Enhanced 170 633,833
Source: HRT, 2002 COA, Abrams-Cherwony & Associates.
11 Hampton Roads Transit, 2002 Comprehensive Operations Analysis for the Hampton Roads
Transit Authority, prepared by Abrams-Cherwony & Associates, et al., for the Transportation District Commission of Hampton Roads and Hampton Roads Transit, July 2002.
12 Hampton Roads Transit and the Hampton Roads Planning District Commission, Proposed 20-Year Transit Plan – Hampton Roads 2026 Long-Range Transportation Plan, prepared by Manual Padron & Associates, et al., April 2003.
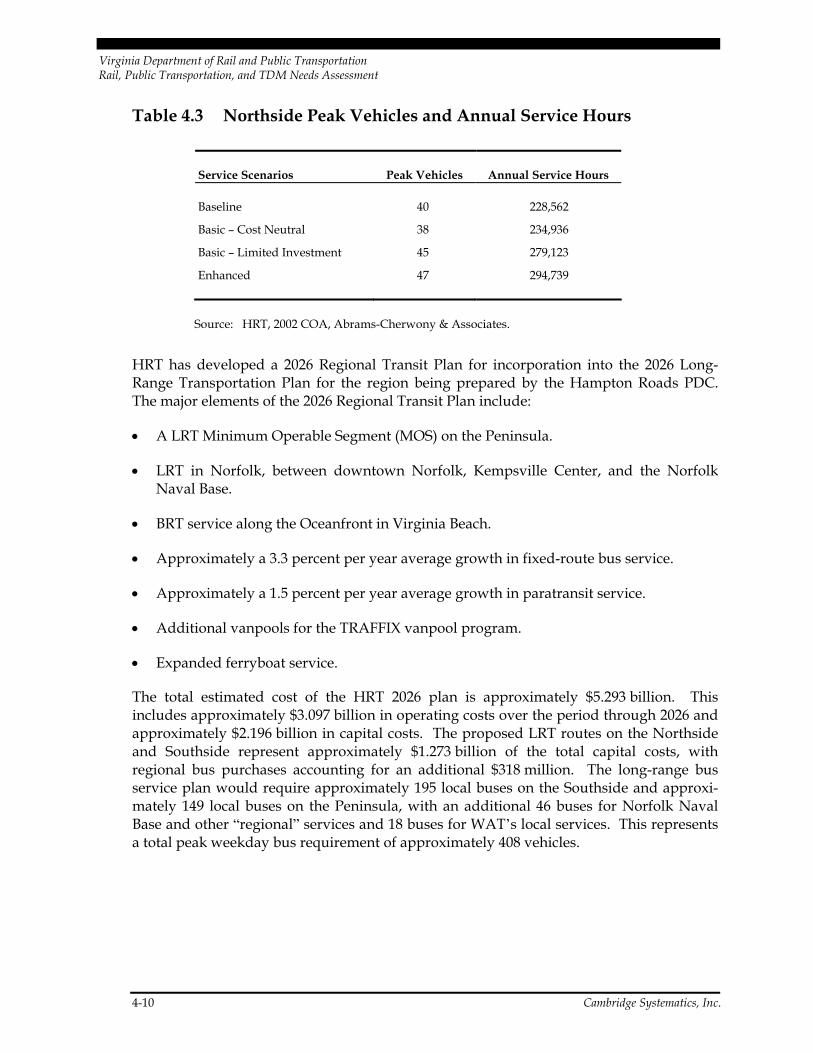
Virginia Department of Rail and Public Transportation Rail, Public Transportation, and TDM Needs Assessment
4-10 Cambridge Systematics, Inc.
Table 4.3 Northside Peak Vehicles and Annual Service Hours
Service Scenarios Peak Vehicles Annual Service Hours
Baseline 40 228,562
Basic – Cost Neutral 38 234,936
Basic – Limited Investment 45 279,123
Enhanced 47 294,739
Source: HRT, 2002 COA, Abrams-Cherwony & Associates.
HRT has developed a 2026 Regional Transit Plan for incorporation into the 2026 Long-Range Transportation Plan for the region being prepared by the Hampton Roads PDC. The major elements of the 2026 Regional Transit Plan include:
• A LRT Minimum Operable Segment (MOS) on the Peninsula.
• LRT in Norfolk, between downtown Norfolk, Kempsville Center, and the Norfolk Naval Base.
• BRT service along the Oceanfront in Virginia Beach.
• Approximately a 3.3 percent per year average growth in fixed-route bus service.
• Approximately a 1.5 percent per year average growth in paratransit service.
• Additional vanpools for the TRAFFIX vanpool program.
• Expanded ferryboat service.
The total estimated cost of the HRT 2026 plan is approximately $5.293 billion. This includes approximately $3.097 billion in operating costs over the period through 2026 and approximately $2.196 billion in capital costs. The proposed LRT routes on the Northside and Southside represent approximately $1.273 billion of the total capital costs, with regional bus purchases accounting for an additional $318 million. The long-range bus service plan would require approximately 195 local buses on the Southside and approxi-mately 149 local buses on the Peninsula, with an additional 46 buses for Norfolk Naval Base and other “regional” services and 18 buses for WAT’s local services. This represents a total peak weekday bus requirement of approximately 408 vehicles.
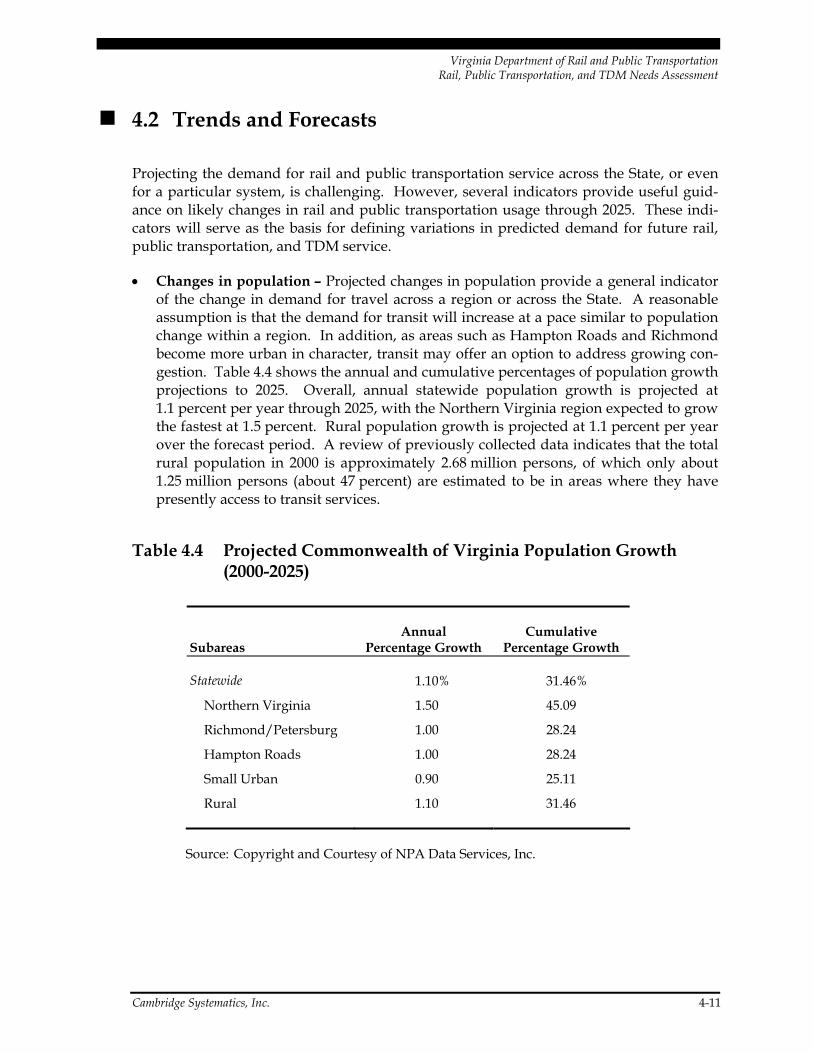
Virginia Department of Rail and Public Transportation Rail, Public Transportation, and TDM Needs Assessment
Cambridge Systematics, Inc. 4-11
4.2 Trends and Forecasts
Projecting the demand for rail and public transportation service across the State, or even for a particular system, is challenging. However, several indicators provide useful guid-ance on likely changes in rail and public transportation usage through 2025. These indi-cators will serve as the basis for defining variations in predicted demand for future rail, public transportation, and TDM service.
• Changes in population – Projected changes in population provide a general indicator of the change in demand for travel across a region or across the State. A reasonable assumption is that the demand for transit will increase at a pace similar to population change within a region. In addition, as areas such as Hampton Roads and Richmond become more urban in character, transit may offer an option to address growing con-gestion. Table 4.4 shows the annual and cumulative percentages of population growth projections to 2025. Overall, annual statewide population growth is projected at 1.1 percent per year through 2025, with the Northern Virginia region expected to grow the fastest at 1.5 percent. Rural population growth is projected at 1.1 percent per year over the forecast period. A review of previously collected data indicates that the total rural population in 2000 is approximately 2.68 million persons, of which only about 1.25 million persons (about 47 percent) are estimated to be in areas where they have presently access to transit services.
Table 4.4 Projected Commonwealth of Virginia Population Growth (2000-2025)
Subareas Annual
Percentage Growth Cumulative
Percentage Growth
Statewide 1.10% 31.46%
Northern Virginia 1.50 45.09
Richmond/Petersburg 1.00 28.24
Hampton Roads 1.00 28.24
Small Urban 0.90 25.11
Rural 1.10 31.46
Source: Copyright and Courtesy of NPA Data Services, Inc.
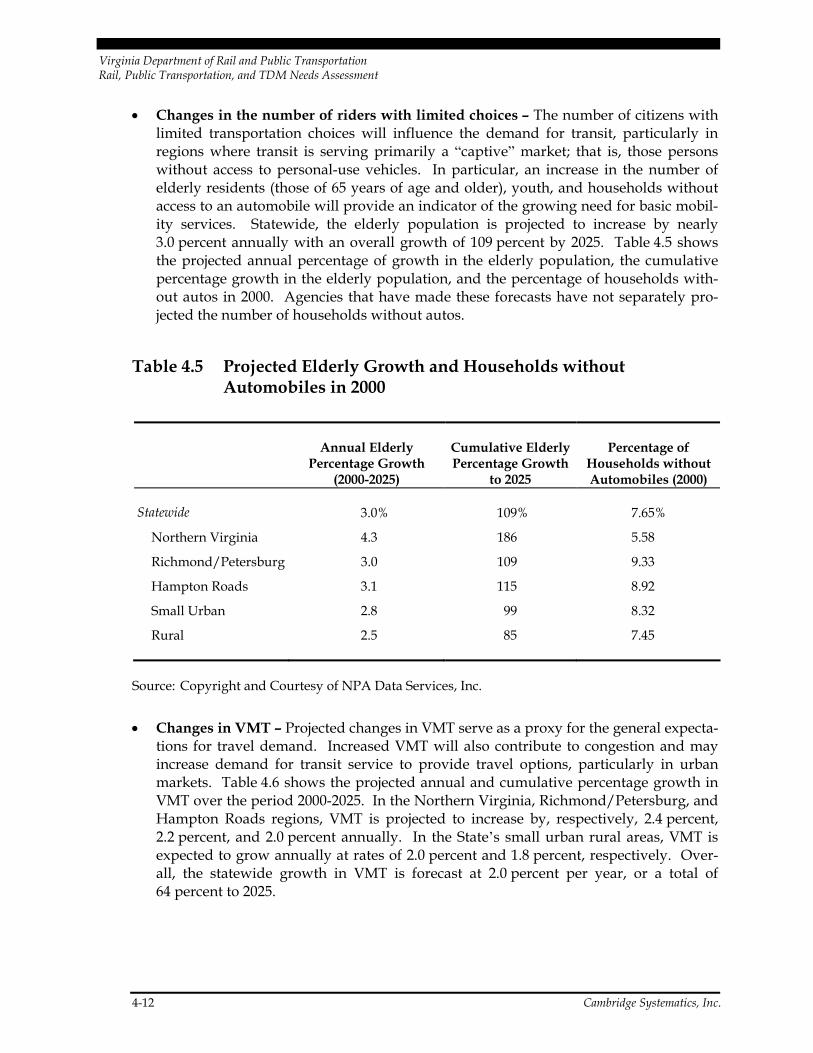
Virginia Department of Rail and Public Transportation Rail, Public Transportation, and TDM Needs Assessment
4-12 Cambridge Systematics, Inc.
• Changes in the number of riders with limited choices – The number of citizens with limited transportation choices will influence the demand for transit, particularly in regions where transit is serving primarily a “captive” market; that is, those persons without access to personal-use vehicles. In particular, an increase in the number of elderly residents (those of 65 years of age and older), youth, and households without access to an automobile will provide an indicator of the growing need for basic mobil-ity services. Statewide, the elderly population is projected to increase by nearly 3.0 percent annually with an overall growth of 109 percent by 2025. Table 4.5 shows the projected annual percentage of growth in the elderly population, the cumulative percentage growth in the elderly population, and the percentage of households with-out autos in 2000. Agencies that have made these forecasts have not separately pro-jected the number of households without autos.
Table 4.5 Projected Elderly Growth and Households without Automobiles in 2000
Annual Elderly Percentage Growth
(2000-2025)
Cumulative Elderly Percentage Growth
to 2025
Percentage of Households without Automobiles (2000)
Statewide 3.0% 109% 7.65%
Northern Virginia 4.3 186 5.58
Richmond/Petersburg 3.0 109 9.33
Hampton Roads 3.1 115 8.92
Small Urban 2.8 99 8.32
Rural 2.5 85 7.45
Source: Copyright and Courtesy of NPA Data Services, Inc.
• Changes in VMT – Projected changes in VMT serve as a proxy for the general expecta-tions for travel demand. Increased VMT will also contribute to congestion and may increase demand for transit service to provide travel options, particularly in urban markets. Table 4.6 shows the projected annual and cumulative percentage growth in VMT over the period 2000-2025. In the Northern Virginia, Richmond/Petersburg, and Hampton Roads regions, VMT is projected to increase by, respectively, 2.4 percent, 2.2 percent, and 2.0 percent annually. In the State’s small urban rural areas, VMT is expected to grow annually at rates of 2.0 percent and 1.8 percent, respectively. Over-all, the statewide growth in VMT is forecast at 2.0 percent per year, or a total of 64 percent to 2025.
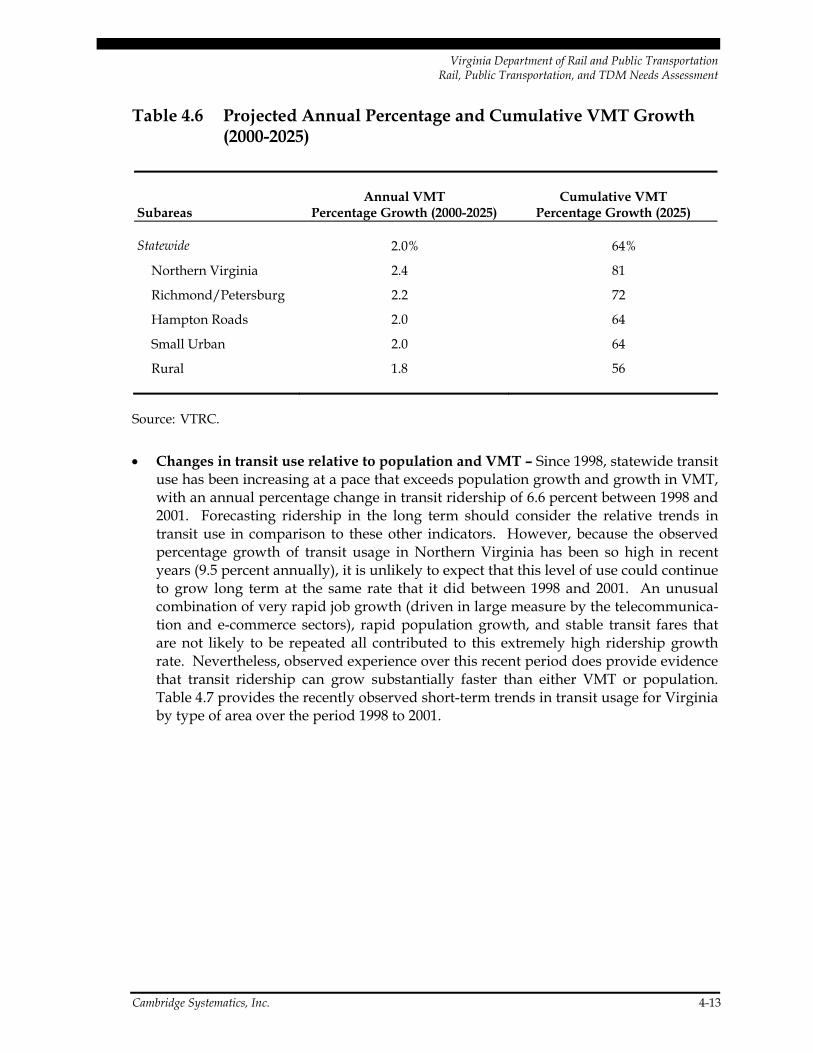
Virginia Department of Rail and Public Transportation Rail, Public Transportation, and TDM Needs Assessment
Cambridge Systematics, Inc. 4-13
Table 4.6 Projected Annual Percentage and Cumulative VMT Growth (2000-2025)
Subareas Annual VMT
Percentage Growth (2000-2025) Cumulative VMT
Percentage Growth (2025)
Statewide 2.0% 64%
Northern Virginia 2.4 81
Richmond/Petersburg 2.2 72
Hampton Roads 2.0 64
Small Urban 2.0 64
Rural 1.8 56
Source: VTRC.
• Changes in transit use relative to population and VMT – Since 1998, statewide transit use has been increasing at a pace that exceeds population growth and growth in VMT, with an annual percentage change in transit ridership of 6.6 percent between 1998 and 2001. Forecasting ridership in the long term should consider the relative trends in transit use in comparison to these other indicators. However, because the observed percentage growth of transit usage in Northern Virginia has been so high in recent years (9.5 percent annually), it is unlikely to expect that this level of use could continue to grow long term at the same rate that it did between 1998 and 2001. An unusual combination of very rapid job growth (driven in large measure by the telecommunica-tion and e-commerce sectors), rapid population growth, and stable transit fares that are not likely to be repeated all contributed to this extremely high ridership growth rate. Nevertheless, observed experience over this recent period does provide evidence that transit ridership can grow substantially faster than either VMT or population. Table 4.7 provides the recently observed short-term trends in transit usage for Virginia by type of area over the period 1998 to 2001.
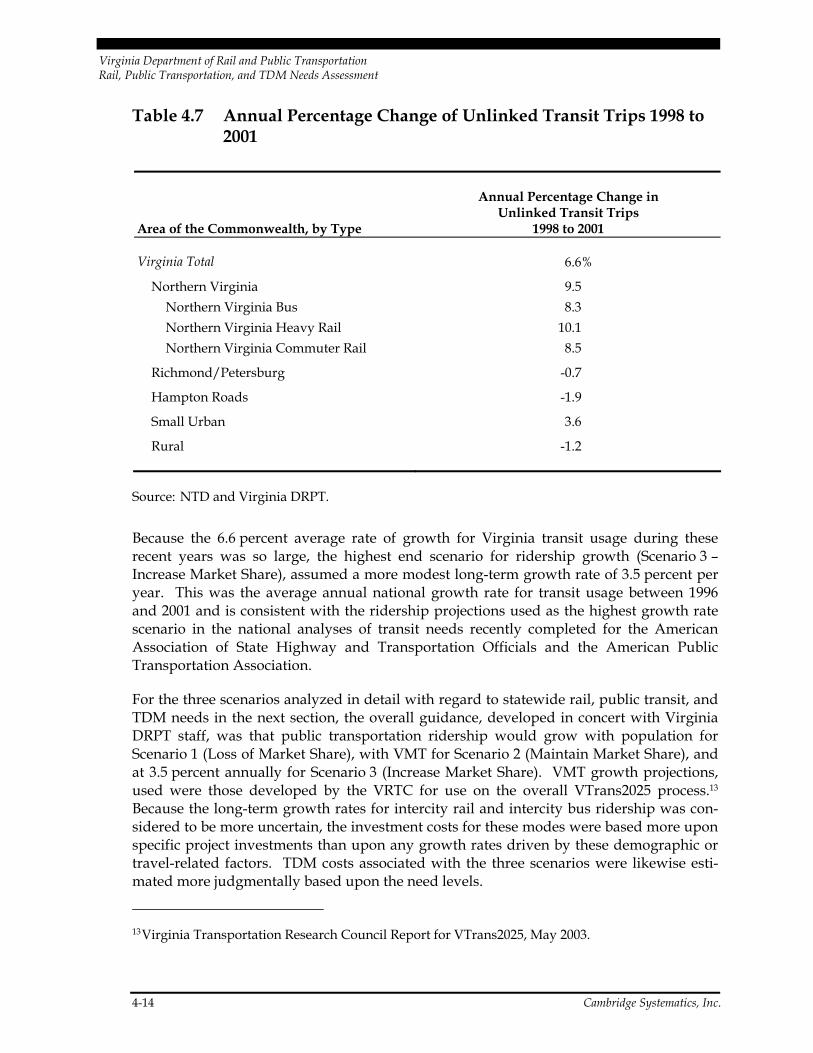
Virginia Department of Rail and Public Transportation Rail, Public Transportation, and TDM Needs Assessment
4-14 Cambridge Systematics, Inc.
Table 4.7 Annual Percentage Change of Unlinked Transit Trips 1998 to 2001
Area of the Commonwealth, by Type
Annual Percentage Change in Unlinked Transit Trips
1998 to 2001
Virginia Total 6.6%
Northern Virginia 9.5 Northern Virginia Bus 8.3 Northern Virginia Heavy Rail 10.1 Northern Virginia Commuter Rail 8.5
Richmond/Petersburg -0.7
Hampton Roads -1.9
Small Urban 3.6
Rural -1.2
Source: NTD and Virginia DRPT.
Because the 6.6 percent average rate of growth for Virginia transit usage during these recent years was so large, the highest end scenario for ridership growth (Scenario 3 – Increase Market Share), assumed a more modest long-term growth rate of 3.5 percent per year. This was the average annual national growth rate for transit usage between 1996 and 2001 and is consistent with the ridership projections used as the highest growth rate scenario in the national analyses of transit needs recently completed for the American Association of State Highway and Transportation Officials and the American Public Transportation Association.
For the three scenarios analyzed in detail with regard to statewide rail, public transit, and TDM needs in the next section, the overall guidance, developed in concert with Virginia DRPT staff, was that public transportation ridership would grow with population for Scenario 1 (Loss of Market Share), with VMT for Scenario 2 (Maintain Market Share), and at 3.5 percent annually for Scenario 3 (Increase Market Share). VMT growth projections, used were those developed by the VRTC for use on the overall VTrans2025 process.13 Because the long-term growth rates for intercity rail and intercity bus ridership was con-sidered to be more uncertain, the investment costs for these modes were based more upon specific project investments than upon any growth rates driven by these demographic or travel-related factors. TDM costs associated with the three scenarios were likewise esti-mated more judgmentally based upon the need levels.
13 Virginia Transportation Research Council Report for VTrans2025, May 2003.
5.0 Rail, Public Transportation, and TDM Scenarios and Needs

Virginia Department of Rail and Public Transportation Rail, Public Transportation, and TDM Needs Assessment
Cambridge Systematics, Inc. 5-1
5.0 Rail, Public Transportation, and TDM Scenarios and Needs
This section summarizes the total estimated rail, public transportation, and TDM capital and operating needs for the Commonwealth of Virginia through 2025. These needs esti-mates are based on three different assumptions regarding the role of rail and public trans-portation in the Commonwealth. The discussion first outlines the assumptions for projected changes in rail, public transportation, and TDM ridership, asset conditions, and service expansion under each of the three scenarios. Following the summary of scenarios, estimates of rail, public transportation, and TDM needs are outlined in detail. The goals for maximizing the rail, public transportation, and TDM investment in the Commonwealth are consistent with the three scenarios developed for the statewide long-range, multimodal transportation plan, VTrans 2025:
• Scenario 1 – Status Quo (Loss of Market Share);
• Scenario 2 – Strategic Investment (Maintain Market Share); and
• Scenario 3 – Fully Integrated System (Increase Market Share).
5.1 Overview of the Scenarios
Scenario 1 – Status Quo (Loss of Market Share)
The first scenario assumes a conservative approach to funding and service levels across the Commonwealth. Under this scenario, rail, public transportation, and TDM systems will continue to operate within current constraints, with relatively limited expansion opportunities. Systems will continue to maintain their physical assets at a level somewhat below, although not far below, optimal condition. Under this scenario, services are not being abandoned and assets will continue to be renewed but not at the pace that would be best to ensure an overall improvement in service quality.
Ridership – Existing public transportation, rail, and TDM systems in Virginia will con-tinue to meet projected increases in ridership at a pace that maintains the performance of the system at currently observed levels. For this scenario, the pace of ridership increase has been assumed to match the anticipated rate of growth of population in the various regions of the State. That is, the maintenance of the status quo is defined as public trans-portation ridership being reflective of the same number of trips per capita as observed today.
Virginia Department of Rail and Public Transportation Rail, Public Transportation, and TDM Needs Assessment
5-2 Cambridge Systematics, Inc.
Service Levels for Existing Systems
Public transportation ridership has generally remained stable or increased across the State in recent years. Public transportation systems will need to add at least some limited amounts of service as ridership in response to expected continued ridership increases to provide for even a similar level of crowding and comfort as is experienced today. This is particularly true on systems, such as those in Northern Virginia, where many existing ser-vices are operating at their functional capacity during peak hours. If service levels are not increased, it can be expected that current and future users will face increasingly crowded and unreliable conditions. The ridership forecasts associated with Scenario 1 (Loss of Market Share) assume that ridership will increase at the projected pace of population growth in those areas where service currently exists.
Condition of Assets
Many public transportation and rail systems struggle to maintain the condition of assets at a level that provides for reliable and efficient operation of service. The FTA has estab-lished guidelines that recommend an age at which various types of transit vehicles should be replaced. It is common to find that public transportation agencies continue to operate vehicles well beyond these age limits. Under the Status Quo (Loss of Market Share) sce-nario, the assumption is that Virginia’s public transportation agencies will continue to replace vehicles according to FTA guidelines, although some vehicles will remain over the normal replacement age, and that other non-vehicle facilities will continue to be main-tained at a level similar to that found today. In many cases, asset conditions would likely remain below optimal levels and may affect the quality and reliability of service. If sys-tems are unable to meet the FTA guidelines for vehicle replacement, they are likely to experience increased maintenance costs and potentially a less reliable service for passengers.
Service Area Coverage
Public transportation service is not currently provided in all parts of the Commonwealth and even in those regions where service is available, it often leaves significant portions of the service area either unserved or underserved. The presumption under the Status Quo (Loss of Market Share) scenario is that systems will expand modestly to serve markets where demand is apparent. The State will continue to support the expansion of rural ser-vice based on local demands. Overall, coverage will remain relatively comparable to that found today. Limited new capital investments in rail lines or other fixed-route services will occur under this scenario. The presumption is that some continued expansion of rural systems will occur, contributing to an overall pace of public transportation and rail ridership increases that slightly exceed population growth in rural parts of the State.
Virginia Department of Rail and Public Transportation Rail, Public Transportation, and TDM Needs Assessment
Cambridge Systematics, Inc. 5-3
Scenario 2 – Strategic Investment (Maintain Market Share)
Under the second scenario, Virginia DRPT and other agencies will make modest improvements in rail, public transportation, and TDM services across the State. It is likely under this scenario that service and ridership will expand at rates beyond projected trends in population growth. A limited number of new major capital investments will occur and the coverage of public transportation, rail, and TDM service is likely to expand in rural parts of the State.
Ridership – Existing public transportation, rail, and TDM systems in the State will con-tinue to meet projected increases in ridership for existing services by expanding at a pace that maintains the performance of the system at existing levels or somewhat improves performance. For this scenario, ridership growth is anticipated to keep pace with the growth in VMT, which is projected to increase at a faster rate than the projected increase in population. Ridership growth above and beyond the anticipated general increases is to be expected in this scenario with the addition of some new public transportation and rail lines and services in selected locations.
System Condition – Existent transit facilities such as maintenance centers, transfer facili-ties, and passenger stations will be improved where necessary to modernize systems and to improve operations and maintenance. A limited number of investments will occur to implement new technology such as ITS. Significant facility upgrades will not occur under this scenario.
New Public Transportation and Rail Lines and Services – A limited number of new rail and public transportation lines and service coverage will be initiated. The expectation is that major capital facilities currently approved by the FTA for Preliminary Engineering under the New Starts program will be constructed. Public transportation and rail service may be expanded within the bounds of service areas for existing systems. A limited expansion of service will occur in those urban and suburban areas where demand is clearly evident or has been considered. Rural services will expand at a more aggressive rate than under the Status Quo (Loss of Market Share) scenario with a trip rate increase to 1.0 trips/capita to reflect some improvement in the level of service. Funding will be pro-vided directly to private intercity and commuter bus carriers to support continuation of rural routes and to provide capital funding – this is a change in current state policy.
Scenario 3 – Fully Integrated System (Increase Market Share)
Under the third scenario, Virginia DRPT and other agencies will aggressively expand and improve rail, public transportation, and TDM service across the Commonwealth. Citizens in Virginia will be provided with an improved level of mobility from rail, public trans-portation, and TDM services throughout the State. Existing systems will improve service levels and asset conditions and the general level of coordination across systems will improve dramatically.
Virginia Department of Rail and Public Transportation Rail, Public Transportation, and TDM Needs Assessment
5-4 Cambridge Systematics, Inc.
Ridership – Ridership growth will occur on public transportation, rail, and TDM systems throughout the Commonwealth at a rate that outpaces that of population and VMT. The overall market share of public transportation, rail, and TDM will increase. Public trans-portation systems will continue to expand service to meet this increased demand for travel and will improve service levels to address crowding where this is currently an issue. Core capacity issues will be addressed to allow for the continued expansion of service to meet increased ridership.
Under this scenario, public transportation and rail ridership is expected to outpace VMT growth and increase at a rate of about 3.5 percent annually. For the rural areas with pub-lic transportation and rail coverage, the trip rate is expected to increase to 1.25 trips per capita to reflect the impact of a projected 40 percent increase in the elderly population and high numbers of auto less households in rural areas. The annual growth rate for rural rid-ership is projected to be about 5.2 percent under this scenario. This pace of public trans-portation and rail ridership growth is still conservative relative to recently observed patronage growth rates in some parts of Virginia.
System Conditions – All vehicles will be replaced according to the cycles recommended by the FTA. All other facilities will be modernized to implement technologies that improve the quality of service for the users and reduce unit costs for the operators. System core capacity issues will be addressed where necessary.
New Public Transportation and Rail Lines and Services – All major rail and public transportation and rail lines currently under consideration will be implemented. Some level of service will be provided in all jurisdictions within the Commonwealth to provide a basic level of mobility for those without transportation options. Efforts will be made to coordinate service across jurisdictional boundaries and to provide improved connections to intercity passenger services, such as those operated by Amtrak and Greyhound. Operation of new intercity bus links would be funded and capital support would be pro-vided to private commuter bus operators to allow for the provision of additional services.
Relationship of Scenarios to Public Transportation, Rail, and TDM Needs across the State
For the purposes of generating scenario specific needs, the assumption is that projected changes in ridership and service expansion will vary across the State under each of the three scenarios. In many cases, public transportation, rail, and TDM ridership will increase at a more rapid rate in those areas that are projected to experience more signifi-cant increases in population. In addition, public transportation use may grow more substantially in rural areas as Virginia DRPT and other agencies seek to provide service in areas where it does not exist presently. Given the differences in public transportation, rail, and TDM use and recent trends across the State, assumptions for population and for rid-ership growth under each of the scenarios are grouped by geography as shown in Table 5.1.
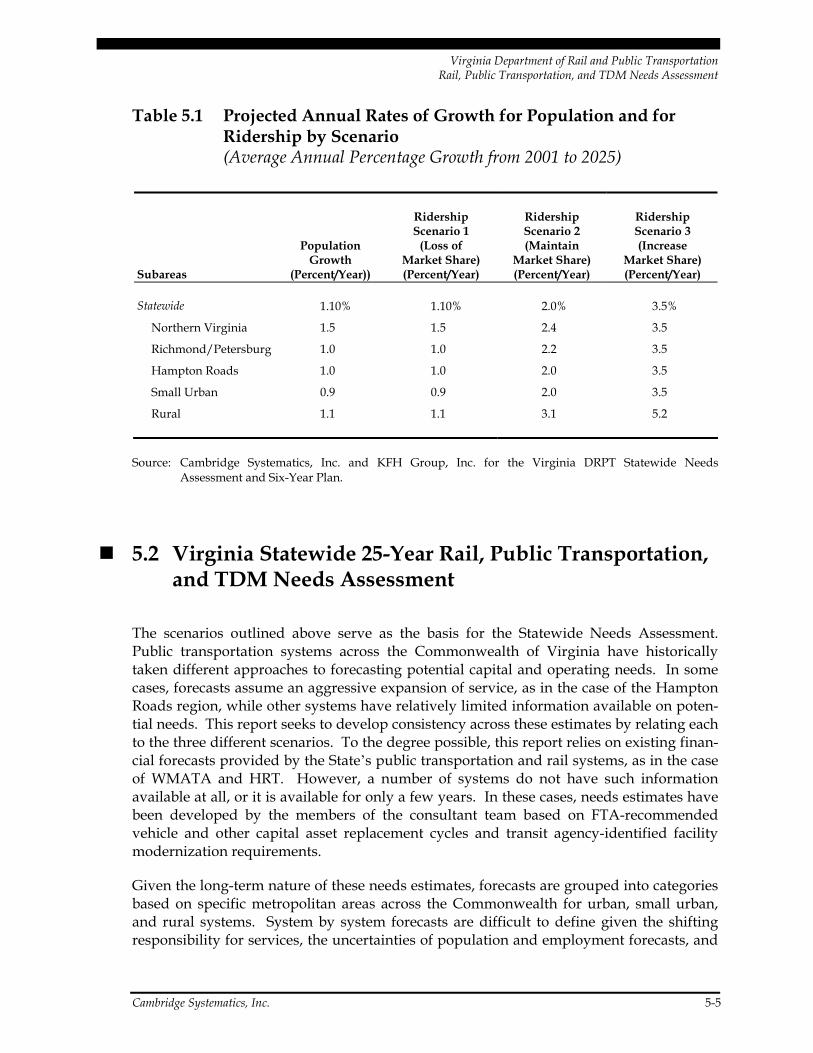
Virginia Department of Rail and Public Transportation Rail, Public Transportation, and TDM Needs Assessment
Cambridge Systematics, Inc. 5-5
Table 5.1 Projected Annual Rates of Growth for Population and for Ridership by Scenario (Average Annual Percentage Growth from 2001 to 2025)
Subareas
Population Growth
(Percent/Year))
Ridership Scenario 1
(Loss of Market Share) (Percent/Year)
Ridership Scenario 2 (Maintain
Market Share) (Percent/Year)
Ridership Scenario 3 (Increase
Market Share) (Percent/Year)
Statewide 1.10% 1.10% 2.0% 3.5%
Northern Virginia 1.5 1.5 2.4 3.5
Richmond/Petersburg 1.0 1.0 2.2 3.5
Hampton Roads 1.0 1.0 2.0 3.5
Small Urban 0.9 0.9 2.0 3.5
Rural 1.1 1.1 3.1 5.2
Source: Cambridge Systematics, Inc. and KFH Group, Inc. for the Virginia DRPT Statewide Needs Assessment and Six-Year Plan.
5.2 Virginia Statewide 25-Year Rail, Public Transportation, and TDM Needs Assessment
The scenarios outlined above serve as the basis for the Statewide Needs Assessment. Public transportation systems across the Commonwealth of Virginia have historically taken different approaches to forecasting potential capital and operating needs. In some cases, forecasts assume an aggressive expansion of service, as in the case of the Hampton Roads region, while other systems have relatively limited information available on poten-tial needs. This report seeks to develop consistency across these estimates by relating each to the three different scenarios. To the degree possible, this report relies on existing finan-cial forecasts provided by the State’s public transportation and rail systems, as in the case of WMATA and HRT. However, a number of systems do not have such information available at all, or it is available for only a few years. In these cases, needs estimates have been developed by the members of the consultant team based on FTA-recommended vehicle and other capital asset replacement cycles and transit agency-identified facility modernization requirements.
Given the long-term nature of these needs estimates, forecasts are grouped into categories based on specific metropolitan areas across the Commonwealth for urban, small urban, and rural systems. System by system forecasts are difficult to define given the shifting responsibility for services, the uncertainties of population and employment forecasts, and
Virginia Department of Rail and Public Transportation Rail, Public Transportation, and TDM Needs Assessment
5-6 Cambridge Systematics, Inc.
the uncertainties about local financial resources, particularly for smaller jurisdictions. As one example, Fairfax County and other localities have taken responsibility for the opera-tion of a number of new bus routes in the Northern Virginia region rather than having WMATA supply these bus services. A combined long-range forecast for Northern Virginia and other regions will thus provide a greater degree of accuracy, to the extent that any long-range forecasts can be accurate, than system by system forecasts.
In an effort to develop consistent financial estimates across the State, forecasts provided by the individual systems have been adjusted where deemed appropriate to do so by the members of the consultant team. As an example, forecasts provided by WMATA assume the construction of the entire Dulles Corridor project from the West Falls Church Metrorail Station to Dulles Airport and beyond to a new terminus station in eastern Loudoun County by 2025. Given the basic underlying assumption that only very limited major capital investments are likely under Scenario 1 (Loss of Market Share), only the defined Phase 1 of this project from West Falls Church to Reston East/Wiehle Avenue is included in Scenario 1 (Loss of Market Share). Similarly, several major capital projects included in budget forecasts provided by HRT have not been included in Scenario 1 (Loss of Market Share) because these projects are still in the early planning stages and represent a signifi-cant departure from current transit service levels in the region. However, some of the HRT identified major capital projects are included under Scenario 2 (Maintain Market Share) and all of these projects are included in Scenario 3 (Increase Market Share).
Forecasts are based on a 21-year investment period beginning in 2005 and ending in 2025. All forecasts are shown in year-of-expenditure (YOE) dollars.
Scenario 1 – Status Quo (Loss of Market Share)
The scenarios outlined in the table below provide adequate capital funds to allow public transportation, rail, and TDM systems to continue to expand modestly throughout the Commonwealth. Under Scenario 1 (Loss of Market Share), most service will remain simi-lar to present service, with only a modest expansion to accommodate ridership growth at the pace of population, a pace slower than that which has occurred in recent years. When available, estimates for specific agencies are based on long-range planning efforts con-ducted by the respective agency. Where specific long-term programs are not available, estimates are based on existing facilities with some expansion to accommodate projected ridership growth. Some assumptions for specific agencies under this scenario include:
• WMATA – Assumptions for WMATA are based on fiscal forecasts provided by the agency. Under this scenario, the assumption is that WMATA will have full funding provided for the Infrastructure Renewal Program and will construct only Phase I of the Dulles Rail Corridor (extension from West Falls Church to Reston East/Wiehle Avenue).
• HRT – This scenario provides for a continued expansion of local bus service to accom-modate a level of growth equivalent to population increases. This scenario does not include funding for new light-rail lines, BRT, or major new maintenance and transfer
Virginia Department of Rail and Public Transportation Rail, Public Transportation, and TDM Needs Assessment
Cambridge Systematics, Inc. 5-7
facilities as included in the agency’s independently developed projected capital program.
• GRTC – This scenario includes additional vehicles and service to accommodate a mod-est increase in ridership. However, it does not include the funding needed to replace the agency’s maintenance facilities that date to the early 1890s era of streetcars.
• Small Urban Systems – This scenario anticipates a continuation of ongoing vehicle replacement programs but does not foresee any major investments to replace or expand existing maintenance or passenger transfer facilities.
• Rural Transit Services – This scenario includes the provision of additional service to expand rural public transportation system coverage and ridership at a pace that slightly exceeds population growth. Virginia DRPT has supported an increase in the coverage of rural service in recent years. The presumption is that an expansion of rural public transportation service will continue to occur at a modest level, slightly above the anticipated rate of population growth.
• Intercity Bus – This scenario assumes Virginia will limit Federal/State operating assis-tance for intercity bus services to rural feeder routes operated by rural public trans-portation systems. Vehicle capital for the rural feeders will also be provided. Programmed and planned intermodal facilities will be constructed, including the Fredericksburg facility, a new facility in Culpeper, a planned multimodal facility in Blacksburg, and the Richmond multimodal facility. The assumption is that no capital or operating assistance will be provided to private commuter bus carriers, though they will continue to serve publicly constructed and maintained park-and-ride lots. Inter-city bus ridership is not anticipated to increase, while commuter bus ridership is pro-jected to grow at an annual rate of 2.0 percent. It is assumed that intercity bus services with a frequency of one round-trip per day will disappear within six years, and that those with two round-trips per day will disappear over the following 15 years.
• Intercity Passenger Rail – No specific improvements are assumed for intercity passen-ger rail under this scenario. Planned improvements to VRE service and rail freight facilities south of Washington will have the added benefit of improving intercity passenger rail service in the Richmond-Washington corridor. The larger fundamental question facing intercity rail services is the degree of certainty that Amtrak will con-tinue to operate long-distance intercity rail passenger service. For the purposes of this discussion, no capital costs for Amtrak are included.
• Joint Freight and Passenger Rail – The Joint Freight and Passenger category includes selected Virginia rail capacity projects. Details are provided under separate cover in the Virginia State Rail Plan Needs Assessment.
• Freight – Detail on freight needs are provided under separate cover in the Virginia State Rail Plan Needs Assessment.
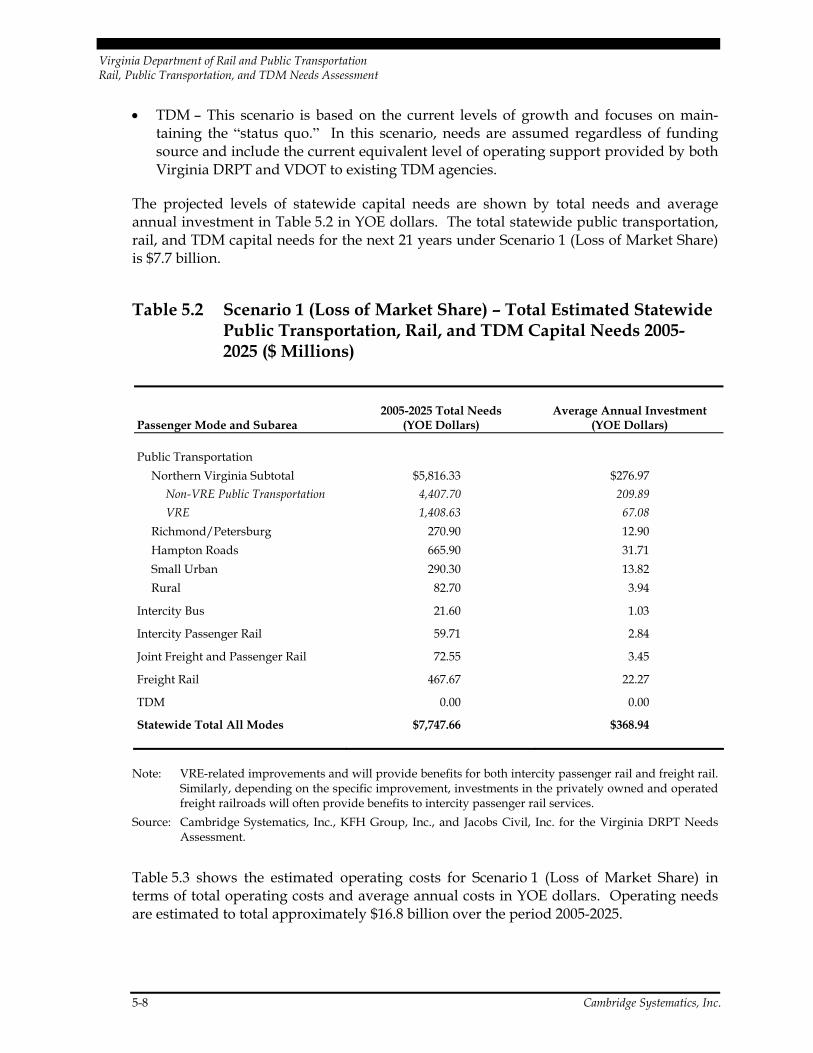
Virginia Department of Rail and Public Transportation Rail, Public Transportation, and TDM Needs Assessment
5-8 Cambridge Systematics, Inc.
• TDM – This scenario is based on the current levels of growth and focuses on main-taining the “status quo.” In this scenario, needs are assumed regardless of funding source and include the current equivalent level of operating support provided by both Virginia DRPT and VDOT to existing TDM agencies.
The projected levels of statewide capital needs are shown by total needs and average annual investment in Table 5.2 in YOE dollars. The total statewide public transportation, rail, and TDM capital needs for the next 21 years under Scenario 1 (Loss of Market Share) is $7.7 billion.
Table 5.2 Scenario 1 (Loss of Market Share) – Total Estimated Statewide Public Transportation, Rail, and TDM Capital Needs 2005-2025 ($ Millions)
Passenger Mode and Subarea 2005-2025 Total Needs
(YOE Dollars) Average Annual Investment
(YOE Dollars)
Public Transportation Northern Virginia Subtotal $5,816.33 $276.97
Non-VRE Public Transportation 4,407.70 209.89 VRE 1,408.63 67.08
Richmond/Petersburg 270.90 12.90 Hampton Roads 665.90 31.71 Small Urban 290.30 13.82 Rural 82.70 3.94
Intercity Bus 21.60 1.03
Intercity Passenger Rail 59.71 2.84
Joint Freight and Passenger Rail 72.55 3.45
Freight Rail 467.67 22.27
TDM 0.00 0.00
Statewide Total All Modes $7,747.66 $368.94
Note: VRE-related improvements and will provide benefits for both intercity passenger rail and freight rail. Similarly, depending on the specific improvement, investments in the privately owned and operated freight railroads will often provide benefits to intercity passenger rail services.
Source: Cambridge Systematics, Inc., KFH Group, Inc., and Jacobs Civil, Inc. for the Virginia DRPT Needs Assessment.
Table 5.3 shows the estimated operating costs for Scenario 1 (Loss of Market Share) in terms of total operating costs and average annual costs in YOE dollars. Operating needs are estimated to total approximately $16.8 billion over the period 2005-2025.
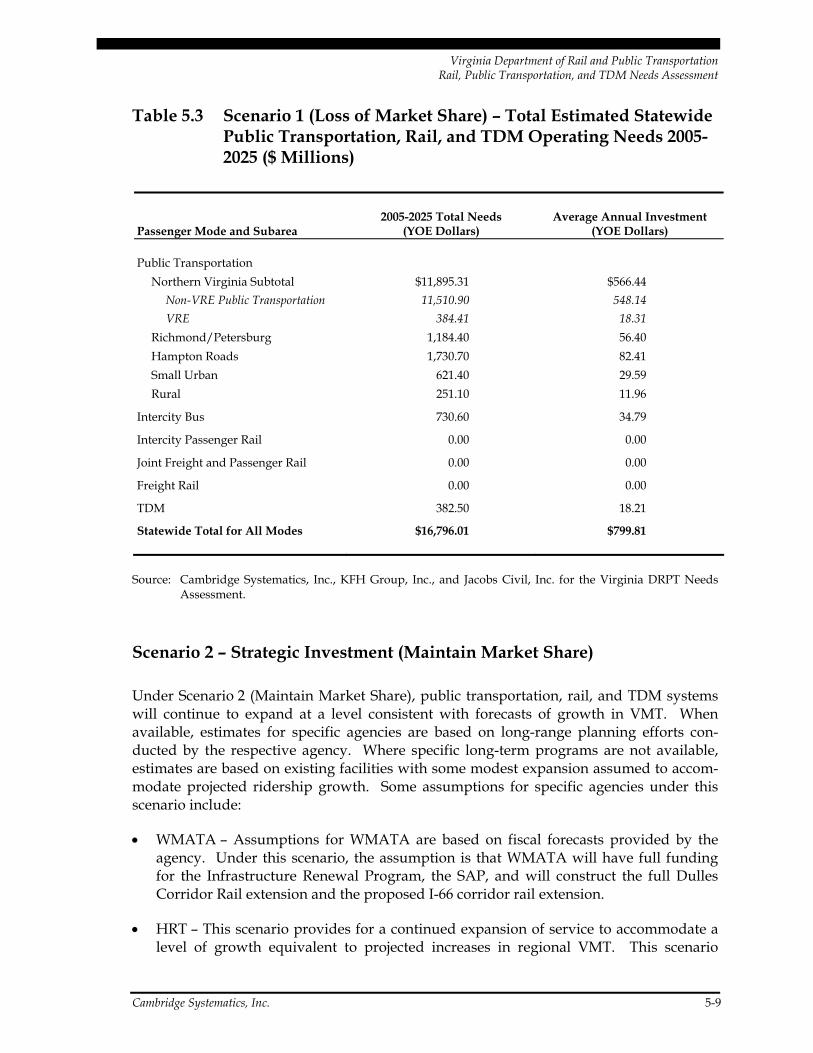
Virginia Department of Rail and Public Transportation Rail, Public Transportation, and TDM Needs Assessment
Cambridge Systematics, Inc. 5-9
Table 5.3 Scenario 1 (Loss of Market Share) – Total Estimated Statewide Public Transportation, Rail, and TDM Operating Needs 2005-2025 ($ Millions)
Passenger Mode and Subarea 2005-2025 Total Needs
(YOE Dollars) Average Annual Investment
(YOE Dollars)
Public Transportation Northern Virginia Subtotal $11,895.31 $566.44
Non-VRE Public Transportation 11,510.90 548.14 VRE 384.41 18.31
Richmond/Petersburg 1,184.40 56.40 Hampton Roads 1,730.70 82.41 Small Urban 621.40 29.59 Rural 251.10 11.96
Intercity Bus 730.60 34.79
Intercity Passenger Rail 0.00 0.00
Joint Freight and Passenger Rail 0.00 0.00
Freight Rail 0.00 0.00
TDM 382.50 18.21
Statewide Total for All Modes $16,796.01 $799.81
Source: Cambridge Systematics, Inc., KFH Group, Inc., and Jacobs Civil, Inc. for the Virginia DRPT Needs Assessment.
Scenario 2 – Strategic Investment (Maintain Market Share)
Under Scenario 2 (Maintain Market Share), public transportation, rail, and TDM systems will continue to expand at a level consistent with forecasts of growth in VMT. When available, estimates for specific agencies are based on long-range planning efforts con-ducted by the respective agency. Where specific long-term programs are not available, estimates are based on existing facilities with some modest expansion assumed to accom-modate projected ridership growth. Some assumptions for specific agencies under this scenario include:
• WMATA – Assumptions for WMATA are based on fiscal forecasts provided by the agency. Under this scenario, the assumption is that WMATA will have full funding for the Infrastructure Renewal Program, the SAP, and will construct the full Dulles Corridor Rail extension and the proposed I-66 corridor rail extension.
• HRT – This scenario provides for a continued expansion of service to accommodate a level of growth equivalent to projected increases in regional VMT. This scenario
Virginia Department of Rail and Public Transportation Rail, Public Transportation, and TDM Needs Assessment
5-10 Cambridge Systematics, Inc.
assumes that HRT will complete the construction of the proposed BRT line in Virginia Beach, the Norfolk MOS LRT line, and three new maintenance facilities.
• GRTC – This scenario includes the acquisition of additional vehicles and the provision of expanded service to accommodate an increase in ridership. This scenario also assumes that GRTC will complete one of the four currently proposed rail corridor projects in the Richmond region, and assumes a project cost based on the average cost of the four rail lines now under consideration.
• Small Urban Systems – This scenario includes continuing vehicle replacement and acquisition programs to both accommodate projected ridership increases and provide expanded service levels. All overage vehicles would be replaced, with the replace-ments spread evenly over the first six years of the period. Current proposals for a number of replacement vehicle maintenance facilities and passenger transfer centers will be implemented.
• Rural Transit Services – This scenario includes the provision of additional service to expand rural public transportation coverage and ridership at a pace that exceeds pro-jected growth in VMT. Virginia DRPT has supported an increase in the coverage of rural service in recent years. The presumption is that an expansion of service will continue to occur at a moderate pace. Planned facilities, including maintenance, administrative, training, and passenger functions as needed, will be built.
• Intercity Bus – The Commonwealth will provide operating assistance to maintain ser-vice on endangered or unprofitable rural links, maintaining service on routes that cur-rently have only one round-trip per day. The rural feeder routes operated by local public transportation systems will also be funded, both operating and capital. Capital funding will also be provided to intercity carriers and commuter bus operators including the incremental costs of wheelchair lifts and additional facility improve-ments and all newly purchased buses will be fully accessible. It is assumed that the current intercity bus network is maintained with ridership growth equal to statewide population growth and that commuter bus ridership will grow at a rate comparable to the projected Northern Virginia VMT growth.
• Intercity Passenger Rail – Improvements to VRE service will have the added benefit of improving Amtrak-operated intercity passenger rail service in the Richmond-Washington corridor. This scenario also includes improvements related to the pro-posed South Hampton Roads High-Speed Rail project, the Trans-Dominion Express service, and the Richmond Main Street Station Initiative. These improvements will have an added benefit for intercity rail passenger movement across much of the Commonwealth.
• Joint Freight and Passenger Rail – The Joint Freight and Passenger category includes selected Virginia rail capacity projects. Details are provided under separate cover in the Virginia State Rail Plan Needs Assessment.
• Freight – Detail on freight needs are provided under separate cover in the Virginia State Rail Plan Needs Assessment.
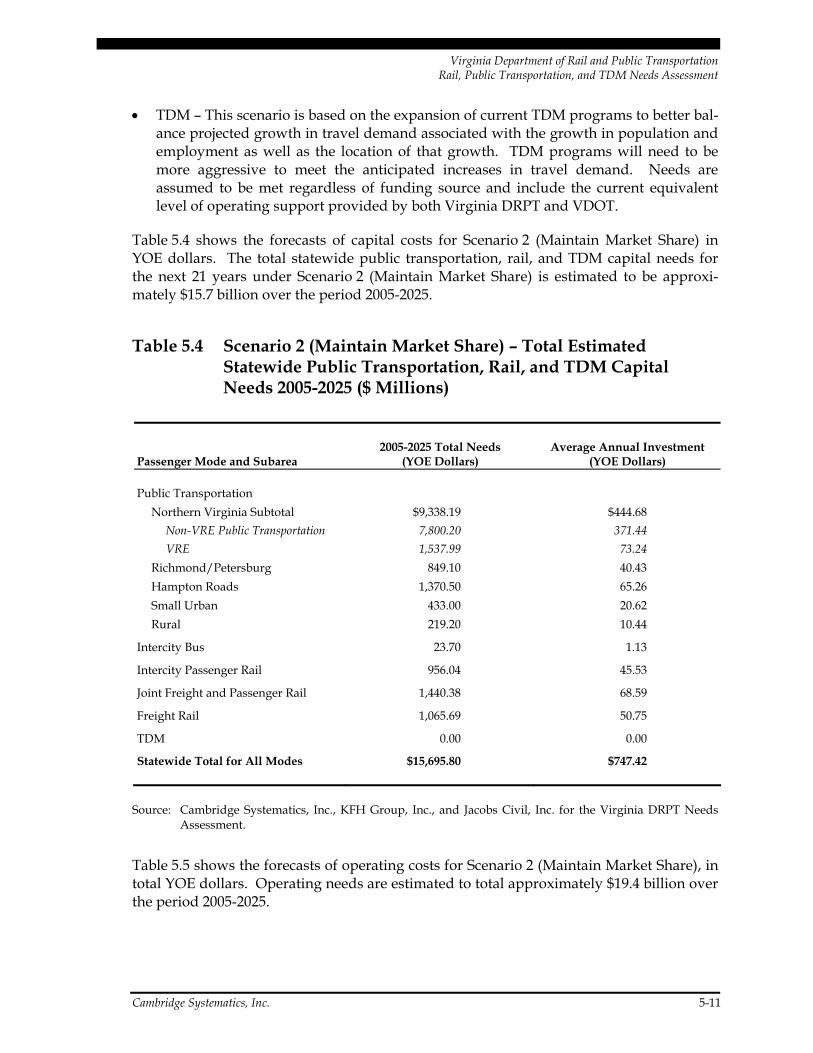
Virginia Department of Rail and Public Transportation Rail, Public Transportation, and TDM Needs Assessment
Cambridge Systematics, Inc. 5-11
• TDM – This scenario is based on the expansion of current TDM programs to better bal-ance projected growth in travel demand associated with the growth in population and employment as well as the location of that growth. TDM programs will need to be more aggressive to meet the anticipated increases in travel demand. Needs are assumed to be met regardless of funding source and include the current equivalent level of operating support provided by both Virginia DRPT and VDOT.
Table 5.4 shows the forecasts of capital costs for Scenario 2 (Maintain Market Share) in YOE dollars. The total statewide public transportation, rail, and TDM capital needs for the next 21 years under Scenario 2 (Maintain Market Share) is estimated to be approxi-mately $15.7 billion over the period 2005-2025.
Table 5.4 Scenario 2 (Maintain Market Share) – Total Estimated Statewide Public Transportation, Rail, and TDM Capital Needs 2005-2025 ($ Millions)
Passenger Mode and Subarea 2005-2025 Total Needs
(YOE Dollars) Average Annual Investment
(YOE Dollars)
Public Transportation Northern Virginia Subtotal $9,338.19 $444.68
Non-VRE Public Transportation 7,800.20 371.44 VRE 1,537.99 73.24
Richmond/Petersburg 849.10 40.43 Hampton Roads 1,370.50 65.26 Small Urban 433.00 20.62 Rural 219.20 10.44
Intercity Bus 23.70 1.13
Intercity Passenger Rail 956.04 45.53
Joint Freight and Passenger Rail 1,440.38 68.59
Freight Rail 1,065.69 50.75
TDM 0.00 0.00
Statewide Total for All Modes $15,695.80 $747.42
Source: Cambridge Systematics, Inc., KFH Group, Inc., and Jacobs Civil, Inc. for the Virginia DRPT Needs Assessment.
Table 5.5 shows the forecasts of operating costs for Scenario 2 (Maintain Market Share), in total YOE dollars. Operating needs are estimated to total approximately $19.4 billion over the period 2005-2025.
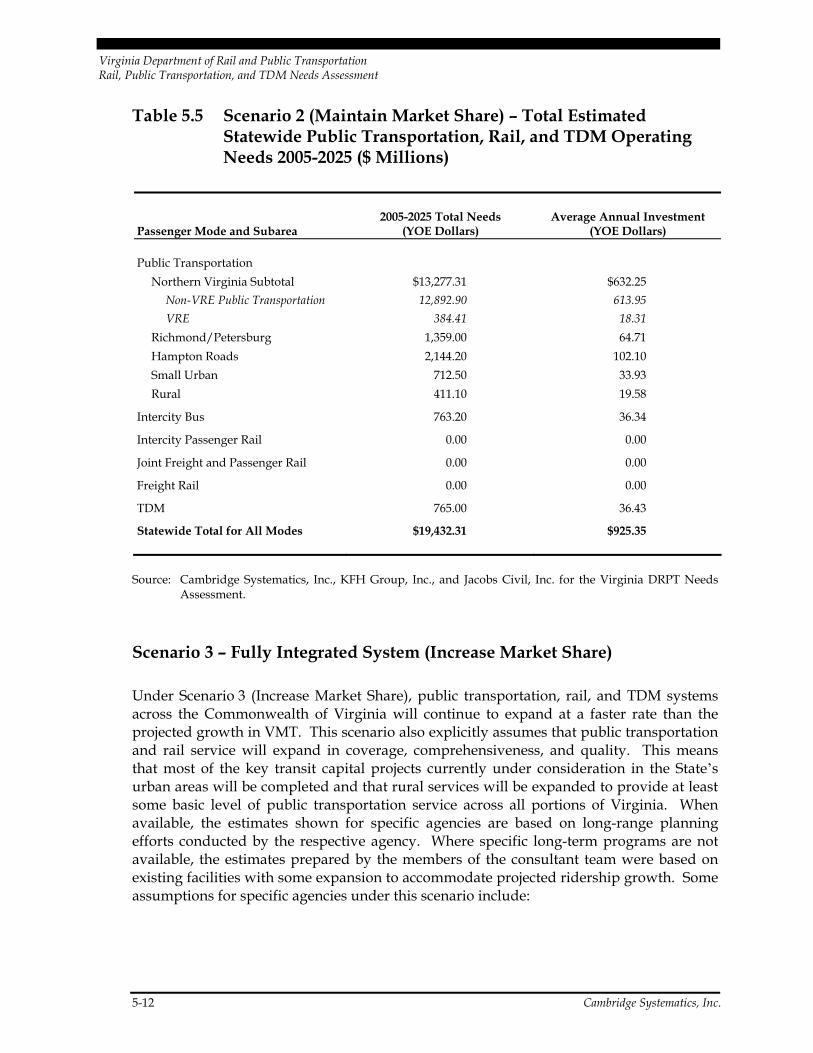
Virginia Department of Rail and Public Transportation Rail, Public Transportation, and TDM Needs Assessment
5-12 Cambridge Systematics, Inc.
Table 5.5 Scenario 2 (Maintain Market Share) – Total Estimated Statewide Public Transportation, Rail, and TDM Operating Needs 2005-2025 ($ Millions)
Passenger Mode and Subarea 2005-2025 Total Needs
(YOE Dollars) Average Annual Investment
(YOE Dollars)
Public Transportation Northern Virginia Subtotal $13,277.31 $632.25
Non-VRE Public Transportation 12,892.90 613.95 VRE 384.41 18.31
Richmond/Petersburg 1,359.00 64.71 Hampton Roads 2,144.20 102.10 Small Urban 712.50 33.93 Rural 411.10 19.58
Intercity Bus 763.20 36.34
Intercity Passenger Rail 0.00 0.00
Joint Freight and Passenger Rail 0.00 0.00
Freight Rail 0.00 0.00
TDM 765.00 36.43
Statewide Total for All Modes $19,432.31 $925.35
Source: Cambridge Systematics, Inc., KFH Group, Inc., and Jacobs Civil, Inc. for the Virginia DRPT Needs Assessment.
Scenario 3 – Fully Integrated System (Increase Market Share)
Under Scenario 3 (Increase Market Share), public transportation, rail, and TDM systems across the Commonwealth of Virginia will continue to expand at a faster rate than the projected growth in VMT. This scenario also explicitly assumes that public transportation and rail service will expand in coverage, comprehensiveness, and quality. This means that most of the key transit capital projects currently under consideration in the State’s urban areas will be completed and that rural services will be expanded to provide at least some basic level of public transportation service across all portions of Virginia. When available, the estimates shown for specific agencies are based on long-range planning efforts conducted by the respective agency. Where specific long-term programs are not available, the estimates prepared by the members of the consultant team were based on existing facilities with some expansion to accommodate projected ridership growth. Some assumptions for specific agencies under this scenario include:
Virginia Department of Rail and Public Transportation Rail, Public Transportation, and TDM Needs Assessment
Cambridge Systematics, Inc. 5-13
• WMATA – Assumptions for WMATA are based on fiscal forecasts provided by the agency. Under this scenario, the assumption is that WMATA will have full funding for all currently defined projects contained in the Infrastructure Renewal Program, the SAP, and the SEP. Specific projects assumed under system expansion include the I-66 corridor rail extension, the full Dulles Corridor Rail project, and the Route 28, Pentagon to Tyson’s Corner, and Capital Beltway rail projects identified in the Northern Virginia 2020 Regional Transportation Plan.
• HRT – This scenario provides for a continued expansion of service to accommodate a level of growth in excess of projected regional VMT. This scenario assumes that HRT will complete the construction of the BRT line in Virginia Beach, the Norfolk MOS light-rail line, the Norfolk Naval Base light-rail line extension, the Peninsula MOS LRT line, and three new maintenance facilities.
• GRTC – This scenario includes the acquisition of additional vehicles and the expansion of service to accommodate an increase in ridership exceeding the projected regional growth in VMT. This scenario also assumes that GRTC will complete all four of the currently planned passenger rail corridor facilities in the region.
• Small Urban Systems – This scenario includes the acquisition of additional vehicles and growth in ridership comparable to the projected statewide growth in VMT. This growth is likely to vary between systems, with some mature systems in low-population growth areas having essentially no growth, while some of the existing small urban systems in areas of high population growth will need to add more service, requiring more vehicles and supporting facilities.
• Rural Transit Services – This scenario includes the provision of additional service to expand rural public transportation coverage and ridership at a pace that exceeds five percent annually. With continued support of rural service from the Commonwealth, the presumption is that an expansion of service will occur at an aggressive pace in order to provide a basic level of mobility for those without transportation options in all parts of the State.
• Intercity Bus Service – In this scenario, it is assumed that operating assistance is pro-vided to intercity carriers to increase rural frequencies and implement new routes. The latter would include those such as a route across the southern part of the State on the U.S. Route 58 corridor from Norfolk to the Bristol/Norton area in Southwest Virginia, north-south links to Martinsville along the U.S. Route 220 corridor, rein-stating the intercity connection to West Virginia along the U.S. Route 60 corridor west of I-81, and reinstitution of the link from Winchester to Hagerstown, Maryland com-pleting the I-81 corridor through the State. Rural feeder operating and capital funding is also assumed, including support for the construction of additional intermodal pas-senger terminals. Capital will be provided to private intercity carriers and commuter bus carriers to support the continued operation of the network. The intercity bus net-work would be expanded with anticipated ridership growth for both intercity bus and commuter bus services comparable to the percentage growth in statewide public transportation ridership under this scenario.

Virginia Department of Rail and Public Transportation Rail, Public Transportation, and TDM Needs Assessment
5-14 Cambridge Systematics, Inc.
• Intercity Passenger Rail – Improvements to VRE service will have the added benefit of improving intercity passenger rail service in the Richmond-Washington corridor. This scenario also includes those improvements related to the proposed South Hampton Roads High-Speed Rail corridor, and further assumes that all of the proposed Southeast High Speed Rail upgrades on the Richmond to Newport News corridor and the Richmond/Petersburg to North Carolina State Line corridor, and the Trans Dominion Express system would be undertaken.
• Joint Freight and Passenger Rail – The Joint Freight and Passenger category includes selected Virginia rail capacity projects. Details are provided under separate cover in the Virginia State Rail Plan Needs Assessment.
• Freight – Detail on freight needs are provided under separate cover in the Virginia State Rail Plan Needs Assessment.
• TDM – In this scenario, efforts will be maximized to better manage use of existing facilities as well as to aggressively grow current TDM programs. All identified TDM needs are assumed to be accommodated regardless of funding source and include a level of support substantially greater than the equivalent level of operating support currently being provided by both Virginia DRPT and VDOT. These numbers present a rising share in TDM amongst all three scenarios, with Scenario 3 (Increase Market Share) being the most aggressive in terms of the number and extent of TDM services provided.
Table 5.6 shows the forecast of capital costs of Scenario 3 (Increase Market Share), in terms of total YOE dollars, and average annual YOE dollars for the period 2005 through 2025. The total statewide public transportation, rail, and TDM capital needs for the next 21 years under Scenario 3 (Increase Market Share) is estimated to be approximately $23.8 billion.
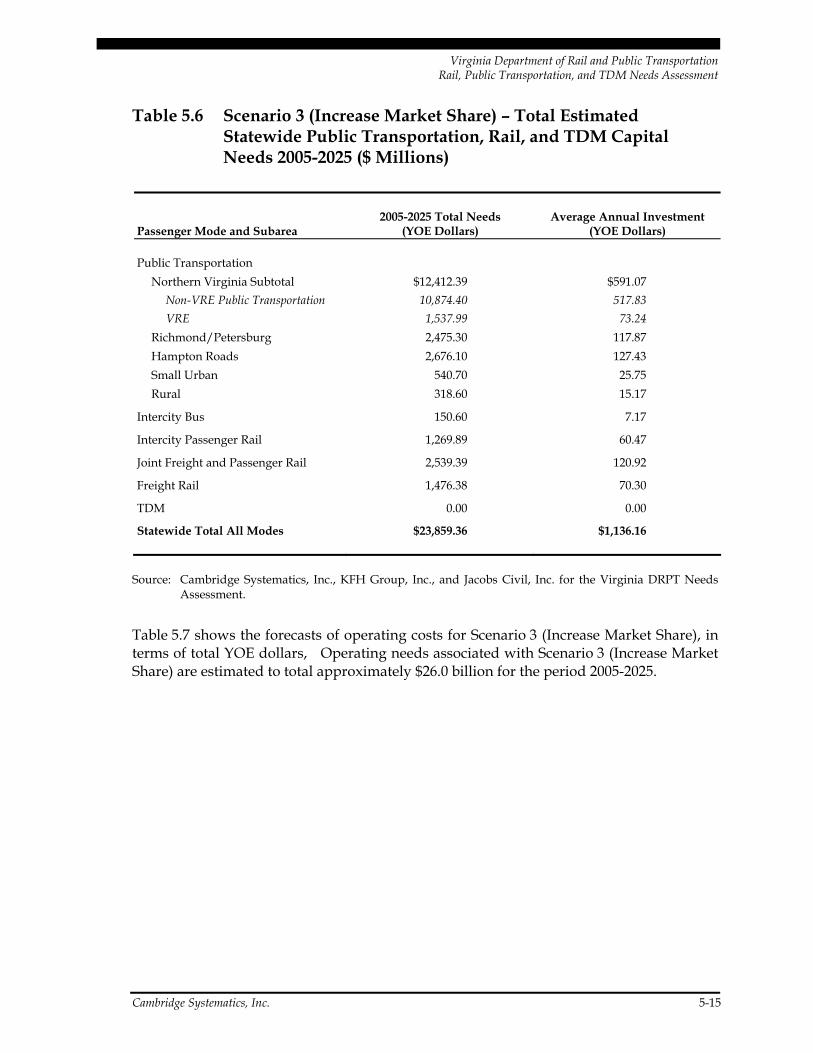
Virginia Department of Rail and Public Transportation Rail, Public Transportation, and TDM Needs Assessment
Cambridge Systematics, Inc. 5-15
Table 5.6 Scenario 3 (Increase Market Share) – Total Estimated Statewide Public Transportation, Rail, and TDM Capital Needs 2005-2025 ($ Millions)
Passenger Mode and Subarea 2005-2025 Total Needs
(YOE Dollars) Average Annual Investment
(YOE Dollars)
Public Transportation Northern Virginia Subtotal $12,412.39 $591.07
Non-VRE Public Transportation 10,874.40 517.83 VRE 1,537.99 73.24
Richmond/Petersburg 2,475.30 117.87 Hampton Roads 2,676.10 127.43 Small Urban 540.70 25.75 Rural 318.60 15.17
Intercity Bus 150.60 7.17
Intercity Passenger Rail 1,269.89 60.47
Joint Freight and Passenger Rail 2,539.39 120.92
Freight Rail 1,476.38 70.30
TDM 0.00 0.00
Statewide Total All Modes $23,859.36 $1,136.16
Source: Cambridge Systematics, Inc., KFH Group, Inc., and Jacobs Civil, Inc. for the Virginia DRPT Needs Assessment.
Table 5.7 shows the forecasts of operating costs for Scenario 3 (Increase Market Share), in terms of total YOE dollars, Operating needs associated with Scenario 3 (Increase Market Share) are estimated to total approximately $26.0 billion for the period 2005-2025.
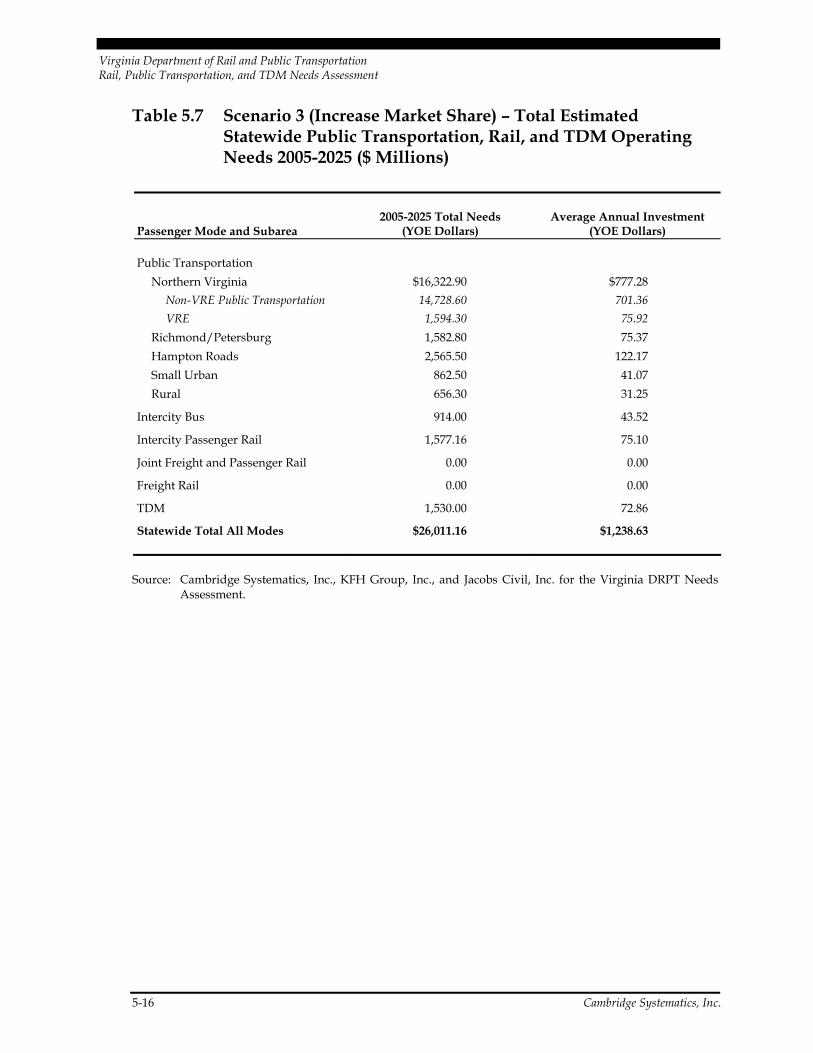
Virginia Department of Rail and Public Transportation Rail, Public Transportation, and TDM Needs Assessment
5-16 Cambridge Systematics, Inc.
Table 5.7 Scenario 3 (Increase Market Share) – Total Estimated Statewide Public Transportation, Rail, and TDM Operating Needs 2005-2025 ($ Millions)
Passenger Mode and Subarea 2005-2025 Total Needs
(YOE Dollars) Average Annual Investment
(YOE Dollars)
Public Transportation Northern Virginia $16,322.90 $777.28
Non-VRE Public Transportation 14,728.60 701.36 VRE 1,594.30 75.92
Richmond/Petersburg 1,582.80 75.37 Hampton Roads 2,565.50 122.17 Small Urban 862.50 41.07 Rural 656.30 31.25
Intercity Bus 914.00 43.52
Intercity Passenger Rail 1,577.16 75.10
Joint Freight and Passenger Rail 0.00 0.00
Freight Rail 0.00 0.00
TDM 1,530.00 72.86
Statewide Total All Modes $26,011.16 $1,238.63
Source: Cambridge Systematics, Inc., KFH Group, Inc., and Jacobs Civil, Inc. for the Virginia DRPT Needs Assessment.
6.0 Funding Resources for 2025 Needs Scenarios

Virginia Department of Rail and Public Transportation Rail, Public Transportation, and TDM Needs Assessment
Cambridge Systematics, Inc. 6-1
6.0 Funding Resources for 2025 Needs Scenarios
6.1 Funding Resources in Comparison to Estimated Transit Capital Needs
Capital funding for public transportation in Virginia will have to increase substantially over current and historic levels between today and 2025 in order to fully implement the recommended needs associated with any of the three alternative scenarios that have been considered. The normal sources of regular transit capital funding include a portion of the state transportation formula assistance program and Federal transportation formula aid. Local governments also typically provide a match for projects implemented using these funding sources, usually at a level equal to or slightly greater than the historical state contribution.
Estimation of the likely amount of state support for transit capital investments was based primarily upon the extrapolation of recent historical trends. Information provided by Virginia DRPT and VDOT staff on projected annual funding levels for the state Transportation Trust Fund through 2030 were used to estimate the value of this funding stream between 2005 and 2025. For the purposes of this discussion, no new potential state funding sources, such as revenues associated with possible high-occupancy toll (HOT) lane facilities, have been considered. The total projected state Transportation Trust Fund expenditures allocated to transit have been estimated to be approximately $3.350 billion. Based on historical trends, approximately 27 percent of this total, or about $905 million, would likely be available for transit capital expenditures, with the remaining 73 percent, or about $2.445 billion, likely available for transit operating expenses. On an average annual basis, the likely capital funding level from this source over the 21-year period between 2005 and 2025 would be approximately $43 million.
The Federal government also provides formula-based funding for public transportation through programs administered by the FTA. Under the proposed administration bill for Federal transportation reauthorization (SAFE-TEA), the Northern Virginia region would receive approximately $266 million in formula-based transit capital aid between 2004 and 2009, or about $44 million per year, and the remainder of Virginia would receive approximately $234 million in formula-based transit capital aid, or about $39 million per year. An additional $9.7 million in Federal formula-based funding is expected to be received by Virginia for use in TDM-related programs over the period 2004-2009. Total Federal formula-based transit and TDM capital assistance in Virginia over this period is thus estimated to be approximately $510 million, or about $85 million per year. Extending
Virginia Department of Rail and Public Transportation Rail, Public Transportation, and TDM Needs Assessment
6-2 Cambridge Systematics, Inc.
this average annual expenditure rate of about $85 million per year through 2025, and applying a 3.0 percent per year inflation factor to convert these current-year value dollars into estimated YOE-value dollars results in an estimate of approximately $2.275 billion in Federal formula-based transit capital funds being available to Virginia between 2005 and 2025.
Another source of formula-based Federal funding available for transit capital improve-ments is the Federal STP. These funds are allocated to the State’s urban areas on the basis of factors such as population and population density and may be used for a wide range of transportation capital improvements including those for highways, transit, bicycle, and pedestrian facilities. Historically, a minimum of 10.0 percent of the State’s annual STP allocation has been allocated for public transportation capital investments. Projections prepared by VDOT and the Virginia DRPT anticipate that this program would provide approximately $196 million for transit capital funding between 2005 and 2025.
An additional major source of Federal transit capital funds is the FTA’s New Starts dis-cretionary program. These funds are awarded nationally in the form of competitive grants, with a large percentage of these funds being specifically designated to individual transit projects either in the six-year cycle Federal transportation reauthorization legisla-tion or in the annual U.S. DOT appropriations bills. These funds are typically awarded on the basis of a 50 percent Federal/50 percent non-Federal matching basis. The proposed financing plan for the $3.384 billion Dulles Corridor Rail Project anticipates the receipt of FTA New Starts funds with a matching ratio of 50 percent Federal, 25 percent state, and 25 percent local funding. Similarly, the preliminary financing plan for the MOS of the planned Norfolk LRT line to be constructed by HRT anticipates the receipt of New Starts funding for about 50 percent of the project cost of approximately $304 million, with the remaining costs to be shared by the state and local governments. However, until such time as a Full Funding Grant Agreement (FFGA) has been entered into between FTA and the designated grant recipient, the availability of this funding source cannot be assured. Thus, for the purposes of this discussion, the receipt of FTA New Starts funds to offset Virginia’s transit capital needs between 2005 and 2025 cannot be assumed.
As noted previously, local governments in Virginia also contribute to transit capital costs, typically by providing matching monies to Federal and state funds. Some local commu-nities have even purchased transit vehicles or installed passenger waiting shelters using 100 percent local funds. If it were to be assumed that local government contributions to transit capital investments would continue to be made at the same approximate rate documented in the FY 2004 Commonwealth Transportation Board (CTB) expenditures, an additional $41.3 million per year (in 2003 dollars) would be available. Adjusting this cur-rent investment level to reflect YOE values, as much as an additional $1.338 billion in local government-generated transit capital funding could be assumed to be available over the period 2005-2025. However, the “local” funds identified in the FY 2004 CTB expenditures are only those monies required to match state and/or Federal transit capital funds for those projects for which state funds are also being used. Moreover, there is some addi-tional unknown amount of local funds that is likely being expended in support of either 100 percent locally funded transit capital projects or projects that are being funded from only Federal and local sources, with no state contribution. For the purposes of this
Virginia Department of Rail and Public Transportation Rail, Public Transportation, and TDM Needs Assessment
Cambridge Systematics, Inc. 6-3
discussion, only those expected revenue from Federal or state sources will be assumed to be available for use in meeting the projected transit capital needs of the Commonwealth through 2025. Stated another way, no specifically defined local revenue stream will be identified at this time.
There is, however, one exception to the general assumption that no local revenue stream can be identified at this time. That exception relates to the funds that have been identified to provide a portion of the non-Federal funding associated with the Dulles Corridor Rail Project and the MOS for the Norfolk LRT line. The funding plan for Phase 1 of the Dulles Project has identified the likely availability of approximately $283 million in state funds, $367 million in other local funds, and $237 million in previously obligated but unspent Federal funds, for a total of approximately $887 million. Similarly, the preliminary funding plan associated with Phase 2 of the Dulles Project has identified the likely avail-ability of approximately $473 million in state funds and $473 million in other local funds, for a total of approximately $946 million. The resulting total state share of the Dulles Project is estimated to be approximately $756 million, with the total local share estimated to be approximately $840 million.
HRT also anticipates that some amount of FTA New Starts funding would be obtained in order to implement the MOS of the planned Norfolk LRT line and to continue work on other fixed-guideway transit projects in the Hampton Roads region. The proposed New Starts transit projects in the Hampton Roads region are anticipated to require a total of approximately $304 million over the six-year period between 2005 and 2010. Using the same funding allocation for the HRT New Starts projects of 50 percent Federal, 25 percent state, and 25 percent local that is being assumed for the Dulles Corridor Project, approxi-mately $76 million in state funds and about $76 million in local funds would need to be allocated to the initial phases of these projects.
The total currently anticipated funds to support transit capital expenditures in the Commonwealth of Virginia over the period 2005-2025, excluding FTA New Starts funds and non-New Starts-related funds provided by local governments, are summarized below:
• Federal transit formula funds (FTA) $2.275 billion
• Federal STP funds $196 million
• Transit capital share of State Transportation Fund $905 million
• State funding for Dulles and HRT New Starts $831 million
• Local funding for Dulles and HRT New Starts $969 million
• Previously obligated but unspent Federal funds for Dulles $237 million
This represents a total of approximately $5.413 billion that could be reasonably expected to be available to support transit capital investments in Virginia over the period 2005 to 2025. This is equivalent to an average annual funding stream of approximately $258 million per year.
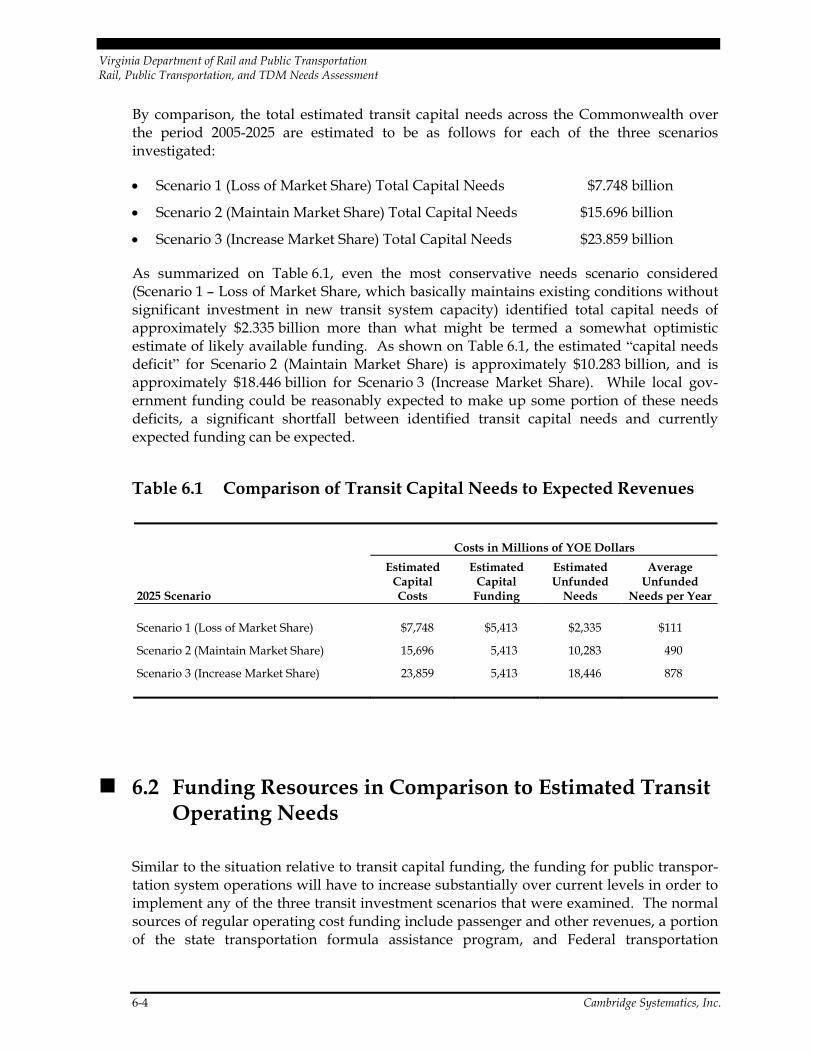
Virginia Department of Rail and Public Transportation Rail, Public Transportation, and TDM Needs Assessment
6-4 Cambridge Systematics, Inc.
By comparison, the total estimated transit capital needs across the Commonwealth over the period 2005-2025 are estimated to be as follows for each of the three scenarios investigated:
• Scenario 1 (Loss of Market Share) Total Capital Needs $7.748 billion
• Scenario 2 (Maintain Market Share) Total Capital Needs $15.696 billion
• Scenario 3 (Increase Market Share) Total Capital Needs $23.859 billion
As summarized on Table 6.1, even the most conservative needs scenario considered (Scenario 1 – Loss of Market Share, which basically maintains existing conditions without significant investment in new transit system capacity) identified total capital needs of approximately $2.335 billion more than what might be termed a somewhat optimistic estimate of likely available funding. As shown on Table 6.1, the estimated “capital needs deficit” for Scenario 2 (Maintain Market Share) is approximately $10.283 billion, and is approximately $18.446 billion for Scenario 3 (Increase Market Share). While local gov-ernment funding could be reasonably expected to make up some portion of these needs deficits, a significant shortfall between identified transit capital needs and currently expected funding can be expected.
Table 6.1 Comparison of Transit Capital Needs to Expected Revenues
Costs in Millions of YOE Dollars
2025 Scenario
Estimated Capital Costs
Estimated Capital
Funding
Estimated Unfunded
Needs
Average Unfunded
Needs per Year
Scenario 1 (Loss of Market Share) $7,748 $5,413 $2,335 $111
Scenario 2 (Maintain Market Share) 15,696 5,413 10,283 490
Scenario 3 (Increase Market Share) 23,859 5,413 18,446 878
6.2 Funding Resources in Comparison to Estimated Transit Operating Needs
Similar to the situation relative to transit capital funding, the funding for public transpor-tation system operations will have to increase substantially over current levels in order to implement any of the three transit investment scenarios that were examined. The normal sources of regular operating cost funding include passenger and other revenues, a portion of the state transportation formula assistance program, and Federal transportation
Virginia Department of Rail and Public Transportation Rail, Public Transportation, and TDM Needs Assessment
Cambridge Systematics, Inc. 6-5
formula aid. Local governments also typically provide operating assistance, usually at a level equal to or greater than the state contribution.
As noted above, it is estimated that the total transit share of the state Transportation Trust Fund will be approximately $3.350 billion between 2005 and 2025. Based on historical trends, approximately 27 percent of this total, or about $905 million, would likely be avail-able for transit capital expenditures, with the remaining 73 percent, or about $2.445 billion, likely available for transit operating expenses. On an average annual basis, the likely transit operating funding level from this source over the 21-year period between 2005 and 2025 would be approximately $116 million.
The Federal government also provides formula-based funding for public transportation through programs administered by the FTA. Under the proposed administration bill for Federal transportation reauthorization (SAFE-TEA), the Northern Virginia region would receive a total of approximately $13 million in formula-based transit operating assistance aid between 2004 and 2009, or about $2.2 million per year, and the remainder of Virginia would receive approximately $348 million in formula-based transit operating assistance, or about $57.9 million per year. The resulting total Federal formula-based transit oper-ating assistance for Virginia over this period is thus estimated to be approximately $361 million, or about $60.2 million per year. Extending this average annual expenditure rate of about $60.2 million per year through 2025, and applying a 3.0 percent per year inflation factor to convert these current-year value dollars into estimated YOE-value dol-lars results in an estimate of approximately $1.515 billion in Federal formula-based transit operating assistance funds being available to Virginia between 2005 and 2025.
Passenger fares have historically represented the single largest component of transit oper-ating revenues. Over the past several years, approximately 51 percent of the total annual transit operating costs in the Northern Virginia region and about 25 percent of the total operating costs in the remainder of the State have been offset by passenger and other revenues. Statewide, this was the equivalent of about $190 million during FY 2004. Assuming that these same farebox recovery percentages can be maintained, it is estimated that the total passenger and other revenues that could be generated over the period 2005-2025 would be as follows for each of the three investment scenarios that were examined:
• Scenario 1 (Loss of Market Share) Revenues $7.121 billion ($339 million per year)
• Scenario 2 (Maintain Market Share) Revenues $8.238 billion ($392 million per year)
• Scenario 3 (Increase Market Share) Revenues $9.842 billion ($469 million per year)
The resulting combination of Federal and state formula operating assistance funds and passenger and other revenues over the period 2005-2025 for each of the three scenarios examined are summarized below:
• Total Scenario 1 (Loss of Market Share) Operating Revenues $11.081 billion
• Total Scenario 2 (Maintain Market Share) Operating Revenues $12.198 billion
• Total Scenario 3 (Increase Market Share) Operating Revenues $13.802 billion
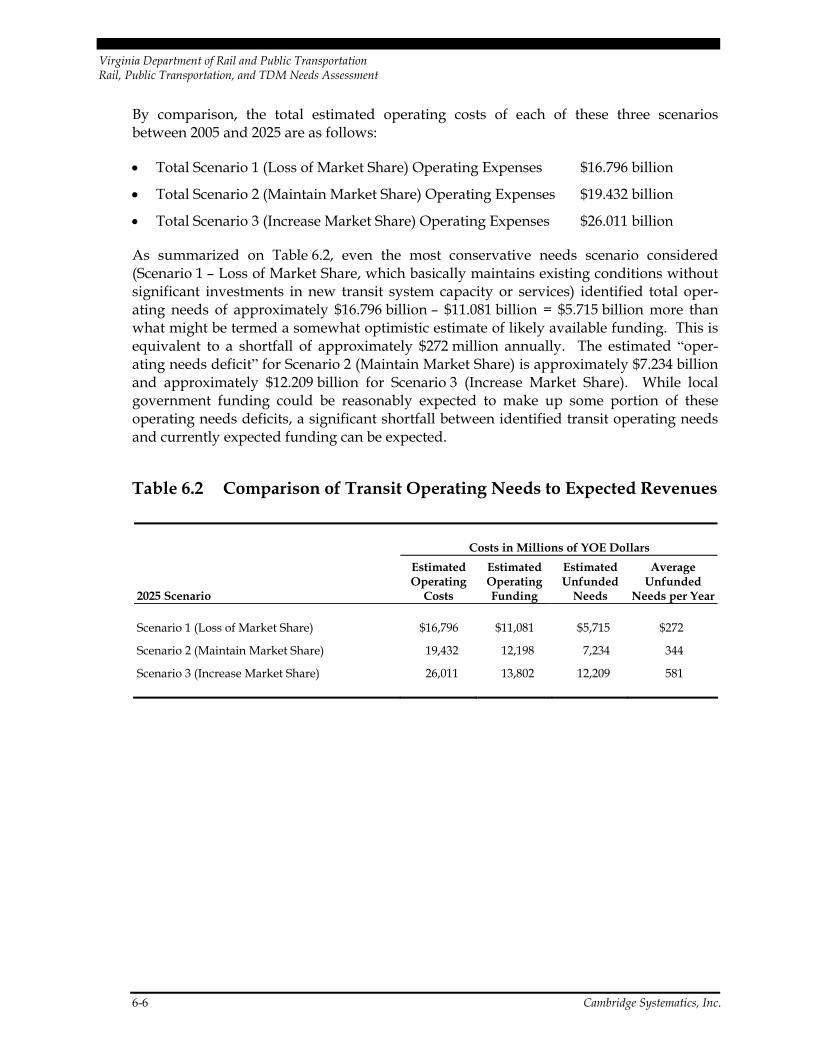
Virginia Department of Rail and Public Transportation Rail, Public Transportation, and TDM Needs Assessment
6-6 Cambridge Systematics, Inc.
By comparison, the total estimated operating costs of each of these three scenarios between 2005 and 2025 are as follows:
• Total Scenario 1 (Loss of Market Share) Operating Expenses $16.796 billion
• Total Scenario 2 (Maintain Market Share) Operating Expenses $19.432 billion
• Total Scenario 3 (Increase Market Share) Operating Expenses $26.011 billion
As summarized on Table 6.2, even the most conservative needs scenario considered (Scenario 1 – Loss of Market Share, which basically maintains existing conditions without significant investments in new transit system capacity or services) identified total oper-ating needs of approximately $16.796 billion – $11.081 billion = $5.715 billion more than what might be termed a somewhat optimistic estimate of likely available funding. This is equivalent to a shortfall of approximately $272 million annually. The estimated “oper-ating needs deficit” for Scenario 2 (Maintain Market Share) is approximately $7.234 billion and approximately $12.209 billion for Scenario 3 (Increase Market Share). While local government funding could be reasonably expected to make up some portion of these operating needs deficits, a significant shortfall between identified transit operating needs and currently expected funding can be expected.
Table 6.2 Comparison of Transit Operating Needs to Expected Revenues
Costs in Millions of YOE Dollars
2025 Scenario
Estimated Operating
Costs
Estimated Operating Funding
Estimated Unfunded
Needs
Average Unfunded
Needs per Year
Scenario 1 (Loss of Market Share) $16,796 $11,081 $5,715 $272
Scenario 2 (Maintain Market Share) 19,432 12,198 7,234 344
Scenario 3 (Increase Market Share) 26,011 13,802 12,209 581