radon atworkplacesin hungary - nucleus documents... · 2016-06-14 · radon atworkplacesin hungary...
TRANSCRIPT

Radon at workplaces in Hungary
Regional Workshop on Radon in Workplaces as an Element of a National Radon Action Plan, Tallinn, Estonia, 23 - 27th May 2016
Zsolt Homoki
National Public Health Center (NPHC)
National Research Directorate for Radiobiologyand Radiohygiene (NRDRR)

2
Content
• General information
• Legislation in Hungary
• Exposure of workers from radon
• Radon concentration in show caves, mines, mofett, SPAs
• Radon survey in kindergartens and crèche
• Radon survey in schools
• Reliability of short term measurements
3
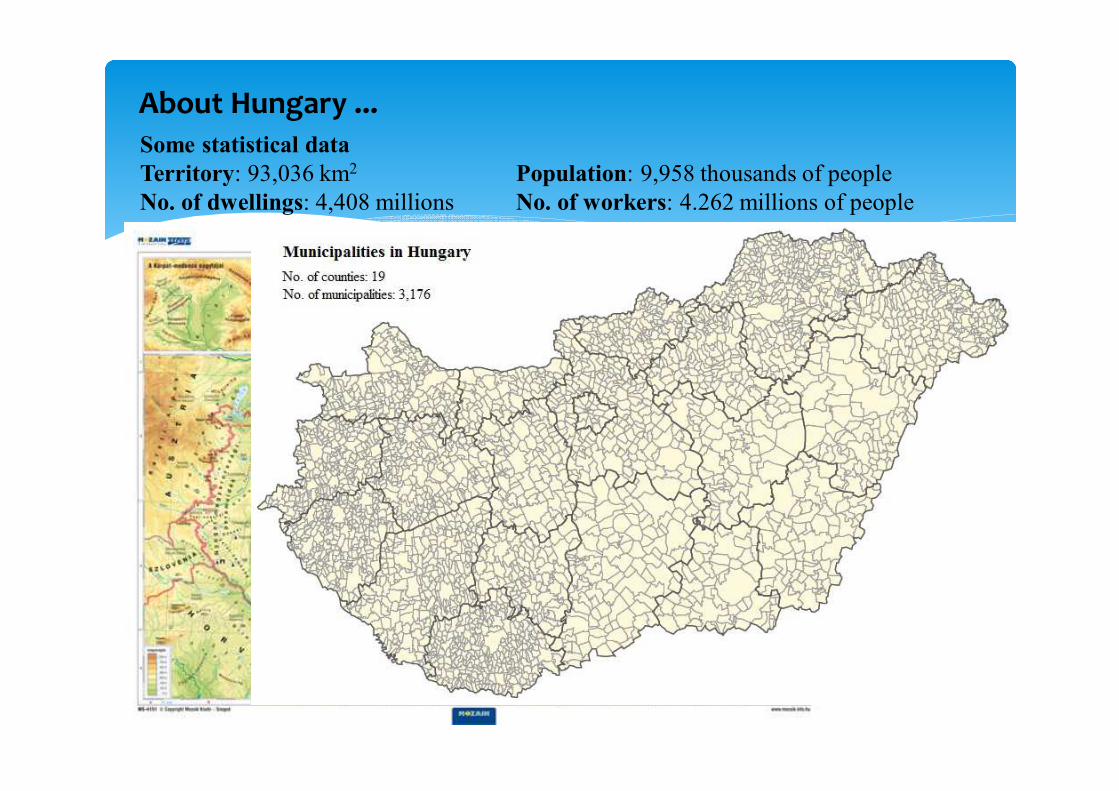
About Hungary ...
Some statistical dataTerritory: 93,036 km2 Population: 9,958 thousands of people
No. of dwellings: 4,408 millions No. of workers: 4.262 millions of people

4
Radon at workplaces – Legislation in Hungary
Year Legislation
1996 Act CXVI on Atomic Energy of 1996 • The minister responsible for health is authorised to regulate in decree the acceptable
level of the concentration of radon and radon daughter elements in residential and public
buildings.
2000 16/2000 Ministry of Health decree• Effective dose limit for workers: 100 mSv/ 5 years (external + internal exposure).
• The doses of workers are controlled by the health authority (NPHMO).
• If it can be assumed that, the workers are exposed to radon concerning the type of job,
by the assessment of the occupational exposure the doses from radon has to be also
taken into account.
• Action level for workplaces has been established in 1000 Bq/m3 annual average radon
concentration.
2016 487/2015 Government decree (instead of 16/2000 MH decree)• Effective dose limit for workers: 20 mSv/ year.
• The doses of workers are controlled by the nuclear authority (HAEA).
• This dose limit has to be also applied for those situation, when the workers should be
exposed by radon above the reference level 300 Bq/m3 annual average concentration.
• The employers are responsible to protect their employee against all kind of health risk
(involving the exposure to radon) and employers responsibility to ensure the personal
dosimetry of workers.

Years old General population
> 65 retired
18-65 adult
16-18 student
3-16 child
0-3 infant
5
Legislation categories for one person
Categories
inhabitant, home owner
workers(employee or employer)
(radiation or non-radiation)
general public
patient
endangered public
Exposure situation
dwelling
workplace
public building
medical examination or
treatment
living in the ambient of
an industrial facility
On the other hand the same person can be• a decision maker
• a member of the authority
• a radon professionals
• a building professionals
• a potentially exposed people

6
Workplaces, where the level of radon can be considerable
Where the main source is the natural environment
• Mines (uranium and other kind of ore) + following processing
• Show caves
• Mofetts (radon SPAs)
• Spas
• Others: underground workplaces (buildings)
Other activities which are regard to TENORM problemwhere the products or waste material can contain in high concentration U-238 andTh-232 isotopes.
• oil refinery
• burning of fuel (charcoal or gas) in power plants
• building material production (especially clay based products, like bricks, tiles)
• geothermal energy production
• fertilizer production (agriculture industry)
• purification of communal wastewater
• purification of (drinking) water
In most of these cases the disposal of the waste material or the by-product gives
problem.

7
Personal dosimetry
Categories for radiation workers:
A when the dose of the workers should be exceeded the 6 mSv/year
B when the dose of the workers should be not exceeded the 6 mSv/y
The exposure of A categorised workers have to be controlled!
It means wearing of personal dose meters.
The personal dosimetry service is provided by the NPHC National Research Directorate
for Radiobiology and Radiohygiene.
Type of dose metersBefore 2012 films
After 2012 TLDs (CaSO4(Tm) + LiBO4)
Both of them are able to measure only the doses to beta-, gamma- radiation and X-ray!
Exposure to radon �There is needed additional detectors!
Passive detectors are useful for personal radon dosimetry purposes.
Active detectors can be used to monitor places (rooms).

8
Control of exposure of workers from radon 1.
Uranium mines (Mecsek hill)(The mining was stopped and the mine was partly recultivated.)
Based on the legislation of the General Mining Committee (1972)
There were established limit for
- alpha-potential energy of radon progenies: 1 WLM (= 1,3·105 MeV/l)
- Ra-226 concentration in air: 1,1 mBq/m3 (= 3·10-11 µCi/ml),
- natural uranium concentration in air: 2,6 mBq/m3 (= 7·10-11 µCi/ml).
The measurements were taken at determined reference point daily or weekly and doses
of the workers were calculated using the monthly average value.
� The annual average radon exposure of the
miners for the period of 1956 – 1996.
Source:
Public Limited Company for Radioactive Waste
Managment, (András Várhegyi)
Görgy Köteles et al. Citogenetic examination of
uranium miners, 2007.

9
Control of exposure of workers from radon 2.
Manganese mines (Úrkút)(The mining was stopped not so far away because of economical reason.)
Originally the radon concentration in the mine was 2-3,000 Bq/m3 and somewhere
it could be ~ 10,000 Bq/m3 in isolated point.
After 2000 according to the actual valid legislation the radon-concentration was
monitored and a ventilation system was built in to decrease the level of
radon under the limit: 1000 Bq/m3. The doses of the workers were
controlled by personal dose meters.
After 2014 There was need to further mitigation action to comply the new legislation
(300 Bq/m3 reference level was established). The solution was applying of
personal ventilation system.
Source:
www.urkut-ufke.hu

10
222Rn and 220Rn six-monthly average activity concentrations at the Manganese
mine (Hungary)
0
200
400
600
800
1000
1200
1400
1600
1800
1 2 3 4 5 6 7 8 9 10 11 12 13 14 15 16 17 18 19 20
Number of measurement point
Ra
do
n a
nd
Th
oro
n c
on
ce
ntr
ati
on
[B
q/m
3]
Radon
Thoron
Radon and thoron concetration in Maganese minebased on the measurement of University of Pannonia

11
Control of exposure of workers from radon 3.
Show cave (Tapolca)2 functions: tourist visit and healing by radon.
The radon concentration in the cave is about 1 – 20 kBq/m3 depending on the season.
Exposure of workersThe tourist guider wears track etch detectors, which are evaluated monthly.
Out of working time the detectors are placed in radon safe cabin near to the entrance.
The annual dose of the workers are near to the dose limit (20 mSv). But if it is necessary
the working (residence) time of the tourist guider are restricted and more workers are
employed.
Earlier the radon concentration was measured by track etch detectors at several points in
the cave with monthly change. And level of radon was monitored by active detectors too
at more points with 1 hour resolution for 1 up to 3 years.
Source: www.tavasbarlang.hu

12
0
500
1000
1500
2000
2500
1 2 3 4 5 6 7 8
Number of measurement point
Ra
do
n a
nd
Th
oro
n c
on
ce
ntr
ati
on
[B
q/m
3]
Radon
Thoron
222Rn and 220Rn six-monthly average activity concentrations at the Hospital- and
Show Cave of Tapolca (Hungary)
Radon and thoron concetration in Show cave Tapolcabased on the measurement of University of Pannonia

13
Radon concentration in show caves and mines
In Hungary about 3,700 caves are recorded, and 30 show caves are opend for visitors.
Caves Place Radon concentration• Cave Szemlő-hegyi (Budapest) 4 - 8 kBq/m3
• Cave Béke (Aggtelek) ~ 8 kBq/m3
• Cave Szent István (Miskolc) ~ 0,15 - 1 kBq/m3
• Cave Baradla (Aggtelek) 1-2 kBq/m3 (south-west end point)
(Jósvafő) ~ 5 kBq/m3 (north-east end point)
Clay mine (Felsőpetény)Radon concentration during working time: ~ 1 kBq/m3
out of working time: 5-15 kBq/m3
The referred measurements were made by• Academy of Hungarian Science, Instiute for Nuclear Research, Debrecen
• University of Pannonia, Institution for Radiochemistry and Radioecology, Veszprém
• collaboration with other universities and institutions
� The exposure of the tourist guiders and workers was measured in these caves too, but their
calculated doses were below the dose limit, therefore they do not wear personal dose
meters.
� By the calculation of the doses to radon the equilibrium factor (Feq) has big importance to
the results, but its value shows high spatial and time variation!

14
Source: www.anp.hu
Show caves, which are opened for tourists �
Cave Baradla

15
Radon concentration in Mofetts 1.
In Hungary two mofetts are operated: one in Mátraderecske and one in Parádfürdő.
They were examined by Phd. István Csige (Hungarian Academy of Science, Debrecen).
16
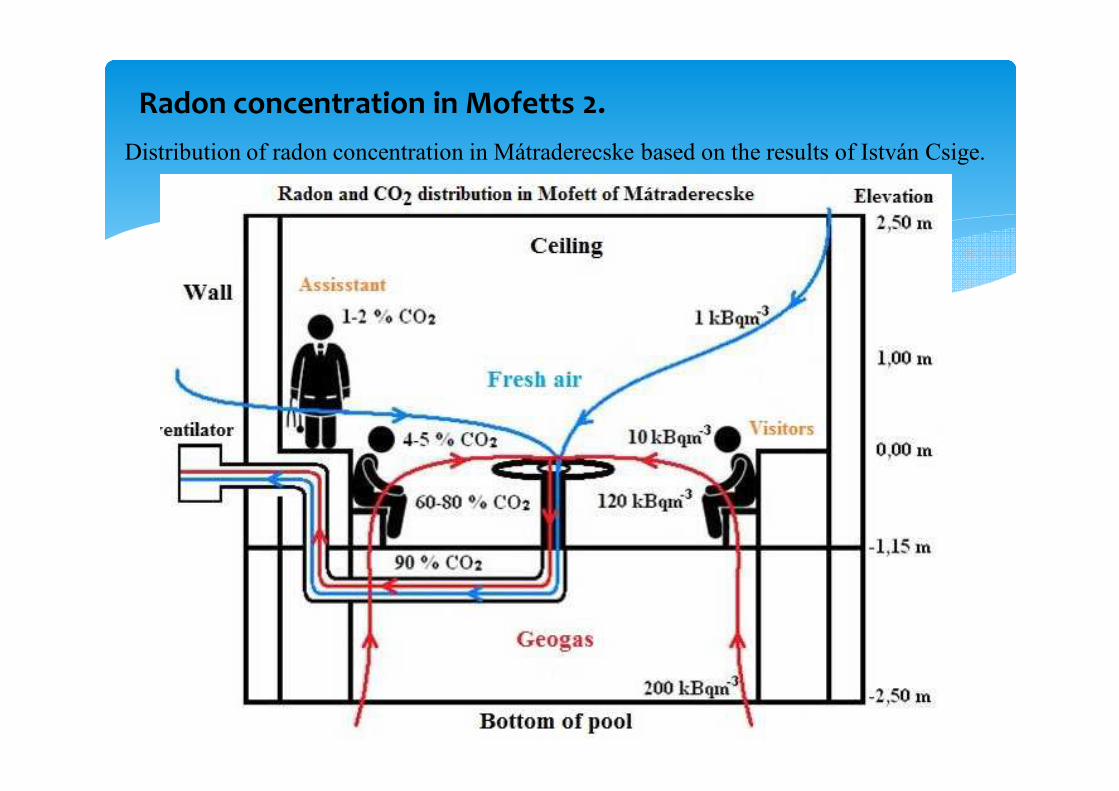
Radon concentration in Mofetts 2.
Distribution of radon concentration in Mátraderecske based on the results of István Csige.

17
Radon survey of kindergartens and crèche
• István Nikl organised a nationwide radon survey in kindergartens and in crèche in 1998.
• He made measurement in 302 from the total 4,466 institutions, in 364 group rooms.
• The sampling points placed in 206 settlements covering the whole territory of Hungary.
• The examination was started in January and finished in June of 1998 (6 months).
• Type of detectors electret (E-Perm) for radon and
TLD (CaSO4(Tm)) for gamma-radiation
Source: I. Nikl, Gy. Köteles, The radon concentration, the environmental dose and the originated
exposure in Hungarian kindergartens and crèche, Egészségtudomány, Vol. 44, pp. 42-48, 2000.
Examination Avaregevalue
Min – max valueNationalaverage
Radon concentration 90 Bq/m3 10 – 1350 Bq/m3 128 Bq/m3
Gamma dose rate 107 nGy/h 57 – 384 nGy/h 127 nGy/h
The statistical results
10 Bq/m 3 < 50 Bq/m 3 < 100 Bq/m 3 < 600 Bq/m 3 <
93 % 60 % 26 % 2,5 %
Radon conc.distribution
• Using these results the annual dose of the children was founded to be 0,49 mSv.
He calculated with 2000 h residence time (50 × 8 h) per year by this estimation.

18
Rn-222 and Ra-226 concentration in thermal waters and SPSs
Indoor radon conc. in Rudas SPA in 1994 Rn and Ra conc. in thermal waters
SPAs Rn-222 Ra-226(Bq/l) (mBq/l)
Rudas SPAJuventus spring 126-154 522-646
Attila spring 211-363 500-834
Hungária spring 262-393 536-699
Rác SPARác Nagy spring 122 697-800
Lukács SPABoltív spring 18 73-99
Római spring 61 48-91
Rn conc. in thermal waters and SPAs
Török SPA Rn-222 Indoor radon(Bq/l) (Bq/m3)
Török spring 82 - 134 118-3484Sources:• Pável Szerbin, Radon in the air of Rudas SPA, Fizikai szemle, Vol. 6, pp 241 (1994)
• Eszter Baradács, Radon and radium content of mineral and thermal waters, Phd Thesis, Debrecen, Hungary (2002)
• Norber Kávási, Determination of annual average radon concentration and exposure to radiation at different
workplaces, Phd Thesis, Veszprém, Hungary (2006)

19
Radon survey in schools – in 2007
• The survey was organised by Gábor Kocsy (NRIRR) in 2006.
• Start: he send letters to the directors of the schools to ask to participate in the survey.
• The ratio of the positive feedback was 37 – 57%.
• A package was sent to schools containing
- background information about the survey and instruction to the placement
- 3 track etch detectors + 1 TLD (CaSO4:Tm)
- questioner about the building characteristic
• Exposure time: 1,5 month (in Spring of 2007)
Radon survey in schools – started in 2015
• This survey is organised by- University of Pannonia, Institution for Radiochemistry and Radioecology, Veszprém
- Social Organisation for Radioecological Cleanliness, Veszprém
- Szent István University, Gödöllő
• 99 kindergartens participate in the survey from 89 settlements (43% of total)
• Planned examinations- indoor radon and thoron concentration
- indoor and outdoor gamma dose rate
- soil gas concentration and permeability measurements
- soil sampling and analyse by gamma-ray spectrometry for (Ra-226, Th-232, K-40)
- radon and thoron exhalation and emanation measurements

20
Veszprém county
Name of schools
Exposure time (day)
Radon conc.
(Bq/m3)
SD (Bq/m3)
Gam-ma
dose rate
(nSv/h)
Uncer. (nSv/h)
Ajka
Kossuth Lajos Általános Iskola 47 65 22,5 86,2 0,1
Mikes Kelemen Általános Iskola 44 530 11,9 114,6 5,6
Fekete István Általános Iskola 49 124 29,2 129 1,4
Eötvös Loránd Általános Iskola 49 175 50,7 155,3 3
Vörösmarty Mihály Általános Iskola és Gimnázium
50 87 2,7 115 2
Balatonfőkajár
Balatonfőkajár-Csajág Általános Iskola
47 55 33,8 73,6 0,3
Balatonfüred
Eötvös Loránd Általános Iskola 47 28 3,5 85,3 1
Pápa
Weöres Sándor Általános Iskola 50 40 11,1 61,1 1,3
Sümeg
Kisfaludy-Ramassetter Iskola 56 110 17,6 89,3 1,3
Szigliget
Szigligeti Közös Fenntartású Általános Iskola
49 54 11,7 99,9 4
Várpalota
Várkerti Általános Iskola és Szakiskola
57 65 12,1 91,7 3,1
Veszprém
Báthory István Általános Iskola 50 32 7,7 83 0,5
Zirc
Reguly Antal Általános Iskola és Előkészítő Szakiskola
61 39 4,2 117,1 9,5
Results of
survey of
schools -2007
1.

21
Alföld
Name of shools
Exposure time (day)
Radon con. (Bq/m3)
SD (Bq/m3)
Gamma dose rate (nSv/h)
Uncer. (nSv/h)
Kecskemét
Lánchíd Utcai Általános Iskola 51 27 11,0 80,5 2,8
Piarista Általános Iskola, Gimná-zium és Diákotthon
47 21 6,7 86,8 0,1
Kiskőrös
Bem József Általános Iskola 47 26 9,6 86,7 0,7
Kiskunhalas
Fazekas Gábor Utcai Általános Iskola
47 83 19,3 114,3 7,5
Kertvárosi Általános Iskola 49 32 6,8 74,5 1,1
Soltvadkert
Kossuth Lajos Általános Iskola és Alapfokú Művészetoktatási Intézmény
47 121 11,9 111,6 2,1
Tabdi
Tabdi Általános Iskola 68 35 16,7 88,8 1,4
Results of survey of schools -2007 2.

22
Pest county
Iskola neve
Exposure time (day)
Radon conc.
(Bq/m3)
SD (Bq/m3)
Gamma dose rate (nSv/h)
Uncer. (nSv/h)
Abony
Somogyi Imre Általános Iskola 47 46 24,4 98 2,1
Jászberény
Gróf Apponyi Albert Általános Iskola és Alapfokú Művészetok-tatási Intézmény
47 49 8,0 89,1 2,5
Belvárosi Általános Iskola 49 35 7,1 102 4,4
District XII of Budapest Name of schools
Exposure time (day)
Radon conc.
(Bq/m3)
SD (Bq/m3)
Gamma dose rate (nSv/h)
Uncer. (nSv/h)
Árpád Utcai Általános és Német Nemzetiségi Iskola
47 90 16,0 111,6 7,6
Bartók Béla Általános Iskola 51 20 8,2 93,3 4
Csillagjáró Általános Iskola 72 80 11,8 80,4 6,5
Rózsakerti Általános Iskola 56 22 10,0 62,9 1,6
Results of survey of schools – 2007 3.

23
Reliability of short term measurements
After the stop of ventilation of a room the radon concentration will generally increase to a
certain time and after that it remains at an „equilibrium level”.
106 Bq/m3
1. day 2. day
3. day
1. day 2. day
3. day4. day
324 Bq/m3
48 Bq/m3
316 Bq/m3
1. day 2. day 3. day4. day 5. day

24
Thank you for your kind attention!