radon-222 and radium-226 occurrence in water: a review
TRANSCRIPT

Radon-222 and radium-226 occurrence in water: a review
FREDERIC GIRAULT1*, FREDERIC PERRIER1 & TADEUSZ A. PRZYLIBSKI2
1Institut de Physique du Globe de Paris, Sorbonne Paris Cite,
Universite Paris Diderot, CNRS, F-75005 Paris, France2Faculty of Geoengineering, Mining and Geology, Division of Geology and Mineral Waters,
Wrocław University of Technology, 50-370 Wrocław, Poland
*Correspondence: [email protected]
Abstract: A total of 2143 dissolved radon-222 and radium-226 activity concentrations measuredtogether in water samples was compiled from the literature. To date, the use of such a large data-base is the first attempt to establish a relationship for the 226Ra–222Rn couple. Over the whole data-set, radon and radium concentrations range over more than nine and six orders of magnitude,respectively. Geometric means yield 9.82 + 0.73 Bq l21 for radon and 54.6 + 2.7 mBq l21 forradium. Only a few waters are in 226Ra–222Rn radioactive equilibrium, with most of them beingfar from equilibrium; the geometric mean of the radium concentration in water/radon concentra-tion in water (CRa/CRn) ratio is estimated to be 0.0056 + 0.0004. Significant differences in radonand radium concentrations are observed between groundwaters and surface waters, on the onehand, and between hot springs and cold springs, on the other. Within water types, typical rangesof radon and radium concentrations can be associated with subgroups of waters. While the radiumconcentration characterizes the geochemistry of the groundwater–rock interaction, the radon con-centration, in most cases, is a signal of non-mobile radium embedded in the encasing rocks. Thus,the 226Ra–222Rn couple can be a useful tool for the characterization of water and for the identifi-cation of water source rocks, shedding light on the various water–rock interaction processes takingplace in the environment.
Supplementary material: The database is available as a table at https://doi.org/10.6084/m9.fig-share.c.3582131
Radon-222 is a noble, odourless colourless radioac-tive gas with a half-life of 3.82146 + 0.00020 days(Bellotti et al. 2015). In the uranium-238 radioactivedecay chain, radon-222 is produced by the alpha-decay of the radioactive alkaline earth metalradium-226, which has a half-life of 1600 + 7years (Duchemin et al. 1994). Radon gas is ubiqui-tous in the environment (Tanner 1964a), as a gasphase in air, an adsorbed phase onto minerals or asa dissolved phase in liquids (Nazaroff 1992).Radium is either as a solid phase within and at thesurface of mineral grains, or as a dissolved phasein liquids. To understand the occurrence ofradon-222 in the environment, it is therefore essen-tial to also study the occurrence of radium-226.Although environmental and health concerns areissues that have been around for a long time (Kinget al. 1982), the other radium isotopes (mainlyradium-228), unrelated to radon-222, are not thesubject of this review. Throughout this paper, wewill thus refer to ‘radon-222’ and ‘radium-226’ as‘radon’ and ‘radium’, respectively.
The first quantitative observations of radioactiv-ity in liquid samples using ‘radium emanation’ (i.e.radon) measurements were performed by Curie &
Laborde (1904, 1906) on several European thermalsprings, and independently by Strutt (1904) on thethermal spring of Bath, UK. The dissolved radonactivity concentration (hereinafter we will onlyuse the term ‘concentration’) in liquid samples, usu-ally expressed in Bq l21, is still commonly mea-sured using these pioneering emanation methodsin the laboratory or even directly in the field (e.g.Baykara & Dogru 2006; Schubert et al. 2006; Gir-ault & Perrier 2014), although continuous measure-ment methods exist (e.g. Burnett et al. 2006;Peterson et al. 2010; Luo et al. 2016). Dissolvedradium activity concentration in liquid samples(Jia & Jia 2012), usually expressed in mBq l21, isgenerally measured using liquid scintillation spec-trometry (e.g. Aupiais et al. 1998), alpha spec-trometry (e.g. Morvan et al. 2001) and massspectrometry (e.g. Copia et al. 2015), but also withradon emanation (e.g. Kohler et al. 2002; Przylibskiet al. 2014; Perrier et al. 2016a). Several studiesmeasured together dissolved radon-222 andradium-226 in liquids. One of the first most signifi-cant combined studies of radon and radium concen-trations in water was carried out on a large numberof springs in Japan (Nakai 1940).
From: Gillmore, G. K., Perrier, F. E. & Crockett, R. G. M. (eds) Radon, Health and Natural Hazards.Geological Society, London, Special Publications, 451, https://doi.org/10.1144/SP451.3# 2016 The Author(s). Published by The Geological Society of London. All rights reserved.For permissions: http://www.geolsoc.org.uk/permissions. Publishing disclaimer: www.geolsoc.org.uk/pub_ethics
by guest on December 3, 2016http://sp.lyellcollection.org/Downloaded from

The 226Ra–222Rn couple is of particular interestin the water environment. To begin with, radon andradium are the subjects of numerous radiologicaland epidemiological studies worldwide (e.g. GusevaCanu et al. 2011). Radium in water can be ingested(Wrenn et al. 1985; Hoffmann et al. 1993; IARC2012), and the resulting dose can be a concern inareas contaminated by the uranium mining industry(Xu et al. 2002; Bollhofer et al. 2011; Carvalho et al.2014), by radium processing plants (Tyler et al.2013) and by radium-activated items such as dialwatches (Gillmore et al. 2012). Radon in wateris a more extensive problem as it can easily escapefrom water (Tanner 1964b), and, therefore, water isa source of radon in dwellings (Vinson et al. 2008).Radon represents half the annual radiation dose tothe general population (Porstendorfer 1994) and isa major cause of lung cancer (Darby et al. 2004;IARC 2012). Thus, the radium and radon levels inwater are major health issues. In addition to theradiological studies of contaminated waters mainlynear uranium and phosphate mines, particular atten-tion has been given to drinking waters and tapwater, for which current regulations strongly dependon the country concerned. Nowadays, the upperlimits of radon and radium concentrations inwater are set at 100 Bq l21 and 500 mBq l21, res-pectively, by the European Commission (CouncilDirective 2013).
Radium is relatively immobile in water, and itsconcentration is controlled by the uranium contentof the encasing rocks and the recoil process fromthe alpha-decay of thorium-230, with a strongdependence on the water chemistry, including theion concentrations of Ca2+, Mg2+, Ba2+, Cl2 andSO4
2−, salinity, TDS (total dissolved solids), pH,and Eh (redox conditions) (Kraemer & Reid 1984;Tomita et al. 2010; Rosenberg et al. 2011a, b;Szabo et al. 2012). The radon concentration inwater results from the radium concentration inwater, emanation from the surrounding rocks (Przy-libski 2000) which includes the recoil process(Krishnaswami et al. 1982), and equilibrium in thewater and air phases. To complicate matters further,the water–air partition coefficient of radon, in addi-tion to temperature, has been shown to depend onsalinity, in particular for cold and saline waters(Schubert et al. 2012). Thus, in addition to the healthissues, radium and radon can trace geological pro-cesses (Krishnaswami et al. 1982; Rama & Moore1984) and complement other geochemical tools(Sarin et al. 1990): for example, around hydrother-mal areas (Girault & Perrier 2014).
In this review paper, we present a compiled data-set of radon-222 and radium-226 activity concentra-tions in various waters available in the literature. Wefocused our selection on studies where radon andradium were effectively measured and where values
were directly exploitable from the text of each arti-cle. We assembled a total of 2143 radon and radiumentries from 116 references. After presenting thedatabase, we summarize the range of radon andradium concentration values in water, and discussthe patterns of the 226Ra–222Rn couple for differentwater types.
Description of the database
The database was built using references whereradon-222 and radium-226 activity concentrationswere measured on the same water samples by thesame authors, and where measured values weredirectly exploitable from the text of the article.We only selected data above the detection level,as indicated by the authors. To date, we havefound a total of 2143 radon and radium measure-ments in water, including 116 references.
The compiled references are gathered and num-bered in Table 1. Of the 116 references, a large num-ber dealt with radiological water quality (49references, thus 42%), either at relatively small spa-tial scales, such as cities or restricted geographicalregions (40 references, 82%), or at larger spatialscales, such as countries or vast geographicalregions (nine references, 18%). We then found stud-ies mainly focusing on the sources and transportprocesses of water in various geological contexts(22 references, 19%). There were also studies (9–10%) on the mapping and monitoring of radon andradium concentrations in water (12 references),about the relationships with water chemistry andoverall water–rock interaction (12 references),and, more recently, on the detection and quantifica-tion of submarine groundwater discharges (10 refer-ences). In a lesser proportion (≤5%), we foundstudies about nuclear waste and radioactive ele-ments (six references), general method assessments(three references), and on exploration and economicpurposes (two references).
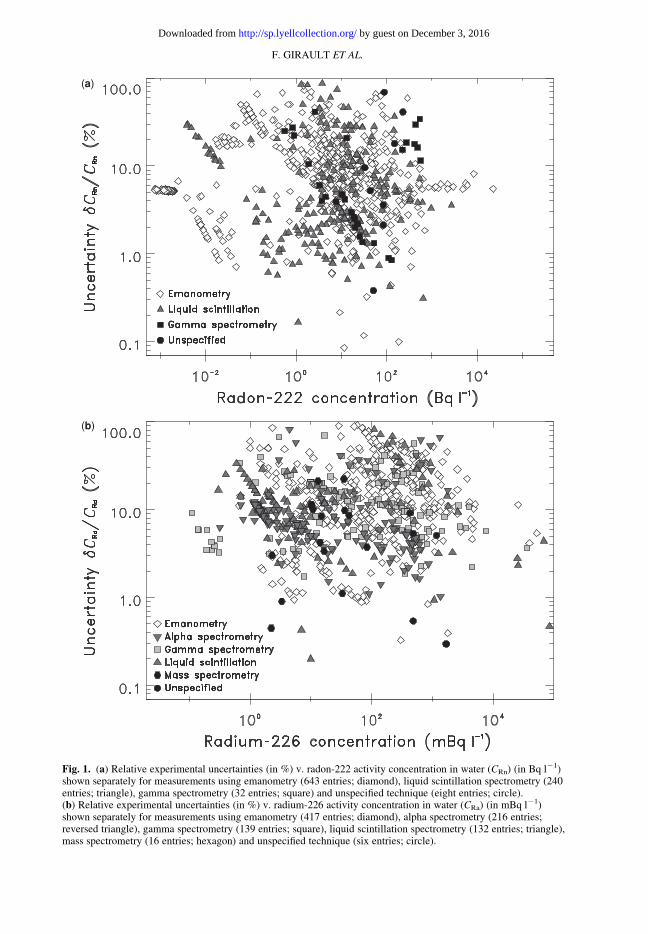
To measure the radon concentration in water(CRn), a majority of references used the emanometrytechnique (69 references, thus 59%). The liquidscintillation and the gamma spectrometry methodswere employed in 28 references (24%) and 12 refer-ences (10%), respectively. Experimental uncertain-ties in the radon concentration in water were onlygiven in 65 references (56%). These are shown inFigure 1a as a function of radon concentration.Uncertainties vary, on average, from 5% to 30%for CRn , 0.1 Bq l21, and from 1 to 10% for CRn .100 Bq l21. In general, for small CRn values, liquidscintillation is the best method; for larger CRn
values, liquid scintillation and emanometry givesimilar results. To measure the radium concentra-tion in water (CRa), a large number of references
F. GIRAULT ET AL.
by guest on December 3, 2016http://sp.lyellcollection.org/Downloaded from

used the emanometry technique (55 references, thus47%). Gamma spectrometry (26 references, 23%),alpha spectrometry (18 references, 16%), liquidscintillation (15 references, 13%) and mass spec-trometry (two references, 2%) methods were alsoemployed. Experimental uncertainties in the radiumconcentration in water were given in only 68 refer-ences (59%). These are shown in Figure 1b as afunction of radium concentration. Uncertainties vary,on average, from 3 to 30% for CRa , 1 mBq l21,and from 1 to 10% for CRa . 1000 mBq l21. In gen-eral, for small CRa values, liquid scintillation, alphaspectrometry and gamma spectrometry are thebest methods; for larger CRn values, liquid scintilla-tion, gamma spectrometry and emanometry givesimilar results.
Over the whole number of references (116), 39(34%) focused on radon and radium concentrationsin spring waters (including 26 references, thus 25%,in hot springs), 69 (59%) in groundwaters, 20 (17%)in surface waters and 18 (16%) in drinking waters.Over the 2143 entries of the database, 551 entries(26%) correspond to spring waters (including 250entries, thus 12%, for hot springs), 1043 entries(49%) to groundwaters, 310 entries (14%) to surfacesprings and 239 entries (11%) to drinking waters.Spring waters include hot spring waters, hydrother-mal waters, sensu lato spring waters, water frompools, and mineral and drinking spring waters;groundwaters include well waters, brine well watersand sensu lato groundwaters; surface waters includeriver waters, meltwaters, lake waters, stream waters,seawater and sensu lato surface waters; drinkingwaters include mineral waters, bottled waters and,also here, unspecified drinkable waters from wellsor springs. In the following, we gather groundwatersand springs together, as spring waters are simplygroundwaters flowing out onto the surface. Radonand radium concentrations in the overall dataset ofwater samples and in the different water types arestudied separately in the following. Thanks to thelarge size of the database, meaningful general con-clusions can be attempted.
Radon-222 in water
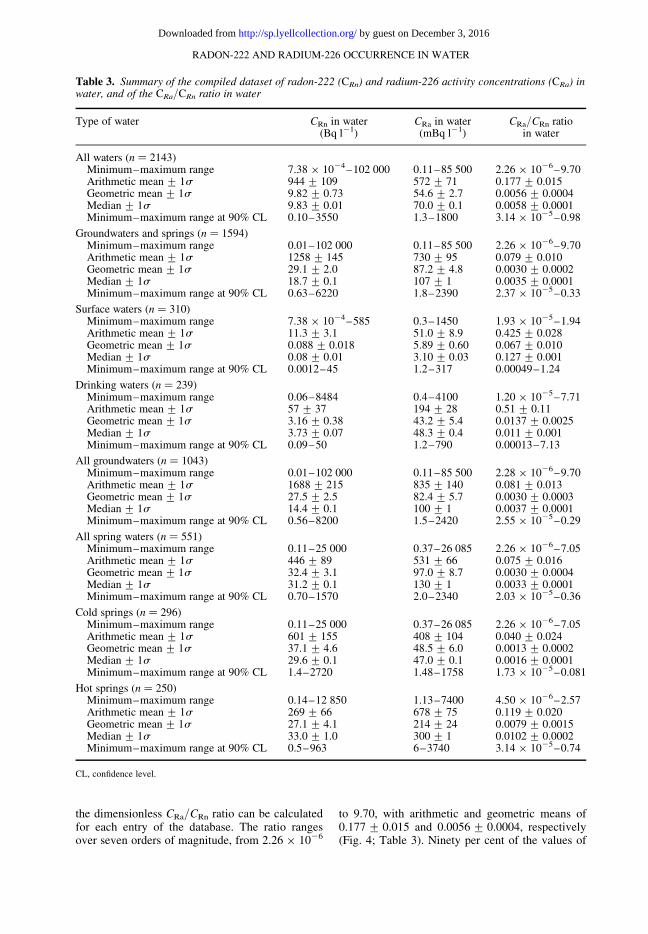
In the compiled dataset, the radon concentration inwater ranges over more than nine orders of mag-nitude, from 7.38 × 1024 to 102 000 Bq l21. Thismaximum value (Table 2) corresponds to a well atStripa granite, Sweden (Andrews et al. 1989). Thearithmetic and geometric means give 944 + 109and 9.82 + 0.73 Bq l21, respectively (Fig. 2a;Table 3). Radon concentration in water is thus char-acterized by an extreme variability, reminiscent of aphysical parameter such as permeability or electri-cal conductivity. Ninety per cent of values range
from 0.10 to 3550 Bq l21, and the median yields9.83 + 0.01 Bq l21. The distribution could beinterpreted as the sum of two dominating Gaussiandistributions centred around 8 Bq l21 (Fig. 2a). Sec-ondary peaks around 2 × 1024, 1022, 2, 6 × 102,7 × 103 and 3 × 10⁴ Bq l21 stand out well againstthe general trend.
Significant differences are observed betweenwater types (Fig. 2; Table 3). For groundwatersand springs (Fig. 2b), the distribution of radon con-centration values is rather wide, with 90% of valuesaround the median from 0.63 to 6220 Bq l21, andwith a particularly large fraction of entries (1124entries, 75%) from 2 to 500 Bq l21. The geometricmean reaches 29.1 + 2.0 Bq l21. Secondary peaksof the distribution are shown at 0.7, 2, 200, 103
and above 104 Bq l21. Only few values around0.1 Bq l21 were found. The distribution exhibitsan extended right-hand tail towards higher values.Indeed, a total of 51 entries have radon concen-trations above 104 Bq l21, with maximum values(Table 2) occurring in wells from the Stripa granite,Sweden (Andrews et al. 1982a, 1989), from theYlasto–Helsinki region, Finland (Asikainen & Kah-los 1979) and from the Wettinquelle cold spring atBad Brambach, Germany (Heinicke et al. 1995a;Appendix A).
In general, significantly smaller radon concen-tration values are found in surface waters (Fig. 2c),with 90% of values between 0.0012 and 45 Bq l21,and a geometric mean of 0.088 + 0.018 Bq l21.Only 36 entries yield values larger than 10 Bq l21.The distribution clearly exhibits four distinctmodes at 1.5 × 10²³, 1.5 × 10²², 6 × 10²¹ andaround 8 Bq l21. Drinking waters show intermediateradon concentration values between those of ground-waters and springs and those of surface waters(Fig. 2d), with 90% of values ranging from 0.09to 50 Bq l21. The distribution exhibits only onemain mode, almost Gaussian, consistent with thegeometric mean of 3.16 + 0.38 Bq l21. Entrieswith values smaller than 1 Bq l21 and higher than100 Bq l21 are scarce. Nevertheless, a large valueof 8484 + 688 Bq l21 was reported for the Wettin-quelle public fountain at Bad Brambach, Germany(Appendix A).
Radium-226 in water
In the compiled dataset, the radium concentration inwater has a less extended distribution than radon,and ranges over six orders of magnitude, from 0.11to 85 500 mBq l21. This maximum value (Table 2)corresponds to a brine well at the Ustron Healthresort in Poland (Kozłowska et al. 2010). Thearithmetic and geometric means give 572 + 71and 54.6 + 2.7 mBq l21, respectively (Fig. 3a;
RADON-222 AND RADIUM-226 OCCURRENCE IN WATER
by guest on December 3, 2016http://sp.lyellcollection.org/Downloaded from

Table 1. List of all compiled references
No. References MethodCRn*
MethodCRa*
Goal† No. References MethodCRn*
MethodCRa*
Goal†
1 Girault & Perrier (2014) E E T 59 Villalba et al. (2006) LS LS Q2 This study E E T 60 Vesterbacka et al. (2005) LS LS Q3 Rodenas et al. (2008) GS AS Q 61 Schettler et al. (2015) LS LS, MS, AS, GS S4 Przylibski (2011) LS LS Q 62 Sadat-Noori et al. (2015) E E S5 Chung (1981) E E M 63 Santos & Eyre (2011) E E S6 Krishnaswami et al. (1991) E E N 64 Rodellas et al. (2012) E GS S7 Andrews et al. (1989) E E N 65 Reynolds et al. (2003) E GS I8 Moise et al. (2000) E, GS GS M 66 Purkla & Eisenhauer (2004) LS AS S9 Asikainen & Kahlos (1979) GS AS T 67 Peterson et al. (2008) E E, GS S
10 Nakai (1940) E E E 68 Lopez & Sanchez (2008) LS, GS AS Q11 Eross et al. (2012) LS AS I 69 Lamontagne et al. (2008) LS AS S12 Onishchenko et al. (2010) E E Q 70 Kobal et al. (1990) E E M13 Condomines et al. (2012) E GS T 71 Hussain et al. (1999) E E S14 King et al. (1982) E E Q 72 Bettencourt et al. (1988) GS AS Q15 Luo et al. (2000) E GS N 73 Kiro et al. (2015) E E T16 Tricca et al. (2001) U GS T 74 Gattacceca et al. (2011) E MS S17 Andrews et al. (1982a) U U N 75 Erees et al. (2006) E E M18 Kies et al. (2011) LS LS T 76 Oliveira et al. (2001) LS AS Q19 Dymond et al. (1983) E E T 77 Oliveira et al. (1998) LS AS M20 Clark & Turekian (1990) E E, GS T 78 Cevik et al. (2006) LS GS Q21 Chaudhuri et al. (2010) E U Q 79 Burnett et al. (2008) E GS S22 Duenas et al. (1998) GS AS Q 80 Asikainen (1981) LS LS I23 Beitollahi et al. (2007) LS E Q 81 Amrani (2002) E GS Q24 Roba et al. (2010) E E M 82 Othman & Yassine (1996) E E M25 Tabar et al. (2013) E E Q 83 Salonen (1988) LS AS Q26 Gainon et al. (2007) E E T 84 Soto et al. (1988) GS LS Q27 Baradacs et al. (2001) E E, GS Q 85 Andrews et al. (1982b) U U T28 Vinson et al. (2009) LS E I 86 Le Cong et al. (2015) E E Q29 Krishnaswami et al. (1982) E GS N 87 Roba et al. (2012) E E I30 Stojkovic et al. (2015) LS GS Q 88 Kozłowska et al. (2010) LS LS T
F.
GIR
AU
LT
ET
AL
. by guest on Decem
ber 3, 2016http://sp.lyellcollection.org/
Dow
nloaded from

31 Althoyaib & El-Taher (2015) E GS Q 89 Jacobi (1949) E E A32 Elliot et al. (2014) E E Q 90 Walencik et al. (2010) LS LS Q33 Al-Masri & Blackburn (1999) LS LS T 91 Szerbin & Koteles (2002) E E Q34 Moldovan et al. (2014) E E Q 92 Thomas et al. (1993) LS E Q35 Nelson et al. (1983) GS GS T 93 Sun & Li (2001) U U T36 Przylibski et al. (2014) LS LS Q 94 Kelkar & Joshi (1969) E AS A37 Santos & Bonotto (2014) E E Q 95 Asikainen & Kahlos (1980) GS AS Q38 Sac et al. (2014) E E Q 96 Danali et al. (1986) GS GS Q39 Tanner (1964b) E E I 97 Hammond et al. (1988b) E GS T40 Strain et al. (1979) E E Q 98 Hammond et al. (1988a) E E I41 Binesh et al. (2011) E E Q 99 Segovia et al. (1999) LS GS T42 Forozani & Soori (2011) E E Q 100 Kasztovszky et al. (1996) E LS Q43 Przylibski et al. (2002) E GS M 101 Heinicke et al. (1995a) U U T44 Wallner & Steininger (2007) LS LS Q 102 Szerbin (1996) E E Q45 Andrews & Wood (1974) U U M 103 Petrovic Pantic et al. (2015) E E T46 Bonotto (2004) E E, GS Q 104 Vengosh et al. (2009) U GS Q47 Duenas et al. (1999) GS AS Q 105 Vinson et al. (2013) LS E I48 Isam Salih et al. (2002) GS GS Q 106 Shivakumara et al. (2014) E E Q49 Jowzaee (2013) LS LS A 107 Weaver & Bahr (1991) U U T50 Kronfeld et al. (1991) E E T 108 Chandrashekara et al. (2012) E GS Q51 Mazor (1962) E E E 109 Godoy & Godoy (2006) U AS Q52 Choubey et al. (2001) E E M 110 Rajesh et al. (2014) E E Q53 Sahin et al. (2013) E E Q 111 Watson Jr. & Mitsch (1987) E E N54 Zhuo et al. (2001) E E Q 112 Outola et al. (2008) E GS Q55 Zukin et al. (1987) E E I 113 Cozma et al. (2016) E E M56 Murad et al. (2014) LS LS Q 114 Hartman & Hammond (1984) E E I57 Yarar et al. (2015) E E M 115 Fonollosa et al. (2016) LS AS T58 Wanty et al. (1991) E E I 116 Rutgers van der Loeff et al. (2014) E AS I
*Measurement methods for radon-222 and radium-226 activity concentrations in water include: E, emanometry; GS, gamma spectrometry; AS, alpha spectrometry; LS, liquid scintillation spectrometry; MS,mass spectrometry; U, unspecified technique.†Reference purposes (goal) include mainly: Q, radiological water quality; T, source and transport processes of water; M, mapping and monitoring of radon and radium concentrations in water; S, detection andquantification of submarine groundwater discharges; E, relationships with water chemistry and overall water–rock interaction; N, with nuclear wastes and radioactive elements; E, with exploration and eco-nomic purposes; A, on general method assessment.
RA
DO
N-2
22
AN
DR
AD
IUM
-226
OC
CU
RR
EN
CE
INW
AT
ER
by guest on Decem
ber 3, 2016http://sp.lyellcollection.org/
Dow
nloaded from
(a)
(b)
Fig. 1. (a) Relative experimental uncertainties (in %) v. radon-222 activity concentration in water (CRn) (in Bq l21)shown separately for measurements using emanometry (643 entries; diamond), liquid scintillation spectrometry (240entries; triangle), gamma spectrometry (32 entries; square) and unspecified technique (eight entries; circle).(b) Relative experimental uncertainties (in %) v. radium-226 activity concentration in water (CRa) (in mBq l21)shown separately for measurements using emanometry (417 entries; diamond), alpha spectrometry (216 entries;reversed triangle), gamma spectrometry (139 entries; square), liquid scintillation spectrometry (132 entries; triangle),mass spectrometry (16 entries; hexagon) and unspecified technique (six entries; circle).
F. GIRAULT ET AL.
by guest on December 3, 2016http://sp.lyellcollection.org/Downloaded from
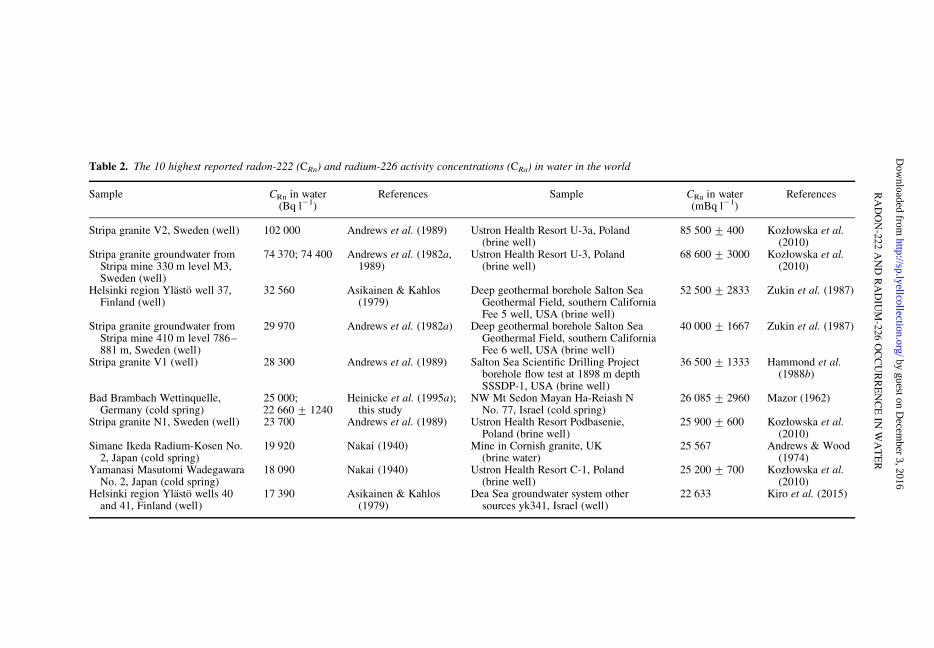
Table 2. The 10 highest reported radon-222 (CRn) and radium-226 activity concentrations (CRa) in water in the world
Sample CRn in water(Bq l21)
References Sample CRa in water(mBq l21)
References
Stripa granite V2, Sweden (well) 102 000 Andrews et al. (1989) Ustron Health Resort U-3a, Poland(brine well)
85 500 + 400 Kozłowska et al.(2010)
Stripa granite groundwater fromStripa mine 330 m level M3,Sweden (well)
74 370; 74 400 Andrews et al. (1982a,1989)
Ustron Health Resort U-3, Poland(brine well)
68 600 + 3000 Kozłowska et al.(2010)
Helsinki region Ylasto well 37,Finland (well)
32 560 Asikainen & Kahlos(1979)
Deep geothermal borehole Salton SeaGeothermal Field, southern CaliforniaFee 5 well, USA (brine well)
52 500 + 2833 Zukin et al. (1987)
Stripa granite groundwater fromStripa mine 410 m level 786–881 m, Sweden (well)
29 970 Andrews et al. (1982a) Deep geothermal borehole Salton SeaGeothermal Field, southern CaliforniaFee 6 well, USA (brine well)
40 000 + 1667 Zukin et al. (1987)
Stripa granite V1 (well) 28 300 Andrews et al. (1989) Salton Sea Scientific Drilling Projectborehole flow test at 1898 m depthSSSDP-1, USA (brine well)
36 500 + 1333 Hammond et al.(1988b)
Bad Brambach Wettinquelle,Germany (cold spring)
25 000;22 660 + 1240
Heinicke et al. (1995a);this study
NW Mt Sedon Mayan Ha-Reiash NNo. 77, Israel (cold spring)
26 085 + 2960 Mazor (1962)
Stripa granite N1, Sweden (well) 23 700 Andrews et al. (1989) Ustron Health Resort Podbasenie,Poland (brine well)
25 900 + 600 Kozłowska et al.(2010)
Simane Ikeda Radium-Kosen No.2, Japan (cold spring)
19 920 Nakai (1940) Mine in Cornish granite, UK(brine water)
25 567 Andrews & Wood(1974)
Yamanasi Masutomi WadegawaraNo. 2, Japan (cold spring)
18 090 Nakai (1940) Ustron Health Resort C-1, Poland(brine well)
25 200 + 700 Kozłowska et al.(2010)
Helsinki region Ylasto wells 40and 41, Finland (well)
17 390 Asikainen & Kahlos(1979)
Dea Sea groundwater system othersources yk341, Israel (well)
22 633 Kiro et al. (2015)
RA
DO
N-2
22
AN
DR
AD
IUM
-226
OC
CU
RR
EN
CE
INW
AT
ER
by guest on Decem
ber 3, 2016http://sp.lyellcollection.org/
Dow
nloaded from

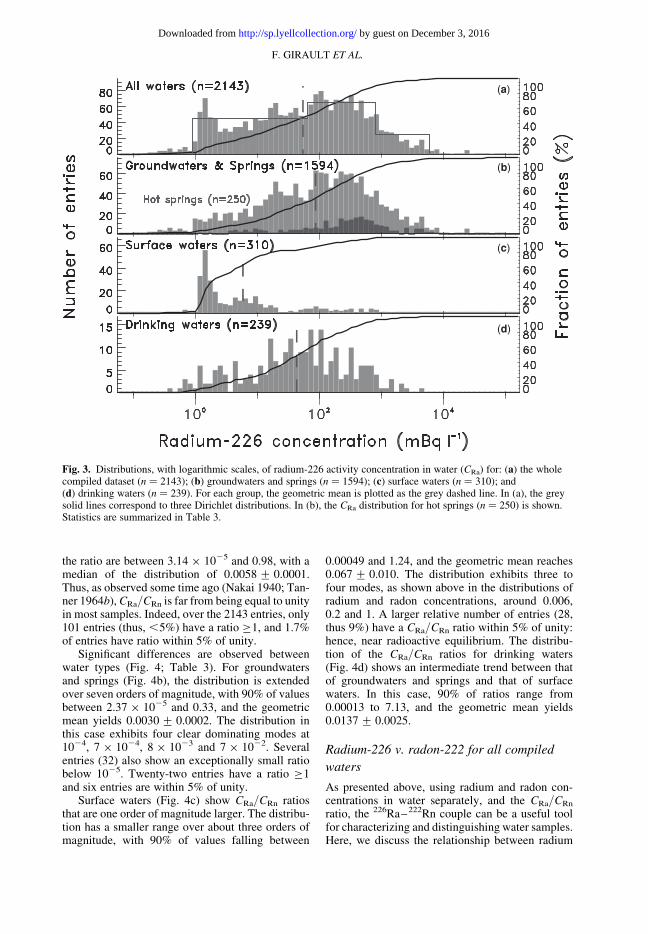
Table 3). Ninety per cent of values range from 1.3to 1800 mBq l21, and the median yields 70.0 +0.1 mBq l21. The distribution exhibits three largepeaks around 2, 20 and 2 × 10² mBq l21. Second-ary peaks around 0.7 and 6 × 10³ mBq l21 arealso visible. Linear trends of the cumulative distri-bution here suggest rather flat probability distribu-tions (Dirichlet distributions): one between 0.9 and65 mBq l21, one between 800 and 6000 mBq l21,and another one in-between.
As in the case of the radon concentrations, signif-icant differences are observed in radium concentra-tion between water types (Fig. 3; Table 3). Theradium concentration in groundwaters and springs(Fig. 3b) shows a large range of values, with 90%of values between 1.8 and 2390 mBq l21. The geo-metric mean gives 87.2 + 4.8 mBq l21. The distri-bution exhibits four modes at 1, 30, 200 and1500 mBq l21. A total of 187 entries have valueshigher than 103 mBq l21, including 13 entries withvalues above 104 mBq l21, with the maximum val-ues obtained from brine wells at the Ustron Healthresort, Poland (Kozłowska et al. 2010), at the SaltonSea Geothermal Field, USA (Zukin et al. 1987;
Hammond et al. 1988b) and in the cold spring atMt Sedon, Israel (Mazor 1962).
Smaller radium concentration values are foundfor surface waters (Fig. 3c), with 90% of values rang-ing from 1.2 to 317 mBq l21. The geometric meanyields 5.89 + 0.60 mBq l21. Most entries are gath-ered within only one order of magnitude, from 1 to20 mBq l21. However, a significant number ofentries (33) give values above 102 mBq l21. Theradium concentration in drinking waters (Fig. 3d)shows an intermediate trend between that of ground-waters and springs and that of surface waters. Ninetyper cent of values are between 1.2 and 790 mBq l21,and the geometric mean is 43.2 + 5.4 mBq l21.Compared with radon concentration, radium indrinking water is more variable, suggesting that itis not monitored carefully in most instances.
Radium-226 v. radon-222 in water
CRa/CRn ratio
Using the radium-226 (CRa) and radon-222 (CRn)concentrations in water of the compiled dataset,
(a)
(b)
(c)
(d)
Fig. 2. Distributions, with logarithmic scales, of radon-222 activity concentration in water (CRn) for: (a) the wholecompiled dataset (n ¼ 2143); (b) groundwaters and springs (n ¼ 1594); (c) surface waters (n ¼ 310); and(d) drinking waters (n ¼ 239). For each group, the geometric mean is plotted as the grey dashed line. In (a), the greysolid lines correspond to two Gaussian distributions with a mean of 8 Bq l21 and standard deviations of 4 and50 Bq l21. In (b), the CRn distribution for hot springs (n ¼ 250) is shown. Statistics are summarized in Table 3.
F. GIRAULT ET AL.
by guest on December 3, 2016http://sp.lyellcollection.org/Downloaded from
the dimensionless CRa/CRn ratio can be calculatedfor each entry of the database. The ratio rangesover seven orders of magnitude, from 2.26 × 1026
to 9.70, with arithmetic and geometric means of0.177 + 0.015 and 0.0056 + 0.0004, respectively(Fig. 4; Table 3). Ninety per cent of the values of
Table 3. Summary of the compiled dataset of radon-222 (CRn) and radium-226 activity concentrations (CRa) inwater, and of the CRa/CRn ratio in water
Type of water CRn in water(Bq l21)
CRa in water(mBq l21)
CRa/CRn ratioin water
All waters (n ¼ 2143)Minimum–maximum range 7.38 × 1024–102 000 0.11–85 500 2.26 × 1026–9.70Arithmetic mean + 1s 944 + 109 572 + 71 0.177 + 0.015Geometric mean + 1s 9.82 + 0.73 54.6 + 2.7 0.0056 + 0.0004Median + 1s 9.83 + 0.01 70.0 + 0.1 0.0058 + 0.0001Minimum–maximum range at 90% CL 0.10–3550 1.3–1800 3.14 × 1025–0.98
Groundwaters and springs (n ¼ 1594)Minimum–maximum range 0.01–102 000 0.11–85 500 2.26 × 1026–9.70Arithmetic mean + 1s 1258 + 145 730 + 95 0.079 + 0.010Geometric mean + 1s 29.1 + 2.0 87.2 + 4.8 0.0030 + 0.0002Median + 1s 18.7 + 0.1 107 + 1 0.0035 + 0.0001Minimum–maximum range at 90% CL 0.63–6220 1.8–2390 2.37 × 1025–0.33
Surface waters (n ¼ 310)Minimum–maximum range 7.38 × 1024–585 0.3–1450 1.93 × 1025–1.94Arithmetic mean + 1s 11.3 + 3.1 51.0 + 8.9 0.425 + 0.028Geometric mean + 1s 0.088 + 0.018 5.89 + 0.60 0.067 + 0.010Median + 1s 0.08 + 0.01 3.10 + 0.03 0.127 + 0.001Minimum–maximum range at 90% CL 0.0012–45 1.2–317 0.00049–1.24
Drinking waters (n ¼ 239)Minimum–maximum range 0.06–8484 0.4–4100 1.20 × 1025–7.71Arithmetic mean + 1s 57 + 37 194 + 28 0.51 + 0.11Geometric mean + 1s 3.16 + 0.38 43.2 + 5.4 0.0137 + 0.0025Median + 1s 3.73 + 0.07 48.3 + 0.4 0.011 + 0.001Minimum–maximum range at 90% CL 0.09–50 1.2–790 0.00013–7.13
All groundwaters (n ¼ 1043)Minimum–maximum range 0.01–102 000 0.11–85 500 2.28 × 1026–9.70Arithmetic mean + 1s 1688 + 215 835 + 140 0.081 + 0.013Geometric mean + 1s 27.5 + 2.5 82.4 + 5.7 0.0030 + 0.0003Median + 1s 14.4 + 0.1 100 + 1 0.0037 + 0.0001Minimum–maximum range at 90% CL 0.56–8200 1.5–2420 2.55 × 1025–0.29
All spring waters (n ¼ 551)Minimum–maximum range 0.11–25 000 0.37–26 085 2.26 × 1026–7.05Arithmetic mean + 1s 446 + 89 531 + 66 0.075 + 0.016Geometric mean + 1s 32.4 + 3.1 97.0 + 8.7 0.0030 + 0.0004Median + 1s 31.2 + 0.1 130 + 1 0.0033 + 0.0001Minimum–maximum range at 90% CL 0.70–1570 2.0–2340 2.03 × 1025–0.36
Cold springs (n ¼ 296)Minimum–maximum range 0.11–25 000 0.37–26 085 2.26 × 1026–7.05Arithmetic mean + 1s 601 + 155 408 + 104 0.040 + 0.024Geometric mean + 1s 37.1 + 4.6 48.5 + 6.0 0.0013 + 0.0002Median + 1s 29.6 + 0.1 47.0 + 0.1 0.0016 + 0.0001Minimum–maximum range at 90% CL 1.4–2720 1.48–1758 1.73 × 1025–0.081
Hot springs (n ¼ 250)Minimum–maximum range 0.14–12 850 1.13–7400 4.50 × 1026–2.57Arithmetic mean + 1s 269 + 66 678 + 75 0.119 + 0.020Geometric mean + 1s 27.1 + 4.1 214 + 24 0.0079 + 0.0015Median + 1s 33.0 + 1.0 300 + 1 0.0102 + 0.0002Minimum–maximum range at 90% CL 0.5–963 6–3740 3.14 × 1025–0.74
CL, confidence level.
RADON-222 AND RADIUM-226 OCCURRENCE IN WATER
by guest on December 3, 2016http://sp.lyellcollection.org/Downloaded from
the ratio are between 3.14 × 1025 and 0.98, with amedian of the distribution of 0.0058 + 0.0001.Thus, as observed some time ago (Nakai 1940; Tan-ner 1964b), CRa/CRn is far from being equal to unityin most samples. Indeed, over the 2143 entries, only101 entries (thus, ,5%) have a ratio ≥1, and 1.7%of entries have ratio within 5% of unity.
Significant differences are observed betweenwater types (Fig. 4; Table 3). For groundwatersand springs (Fig. 4b), the distribution is extendedover seven orders of magnitude, with 90% of valuesbetween 2.37 × 1025 and 0.33, and the geometricmean yields 0.0030 + 0.0002. The distribution inthis case exhibits four clear dominating modes at1024, 7 × 1024, 8 × 10²³ and 7 × 10²². Severalentries (32) also show an exceptionally small ratiobelow 1025. Twenty-two entries have a ratio ≥1and six entries are within 5% of unity.
Surface waters (Fig. 4c) show CRa/CRn ratiosthat are one order of magnitude larger. The distribu-tion has a smaller range over about three orders ofmagnitude, with 90% of values falling between
0.00049 and 1.24, and the geometric mean reaches0.067 + 0.010. The distribution exhibits three tofour modes, as shown above in the distributions ofradium and radon concentrations, around 0.006,0.2 and 1. A larger relative number of entries (28,thus 9%) have a CRa/CRn ratio within 5% of unity:hence, near radioactive equilibrium. The distribu-tion of the CRa/CRn ratios for drinking waters(Fig. 4d) shows an intermediate trend between thatof groundwaters and springs and that of surfacewaters. In this case, 90% of ratios range from0.00013 to 7.13, and the geometric mean yields0.0137 + 0.0025.
Radium-226 v. radon-222 for all compiled
waters
As presented above, using radium and radon con-centrations in water separately, and the CRa/CRn
ratio, the 226Ra–222Rn couple can be a useful toolfor characterizing and distinguishing water samples.Here, we discuss the relationship between radium
(a)
(b)
(c)
(d)
Fig. 3. Distributions, with logarithmic scales, of radium-226 activity concentration in water (CRa) for: (a) the wholecompiled dataset (n ¼ 2143); (b) groundwaters and springs (n ¼ 1594); (c) surface waters (n ¼ 310); and(d) drinking waters (n ¼ 239). For each group, the geometric mean is plotted as the grey dashed line. In (a), the greysolid lines correspond to three Dirichlet distributions. In (b), the CRa distribution for hot springs (n ¼ 250) is shown.Statistics are summarized in Table 3.
F. GIRAULT ET AL.
by guest on December 3, 2016http://sp.lyellcollection.org/Downloaded from

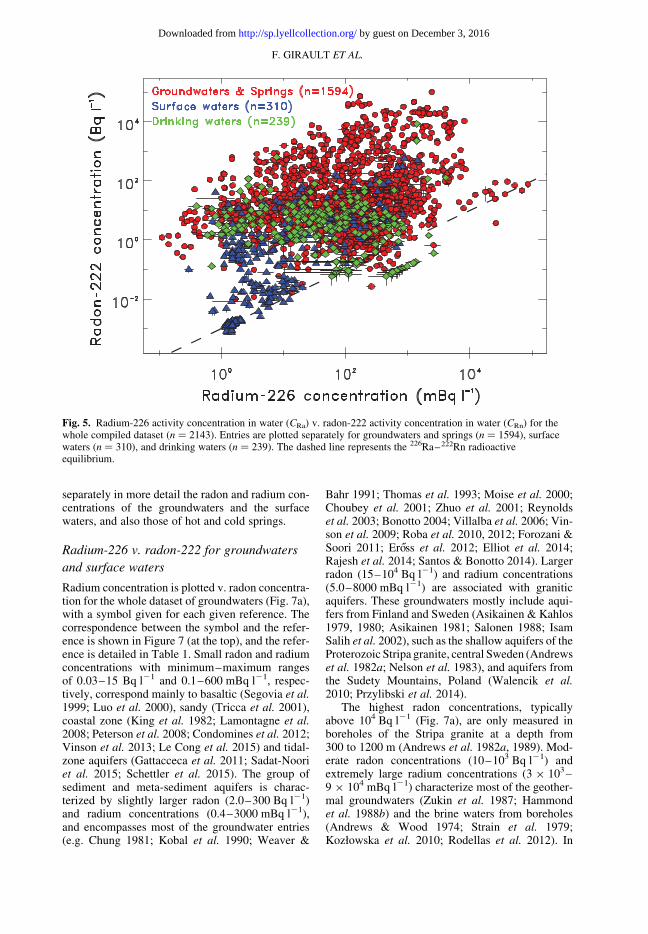
and radon when considering different water types.Radium concentration is plotted v. radon concen-tration in Figure 5 for the whole dataset for ground-waters and springs, surface waters, and drinkingwaters separately, and the contours at 90% aroundpeak density are shown in Figure 6. To the firstorder, most of the entries appear gathered in aregion where radon concentrations range from 1 to100 Bq l21 and where radium concentrations rangefrom 10 to 1000 mBq l21. In general, data withlow radium concentrations are confined to a regionwith relatively low radon concentrations. The oppo-site is also true, with only a few entries character-ized by radium concentrations higher than radonconcentrations.
In this two-parameter space (Figs 5 & 6), drink-ing waters seem located between the groundwatersand springs and the surface waters regions. Onlygroundwaters and springs show exceptionallylarge radon and radium concentrations: the largestradon concentrations for the smallest radium con-centrations, and the largest radium concentrationfor a given radon concentration. They exhibit two
groups of similar radium concentration range, butwith the radon concentration below or above 100Bq l21. Surface waters generally show the smallestradon and radium concentrations. Their entries areconfined to a region where the radon concentrationis smaller than 100 Bq l21, but form one groupwith a small radium concentration (,20 mBq l21)and another group with a larger radium concentra-tion (.70 mBq l21). Finally, drinking waters arelocated in a region where the radon concentrationis larger than that of surface waters and relativelysmaller than that of groundwaters and springs, butshow a large range of radium concentration values.Large groups of surface waters are gathered closeto the 226Ra–222Rn radioactive equilibrium at aradon concentration value of 1021 and 1022 Bq l21.Another group, including groundwaters and springs,surface waters, and drinking waters, is also closeto the 226Ra–222Rn equilibrium, around a radonconcentration value of 0.1 Bq l21. A group ofgroundwaters and springs with the largest radiumconcentrations (.7 × 103 mBq l21) is also closeto equilibrium. In the following, we discuss
(a)
(b)
(c)
(d)
Fig. 4. Distributions, with logarithmic scales, of the CRa/CRn ratio in water for: (a) the whole compiled dataset(n ¼ 2143); (b) groundwaters and springs (n ¼ 1594); (c) surface waters (n ¼ 310); and (d) drinking waters(n ¼ 239). For each group, the geometric mean is plotted as a grey dashed line. In (b), the CRa/CRn ratio distributionfor hot springs (n ¼ 250) is shown. Statistics are summarized in Table 3.
RADON-222 AND RADIUM-226 OCCURRENCE IN WATER
by guest on December 3, 2016http://sp.lyellcollection.org/Downloaded from
separately in more detail the radon and radium con-centrations of the groundwaters and the surfacewaters, and also those of hot and cold springs.
Radium-226 v. radon-222 for groundwaters
and surface waters
Radium concentration is plotted v. radon concentra-tion for the whole dataset of groundwaters (Fig. 7a),with a symbol given for each given reference. Thecorrespondence between the symbol and the refer-ence is shown in Figure 7 (at the top), and the refer-ence is detailed in Table 1. Small radon and radiumconcentrations with minimum–maximum rangesof 0.03–15 Bq l21 and 0.1–600 mBq l21, respec-tively, correspond mainly to basaltic (Segovia et al.1999; Luo et al. 2000), sandy (Tricca et al. 2001),coastal zone (King et al. 1982; Lamontagne et al.2008; Peterson et al. 2008; Condomines et al. 2012;Vinson et al. 2013; Le Cong et al. 2015) and tidal-zone aquifers (Gattacceca et al. 2011; Sadat-Nooriet al. 2015; Schettler et al. 2015). The group ofsediment and meta-sediment aquifers is charac-terized by slightly larger radon (2.0–300 Bq l21)and radium concentrations (0.4–3000 mBq l21),and encompasses most of the groundwater entries(e.g. Chung 1981; Kobal et al. 1990; Weaver &
Bahr 1991; Thomas et al. 1993; Moise et al. 2000;Choubey et al. 2001; Zhuo et al. 2001; Reynoldset al. 2003; Bonotto 2004; Villalba et al. 2006; Vin-son et al. 2009; Roba et al. 2010, 2012; Forozani &Soori 2011; Eross et al. 2012; Elliot et al. 2014;Rajesh et al. 2014; Santos & Bonotto 2014). Largerradon (15–104 Bq l21) and radium concentrations(5.0–8000 mBq l21) are associated with graniticaquifers. These groundwaters mostly include aqui-fers from Finland and Sweden (Asikainen & Kahlos1979, 1980; Asikainen 1981; Salonen 1988; IsamSalih et al. 2002), such as the shallow aquifers of theProterozoic Stripa granite, central Sweden (Andrewset al. 1982a; Nelson et al. 1983), and aquifers fromthe Sudety Mountains, Poland (Walencik et al.2010; Przylibski et al. 2014).
The highest radon concentrations, typicallyabove 104 Bq l21 (Fig. 7a), are only measured inboreholes of the Stripa granite at a depth from300 to 1200 m (Andrews et al. 1982a, 1989). Mod-erate radon concentrations (10–103 Bq l21) andextremely large radium concentrations (3 × 10³–9 × 10⁴ mBq l21) characterize most of the geother-mal groundwaters (Zukin et al. 1987; Hammondet al. 1988b) and the brine waters from boreholes(Andrews & Wood 1974; Strain et al. 1979;Kozłowska et al. 2010; Rodellas et al. 2012). In
Fig. 5. Radium-226 activity concentration in water (CRa) v. radon-222 activity concentration in water (CRn) for thewhole compiled dataset (n ¼ 2143). Entries are plotted separately for groundwaters and springs (n ¼ 1594), surfacewaters (n ¼ 310), and drinking waters (n ¼ 239). The dashed line represents the 226Ra–222Rn radioactiveequilibrium.
F. GIRAULT ET AL.
by guest on December 3, 2016http://sp.lyellcollection.org/Downloaded from

particular, some of the Dead Sea groundwaters inIsrael show large radium concentrations (Kiroet al. 2015). Groundwaters at 226Ra–222Rn radioac-tive equilibrium are from some of the well waters ofKorogoro creek, Australia (Sadat-Noori et al. 2015),of Slovenia (Kobal et al. 1990), of Monts Sedon andHordos, Israel (Mazor 1962), of the Salton Sea geo-thermal system, USA (Zukin et al. 1987; Hammondet al. 1988b), and of the Ustron Health resort, Poland(Kozłowska et al. 2010).
Radium concentration is plotted v. radon con-centration for the whole dataset of surface waters(Fig. 7b) with a given symbol for each given refer-ence as previously. Small radon and radium con-centrations, with minimum–maximum ranges of6 × 1024–6 × 10²² Bq l21 and 0.7–20 mBq l21,respectively, correspond to seawaters (Hussainet al. 1999; Purkla & Eisenhauer 2004; Burnettet al. 2008; Gattacceca et al. 2011; Rutgers vander Loeff et al. 2014). Most of the surface waterentries are common river and lake waters, withradon and radium concentrations ranges of 8 ×10²²–80 Bq l21 and 1–800 mBq l21, respectively(Mazor 1962; Kobal et al. 1990; Szerbin 1996;Al-Masri & Blackburn 1999; Binesh et al. 2011;Rodellas et al. 2012; Rajesh et al. 2014; Kiroet al. 2015; Cozma et al. 2016). In-between, we
logically find tidal rivers (Hartman & Hammond1984; Santos & Eyre 2011).
For rivers, the main differences in the substratumare reflected by radium concentration levels (Fig.7b). Nevertheless, rivers flowing on U-rich granites,such as streams at Bad Brambach, Germany and inthe granitic Lozere massif, France (see AppendixA), yield the largest radon concentrations. Meltwa-ters from a Spitsbergen glacier (Kies et al. 2011)are characterized by intermediate radon concentra-tions between common rivers and rivers flowingon a U-rich substratum. Finally, the largest radonand radium concentrations, with values reaching500 Bq l21 and 1400 mBq l21, respectively, arefound in marsh waters, Spain (Rodellas et al.2012). Surface waters at 226Ra–222Rn radioactiveequilibrium are mainly seawaters (Hussain et al.1999; Rutgers van der Loeff et al. 2014) and somelake waters (Mazor 1962), with a geometric meanof the CRa/CRn ratio for seawater of 0.70 + 0.04.
Radium-226 v. radon-222 for hot springs
and cold springs
Radium concentration is plotted v. radon concentra-tion for the whole dataset of hot spring waters
Fig. 6. Contours at 90% around peak density of the 226Ra-222Rn couple using the whole dataset shown in Figure 5.Contours at 90% are plotted separately for groundwaters and springs (n ¼ 1594), surface waters (n ¼ 310), anddrinking waters (n ¼ 239). Dashed line represents the 226Ra-222Rn radioactive equilibrium.
RADON-222 AND RADIUM-226 OCCURRENCE IN WATER
by guest on December 3, 2016http://sp.lyellcollection.org/Downloaded from
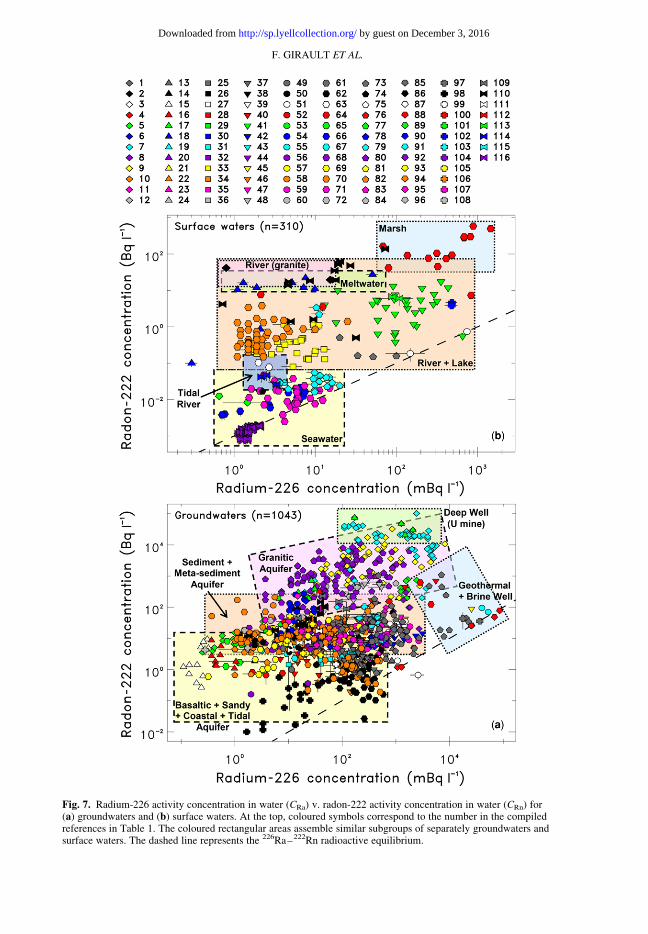
Fig. 7. Radium-226 activity concentration in water (CRa) v. radon-222 activity concentration in water (CRn) for(a) groundwaters and (b) surface waters. At the top, coloured symbols correspond to the number in the compiledreferences in Table 1. The coloured rectangular areas assemble similar subgroups of separately groundwaters andsurface waters. The dashed line represents the 226Ra–222Rn radioactive equilibrium.
F. GIRAULT ET AL.
by guest on December 3, 2016http://sp.lyellcollection.org/Downloaded from
(Fig. 8a) using the previous convention for symbols.Hot springs show a large range of radon and radiumconcentrations. The radon-rich or radon-bearinghot springs are characterized by the largest radonconcentrations (.80 Bq l21) and a wide range ofradium concentrations (3–1500 mBq l21). Thesespring waters include the particular hot springs ofthe Misasa, Masutomi and Arima provinces inJapan (Nakai 1940), and some hot springs of Spain(Rodenas et al. 2008), Hungary (Baradacs et al.2001; Eross et al. 2012) and Iran (Beitollahi et al.2007). The radium-rich hot springs show the larg-est radium concentrations (.200 mBq l21) forrelatively moderate radon concentrations (0.4–100 Bq l21). Among these radium-bearing hotsprings, we again find some Japanese springs locatedin the Arima and Masutomi provinces (Nakai 1940),the Karlovy Vary hot springs in the Czech Republic(Appendix A), some hot springs in Bakreswar(Chaudhuri et al. 2010) and to the south in Bombayin India (Kelkar & Joshi 1969), some hot springs inJangxi province in China (Sun & Li 2001), andnumerous hot springs in Turkey: some thermalwaters in western Turkey (Erees et al. 2006), the hotsprings of the Diliki Geothermal Area (Tabar et al.2013), of the Seferihisar Geothermal Region (Sacet al. 2014) and of the Bayındır-Izmir spas (Yararet al. 2015). Between radon-bearing and radium-bearing hot springs, we find the thermal springs ofBath, UK (Jacobi 1949; Andrews & Wood 1974;Andrews et al. 1982b) (Appendix A), some hotsprings in Israel (Mazor 1962), some springs of theAndalusia spas, Spain (Duenas et al. 1998), somesprings of the Ural spas, Russia (Onishchenkoet al. 2010), and some springs in the YellowstoneNational Park, USA (Clark & Turekian 1990).
The lowest radon concentration (Fig. 8a) wasmeasured on a hot spring near the Elsinore Faultin California, USA (Chung 1981). Moderate radiumconcentrations (10–500 mBq l21) and low to highradon concentrations (0.4–200 Bq l21) characterizethe Nepal Himalayas hot springs (Girault & Perrier2014; Girault et al. 2016). An extremely peculiarregion with high radon (.70 Bq l21) and highradium concentrations (.1500 mBq l21) corre-sponds to the hot springs of the Ikaria Island spain Greece (Danali et al. 1986) and some Israel hotsprings, such as the En Gedi (Kronfeld et al.1991), En Qedem (Kronfeld et al. 1991; Kiroet al. 2015), Hammat Gader group springs (Moiseet al. 2000) and Tiberias hot springs (Mazor 1962;Moise et al. 2000). Hot springs at 226Ra–222Rnradioactive equilibrium are mainly some thermalwaters in Turkey (Erees et al. 2006), the Ural spasin Russia (Onishchenko et al. 2010) and one hotspring in the Arima province in Japan (Nakai 1940).
Radium concentration is plotted v. radon con-centration for the whole dataset of cold spring
waters (Fig. 8b), with the same convention usedfor the symbols. Low radon (0.3–50 Bq l21) andradium concentrations (1.5–200 mBq l21) corre-spond mainly to coastal springs (Kronfeld et al.1991; Othman & Yassine 1996; Duenas et al.1998; Binesh et al. 2011; Jowzaee 2013; Fonollosaet al. 2016). Springs within sediments (Chung 1981;Clark & Turekian 1990) (Appendix A) yield smallerradium (,6 mBq l21) and higher radon concentra-tions (10–200 Bq l21). Springs within granites andU-rich rocks, such as phyllites (Kasztovszky et al.1996; Sun & Li 2001; Przylibski 2011; Girault &Perrier 2014), are generally characterized by largerradium (300–4000 mBq l21) and radon concentra-tions (2–700 Bq l21). In-between coastal springs,sediment springs and granite springs areas, othercontinental springs are found (e.g. Mazor 1962;Oliveira et al. 1998; Rodenas et al. 2008; Eross et al.2012; Moldovan et al. 2014; Kiro et al. 2015). Inparticular, springs in the Nepal Himalayas withaverage values of CRn ¼ 78 + 58 Bq l21 andCRa ¼ 216 + 160 mBq l21 (Girault & Perrier 2014;Girault et al. 2016) show smaller radon and largerradium concentrations than Swiss Alps springs,which have average values of CRn ¼ 218 + 59Bq l21 and CRa ¼ 38.2 + 9.6 mBq l21 (Gainonet al. 2007). Particular springs with extremely largeradium concentrations (.7000 mBq l21) and mod-erate radon concentrations (30–300 Bq l21) arethe brines of En Gedi, Israel (Moise et al. 2000).
Springs within U-rich granites (Fig. 8b) arecharacterized by large radon concentrations(.200 Bq l21) and a large range of radium concen-trations (1–104 mBq l21). These cold springsinclude mainly springs of the Masutomi and Misasaprovinces in Japan (Nakai 1940), of Bad Brambachspa, Germany, such as the Wettinquelle cold springwhich has the largest radon concentration mea-sured in natural springs worldwide (Heinicke et al.1995a) (Appendix A), the Jerzy spring located inthe Sudety Mountains of Poland (Przylibski 2011),and some springs of Niska Banja, Serbia (Onish-chenko et al. 2010). Only some Israel cold springsappear to be near 226Ra–222Rn radioactive equilib-rium (Mazor 1962).
Conclusions and perspectives
In this paper, we have explored the properties ofradon-222 and radium-226 activity concentrationsin water using a compiled database. To date, thisis the first attempt to establish a systematic relation-ship between these two dissolved radioactive iso-topes using such a large database. Over the wholedataset (2143 entries from 116 references), radonand radium concentrations range over more thannine and six orders of magnitude, respectively.
RADON-222 AND RADIUM-226 OCCURRENCE IN WATER
by guest on December 3, 2016http://sp.lyellcollection.org/Downloaded from
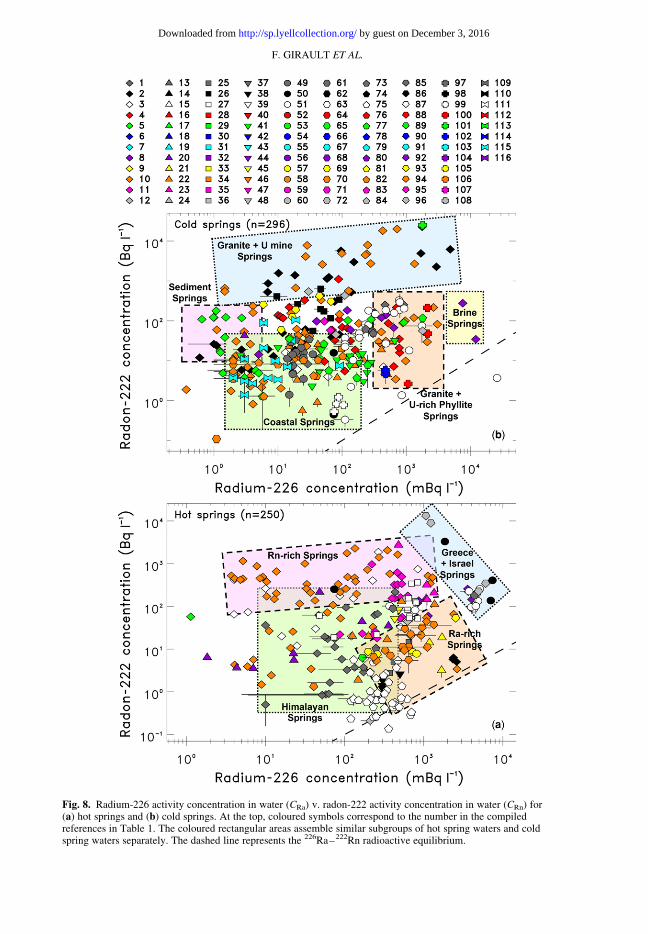
Fig. 8. Radium-226 activity concentration in water (CRa) v. radon-222 activity concentration in water (CRn) for(a) hot springs and (b) cold springs. At the top, coloured symbols correspond to the number in the compiledreferences in Table 1. The coloured rectangular areas assemble similar subgroups of hot spring waters and coldspring waters separately. The dashed line represents the 226Ra–222Rn radioactive equilibrium.
F. GIRAULT ET AL.
by guest on December 3, 2016http://sp.lyellcollection.org/Downloaded from

Geometric means yield 9.82 + 0.73 Bq l21 forradon and 54.6 + 2.7 mBq l21 for radium. As pre-viously pointed out in some studies, only 1.7% ofthe waters appear to be at 226Ra–222Rn radioactiveequilibrium; most of them are, indeed, far fromequilibrium, with a geometric mean of the CRa/CRn ratio of 0.0056 + 0.0004. Significant differ-ences in radon and radium concentrations havebeen shown between groundwaters and surfacewaters, on the one hand, and between hot springsand cold springs, on the other. Within water types,it was also possible to associate typical ranges ofradon and radium concentrations with subgroupsof waters, thus indicating that the 226Ra–222Rn cou-ple can be a useful tool for the characterization ofwater and for the identification of water sourcerocks.
This study has also highlighted that over thewhole of the literature on radon and radium inwater, several references measured both radioactiveisotopes systematically. However, more data areneeded, in particular for spring waters and surfacewaters. At this stage of the review, no clear relation-ship has been observed between radon or radiumconcentration and water temperature, pH, Eh orTDS. For hot springs, however, a larger dissolvedradium concentration is generally associated witha smaller acidic pH. This assumes that radium pre-cipitates preferentially at higher basic pH values, asrecently argued by Guillen et al. (2014). Otherdissolved elements may have a crucial role in thedistribution of dissolved radium in water, as evi-denced by groundwaters from North Carolina,USA (Vinson et al. 2009), but more systematic stud-ies are required to substantiate this point. In thisregard, the relationships with water salinity and elec-trical conductivity for dissolved radon (Schubertet al. 2012) and dissolved radium (Kraemer & Reid1984; Tomita et al. 2010; Rosenberg et al. 2011a,b; Szabo et al. 2012) may need to be investigatedfurther.
In general, the data available on dissolved radonand radium concentrations in water are obtained inthe field or in the laboratory at a given time. Indeed,numerous studies have been devoted to the charac-terization of spatial variations of radon and radiumconcentrations in springs and groundwaters at dif-ferent regional scales, but only a few of them havefocused on temporal variations that have durationsof the order of days. Obtaining temporal variationsover a minimum of 1 year for both radon and radiumconcentrations in water at a single location thusappears to be an arduous task, as commercial or self-made instruments are expensive and difficult toinstall directly in the field for long periods of time(e.g. Burnett et al. 2006; Peterson et al. 2010). Sig-nificant progress in this field of applied research istherefore particularly needed. The permanent
instrumentation that has been sited at Bad Brambachspa in Saxony, Germany for more than 20 years (e.g.Heinicke et al. 1995b; Weise et al. 2001; Braueret al. 2007), located in the seismically active regionof the Eger Rift, represents the most important long-term temporal monitoring of radon and radium con-centrations (as well as other numerous dissolvedelements and isotopes) ever launched in the world.The techniques developed there should pave theway towards the next generation of long-term con-tinuous measurement equipment (e.g. in springslocated in tectonically active regions).
The relationships between the radon-222 andradium-226 concentrations in water have also beenused as a water-dating method: in particular,recently, in the context of the detection of submarinegroundwater discharges (e.g. Hussain et al. 1999;Burnett et al. 2008). However, in order to under-stand water–rock interaction processes better andto use more extensive dating methods using the226Ra–222Rn couple, the measurement of the bulkradium concentration of the surrounding and under-lying rocks alone is not sufficient. Indeed, generally,radon has been found in large excess compared toradium, mainly because water is continuouslyrecharged in radon along its underground circuit(Tanner 1964b; Przylibski 2000). Quantification ofthe radon source through the measurement of theeffective radium concentration (e.g. Girault & Per-rier 2012a, b; Perrier et al. 2016b) – for example,of rocks present along the whole water circuitryof a spring or on aquifer rocks – would giveprecious insights to the available radon in con-nected pore spaces. Watersheds, including variouscompartments of the critical zone such as aquifer,spring(s), fine soil layer, and U-rich or Ra-richunderlying rocks, may be providential sites to per-form such a combined study of radium and radonin waters and rocks, a mandatory approach to betterunderstand the various water–rock interaction pro-cesses related to radon and radium in the naturalenvironment.
The authors are grateful to Ulrich Koch (Saxon Academy ofSciences at Leipzig, Bad Brambach, Germany) for theopportunity to measure radon and radium concentrationsat Bad Brambach, Saxony, Germany. We thank CarmenRodenas for sharing her database. The original manuscriptwas significantly improved thanks to the insightful com-ments of two reviewers. This is IPGP contribution No. 3737.
Appendix A
In this study, radon-222 and radium-226 activity concen-
trations in water were measured using the emanometry
technique. Data are consolidated in Table A1. In the
field, water was sampled in a glass bottle, which always
corresponded to a 0.3–0.7 fraction of the bottle volume,
RADON-222 AND RADIUM-226 OCCURRENCE IN WATER
by guest on December 3, 2016http://sp.lyellcollection.org/Downloaded from

and then closed hermetically with a rubber stopper after
sampling.
For radon, after 10 min of manual shaking, equilibrium
between the air and water phases was reached (Girault &
Perrier 2014). The air in the bottle was then sampled
using a 125 ml pre-evacuated scintillation flask (Algade,
France). The radon concentration in the flask was inferred
from the counting rate obtained with a photomultiplier
(CALENTM, Algade, France) 3.5 h after sampling. For
each water sample, at least two measurements were per-
formed and the values averaged. Experimental uncertain-
ties correspond to the statistical fluctuation of the
counting, the dilution correction and additional sources
(12%) determined experimentally (Girault & Perrier
2014). These varied from 5% for CRn . 100 Bq l21 to
30% for CRn , 1 Bq l21.
For radium, the same emanometry method was used.
The bottle was kept hermetically closed for more than
50 days to guarantee the disintegration of essentially
all the dissolved radon atoms. More details are available
in Perrier et al. (2016a). For each water sample, at least
two measurements were performed and the values aver-
aged. Experimental uncertainties were set as for the
measurements of the radon concentration. These varied
from 10% for CRa . 100 mBq l21 to 40% for CRa ,
8 mBq l21.
References
Al-Masri, M.S. & Blackburn, R. 1999. Radon-222and related activities in surface waters of the EnglishLake District. Applied Radiation and Isotopes, 50,1137–1143.
Althoyaib, S.S. & El-Taher, A. 2015. Natural radioac-tivity measurements in groundwater from Al-Jawa,Saudi Arabia. Journal of Radioanalytical and NuclearChemistry, 304, 547–552.
Amrani, D. 2002. Natural radioactivity in Algerian bottledmineral waters. Journal of Radioanalytical andNuclear Chemistry, 252, 597–600.
Table A1. Radon-222 and radium-226 activity concentrations in water measured in this study
Type of water Country Description CRn in water(Bq l21)
CRa in water(mBq l21)
Hot spring UK King Spring Pump House Bath 99.1 + 5.6 393 + 51Czech Republic Karlovy Vary A 708C 5.04 + 0.54 2599 + 234
Karlovy Vary B 508C 5.76 + 0.78 2338 + 228Karlovy Vary C 308C 6.32 + 0.74 2376 + 255
Spring Czech Republic Rafael spring 2967 + 173 153 + 25Mikael spring 5689 + 361 96 + 19Teplice Pravridlo 1 304 + 24 76.3 + 5.2
Poland Swieradow Zdroj Dom Zdrojowy cave 525 + 31 139.2 + 8.2Swieradow Zdroj Radon Bath bathtub room 3 1237 + 72 62.2 + 4.6Swieradow Zdroj Forest spring 5 1390 + 78 18.4 + 3.1Kowary spring 26 525 + 33 6.9 + 1.2Kowary mine Adit19A point 2 1565 + 97 10.2 + 1.7
Germany Bad Brambach Wettinquelle 22 660 + 1240 1770 + 163Bad Brambach Schillerquelle 4891 + 266 1696 + 159Bad Brambach Eisenquelle 1135 + 64 58.1 + 4.1Bad Brambach Obere Grenzquelle 6162 + 373 4855 + 496Bad Brambach Untere Grenzquelle 2259 + 124 2959 + 166Bad Elster Marienquelle 3 60.5 + 4.0 26.8 + 3.5Bad Elster Salzquelle 38.7 + 2.8 68.9 + 5.8
France Velleminfroy 45.4 + 2.7 90.6 + 8.7Borehole Forestry House Chambon-la-Foret Obs. 11.89 + 0.68 15.4 + 1.6Anduze Fontaine de l’Eglise 18.8 + 1.2 2.7 + 0.7Anduze Fontaine Pradier 5.88 + 0.65 3.7 + 1.8Anduze Fontaine Notre-Dame 11.95 + 0.85 0.6 + 1.6Spring Mitry Mory 2 Aquifer Basement 26.1 + 1.5 1.0 + 0.6Mont Lozere La Vialasse 867 + 49 7.0 + 1.3Wash house Fontenay-les-Briis 49.8 + 2.5 11.8 + 1.3Nozzle A Parc des Thermes Forges-les-Bains 18.7 + 1.1 18.4 + 1.3Nozzle C Parc des Thermes Forges-les-Bains 24.2 + 1.5 1.1 + 1.5Nozzle E Parc des Thermes Forges-les-Bains 12.94 + 0.95 8.5 + 1.4Nozzle D Parc des Thermes Forges-les-Bains 19.2 + 1.2 7.0 + 1.5Miraculous spring Ste Genevieve des Bois 26.4 + 1.5 25.7 + 3.0Orge spring Rock basin in ruin 5.86 + 0.34 2.7 + 0.6
River water Germany Bad Brambach Rothenbach Kurpark Stream 19.6 + 1.7 15.3 + 1.6France Mont Lozere La Sapine 41.5 + 2.6 0.8 + 1.3
Tap water Germany Bad Brambach Wettinquelle tap 8484 + 688 1400 + 173Bad Brambach Schillerquelle tap 2270 + 141 1397 + 268Bad Brambach Eisenquelle tap 0.0675 + 0.114 65.3 + 6.0
Poland Swieradow Zdroj Hotel Bialy Kamien 64.1 + 3.8 4.4 + 0.8Germany Bad Brambach Ramada Resort room bathroom 26.6 + 2.1 21.4 + 2.4France Machery Vaugrigneuse 0.750 + 0.038 2.7 + 0.5
IPGP Laboratory 1100 0.129 + 0.007 0.7 + 0.1
F. GIRAULT ET AL.
by guest on December 3, 2016http://sp.lyellcollection.org/Downloaded from

Andrews, J.N. & Wood, D.F. 1974. Radium-226,radon-222 and lead-210 in Bath thermal springs com-pared with some environmental waters. Health Phys-ics, 27, 307–310.
Andrews, J.N., Burgess, W.G., Edmunds, W.M., Kay,R.L.F. & Lee, D.J. 1982b. The thermal springs ofBath. Nature, 298, 339–343.
Andrews, J.N., Giles, I.S. et al. 1982a. Radioelements,radiogenic helium and age relationship for groundwa-ters from the granites at Stripa, Sweden. Geochimicaet Cosmochimica Acta, 46, 1533–1543.
Andrews, J.N., Ford, D.J., Hussain, N., Trivedi, D. &Youngman, M.J. 1989. Natural radioelement solutionby circulating groundwaters in the Stripa granite. Geo-chimica et Cosmochimica Acta, 53, 1791–1802.
Asikainen, M. 1981. State of disequilibrium between238U, 234U, 226Ra and 222Rn in groundwater frombedrock. Geochimica et Cosmochimica Acta, 45,201–206.
Asikainen, M. & Kahlos, H. 1979. Anomalously highconcentrations of uranium, radium and radon inwater from drilled wells in the Helsinki region. Geochi-mica et Cosmochimica Acta, 43, 1681–1686.
Asikainen, M. & Kahlos, H. 1980. Natural radioactivityof drinking water in Finland. Health Physics, 39,77–83.
Aupiais, J., Fayolle, C., Gilbert, P. & Dacheux, N.1998. Determination of 226Ra in mineral drinkingwaters by a liquid scintillation with rejection of b–gemitters. Analytical Chemistry, 70, 2353–2359.
Baradacs, E., Hunyadi, I., Dezso, Z., Csige, I. & Szer-
bin, P. 2001. 226Ra in geothermal and bottled mineralwaters of Hungary. Radiation Measurements, 34,385–390.
Baykara, O. & Dogru, M. 2006. Measurements of radonand uranium concentration inwater and soil samplesfrom East Anatolian Active Fault Systems (Turkey).Radiation Measurements, 41, 362–367.
Beitollahi, M., Ghiassi-Nejad, M., Esmaeli, A. &Dunker, R. 2007. Radiological studies in the hotspring region of Mahallat, Central Iran. Radiation Pro-tection Dosimetry, 123, 505–508.
Bellotti, E., Broggini, C., Di Carlo, G., Laubenstein,M. & Menegazzo, R. 2015. Precise measurement ofthe 222Rn half-life: a probe to monitor the stability ofradioactivity. Physics Letters B, 743, 526–530.
Bettencourt, A.O., Teixeira, M.M.G.R., Faisca, M.C.,Vieira, J.A. & Ferrador, G.C. 1988. Natural radioac-tivity in Portuguese mineral waters. Radiation Protec-tion Dosimetry, 24, 139–142.
Binesh, A., Mohammadi, S., Mowlavi, A.A. & Parvar-
esh, P. 2011. Measuring radon and radium concentra-tion in 120 samples of drinking water sources, springsand rivers of Shandiz, Zoshk and Abrdeh regions. Envi-ronmental Research Journal, 5, 1–5.
Bollhofer, A., Brazier, J., Humphrey, C., Ryan, B. &Esparon, A. 2011. A study of radium bioaccumula-tion in freshwater mussels, Velesunio angasi, in theMagela Creek catchment, Northern Territory, Austra-lia. Journal of Environmental Radioactivity, 102,964–974.
Bonotto, D.M. 2004. Doses from 222Rn, 226Ra, and 228Rain groundwater from Guarani aquifer, South America.Journal of Environmental Radioactivity, 76, 319–335.
Brauer, K., Kampf, H., Koch, U., Niedermann, S. &Strauch, G. 2007. Seismically induced changes ofthe fluid signature detected by a multi-isotopeapproach (He, CO2, CH4, N2) at the Wettinquelle,Bad Brambach (central Europe). Journal of Geophysi-cal Research, 112, B04307.
Burnett, W.C., Aggarwal, P.K. et al. 2006. Quantify-ing submarine groundwater discharge in the coastalzone via multiple methods. Science of the Total Envi-ronment, 367, 498–543.
Burnett, W.C., Peterson, R., Moore, W.S. & Oli-
veira, J. 2008. Radon and radium isotopes as tracersof submarine groundwater discharge – Results fromthe Ubatuba, Brazil SGD assessment intercomparison.Estuarine, Coastal and Shelf Science, 76, 501–511.
Carvalho, F.P., Oliveira, J.M., Malta, M. & Lemos,M.E. 2014. Radioanalytical assessment of environ-mental contamination around non-remediated ura-nium mining legacy site and radium mobility.Journal of Radioanalytical and Nuclear Chemistry,299, 119–125.
Cevik, U., Damla, N., Karahan, G., Celebi, N. &Kobya, A.I. 2006. Natural radioactivity in tap watersof Eastern Black Sea region of Turkey. Radiation Pro-tection Dosimetry, 118, 88–92.
Chandrashekara, M.S., Veda, S.M. & Paramesh, L.2012. Studies on radiation dose due to radioactive ele-ments present in ground water and soil samples aroundMysore city, India. Radiation Protection Dosimetry,149, 315–320.
Chaudhuri, H.D., Das, N.K., Bhandari, R.K., Sen, P. &Sinha, B. 2010. Radon activity measurements aroundBakreswar thermal springs. Radiation Measurements,45, 143–146.
Choubey, V.M., Bartarya, S.K., Saini, N.K. &Ramola, R.C. 2001. Impact of geohydrology and neo-tectonic activity on radon concentration in groundwa-ter of intermontane Doon Valley, Outer Himalaya,India. Environmental Geology, 40, 257–266.
Chung, Y.-C. 1981. Radium-226 and radon-222 in South-ern California groundwaters: spatial variations and cor-relations. Geophysical Research Letters, 8, 457–460.
Clark, J.F. & Turekian, K.K. 1990. Time scale of hydro-thermal water–rock reactions in Yellowstone NationalPark based on radium isotopes and radon. Journal ofVolcanology and Geothermal Research, 40, 169–180.
Condomines, M., Gourdin, E., Gataniou, D. & Seidel,J.-L. 2012. Geochemical behaviour of radium isotopesand radon in a coastal thermal system (Balaruc-les-Bains, South of France). Geochimica et CosmochimicaActa, 98, 160–176.
Copia, L., Nisi, S., Plastino, W., Ciarletti, M. & Povi-
nec, P.P. 2015. Low-level 226Ra determination ingroundwater by SF-ICP-MS: optimization of separa-tion and pre-concentration methods. Journal of Analyt-ical Science and Technology, 6, 22, https://doi.org/10.1186/s40543-015-0062-5
COUNCIL DIRECTIVE 2013. Council Directive 2013/51/EURATOM of 22 October 2013. Laying down require-ments for the protection of the health of the generalpublic with regard to radioactive substances in waterintended for human consumption. Official Journal ofthe European Union, 7.11.2013, 56, L 296/12–L296/21.
RADON-222 AND RADIUM-226 OCCURRENCE IN WATER
by guest on December 3, 2016http://sp.lyellcollection.org/Downloaded from

Cozma, A.I., Baciu, C., Moldovan, M. & Pop, I.-C.2016. Using natural tracers to track the groundwaterflow in a mining area. Procedia Environmental Sci-ences, 32, 211–220.
Curie, P. & Laborde, A. 1904. On the radioactivity ofgases degassing from thermal spring waters. Comptesrendus de l’Academie des Sciences, 138, 1150–1153[in French].
Curie, P. & Laborde, A. 1906. On the radioactivity ofgases originating from thermal spring waters. Comptesrendus de l’Academie des Sciences, 142, 1462–1466[in French].
Danali, S., Margomenou, G. & Veldeki, K. 1986. Theradioactivity of spas on the Greek island Ikaria andinfluencing factors. Health Physics, 50, 509–513.
Darby, S., Hill, D. et al. 2004. Radon in homes and riskof lung cancer: collaborative analysis of individualdata from 13 European case-control studies. BritishMedical Journal, 330, 223–228.
Duchemin, B., Coursol, N. & Be, M.M. 1994. There-evaluation of decay data for the U-238 chain.Nuclear Instruments and Methods in Physics ResearchSection A, A339, 146–150.
Duenas, C., Fernandez, M.C., Enrıquez, C., Carre-
tero, J. & Liger, E. 1998. Natural radioactivity levelsin Andalusian spas. Water Research, 32, 2271–2278.
Duenas, C., Fernandez, M.C., Carretero, J., Liger, E.& Canete, S. 1999. 226Ra and 222Rn concentrationsand doses in bottled waters in Spain. Journal of Envi-ronmental Radioactivity, 45, 283–290.
Dymond, J., Cobler, R., Gordon, L., Biscaye, P. &Mathieu, G. 1983. 226Ra and 222Rn contents of Gala-pagos Rift hydrothermal waters – the importance oflow-temperature interactions with crustal rocks.Earth and Planetary Science Letters, 64, 417–429.
Elliot, T., Bonotto, D.M. & Andrews, J.N. 2014. Dis-solved uranium, radium and radon evolution in theContinental Intercalaire aquifer, Algeria and Tunisia.Journal of Environmental Radioactivity, 137,150–162.
Erees, F.S., Yener, G., Salk, M. & Ozbal, O. 2006.Measurements of radon content in soil gas and in thethermal waters in Western Turkey. Radiation Mea-surements, 41, 354–361.
Eross, A., Madl-Szonyi, J., Surbeck, H., Horvath, A.,Goldscheider, N. & Csoma, A.E. 2012. Radionu-clides as natural tracers for the characterization of flu-ids in regional discharge areas, Buda Thermal Karst,Hungary. Journal of Hydrology, 426–427, 124–137.
Fonollosa, E., Penalver, A., Borrull, F. & Aguilar,C. 2016. Radon in spring waters in the south of Catalo-nia. Journal of Environmental Radioactivity, 151,275–281.
Forozani, G. & Soori, G. 2011. Study on radon andradium concentrations in drinking water in west regionof Iran. Agricultural Journal, 6, 310–312.
Gainon, F., Goldscheider, N. & Surbeck, H. 2007.Conceptual model for the origin of high radon levelsin spring waters – the example of the St. Placidusspring, Grisons, Swiss Alps. Swiss Journal of Geosci-ences, 100, 251–262.
Gattacceca, J.C., Mayer, A., Cucco, A., Claude, C.,Radakovitch, O., Vallet-Coulomb, C. & Hamelin,B. 2011. Submarine groundwater discharge in a
subsiding coastal lowland: a 226Ra and 222Rn investiga-tion in the Southern Venice lagoon. Applied Geochem-istry, 26, 907–920.
Gillmore, G.K., Crockett, R., Denman, T., Flowers,A. & Harris, R. 2012. Radium dial watches, a poten-tially hazardous legacy? Environment International,45, 91–98.
Girault, F. & Perrier, F. 2012a. Measuring effectiveradium concentration with large numbers of samples.Part I – Experimental method and uncertainties. Jour-nal of Environmental Radioactivity, 113, 177–188.
Girault, F. & Perrier, F. 2012b. Measuring effectiveradium concentration with large numbers of samples.Part II – General properties and representativity. Jour-nal of Environmental Radioactivity, 113, 189–202.
Girault, F. & Perrier, F. 2014. The Syabru-Bensi hydro-thermal system in central Nepal: 2. Modeling andsignificance of the radon signature. Journal of Geo-physical Research: Solid Earth, 119, 4056–4089,https://doi.org/10.1002/2013JB010302
Girault, F., Koirala, B.P., Bhattarai, M. & Perrier,F. 2016. Radon and carbon dioxide around remoteHimalayan thermal springs. In: Gillmore, G.K., Per-
rier, F.E. & Crockett, R.G.M. (eds) Radon, Healthand Natural Hazards. Geological Society, London,Special Publications, 451. First published onlineDecember 2, 2016, https://doi.org/10.1144/SP451.6
Godoy, J.M. & Godoy, M.L. 2006. Natural radioactivityin Brazilian groundwater. Journal of EnvironmentalRadioactivity, 85, 71–83.
Guillen, J., Tejado, J.J., Baeza, A., Salas, A. &Munoz-Munoz, J.G. 2014. Environmental impactof a granite processing factory as source of naturallyoccurring radionuclides. Applied Geochemistry, 47,122–129.
Guseva Canu, I., Laurent, O., Pires, N., Laurier, D. &Dublineau, I. 2011. Health effects of naturallyradioactive water ingestion: the need for enhancedstudies. Environmental Health Perspectives, 119,1676–1680.
Hammond, D.E., Leslie, B.W. & Ku, T.-L. 1988a. 222Rnconcentrations in deep formation waters and the geo-hydrology of the Cajon Pass borehole. GeophysicalResearch Letters, 15, 1045–1048.
Hammond, D.E., Zukin, J.G. & Ku, T.-L. 1988b. Thekinetics of radioisotope exchange between brine androck in a geothermal system. Journal of GeophysicalResearch, 93, 13,175–13,186.
Hartman, B. & Hammond, D.E. 1984. Gas exchangerates across the sediment-water and air-water inter-faces in South San Francisco Bay. Journal of Geophys-ical Research, 89, 3593–3603.
Heinicke, J., Koch, U., Hebert, D. & Martinelli, G.1995a. Simultaneous measurements of radon andCO2 in water as a possible tool for earthquake predic-tion. In: Dubois, C. (ed.) Gas Geochemistry. ScienceReviews, Northwood, UK, 295–303.
Heinicke, J., Koch, U. & Martinelli, G. 1995b. CO2
and radon measurements in the Vogtland area (Ger-many) – A contribution to earthquake predictionresearch. Geophysical Research Letters, 22, 771–774.
Hoffmann, W., Kranefeld, A. & Schmitz-Feuerhake,I. 1993. Radium-226-contaminated drinking water:hypothesis on an exposure pathway in a population
F. GIRAULT ET AL.
by guest on December 3, 2016http://sp.lyellcollection.org/Downloaded from

with elevated childhood leukemia. EnvironmentalHealth Perspectives, 101, 113–115.
Hussain, N., Church, T.M. & Kim, G. 1999. Use of 222Rnand 226Ra to trace groundwater discharge into theChesapeake Bay. Marine Chemistry, 65, 127–134.
IARC. 2012. A Review of Human Carcinogens. Part D:Radiation. IARC Monographs on the Evaluation ofCarcinogenic Risks to Humans, 100D. InternationalAgency for Research on Cancer, World Health Organi-zation, Lyon, France.
Isam Salih, M.M., Pettersson, H.B.L. & Lund, E.2002. Uranium and thorium series radionuclidesin drinking water from drilled bedrock wells: corre-lation to geology and bedrock radioactivity and doseestimation. Radiation Protection Dosimetry, 102,249–258.
Jacobi, R.B. 1949. S64. The determination of radon andradium in water. Journal of the Chemical Society, 1949,S314–S318, https://doi.org/10.1039/JR949000S314
Jia, G. & Jia, J. 2012. Determination of radium isotopes inenvironmental samples by gamma spectrometry, liquidscintillation counting and alpha spectrometry: a reviewof analytical methodology. Journal of EnvironmentalRadioactivity, 106, 98–119.
Jowzaee, S. 2013. Determination of selected naturalradionuclide concentrations in Southwestern Caspiangroundwater using liquid scintillation counting. Radia-tion Protection Dosimetry, 157, 234–241.
Kasztovszky, Z., Kuczi, R. & Szerbin, P. 1996. On thenatural radioactivity of waters in Hungary. CentralEuropean Journal of Occupational and EnvironmentalMedicine, 2, 335–347.
Kelkar, D.N. & Joshi, P.V. 1969. A rapid method for esti-mating radium and radon in water. Health Physics, 17,253–257.
Kies, A., Nawrot, A., Tosheva, Z. & Jania, J. 2011. Nat-ural radioactive isotopes in glacier meltwater studies.Geochemistry Journal, 45, 423–429.
King, P.T., Michel, J. & Moore, W.S. 1982. Groundwater geochemistry of 228Ra, 226Ra and 222Rn. Geo-chimica et Cosmochimica Acta, 46, 1173–1182.
Kiro, Y., Weinstein, Y., Starinsky, A. & Yechieli, Y.2015. Application of radon and radium isotopes togroundwater flow dynamics: an example from theDead Sea. Chemical Geology, 411, 155–171.
Kobal, I., Vaupotic, J., Mitic, D., Ancik, M., Jerancic,S. & Skofljanec, M. 1990. Natural radioactivity offresh waters in Slovenia, Yugoslavia. EnvironmentInternational, 16, 141–154.
Kohler, M., Preuße, W., Gleisberg, B., Schafer, I.,Heinrich, T. & Knobus, B. 2002. Comparison ofmethods for the analysis of 226Ra in water samples.Applied Radiation and Isotopes, 56, 387–392.
Kozłowska, B., Walencik, A., Przylibski, T.A.,Dorda, J. & Zipper, W. 2010. Uranium, radium andradon isotopes in selected brines of Poland. Nukleo-nika, 55, 519–522.
Kraemer, T.F. & Reid, D.F. 1984. The occurrenceand behavior of radium in saline formation water ofthe U.S. Gulf Coast region. Isotope Geoscience, 2,153–174.
Krishnaswami, S., Graustein, W.C., Turekian, K.K. &Dowd, J.F. 1982. Radium, thorium and radioactivelead isotopes in groundwaters: application to the in
situ determination of adsorption–desorption rateconstant and retardation factors. Water ResourcesResearch, 18, 1633–1675.
Krishnaswami, S., Bhushan, R. & Baskaran, M. 1991.Radium isotopes and 222Rn in shallow brines, Khara-ghoda (India). Chemical Geology, 87, 125–136.
Kronfeld, J., Ilani, S. & Strull, A. 1991. Radium pre-cipitation and extreme 238U-series disequilibriumalong the Dead Sea coast, Israel. Applied Geochemis-try, 6, 355–361.
Lamontagne, S., Le Gal La Salle, C. et al. 2008.Radium and radon radioisotopes in regional groundwa-ter, intertidal groundwater, and seawater in the Ade-laide Coastal Waters Study area: implications for theevaluation of submarine groundwater discharge.Marine Chemistry, 109, 318–336.
Le Cong, H., Huynh Nguyen, P.T., Nguyen, V.T. & Le
Quoc, B. 2015. Radon and radium concentrations indrinkable water supplies of the Thu Duc region in HoChi Minh city, Vietnam. Applied Radiation and Iso-topes, 105, 219–224, https://doi.org/10.1016/j.apradiso.2015.08.033
Lopez, M.G. & Sanchez, A.M. 2008. Present status of222Rn in groundwater in Extremadura. Journal of Envi-ronmental Radioactivity, 99, 1539–1543.
Luo, S., Ku, T.-L., Roback, R., Murrell, M. & McLing,T.L. 2000. In-situ radionuclide transport and preferen-tial groundwater flows at INEEL (Idaho): decay-seriesdisequilibrium studies. Geochimica et CosmochimicaActa, 64, 867–881.
Luo, X., Jiao, J.J., Wang, X.-S. & Liu, K. 2016. Tem-poral 222Rn distributions to reveal groundwater dis-charge into desert lakes: implication of water balancein the Badain Jaran Desert, China. Journal of Hydrol-ogy, 534, 87–103.
Mazor, E. 1962. Radon and radium content of some Isreliwater sources and a hypothesis on underground reser-voirs of brines, oils and gases in the Rift Valley. Geo-chimica et Cosmochimica Acta, 26, 765–786.
Moise, T., Starinsky, A., Katz, A. & Kolodny, Y. 2000.Ra isotopes and Rn in brines and ground waters of theJordan-Dead Sea Rift Valley: enrichment, retardation,and mixing. Geochimica et Cosmochimica Acta, 64,2371–2388.
Moldovan, M., Benea, V., Nita, D.C., Papp, B., Bur-
ghele, B.D., Bican-Brisan, N. & Cosma, C. 2014.Radon and radium concentration in water fromnorth-west of Romania and the estimated doses.Radiation Protection Dosimetry, 162, 96–100.
Morvan, K., Andres, Y., Mokili, B. & Abbe, J.-C. 2001.Determination of radium-226 in aqueous solutions bya-spectrometry. Analytical Chemistry Journal of Envi-ronmental Radioactivity, 73, 4218–4224.
Murad, A., Alshamsi, D., Hou, X.L., Al Shidi, F., Al
Kendi, R. & Aldahan, A. 2014. Radioactivity ingroundwater along the borders of Oman and UAE.Journal of Radioanalytical and Nuclear Chemistry,299, 1653–1660.
Nakai, T. 1940. Radium content of mineral springs inJapan. Bulletin of the Chemical Society of Japan, 15,333–426.
Nazaroff, W.W. 1992. Radon transport from soil to air.Reviews of Geophysics, 30, 137–160, https://doi.org/10.1029/92RG00055
RADON-222 AND RADIUM-226 OCCURRENCE IN WATER
by guest on December 3, 2016http://sp.lyellcollection.org/Downloaded from
Nelson, P.H., Rachiele, R. & Smith, A. 1983. Transportof radon in flowing boreholes at Stripa, Sweden. Jour-nal of Geophysical Research, 88, 2395–2405.
Oliveira, J., Mazzili, B., Oliveira Sampa, M.H. &Silva, B. 1998. Seasonal variations of 226Ra and min-eral spring waters of Aguas da Prata, Brazil. AppliedRadiation and Isotopes, 49, 423–427.
Oliveira, J., Mazzilli, B.P., Oliveira Sampa, M.H. &Bambalas, E. 2001. Natural radionuclides in drinkingwater supplies of Sao Paulo State, Brazil and conse-quent population doses. Journal of EnvironmentalRadioactivity, 53, 99–109.
Onishchenko, A., Zhukovsky, M., Veselinovic, N. &Zunic, Z.S. 2010. Radium-226 concentration in springwater sampled in high radon regions. Applied Radia-tion and Isotopes, 68, 825.
Othman, I. & Yassine, T. 1996. Natural radioactivity ofdrinking water in the southern and middle parts ofSyria. Environment International, 22, S355–S359.
Outola, I., Nour, S. et al. 2008. Investigation of radio-activity in selected drinking water samples from Mary-land. Journal of Radioanalytical and NuclearChemistry, 277, 155–159, https://doi.org/10.1007/s10967-008-0724-5
Perrier, F., Aupiais, J., Girault, F., Przylibski, T.A. &Bouquerel, H. 2016a. Optimized measurement ofradium-226 concentration in liquid samples withradon-222 emanation. Applied Radiation and Isotopes,157, 52–59.
Perrier, F., Girault, F. & Bouquerel, H. 2016b. Effec-tive radium-226 concentration in rocks, soils, plantsand bones. In: Gillmore, G.K., Perrier, F.E. &Crockett, R.G.M. (eds) Radon, Health and NaturalHazards. Geological Society, London, Special Publi-cations, 451. First published online November 21,2016, https://doi.org/10.1144/SP451.8
Peterson, R.N., Burnett, W.C., Taniguchi, M., Chen,J., Santos, I.R. & Ishitobi, T. 2008. Radon andradium isotope assessment of submarine groundwaterdischarge in the Yellow River delta, China. Journalof Geophysical Research: Oceans, 113, C09021,https://doi.org/10.1029/2008JC004776
Peterson, R.N., Santos, I.R. & Burnett, W.C. 2010.Evaluating groundwater discharge to tidal riversbased on a Rn-222 time-series approach. Estuarine,Coastal and Shelf Science, 86, 165–178.
Petrovic Pantic, T., Birke, M., Petrovic, B., Nikolov,J., Dragisic, V. & Zivanovic, V. 2015. Hydrogeo-chemistry of thermal groundwaters in the Serbian crys-talline core region. Journal of GeochemicalExploration, 159, 101–114.
Porstendorfer, J. 1994. Properties and behaviour ofradon and thoron and their decay products in the air.Journal of Aerosol Science, 25, 219–263.
Przylibski, T.A. 2000. Estimating the radon emanationcoefficient from crystalline rocks into groundwater.Applied Radiation and Isotopes, 53, 473–479.
Przylibski, T.A. 2011. Shallow circulation groundwater –the main type of water containing hazardous radonconcentration. Natural Hazards and Earth System Sci-ences, 11, 1695–1703.
Przylibski, T.A., Kozaowska, B., Dorda, J. & Kieac-
zawa, B. 2002. Radon-222 and 226Ra concentrationsin mineralized groundwaters of Gorzanow (Kaodzko
Basin, Sudeten Mountains, SW Poland). Journal ofRadioanalytical and Nuclear Chemistry, 253, 11–19.
Przylibski, T.A., Gorecka, J. et al. 2014. 222Rn and226Ra activity concentrations in groundwaters of south-ern Poland: new data and selected genetic relations.Journal of Radioanalytical and Nuclear Chemistry,301, 757–764.
Purkla, S. & Eisenhauer, A. 2004. Determination ofradium isotopes and 222Rn in a groundwater affectedcoastal area of the Baltic Sea and the underlying sub-sea floor aquifer. Marine Chemistry, 87, 137–149.
Rajesh, B.M., Chandrashekara, M.S., Nagaraja, P.,Chandrashekara, A. & Paramesh, L. 2014. Distri-bution of 226Ra and 222Rn in bore well and lakewater of Mysore Taluk, Karnataka State, India. Inter-national Journal of Environmental Sciences, 4,558–566.
Rama, & Moore, W.S. 1984. Mechanism of transport ofU–Th series radioisotopes from solids into groundwater. Geochimica et Cosmochimica Acta, 48,395–399.
Reynolds, B.C., Wasserburg, G.J. & Baskaran, M.2003. The transport of U- and Th-series nuclides insandy confined aquifers. Geochimica et CosmochimicaActa, 67, 1955–1972.
Roba, C.A., Codrea, V., Moldovan, M., Baciu, C. &Cosma, C. 2010. Radon and radium content of somecold and thermal aquifers from Bihor County (north-western Romania). Geofluids, 10, 571–585.
Roba, C.A., Nita, D., Cosma, C., Codrea, V. & Olah,S. 2012. Correlations between radium and radonoccurrence and hydrogeochemical features for variousgeothermal aquifers in Northwestern Romania. Geo-thermics, 42, 32–46.
Rodellas, V., Garcia-Orellana, J. et al. 2012. Quan-tifying groundwater discharge from different sourcesinto a Mediterranean wetland by using 222Rn and Raisotopes. Journal of Hydrology, 466–467, 11–22.
Rodenas, C., Gomez, J., Soto, J. & Maraver, F. 2008.Natural radioactivity of spring water used as spas inSpain. Journal of Radioanalytical and Nuclear Chem-istry, 277, 625–630.
Rosenberg, Y.O., Metz, V. & Ganor, J. 2011a.Co-precipitation of radium in high ionic strength sys-tems: 1. Thermodynamic properties of the Na–Ra–Cl–SO4–H2O system – Estimating Pitzer parametersfor RaCl2. Geochimica et Cosmochimica Acta, 75,5389–5402.
Rosenberg, Y.O., Metz, V., Oren, Y., Volkman, Y. &Ganor, J. 2011b. Co-precipitation of radium in highionic strength systems: 2. Kinetic and ionic strengtheffects. Geochimica et Cosmochimica Acta, 75,5403–5422.
Rutgers van der Loeff, M.M., Cassar, N., Nicolaus,M., Rabe, B. & Stimac, I. 2014. The influence ofsea ice cover on air-sea gas exchange estimated withradon-222 profiles. Journal of Geophysical Research:Oceans, 119, 2735–2751, https://doi.org/10.1002/2013JC009321
Sac, M.M., Aydemir, S., Ichedef, M., Kumru, M.N.,Bolca, M. & Ozen, F. 2014. Natural radioactivity lev-els of geothermal waters and their influence on soil andagricultural activities. Radiation Protection Dosime-try, 158, 148–155.
F. GIRAULT ET AL.
by guest on December 3, 2016http://sp.lyellcollection.org/Downloaded from

Sadat-Noori, M., Santos, I.R., Sanders, C.J., Sanders,L.M. & Maher, D.T. 2015. Groundwater dischargeinto an estuary using spatially distributed radon timeseries and radium isotopes. Journal of Hydrology,528, 703–719.
Sahin, L., Cetinkaya, H., Sac, M.M. & Ichedef, M.2013. Determination of radon and radium concentra-tions in drinking water samples around the city ofKutahya. Radiation Protection Dosimetry, 155,474–482.
Salonen, L. 1988. Natural radionuclides in ground waterin Finland. Radiation Protection Dosimetry, 24,163–166.
Santos, I.R. & Eyre, B.D. 2011. Radon tracing of ground-water discharge into an Australian estuary surroundedby coastal acid sulphate soils. Journal of Hydrology,396, 246–257.
Santos, T.O. & Bonotto, D.M. 2014. 222Rn, 226Ra, andhydrochemistry in the Bauru Aquifer System, SaoJose do Rio Preto (SP), Brazil. Applied Radiationand Isotopes, 86, 109–117.
Sarin, M.M., Krishnaswami, S., Somayajulu, B.L.K. &Moore, W.S. 1990. Chemistry of uranium, thorium,and radium isotopes in the Ganga Brahmaputra riversystem: weathering processes and fluxes to the Bayof Bengal. Geochimica et Cosmochimica Acta, 54,1387–1396.
Schettler, G., Oberhansli, H. & Hahne, K. 2015.Ra-226 and Rn-222 in saline water compartments ofthe Aral Sea region. Applied Geochemistry, 58,106–122.
Schubert, M., Buerkin, W., Pena, P., Lopez, A.E. &Balcazar, M. 2006. On-site determination of theradon concentration in water samples: methodicalbackground and results from laboratory studies anda field-scale test. Radiation Measurements, 41,492–497.
Schubert, M., Paschke, A., Lieberman, E. & Bur-
nett, W.C. 2012. Air–water partitioning of 222Rnand its dependence on water temperature and sali-nity. Environmental Science & Technology, 46,3905–3911.
Segovia, N., Tamez, E., Iturbe, J.L., Pena, P., Hernan-
dez, A., Aranda, P. & Lopez-Castanares, R. 1999.Radon and radium determination in groundwaterfrom a volcanic zone in central Mexico. In: Newton,G.W.A. (ed.) Environmental Radiochemical Analy-sis. Royal Society of Chemistry, Cambridge, UK,37–44.
Shivakumara, B.C., Chandrashekara, M.S., Kavitha,E. & Paramesh, L. 2014. Studies on 226Ra and 222Rnconcentration in drinking water of Mandya region,Karnataka State, India. Journal of Radiation Researchand Applied Sciences, 7, 491–498.
Soto, J., Quindos, L.S., Diaz-Caneja, N., Gutierrez, I.& Fernandez, P.L. 1988. 226Ra and 222Rn in naturalwaters in two typical locations in Spain. Radiation Pro-tection Dosimetry, 24, 109–111.
Stojkovic, I., Tenjovic, B., Nikolov, J., Veskovic, M.,Mrda, D. & Todorovic, N. 2015. Improvement ofmeasuring methods and instrumentation concerning222Rn determination in drinking waters – RAD7 andLSC technique comparison. Applied Radiation andIsotopes, 98, 117–124.
Strain, C.D., Watson, J.E., JR. & Fong, S.-W. 1979. Anevaluation of 226Ra and 222Rn concentrations in groundand surface water near a phosphate mining and manu-facturing facility. Health Physics, 37, 779–783.
Strutt, R.J. 1904. A study of the radio-activity ofcertain minerals and mineral waters. Nature, 69,473–475.
Sun, Z. & Li, X. 2001. Studies of geothermal waters inJiangxi Province using isotope techniques. Science inChina Series E: Technological Sciences, 44, 144–150.
Szabo, Z., dePaul, V.T., Fischer, J.M., Kraemer, T.F.& Jacobsen, E. 2012. Occurrence and geochemistryof radium in water from principal drinking-water aqui-fer systems of the United States. Applied Geochemis-try, 27, 729–752.
Szerbin, P. 1996. Natural radioactivity of certain spas andcaves in Hungary. Environment International, 22,S389–S398.
Szerbin, P. & Koteles, G. 2002. 222Rn, 226Ra, and U indrinking water in Hungary. In: IAEA TechnologicallyEnhanced Natural Radiation (TENR II), Vienna, Aus-tria. International Atomic Energy Agency, Vienna,Austria, 158–165.
Tabar, E., Kumru, M.N., Sac, M.M., Ichedef, M.,Bolca, M. & Ozen, F. 2013. Radiological andchemical monitoring of Dikili geothermal waters,Western Turkey. Radiation Physics and Chemistry,91, 89–97.
Tanner, A.B. 1964a. Radon migration in the ground: Areview. In: Adams, J.A.S. & Lowder, W.M. (eds)The Natural Radiation Environment. University ofChicago Press, Chicago, IL, 161–190.
Tanner, A.B. 1964b. 14. Physical and chemical controlson distribution of radium-226 and radon-222 in groundwater near Great Salt Lake, Utah. In: Adams, J.A.S. &Lowder, W.M. (eds) The Natural Radiation Environ-ment. University of Chicago Press, Chicago, IL,253–278.
Thomas, J.M., Welch, A.H., Lico, M.S., Hughes, J.L. &Whitney, R. 1993. Radionuclides in ground waterof the Carson River Basin, western Nevada and eas-tern California, U.S.A. Applied Geochemistry, 8,447–471.
Tomita, J., Satake, H., Fukuyama, T., Sasaki, K., Saka-
guchi, A. & Yamamoto, M. 2010. Radium geochem-istry in Na–Cl type groundwater in Niigata Prefecture,Japan. Journal of Environmental Radioactivity, 101,201–210.
Tricca, A., Wasserburg, G.J., Porcelli, D. & Bas-
karan, M. 2001. The transport of U- and Th-seriesnuclides in a sandy unconfined aquifer. Geochimicaet Cosmochimica Acta, 65, 1187–1210.
Tyler, A.N., Dale, P., Copplestone, D., Bradley, S.,Ewen, H., McGuire, C. & Scott, E.M. 2013. Theradium legacy: contaminated land and the committedeffective dose from the ingestion of radium contami-nated materials. Environment International, 59,448–455.
Vengosh, A., Hirschfeld, D. et al. 2009. High naturallyoccuring radioactivity in fossil groundwater from theMiddle East. Environmental Science & Technology,43, 1769–1775.
Vesterbacka, P., Makelainen, I. & Arvela, H. 2005.Natural radioactivity in drinking water in private
RADON-222 AND RADIUM-226 OCCURRENCE IN WATER
by guest on December 3, 2016http://sp.lyellcollection.org/Downloaded from

wells in Finland. Radiation Protection Dosimetry, 113,223–232.
Villalba, L., Montero-Cabrera, M.E. et al. 2006.Natural radioactivity in groundwater and estimates ofcommitted effective dose due to water ingestion inthe state of Chihuahua (Mexico). Radiation ProtectionDosimetry, 121, 148–157.
Vinson, D.S., Campbell, T.R. & Vengosh, A. 2008.Radon transfer from groundwater used in showers toindoor air. Applied Geochemistry, 23, 2676–2685.
Vinson, D.S., Vengosh, A., Hirschfeld, D. & Dwyer,G.S. 2009. Relationships between radium and radonoccurrence and hydrochemistry in fresh groundwaterfrom fractured crystalline rocks, North Carolina(USA). Chemical Geology, 260, 159–171.
Vinson, D.S., Tagma, T., Bouchaou, L., Dwyer, G.S.,Warner, N.R. & Vengosh, A. 2013. Occurrence andmobilization of radium in fresh to saline coastalgroundwater inferred from geochemical and isotopictracers (Sr, S, O, H, Ra, Rn). Applied Geochemistry,38, 161–175.
Walencik, A., Kozłowska, B., Przylibski, T.A.,Dorda, J. & Zipper, W. 2010. Natural radioactivityof groundwater from the Przerzeczyn-Zdroj Spa.Nukleonika, 55, 169–175.
Wallner, G. & Steininger, G. 2007. Radium iso-topes and 222Rn in Austrian drinking waters. Journalof Radioanalytical and Nuclear Chemistry, 274,511–516.
Wanty, R.B., Johnson, S.L. & Briggs, P.H. 1991.Radon-222 and its parent radionuclides in groundwaterfrom two study areas in New Jersey and Maryland,U.S.A. Applied Geochemistry, 6, 305–318.
Watson, J.E., JR & Mitsch, B.F. 1987. Ground-water con-centrations of 226Ra and 222Rn in North Carolina phos-phate lands. Health Physics, 52, 361–365.
Weaver, T.R. & Bahr, J.M. 1991. Geochemical evolu-tion in the Cambrian–Ordovician sandstone aquifer,Eastern Wisconsin: 1. Major ion and radionuclide dis-tribution. Ground Water, 29, 350–356.
Weise, S.M., Brauer, K., Kampf, H., Strauch, G. &Koch, U. 2001. Transport of mantle volatiles throughthe crust traced by seismically released fluids: a naturalexperiment in the earthquake swarm area Vogtland/NW Bohemia, Central Europe. Tectonophysics, 336,137–150.
Wrenn, M.E., Durbin, P.W., Howard, B., Lipsztein, J.,Rundo, J., Still, E.T. & Willis, D.L. 1985. Metabo-lism of ingested U and Ra. Health Physics, 48,601–633, https://doi.org/10.1097/00004032-198505000-00004
Xu, L., Wang, Y., Lu, J., Lu, W., Liu, Y. & Liu, X. 2002.Radioactive contamination of the environment as aresult of uranium production: a case study at the aban-doned Lincang uranium mine, Yunnan Province,China. Science in China Series B: Chemistry, 45,11–19.
Yarar, Z., Taskopru, C., Ichedef, M., Sac, M.M.,Kumru, M.N. & Bolca, M. 2015. 222Ra and 226Rain geothermal waters of Bayındır-Izmir (Turkey).Environmental Earth Sciences, 74, 6943–6949,https://doi.org/10.1007/s12665-015-4701-3
Zhuo, W., Iida, T. & Yang, X. 2001. Occurrence of222Rn, 226Ra, 228Ra and U in groundwater in FujianProvince, China. Journal of Environmental Radioac-tivity, 53, 111–120.
Zukin, J.G., Hammond, D.E., Ku, T.-L. & Elders, W.A.1987. Uranium-thorium series radionuclides in brinesaud reservoir rocks from two deep geothermal bore-holes in the Salton Sea Geothermal Field, southeasternCalifornia. Geochimica et Cosmochimica Acta, 51,2719–2731.
F. GIRAULT ET AL.
by guest on December 3, 2016http://sp.lyellcollection.org/Downloaded from