radionuclide transfer to wildlife wg 5...radionuclide transfer to wildlife wg 5: activities • key...
TRANSCRIPT

EMRAS II Jan 2010
Radionuclide Transfer to WildlifeWG 5:
Activities
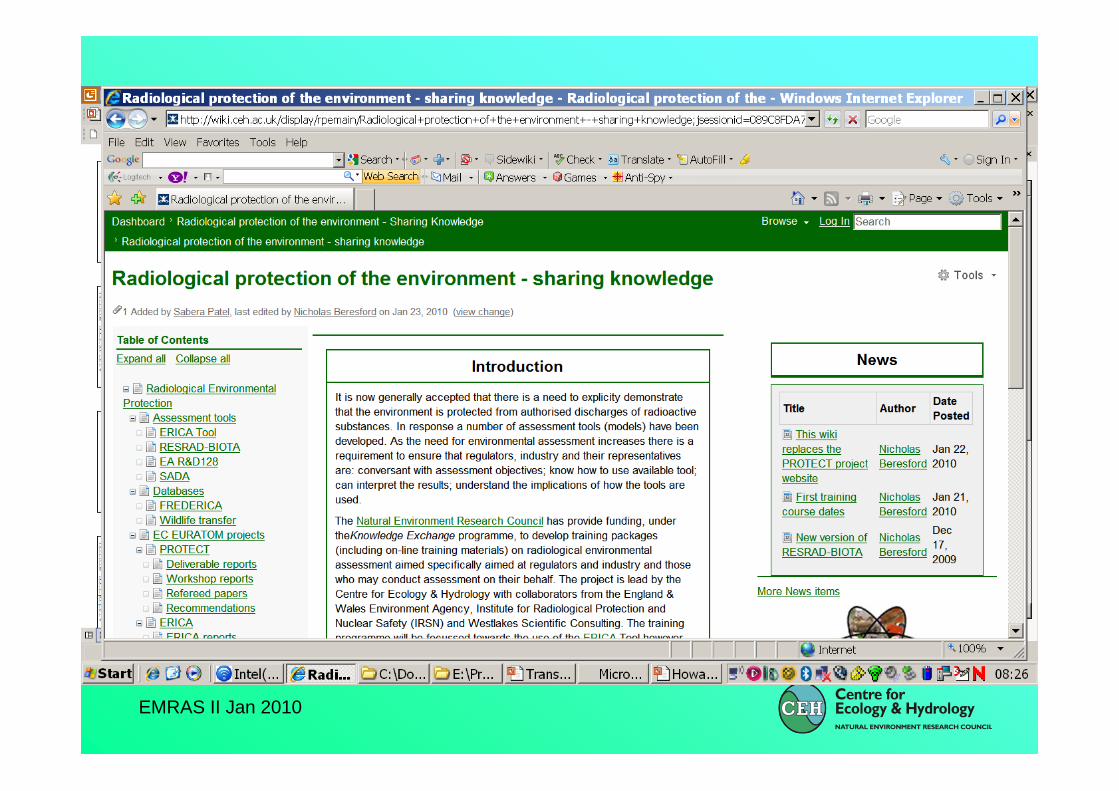
• Key output TRS on transfer to wildlife• On-line database – can be accessed through
PROTECT website linked wiki(www.ceh.ac.uk/protect)
• Science presentations on inputs• Publication in Radiation Environ Biophys

EMRAS II Jan 2010
TRS: RADIONUCLIDE TRANSFER TO WILDLIFE
Provide IAEA Member States with data for use in the radiological assessment of wildlife as a consequence of routine
discharges of radionuclides to the environment and existing contamination situations.

EMRAS II Jan 2010

EMRAS II Jan 2010
Database output

EMRAS II Jan 2010
With sources…

EMRAS II Jan 2010
Can elemental composition data of crop leaves be applied to tree leaves and wild grass?
K. Tagami & S. Uchida, NIRS, Japan
10-4
10-2
100
102
104
106
10-4 10-2 100 102 104 106
Herbaceous plants
Conc
entr
atio
ns o
f ele
men
ts in
Her
bace
ous
plan
ts, m
g/kg
Elemental concentraiton in leafy vegetables, mg/kg
10-4
10-2
100
102
104
106
10-4 10-2 100 102 104 106
Rice leaves
Conc
entr
atio
ns o
f ele
men
ts in
Her
bace
ous
plan
ts, m
g/kg
Elemental concentraiton in leafy vegetables, mg/kg

EMRAS II Jan 2010
Transfers to Marine Biota: Developments of a PhylogeneticBioaccumulation ModelJeffree et al , MEL, IAEA
• Hypothesis: – Evolutionary divergent organisms have different patterns of
bioaccumulation of trace elements– The greater the period of divergence the greater the
differences
– tested by short-term experimental bioaccumulation from seawater;54Mn, 60Co, 65Zn, 109Cd, 110mAg, 75Se, 134Cs, 241Am, 51Cr
• Outcomes– Differences demonstrated can be interpreted in terms of
differences in physiology and anatomy– Has identified ‘at risk’ taxa, relative to reference organisms

EMRAS II Jan 2010
The Cephalochordate: Amphioxus
Transform: Log(X+1)Standardise Samples by TotalResemblance: D1 Euclidean distance
Co-60
20
80
140
200
d
dd
d
d
dd
bbbb
b bb ba
ba
ba
ba
baba
bababa
t
t ttt
tt ttt
r
r
r
rto
to
aaaaa aa
aa
aaa
aa
aaaa
a
a
2D Stress: 0.08
a a a a a a a a a a a a a a a a a a a a ba b b b b b b b ba ba ba ba ba ba ba ba t t t t t t t t t t r r r r to d to d d d d d d
Samples
0
5
10
15
20
Dis
tanc
e
Transform: Log(X+1)Standardise Samples by TotalResemblance: D1 Euclidean distance
speciesdbbatrtoa
All amphioxus group together, distinct from teleosts and
chondrichthyans, but closer to teleosts

EMRAS II Jan 2010
Reptiles: Mike Wood, Liverpool U

EMRAS II Jan 2010
The CR database• 251 data lines (n=856)
– Snakes (13 species)– Lizards (16 species)– Turtles and tortoises (8 species)– Crocodilians (3 species)
• 35 elements in freshwater reptiles– Am, As, B, Ba, Ca, Cd, Ce, Cm, Co, Cr, Cs, Cu, Fe, Hg, K, La, Mg,
Mn, Mo, Na, Ni, Pb, Po, Pu, Ra, Rb, Sb, Se, Sr, Th, U, V, Y, Zn, Zr
• 15 elements in terrestrial reptiles– Am, C, Cs, Cu, K, Mn, Ni, Pb, Po, Pu, Sr, Tc, Th, U, Zn
• 10 elements in freshwater reptile eggs– As, Cd, Cr, Cu, Fe, Hg, Mn, Pb, Zn
EMRAS II Jan 2010
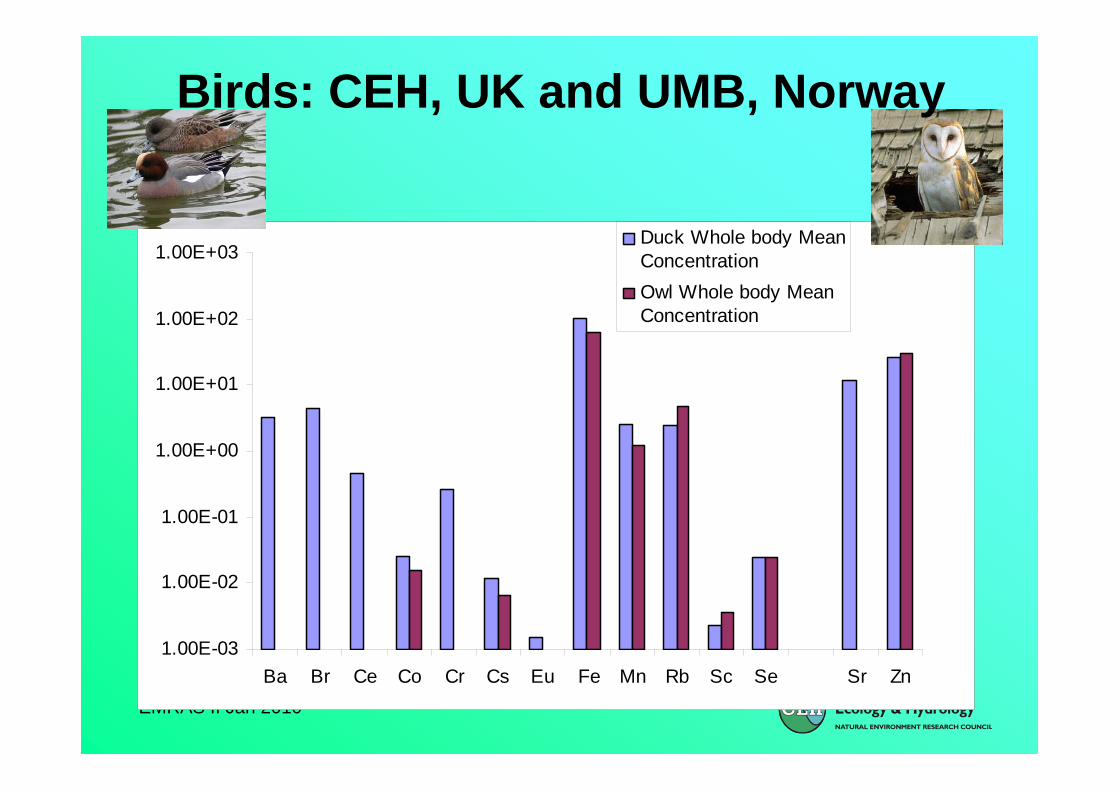
1.00E-03
1.00E-02
1.00E-01
1.00E+00
1.00E+01
1.00E+02
1.00E+03
Ba Br Ce Co Cr Cs Eu Fe Mn Rb Sc Se Sr Zn
Duck Whole body MeanConcentrationOwl Whole body MeanConcentration
Birds: CEH, UK and UMB, Norway
EMRAS II Jan 2010
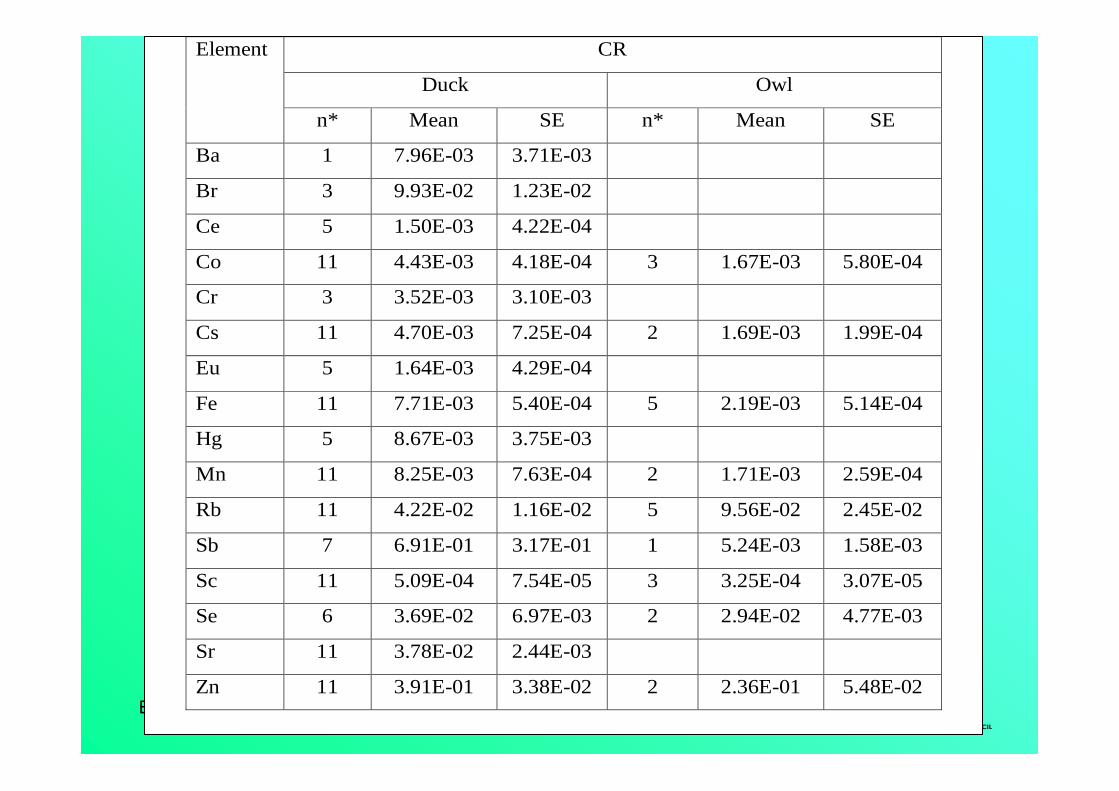
Element CR
Duck Owl
n* Mean SE n* Mean SE
Ba 1 7.96E-03 3.71E-03
Br 3 9.93E-02 1.23E-02
Ce 5 1.50E-03 4.22E-04
Co 11 4.43E-03 4.18E-04 3 1.67E-03 5.80E-04
Cr 3 3.52E-03 3.10E-03
Cs 11 4.70E-03 7.25E-04 2 1.69E-03 1.99E-04
Eu 5 1.64E-03 4.29E-04
Fe 11 7.71E-03 5.40E-04 5 2.19E-03 5.14E-04
Hg 5 8.67E-03 3.75E-03
Mn 11 8.25E-03 7.63E-04 2 1.71E-03 2.59E-04
Rb 11 4.22E-02 1.16E-02 5 9.56E-02 2.45E-02
Sb 7 6.91E-01 3.17E-01 1 5.24E-03 1.58E-03
Sc 11 5.09E-04 7.54E-05 3 3.25E-04 3.07E-05
Se 6 3.69E-02 6.97E-03 2 2.94E-02 4.77E-03
Sr 11 3.78E-02 2.44E-03
Zn 11 3.91E-01 3.38E-02 2 2.36E-01 5.48E-02
EMRAS II Jan 2010

EMRAS II Jan 2010
Future
• Data entry to May 09• Summer meeting June/July, location ?
– Review revised text– Consider data tables for CR and conversions
• Trends, extent of change in values compared to initial ERICA Tool database
• QC• Wildlife group sub divisions?

EMRAS II Jan 2010
The Kd “problem”
Sr
1
10
100
1000
10000
3 4 5 6 7 8 9
pH
Kd
l/kg
[DOC] = 1[DOC] = 3[DOC] = 10ERICA valuesw pH 8
EMRAS II Jan 2010
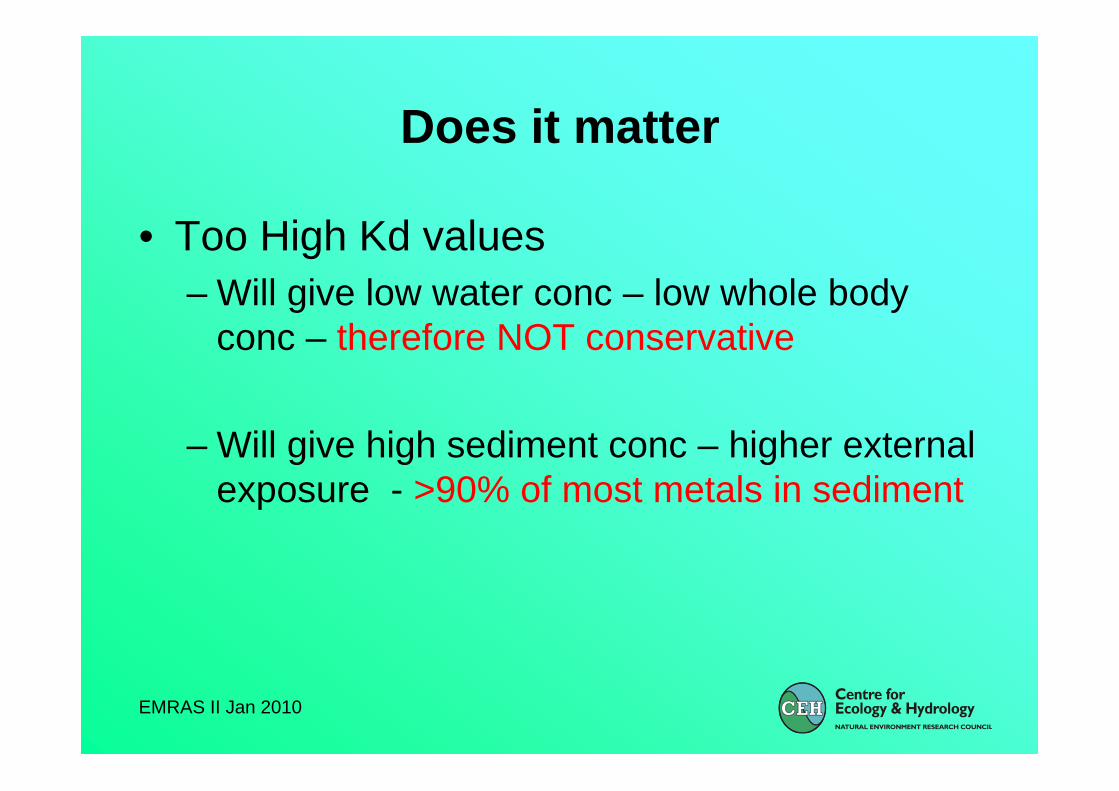
Does it matter
• Too High Kd values– Will give low water conc – low whole body
conc – therefore NOT conservative
– Will give high sediment conc – higher external exposure - >90% of most metals in sediment