radiological protection of patients in diagnostic - publications - iaea
TRANSCRIPT

CONTRIBUTED PAPERS
International Conference held in Málaga, Spain, 26–30 March 2001 Organized by the International Atomic Energy Agency
and co-sponsored by the European Commission, the Pan American Health Organization and
the World Health Organization
Radiological Protection of Patients in Diagnostic and
Interventional Radiology, Nuclear Medicine and Radiotherapy
I N T E R N A T I O N A L A T O M I C E N E R G Y A G E N C Y

The originating Section of this publication in the IAEA was:
Radiation Safety Section International Atomic Energy Agency
Wagramer Strasse 5 P.O. Box 100
A-1400 Vienna, Austria
RADIOLOGICAL PROTECTION OF PATIENTS IN DIAGNOSTIC AND INTERVENTIONAL RADIOLOGY,
NUCLEAR MEDICINE AND RADIOTHERAPY IAEA, VIENNA, 2001
IAEA-CSP-7/P ISSN 1563–0153
© IAEA, 2001
Printed by the IAEA in Austria March 2001

FOREWORD
An International Conference on the Radiological Protection of Patients in Diagnostic and Interventional Radiology, Nuclear Medicine and Radiotherapy organized by the International Atomic Energy Agency and co-sponsored by the European Commission, the Pan American Health Organization and the World Health Organization was held in Málaga, Spain, from 26 to 30 March 2001. The Government of Spain has hosted this Conference through the Ministerio de Sanidad y Consumo, the Consejo de Seguridad Nuclear, the Junta de Andalucía, the Universidad de Málaga and the Grupo de Investigación en Protección Radiológica de la Universidad de Málaga (PRUMA). The Conference has been organized in co-operation with the United Nations Scientific Committee on the Effects of Atomic Radiation (UNSCEAR), the International Commission on Radiological Protection (ICRP) and the following professional societies: International Organization of Medical Physicists (IOMP), International Radiation Protection Association (IRPA), International Society of Radiation Oncology (ISRO), International Society of Radiology (ISR), International Society of Radiographers and Radiological Technologists (ISRRT) and World Federation of Nuclear Medicine and Biology (WFNMB). This publication contains contributed papers submitted to the Conference Programme Committee. The papers are in one of the two working languages of this Conference, English and Spanish. The IAEA is planning to issue proceedings of this Conference containing selected presentations. The topics covered by the Conference are as follows: • Radiological protection of patients in general diagnostic radiology (radiography) • Radiological protection of patients in general diagnostic radiology (fluoroscopy) • Radiological protection issues in specific uses of diagnostic radiology, such as
mammography and computed tomography (with special consideration of the impact of digital techniques)
• Radiological protection in interventional radiology, including fluoroscopy not carried out by radiologists
• Radiological protection of patients in nuclear medicine • Developing and using dose guidance (reference) levels in radiology and nuclear medicine
examinations • Radiological protection of the embryo and foetus in pregnant patients • Radiological protection of paediatric patients • Radiological protection of patients in radiotherapy: external beam • Radiological protection of patients in radiotherapy: brachytherapy • Radiological protection of patients in biomedical research • Influence of standardization in the design and development of medical radiological
equipment on the radiological protection of patients • Education, training and continuous professional development in the radiological protection
of patients • Topics for research and development in the radiological protection of patients • Implementation of regulations on the radiological protection of patients

EDITORIAL NOTE
This publication has been prepared from the original material as submitted by the authors. The views expressed do not necessarily reflect those of the IAEA, the governments of the nominating Member States or the nominating organizations.
The use of particular designations of countries or territories does not imply any judgement by the publisher, the IAEA, as to the legal status of such countries or territories, of their authorities and institutions or of the delimitation of their boundaries.
The mention of names of specific companies or products (whether or not indicated as registered) does not imply any intention to infringe proprietary rights, nor should it be construed as an endorsement or recommendation on the part of the IAEA.
The authors are responsible for having obtained the necessary permission for the IAEA to reproduce, translate or use material from sources already protected by copyrights.

CONTENTS
RADIOLOGICAL PROTECTION OF PATIENTS IN GENERAL DIAGNOSTIC
RADIOLOGY (RADIOGRAPHY) (Topical Session 1a)*
Swiss nation-wide survey on radiation doses in diagnostic radiology (IAEA-CN-85-82) ..................... 3
A. Aroua, J.F. Valley, J.-P. Vader, B. Burnand
Evaluation of patient skin dose equivalent due to diagnostic procedures with x-rays in
Lagos State, Nigeria (IAEA-CN-85-149)........................................................................................... 7
M.A. Aweda
Entrance surface dose measurement for some of the radiological patients in Bangladesh
(IAEA-CN-85-193) ............................................................................................................................ 9
Z. Begum
The first trial patient dose survey in diagnostic radiology in Viet Nam (IAEA-CN-85-206)............... 13
Dang Thanh Luong, Duong van Vinh, Ha Ngoc Thach, Phan Tuong Van,
Nguyen Phuong Dung, Pham Quang Dien, Nguyen Manh Phuc, Nguyen Manh Truong
Radiation doses to patients in diagnostic radiology in Romania; comparison with guidance levels
and possibilities of reduction (IAEA-CN-85-5)............................................................................... 17
C. Milu, A. Dumitrescu, R. Marin, F.S. Popescu
Patient’s dose assessment during sinus X-rays radiography at “Hopital du Point G”
(IAEA-CN-85-14) ............................................................................................................................ 21
S. Sidibe, B.Y. Sacko, M. Doucoure, B. Traore, I. Traore
Trends and the determination of effective doses for standard x-ray procedures
(IAEA-CN-85-29) ............................................................................................................................ 25
H.M. Johnson, C. Neduzak, J. Gallet, J. Sandeman
A project: “Radiological protection in radiology”, IAEA–Universidad Central de Venezuela
(IAEA-CN-85-33) ............................................................................................................................ 30
A.R. Díaz, G. Salazar, R. Fermín, M. González
Ionizing radiation used in medical diagnostics as a sourse of a radiation exposure of the patient
with occupational diseases. Analysis and problems (IAEA-CN-85-42).......................................... 35
D.B. Apostolova, Z.D. Paskalev
Patient’s and occupational dose exposure in roentgen examinations (IAEA-CN-85-47)..................... 39
L. Qafmolla, G. Shehi
Indonesia’s experience on IAEA-CRP on radiation protection in diagnostic radiology
(IAEA-CN-85-81) ................................................................................................................................. 44
Nasukha
Radiation protection of patients in general diagnostic radiology in Lithuania (IAEA-CN-85-99) ...... 48
G. Morkunas, J. Ziliukas
Doses to patients from diagnostic radiology in Romania (IAEA-CN-85-105) ..................................... 53
O. Iacob, C. Diaconescu
Some experiences from radiation protection of patients undergoing X-ray examinations
in Tanzania (IAEA-CN-85-113)....................................................................................................... 58
J.E. Ngaile, W.E. Muhogora, A.M. Nyanda
Medical exposure in Russia (IAEA-CN-85-136) .................................................................................. 64
S.A. Kalnitsky, A.B. Bazukin, M.M. Vlasova, S.I. Ivanov, E.V. Ivanov,
Y.O. Jakubovskiy-Lipsky, A.A. Gontsov
Radiation dose in radiography and methods for dose reduction (IAEA-CN-85-142)........................... 67
B. Yue, K. Wei, Q. Zhou, Y. Cheng, C. Hou, L. Ge, X .Qi
* For technical reasons, paper IAEA-CN-85-301 could not be included with the papers of this session, but can be
found on page 909.
Estimation of patient radiation doses during radiologic examinations in the Republic of Haiti
(IAEA-CN-85-151) .......................................................................................................................... 71
G. Massillon J., C. Borrás
Medical radiation exposure and usage for diagnostic radiology in Malaysia (IAEA-CN-85-209) ...... 75
Kwan-Hoong Ng, Premavathy Rassiah, Hwee-Beng Wang, Ahmad Shariff Hambali,
Pirunthavany Muthuvelu, B.J.J. Abdullah, S. Sivalingam
Patient dose surveys for radiological examinations in Dutch hospitals between 1993 and 2000
(IAEA-CN-85-217) .......................................................................................................................... 79
F.M. Spoelstra, J. Geleijns, J.J. Broerse, W.M. Teeuwisse, D. Zweers
Patient doses and examination frequency for diagnostic radiology in Iceland 1993–1998
(IAEA-CN-85-263) .......................................................................................................................... 84
G. Einarsson, S.M. Magnusson
Can patient positioning using an ultrashort fluoroscopic pulse be justified? (IAEA-CN-85-91)......... 89
T. Deprez, L. Schrijvers, H. Pauwels, H. Bosmans, G. Marchal
Development of an international code of practice for dosimetry in x-ray diagnostic radiology
(IAEA-CN-85-269) .......................................................................................................................... 93
F. Pernicka, G.A. Carlsson, D.R. Dance, L.A. DeWerd, H.M. Kramer, K.-H. Ng
Quality control and patient doses for x-ray examinations in some hospitals in Thailand
(IAEA-CN-85-288) .......................................................................................................................... 99
P. Plainoi, W. Diswath, N. Manatrakul
Quality control of diagnostic x-ray units (IAEA-CN-85-205) ............................................................ 104
O.T. Marinkovic, S. Milacic, D. Jovicic, I. Tanaskovic
Digital technology influence on patient dose in radiological examination of the upper
digestive apparatus (IAEA-CN-85-107)......................................................................................... 106
E. Núñez, X. Pifarré, J. Ruiz, C. Escalada, M.C. Paredes
Radiation protection and quality assurance in dental radiology: I. Intraoral radiography
(IAEA-CN-85-257) ........................................................................................................................ 110
Y. Martinez-Beneyto, M. Alcaraz, S. Jódar-Pórlan, A.M. Saura-Iniesta,
E. Velasco-Hidalgo
Radiation protection and quality assurance in dental radiology: II. Panoramic radiology
(IAEA-CN-85-258) ........................................................................................................................ 114
S. Jódar-Pórlan, M. Alcaraz, Y. Martinez-Beneyto, A.M. Saura-Iniesta,
E. Velasco-Hidalgo
RADIOLOGICAL PROTECTION OF PATIENTS IN GENERAL DIAGNOSTIC
RADIOLOGY (FLUOROSCOPY) (Topical Session 1b)
Fluoroscopy without image intensifier (IAEA-CN-85-152) ............................................................... 121
L.V. Canevaro, G. Drexler
Evaluation of the dosimetric performance characteristic of fluoroscopy system used in
medicine (IAEA-CN-85-157)......................................................................................................... 126
Qi Xuesong, Wei Kedao, Cheng Yuxi, Zhou Qifu, Ge Lijuan, Hou Changsong
Patient dose measurements in fluoroscopic examinations, aiming to the establishment of
reference levels in Brazil (IAEA-CN-85-93) ................................................................................. 130
L.V. Canevaro, G. Drexler
Patient and staff dose during hysterosalpingography (IAEA-CN-85-73) ........................................... 135
N. Buls, M. Osteaux
Patient dosimetry in histerosalpingography (IAEA-CN-85-94).......................................................... 139
H.J. Khoury, A. Maia, M. Oliveira, R. Kramer, G. Drexler
Dosimetric assessment of swallowing examinations with videofluoroscopy (IAEA-CN-85-67)....... 143
M.M.B. Costa, L.V. Canevaro, A.C.P. Azevedo

RADIOLOGICAL PROTECTION ISSUES IN SPECIFIC USES OF DIAGNOSTIC
RADIOLOGY, SUCH AS MAMMOGRAPHY AND COMPUTED TOMOGRAPHY
(WITH SPECIAL CONSIDERATION OF THE IMPACT OF DIGITAL TECHNIQUES)
(Topical Session 2)
Evaluation of diagnostic radiology services in five Latin American countries:
Results for mammography (IAEA-CN-85-103)............................................................................. 151
M.E. Brandan, C.E.M. Caspani, R. de la Mora, A.A. Miranda, M.-C. Plazas, C. Borrás
Study about diagnostic quality in a public-center of mammography of Santa Fe – Argentina
(IAEA-CN-85-144) ........................................................................................................................ 154
R. Lescano, J. Kiguen, L. Gaitán, C. Caspani
Benefit and risk in breast screening (IAEA-CN-85-166).................................................................... 159
J. Law, K. Faulkner, F. Neilson
Quality assurance programme in mammography of the Sociedad Española de Diagnósticos
por Imagen de la Mama (SEDIM) (IAEA-CN-85-235) ................................................................. 164
B. Fernández, C. González, I. Hernando, M. Iríbar, J. A. López, R Salvador,
A. Vega, I. Vizcaíno
Image quality and patient dose optimization in mammography in Hungary (IAEA-CN-85-108) ...... 169
S. Pellet, A. Motoc, F. Giczi, E. Vano, C. Maccia, M. Gödény, B. Kovács, G. Forray
A review of the role of radiation metrology in the safety of diagnostic radiology patients
(IAEA-CN-85-305) ........................................................................................................................ 174
J.G.P. Peixoto, C.E. de Almeida
Image quality and dose in mammographic images obtained in Mexico City hospitals
(IAEA-CN-85-210) ........................................................................................................................ 179
C. Ruiz-Trejo, M.-E. Brandan, M. Verdejo, A. Flores, M. Guevara, J. Martín,
L. Madero-Preciado
A comparison of two different processing chemicals for mammography: Repercussion on
dose to patients (IAEA-CN-85-171) ............................................................................................. 183
F. Sendra-Portero, E. Ristori-Bogajo, P. Buch-Tomé, M. Martínez-Morillo, E. Nava-Baro
Study of radiological risk in breast cancer screening programme at Comunidad Valenciana
(IAEA-CN-85-234) ........................................................................................................................ 188
J.I. Villaescosa, A. León, G. Verdú, M.D. Cuevas, M.D. Salas
Mammography quality assurance in Morocco (IAEA-CN-85-128).................................................... 193
F. Zaoui, K. Talsmat, K. Lalaoui
Organ doses in CT of thorax: Sequential slices versus helical slices (IAEA-CN-85-201)................. 198
C. Bodineau Gil, J. Macías Jaén, I. Tort Ausina, R. Ruiz-Cruces, P. Galán Montenegro,
A. Díez de los Ríos
How will the introduction of multi-slice CT affect patient doses? (IAEA-CN-85-63)....................... 202
W. Huda, P.J. Mergo
Dual-slice spiral scanner: doses delivered during thoracic and abdominal examinations
(IAEA-CN-85-174) ....................................................................................................................... 206
G. Marinello, M.C. Besse, N. Vasile, M.C. Anglade
Patient doses for computed tomography in Hungary (IAEA-CN-85-39)............................................ 210
S. Pellet, L. Ballay, A. Motoc, D. Heissler, A. Temesi, F. Giczi
Radiation dose and quality control in fluoroscopy and computed tomography scanning
(IAEA-CN-85-141) ........................................................................................................................ 214
K. Wei, B. Yue, Q. Zhou, Y. Cheng, C. Hou, L. Ge, X. Qi
Patient doses from computed tomography in northeast region of Ukraine (IAEA-CN-85-116) ........ 219
N. Pylypenko, V. Kornyeyeva, H. Gur
Use of the EC quality criteria as a common method of inspecting CT laboratories —
A pilot project by the Nordic radiation protection authorities (IAEA-CN-85-175) ...................... 223
C.G. Torp, H.M. Olerud, G. Einarsson, P. Grøn, W. Leitz, A. Servomaa

Establishment of computed tomography reference dose levels in Onassis Cardiac
Surgery Center (IAEA-CN-85-203) ............................................................................................... 228
V. Tsapaki, E. Kyrozi, T. Syrigou, I. Mastorakou, S. Kottou
Radiation protection of patients during CT fluoroscopy (IAEA-CN-85-10) ...................................... 233
J.E. Aldrich, B.B. Forster
RADIOLOGICAL PROTECTION IN INTERVENTIONAL RADIOLOGY, INCLUDING
FLUOROSCOPY NOT CARRIED OUT BY RADIOLOGISTS (Topical Session 3)
Patient dose in interventional radiology (IAEA-CN-85-85-190) ........................................................ 239
M. Fernández Bordes, R. Berenguer, P. Gómez, M.J. Béjar, S. González
Patient doses in interventional cardiology (IAEA-CN-85-200) ......................................................... 244
F. Carrera, C. Ojeda, A. Sánchez,
I. Tort,
R. Ruiz-Cruces,
J. Francisco Díaz
Radiation risk evaluation and reference doses in interventional radiology (IAEA-CN-85-76) ......... 250
K. Faulkner, E. Vano, R. Padovani, J. Zoetelief
An assessment of methods for monitoring entrance surface dose in fluoroscopically guided
interventional procedures (IAEA-CN-85-61) ................................................................................ 254
J.C. Waite, M. Fitzgerald
Radiation dose during angiographic procedures (IAEA-CN-85-85-69) ............................................ 259
Ch. Lavoie, P. Rasuli
Radiological protection in interventional cardiology in Chile (IAEA-CN-85-80) ............................ 263
A. Ramírez, E. Vañó, F.A. Leyton, C. Oyarzún, J. Gamarra, E. Farias, A.M. Silva, P. Ortiz
Absorbed doses to patients from angioradiology (IAEA-CN-85-111) .............................................. 267
R. Rodríguez-Romero, F. Díaz-Romero, J. Hernández-Armas
Investigation of radiation skin dose in interventional cardiology (IAEA-CN-85-71) ........................ 272
C.M. Webster, D. Hayes, J. Horrocks
Patient doses in digital cardiac imaging (IAEA-CN-85-64) ............................................................... 277
W. Huda, K. Phadke, K. M. Ogden, M.L. Roskopf
Radiation doses to patients in haemodynamic procedures (IAEA-CN-85-110) ................................. 281
B. Cañadillas-Perdomo, C. Pérez-Martín, A.
Catalán-Acosta, D.
de Armas-Trujillo,
J. Hernández-Armas
Comparison between thermoluminiscence dosimetry and transmission ionization
chamber measurements (IAEA-CN-85-177).................................................................................. 286
I. Hernando, R. Torres
Radiofrequency catheter ablation: relationship between fluoroscopic time and skin doses
according to diagnoses. Basis to establish a quality assurance programme
(IAEA-CN-85-168) ........................................................................................................................ 291
E. Cotelo, J. Pouso, W. Reyes
Estimation of skin dose in interventional neuro and cardiac procedures (IAEA-CN-85-62) ............. 297
P.J. Marsden, Y. Washington, J. Diskin
Patient radiation doses from neuroradiology procedures (IAEA-CN-85-112) ................................... 301
M.J. García-Román, E.
Prada-Martínez, J.
Abreu-Luis, J.
Hernández-Armas
Radiation doses in interventional neuroradiology (IAEA-CN-85-68) ................................................ 306
C. Theodorakou, P. Butler, J.A. Horrocks
Radiation injury of the skin following diagnostic and interventional fluoroscopic procedures
(IAEA-CN-85-38) .......................................................................................................................... 312
T.R. Koenig, L.K. Wagner, F.A. Mettler
Iodine visibility in coronary angiography using copper filtration (IAEA-CN-85-78) ........................ 317
A.T. Rogers, M.E. Holloway
The use of constancy checks to optimise patient dose in interventional radiology systems
(IAEA-CN-85-196) ........................................................................................................................ 320
E. Vaño, J.M. Fernandez, L. Lopez, J.I. Ten, L. Gonzalez, E. Guibelalde
Organ doses in interventional radiology procedures: Evaluation of software (IAEA-CN-85-226).... 325
I. Tort, R. Ruiz-Cruces, M. Pérez-Martínez, F. Carrera, C. Ojeda, A. Díez de los Ríos

Occupational hand doses in interventional radiology (IAEA-CN-85-253)......................................... 329
V. Spasic Jokic, B. Djurovic, S. Lukac
Doses to patients and staff from endovascular treatment of abdominal aortic aneurysms –
preliminary results (IAEA-CN-85-129) ......................................................................................... 332
E.G. Bjørklund, A. Widmark, T. Gjølberg, D. Bay, J.J. Jørgensen , L.E. Staxrud
Optimisation of patient and staff exposure in interventional cardiology (IAEA-CN-85-147) ........... 338
R. Padovani, M.R. Malisan, G. Bernardi, E. Vaño, V. Neofotistou
Occupational exposures from selected interventional radiological procedures (IAEA-CN-85-51) ... 343
J. Janeczek, A. Beal, D. James
A study on the annual equivalent doses received by cardiologists in a UK hospital
(IAEA-CN-85-72) .......................................................................................................................... 347
R.Y.L. Fong, E. Ryan, S. Alonso-Arrizabalaga
Staff dosimetry and risk assessment during digestive and angiographic examinations
(IAEA-CN-85-49) .......................................................................................................................... 352
J. Pages, M. Osteaux
RADIOLOGICAL PROTECTION OF PATIENTS IN NUCLEAR MEDICINE
(Topical Session 4)
Doses of ionising radiation received by patients diagnosed at the Nuclear Medicine
Department in Warsaw from 1985 to 1999 (IAEA-CN-85-86) ..................................................... 359
J.Chaœ, M. Marciniak, E. Dziuk, M.K. Janiak
Doses from nuclear medicine examinations: A 25-year follow-up study (IAEA-CN-85-114)........... 365
K.J.A. Kairemo, H. Korpela
General comments on radiological patient protection in nuclear medicine (IAEA-CN-85-183) ....... 369
M. Téllez de Cepeda, R. Plaza, E. Corredoira, L.M. Martín Curto
Patient dose assessment in different diagnostic procedures in nuclear medicine
(IAEA-CN-85-192) ........................................................................................................................ 374
E. de Sena, M.J. Béjar, R. Ruano, R. Berenguer, P. Tamayo
Radiation protection of thyroid cancer patients receiving I-131 therapy: Some considerations
(IAEA-CN-85-202) ........................................................................................................................ 379
S. Kottou, D. Papadimitriou, M. Molfetas, A. Samartzis, P. Mavrokephalos, A. Perris,
C.C. Alevizaki
Current trends on internal dosimetry for patient protection in nuclear medicine
(IAEA-CN-85-219) ........................................................................................................................ 383
A.M. Rojo, P.A. Gisone, J.J. Kunst
Internal radiation dosimetry, pharmacokinetics and biodistribution of the 99mTc labeled
IOR egf/r3 monoclonal antibody (IAEA-CN-85-254) ................................................................... 387
L.A. Torres, A. Perera, M. Ramos, A. Hernández, N. Iznaga, M.E. Solano, I. Alvarez,
J.L. Rodríguez
A protocol to determinate the situation of nuclear medicine in Venezuela, 1999–2000
(IAEA-CN-85-267) ........................................................................................................................ 392
L. Carrizales, G. Leandro
Parameter estimation and compartmental modelling for individualization of therapeutic
dosage of radiopharmaceuticals (IAEA-CN-85-164)..................................................................... 397
A. Giussani, C. Cantone
DEVELOPING AND USING DOSE GUIDANCE (REFERENCE) LEVELS IN
RADIOLOGY AND NUCLEAR MEDICINE EXAMINATIONS (Topical Session 5)
Practical implementation of the medical exposure directive (97/43) in Luxembourg with
special reference to diagnostic reference levels (IAEA-CN-85-53) .............................................. 403
A. Schreiner-Karoussou, C. Back, N. Harpes, F. Shannoun

A proposal to prove compliance of ESD with EU-guidelines (IAEA-CN-85-189) ............................ 407
M. Tschurlovits
Diagnostic radiography dose and guidance levels (IAEA-CN-85-176).............................................. 411
M. Cuadros, A. Augusto
Results of the study of entrance surface dose from conventional examinations in
diagnostic radiology (IAEA-CN-85-281)....................................................................................... 414
A. Martínez, L. Jova, R. de la Mora, C. Guevara, I. Fleitas, J. Carrazana, E. Díaz
A trial to establish diagnostic reference levels for radiological examinations in Greece
(IAEA-CN-85-95) .......................................................................................................................... 419
E. Papageorgiou, P. Dimitriou, E. Vardalaki, C.J. Hourdakis, L. Vlahos
Patient exposures from diagnostic radiological procedures in India (IAEA-CN-85-21) .................... 424
J.B. Sasane, S.G. Sawant, V.K. Shirva, P.K. Dash Sharma, K. Chhokra, V. Jayalakshmi,
K.N. Govindarajan, R.N. Kulkarni, K.S. Parthasarathy , A.S. Pradhan, B.C. Bhatt
Need for harmonisation in the establishment and use of reference dose levels in radiology
(IAEA-CN-85-15) .......................................................................................................................... 429
J. Zoetelief
Patient dose surveys and the use of local and national diagnostic reference levels
(IAEA-CN-85-248) ........................................................................................................................ 434
M.L. Ramsdale, D. Peet, P. Hollaway, A. Rust
An approach to local diagnostic reference levels (DRL’s) in the context of national and international DRL’s (IAEA-CN-85-77) ......................................................................................................... 440
A.T. Rogers
Dimond: A European approach to establish and use reference levels in fluoroscopy guided
Procedures (IAEA-CN-85-194) ................................................................................................................... 444
E. Vano, K. Faulkner, R. Padovani, J. Zoetelief, M. Toivonen, V. Neofotistou
Reference dosimetry for CT in the UK (IAEA-CN-85-57)................................................................. 449
P.C. Shrimpton, B.F. Wall
The establishment and use of dose reference levels in general paediatric radiology
(IAEA-CN-85-59) .......................................................................................................................... 453
P.J. Marsden, J. Hardwick, C. Mencik, C. McLaren, C. Young, P. Mashford
Introduction of guidance dose levels in paediatrics CT (IAEA-CN-85-139)...................................... 458
F.R. Verdun, M. Bernasconi, P. Schnyder, J.F. Valley, F. Gudinchet
Implementation of diagnostic reference levels for X-ray examinations in the UK
(IAEA-CN-85-55) .......................................................................................................................... 462
B.F. Wall
Diagnostic reference activities for nuclear medicine in Australia and New Zealand
(IAEA-CN-85-259) ........................................................................................................................ 466
J.E. Towson, R.C. Smart
Nuclear medicine and its radiological protection in China (IAEA-CN-85-28) .................................. 472
J. Wu
Preliminary results of the analysis of the administered activities in diagnostic studies of
nuclear medicine (IAEA-CN-85-280)............................................................................................ 475
G. López Bejerano, L.J. Sed
Administered activity and estimated radiation doses from nuclear medicine diagnostic
procedures to the Israeli population (IAEA-CN-85-65)................................................................. 479
J. Weininger, A.B. Shlomo, J.K.Y. Shamai, T. Schlesinger
Development of diagnostic reference levels in paediatric radiology (IAEA-CN-85-56).................... 483
D. Hart, B.F. Wall
RADIOLOGICAL PROTECTION OF THE EMBRYO AND FOETUS IN
PREGNANT PATIENTS (Topical Session 6)
Ten years investigation on radiological exposures to the embryo and fetus in pregnant women
of Iran (IAEA-CN-85-66).................................................................................................................... 491
A. Arbabi

Diagnostic radiation of potentially reproductive females (IAEA-CN-85-01)..................................... 495
M.E. Abd El-Bagi, M.S. Al-Mutairi, M.A. Al-Thagafi, N.M. Al-Masri, O. Al-Sasi
Programme for reducing the risk factors due to prenatal exposure (IAEA-CN-85-182) ................... 499
L. Arranz, N. Ferrer, J.M. Sastre
Unjustified prenatal radiation exposure in medical applications (IAEA-CN-85-121) ....................... 503
J. Cárdenas Herrera, G. López Bejerano, A.I. Lamadrid, O. García Lima,
E. Díaz Bernal, V. Freixas, R. Sánchez
Radiation during pregnancy (IAEA-CN-85-75).................................................................................. 507
K. Faulkner, J.F. Malone, R.H. Corbett, P. Craven, E.K. Osei
Experimental determination of fetal doses received during conventional X rays explorations of
Troncus. Influence of the lead apron (IAEA-CN-85-236) ............................................................. 512
X. Pifarré, L. Brualla, J. Ruiz, C. Escalada, D. Planes, M.C. Paredes
The software program Peridose to calculate the fetal dose or dose to other critical structures
outside the target area in radiation therapy (IAEA-CN-85-009).................................................... 516
P.H. van der Giessen
Dose to the uterus from radiotherapy procedures for breast carcinoma (IAEA-CN-85-232)............. 522
C. Martín Rincón, I. Jerez Sainz, I. Modolell Farré, M.L. España López, P. López Franco
Patient and fetal dose in diagnostic x-rays and radiotherapy in Bangkok, Thailand
(IAEA-CN-85-026) ........................................................................................................................ 527
J. Pataramontree, S. Wangsuphachar, J. Apaiphonlacharn, P. Chaichan, S. Sompradit,
K. Suteerakul, W. Thamwerawong
RADIOLOGICAL PROTECTION OF PAEDIATRIC PATIENTS (Topical Session 7)
The development of standard operating protocols for paediatric radiology (IAEA-CN-85-58)......... 535
P.J. Marsden, C. Mencik, C. McLaren, C. Young, S. Scadden, P. Mashford,
K. McHugh, M. Beckett, M Calvert, J. Hardwick
Radiation doses to neonates and issues of radiation protection in a special care baby unit
(IAEA-CN-85-52) .......................................................................................................................... 539
C.I. Armpilia, I.A.J. Fife, P.L. Croasdale
Evaluation of the radiation dose in a paediatric x-ray department (IAEA-CN-85-41) ....................... 544
P.A. Kaplanis
, S. Christofides, G. Christodoulides, K. Aristidou
Radiation exposure of children during radiodiagnostic examinations of chest in Slovakia
(IAEA-CN-85-207) ........................................................................................................................ 548
M. Horváthová, D. Nikodemová
Radiation detriment ascribable to infants and children undergoing micturating
cystourethrograms — A review of studies in Spain, Britain, New Zealand and
Venezuela (IAEA-CN-85-172) ...................................................................................................... 552
D.L. Evans, M.C. Canete
RADIOLOGICAL PROTECTION OF PATIENTS IN RADIOTHERAPY:
EXTERNAL BEAM (Topical Session 8a)
Radiological protection of the radiotherapy patient? (IAEA-CN-85-153) ......................................... 561
M.P.R. Waligórski, J. Lesiak
High dose and low dose radiation exposure in the induction of breast cancer
(IAEA-CN-85-17) .......................................................................................................................... 564
E. Fernandez-Vicioso, R. Ruiz-Cruces, J.M. Pastor Vega
A computer tool for daily application of the linear quadratic model (IAEA-CN-85-181) ................. 570
J. Macías Jaén, P. Galán Montenegro, C. Bodineau Gil, A. Wals Zurita, A. M. Serradilla Gil
Tolerance of the different structures of the eye to therapeutic ionizing radiation
(IAEA-CN-85-197) ........................................................................................................................ 574
E. Fernandez-Vicioso, R. Ruiz-Cruces, K. Faulkner
Influence of dose per fraction on 7 days per week fractionation in radiotherapy
(IAEA-CN-85-18) .......................................................................................................................... 581
M. Vilches, D. Guirado
Palliative radiation therapy for overloading radiotherapy centre, especially for developing
country (IAEA-CN-85-46) ............................................................................................................. 586
M. Myo, Susworo, T. San
Dose distribution over the radiation field and organs of the body during radiotherapy
procedures (IAEA-CN-85-36)........................................................................................................ 589
S. Roy, A.S.M. Ambia, S. Akhter, H. Banu, M. Begum
Peripheral dose in photon beams from a linear accelerator with a multileaf collimator
(IAEA-CN-85-97) .......................................................................................................................... 592
R. Lope Lope, F.Lozano Flores, J. Gracia Sorrosal, J.A. Font Gómez, A. Hernández Vitoria
Patient dose from photoneutrons in a 18 MV linac (IAEA-CN-85-251) ............................................ 596
R. Barquero, R. Méndez, M.P. Iñiguez
Shielding for radiation scattered dose distribution to the outside fields in patients treated with
high energy radiotherapy beams (IAEA-CN-85-70) ...................................................................... 601
Sung Sil Chu
Neutron dose to patients treated with high-energy medical accelerators (IAEA-CN-85-8) ............... 605
P.H. McGinley
Radiological protection considerations during the treatment of glioblastoma patients by
boron neutron capture therapy at the high flux reactor in Petten, the Netherlands
(IAEA-CN-85-298) ........................................................................................................................ 609
R.L. Moss, J.Rassow, E. Finke, F. Stecher-Rasmussen, W. Sauerwein
Quality control in radiotherapy treatment: Radiation induced myelopathy (IAEA-CN-85-255) ....... 614
E. Fernández-Vicioso, R. Ruiz-Cruces
Quality assurance in radiotherapy (IAEA-CN-85-223) ...................................................................... 618
S. Groth, A. Meghzifene, H. Tatsuzaki, V. Levin, J. Izewska
The estro-equal results for photon and electron beams checks in European radiotherapy beams
(IAEA-CN-85-48) .......................................................................................................................... 625
H. Ferreira, A. Dutreix, A. Bridier, D. Marre, J. Chavaudra, H. Svensson
Standard operating procedures for quality audits of 60Co external beam radiotherapy facilities
(IAEA-CN-85-120) ........................................................................................................................ 630
E.F. Larrinaga Cortina, L. Domínguez Hung, R. Campa Menéndez
Preliminary results of a national quality audit programme in radiotherapy services in Cuba
(IAEA-CN-85-247) ........................................................................................................................ 635
L. Domínguez Hung, E.F. Larrinaga Cortina, R. Campa Menéndez, J.L. Morales López,
A.F. García Yip
Error prevention in radiotherapy treatments using a record and verify system (IAEA-CN-85-170).. 640
S. Navarrete Campos, A. Hernández Vitoria, M. Canellas Anoz, E. Millán Cebrián,
A. García Romero
Manual cross check of computed dose times for motorised wedged fields (IAEA-CN-85-79).......... 644
J. Porte
Quality assurance of the treatments performed with a linear accelerator by means of in vivo
dosimetry (IAEA-CN-85-239) ....................................................................................................... 647
N. Jornet, M. Ribas, T. Eudaldo, P. Carrasco
IAEA Radiation Events Database (RADEV) (IAEA-CN-85-268) ..................................................... 652
J. Wheatley, P. Ortiz-Lopez
Methodology for the application of probabilistic safety assessment techniques (PSA) to the
cobalt-therapy units in Cuba (IAEA-CN-85-165).......................................................................... 656
J.J. Vilaragut Llanes, R. Ferro Fernández, M. Troncoso Fleitas, B. Lozano Lima,
A. De la Fuente Puch, Y. Pérez Reyes, C. Duménigo González
Normal tissue damage in radiotherapy development of a clinical audit tool (IAEA-CN-85-265) ..... 662
A. Barrett

RADIOLOGICAL PROTECTION OF PATIENTS IN RADIOTHERAPY:
BRACHYTHERAPY (Topical Session 8b)
Accurate assessment of the distortions produced by the transit dose in HDR brachytherapy
(IAEA-CN-85-06) .......................................................................................................................... 669
E.K. Nani, A.W.K. Kyere, K. Tetteh
Methodology for comprehensive patient, worker and public radiation protection
considerations while introducing new medical procedures (IAEA-CN-85-22)............................. 674
E. Neeman, M. Keren
Radiation safety program in a high dose rate brachytherapy facility (IAEA-CN-85-12) ................... 678
L. V. Rodriguez, R.C. Solis, T.M. Hermoso
Radiation protection of patients in epiescleral brachytherapy (IAEA-CN-85-180) ........................... 682
J.M. de Frutos, G. Sánchez, J.R. Sendón, A. del Castillo, I. Hernando
Estimation of the transit dose component in high dose rate brachytherapy
(IAEA-CN-85-173) ........................................................................................................................ 687
A. García Romero, E. Millán Cebrián, F.J. Lozano Flores, R. Lope Lope,
M. Canellas Anoz
Patient dosimetry in intravascular radiation therapy (IAEA-CN-85-85) ............................................ 691
S. Van de Putte, Y Taeymans, H. Thierens
Design and implementation of an intravascular brachytherapy installation in cardiology
(IAEA-CN-85-195) ........................................................................................................................ 696
C. Prieto, E. Vano, M. Sabate, J.M. Fernandez, Y.C. Galvan
Radiation risk to patient from intracoronary brachytherapy (IAEA-CN-85-127)............................... 701
A Hefner, C Kirisits, D. Georg, R Pötter
RADIOLOGICAL PROTECTION OF PATIENTS IN BIOMEDICAL RESEARCH
(Topical Session 9)
No contributed papers have been received for this session
INFLUENCE OF STANDARDIZATION IN THE DESIGN AND
DEVELOPMENT OF MEDICAL RADIOLOGICAL EQUIPMENT ON THE
RADIOLOGICAL PROTECTION OF PATIENTS (Topical Session 10)
Initial evaluation of a full breast digital system (IAEA-CN-85-233).................................................. 709
E. Vañó, M. Chevalier, P. Morán, J.M. Fernández, T. Cepeda, A. Fabra,
C.S. Alvarez Pedrosa
Experimental determination of blurring in x-ray fluoroscopy last image hold due to patient
movement and its repercussion to patient doses (IAEA-CN-85-167)............................................ 714
E. Guibelalde, E.Vañó, J.M. Fernández, L. González, J. Alberdi, A. Molinero
The Danube hospital project for automated transcription of X ray dose data from radiography,
fluoroscopy and computed tomography (CT) into the electronic patient record
(IAEA-CN-85-246) ........................................................................................................................ 719
G. Pärtan, R. Mayrhofer, H. Mosser, A. Maltsidis, Th. Dechant, W. Honsal, W. Hruby
Dimond II: Measures for optimising radiological information content and dose in digital
imaging (IAEA-CN-85-261) .......................................................................................................... 722
A. Dowling, J. Malone, D. Marsh
Implementation of “early alert system” area detector at patient from entrance in
afterloading brachytherapy (IAEA-CN-85-237) ............................................................................ 726
R. Videla Valdebenito

EDUCATION, TRAINING AND CONTINUOUS PROFESSIONAL DEVELOPMENT
IN THE RADIOLOGICAL PROTECTION OF PATIENTS (Topical Session 11)
The new system of education and training of medical staff in radiation protection in Albania
(IAEA-CN-85-92) .......................................................................................................................... 735
B. Grillo, K. Preza, V. Titka, G. Shehi
Education and training of the radiation protection in the Spanish schools of medicine
(IAEA-CN-85-198) ........................................................................................................................ 739
R. Ruiz-Cruces, M.T. Delgado Macias, J.H. Armas, E. Vañó Carruana,
A. Diez de los Ríos, M. Martínez Morillo
The changing role of the radiographer under IR(ME)R 2000 (IAEA-CN-85-50) .............................. 743
S. Barlow
The education and training of professionals. The perspective of the Spanish Society of
Medical Physics (SEFM)(IAEA-CN-85-214)................................................................................ 746
T. Eudaldo, E. Millán, M.C. Paredes, E. Vañó, F. Peinado, C. Nuñez de Villavicencio,
J.C. Mateos, J.J. Peña
Medical Radiation Physics Training Emerald (IAEA-CN-85-146) .................................................... 750
S. Tabakov, C. Roberts, I.L. Lamm, F. Milano, C. Lewis, D. Smith, A. Litchev, B.A. Jonsson,
M. Ljungberg, S.E. Strand, L. Jonsson, L. Riccardi, A. Benini, G. da Silva, N. Teixeira,
A. Pascoal, A. Noel, P. Smith, L. Musilek, N. Sheahan
Education, training and continuing professional development for the medical physicist —
The EFOMP view in relation to EC Council directives (IAEA-CN-85-178) ................................ 755
I.L. Lamm
An interactive Web-based radiation protection course in fluoroscopy (IAEA-CN-85-11) ................ 760
J. Aldrich
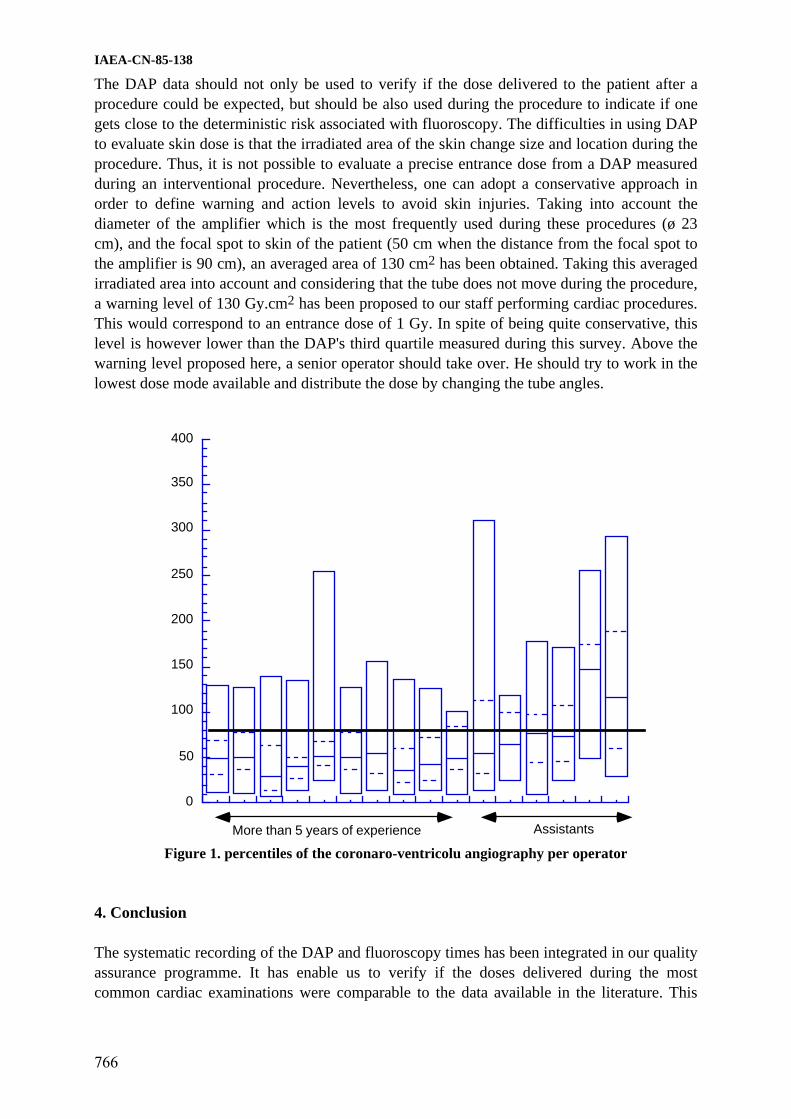
Patient dose optimisation in cardiology during fluoroscopy examinations (IAEA-CN-85-138)........ 764
F.R. Verdun, S. Wicky, M. Narbel, P. Schnyder, J.F. Valley
CD-ROM training course in quality assurance in diagnostic imaging (IAEA-CN-85-156) ............... 768
H.J. Khoury, P. Machado, G. Drexler
The reduction in DAP values possible with operator education and additional filtration in a
cardiac catheterisation laboratory (IAEA-CN-85-98).................................................................... 771
H.M. Warren-Forward, L. Duggan
Education for radiological protection in radiotherapy. ESTRO recommendations for
EU Euratom guidelines (IAEA-CN-85-266).................................................................................. 776
A. McKenzie, A. Barrett
How changes in a radiologist’s technique can reduce patient dose in barium enema studies
(IAEA-CN-85-34) .......................................................................................................................... 780
R.H. Corbett
Using the BERT concept to promote public understanding of radiation (IAEA-CN-85-2)................ 784
Kwan-Hoong Ng, J.R. Cameron
Communicating risks and benefits of medical exposures to patients (IAEA-CN-85-54) ................... 788
B.F. Wall
TOPICS FOR RESEARCH AND DEVELOPMENT IN THE RADIOLOGICAL
PROTECTION OF PATIENTS (Topical Session 12)
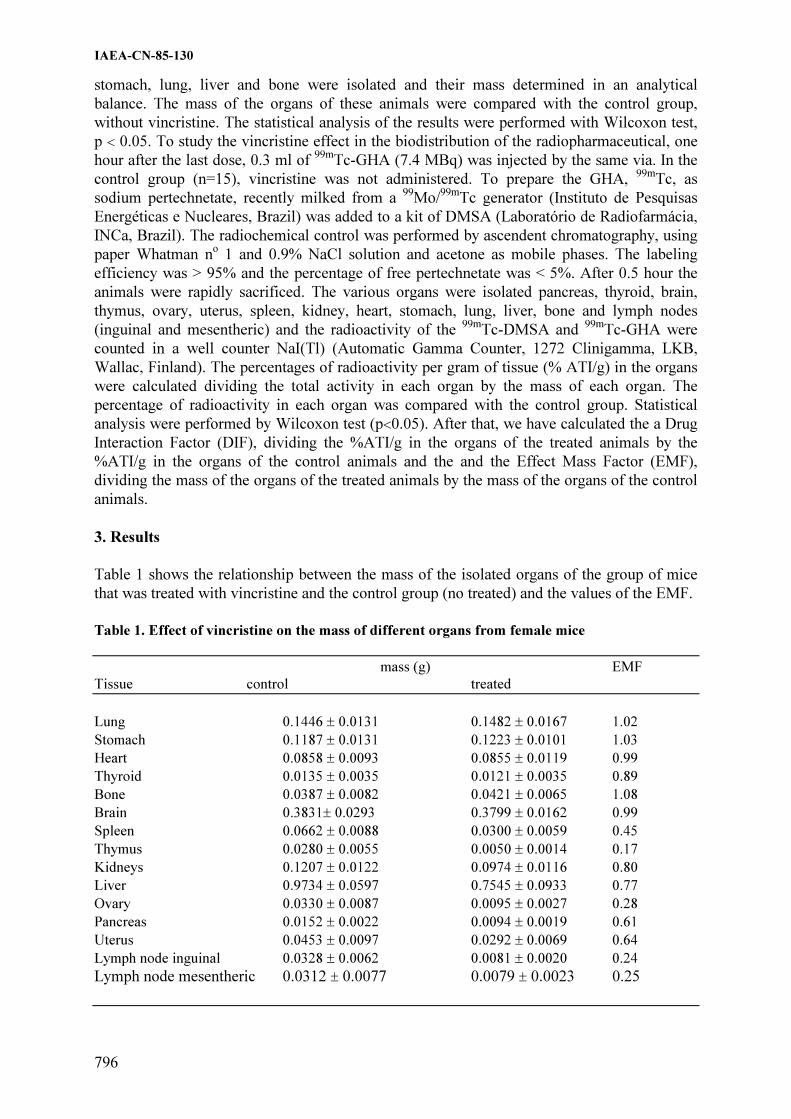
Drug interaction with radiopharmaceuticals and the importance for the radiation dose
to the patient (IAEA-CN-85-130) .................................................................................................. 795
D.M.M. Mattos, M.L. Gomes, R.S. Freitas, V.N. Cardoso, M. Bernardo-Filho
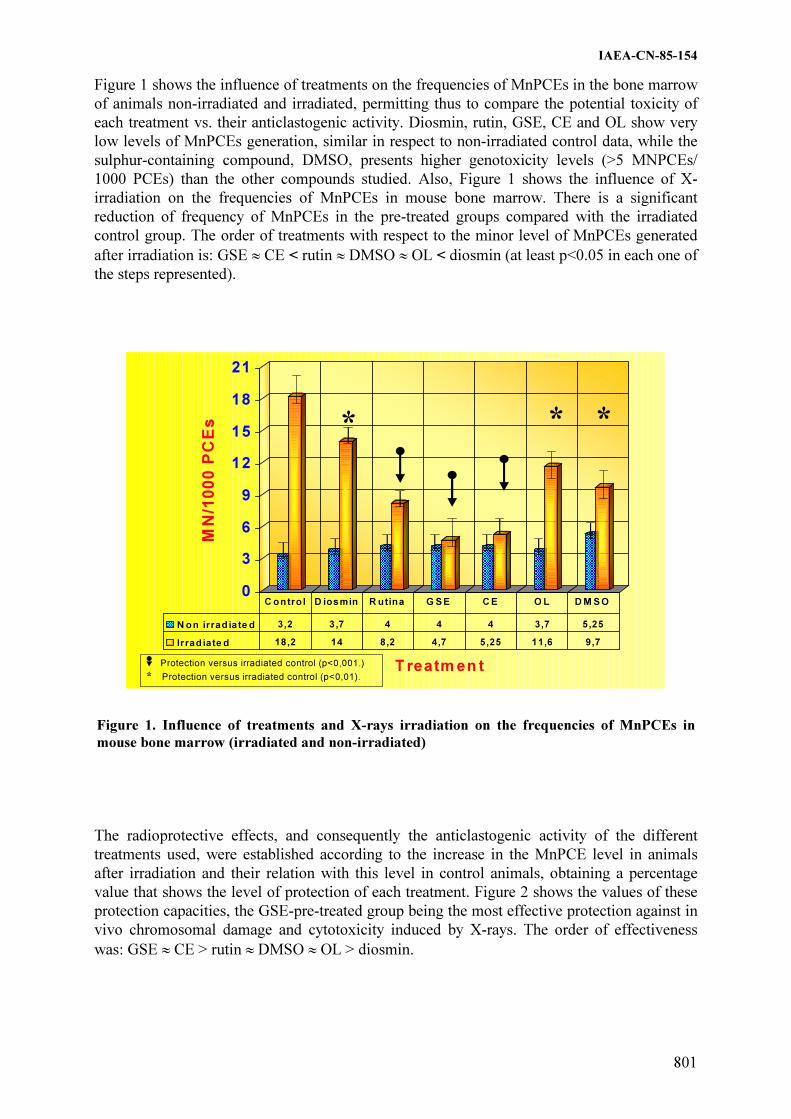
Protective effects of several plant polyphenols against chromosomal damage induced in vivo
by X-rays. Comparative study versus diosmin and rutin (IAEA-CN-85-154)............................... 799
M. Alcaraz, B. Rosa, J. Castillo, O. Benavente-García, J. Lorente, V. Vicente, M. Canteras
Cytokinesis block micronucleus in human lymphocytes: Effect of low dose radiation in
vascular radiology (IAEA-CN-85-256).......................................................................................... 803
M. Alcaraz, B. Rosa, J.L. Navarro,
M.J. Dato, C. Acevedo, M. Canteras

IMPLEMENTATION OF REGULATIONS ON THE RADIOLOGICAL PROTECTION
OF PATIENTS (Topical Session 13)
Radiation protection in hospitals of Ecuatorial Guinea (IAEA-CN-85-25)........................................ 809
P. Rabat Macambo
Strategic management of radiation protection programme in the Ministry of Health Malaysia —
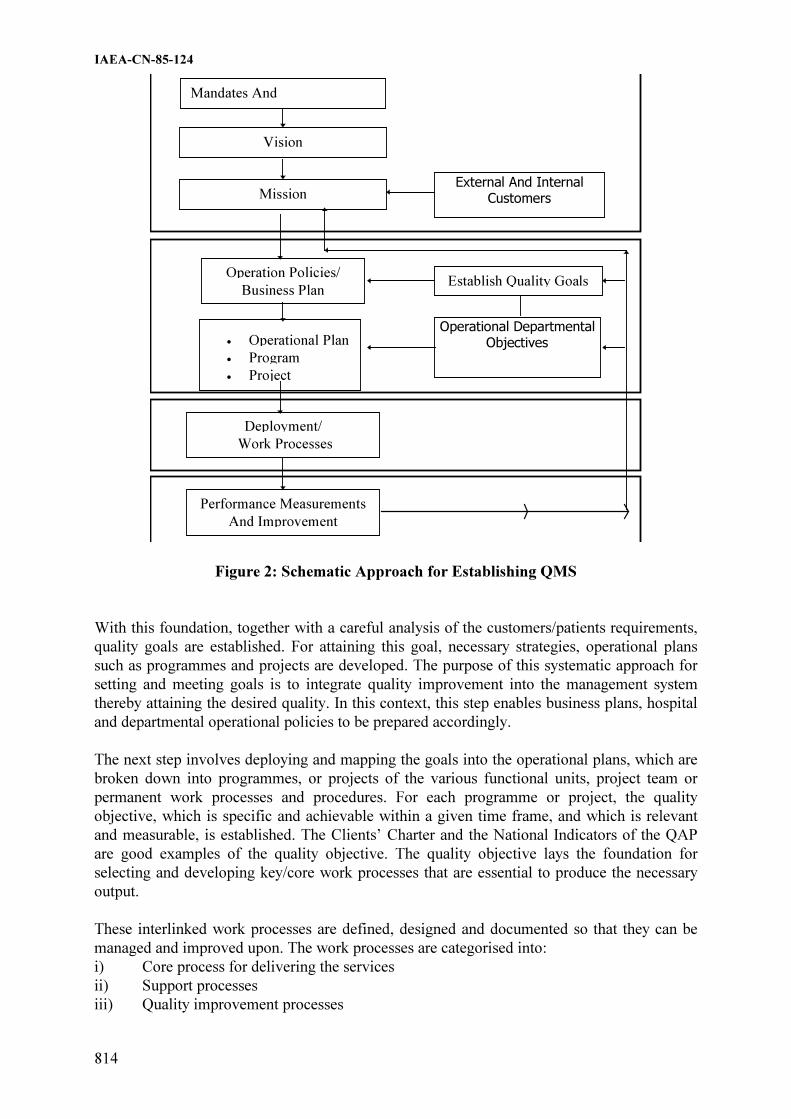
An approach based on MS ISO 9000 quality management system (IAEA-CN-85-124) ............... 812
H.B. Wang
New perspective for radiation protection in diagnostic procedure in Paraguay
(IAEA-CN-85-90) ............................................................................................................................... 817
R.A. Sosky, M. Gamarra
Radiation protection infrastructure in the Republic of Croatia (IAEA-CN-85-44) ............................ 821
S. Grgic
Medical management of radiation safety and radiological protection of patients in Armenia
(IAEA-CN-85-40) .......................................................................................................................... 826
N.M. Hovhannisyan
Contribution of the ARCAL XX/IAEA project to improvement of radiation safety in medical
practices (IAEA-CN-85-148) ......................................................................................................... 828
E. Medina Gironzini
Implementation of ICRP-60, BBS-115 and the patient directives in radiation safety regulations
of Taek (IAEA-CN-85-83) ............................................................................................................. 833
H.B. Okyar, M. Vural
Protection of patients in the first radiotherapy standard in Peru (IAEA-CN-85-250) ........................ 838
R. Ramírez Quijada
The justification of a medical exposure — Who does it? (IAEA-CN-85-60) .................................... 842
P.J. Marsden, J. Hardwick, K. McHugh
The patient's radiological protection in medical practices: Legal support in the
Cuban legislation (IAEA-CN-85-306) ........................................................................................... 847
I.A. González, M. Durán Delgado
Radiation protection of patients in diagnostic radiology in Estonia (IAEA-CN-85-74).................... 851
I. Filippova
Radiological procedures: Quality criteria and dose optimisation: French status
(IAEA-CN-85-211) ........................................................................................................................ 855
Ph. Grenier, M. Bourguignon, E. Marshall-Depommier, H. Beauvais-March,
M. Valero, J.F. Lacronique, G. Frijal
Ethical and legal aspects of medical exposure to ionizing radiation in the Netherlands
in the year 2000 (IAEA-CN-85-218) ............................................................................................. 859
J. Rijlaarsdam
Consequences and problems which arose from the application of the Spanish laws about quality
criteria in radiodiagnostic, nuclear medicine and radiotherapy from the point of view of
radiophysicists (IAEA-CN-85-117) ............................................................................................... 864
A. Hernández Vitoria, B. Fernández González, J. Martí Climent, J. Pérez Calatayud
Evaluation of the radiological protection in several departments of nuclear medicine
(IAEA-CN-85-279) ........................................................................................................................ 868
G. López Bejerano, L. Jova Sed
Radiotherapy practice in an unregulated environment: Call for joint action (IAEA-CN-85-283) ..... 873
Sh. Elegba
Quality systems for radiotherapy: Impact by a central authority for improved accuracy, safety
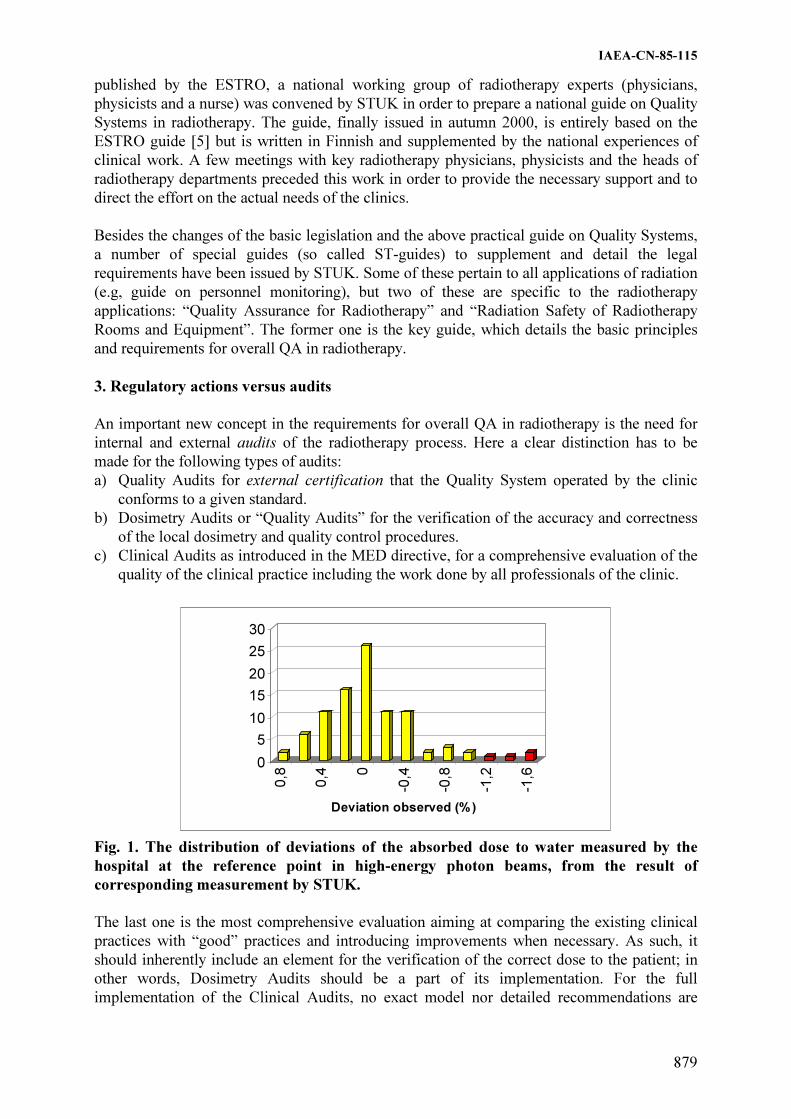
and accident prevention (IAEA-CN-85-115) ................................................................................. 878
H. Järvinen, P. Sipilä, R. Parkkinen, A. Kosunen, I. Jokelainen
Guidelines for the design of the working rules of the guarantee and quality control
in radiotherapy commission (IAEA-CN-85-272)........................................................................... 883
J. Pardo, M.A. Galmés, J. Font, J. Caro, J. Serra, F. Mata, S. Bertán, A. Biete,
J.A. Carceller, R. Escó, A. Palacios, C. Veiras, M.G. Vazquez

Radiological protection of patients in general diagnostic radiology (IAEA-CN-85-89) .................... 888
A.W. Karigi
Radiotherapy procedures quality control program: Guidelines established by the Spanish
Society of Radiotherapy and Oncology (IAEA-CN-85-273) ......................................................... 892
A. Palacios, J. Pardo, A. Valls, I. Petschen, A. Castell, A. Villar, B.A. Pedro Olivé,
V. Muñoz, J. Fernández, R. Rodríguez, C. Otón
Final report from the Spanish Society of Radiotherapy and Oncology Infrastructures Commission
about department standards recommendable in radiation oncology (IAEA-CN-85-274).............. 897
R. Escó, J. Pardo, A. Palacios, A. Biete, J. Fernández, A. Valls,
L. Herrazquin, P. Román, R. Magallón
Health regulations about radiation oncology in Spain: The legislative dilemma between
radiation protection and treatment of cancer (IAEA-CN-85-275) ................................................. 902
R. Escó, A. Biete, J. Pardo, J.A. Carceller, C. Veiras, A. Palacios, M.G. Vazquez
Radiation protection problems in the practice of radiotherapy in Nigeria (IAEA-CN-85-284) ......... 905
K.K. Ketiku, O.T. Oladeji
Radiological protection in medicine: Current problems in Indonesia (IAEA-CN-85-45) ................. 908
E. Hiswara
Study on patient dose in diagnostic radiolgy in Japan: Investigation of entrance surface dose
of patient using direct measurement by TLD (IAEA-CN-85-301) ................................................ 913
S. Iwanami, T. Ishiguchi, T. Ishigaki, S. Koga

Topical Session 1a
RADIOLOGICAL PROTECTION OF PATIENTS IN
GENERAL DIAGNOSTIC RADIOLOGY
(RADIOGRAPHY)

.

IAEA-CN-85-82
3
SWISS NATION-WIDE SURVEY ON RADIATION DOSES IN DIAGNOSTIC RADIOLOGY
A. Aroua, J.F. Valley
Institut de Radiophysique Appliquée, Lausanne, Switzerland J.-P. Vader, B. Burnand Institut Universitaire de Médecine Sociale et Préventive, Lausanne, Switzerland Abstract
A nation-wide survey on radiation doses in diagnostic radiology was conducted in Switzerland in 1998-1999.
More than 250 types of examinations were considered, covering conventional and interventional radiology,
angiography, CT, mammography, osteodensitometry, conventional tomography and dental radiology. This survey
aimed at establishing the collective radiological impact of radiodiagnostics on the Swiss population. The
methodology of the survey is described. The examnination frequencies and integral dosimetric results associated
with diagnostic radiology in Switzerland are presented.
1. Introduction
At the international level there is a great interest for establishing the radiation doses due to
medical exposure. This is due to the fact that medical exposure is the highest source of
artificial irradiation. During the last two decades many national surveys of the frequencies and
doses associated with medical examinations have been reported in the litterature. A
comparative work regarding these surveys is published regularly by UNSCEAR (1).
Switzerland has a long tradition in surveying the medical exposure that started in the late 50s
(2-5); the present work being the continuation of the previous studies. The aim of this work is
to determine the collective radiological impact of radiodiagnostics on the Swiss population, to
gather enough data in order to issue recommendations aiming at patient dose reduction and to
set a comprehensive framework for future studies.
2. Material and methods
The methodology of the study is outlined in the diagram shown in figure 1. The frequential
and dosimetric aspects were handled separately.
Concerning the dosimetric issue no measurements were performed. Rather, a standard
technique was established for each type of examination (technical parameters, projections
considered, number of films or CT slices, duration of fluoroscopy, etc.). After the validation of
the technique, the dose indices (ESD, DAP) were modelled based on the conditions of the
examination. The organ and tissue equivalent doses were then established using appropriate
conversion factors. To this purpose, the programs ODS60 (6) and CTDOSE (7) were used for
radiography/fluoroscopy and CT examinations respectively.
The second part of the study consisted in surveying the frequency of examinations in all the
establishments who prescribe and perform radiological examinations in Switzerland:
hospitals, practitioners and other institutions (school, penitentiary and military medicine, etc.).
An information on the patient's age and gender and on the indication of the examination
(affection of the patient, aim of the examination, sevrity of the case) was collected, whenever
possible.

IAEA-CN-85-82
4
A convolution of the frequency and the dosimetric results was then performed, taking into
account for each examination the patient's age and gender profiles, the film-screen sensitivity
profiles and the corpulence profiles. For the age correction different models were used.
R a d i o l o g i c a l r i s k
m o d e l
O r g a n
d o s e s
I n d i v i d u a l
i m p a c t
D o s e i n d i c e s
V a l i d a t i o n
s u r v e y
F r e q u e n c y
s u r v e y
E x a m i n a t i o n ' s
p a r a m e t e r s
C o l l e c t i v e
i m p a c t
D o s i m e t r i c m o d e l
C o n v e r s i o n f a c t o r s
A n n u a l n u m b e r
i n S w i t z e r l a n d
M e a n n u m b e r o f
e x a m i n a t i o n s p e r
e s t a b l i s h m e n t
P r o j e c t i o n
m o d e l
A g e a n d g e n d e r
p r o f i l e s
Figure 1 Methodology of the study
3. Results
The survey revealed that the total annual number of examinations (all types together) in
Switzerland is about 9.5 millions (1.34 per inhabitant) and that the collective dose is 7100 Sv,
corresponding to a mean annual effective dose of 1.0 mSv per inhabitant.
Table 1 presents the distribution of the annual number of examinations and the collective dose
with the different categories of examinations. In terms of the number of examinations, the
radiography and dental radiology have the highest contributions to the total number (47% and
42% respectively). The other modalities represent together 11% of the total. In terms of dose,
radiography, tomodensitometry and conventional fluoroscopy have the highest contribution to
the collective dose (42%, 28% and 17% respectively). The other modalities represent 13% of
the collective dose.
Table 1. Annual number of examinations and collective dose in mSv (rounded values) per
category of examinations
Category Annual
number
Fraction
(%)
Collective
dose
Fraction
(%)
Radiography 4'500'000 47 3'000'000 42.2
Dental radiology 4'000'000 42 70'000 1.0
CT (tomodensitometry) 300'000 3.2 2'000'000 28.1
Mammography 200'000 2.1 40'000 0.6
Radiography and fluoroscopy : non-angio 150'000 1.6 1'200'000 16.9
Radiography and fluoroscopy : angiography 70'000 0.7 500'000 7.0
Radiography and fluoroscopy : interventional 30'000 0.3 250'000 3.5
Osteodensitometry 30'000 0.3 40 0.0
Conventional tomography 10'000 0.1 50'000 0.7
Total 9'500'000 100 7'100'000 100

IAEA-CN-85-82
5
Table 2 presents the distribution of the annual number of examinations and the collective dose
with the different categories of establishments. In terms of the annual number of
examinations, the dentists are on top position with 42% of the total, followed by the hospitals
with 31% and the general practitioners with 16%. The other categories contribute together for
11%. In terms of the collective dose, the hospitals alone contribute for about 73%. The general
practitioners contribute for almost 10% and the radiologists for almost 7%. The contribution
of the other categories all together is about 10%.
Table 2. Annual number of examinations and collective dose in mSv (rounded values) per
category of establishments
Category Annual
number
Fraction (%) Collective
dose
Fraction (%)
General and internal medicine 1'500'000 15.8 670'000 9.4
Radiology 250'000 2.6 480'000 6.7
Small hospitals (< 500 beds) 2'000'000 21.1 3'300'000 46.2
Large hospitals (> 500 beds) 950'000 10.0 1'900'000 26.6
Dental medicine 4'000'000 42.1 70'000 1.0
Chiropractic 60'000 0.6 140'000 2.0
Others 700'000 7.4 580'000 8.1
Total 9'500'000 100 7'100'000 100
The distribution of the collective dose with the age of the patient is given in figure 2. The
distribution peaks at age 65. If a correction for the age of the patient is performed according to
an appropriate risk model we obtain a reduced mean annual effective dose of about 0.6 mSv
per inhabitant.
0
2
4
6
8
10
< 1
1 - 4
5 - 9
10 - 1
4
15 - 1
9
20 - 2
4
25 - 2
9
30 - 3
4
35 - 3
9
40 - 4
4
45 - 4
9
50 - 5
4
55 - 5
9
60 - 6
4
65 - 6
9
70 - 7
4
75 - 7
9
80 - 8
4
85 - 8
9
90 - 9
4
> 9
5
Age Group
Fra
ctio
n o
f th
e D
ose
(%
)
Figure 2 Distribution of the collective dose with the age of the patient
4. Conclusion
The present survey allowed the establishment of an accurate picture regarding the exposure of
the Swiss population by diagnostic radiology. Both the frequencies and the doses associated
with the different types of examinations were investigated. The results of the study will be
used to elaborate recommendations in order to reduce the patient doses involved in diagnostic
radiology.

IAEA-CN-85-82
6
Acknowledgements
The authors are grateful to the Swiss Federal Office of Public Health who financed this survey
under contract Nr. 316.96.0576.
References
[1] United Nations, 2000 Report of the United Nations Scientific Committee on the Effects
of Atomic Radiation to the General Assembly, Volume I : Sources, New-York, USA (2000).
[2] Zuppinger, A., Minder, W., Sarasin, R. and Schär, M., Die Strahlenbelastung der schweizerischen Bevölkerung durch röntgendiagnostische Massnahmen, Radiol. clin. 30 (1961).
[3] Poretti, G., Ionesco, R. and Lanz, W., Erhebung über die Strahlenbelastung der Schweizer Bevölkerung infolge röntgendiagnostischer Untersuchungen, Hrsg., Schweiz. Vereinigung für Atomenergie (1971).
[4] Mini, R. and Poretti, G., Die Bestimmung der Strahlenbelastung einer Bevölkerungsgruppe gemäss ICRP26, Tagungsbericht der Schweizerischen Gesellschaft für Strahlenbiologie und Strahlenphysik SGSP (1984).
[5] Mini, R.L., Dosisbestimmungen in der medizinischen Röntgendiagnostik, Verlag Max Huber, ISBN 3 906401 14 6 (1992).
[6] Rannikko, S., Ermakov, I., Lampinen, J.S., Toivonen, M., Karila K.T.K. and Chervjakov, A., Computing Patient Doses of X-Ray Examinations Using a Patient Size- and Sex-adjustable Phantom, Br. J. Radiol. 70, 708–718 (1997).
[7] Baadegaard, N. and Jensen, L.C., Organ Doses in CT Calculated by Monte Carlo Technique Based on Measured CT-Beam Profiles, Proceedings of the World Congress on Medical Physics and Biomedical Engineering, Nice, France (1997).

IAEA-CN-85-149
7
EVALUATION OF PATIENT SKIN DOSE EQUIVALENT DUE TO
DIAGNOSTIC PROCEDURES WITH X-RAYS IN LAGOS STATE NIGERIA
M.A. Aweda
College of Medicine, Lagos University, Teaching Hospital, Lagos, Nigeria
Abstract
This paper reports the study of Patient Skin Dose Equivalents in Lagos State, Nigeria, as one of the strategies of
patient protection and x-ray procedure quality assessment. 13 most frequent x-ray diagnostic procedures were
studied. These were chest, skull, cervical spine, lumbosacral spine, sinusis, pelvis, plain abdomen, shoulder, foot,
hysterosalpingography, intravenous urography, barium meal and barium enema. 1977 procedures were monitored
for a period of 12 months in both private and public hospitals carefully selected from all over the state. The
results obtained compared favorably well with those from similar studies reported in the literature. The slight
differences observed have been ascribed to variations in the patient anatomy, exposure conditions and choice of
radiographic parameters.
1. Introduction
The main radiation protection problem in the diagnostic applications of x-rays is the
unnecessary irradiation of patients and staff. Exposures to ionizing radiation and the
associated health hazards necessitate the need for justification, optimization and respect of
norms as recommended by the relevant international organizations [1]. Patient exposures in
most cases are justified having taken account of alternative diagnostic methods using non-
ionizing radiation [2]. Optimization implies reduction of patient dose to minimum possible
while still obtaining all the necessary diagnostic information according to the ALARA
principle.
Evaluation of Patient Skin Dose Equivalent (PSDE) is an optimization process intended for
monitoring and assessment of performance within a department as part of dose reduction and
patient protection strategies. PSDE is useful in the assessment of the potential harms from a
particular procedure and for intercomparison of quality and standards between departments at
national and international levels. The various direct and indirect methods of patient dosimetry
exist in the literature [3,4,5]. PSDE monitoring is of particular importance in third world
countries where the larger percentage of the radiation facilities are old, many of them not
regularly serviced and the quality control and recalibration of the electric, mechanical and
dosimetric performance parameters are almost non existent as in the developed countries.
This paper reports the PSDE from 13 most frequent x-ray diagnostic procedures in Lagos
state, Nigeria. Lagos, being the economic and the industrial nerve center of the country, is the
most densely populated city in the West African subregion. The number of private hospitals in
the state is far greater than public and they are of varying sizes and standards. Some of the
public and private hospitals have been selected for this study. The results obtained were
compared with similar studies reported in the literature. The goal is to improve the quality of
radiodiagnostic procedures, the quality being defined in terms of qualitative image vis-à-vis
the dose to patient.
2. Materials and methods
PSDE were monitored for a period of 12 months in 10 different public and private hospitals
distributed all over Lagos state. The criteria for selection of hospital included good
representation of type of diagnostic procedures studied, the geographical location, how busy
the hospital is and the facilities available. The 13 procedures studied were chest, skull,

IAEA-CN-85-149
8
cervical spine, lumbosacral spine (LSS), sinusis, pelvis, plain abdomen, shoulder, foot,
hysterosalpingography (HSG), Intravenous Urography (IVU), Barium Meal (BM) and Barium
Enema (BE). 1977 procedures were monitored out of which 1485 were common and 492
were special procedures.
Thermoluminescence Dosemeter (TLD) LiF chips were placed one on each side and one at the
central axis of the rectangular x-ray beam on the patient skin. From reading the chips the
average PSDE for each exposure was determined. The TLD reader was Tolede 654 from
Vinten U.K. at the Federal Radiation Protection Service. The system had been pre-calibrated
at the dosimetry laboratory of IAEA in Seibersdorf, Austria. A patient radiological
examination conditions and radiological parameters.
3. Results and discussions
The number of exposures, the range of the PSDE and the mean values for the various
procedures monitored are summarized in table 1 below.( Table not provided). The ranges of
the PSDE from the literature are contained in the last column for comparison. The PSDE
recorded cover a wide range and vary with patients. This observation is expected because each
patient is unique in anatomy, age, weight, illness and exposure conditions. Patient dose
depends on type of procedure, beam size or the volume of tissue in the beam, patient
positioning as well as radiological parameters such as KV, mAs, type and speed of film, use
of intensifier and grid, age, type and the output of the x-ray facility. These technical and
patient anatomical difference have been identified to account for the wide PSDE ranges. Some
procedures such as LSS, HSG, IVU, BM and BE gave PSDE values which are multiples of the
means annual background dose limit. The range of the PSDE obtained compared with those
by Roger R.T. [6] and the means PSDE values by Shrimpton et al.[7] show a good agreement.
The slight differences could be attributed to the patient anatomical and exposure parameter
differences.
References
[1] INTERNATIONAL ATOMIC ENERGY AGENCY, Safety Standards. Safety Series
No. 115, 1996, IAEA, Vienna.
[2] WORLD HEALTH ORGANISATION, A Rational Approach to Radiodiagnostic
Investigations. Technical Report Series No. 689. 1983 WHO Geneva.
[3] NATIONAL RADIOLOGICAL PROTECTION BOARD, U.K. Doses to Patients from
Medical x-ray Examinations in the U.K. 1995 Review. NRPB - R289, 1996 London.
[4] NATIONAL RADIOLOGICAL PROTECTION BOARD/DOSIMETRY WORKING
PARTY OF THE INSTITUTE OF PHYSICAL SCIENCE IN MEDICINE,
NationalProtocol for patient Dose Measurement in Diagnostic Radiology. NRPB,
Didcot Oxon OxII ORG U.K. 1992 London.
[5] WALL B.F., HARRISON R.M., SPIERS F.W., Patient.
[6] Dosimentry Techniques in Diagnostic Radiological. Institute of Physical Science in
Medicine Report No. 53 IPSM 1988 New York.
[7] ROGER R.T, Radiation Dose to the skin in Diagnostic Radiography Brit. J. Radiol. Vol.
42 pg. 511-518, 1969.
[8] SHRIMPTON P.C., WALL B.F., FISHER E., HILLER M.C., KENDALL G.M AND
HARRISON R.M., A National survey of Doses to patients undergoing a selection of
Routine x-ray Examinations in English Hospitals. NRPB - NR200, HMSO, 1986,
London.

IAEA-CN-85-193
9
ENTRANCE SURFACE DOSE MEASUREMENT FOR SOME OF THE
RADIOLOGICAL PATIENTS IN BANGLADESH
Z. Begum
Bangladesh Atomic Energy Commission, Dhaka, Bangladesh
Abstract
ESD values were measured for the most common types of X-ray procedures in four of the main hospitals of
Dhaka the Capital City of Bangladesh. Patients undergoing a variety of examination protocols such as Chest PA,
Lumber Spine AP and Lateral, Skull AP and Lateral, Pelvis AP were studied in the four hospitals numbered as 1,
2, 3 and 4.Diagnostic Radiology is the largest contributor to the artificial sources of ionizing radiation. Since X-
ray is a powerful technique of diagnostic imaging, a large number of patient’s (a part of total population) are
availing this technique every day in all countries of the world including Bangladesh. But so far no attempt has
been made in Bangladesh to find out the doses delivered to the patient undergoing different X-ray procedures.
So. in this study Entrance Surface Dose (ESD) values have been measured for about 196 patients undergoing
different X-ray procedures. The observed ESD values in the different local hospitals were compared with the
values within the hospitals and also with the International Reference ESD Values.
1. Introduction
Though a net benefit to health may be achieved by all increase in the provision of radiation
services in medical fields yet it carries some risk. International Atomic Energy Agency has
imposed no limit on medical exposures, the aim is to ensure that the doses are not only low
enough to justify the particular diagnostic examination but are kept even lower when the
objective is reasonably achievable.
Entrance Surface Dose is one of the basic dosimetric quantities for measuring the patient dose.
In connection with optimizing patient dose it is also the basic quantity for comparing with the
International Reference Values which is also important from the point of view of radiation
protection of the patients. Though ESD value measurement for the patient is an essential
component of Quality Control programme for individual X-ray radiology departments but
comparison of ESD values between different hospitals, showing the variation of ESD values
and the ratio of maximum and minimum ESD values can picture out the overall situation of
the radiology departments of the country and can help to take protective measures where
necessary. So, such an attempt has been undertaken in the present study. The results of the
patient dose measurement, presented here are the first reported works that have been done in
Bangladesh.
2. Experimental procedure
Since Chest PA patients were easily available in the hospitals, 10 patients for this projection
in all the hospitals were taken but the patient sample size had to be lowered because of lower
availability of the patients for some of the other procedures. In order to obtain representative
values of ESDs for each X-ray procedure at least five patients per type of radiograph has been
studied to provide a good indication of typical clinical practice. Only adult patients are
included in the sample for the assessment of general diagnostic radiology procedures. Both
sexes have been included as long as extremes in physique are avoided. Patients with weight 60
�10 kg. were considered in this study [1]. Since effects of field size on radiation output in air
has been found to be small and in fact negligible for field sizes used in radiograph [2}, the
effect of field size has been neglected in this study.

IAEA-CN-85-193
10
For each diagnostic procedure a batch of three TLD chips were attached to the skin as close as
possible to the point where the central axis of the X-ray beam enters the patient. The exposure
parameters of the patients such as kVp, mAs, time, FFD etc. were noted down. Following the
X-ray procedure the chips were read by the Harshaw 3500 TLD Reader. The average of three
chips was taken as the ESD value received by the patient for that particular procedure. For
background one batch of chips was kept without exposure every time when the other chips
were exposed.
3. Results and discussion
Patient data and exposure parameters are shown in Table I. The mean ESD values in different
hospitals together with the reference ESD values and also the range factors (ratio between
maximum and minimum ESD values) is shown in Table II.
Table I. Patient Data and Exposure Parameters for ESD Measurement
Serial No.
of the
hospitals
Type of X-ray
Procedure
Range of Age of
Patient
Range of Wt.
Of Patient
Range of kVp Range of FFD
(cm)
1.
2.
3
4.
Chest PA
18-36
22-60
24-78
28-65
56-68
55-75
54-65
50-69
50-55
65-80
55-70
55-73
114-138
150-150
150-150
200-200
1.
2.
3.
4.
Lumber
Spine AP
21-60
20-55
31-70
20-70
52-71
52-68
50-74
50-70
70-81
70-85
70-90
60-77
90-103
90-90
105-110
90-110
1.
2.
3.
4.
Lumber Spine
Lateral
21-60
22-55
31-70
23-70
52-71
52-68
54-65
50-70
77-85
80-90
70-95
73-85
90-110
90-90
105-110
90-110
1.
2.
3.
4.
Skull AP 20-50
22-50
18-68
24-45
53-73
50-65
52-80
50-67
57-70
70-80
75-85
60-75
80-100
90-100
105-110
100-100
1.
2.
3.
4.
Skull Lateral 20-50
34-50
18-68
24-45
53-59
50-65
52-74
50-67
57-81
70-80
65-80
55-70
80-103
90-100
105-110
100-100
1.
2.
3.
4.
Pelvis AP 18-65
32-48
19-75
27-70
50-58
50-66
50-80
52-77
65-77
70-80
65-80
66-73
90-112
90-105
105-110
97-113
A large variation of ESD values for the same type of X-ray procedure even in the same
hospital has been observed. The mean ESD values for each procedure was compared with the
Internationally Accepted Reference Values. It is observed that in most of the cases the local
hospitals delivered ESD values lower than the corresponding Reference Value. In case of
Chest PA, the variation between kVp used among the hospitals was large (50-80 kVp), also
variation between used FFD was large (114-200), so a large variation of the ratio of 35.9 in the
max/min ESD values was observed. This abnormally high variation in the ratio of ESD values
indicates wide variation in the dose, delivered to the patient for the same type of examination.
Hospitals 1, 3, and 4 delivered ESD values for Chest PA nearly equal to the Reference Value

IAEA-CN-85-193
11
Table II. Mean and Range of ESD Values for different types of X-ray examinations in different
hospitals together with the Reference Value and Range factor
Name of
Hospital
Type of
Exam.
No. of
Patients
Maximum
ESD
(mGy)
Minimum
ESD
(mGy)
Mean
ESD
(mGy)
Reference
Value
(mGy)
ESD
Range
Factor
Max/
Min
1.
2.
3.
4.
Chest PA
10
10
10
10
0.49�0.17
4.67�0.22
0.73�0.21
0.74�0.10
0.14�0.01
0.28�0.04
0.19�0.03
0.13�0.03
0.33�0.07
1.58�0.16
0.44�0.14
0.44�0.13
0.4 35.9
1.
2.
3.
4.
Lumber
Spine AP
10
10
9
10
5.67�0.65
25.54�3.66
10.28�0.40
6.22�1.07
2.54�0.15
4.52�0.36
3.51�0.06
1.36�0.09
4.01�0.67
9.71�0.57
7.07�0.55
3.48�0.64
10 18.8
1.
2.
3.
4.
Lumber
Spine
LAT
10
9
10
10
8.28�0.40
33.68�1.32
23.25�0.41
12.46�0.63
5.89�0.48
7.31�1.00
9.08�0.02
3.03�0.29
7.20�0.66
12.66�1.20
13.82�0.76
6.6�0.69
30 11.12
1.
2.
3.
4.
Skull AP 7
7
10
5
2.58�0.13
15.40�1.5
3.51�0.86
1.64�0.17
1.19�0.28
2.40�0.18
1.34�0.14
0.86�0.10
1.17�0.24
8.6�0.95
2.4�0.45
1.21�0.15
5 17.9
1.
2.
3.
4.
Skull LAT 5
5
10
5
0.93�0.11
10.09�0.8
3.66�0.33
1.56�0.14
1.46�0.08
3.78�0.24
1.52�0.07
0.49�0.02
1.16�0.12
6.96�0.44
2.44�0.34
0.92�0.14
3 20.59
1.
2.
3.
4.
Pelvis AP 5
5
8
6
4.83�0.64
8.04�0.28
9.24�0.52
3.28�0.13
2.07�0.27
4.00�0.15
2.73�0.56
1.91�0.10
3.34�0.55
6.20�0.30
5.15�0.46
2.63�0.66
10 4.8
but hospital 2 delivered higher than Reference Value. In case of Lumber Spine AP hospital 1
delivered dose nearly equal to the Reference Value but all other hospitals delivered lower
doses. In case of Skull AP all the four hospitals delivered lower doses than the Reference
Value except hospital 1 which delivered higher value. In case of Skull Lateral hospital 3
delivered ESD value nearly equal to the Reference Value. The other two hospitals delivered
lower values except hospital 1 which again delivered about 2 times higher value than the
Reference Value. In the case of Pelvis, all the hospitals delivered lower mean ESD values than
the Reference Value.
From the present study though it is observed that in many cases the mean ESD values are
below the Internationally accepted Reference Values, in most of the cases the fluctuation of
the ESD values was too large, even in the same type of X-ray examination and same X-ray
facility. It was found that the ratio of maximum and minimum ESD values for different X-ray
procedures ranged from 2.62 to 77.8, the Chest PA has showed the largest variation. Higher
ESD than the Reference ESD values for a particular type of X-ray procedure in general
represent an unnecessary over exposure to the patient whereas low ESD values may lead to
poor diagnosis and unnecessary repetition of the X-ray procedure. In both cases the chance of

IAEA-CN-85-193
12
increasing radiation exposure to the patient increases. Also a considerable spread of patient
doses between hospitals for similar types of X-ray procedure reflects the need for dose
optimization maintaining the relevant appropriate parameters for the radiological X-ray
procedures in Bangladesh
Acknowledgements
I express my heart-felt gratitude to Mr. Fazle Karim Miah, Chief Scientific Officer,
Bangladesh Atomic Energy Commission for his constant guidance throughout the course of
the whole work. I am also thankful to all my colleagues of HPRML, Bangladesh Atomic
Energy Commission who extended their help and cooperation during the work.
References
[1] ORESEGUN, M. et, al., “Radiation Protection and Quality Assurance in Diagnostic
Radiology an IAEA Coordinated Research Project in Asia and Eastern Europe,” Appl,
Radiat, And Isotopes, Vol. 50, Pergamon Press (1999) 271–276.
[2] ROGERS, R. T., “Radiation Dose to the skin in Diagnostic Radiology”, British Journal
of Radiology, Vol. 42, No. 493 (1969) 511–518.

IAEA-CN-85-206
13
THE FIRST TRIAL PATIENT DOSE SURVEY IN
DIAGNOSTIC RADIOLOGY IN VIET NAM
Dang Thanh Luong, Duong van Vinh, Ha Ngoc Thach, Phan Tuong Van,
Nguyen Phuong Dung, Pham Quang Dien
Institute For Nuclear Science and Technique, Vietnam Atomic Energy Commission, Viet Nam
Nguyen Manh Phuc, Nguyen Manh Truong
Hospital Tran Hung Dao, Viet Nam
Abstract
This paper presents the results of the patient dose survey in some hospitals in Hanoi City from 1995 to 1997
under IAEA CRP "Radiation Protection in Diagnostic Radiology in Asia and Far East". The main investigated
types of the X-ray examination were: Chest PA,LAT; Skull PA/AP,LAT; Lumbar spine AP,LAT; and Pelvis AP
and in barium meal as well. The fluctuation of the entrance surface doses ( ESD) was too large, even in the same
type of X-ray examination and X-ray facility. It was found that the ratio of maximum and minimum ESD ranged
from 1.5 to 18. The mean values of ESD for chest and skull were higher than the CEC recommended guidance
values, while the mean values of lumbar spine and pelvis were smaller than that of CEC recommended guidance
values. The result of dose intercomparison was also reported. Some methods of dose reduction were applied for
improving the patient dose in X-ray departments such as a high kV technique, high sensitive screen-film
combination.
1. Introduction
The World Health Organization (WHO) has defined quality assurance in medical X-ray
diagnosis as:
"... An organized effort by the staff operating a facility, to ensure that the diagnostic images
produced by the facility are of sufficiently high quality so that they consistently provide
adequate diagnostic information at the lowest possible cost and with the least possible
exposure of the patient to radiation"
It was clear that the patient dose monitoring should be an essential component of quality
control programme in diagnostic radiology . In Vietnam there are more than two thousands X-
ray machines being used in diagnostic radiology. These x-ray machines are very different in
types and models. Most of them are very old and have been working for a long time without
quality control. This paper presented the first results of the patient dose survey conducted in
1995-1997 period in Hanoi City according to CEC recommended conditions. Selected types of
X-ray examination for investigation were lung PA,LAT; skull AP/PA, LAT; lumbar spine AP,
LAT; pelvis AP and in barium meal as well. The results of thermoluminescent dosimeter
system intercomparison were also reported.
2. Experiment and discussion
1. Thermoluminescent dosimeter system and result of dose intercomparison:
1-1/ Thermoluminescent system
TLD-100 was chosen for measuring the ESD per radiograph. TLDs have an advantage of
being physically small, enabling them to be stuck directly to the patient's skin. They will fully
measure the radiation backscattered from the patient's body. Universal ToLeDo Reader 654D
was used for reading the thermoluminescent signals from TLDs. The measuring regime was
setup as following:

IAEA-CN-85-206
14
�� Preheating temperature: 130o
C time: 16 seconds
�� Reading temperature : 260o
C time: 16 seconds
�� Annealing temperature : 300o
C time: 25 seconds
�� Heating rate : 16o
C/sec.
TLDs were individually calibrated against OB/6 Buchler reference source: Cs-137 20Ci.
1-2/ Calibration and Intercomparison of Dosimetric System
55 TLDs were divided into 11 sets of 5 dosimeters and have been sent to the Primary Standard
Dosimetry Laboratory at National Radiation Laboratory (NRL) in New Zealand.
The Table 1 presented the result of dose intercomparison. It was shown that the absorbed
doses in air of the dosimeter sets TLD7, TLD8 and TLD9 were in a good agreement with
reference values. The deviations in % ( � = ( Ref.-meas.)/Ref. x 100% ) of sets TLD7, TLD8
and TLD9 were of 0.2%, -1.4% and 2.2%, respectively.
Table 1. Result of Dose Measurement for Intercomparison of TLD Systems
Code Eff.energ
y
keV
Mean cal.
dose, mGy
Sdev
mGy
Ref. Dose
mGy
Deviatio
n
%
corrected
meas. values
TLD7 26.9 4.22 0.09 4.23 0.2 4.28mGy
TLD8 33 25.97 1.07 25.6 -1.4 26.63mGy
TLD9 41.1 2.21 0.06 2.26 2.2 2.26mGy
Dose intercomparison
0.000.200.400.600.801.001.201.401.60
B C I M T V
Countries
Me
as.
/Re
fer.
2.26 mGy4.23 mGy25.6 mGy
Figure 1 Results of dose intercomparison in Asia-Pacific Region.
The result of the dose intercomparison showed that the TLD system was adequate for
monitoring the patient dose.
2. Patient dose survey
2-1/ Entrance Surface Dose (ESD)
Here, the patient dose can be understood as the entrance surface dose, that can be defined as
the absorbed dose to air at the point of intersection of X-ray beam axis with the entrance
surface of patient, including backscattered radiation. The entrance surface dose is to be
expressed in term of mGy.

IAEA-CN-85-206
15
2-2/ Selection of measurement samples
For the dose measurements to be indicative of routine practice and to be comparable, the
careful selection of measurement samples is required. Adult patients of both of sexes were
selected for assessment of general diagnostic radiology procedures. At least 10 patients were
selected for each type of examination for one x-tube. The mass of patient should be in the
range of 65�10 kg.
2-3/ The patient dose
3. Patient doses in radiography
Table 2. The results of ESD survey before QC
Lung
PA
Lung
LAT
L.spine
AP
L.spine
LAT
Skull
AP/PA
Skull
LAT
Skull
Hertz
Pelvis
AP
Hospital 1 0.7 1.83 5.06 10.25 9.05 30.65 2.89
Hospital 2 1.47 3.71 6.3 10.91 6.7 4.66 5.28
Hospital 3 0.98 7.8 7.47 20.2 7.52 7.67 6.04
The patient dose survey was conducted in 7 X -ray rooms of three hospitals [2]. The result of
dose monitoring before carrying out QC is presented in the table 2. It was found that except
for the lung PA examination, the ESDs of the different types of x-ray examination in hospital
3 were higher than that in other hospitals, particularly in lung LAT, lumbar spine AP/PA, LAT
and pelvis AP examinations. One of reasons related to these high values of ESD may be that
the X-ray machines of this hospital were too old and functioning not properly. Some times, it
is necessary to repeat exposure at least two times for getting one radiograph because the
power of radiation exposure is not enough for the fat patient. The ESD of the skull in the
Hertz position in hospital 1 was very high ( > 30mGy).
Table 3. CEC values [1] and the ratio of the measured ESD and CEC
Ratio of the measured ESD and CEC recommended values
Lung
PA
Lung
LAT
L.spin
e AP
L.spine
LAT
Skull
PA/AP
Skull
LAT
Pelvis
AP
CEC
values
0.3
mGy
1.5
mGy
10
mGy
30
mGy
5
mGy
3
mGy
10
mGy
Hospital 1 2.3 1.22 0.5 0.34 1.81 - 0.29
Hospital 2 4.9 2.47 0.63 0.36 1.34 1.55 0.53
Hospital 3 3.26 5.2 0.74 0.67 1.50 2.55 0.64
The table 3 showed that ESDs of the lumbar spine ( AP, LAT) and pelvis (LAT) examination
were less than that of CEC recommended values. In the mean time, for the lung and skull
examinations the obtained ESDs were higher then CEC values. The ratios of the measured
ESD and CEC recommended values for lung examination were ranged from1.2 to 5.2. From
the practice, it was learn that, except for lung examination, radiographic technical data for the
other types of studied x-ray examination in the investigated hospitals was similar to the CEC
suggested technical data, particularly in kVp, mAs and FFD specification. The low voltage
technique was still widely used in the practice for the lung examination. That may be one of
the main reasons to get a high value of ESD for the lung examination in all most hospitals.
Another reason is that the deferent screen-film combination was popularly accepted to be used
in hospitals for the economical causes. ESD varied in the very large scale for any given X-ray
examination. The ratios of max/min of ESD values were varied from 1.5 upto 16. The largest
variations were observed for the chest LAT in the hospital 3 and skull AP/PA in the hospital 1.

IAEA-CN-85-206
16
4. Patient doses in fluoroscopy
The patient doses (DAP) in the barium meal examination were performed on 7 units( 4 U arm
intensifier fluoroscopy units, 3 direct fluoroscopy units). The average values of DAP were
quite different from hospital to hospital (see the table 4). The maximum attitude of
discrepancy is of 14.2 factor for the fluoroscopy intensifier units
Table 4. The patient doses ( DAP) in the barium meal examination
TUR-
D351
(Direct)
Picker
(Direct)
Trophy Shima
zu1
Shima
zu2
Elemma
(Direct)
GE
TFX15
Exposure time, sec. 91 50 121 22 42 16.2 109
DAP, mGycm2
1241 5373 5054 351 355 763 1067
mGycm2/sec. 13.6 107.5 41.8 16.0 8.5 47.1 9.8
The figures in the above table showed that the patient doses in barium meal strongly depend
on the skills of radiologist. It may also mean that the reduction of patient dose depends on
carefulness and experiences of radiologists.
2-4/Dose Reduction
It was shown that ESD of lung examination were high. So we have tried to apply two methods
for reducing the patient dose for PA lung x-ray examination. The increased kV and screen -
film combination with higher sensitivity methods were used in three hospitals. The patient
dose reduction varied from 40 % to 80% for the Chest PA and from 10% to 80% for Chest
LAT. for other types o examinations the general patient dose reducion was found in the
interval of 15% to 45%. It was found that by using the high kV technique or high sensitive
screen-film combination the ESDs of patient under chest examination were reduced very
much.
4. Conclusion
The paper presented the first patient dose survey in diagnostic radiology in Vietnam according
to CEC condition. The ESDs of chest and skull examination were higher than that of CEC
recommended values. The necessary measures should be taken so that the QA and QC
programme in diagnostic radiology in Vietnam will be established and implemented regularly.
The high kV and high sensitive film screen methods should be applied in the x-ray
departments for reducing the medical exposure to collective public dose.
Acknowledgements
We would like to acknowledge to IAEA for supporting this study in the framework of the
IAEA's RC 8415/RB under CRP "Radiation Protection in Diagnostic Radiology in Asia and
Far East". We also express our thanks to all staff of Centre of Radiation Protection and
Nuclear Physics, X-ray departments of hospitals K, Viet Duc, Tran Hung Dao, Bach Mai and
Hospital Traditional Medicine, Hospital Central Ophthaimic for their cooperation and
assistance in carrying out this survey.
References
[1] CEC, Working Document 3rd edition, June 1995.
[2] DANG THANH LUONG, Final Report of IAEA's RC 8415.

IAEA-CN-85-5
17
RADIATION DOSES TO PATIENTS IN DIAGNOSTIC RADIOLOGY IN
ROMANIA; COMPARISON WITH GUIDANCE LEVELS AND
POSSIBILITIES OF REDUCTION
C. Milu, A. Dumitrescu, R. Marin, F.S. Popescu
Institute of Public Health, Bucharest, Romania
Abstract
During 1990-2000 the Institute of Public Health-Bucharest participated to two research programmes, co-
ordinated by International Atomic Energy Agency, in co-operation with European Commission. Patient dose
measurements were performed in 10 X-ray units from 5 big hospitals from Romania, for the main X-ray
diagnostic procedures using thermoluminescent dosemeters (TLDs). The obtained values were compared with the
internationally recommended guidance levels. The highest ratio patient surface entrance dose/ guidance level was
determined for chest radiography due to the routine practice of using low “kV” technique.
A special attention was given also to conventional fluoroscopy (direct viewing), still in use in about 20% of the
total X-ray examinations in Romania.
1. Introduction
According to the definition, in X-ray diagnostic radiology, a Guidance Level (GL) is a dose
level set for standard procedures and for groups of standard-sized patients or a standard
phantom:
�� entrance surface dose per radiograph, for diagnostic radiography;
�� entrance surface dose rate, for fluoroscopy;
�� average glandular dose per cranio-caudal projection, for mammography;
�� multiple scan average dose, for computed tomography.
Consistent guidance levels are given by International Atomic Energy Agency in Basic Safety
Standards from 1996 [1] and by European Commission in its guidances from 1996 and 1999
[2,3].
The GLs practically should assist in the optimisation of the patient protection, by helping to
avoid unnecessarily high doses to the patient. The system for using GLs includes:
�� estimation of patient doses, as part of a regular quality assurance programme;
�� comparison of obtained doses with the internationally recommended guidance levels;
�� corrective actions whenever guidance levels are consistently exceeded.
Since the beginnings of 1990, the Institute of Public Health-Bucharest participated to the co-
ordinated research programmes (CRPs) on “Radiation Doses in Diagnostic Radiology and
Methods for Dose Reduction“ [4] and on “Technologies for Dose Reduction in Diagnostic
Radiology for Eastern European Countries”, initiated by the International Atomic Energy
Agency, in co-operation with European Commission.
2. Method
The investigations were performed in 5 main hospitals from Bucharest, Cluj-Napoca and
Iassy, during several X-ray examinations (conventional fluoroscopy and standard radiography)

IAEA-CN-85-5
18
and consisted in patient dose measurements and in comparisons with internationally
recommended guidance levels.
The entrance surface dose on patient in medical radiography was directly measured by
means of TL dosemeters, after an intercalibration of all participating laboratories to the CRP.
A set of dosemeters from each participant was exposed in the same laboratory to different
beams (25, 60, 80 and 120 kV and 137
Cs) and to different doses (0, 1, 5 and 50 mGy).
The dose-area product and dose rate in fluoroscopy were determined using appropriate
calibrated ion chambers type PTW-Freiburg.
When performing measurements on the patient, several relevant data were collected:
equipment generator and X-ray tubes imaging system and processing, patient data and
technical factors (settings, distances, exposure time) for each examinations.
After a comparison with guidance levels, an analysis of the results was performed, in order to
identify the causes which contribute most to the dose and, if appropriate, dose reduction
methods were applied, keeping the image quality [3].
3. Results
In Table 1 are presented the measured entrance doses to patient for the main radiographic
examinations and projections. The mean value ranged from 45.3 mGy for thoracic spine
(LAT) to 1.1 mGy for chest (PA). The ratio between the measured (mean) dose and guidance
level [1] varies from 1.0 for cholecystography (AP) to max. 2.8 for chest (PA).
Table 1. Patient doses (adults) for diagnostic radiography
Type of examination and projection Measured entrance dose
(mGy)
Guidance
Level
Ratio
(M/G)
Range Mean value
SKULL AP
LAT
4.7 – 19.0
4.4 – 14.5
9.1
6.9
5
3
1.8
2.3
CHEST PA
LAT
0.5 – 1.5
1.0 – 3.1
1.1
1.8
0.4
1.5
2.8
1.2
THORACIC SPINE AP
LAT
6.5 – 20.6
19.2 – 55.0
12.0
35.6
7
20
1.7
1.8
LUMBAR SPINE AP
LAT
7.4 – 25.8
26.0 – 72.8
16.8
45.3
10
30
1.7
1.5
ABDOMEN AP 10.7 – 21.3 14.2 10 1.4
PELVIS AP 9.6 – 24.4 16.6 10 1.7
CHOLECYSTOGRAPHY AP 7.8 – 15.8 10.1 10 1.0
The calculated effective doses are given in Table 2.

IAEA-CN-85-5
19
Table 2. Effective dose per radiographic procedure
Procedure Effective dose per radiographic
procedure/(mSv)
SKULL 0.17 ( � 0.09)
CHEST 0.25 ( � 0.11)
THORACIC SPINE 2.00 ( � 1.20)
LUMBAR SPINE 2.93 ( � 1.40)
ABDOMEN 1.90 ( � 1.10)
PELVIS 2.60 ( � 1.30)
CHOLECYSTOGRAPHY 1.60 ( � 0.90)
In Table 3 are shown the dose-area product values obtained for fluoroscopic procedures (the
barium examinations include also the radiographic images) and the calculated effective doses.
Table 3. Patient doses in fluoroscopic procedures
Procedure Dose – Area Product
(Gy . cm2)
Effective Dose
(mSv)
Range Mean value
Chest fluoroscopy 4.3 – 10.7 7.5 0.95
Barium meal 11.0 – 30.0 20.5 4.10
Barium enema 18.5 – 45.7 32.1 9.10
The Table 4 presents the range of measured entrance surface dose rates for conventional
fluoroscopic installations (direct viewing) and the comparison with guidance value.
Table 4. Entrance surface dose rates (mGy/ min)
Settings for chest fluoroscopy Dose rate
kV
range
mA
range
total filtration
mm Al
Measured Guidance
70 - 85 2.5 – 3.0 2.5 22 – 49.5 25
4. Dose reduction
For the very frequent chest radiography, the analysis of physical parameters used (Table 5)
shown that a low “kV” technique is generally preferred, explained by the care to protect X-ray
tube.
Table 5. Physical parameters used and comparison with recommended values for chest
radiography
Parameter Used Guidance
FFD (cm) 160 (150-170) 180 (140-200)
kV 75 (70-80) 125
Speed of film/ screen
combination
200 400

IAEA-CN-85-5
20
By increasing of kV and reduction of both mA.s and field size a dose reduction up to 30 %
was obtained, keeping the quality of image.
An increase of screen-film sensitivity determined a dose reduction up to 40 %.
Important possibilities for dose reduction are available in fluoroscopy. In Romania 20 % of
the total X-ray examinations are fluoroscopies and 80 % of fluoroscopies are for chest, most
of them still using conventional (direct viewing) fluoroscopy. According to Art. 8 of Conncil
Directive 97/ 43/ EURATOM of 30 June 1997 [5], such techniques are considered unjustified
and should be prohibited in the future.
Important practical possibilities for dose reduction are available in fluoroscopy: use of as low
mA and kV factors as possible, attention to a good collimation, short duration of
investigation, dispense with antiscatter grids and others well known good practices.
5. Conclusions
By comparing local practice against guidance levels of dose for patients, it was demonstrated
that guidance levels are important quantitative guides for the optimisation of patient
protection in diagnostic radiology.
As the guidance levels from basic safety standards are based on investigations in some
developed countries, they are too restrictive for some other countries.
The guidance levels should be understood as guidelines, rather than standards in medical
diagnostic radiology, and they should be evaluated in relation with quality assurances
programmes in each country, by professionals from both medical and physics communities.
References
[1] INTERNATIONAL ATOMIC ENERGY AGENCY, International Basic Safety
Standards for Protection against Ionizing Radiation and for the Safety of Radiation
Sources, Safety Series No. 115, IAEA, Vienna (1996).
[2] EUROPEAN COMMISSION, Guidance on diagnostic reference levels (DRLs) for
medical exposures, Radiation Protection 109 (1999).
[3] EUROPEAN COMMISSION, European Guidelines on Quality Criteria for Diagnostic
Radiographic Images, EUR 16260 EN (1996).
[4] INTERNATIONAL ATOMIC ENERGY AGENCY, Radiation Doses in Diagnostic
Radiology and Methods for Dose Reduction, IAEA-TECDOC-796, Vienna (1995).
[5] EUROPEAN COMMUNITIES, Council Directive 97/ 43/ EURATOM of June 1997 on
Health protection of individuals against the dangers of ionizing radiation in relation to
medical exposure, L 180/ 22 (1997).

IAEA-CN-85-14
21
PATIENT’S DOSE ASSESSMENT DURING SINUS X-RAYS
RADIOGRAPHY AT « HOPITAL DU POINT G »
S. Sidibe, B.Y. Sacko, M. Doucoure, B. Traore, I. Traore
Service de radiologie et de médecine nucléaire, Hôpital du Point « G », Bamako, Mali
Abstract
OBJECTIVE
�� To evaluate the patients X-rays dose during head radiography for sinusitis
�� To precise the influence of source-image distance on the patient’s dose.
MATERIAL AND METHOD
From may 1997 to january 1999, 83 patients with clinical suspicious sinusitis have been included in this study.
Skull radiography in 3 positions (posterior, lateral and Blondeau view) have been achieved for each patient on
24x30 centimeters size films. These radiography were realised on a Diagnost 7 Masio Philip X-rays machine.
Three TLD dosimeters were pasted against every patient target organs (thyroid, rigth and left eyes). The source-
image distance (SID) was 100 centimeters for the first group (35 patients) and 125 centimeters for the second
group (48 patients). The selected parameters (high voltage and charge) were as follow:
Skull postero-anterior view: 65 to 85 kV, 80 mAs
Skull lateral view: 60 to 75 kV, 80 mAs
Blondeau view (paranasal sinuses): 90 to 95 kV, 100 mAs.
RESULTS
All the radiographies were analysed by the same radiologist who didn’t know the SID. All the films were of good
quality. The patient’s dose in millisievert for each target organ were:
Left eye Right eye Thyroid
Group I
(SID = 100 cm)
3,2 (+ ou – 0,66)
3, 0 (+ ou – 0,82)
0,62 (+ ou – 0,09)
Group II
(SID = 125 cm)
1,9 (+ ou – 0,48)
1, 86 (+ ou – 0,50)
0,39 (+ ou – 0,08)
In conclusion, the increase of SID from 100 to 125 centimeters allows patient’s dose reduction by a factor of 1.6
without the alteration of the films quality, hence the reliability of the diagnosis.
1. Introduction
Radiation doses from radiodiagnostic radiology are the largest contribution to the collective
dose from all man-made sources of radiations. In Mali (west africa), where the radiation
protection law instead International Atomic Energy Agency (IAEA) effort is still on draft
form, the number of X-rays diagnostic installations grows year by year. If 86% of these
installations are a second-hand machines, most of them are at least 20 years old (Sidibé et al.,
1995). Also any project on dose assessment and developping dose reference levels and image
quality criteria for common diagnostic examination have been running. In « hôpital du Point
G », skull radiography is the second largest examination just after chest radiography, and
sinusitis is the mainly reason of such radiography. If it is well recognised that the over-zealous
reductions in patient doses can have deleterious effects on the diagnostic information of the
image, in some cases, doses reduction can even be obtained together with an improvement of
the image. In this fact our present study have been done with following purposes:
�� To evaluate the patients X-rays dose during head radiography for sinusitis;
�� To precise the influence of source-image distance on the patient’s dose.

IAEA-CN-85-14
22
2. Material and methods
From May 1997 to January 1999, 83 patients with a clinical suspicious sinusitis were included
in this study. These patients included 36 males and 47 females. The mean age of our study
population was 28 years (average: 5 to 67 years). All the radiographic examiantions were
realised according to the physician recommendation through following projections: skull
postero-anterior, lateral and Blondeau views. Radiography were realised on a Diagnost 7
Massio Philip X-rays machine with a 24x30 centimeters size films (Kodak X-Omat K film).
Patients were divided in two groups according to the Source – Image – Distance (SID) which
was 100 centimeters for group I (35 patients) and 125 centimeters for group II (48 patients).
For patient doses evaluation we used 3 previous calibrated thermoluminescent dosimeters
(TLD). These TLD were pasted for each patient on thyroid, right and left eyes. These organs
were selected because they are target organs for each view. The selected constant parameter
(high voltage and charge) for X-rays radiography were as follow:
�� Skull postero-anterior view: 65 to 85 kV, 80 mAs
�� Skull lateral view: 60 to 75 kV, 80 mAs
�� Blondeau view: 90 to 95 kV, 100 mAs.
All the films were transported through the same processing sequence (developing, fixing,
washing and drying) of an automated processor. Each picture was closly identified and
evaluation of all pictures have been done by the same radiographer without information on the
SID parameter. For image quality assessment we used a qualitative rating with 3 scales (Poor,
Satisfactory, Good) for each picture.
3. Results
The criteria for image quality assessment were:
Skull postero-anterior view:
�� symetrical reproduction of the skull;
�� symetrical reproduction of rock face on the lower part of the orbits;
�� repoduction of spongiosa and corticalis;
�� visualization of the skull sutures.
Skull lateral view:
�� visualization of the skull sutures;
�� superimposition (left-right) of the orbits roof;
�� visualization of the skull and neck junction.
��
Blodeau view:
�� symetrical reproduction of face;
�� visualization of maxillary sinus;
�� visualization of the rock under maxillary sinus.
��
Table I, II, and III represented the summary of these criteria, and table IV represented patient’s
doses in millisivert.

IAEA-CN-85-14
23
Table I. Image quality assessment according to a qualitative 3 scales (skull postero-anterior
view)
Poor Satisfactory Good
Group I
(SID = 100 cm)
0
9
26
Group II
(SID = 125 cm)
0
12
36
Table II. Image quality assessment according to a qualitative 3 scales (skull lateral view)
Poor Satisfactory Good
Group I
(SID = 100 cm)
1
15
19
Group II
(SID = 125 cm)
0
21
27
Table III. Image quality assessment according to a qualitative 3 scales (Blondeau view)
Poor Satisfactory Good
Group I
(SID = 100 cm)
3
11
21
Group II
(SID = 125 cm)
4
18
26
Table IV. The patient’s dose in millisievert for each target organ were
Left eye Right eye Thyroid
Group I
(SID = 100 cm)
3,2 (+ ou – 0,66)
3, 0 (+ ou – 0,82)
0,62 (+ ou – 0,09)
Group II
(SID = 125 cm)
1,9 (+ ou – 0,48)
1, 86 (+ ou – 0,50)
0,39 (+ ou – 0,08)
Right maxillary sinusitis
[a] [b] [c] Figure 1. X-ray radiography at SID 100 centimeters: [a] skull postero-anterior view; [b] skull
lateral view; [c] Paranasal sinuses (Blondeau view)

IAEA-CN-85-14
24
Normal maxillary, frontal and sphenoidal sinuses
[a] [b] [c]
Figure 2. X-ray radiography at SID 125 centimeters: [a] skull postero-anterior view; [b] skull
lateral view; [c] Paranasal sinuses (Blondeau view).
In conclusion, the increase of SID from 100 to 125 centimeters allows patient’s dose
reduction by a factor of 1.6 without the alteration of the films quality, hence the reliability of
the diagnosis.
According to the situation of the situation of X-rays equipment in Mali, a national project of
dose assessment and developping dose reference levels and image quality is necessary.
References
[1] Agence Internationale de l’Energie Atomique. Normes fondamentales internationales de
protection contre les rayonnements ionisants et de sûreté des sources de rayonnement –
Vienne, 1994
[2] Aubert B, Lefaure C. Peut on optimiser la radioprotection des travailleurs dans le
domaine médical ? J Radiol 1998 ; 79 : 307-312.
[3] Commission Internationale de Protection radiologique 1990. Recommendations of the
International Commission on Radiological Protection, Publication N° 60, Pergamon
Press, Oxford et New York, 1991.
[4] Sidibé S.: Rapport sur la protection contre les radiations et la gestion des déchets
radioactifs au Mali. IAEA regional seminar on condition necessary for radiation safety –
Lussaka, Zambia, november 1995.

IAEA-CN-85-29
25
TRENDS AND THE DETERMINATION OF EFFECTIVE DOSES FOR
STANDARD X-RAY PROCEDURES
H.M. Johnson, C. Neduzak, J. Gallet, J. Sandeman
Department of Medical Physics, Cancer Care Manitoba, Canada
Abstract
Trends in the entrance skin exposures (air kerma) for standard x-ray imaging procedures are reported for the
Province of Manitoba, Canada. Average annual data per procedure using standard phantoms and standard ion
chambers have been recorded since 1981. For example, chest air kerma (backscatter included) has decreased
from 0.14 to 0.09 mGy. Confounding factors may negate the gains unless facility quality control programs are
maintained. The data were obtained for a quality assurance and regulatory compliance program. Quoting such
data for risk evaluation purposes lacks rigor hence a compartment model for organ apportioning, using organ
absorbed doses and weighting factors, has been applied to determine effective dose per procedure. The effective
doses for the standard procedures are presented, including the value of 0.027 mSv (1999) calculated for the
effective dose in PA chest imaging.
1. Introduction
The Canadian province of Manitoba lies in mid continent with a population of 1.2 million
persons. Health care facilities are distributed throughout the province with tertiary care
concentrated in the provincial capital of Winnipeg. Radiation Protection Services is mandated
by the Province to provide x-ray regulatory services for the health care facilities. An
inspectorate group operating from the Medical Physics Department of CancerCare Manitoba
surveys medical x-ray facilities annually. A compliance review is conducted during each
survey and guidance is provided (and demonstrated) for changes in techniques that will
maintain film density and image quality as well as controlling patient dose.
Legislation does not specify dose limits for entrance skin exposures in specified procedures.
Rather the province-wide averages of the previous year’s surveys are used to benchmark the
entrance skin exposures for the current year’s surveys. Entrance skin exposures are measured
with selected phantoms in place, the thickness of the phantom being varied according to the
procedure in order to simulate the patient. The year-by-year entrance skin exposure data for
standard procedures have been tabulated to assess the trends. These data are reported here.
While entrance skin exposure data are an appropriate quality control tool, the data are
erroneously used as the measure of patient dose. To address this concern, a means of
calculating the effective dose has been implemented. The average effective doses for the
standard procedures tested in the compliance program have been determined for the 1999
data.
2. Methodology
In performing the compliance tests, x-ray machines were set up in an identical manner to the
technique used by the facility’s technologists. The tube was set at a height of 100 cm (focal
spot to film), the appropriate phantom was positioned as if it was the patient and imaging
parameters (tube voltage, current and time) were obtained from the technologist. Phantom
thickness was constant for a specific procedure but varied according to the procedure (see
Table I). Entrance skin exposure data were consistently measured with a 6 cc ion chamber
(Radcal Corporation) and an MDH meter (1015 and 1515). The ion chamber was inserted in a

IAEA-CN-85-29
26
machined receptacle at the top of the phantom block. Phantoms of various thickness were
constructed from pressed wood having a specific gravity of 1.00.
Entrance skin exposure data were collected with the instrumentation in milliroentgen (mR)
and were subsequently converted to air kerma in milligray (mGy): 1.00 mR = 0.00873 mGy.
3. Results
The average annual air kerma data for three x-ray imaging views are shown in Figures 1 and
2. These data are the average of each annual set of compliance measurements for these
procedures measured on medical x-ray machines in the province of Manitoba during the
period 1981 – 1999. Data concerning the phantom thickness used to obtain the respective
views are provided in Table I. Figures 1 and 2 demonstrate the gradual decrease in average air
kerma for certain views as a result of the compliance review program, while maintaining film
density and image quality.
Entrance skin exposure data obtained in the 1999 survey year are reported as air kerma in
Table I. The standard procedures measured in our program are listed. Air kerma data include
backscatter from the phantom. The tube voltage and phantom thickness and average film
density are shown according to the procedure. Film speed is “400” throughout the provincial
system.
Table I. Average air kerma data for standard procedures in Manitoba, 1999. Data shown are
from x-ray machines with manual timing, anti-scatter grids and were obtained with phantom
thickness as shown for the procedures. Tube voltages are nominal averages
Imaging
Procedure
X-Ray Tube
Voltage
(kVp)
Phantom
Thickness
(cm)
Average Air
Kerma
(mGy)
Average Film
Optical
Density
PA Chest 110 10 0.091 +/-.03 1.6
AP Abdomen 85 18 1.36 +/-.47 1.6
AP Cervical Spine 70 13 0.41 +/-.17 1.4
AP Thoracic Spine 75 18 1.15 +/-.42 1.3
AP Lumbar Spine 85 23 2.47 +/-.95 1.2
Lateral Skull 80 15 0.52 +/-.14 1.2
4. Discussion
The regular program of compliance inspection and the interactions with x-ray technologists to
assess the techniques and the doses resulted in the gradual decline in average air kerma and
hence in patient doses. The introduction of 400-speed film has assisted in this reduction
process. Nevertheless, confounding factors may be a potential source of further dose reduction
on the one hand and may threaten the trend on the other. These confounding factors include:
(a) Reduced attention to quality control by the technologists may fail to observe changes in
x-ray unit calibration or phototimer tracking.

IAEA-CN-85-29
27
Figure 1. Air Kerma trends in the period 1981 - 1999, inclusive, for selected procedures.
Figure 2. Annual average air kerma, 1981-1999, imaged on medical x-ray equipment in in Manitoba for PA
Chest procedures with 10-cm phantom. Data include backscatter from the phantom.

IAEA-CN-85-29
28
(b) Cost-driven film changes and/or chemistry changes without testing.
(c) Radiologists reading different film densities from different facilities without feedback;
different radiologists preferring films of different densities from the same facility.
(d) Failure to track repeat and reject analyses and evaluate factors contributing to spoiled
films.
The confounding factors will be addressed through communication among radiologists and
technologists and through adherence to the facility’s quality control program.
Data include backscatter from the phantom.
5. Effective dose determination
We used a compartment model derived from a Health Physics Society standard (1) to
calculate effective dose from the standard procedures in our compliance program. Tissue
weighting factors in Reference 1 were converted to those of ICRP 60 (2) and the “remainder”
organs were adjusted. Body compartments were defined for the major procedures: head and
neck, thorax, abdomen and extremities. The models for the first three compartments were
applied to convert entrance skin exposure (air kerma) data to effective doses (see Table II).
The application of this method was as follows:
�� account for backscatter (taken to be 30% for this application);
�� convert exposure data to air kerma “free in air” in SI units;
�� determine the absorbed dose at depth for each critical organ in the respective
compartment using the orientation-specific information in Reference 3 (assuming
average photon energy equals 50% of kVp);
�� apportion the organ masses to the imaging field of view as necessary and calculate the
resultant tissue weighting factor for the organ in the compartment;
�� the radiation weighting factor was unity; multiply the resultant tissue weighting factor
by the absorbed dose to the organ (tissue) to obtain the organ effective dose;
�� sum the effective organ doses for the diagnostic image to determine effective dose.
Table II. Effective doses for standard procedures using the compartment model
Imaging Procedure Imaging
Compartment
Ave. Photon
Energy (keV)
Air Kerma
1999 (mGy)
Effective
Dose (mSv)
PA Chest Thorax 55 0.091 +/-.03 0.027
AP Abdomen Abdomen 42.5 1.36 +/-.47 0.525
AP Cervical Spine Head and Neck 35 0.41 +/-.17 0.023
AP Thoracic Spine Thorax 37.5 1.15 +/-.42 0.217
AP Lumbar Spine Abdomen 42.5 2.47 +/-.95 0.953
LAT Skull Head and Neck 40 0.52 +/-.14 0.018
6. Conclusion
Compliance surveys of diagnostic x-ray equipment in Manitoba indicate a downward trend in
entrance skin exposures for standard imaging procedures. The trend requires vigilance and
maintenance of quality control activities to avoid negating the gains. The data were converted
to effective doses using a compartment model. While approximations exist in the effective
dose calculations, the results are useful indicators of the potential risks from imaging.

IAEA-CN-85-29
29
References
[1] Health Physics Society Standard: Criteria for Performing Multiple Badging, An
American National Standard. HPS.N13.41-1997. Health Physics Society, 1313 Dolley
Madison Blvd, Suite 402; McLean, VA, 22101, USA.
[2] ICRP-60. Recommendations of the International Commission on Radiological
Protection, ICRP Publication 60. Annals of the ICRP, 21 (1-3), Pergamon Press,
Oxford, 1991.
[3] ICRP-74. Conversion Coefficients for Use in Radiological Protection Against External
Radiation, Annals of the ICRP 26 (3,4), Pergamon Press Oxford, 1996.
IAEA-CN-85-33
30
A PROJECT: “RADIOLOGICAL PROTECTION IN RADIOLOGY”,
IAEA–UNIVERSIDAD CENTRAL DE VENEZUELA
A.R. Díaz, G. Salazar, R. Fermín, M. González
Facultad de Medicina, Universidad Central de Venezuela, Venezuela
Abstract
For several years a reference center of the UCV has been working in the project VEN/9/007 on dose reduction in
diagnostic radiology sponsored by the IAEA.
The dose and quality image was evaluated for different types of radiological study (conventional radiology, CT,
mammography, interventional radiology) in different facilities at Caracas and others regions of the Venezuela.
TL dosimeters were used to assess dose and reduction in dose. Based on the recommendations given by CEC
documents on diagnostic quality criteria, a quality control program in radiological protection of patients and staff
have been developed, for example: Pilot study by using TLD in personnel radiation monitoring. Comparative
study between high and low kVp in chest. Evaluation and dose reduction in chest pediatric. Reduction of
radiation dose in studies of billiards via. Quality Image and reduction of the dose in studies of colon by enema.
Radiation dose of staff in fluoroscopy procedures. Evaluation and dose reduction in dental radiography in public
Institutions. A mammography accreditation program for Venezuela, applied to public hospitals.
1. Introducción
En el área de medicina hay un importante porcentaje de enfermedades diagnosticadas con el uso los rayos X. Por lo tanto, cualquier país que aspire mejorar los programas de cuidados de salud de su población debe garantizar su uso adecuado y seguro. En tal sentido, el Organismo Internacional de Energía Atómica (OIEA) ha publicado las Normas Básicas para la protección contra la radiación ionizante, donde se dedica un apéndice para la exposición médica y particularmente a la protección radiológica del paciente [1]. Pero en el área de radiodiagnóstico, además de la protección radiológica del paciente, es fundamental la calidad de la imagen obtenida, para garantizar un diagnóstico adecuado. La Comisión de las Comunidades Europeas (CEC) ha elaborado un documento sobre criterios de calidad para diferentes estudios radiológicos [2]. Pero una buena calidad de imagen con dosis bajas al paciente depende de diversos factores, entre ellos, el funcionamiento de la unidad, las condiciones de las instalaciones y de los equipos; los insumos; las técnicas para la obtención de la imagen; la calidad del servicio de mantenimiento. En esta dirección, a comienzo de los años noventa, el OIEA patrocinó un estudio piloto en algunos países, para reducir dosis en pacientes y al mismo tiempo evaluar la calidad de imagen obtenida en diferentes tipos de estudios radiológicos [3]. En la misma dirección de ese estudio, el centro de Física Médica y Dosimetría (CFMD) de la Universidad Central de Venezuela (UCV) ha desarrollado el proyecto VEN 9/007 “Protección Radiológica en Radiología”, subvencionado por el OIEA. En el presente trabajo se muestran algunos resultados relacionados con la medición y reducción de dosis en pacientes y el monitoreo de la calidad de la imagen.

IAEA-CN-85-33
31
2. Materiales y metodos
Las evaluaciones se realizaron en los servicios radiológicos del Hospital Universitario de Caracas (HUC) y la Facultad de Odontología de la UCV, y en servicios de radiología de otras instituciones médica u odontológica de Caracas y del interior del país. Para ello se tomó como patrón de trabajo, la metodología desarrollada en el estudio piloto del OIEA y otras experiencias en esta área [4][5]. El procedimiento se realizó en tres fases. La primera se utilizó para obtener información básica sobre el servicio de radiología por medio de un cuestionario. En este se indagó sobre la calificación del personal, el equipamiento, insumos, técnicas radiográficas, y las prácticas de control de calidad y mantenimiento. En la segunda, por una parte, se efectuó una evaluación física de la cadena para la toma radiográfica, para ello se siguió el protocolo español de control de calidad en radiodiagnóstico [6] Por otra, se tomaron las radiografías de pacientes (o de maniquíes) y se midió la dosis de entrada, sin modificar ningún parámetro de la cadena. Para la evaluación de la calidad de la imagen clínica se siguieron los criterios propuesto por la CEC y para medir la dosis de entrada se utilizaron dosímetros termoluminiscentes (TLD-100). En la tercera fase, previa a la toma radiográfica, se modifica(n) el (o los) parámetro(s) de la cadena que pueda(n) – de acuerdo a los resultados obtenidos en la segunda fase – estar influyendo en un aumento de la dosis de radiación que está recibiendo el paciente (o el maniquí) En estas nuevas condiciones se mide la dosis y se evalúa la imagen clínica obtenida.
3. Resultados
Los trabajos se desarrollaron con la colaboración de estudiantes de pregrado u postgrado de la UCV que hicieron su tesis en el CFMD, o profesores que realizaron su trabajo de investigación en el Centro. A continuación se presentan – en forma resumida – algunos de los 53 trabajos realizados entre 1995 y 1999. I. Evaluación y reducción de los rangos exposición en radiología odontológica en el
área metropolitana de Caracas [7]
En radiología odontológica, probablemente una de las causas por la que los pacientes están expuesto a recibir mayor dosis, se debe a que se aumenta el tiempo de exposición al paciente en función de disminuir el tiempo de revelado de la película y no siguen las especificaciones para el revelado de la película dadas por el fabricante. Esto, además, puede influir en la calidad de la imagen obtenida. Para evaluar esta situación la investigación en servicios odontológicos públicos de Caracas se midió la dosis de entrada y se evalúo la calidad de imagen con un maniquí odontológico. Se utilizaron, para ello, los parámetros de exposición y el proceso de revelado que usa el servicio visitado habitualmente. Posteriormente, en una nueva visita, se evaluaron los mismos parámetros, pero siguiendo las condiciones de preparación de químicos y procesamiento recomendado para las películas por el fabricante, y la técnica de exposición ajustada a las nuevas condiciones.

IAEA-CN-85-33
32
Resultados: Disminución – en algunos caso –- hasta de un 80 % de la dosis de radiación medida en los consultorios visitados y una mejora significativa de la calidad de imagen. II. En los cinco trabajos citados se evaluó la calidad de imagen y la dosis para técnicas
de bajo y alto Kvp
1. Estudio comparativo entre el alto y bajo Kvp en patología del mediastino en el servicio de Cardiología del HUC [8].
2. Calidad de la imagen y dosis en tórax en el servicio de radiología general del HUC [9]. 3. Evaluación y reducción de dosis en tórax pediátrico en el Hospital Julio Criollo Rivas de
Caracas [10]. 4. Determinación y disminución de la dosis a pacientes sometidos a estudios de vías biliares
del servicio de Gastroenterología del HUC [11]. 5. Reducción de dosis en radiografías de tórax del examen preventivo del Hospital Industrial
de San Tome, Estado Anzoátegui [12]. 6. Resultado. Con la técnica de alto Kvp se obtuvo adecuada calidad de la imagen y la
disminución de la dosis recibida por el paciente. III. Calculo y reducción de la dosis en estudios simples de tórax, columna lumbar, y
pelvis en la clínica industrial CORPOVEN-Anaco-Anzoátegui [13] Parte de los estudios radiológicos realizados en tórax, columna y pelvis en esta clínica se utilizan con fines de contratación laborales. En este sentido, el trabajo de investigación, por una parte, evalúa el hecho de someter a las personas que solicitan empleo a una evaluación radiológica y por otra, para reducir la dosis de radiación, se cambio el tipo de películas y chasis convencionales por pantallas de tierras raras y películas adecuadas. Resultados: Se logró disminuir la dosis y se mejora la calidad de la imagen. Asimismo se hizo una revisión de los archivos radiológicos de la clínica – para el caso de las radiografías de tórax - en lo que se refiere al valor de estos estudios para el caso de las personas que solicitan empleo, más del 90 % de las personas evaluadas presentaron una imagen de tórax normal. IV. Elaboración de un programa de acreditación para unidades de mamografía en
Venezuela y su aplicación a las unidades de hospitales públicos de Caracas [14]
En 1994 se realizó, en Venezuela, un primer trabajo en esta área, donde se evaluó la calidad de la imagen y la dosis de radiación en los mamógrafos de Caracas [15] Como continuación de ese trabajo, en el presente se elabora un programa de acreditación para unidades de mamografía en Venezuela. Asimismo, el programa de acreditación propuesto se utilizó para evaluar las unidades de mamografía de los hospitales públicos de Caracas. Resultados: Con relación a las características de funcionamiento y normativa que rigen el
tipo de servicio médico asistencial, no existe una normativa común, ni criterios ni parámetros de selección específicos. Con relación a la evaluación de la calidad de la imagen
del maniquí, solo un centro está dentro de los límites de tolerancia para la prueba. En cuanto
a la calidad de la imagen clínica, el 70 % de los centros no cumplieron criterios de colocación adecuada. Con respecto a la exposición, las fallas en la técnica de exposición estuvieron presentes en el 57% de las imágenes obtenidas. La presencia de múltiples
artefactos, fue considerada como una fuente en la reducción de la calidad de la imagen. Con

IAEA-CN-85-33
33
relación a la medición de la dosis de entrada, solo una de las unidades estuvo dentro de los límites de tolerancia permitidos. V. Dosis al personal que labora en procedimientos radiológicos con fluoroscopia en el
Hospital Universitario de Caracas [16]
En radiodiagnóstico, uno de los procedimientos donde el personal recibe mayor dosis de radiación es en los estudios angliográficos. En este trabajo se evalúan los procedimientos de protección radiológica seguidas y la dosis recibida por el personal. Se le mide la dosis con dosímetros TL a nivel del cristalino, tiroides, tórax, mamas, y gónadas. Resultados: Se determinó que el médico intervensionista recibe una dosis alta cuando no se siguen procedimientos de protección radiológica. 6. Conclusiones
Con el desarrollo del Proyecto VEN/9/007 se pone en práctica una metodología para el uso eficiente y seguro de las fuentes de radiación ionizantes en radiodiagnóstico. Sumado a esto, la incorporación de alumnos y profesores al proyecto, a través de la realización de tesis y otros trabajos de investigación, no solo da importantes aportes para el caso de Venezuela, sino que en su desarrollo están explícitos los conocimientos adquiridos por este personal y que pueden poner en práctica en su trabajo en los centros de atención médica donde laboran, lo cual contribuye a obtener imágenes de buena calidad y con dosis baja de radiación. Referencias
[1] INTERNATIONAL ATOMIC ENERGY AGENCY, Normas Básicas Internacionales de Seguridad para la Protección contra la Radiación Ionizante y para la Seguridad de las Fuentes de Radiación. Colección Seguridad No 115. Vienna (1997)
[2] COMISIÓN OF THE EUROPEAN COMMUNITIES, Working Document on quality criteria for diagnostic Radiographic Images, CEC XII/173/90, June (1990)
[3] INTERNATIONAL ATOMIC ENERGY AGENCY, Radiation doses in diagnostic radiology and methods for dose reduction, AIEA-TECDOC-796, April (1995)
[4] VAÑO E., GONZALEZ L., CALZADO A., DELGADO V., MORAN P.; Some result of patient Dose Survey in the Madrid, Optimisation of image quality and patient exposure in diagnostic radiology, British Institute of radiology (1989)
[5] MOTA H., ARAUJO A.,PEIXOTO J., DRAXLER G., Radiologica e Controle de Qualidade em Radiologia Dentaria, Instituto de Radioprotección Dosimetrica, Brasil (1994)
[6] SOCIEDAD ESPAÑOLA DE FÍSICA MEDICA. Protocolo español de control de Calidad en Radiodiagnóstico. Versión Provisional (1993)
[7] GARCIA C., RODRIGUEZ A., ROJAS C., Evaluación de exposiciones en Radiología Odontológica, Tesis de Grado, Universidad Central de Venezuela, Caracas (1995)
[8] MASA S., MORA M., Estudio comparativo entre el alto y bajo Kvp. en patología del mediastino en el servicio de Cardiología del HUC, Tesis de pregrado, Universidad Central de Venezuela, Caracas (1995)
[9] KASSAR N., Evaluación de dosis en Estudios radiológicas de Tórax en pacientes del HUC, Tesis de pregrado, Universidad Central de Venezuela, Caracas (1995)

IAEA-CN-85-33
34
[10] NAVARRO Z., Evaluación y reducción de dosis en tórax pediátrico en el Hospital Julio Criollo Rivas de Caracas, Tesis de pregrado, Universidad Central de Venezuela, Caracas (1995)
[11] CEDEÑO J., REBOLLEDO A., ROA R., Determinación y disminución de la dosis de radiación a pacientes sometidos a estudios de vías biliares del servicio de Gastroenterología del HUC, Tesis de pregrado, Universidad Central de Venezuela, Caracas (1996)
[12] GARCIA C., ZAMBRANO S., reducción de dosis de radiación en radiografías de tórax del examen preventivo anual del Hospital Industrial de San Tome, Estado Anzoátegui. Tesis de pregrado, Universidad Central de Venezuela, Caracas (1998)
[13] GUILLÉN F, Calculo y reducción de la dosis en Estudios simples de tórax, columna lumbar, y pelvis en la Clínica Industrial CORPOVEN-Anaco-Anzoátegui, Tesis de pregrado, Universidad Central de Venezuela, Caracas (1997)
[14] RUIZ K., MILLAN M., Programa de Acreditación de unidades de mamografía. Tesis de postgrado en radiodiagnóstico, Universidad Central de Venezuela, Caracas (1998)
[15] DIAZ A. Control de Calidad de Mamógrafos de Caracas, Trabajo de Ascenso. Universidad Central de Venezuela, caracas, (1995)
[16] PERDOMO T., SILVA J., SOSA E., Evaluación de la dosis de radiación recibida por el personal profesionalmente expuesto en estudios angiográficos en el HUC. Tesis de pregrado, Universidad Central de Venezuela, Caracas (1996)

IAEA-CN-85-42
35
IONIZING RADIATION USED IN MEDICAL DIAGNOSTICS AS A SOURCE OF
RADIATION EXPOSURE OF THE PATIENT WITH OCCUPATIONAL DISEASES.
ANALYSIS AND PROBLEMS
D.B. Apostolova1, Z.D. Paskalev
2
1Medical University, Center of Occupational Diseases, Sofia, Bulgaria
2National Center of Radiobiology and Radiation Protection, Sofia, Bulgaria
Abstract
X-rays in medical diagnostic are the major source of bulgarian population exposure to ionizing radiations.
Diagnostic X-ray is the most diagnostic application and is used in wide variety of examination. The modern
concept for radiation protection of patients in diagnostic radiology is based on two main principles: justification
of the examinations and radiation protection optimization. It is pointed out that the collective effective dose of
radiation may be considerably reduced by decreasing the number of clinically unwarranted X-ray examination of
storage and delivery of diagnostic information and adopting a system for physical and technical quality control of
the X-ray equipment.
The aim of this investigation is assessment the collective effective doses for the patients with occupational
diseases, exposed to ionizing radiation by radiological diagnostics.
The study covers the period of 1990 through 1999. A total of 3293 patients, treated in Department of
occupational toxicology, Clinic of occupational diseases, Medical University- Sofia were examined with X-ray
and KT (cervical and lumbar spine, chest, skull, stomach, extremities, pelvis, brain). The most of the observed
patient were with heavy metals poisonings predominantly and a little with other chemical agents poisonings.
Number of patients with radiological examinations was 1938, number of examination per capita was 0,59 and the
total number of radiological examinations was 2536. The average number of radiological examination for one
patient was 1,36, the most number of radiological examination for one patient was 4. The collective effective
dose for an examined patient was 1803 man.mSv. Our results shown the essential of the raising ensure that the
medical exposure of patients be the minimum necessary to achieve the required diagnostic objective.
1. Introduction
In many branches of medicine, ionizing radiation is a powerful tool both as an aid to diagnosis
and a means of therapy. Diagnostic X-ray is the most familiar application and is used in wide
variety of examination. X-rays in medical diagnostic are the major source of bulgarian
population exposure to ionizing radiations. It has been estimated that over 90% of the total
exposure of the bulgarian population from uses of radiation comes from the diagnostic use of
X-rays [1,2,3].
There are two categories of biological effects of ionizing radiation: deterministic and
stochastic effects. For stochastic effects no threshold dose is assumed and the probability of
their occurrence is believed to the proportional to the dose (linear dose-effect relationship in
the low dose, low dose-rate range). The probability of a fatal radiation induced cancer has
been estimated at approximately 5 per cent per Sievert effective dose for the low dose, low
dose-rate and 1% for serious genetic diseases, for the whole population with is normal age
distribution. Many organs are believed to be sensitive to stochastic effects, notably the gonads,
female breast, bone marrow, lung, thyroid and bone surfaces [4,5,6].
The modern concept for radiation protection of patients in diagnostic radiology is based on
two main principles: justification of the examinations and radiation protection optimization. It
is pointed out that the collective effective dose of radiation may be considerably reduced by
decreasing the number of clinically unwarranted X-ray examination of storage and delivery of
diagnostic information and adopting a system for physical and technical quality control of the
X-ray equipment [7,9].

IAEA-CN-85-42
36
The aim of this investigation is assessment the collective effective doses for the patients with
occupational diseases, exposed to ionizing radiation by radiological diagnostics.
2. Materials and methods
The study covers the period of 1990 through 1999. A total of 3293 patients, treated in
Department of occupational toxicology, Clinic of occupational diseases, Medical University-
Sofia were examined with X-ray and CT. The examination considered: chest PA (posterior-
anterior) and LAT (lateral) projections, cervical spine AP (anterior-posterior) and LAT
projection, lumbar spine AP, LAT and LSJ (lumbo-sacral-joint) projection, skull- PA and
LAT, hand and wrist AP, pelvis AP, Ro-contrast stomach, CT brain. The most of the observed
patient were with heavy metals poisonings predominantly and a little with other chemical
agents poisonings.
For an assessment of the collective effective dose, the radiological examined patients were
distributed by age, number of radiological examinations, and structure of radiological
diagnosis.
Number of patients with radiological examinations was 1938, number of examination per
capita was 0,59 and the total number of radiological examinations was 2536.
3. Results and discussion
The number of treated patients, the number of patients with radiological examinations, the
total number of conducted radiological examinations, and the number of radiological
examinations for one patient, distributed by the observed years are shown in Table I.
Table I. Number of treated patients, patients with radiological examinations, total number of
conducted radiological examinations, and radiological examinations for one examined patient
Year Number of
treated patients
Number of
examination
patients
Number of
radiological
examinations
Number of
examinations for one
examined patient
1990 331 195 265 1,35
1991 342 202 273 1,35
1992 347 204 255 1,25
1993 335 189 246 1,30
1994 342 201 281 1,40
1995 348 202 272 1,35
1996 342 202 282 1,40
1997 338 201 251 1,25
1998 328 198 257 1,29
1999 246 153 214 1,39
Total 3299 1938 2596
The results in the Table I shows the average number of radiological examinations for one
examined patient was 1,36, the most number of radiological examinations for one patient was
4. The ratio (number of radiological examinations) / (number of treated patients) is 0,79.
The distribution of the treated patients by the age and sex for 1998 is presented in Table II.
The number of radiological examinations included in Table II consists only X-ray graphy as

IAEA-CN-85-42
37
there is unclear patient dose in X-Ray scopy because different time examinations. The
structure of radiological diagnosis, effective dose per one radiological examination – patient
dose Heff (mSv) and collective effective doses are presented in Table III.
Table II. Distribution of the number of treated patients by the age and sex for 1998
Age of
patients
Number of patients
attending hospital
Total Number of radiological
examinations
(X-ray graph)
Total Number of
examinations
for one patient
man woman man woman
18-25 8 3 11 2 - 2 0,18
26-45 105 43 148 51 34 85 0,58
46-55 100 38 138 42 51 93 0,67
56-60 16 6 22 6 3 9 0,41
>60 6 4 10 1 - 1 0,10
Total 235 94 328 102 88 190 0,58
Table III. Structure of radiological diagnosis, effective dose per one radiological examination –
patient dose Heff (mSv) and collective effective doses for 1998
Structure of radiological diagnosis Number of
radiological
examinations
Heff
(mSv)
Collective
effective doses
(man.mSv/y)
Ro-graphy: Chest- PA,
LAT
48
15
-total 63
0,08mSv
5,04
Cervical spine- AP,
LAT
48
12
-total 60
0,7mSv
42
Lumbar spine- AP,
LAT,
LSJ
19
2
2
-total 23
1,3mSv
29,9
Scull- PA,
LAT
20
9
-total 29
0,7mSv
20,3
Hand and wrist - AP 15 0,7mSv 10,5
Pelvis- AP 5 0,7mSv 3,5
Ro-contrast stomach 13 3,0mSv 39
CT brain 6 5,0mSv 30
Total 214 180,24
The data in Table II show the most number of the patients treated in clinical conditions are
between age range 26-45 and 46-55. The number of radiological examinations per capita
varied from 0,10 to 0,67, and the mean value was 0,58. The results in Table III for the
structure of radiological diagnosis show the most number of radiological examinations are for
the chest and cervical spine- 63 and 60 respectively.
For the investigation period (1990-1999) diagnostic medical exposure provides 0,54 mSv/y
average dose per patient.

IAEA-CN-85-42
38
4. Conclusions
The Bulgarian population exposure, presented as a mean annual effective collective doses,
amounts to: 20240 mSv/y from natural background, 6400 mSv/y from X-ray diagnostics; the
average effective dose from X-ray diagnostics- 0,34 mSv/y. Number of examination per capita
for Bulgarian population (period 1990-1995y) is 0,59 [8]. Worldwide, diagnostic medical
exposures provide 0,3 mSv/y average dose per capita [9].
The received doses from the patients with occupational pathology are more high than the
doses mentioned above. Our results shown the essential of the raising ensure that the medical
exposure of patients be the minimum necessary to achieve the required diagnostic objective.
References
[1] INTERNATIONAL ATOMIC ENERGY AGENCY, International Basic Safety
Standards for Protection Against Ionizing Radiation and for the Safety of Radiation
Sources, Jointly sponsored by the International Labor Organization, Food and
Agriculture Organization, Nuclear Energy Agency of the Organization,
FAO/IAEA/ILO/OECD-NEA/WHO; IAEA Safety Series No. 115, Vienna (1996).
[2] INTERNATIONAL COMMISSION ON RADIOLOGICAL PROTECTION,
Radiological Protection and Safety in Medicine, ICRP Publication 73, Annals of the
ICRP, Vol. 26/2, Pergamon Press, Oxford (1996).
[3] THE ROYAL COLLEGE OF RADIOLOGISTS, Making the best use of a department
of clinical radiology- Guidelines for Doctors. (Forth Edition). London: The Royal
College of Radiologists (1998).
[4] WORLD HEALTH ORGANIZATION, Effective Choices for Diagnostic Imaging in
Clinical Practice, Report of a WHO Scientific Group, Technical Report Series 795,
WHO, Geneva (1990).
[5] INSTITUTE OF PHYSICS AND ENGINEERING IN MEDICINE (IPEM), College of
Radiographers (CoR), Recommended Standards for the Routine Performance Testing of
Diagnostic X-ray Imaging Systems), National Radiological Protection Board (NRPB),
IPEM Report No.77 (1997).
[6] COUNCIL DIRECTIVE 97 / 43 / EURATOM of 30 June 1997 on Health Protection of
Individuals Against the Dangers of Ionizing Radiation in Relation to Medical Exposure
and Repealing Directive 84/466/Euratom; Official Journal of the European
Communities L180 / 22 (1997).
[7] EUROPEAN GUIDELINES on Quality Criteria for Diagnostic Radiographic Images;
Report EUR 16260 EN, DA, DE, ES, FR. GR, IT, NL, PO (1996).
[8] VASILEV, G., BAYRAKOVA, A., INGILIZOVA, H., HRISTOVA, M., KARADJOV,
A., Exposure of the Bulgarian Population from Natural and Manmade Ionizing
Radiation Source in the mid 90-ies, Roent. Radiol. 4 (1997) 14-18.
[9] RADIATION PROTECTION IN MEDICAL EXPOSURE, Safety Guide, Jointly
sponsored by IAEA, PAHO and WHO, Reproduced by the IAEA, Vienna, (1999).

IAEA-CN-85-47
39
PATIENT’S AND OCCUPATIONAL DOSE EXPOSURE IN
ROENTGEN EXAMINATIONS
L. Qafmolla
Institute of Nuclear Physics, Tirana, Albania
G. Shehi
University Hospital Center, “M. Theresa”, Tirana, Albania
Abstract
The study of roentgen exposure in diagnostics, is a constant obligation everywhere because: (a) the higher number
of people undergoing roentgen examination and (b) relative high exposure doses during examinations. We are
interested about exposure doses for patients and occupational staff only. Nevertheless, being linked with the main
goal of our paper: “exposure dose” we would give below the figures of frequencies for widely performed
examinations, just to calculate such parameters like mean exposure dose and collective effective dose.
The use of ionizing radiation in Albania is as follow: about 70% belong to the medical application and 30% to the
others, research, agriculture and industrial applications.
From the medicine uses 80% belong to the X-ray and 20% radioactive sources. The use of X-ray procedure in
medicine is 85% in diagnostic and 15% in radiotherapy.
In this way, the main field, which contribute of exposure doses for both, population and occupational staff in
Albania, is X-ray diagnostic irradiation. The amount of exposure dose as well as the collective dose coming up
from X-ray in diagnostic is about 75-80% of total value for above-mentioned parameter.
1. Introduction
The evaluations of exposure dose are given separately, for patients and occupational staff. From
these values of exposure dose, we tried an approach, through extrapolation for total exposure
dose coming up from all X-ray diagnostic examinations. For such evaluations (of patient doses)
we use the data carried out during 80-th in vitro and vivo with TLD, furnish by IAEA and EC,
as well as the data performed with PMX-meter.
We have discussed about most widely used examinations as: chest and stomach fluoroscopic
procedures, skeleton and head & neck radiographs, which have the frequencies of 307,20,140
and 50 exposure/year/100 inhabitants respectively.
The justification and optimization principles as the main principles in radiation protection field
have been in our consideration during X-ray examination [1]. The number of diagnostic X-ray
examinations in Albania has not increased significantly in recent years.
UNSCEAR (United Nations Scientific Committee on the Effects of Atomic Radiation)
recommends regular surveys of the number of X-ray examinations in order to study the trends
and differences in the use of radiation between different countries. Changes in the distribution
of X-ray examinations contribute to changes in the collective dose of the population [1, 2].
2. Material and methods
Actually, the individual monitoring (workers+patients) has been performed, during our study
with TLD-100 cards, given by IAEA, which control was established already.
Every month, the Personal Dosimetry Division in Institute of Nuclear Physics (INP) distributes
about 300 pieces of TLD-100 cards to measure the effective dose of employees at the nuclear
facilities in Tirana city. We tried to extents the personnel, patients and population control by

IAEA-CN-85-47
40
TLD-s cards in some other cities of Albania, for instance in Durres, Korça, Shkodra cities, we
have three months control only.
Table la. Frequency / 1000 inhabitants / year in vitro examinations
GRAPHIES FLUOROSCOPIES
Head &
Neck
Chest
Abdomen
Pelvis
Extremities
Chest
Stomach
50 60 10 20 50 307 20
For these measurements we have used the Harshaw TLD-s. For each type of examination we performed
at least 8 sets of measurements, and for each set we have used10-15TLD-s.
Table lb. Frequency / 1000 inhabitants / year in vivo examinations
GRAPHIES FLUOROSCOPIES
Head &
Neck
Chest
Abdomen
Pelvis
Extremities
Chest
Stomach
42 45 10 17 52 280 15
The most significant contribution to the radiation dose to population is mainly due to in vivo
examinations. While results in table lc shown the figure of the mean annual effective dose for
occupational staff of Tirana City during 1997,1998, 1999 years [3].
Table lc. Mean Annual Effective Dose of occupational Staff in Tirana city
No Mean Annual Effective Doses ( mSv )
Occupational Practices 1997 1998 1999
1 HOSPITAL No. 1 3.45 3.50 2.95
2 Ptisio-Pneumology Hospital 3.40 3.90 4.30
3 Dispensary anti TBS 4.60 4.55 4.45
4 Nuclear Medicine 3.39 4.65 4.20
5 Regional Polyclinic No. 2 4.65 4.80 4.85
So, for instance to keep the exposure dose for chest fluoroscopy, we have measured 10 different
patients, and to each patient we put on the skin surface of chest size 15 TLD-s, as well as about
10 TLD-s in other points outside of chest size, like gonads, eyes, etc.
A set of output X-ray beam’s tube, without patient, at the same conditions (RV; mAs; source-
skin-distance; beam aperture) were performed with ionizing chamber to verify the values of
exposure doses measured by TLD-s.
The last one were carried out with universal dosimeter+ionizing chamber of appropriate
volume, HVL etc. [2, 4].
In table 2a is show an example of output verification for beam used in chest fluoroscopy
(85 Rv; 1.3 mA).

IAEA-CN-85-47
41
Table 2a. Output verification for beam in chest fluoroscopy (85 RV; 1.3 mA)
Exposure
time (sec).
15 10 18 30 20 24 30 20
Measure
by TLD
(mGy)
9.5 8 10 17.2 15 19.3 22.1 14
Tubeo
output
values
mAs
0.48 0.61 0.42 0.44 0.58 0.61 0.54 0.52
Measure
by
ionizing
chamber
mGy
11.5 9.4 14.2 23.7 15.7 18.9 23.2 15.7
Tube
output
measured
ionizing
chamber
mAs
0.59 0.72 0.61 0.61 0.60 0.60 0.62 0.61
The figure in third and fifth rows represents the tube output values (mAs), while in the last
column is shown the mean values of each one set. The difference of those in percentage is about
11%; which is a good agreement between two sets.
The exposure doses, in average values, calculated for 8-15 examinations of each type are shown
in table 2b.
Table 2b. The values of exposure doses for different examinations (mRem)
GRAPHIES FLUOROSCOPIES
Methods
Head &
Neck
Chest
Abdome
n
Pelvis
Extremit
ies
Chest
Stomach
TLD-s 140 (15) 50 (15) 650 (10) 820 (12) 20 (15) 112 (20) 200 (9)
Ionizing
Chamber
60 (15) 52 (12) 500 (10) 900 (12) 30 (15) 136 (20) 300 (9)
The values in brackets showed the number of measurements for a given type of examinations.
The set b (in vivo) of measurements was carried out for different examinations with Harshaw
TLD-s with parallel with TLD furnish by EC. Furthermore were done directly the
measurements of different beam’s output with PMX-meter.
The agreement between both sets a (in vitro) and b (in vivo) of measurements is quite good
within the limits of fluctuation down by the differences of parameters used for the same type of
examinations in different X-ray machines. In table 2c are shown the average values of beam
output per 1 mAs for different X-ray machines and different types of examinations.

IAEA-CN-85-47
42
Table 2c. Average values of beam output in mRem / 1 mAs
Methods GRAPHIES FLUOROSCOPIES
Chest +
Abdomen
Abdomen +
Pelvis
Head +
Neck
Chest
Stomach
TLD-s 60 100 80 65 95
Beam output 70 105 77 75 100
3. Results
The main goal of our study is to calculate the mean exposure dose per capita-year of population.
Our results are extrapolate to whole population because:
�� The frequency of X-ray diagnostic exposure for above-mentioned examinations is high (the
average value of la and lb figures is about 500 examinations / 1000 inhabitants/Year and
adding to this value those of other types of examinations, not included in our paper, the
frequency will be more than 750 for patient examination. It means that the “Patient
Group” is almost equal with “Whole Population Group”.
�� Taking into account, X-ray biologic damages, we need to have common average level of
irradiation for whole population, where in this case are included and occupational staff, who
are working in ionizing radiation field too.
So, from the point of view of common average level in table 3, represents the average values
for each type of examination carried out from tables 2a; 2b as well as from all TLD-s
measurements.
Table 3. The average values of exposure dose for different examination (mRem)
GRAPHIES FLUOROSCOPIES
Head +
Neck
Chest
Abdomen
Pelvis
Chest
Stomach
Average
values of
exposure
dose
193
53
612
800
227
464
Frequency 51 46 53 10 294 18
Exposure
dose/capita
3.8 1.15 11.55 80 0.8 25.8
The annual exposure dose per capita, given from patient’s examinations is about 62.64 mRem
(0.6264 mGy) and about 0.5123 for occupational staff.
4. Discussions
The examination groups, patients and occupational staff, studied in our paper, excluding the
pelvic and abdominal part of skeleton, have a limited contribution to the annual exposure dose.
The above-mentioned values (0.6264 mGy) for patients and (0.6123 mGy) for occupational
staff, have represented about 45-50% of total exposure dose coming up from X-ray diagnostic
examinations.

IAEA-CN-85-47
43
Our results are in a good agreement with those of our European colleagues, in which for groups
of examinations like: the CT, Barium Enema, and Double Contrast, Lumper Spine, Carotit
Angiography and Intestinal Transit, the contribute to the annual exposure dose per capita, is
greater (about 66%) than our case [1, 2].
Consequently the annual exposure dose in Albania, result more than 1.2 mGy/year per capita.
References
[1] Ranniko, S., Karila, K., “Patient and Population dose of X-ray diagnostic in Finland”,
Helsinki 1997, 21-24 pp.
[2] Document of NRPB-R201 “An update on the frequency of Medical and Dental
Examination in GB-1983”, 8-11 pp.
[3] National Registry for exposure doses of Occupational Staff of Tirana City (1997, 1998,
1999).
[4] Rantanen, E., “Radiation Practices”, Annual Report 1998, 1999, Finland 8, 10, 13 pp.

IAEA-CN-85-81
44
INDONESIA’S EXPERIENCE WITH IAEA-CRP* ON
RADIATION PROTECTION IN DIAGNOSTIC RADIOLOGY
Nasukha
National Nuclear Energy Agency of Indonesia (Batan), Jakarta, Indonesia
Abstract
IAEA-CRP on Radiation Doses in Diagnostic Radiology and Methods for Dose Reduction has been participated
by some Asian and East European countries. Indonesia is one of participants that followed the IAEA program.
This paper is not disscuss of CRP-results since it will be published on TECDOC soon. But the work on
evaluation of examination frequencies, film reject rate analysis, patient dose measurements, image quality before
and after Quality Control (QC) and QC itself gave some experiences to investigator to be explored and presented.
Experiences could be in form of problems, how to solve problems and some suggestions. Started from no QC up
to complicated QC to be face on conventional radiography to CT-scan and fluoroscopy units. These valuable
experiences of Indonesia are proven exercise of IAEA-CRP as a good start for next CRP or national projects in
diagnostic radiology.
1. Introduction
The Indonesia as a developing country with population of more than 200 million people have
many problems on radiology diagnostic services. It is not only facilities, but also human
resources to serve of about 100 million people if approximately 50 percent of population
occupy this health service. The number of x-ray diagnostic machines nationally is only about
1197 units that spread to the whole country which have of about 5000 islands. Quality of
services is very important one to success the aim of diagnoses.
Two well known International agencies that concern radiological health care all over the world
are World Health Organization (WHO) and International Atomic Energy Agency (IAEA).
WHO activities on radiological health care for Member states assist in developing a policy of
services through publication, experts adviser and training for increase knowledge and skill
human resources [1]. On the other hand, IAEA seek to accelerate and enlarge the contribution
of atomic energy to peace, health and prosperity through the world [2]. Indonesia as a Member
of both WHO and IAEA, is always participated their activities.
The International Commission on Radiological Protection (ICRP) published recommendation
concerning the radiation protection in diagnostic radiology is an ideal concept that it is not a
simply practical implementation. Optimization needs more efforts to success radiation
protection in diagnostic radiology that is more attention on daily practices.
A Coordinated Research Program (CRP) on assessment of radiation doses in diagnostic
radiology and studying methods for reduction was firstly started in IAEA Member States in
cooperation with the Commission of the European Communities (CEC) [3]. A second CRP-
IAEA that Indonesia is one of the nine Asian country regionally participated on Radiation
Doses in Diagnostic Radiology and Methods for Dose Reduction Project. There were two
phases to complete the project, which were Conventional radiography for the first phase and
Flouroscopy and CT-scan for the second.
* IAEA-CRP is International Atomic Energy Agency-Coordinated Research Project.
IAEA-CN-85-81
45
The Technical Assistance (TA) has been planned to develop quality assurance program on
medical application of ionizing radiation nationally, especially in diagnostic radiology. A
scenario has planned on 1993 to develop a quality assurance program as required for
radiodiagnostic examination in Indonesia for some hospitals. The action plan of the idea was
performed through technical cooperation of International Atomic Energy Agency (IAEA). The
National Workshop on Quality Assurance and Radiation Protection in Diagnostic Radiology
was dedicated to radiologist, radiographers and medical phycisists on 1994. The workshop
was organized by our institution joint with Radiologist’s society and one of the hospitals that
participated on the project. Introducing and understanding of radiation protection optimization
in diagnostic radiology has been given on lectures by some international experts. Practical
sessions were also organized on the last day of five day’s workshop.
2. Basic understanding of the project
It is necessary to participants of the CRP’s to understand the main objective of project,
especially for investigators. Fundamental basis of radiation protection in diagnostic radiology
on The International Basic Safety Standards for Protection against Ionizing Radiation and for
the Safety of Sources (BSS) needs more elaborations. Optimization of radiation protection by
means a quality assurance program and dose reduction methods is also necessary to elaborate
practically for them. Thinking separately of dose reduction to patients without inherently
improvement of image quality is not satisfactory for optimization in protection radiation.
However, this is not simple to be implemented on daily practices.
3. Selection of hospitals
The project should participate one major hospital and three satellite hospitals. Before choosing
hospitals that participated the project, investigators should have data for number of patients,
type of examination - projection and facilities those hospitals. Unless the project will not
complete as the schedule time.
�� Number of patients and type of examinations
Eight x-ray projections that selected on the project were chest PA and lateral, LS-AP, LSJ (L5-
S1) lateral, pelvis AP, skull Pa and lateral. Problems arrive from number of patients. Each
hospital has own number of patients, as an example the major hospital recorded daily
minimum and maximum patients for chest PA respectively were 34 and 71 patients. While the
satellite hospital, 10 and 30 patients for daily minimum and maximum patients respectively. It
was seen that the daily maximum number of patients at satellite hospital to be the daily
minimum number of patients of the major hospital. This number affects to percentage of reject
film statistically. Next experience was founded when evaluation to be done for limited (less) -
not many patients (examination) such as skull PA on the satellite hospital and LS lateral for
the other satellite hospital.
The above problems were not only for film reject analysis, but also for patient dosimetry
measurements. To complete 10 patients of weight 65� 10 kg to 8 type examination may be
require more than scheduled time. So that, some satellite hospitals could not complete and
continued for patient dose measurements, moreover it will be automatically a evaluation of
image quality problem.

IAEA-CN-85-81
46
It seems that the number of patients and type of examination (8 x-ray projections) for he first
phase of IAEA-CRP could not perfectly be completed on the schedule time as it was planned
before. Three satellite hospitals were targeted to participate and complete the IAEA-CRP, two
hospitals were dropped. It was just because of limited the number of patients for some type
examinations. Solution could be done by choosing satellite hospitals on the other city to get
enough number of patients of some type examinations, like Bandung, Semarang or Surabaya
cities. However, the other problems will occur from transportation and coordination when the
action plan to be implementation.
Next experiences happened when second phase project started. Selection of hospitals on the
first phase based on feasibility study of conventional radiography. The hospitals that
participated on first phase, it would be possible to continue their participation on second
phase. Actually, fluoroscopy units on the hospitals that participated on first phase were not as
many as required. Alternative hospital should be participated to fulfil the second phase of
project. Since difficulties on the target of patient weight on the first phase, so the second phase
patient weight was lowered to be 60� 10 kg. Due to limited patients on CT chest examination
and standard QC CT-phantom, Indonesia could not complete this part.
�� Facilities and equipment used
Number of patient consideration when choosing hospitals is not enough without take account
facilities - equipment used on hospitals. Minimum performance criteria of the facilities and
equipment should be have to success the IAEA-CRP. Choosing facilities - equipment to be
used for IAEA-CRP will affect to daily schedule hospitals if unusual facilities alter their
functions, such as a x-ray unit used to LS examination than change of function to chest
examinations.
Problems come out after the units were evaluated for QC. The condition of unit is less
possible to get good image and low doses, such as not possible to reach high kVp and the
stability of unit. This is happened at major hospital. By this experience, minimum requirement
of facilities and equipment should be identified before IAEA-CRP to be done. These are not
only performances of facilities and equipment, but also the possibility to increase image
quality and to minimize doses.
TLD reader as a basic equipment of patient dose measurements could not work perfectly.
Unfortunately, it could not be repaired soon. That was happened for 4 months. New reader
was prepared to solve this problem. Meaning that on this IAEA-CRP, two TLD readers were
used. Another experience according to TLD was loss TLD materials, since it were brought by
patients. Two problems come out for dose patient measurement of fluoroscopy examination,
one from limited of patient number then second from dosemeter. Patient dose measurement of
fluoroscopy examinations is dependent on Dose Area Product (DAP) dosemeter.
4. Conclusion
IAEA-CRP need more efforts, such as understanding of concept as the whole, feasibility study
of condition participants (number of patients, type of examinations, facilities and equipment
used) that carry the project. Project like IAEA-CRP on Radiation Protection in Diagnostic
Radiology practically is not simple to be implemented to whole hospitals nationally. This
experience might be useful for institutions or organizations that offers grants. Support from
government or such international organizations is very helpful to run quality control program.

IAEA-CN-85-81
47
Acknowledgements
The author is grateful to all hospitals involved and for help and assistance from the staffs. The
author also wishes to thank to IAEA that allowed Indonesia to participate on CRP on
Radiation Protection in Diagnostic Radiology.
References
[1] G Hanson, WHO and rational reduction of pateint dose, Radiation Protection
Dosimetry, 57 (1995) 27-32.
[2] Modupe Oresegun, et al. Radiation protection and quality assurance in diagnostic
radiology - an IAEA coordinated research project in Asia and Eastern Europe, Applied
radiation and Isotopes, 50 (1999) 271-276.
[3] IAEA-TECDOC-796. Radiation Doses in diagnostic radiology and methods for dose
reduction. IAEA. 1995.

IAEA-CN-85-99
48
RADIATION PROTECTION OF PATIENTS IN
GENERAL DIAGNOSTIC RADIOLOGY IN LITHUANIA
G. Morkunas, J. Ziliukas
Radiation Protection Centre, Vilnius, Lithuania
Abstract
The situation in control of exposure due to general diagnostic radiological examinations in Lithuania is
described. Experience in creation of legal basis for radiation protection, results of measurements of patients'
doses and quality control tests of x-ray units are given. The main problems encountered in implementation of
international recommendations and requirements of European Medical Exposure Directive are discussed.
1. Introduction
Lithuania with 3.7 million of population has more than 1100 diagnostic x-ray machines.
According to the UNSCEAR classification Lithuania is in the group of states of health care
level I. More than 2 million of x-ray examinations are being performed each year. It indicates
that medical exposure due to diagnostic radiology is the important source among all the other
sources. Individual doses to patients in some cases may be rather high, because units older that
20 years are still in operation. It is evident that control of doses to patients and their radiation
protection are very important.
2. National requirements for radiation protection in medicine
Development of the legal system was started in 1996 with adoption of the Lithuanian
Hygienic Norm HN 73-1997 Basic Standards of Radiation Protection. Three international
documents [1-3] were taken for a basis of this Hygienic Norm. Specific hygiene norms on
radiation protection in x-ray radiology, nuclear medicine and radiation protection have been
adopted later.
General principles of radiation protection of patients (justification of medical exposure,
optimization of radiation protection) are to be followed in all the fields of medical
applications of radiation including diagnostic radiology. Medical exposure may be applied
only in case the patient has a prescription for this procedure. Medical practitioner is
responsible for radiation protection of individual patient. Special measures shall be taken to
protect the pregnant women.
Guidance levels of dose for diagnostic radiography are established. The levels recommended
in the BSS [1] are taken as a basis for the guidance levels. Some modifications of these levels
are based on results of measurements of patients' doses. These modifications recommend
higher entrance surface doses than doses, given in [1].
Criteria of acceptability of performance of diagnostic x-ray units as established by EC [4 were
taken. Results of pilot tests of quality control of x-ray units were used for establishment of
these criteria. These results showed that the significant part of old x-ray units can not meet
some of the recommended criteria. For this reason exceptions are applied to units which are
manufactured before January 1st of 1997. The exceptions are for such parameters as the
maximum dose rate at the entrance screen of conventional image intensifier (1.6 �Gy/s.
instead of recommended 0.8 �Gy/s.), minimum operating tube voltage of dental units (45 kV

IAEA-CN-85-99
49
instead of 50 kV), deviation of exposure time from set values, some features of automatic
exposure control. Such approach allows use of available x-ray units without major
reconstruction of them. In many cases this reconstruction is not possible nor feasible.
Two particular problems should be mentioned. One of them is connected with the requirement
of the BSS [3] on not to use fluoroscopy units without image intensifier. There are such units
still available in Lithuania. Lithuanian Hygiene Norm on radiation protection in x-ray
radiology does not allow use of such units after the January 1st of 2002. This deadline is 2
years later than the deadline determined by the Medical Exposure Directive. It is connected
with the restricted financial possibilities of the state.
Photofluorography units are still used in Lithuania, mainly for screening purposes. More than
100 examinations are being performed each year per 1000 population. Higher doses and
poorer image quality are the reason for abandoning of this type of procedure in many
countries. The complicated tuberculosis situation in Lithuania requires chest examinations,
and not always conventional x-ray units are available. Investigation of justification of this type
of examinations has been started. It will be basis for taking decision about expedience of
photofluorography.
The experience from creation of legal basis shows that close co-operation between regulatory
authority and interested health care institutions and availability of results of actual
investigations of patients' doses, quality control of radiological equipment may be helpful in
creation of effective legislation.
3. Doses to patients
RADOS TLD system is used for measurements of patients' doses. Measurements are
performed in randomly selected x-ray departments all around Lithuania. LiF pellets without
slide holders in black bags are taped on the skin of the patient in the centre of x-ray field in the
direction to the x-ray tube. Sex of patient, his/her weight, height and thickness in the centre of
x-ray field, exposure parameters such as kVp, mA or mAs, size of x-ray field, focus-film
distance, total filtration are written down in the special protocols. Since there is a shortage of
standard size patients, doses to all the patients available during period of measurements are
recorded. The average weight of patients in different departments was (66�12) to (77�18) kg
(95% of confidence). It indicates that if a number of patients is not large enough, differences
in their weights are not essential.
The results of measurements are presented in Fig. These results show that in some hospitals
the reference levels, established by the Lithuanian Basic Safety Standards are exceeded more
than 2 times. It indicates that these levels should be reviewed. New reference levels at the 75th
percentile of measured doses should established [5]. For this reason the trial which includes
larger number of hospitals of different level is about to started.
The effective doses due to the chest (PA) examinations have been calculated using [6]. The
distribution of doses is log normal, with the maximum at 0.2 mSv. The average of effective
dose received during chest PA examinations is (0.06�0.02) mSv.
The average effective dose received during photofluorography in two hospitals was
(0.32�0.10) mSv per image. It should be pointed out that averages of effective doses in these

IAEA-CN-85-99
50
hospitals are rather different - (0.46�0.14) and (0.14�0.03) mSv per image. These results
show, that the risk/benefit analysis of such type of examinations shall be performed though
not only doses but quality of image should be taken into account.
C h e s t , P A
0
0 ,5
1
1 ,5
2
2 ,5
3
1, R
UM
20
3, D
iagn
omax
3, S
iem
ens
6, E
DR-7
50B A
ll
Guida
nce
L u m b a r s p in e , L A T
0
1 0
2 0
3 0
4 0
5 0
6 0
7 0
1, R
UM
20
2, R
UM
20
3, D
iagn
omax
4, O
ptim
us P A
ll
Guida
nce
L u m b a r s p in e , L S J
0
2 0
4 0
6 0
8 0
1 0 0
1 2 0
1 4 0
1, R
UM
20
2, R
UM
20
3, D
iagn
omax
4, O
ptim
us P
5, T
UR D
800 A
ll
Guida
nce
Lumbar spine, AP
0
5
10
15
20
25
30
1, RUM 20 All Guidance
Fig. Results of measurements of patients’ entrance surface doses (in mGy) in different
departments using different x-ray equipment (indicated). Error bars are for 95% of
confidence
4. Performance of x-ray units
Quality control of x-ray machines is performed with the help of PMXIII by RTI Electronics.
143 units were checked in 1998, 150 - in 1999. In 2000 this number increased because quality
control became a condition for licensing. The results of these tests are presented in the Table.

IAEA-CN-85-99
51
Table. Results of quality control of diagnostic x-ray units
Checked Did not pass Fixed Not fixed
Dental units 142 4 3 1
Portable units 59 5 3 2
Conventional units 85 25 24 1
Mammography units 7 0 0 0
Photofluorography units 28 5 5 0
Angiography units 2 0 0 0
Total 323 39 35 4
Most frequently x-ray units do not pass tests because of problems with high voltage generator
(poor waveform), too low x-ray tube voltage, dose linearity and timer accuracy. Dose
repeatability and too low voltage are the main problems in dental x-ray units during
acceptance testing.
It is seen that quality control is the powerful tool in improving of performance of x-ray units.
Nearly 90% of units were successfully repaired. On the other hand, even new dental units do
not pass testing. It shows the importance of acceptance testing.
5. Conclusions
During the last 5 years Lithuania is making intensive efforts in improving of radiation
protection of patients. International recommendations and requirements of European
Directives is the powerful moving force. However, many radiologists are used to very
prescriptive system, which was in force until the beginning of 90s. The lack of qualified
experts is to be mentioned on this occasion. It results in very heavy workload of regulatory
authority, which should perform calculations of shielding thickness, quality control tests,
measurements of dose rate in workplaces.
On the other hand, the Radiation Protection Centre shall collect the most recent information
on operational radiation protection in order to prepare the effective standards, rules and
recommendations. These documents shall be drafted in close co-operation with radiologists,
radiation protection advisers, hospital physicists. However, it remains the problem. Hospital
radiation workers are not motivated to take part in drafting of these documents, even in
discussions of drafts.
Quality assurance remains the very sensitive point in the whole system of the patient radiation
protection. Hospitals are trying to rely on results of annual quality control checks, performed
by the Radiation Protection Centre and other organizations. Everyday control of developing
process, analysis of image quality should be introduced.
References
[1] International Basic Safety Standards for Protection against Ionizing Radiation and for
the Safety of Radiation Sources, Safety Series No.115, IAEA, Vienna, (1996).
[2] Council Directive 96/29/Euratom of 13 May 1996, laying down Basic Safety Standards
for the Protection of the Health of Workers and the General Public against the dangers
arising from Ionizing Radiation, Official Journal of the European Communities L159
(1996) 1-114.

IAEA-CN-85-99
52
[3] Council Directive 97/43/Euratom of 30 June 1997 on health protection of individuals
against the dangers of ionizing radiation in relation to medical exposure, and repealing
Directive 84/466/Euratom, Official Journal of the European Communities L180 (1997)
22-27.
[4] European Commission. Criteria for acceptability of radiological (including
radiotherapy) and nuclear medicine installations. Radiation Protection 91, Directorate-
General Environment, Nuclear Safety and Civil Protection, Luxembourg (1997).
[5] European Commission. Guidance on diagnostic reference levels (DRLs) for medical
exposures. Radiation Protection 109, Directorate-General Environment, Nuclear Safety
and Civil Protection, Luxembourg (1999).
[6] HART, D.; JONES, D.G.; WALL, B.F. Estimation of effective dose in diagnostic
radiology from entrance surface dose and dose-area product measurements. NRPB-
R262, National Radiological Protection Board, (1994).

IAEA-CN-85-105
53
DOSES TO PATIENTS FROM DIAGNOSTIC RADIOLOGY IN ROMANIA
O. Iacob, C. Diaconescu
Institute of Public Health and Medical Research, Iasi, Romania
Abstract
Effective doses to over 2400 patients undergoing 20 most important types of X-ray examinations have been
estimated from entrance surface doses or dose-area products, measured in 27 X-ray departments, and the
appropriate conversion coefficients calculated by the NRPB for six mathematical phantoms representing 0, 1, 5,
10, 15 year old children and the adult. The patient-weighted mean effective dose from X-ray examinations
performed annually in Romania is 1.32 mSv, with 1.40 mSv for the average adult patient and 0,59 mSv for the
average paediatric patient. The corresponding annual collective effective dose is about 13,430 manSv, with the
main contribution belonging to adult patients (95%), the remainder of 5 percent – to paediatric patients.
1. Introduction
Diagnostic radiology represents throughout the world the largest manmade source of public
exposure to ionising radiation. In Romania, on our last estimate, its contribution to the annual
collective effective dose from artificial radiation sources is about 90 percent [1].
The present work intended to update the magnitude of patient exposure (children and adults)
during conventional diagnostic X-ray examinations performed annually in Romania.
2. Methods
Individual effective doses to over 2400 patients undergoing 20 most frequently performed
types of X-ray examinations at 27 diagnostic X-ray departments have been derived from
entrance surface dose (ESD) measured with TLD-100 thermoluminiscent dosemeters directly
stuck to the patient’s skin or dose-area product(DAP) measured by a Diamentor transmission
ionisation chamber attached to the diaphragm housing of the X-ray set [2]. Appropriate
conversion coefficients, calculated by the NRPB using Monte-Carlo techniques on a series of
6 mathematical phantoms representing 0, 1, 5, 10, 15 year old children as well as the adult,
have been applied [3, 4].The age-dependent frequencies of X-ray examinations necessary for
the annual collective effective dose and the average patient effective dose calculation are those
reported by our last national study on medical exposures, published in the UNSCEAR-2000
Report [5].Measurements have been carried out from July 1997 to July 2000 and all
dosemeters have been calibrated at WHO Regional Reference Centre for Secondary Standard
Dosimetry, Bucharest, Romania.
3. Results
Tables I–VI summarise the results of our survey on patient exposure during X- ray
examinations in terms of Dose-Area Product (DAP), Entrance Surface Dose (ESD) and
effective dose per examination.
Table VII presents the patient-weighted effective doses per examination and the annual
collective effective doses received by patients as a result of one year of diagnostic
conventional X-ray examinations in Romania. The values are of 1.32 mSv from all medical
exams and 13,432 manSv for collective dose.
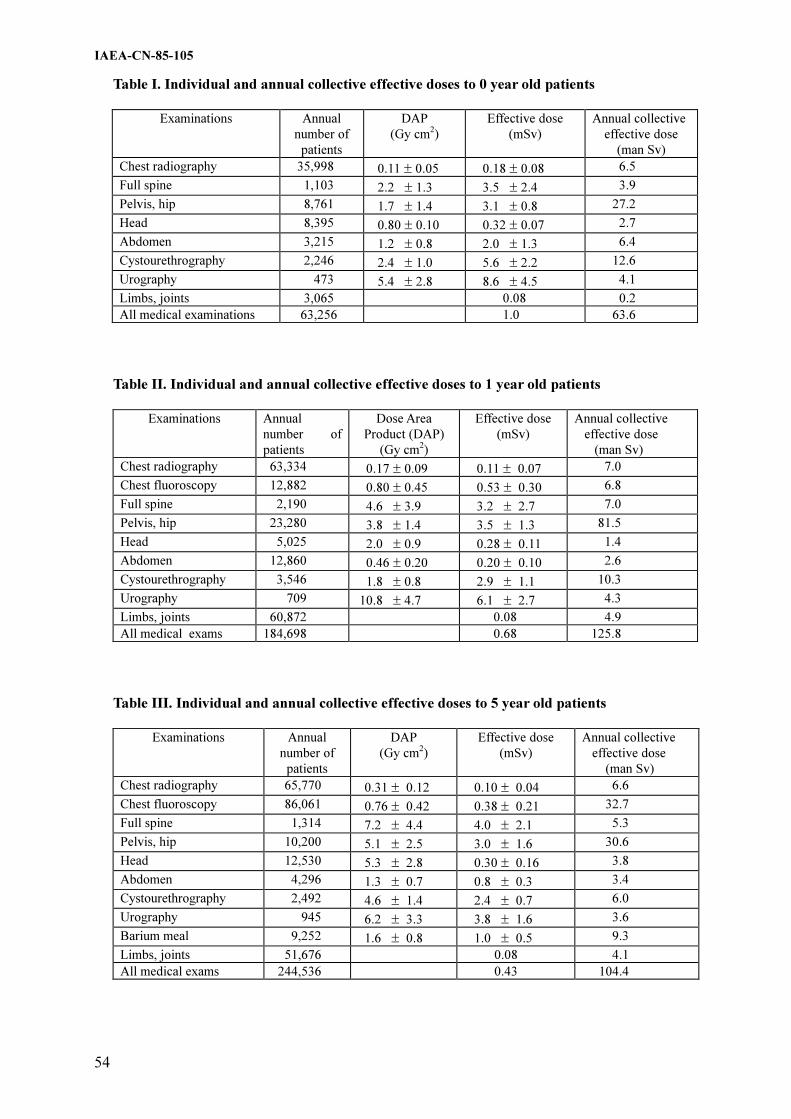
IAEA-CN-85-105
54
Table I. Individual and annual collective effective doses to 0 year old patients
Examinations Annual
number of
patients
DAP
(Gy cm2)
Effective dose
(mSv)
Annual collective
effective dose
(man Sv)
Chest radiography 35,998 0.11 � 0.05 0.18 � 0.08 6.5
Full spine 1,103 2.2 � 1.3 3.5 � 2.4 3.9
Pelvis, hip 8,761 1.7 � 1.4 3.1 � 0.8 27.2
Head 8,395 0.80 � 0.10 0.32 � 0.07 2.7
Abdomen 3,215 1.2 � 0.8 2.0 � 1.3 6.4
Cystourethrography 2,246 2.4 � 1.0 5.6 � 2.2 12.6
Urography 473 5.4 � 2.8 8.6 � 4.5 4.1
Limbs, joints 3,065 0.08 0.2
All medical examinations 63,256 1.0 63.6
Table II. Individual and annual collective effective doses to 1 year old patients
Examinations Annual
number of
patients
Dose Area
Product (DAP)
(Gy cm2)
Effective dose
(mSv)
Annual collective
effective dose
(man Sv)
Chest radiography 63,334 0.17 � 0.09 0.11 � 0.07 7.0
Chest fluoroscopy 12,882 0.80 � 0.45 0.53 � 0.30 6.8
Full spine 2,190 4.6 � 3.9 3.2 � 2.7 7.0
Pelvis, hip 23,280 3.8 � 1.4 3.5 � 1.3 81.5
Head 5,025 2.0 � 0.9 0.28 � 0.11 1.4
Abdomen 12,860 0.46 � 0.20 0.20 � 0.10 2.6
Cystourethrography 3,546 1.8 � 0.8 2.9 � 1.1 10.3
Urography 709 10.8 � 4.7 6.1 � 2.7 4.3
Limbs, joints 60,872 0.08 4.9
All medical exams 184,698 0.68 125.8
Table III. Individual and annual collective effective doses to 5 year old patients
Examinations Annual
number of
patients
DAP
(Gy cm2)
Effective dose
(mSv)
Annual collective
effective dose
(man Sv)
Chest radiography 65,770 0.31 � 0.12 0.10 � 0.04 6.6
Chest fluoroscopy 86,061 0.76 � 0.42 0.38 � 0.21 32.7
Full spine 1,314 7.2 � 4.4 4.0 � 2.1 5.3
Pelvis, hip 10,200 5.1 � 2.5 3.0 � 1.6 30.6
Head 12,530 5.3 � 2.8 0.30 � 0.16 3.8
Abdomen 4,296 1.3 � 0.7 0.8 � 0.3 3.4
Cystourethrography 2,492 4.6 � 1.4 2.4 � 0.7 6.0
Urography 945 6.2 � 3.3 3.8 � 1.6 3.6
Barium meal 9,252 1.6 � 0.8 1.0 � 0.5 9.3
Limbs, joints 51,676 0.08 4.1
All medical exams 244,536 0.43 104.4

IAEA-CN-85-105
55
Table IV. Individual and annual collective effective doses to 10 year old patients
Examinations Annual
number of
patients
DAP
(Gy cm2)
Effective dose
(mSv)
Annual collective
effective dose
(man Sv)
Chest radiography 58,192 0.57 � 0.20 0.12 � 0.04 7.0
Chestphotofluorography 12,442 1.1 � 0.4 0.26 � 0.10 3.2
Chest fluoroscopy 77,565 1.2 � 0.80 0.38 � 0.25 29.5
Full spine 2,628 13.5 � 5.3 5.3 � 1.8 13.9
Pelvis, hip 13,080 22.0 � 7.0 3.6 � 1.2 47.1
Head 11,702 6.8 � 2.2 0.34 � 0.12 4.0
Abdomen 3,190 3.9 � 2.2 1.2 � 0.7 3.8
Cystourethrography 516 14.5 � 5.3 2.5 � 0.9 1.3
Urography 1182 14.1 � 9.0 4.2 � 2.7 5.0
Barium meal 10,453 3.8 � 1.9 1.6 � 1.0 16.7
Limbs, joints 54,741 0.08 4.4
All medical exams 245,691 0.55 135.9
Table V. Individual and annual collective effective doses to 15 year old patients
Examination Annual
number of
patients
DAP
(Gy cm2)
Effective dose
(mSv)
Annual collective
effective dose
(man Sv)
Chest radiography 47,365 0.73 � 0.21 0.13 � 0.04 6.2
Chest photofluorography 49,769 2.9 � 0.6 0.40 � 0.10 19.9
Chest fluoroscopy 97,572 1.8 � 1.1 0.33 � 0.25 32.2
Spine - lumbar
- cervical
10,283
11,437 18.8 � 7.1
2.4 � 1.3
4.5 � 1.9
0.57 � 0.32
46.3
6.5
Pelvis, hip 7,260 23.5 � 10.3 3.4 � 1.5 24.7
Head 25,950 6.1 � 2.7 0.21 � 0.11 5.4
Abdomen 2,161 3.8 � 1.2 0.85 � 0.27 1.8
Cystography 194 20.4 � 6.4 2.2 � 0.7 1.4
Urography 1418 21.4 � 11.5 4.8 � 2.6 6.8
Barium meal 20,346 8.4 � 5.1 2.1 � 1.1 42.7
Limbs, joints 48,610 0.08 3.9
All medical examinations 322,365 0.61 196.8

IAEA-CN-85-105
56
Table VI. Annual individual and collective effective doses to adult patients undergoing some
conventional X-ray examinations
Examination Annual number
of patients
ESD
(mGy)
Effective dose
(mSv)
Annual collective
effective dose (manSv)
Chest radiography 943,059 2.4 � 1.0 0.25 � 0.11 235.8
Chest photofluorography 2, 330,493 5.9 � 2.8 0.63 � 0.30 1468.2
Chest fluoroscopy 2, 263,700 13.4 � 5.6 0.95 � 0.40 2150.5
Spine - lumbar
- thoracic
- cervical
224,849
75,151
196,513
51.3 � 24.0
29.5 � 14.1
10.3 � 4.9
3.0 � 1.4
2.1 � 1.2
0.21 � 0.1
674.5
157.8
41.1
Pelvis 195,708 17.1 � 9.4 2.9 � 1.6 567.6
Hip 69,761 19.2 � 5.6 1.7 � 0.5 118.6
Head 390,695 20.0 � 14.1 0.17 � 0.12 66.4
Abdomen 312,728 19.3 � 10.3 1.9 � 1.0 594.1
Barium meal 986,902 55.2 � 25.6 4.1 � 1.9 4046.2
Barium enema 221,378 83.0 � 35.0 9.0 � 3.8 1992.4
Cholecistography 60,199 39.8 � 22.4 1.6 � 0.9 96.3
Urography 62,787 48.2 � 24.0 5.8 � 2.9 364.2
Mamography 39,973 31.7 � 15.3 0.62 � 0.3 24.8
Angiography 14,206 21.3 � 7.7 0.22 � 0.08 3.1
Hysterosalpingography 1,050 57.4 � 23.5 6.6 � 2.7 6.9
Lung tomography 52,804 18.0 � 9.6 2.8 � 1.5 147.8
Limbs, joints 693,390 6.6 � 2.5 0.08 � 0.03 55.5
All medical examinations 9,135,346 1.40 12.812
Table VII. Exposure from diagnostic radiology in Romania
Examinations Annual number
of examinations
(1995) %
Effective dose*
(mSv)
Annual collective
effective dose
(manSv) %
Chest radiography 1,213,718 11.90 0.22 269.1 2.0
Chest photofluorography 2,392,704 23.46 0.62 1491.3 11.10
Chest fluoroscopy 2,537,780 24.89 0.89 2251.7 16.76
Spine - lumbar
- thoracic
- cervical
236,186 2.32
81,332 0.80
207,950 2.04
3.02
2.35
0.21
714.0 5.32
190.9 1.42
44.6 0.33
Pelvis 253,837 2.49 2.66 675.4 5.03
Hip (both) 74,213 0.73 2.99 221.9 1.65
Head 454,297 4.45 0.18 83.7 0.62
Abdomen 338,450 3.32 1.81 612.1 4.56
Barium meal 1,026,953 10.0 4.0 4114.8 30.63
Barium enema 221,378 2.17 9.0 1992.4 14.83
Cholecistography 61,428 0.60 1.57 96.3 0.72
Urography 67,513 0.66 5.75 388.0 2.89
Mammography 40,336 0.40 0.61 24.8 0.18
Angiography 14,206 0.14 0.22 3.1 0.02
Hysterosalpingography 1,050 0.01 6.57 6.9 0.05
Lung tomography 52,804 0.52 2.79 147.8 1.10
Limbs, joints 912,335 8.95 0.08 72.5 0.54
Cystourethrography 8,984 0.09 3.4 30.6 0.23
All medical examinations 10,197,474 100 1.32 13,432 100
Per capita 0.59

IAEA-CN-85-105
57
4. Conclusions
The new value of the annual collective effective dose resulting from diagnostic X-ray
conventional examinations performed in Romania is of about 13,430 manSv with the main
contribution of 95 per cent belonging to adult patients and the remainder of 5 per cent - to
paediatric patients.
Unfortunately, fluoroscopic examinations have had a contribution of more than 60 per cent to
this annual collective effective dose and barium enema was associated with the highest
effective dose - 9 mSv.
The patient - weighted mean effective dose from X-ray examinations performed annually in
Romania is 1.32 mSV with 1.40 mSv for the average adult patient and 0.59 mSv for the
average paediatric patient. The annual per caput effective dose due to diagnostic radiology in
Romania is 0.59 mSv.
The knowledge of the real level of patient dose is an essential component of quality assurance
programs in diagnostic radiology.
References
[1] IACOB, O., DIACONESCU, C., BOTEZATU, E., An update of exposures from natural
and artificial ionising radiation sources in Romania, Journ. Prev. Med., 6 3 (1998) 7-16.
[2] HART, D., JONES, D. G., WALL, B. F., Coefficients for Estimating Effective Doses
from Paediatric X-ray examinations, NRPB-R279, National Radiological Protection
Board, Chilton, UK, (1996)
[3] HART, D., JONES, D. G., WALL, B. F., Estimation of Effective Doses in Diagnostic
Radiology from Entrance Surface Dose and Dose-Area Product Measurements, NRPB-
R279, National Radiological Protection Board, Chilton, UK, (1996)
[4] UNSCEAR 2000 Report to General Assembly, with Scientific Annexis, United Nations
Scientific Committee on Effects of Atomic Radiation, Vol. I: Sources, Annex D:
Medical radiation exposures, UN, New York (2000).

IAEA-CN-85-113
58
SOME EXPERIENCES FROM RADIATION PROTECTION OF PATIENTS
UNDERGOING X-RAY EXAMINATIONS IN TANZANIA
J.E. Ngaile, W.E. Muhogora, A.M. Nyanda
National Radiation Commission, Arusha, United Republic of Tanzania
Abstract
A study of patient entrance surface dose (ESD) received by adult patients was undertaken in five major
diagnostic facilities in Tanzania. Five selected X-ray projections for chest PA; Abdomen AP; lumbar spine AP;
lumbar spine LAT and pelvis AP were done in the study. The mean ESDs after introduction of dose reduction
methods were 0.34 mGy, 5.41 mGy, 3.7 mGy, 4.8 mGy and 8.8 mGy for chest PA; abdomen AP; pelvis AP;
lumbar spine AP and lumbar spine LAT respectively. The variations of doses observed in the study were
influenced by performance characteristic of X-ray equipment, patient shape and size, type of image receptor,
radiographic techniques as well as skills employed. The results show that increasing the tube voltage reduced the
ESD by 35.5%, while lowering of mAs reduced ESD in the range from 15% to 60%. The reduction of ESD by
increasing the filtration ranged from 11% to 58% while increasing of speed class of film-screen combination
reduced the ESD in the range from 33% to 57%. The corresponding results of image quality show that out of
1064 scores of image criteria 298,481 and 285 were rated for good, satisfactory and poor respectively. The
results of this study provide an evidence of existing potential for dose reduction in the diagnostic radiology
facilities and the most important factor for improvement is to increase awareness, both from reality of harm from
unnecessary radiation exposure and with relative ease doses can be reduced. The study should therefore be
implemented on the national scale as an approach to establish guidance levels of patient entrance surface dose for
good medical practice and regular monitoring purposes.
1. Introduction
In diagnostic radiology, measurements of radiation doses to the patients provide means for
setting and checking standards of good practices as an aid to the optimization of patient
protection. It is difficult for an X-ray facility to be aware of its performance without some
form of patient dose monitoring. In Tanzania, the medical use of X-rays for diagnosis of
diseases and injury started as early as 1938 and as technology and health care improved there
has been an increase in the usage of radiation. To date the country has more than 300
diagnostic X-ray units and it is estimated that about 1,000,000 X-ray examinations are carried
out annually in the country [2]. Despite such extensive use, there was no radiation protection
until the Protection from Radiation Act, 1983 came into force. The Act established the
National Radiation Commission (NRC), as the Competent Authority responsible for all
matters relating to radiation protection [1]. The increasing trend of the number of X-ray
examinations in absence of guidance levels prompted the NRC, to carry out a pilot study to
investigate the factors that influence patient dose from diagnostic radiology. The patient dose
assessment based on such pilot study would be a precursor of establishing the National
guidance levels of patient entrance surface dose for regular monitoring purposes. The range of
doses associated with the same procedures that were found in the study which have shown
huge potential for dose reduction were due to the diversity of diagnostic factors like, the
difference in patient size and shape, the variety of available imaging systems, processing
chemicals, skills employed and the range of technical parameters that were used, such as tube
potential, current, exposure time, filtration, field size, and distance. The study revealed that
different techniques and clinical factors that influenced the doses to patients from diagnostic
radiology, might give added knowledge for use in the optimization of diagnostic radiology
procedures. This paper presents and discusses some experiences from radiation protection of
patients undergoing X-ray examinations from five major diagnostic radiology facilities in
Tanzania.

IAEA-CN-85-113
59
2. Materials and methods
The Entrance Surface Dose (ESD) study involved a total of ten X-ray rooms at four referral
hospitals and one regional hospital. The hospitals were the Muhimbili Medical Centre
(MMC), Kilimajaro Christian Medical Centre (KCMC), Bugando Medical Centre (BMC),
Mbeya Consultant Hospital (MCH) and Arusha Regional Hospital (ARH) which collectively
attend nearly 50% of patients undergoing X-ray examination in the country annually [2,7].
Five selected X-ray projections for chest PA; abdomen AP; lumbar spine AP; lumbar spine
LAT and pelvis AP were used in the study as recommended [3]. Ten adult patients whose
individual weights and thickness were close to 70 kg and 20 cm respectively had their ESD
measured. The ESD were determined using the LiF thermoluminescent dosemeter (TLD)
chips, which were calibrated at the National Calibration Laboratory (NCL) for ionizing
radiation, Arusha, Tanzania. A Harshaw TLD system model 4000B (No.3190) was used to
evaluate the TLDs. Two calibrated TL chips enclosed in a labelled 30 x 30 x 0.01 mm3
polythene sachet were used to determine the ESD by attaching the dosemeters at the middle of
the light field on the patient for each radiographic exposure. The quality assurance program
(QA) on x-ray equipment was undertaken before the introduction of the dose reduction
methods. The quality control (QC) tests on the X-ray equipment were undertaken by using a
non-invasive X-ray test device, Victoreen model 4000M+. The leakage measurements were
measured using a calibrated Radiation Alert Monitor 4. The beam alignment and the beam
perpendicularity were determined by using RMI test tools. During the X ray examination,
requirements and technical parameters of good imaging were closely followed. The quality of
the obtained radiographs per X-ray projection was tested for compliance with the European
guidelines on quality criteria for radiographic images [8] by five experienced radiologists. The
observers evaluated the image quality of all ten radiographs of each X ray projections and
scores good for feature detected and fully reproduced, detail visible clearly defined;
satisfactory for feature just visible, detail just visible but not clearly defined and poor for
feature invisible, detail invisible or not clear.
3. Results and discussions
3.1. Quality assurance program on X-ray equipment
The results of quality control (QC) checks done on X-ray equipment are given in table 1. By
comparing these results with the recommended tolerances [3,6], it can be seen that all the X-
ray machines under study, passed all QC tests done. However, in clinical situations where
diagnostic conditions for which equipment and technique related factors are variable, the use
of these X-ray machines may still lead to un –optimized diagnostic procedures. Therefore the
QC results provide guidance on the choice of exposure techniques and hence suggest the need
for optimized dose reduction methods. The lowering of mAs was found to be effective for X-
ray equipment with higher timer reproducibility than lower timer reproducibility. The
increasing of filtration was found to be effective for an X-ray machine of lower half value
layer. Likewise, the increasing of tube potential reduced the patient dose [4] more efficiently
for the X-ray machines that possessed better tube voltage consistency and higher accuracy.
3.2. Entrance surface dose measurement on patient
The mean ESD per examination before the introduction of dose reduction methods was found
to be in the range from 0.1 to 0.9 mGy for chest, 3.5 to 13.9 mGy for abdomen AP and 1.6 to
13.1 mGy for pelvis AP X-ray examinations. For Lumbar spine, AP and Lumbar spine, LAT

IAEA-CN-85-113
60
the dose ranges were 3.6-12.7 mGy and 10.0-29.6 mGy respectively. It can be seen that about
70% of the mean doses are below the recommended ESD guidance levels [3, 5]. Indeed, the
dose results compare well with the results from similar studies [3]. Despite the fact that
majority of ESD values are below the Internationally recommended ESD guidance levels, the
corresponding ESD variations may not be fully justified.
Table 1. Results of QC checks on X-ray equipment at the five hospitals (maximum value of
performance indicated)
Parameters KCMC MMC BMC ARH MCH
R1 R4 R4A R4B R203 R207 R1 R1
kV accuracy (10%)* 4.1 8.0 5.3 7.2 4.1 7.5 5.4 5.6
kV reproducibility(4%)* 1.0 0.5 0.5 0.5 1.1 0.5 1.0 0.3
kV consistency (10%)* 6.0 2.1 4.2 3.8 7.8 4.3 6.6 2.1
HVL,mmAL (at 80kVp)* 4.1 4.0** 3.4 3.1 3.7 2.8 3.7 2.1
Timer accuracy(10%)* 0.4 1.5 1.6 1.0 1.5 1.0 6.1 0.8
Timer reproducibility(5%)* 1.0 0.3 0.9 0.3 0.5 0.2 0.1 0.1
Output linearity 3.9 1.0 1.1 2.9 3.9 1.8 5.0 4.6
mGy/mAs(5%)*
Leakage radiation at 1 m
(1000 �Sv/h)* 9.5 20.0 10.3 15.0 20.8 350 12.0 400
Light –radiation
Beam alignment
(Deviation at 1 m) (+2%)* A A A A A A A A
Beam perpendicularly(1.5o
)* A A A A A A A A
*Tolerance ** at 120 kVp A; Acceptable R: Room
Factors that influences ESD are comprehensively discussed elsewhere [3,4]. The choice of
film-screen combination influences the patient entrance surface dose [4]. A sensitive screen-
film combination requires much less exposure than a low sensitivity non-screen film system,
although shows less detail. Two types of speed classes of film-screen combination such as 200
and 400 were employed although majority of hospitals use the ‘200’ type, as they are
relatively cheaper than the other class. The alternative use of high kV technique for chest X-
ray examination reduced the patient dose, as high energy X-rays are more penetrating than
low-energy X-rays [4]. The influence of filtration reduces the intensity of the beam. Filters
selectively remove many more low-energy X-ray than high –energy X-rays [3,4]. The
observed high mAs variation in a majority of X-ray examinations for patients of similar size,
also suggested that the reduction of mAs could be effective in reducing patient dose.
Irrespective of the type of X-ray examination, the results show that increasing the tube voltage
reduced ESD by 35.5% while lowering of mAs reduced ESD in the range from 15% to 60%.
The reduction of ESD by increasing the filtration ranged from 11% to 58% while increasing of
speed class of film –screen combination reduced ESD in the range from 33% to 57%. These
include film –developing conditions, speed class of film combinations, filtration and exposure
factors such as kVp and mAs. Large variation of distance from the x-ray tube has also been
found to influence the ESD on patients [3].
After introduction of the dose reduction methods the change of the ESD median from second
round ESD measurement was 0.41 mGy to 0.36 mGy for chest PA, 8.9 mGy to 6.4 mGy for
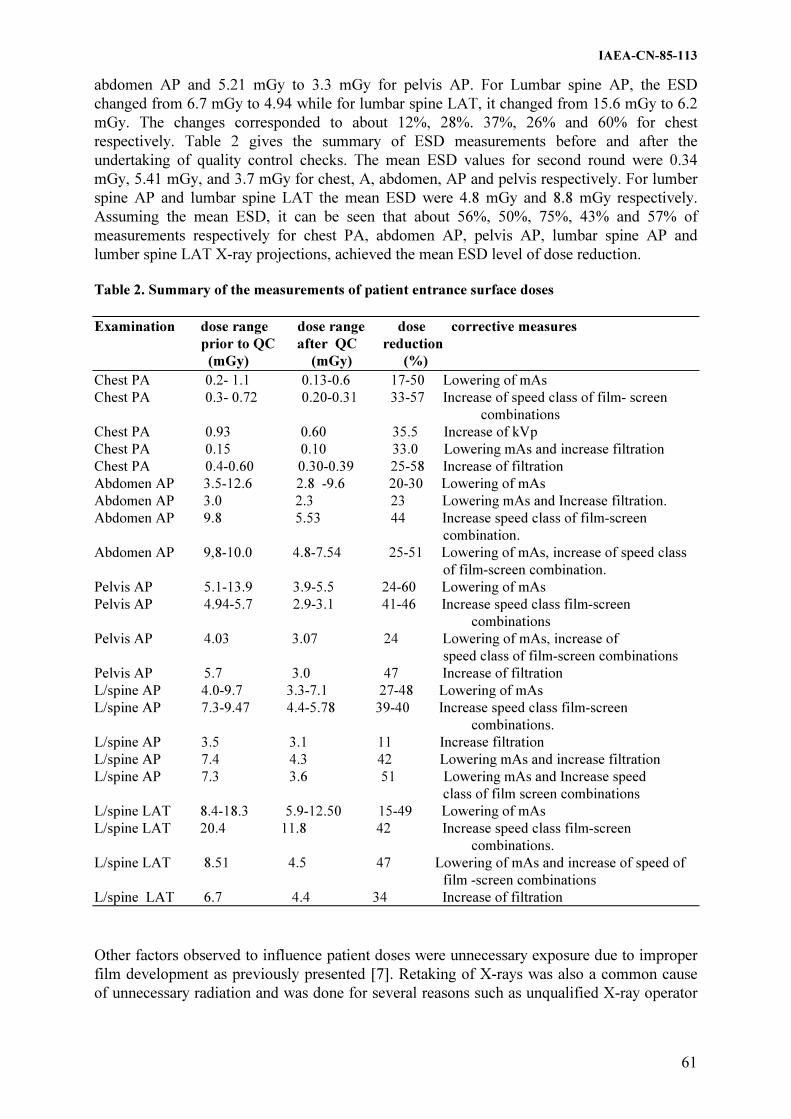
IAEA-CN-85-113
61
abdomen AP and 5.21 mGy to 3.3 mGy for pelvis AP. For Lumbar spine AP, the ESD
changed from 6.7 mGy to 4.94 while for lumbar spine LAT, it changed from 15.6 mGy to 6.2
mGy. The changes corresponded to about 12%, 28%. 37%, 26% and 60% for chest
respectively. Table 2 gives the summary of ESD measurements before and after the
undertaking of quality control checks. The mean ESD values for second round were 0.34
mGy, 5.41 mGy, and 3.7 mGy for chest, A, abdomen, AP and pelvis respectively. For lumber
spine AP and lumbar spine LAT the mean ESD were 4.8 mGy and 8.8 mGy respectively.
Assuming the mean ESD, it can be seen that about 56%, 50%, 75%, 43% and 57% of
measurements respectively for chest PA, abdomen AP, pelvis AP, lumbar spine AP and
lumber spine LAT X-ray projections, achieved the mean ESD level of dose reduction.
Table 2. Summary of the measurements of patient entrance surface doses
Examination dose range dose range dose corrective measures
prior to QC after QC reduction
(mGy) (mGy) (%)
Chest PA 0.2- 1.1 0.13-0.6 17-50 Lowering of mAs
Chest PA 0.3- 0.72 0.20-0.31 33-57 Increase of speed class of film- screen
combinations
Chest PA 0.93 0.60 35.5 Increase of kVp
Chest PA 0.15 0.10 33.0 Lowering mAs and increase filtration
Chest PA 0.4-0.60 0.30-0.39 25-58 Increase of filtration
Abdomen AP 3.5-12.6 2.8 -9.6 20-30 Lowering of mAs
Abdomen AP 3.0 2.3 23 Lowering mAs and Increase filtration.
Abdomen AP 9.8 5.53 44 Increase speed class of film-screen
combination.
Abdomen AP 9,8-10.0 4.8-7.54 25-51 Lowering of mAs, increase of speed class
of film-screen combination.
Pelvis AP 5.1-13.9 3.9-5.5 24-60 Lowering of mAs
Pelvis AP 4.94-5.7 2.9-3.1 41-46 Increase speed class film-screen
combinations
Pelvis AP 4.03 3.07 24 Lowering of mAs, increase of
speed class of film-screen combinations
Pelvis AP 5.7 3.0 47 Increase of filtration
L/spine AP 4.0-9.7 3.3-7.1 27-48 Lowering of mAs
L/spine AP 7.3-9.47 4.4-5.78 39-40 Increase speed class film-screen
combinations.
L/spine AP 3.5 3.1 11 Increase filtration
L/spine AP 7.4 4.3 42 Lowering mAs and increase filtration
L/spine AP 7.3 3.6 51 Lowering mAs and Increase speed
class of film screen combinations
L/spine LAT 8.4-18.3 5.9-12.50 15-49 Lowering of mAs
L/spine LAT 20.4 11.8 42 Increase speed class film-screen
combinations.
L/spine LAT 8.51 4.5 47 Lowering of mAs and increase of speed of
film -screen combinations
L/spine LAT 6.7 4.4 34 Increase of filtration
Other factors observed to influence patient doses were unnecessary exposure due to improper
film development as previously presented [7]. Retaking of X-rays was also a common cause
of unnecessary radiation and was done for several reasons such as unqualified X-ray operator

IAEA-CN-85-113
62
and loss of the original films and chemicals. This leads to the conclusion that lack of
necessary attention or awareness about the levels of doses and risk associated with particular
procedures and particular techniques may also contribute to patient dose.
In a rapidly changing field of modern x-ray diagnostics, the referring physician and the
radiologist/radiographer who are responsible for clinically directing the examination must
build their decision upon a correct assessment of the indications for X-ray examination and
the way the results are likely to influence diagnosis and subsequent patient dose. The above
facts should take into consideration the physical properties and biological effects of ionizing
radiation and the concepts of benefits and risks in radiological protection. Generally, the
effectiveness of dose reduction was observed to be independent of the type of x-ray
examination and X-ray equipment type. This suggests that the influence of the technique used
and skill employed may be significant to the ESD reductions.
3.3. Image quality assessment
The results of image quality assessment based on the European guidelines show that out of
1064 scores of image criteria 298 (28%), 481(45%) and 285 (27%) were rated for good,
satisfactory and poor respectively. Majority of observers noted the detailed nature of the
quality criteria and were of opinion that slight variations in film processing conditions could
be a source of significant number of radiographs rated satisfactory otherwise could be good
radiographs. Despite that the guidelines were less familiar to some observers, they have been
found useful and their adoption in the country is recommended. The need to provide relevant
education and training to staff in the radiology department has been seen.
4. Conclusions
Some experiences from radiation protection of patients undergoing X-ray examinations in
Tanzania have been presented. The results of the study provide evidence of the existing
potential for dose reduction in the country’s hospitals and the most important factor for
improvement is to increase safety culture, both from reality of harm from unnecessary
radiation exposure and of the relative ease with which doses can be reduced. This requires
familiarity with the levels of doses connected with the various X-ray projections and with
techniques of quality control. The study should therefore be implemented on the national scale
as an approach to establish national guidance levels of patient entrance surface dose
associated with particular procedures for good medical practice and regular monitoring
purposes.
Acknowledgement
The work was supported by the International Atomic Energy Agency through the research
project number 9336/RO which the authors of this paper gratefully acknowledge.
References
[1] [1]NYANDA, A.M., MUHOGORA, W.E., “Regulatory control of low-level radiation
exposure in Tanzania”, IAEA-TECDOC-976, Vienna (1997) 308-311.
[2] MUHOGORA, W.E., NYANDA, A.M., LEMA, U.S., NGAILE, J.E., “Typical radiation
doses topatients from some common X-ray Examinations in Tanzania”. Radiation
Protection Dosimetry, Vol.82, No.4, pp.301-305 (1999)

IAEA-CN-85-113
63
[3] Radiation doses in diagnostic radiology and methods for dose reduction, IAEA-
TECDOC 796, Vienna (1995).
[4] CAMERON, J.R., SKOFRONICK, J.G., Medical Physics, John Wiley & Sons, Inc.
New York (1978) pp387-437.
[5] International Basic Safety Standards for Radiation Protection against ionizing radiation
and for the safety of radiation sources, IAEA SAFETY SERIES NO.115, Vienna
(1996).
[6] LOBRIGUITO, H.M., BAHAD, T.U., MOPERA, D.J.; Performance evaluation of 500
mA x-rays units in selected department of health hospitals in the Philippines;
Measurement Assurance in Dosimetry. Proc of symp. Vienna, 24-27 May 1993. pp659-
667 (1993).
[7] MUHOGORA, W.E., NYANDA, A.M., NGAILE, J.E., LEMA, U.S., Film reject rate
studies in major diagnostic x-ray facilities in Tanzania, SRP Inter. Symp, Southport, 14-
18 June 1999.
[8] European Commission. European guidelines on quality criteria for diagnostic
radiographic images, EUR 16260 ISBN 92-827-72284-5, Brussels (1996).

IAEA-CN-85-136
64
MEDICAL EXPOSURE IN RUSSIA
S.A. Kalniskya, A.B.Bazukin
a, M.M. Vlasova
b, S.I. Ivanov
c, E.V. Ivanov
a,
Y.O. Jakubovskiy-Lipskya, A.A. Gontsov
b
aInstitute of Radiation Hygiene, St.-Petersburg, Russian Federation, bAdministration of Health, City Center of Radiation Diagnostics and Therapeutics,
St. Petersburg, Russian Federation, Tumen, Russian Federation cMinistry of Health, Moscow, Russian Federation
Abstract
Recently there have been considerable changes in radiology, which is because of coming to a new form of
property, reforms of health services and crisis in the society. Big area, bad means of communication and low
density of population in most regions of the country should be also mentioned among the factors, influencing the
level of both health protection and radiology services. Al this factors don’t allow to create an effective radiology
system in a short time. Meanwhile the main nearest task of radiology is the integration and optimization of all
means of visualization on the base of solving fundamental problems of health protection according to the Federal
program, normative acts and decrees of the government. In this connection it seemed to be an urgent task to
estimate various aspects of radiology activity of Russian Health in the dynamics for the recent period of time.
The data of the state statistics are to be used to cope with this task. These data on the base of the computer
program “Region”, the quantity indices of various visualization methods used in Russia and the doses of
exposure of the population have been estimated and the reference book “Medical irradiation of the population in
Russia.1980-1997 years” has been published.
It turned out that the average annual number of X-ray examinations per thousand population in Russia before
1988 year was constantly up to 1600. And only then because of Chernobyl accident its increase stopped and its
gradual decline began (table 1). Such high frequency of the examinations was caused mainly by the large scales
of mass preventive photofluorography (more than 40%), held for early tuberculosis exposure.
It was as a result of reorganization of fluorographic examination system started in the late 80-s and early 90-s that
this pernicious tendency was overcome and the number of fluorography was reduced almost twice from 90 to 56
millions a year, which considerably contributed to reducing the exposure. Unfortunately as a result of it, the rate
of tuberculosis has increased, which led to the recommencement of mass fluorographic screening in former or
ever larger scales.
Recently the number examinations per 1000 population has reduced to 1200. The specific feature of modern X-
ray diagnostic is its competing with new non-radiation examinations, in particular with ultrasound and
endoscopic ones. These methods are very efficient and recently have been developing very actively.
Nevertheless, the classical radiology is not going to surrender and in spite of some reduction in examinations it is
still the leader among all ways of visualization. The structure of X-ray examinations has changed considerably
during the last decades: the number of the most dose-making examinations has become 8 times less, the number
of the most informative and the least dose-making radiography examinations has twice, and only the amount of
photofluorography examinations , including screening, has declined inconsiderably.
Among all X-ray examinations the maximum quantity is still that of chest and skeleton. The
amount of X-ray examinations is equal for male and female parts of population, 53,7% and
46,3% accordingly. Speaking of the age of the examined , it should be noted that the most part
of X-ray examinations is held among middle-aged and especially elderly people. Children’s
contribution is inconsiderable. This correlation has been stable for the recent period of time.
A detailed study of X-ray examinations shows that the main contribution to it is made by
diagnostics and screening of lung, stomach examinations as well as examinations of skull and
extremity. Recently there has increased the number of special X-ray examinations among

IAEA-CN-85-136
65
which are angiography and intervention methods. They are the most informative, but at the
same time they are accompanied by very high dose, including the influence on skin.
Table 1. The dynamics of medical radiation exposure in Russia
Index Years
1965 1970 1975 1980 1985 1990 1997
X-Ray Examinations
Number examinations 1120 1204 1332 1488 1682 1177 1230
per 1000 population
Contribution, %
Fluoroscopy 47 40 27 13 7 5,5 5
Radiography 27 27 36 49 43 54 54
Photofluorography 26 33 37 38 50 41 39
Dental * * * * 4,7 7,0 7,8
Mammography * * * 0,6 0,4 0,3 0,4
CT * * * * * * 0,5
Chest 81 76 71 64 62 51 45
Digestive organs 6 8 10 13 14 12 6
Skeleton 10 12 14 18 19 24 36
Other 3 4 5 5 7 13 13
Nuclear medicine
Number examinations * * * 9,0 10,5 15,3 12,6
per 1000 population
Ultrasound diagnostic
Number examinations * * * * * 80 270
per 1000 population
Radiation therapy
Number examinations * * * 0,98 0,99 1,57 1,66
per 1000 population
* the data are not provided by statistical form.
Considerably yielding to traditional X-ray examinations are dental and mammography. Their
contribution to the general number of X-ray examinations is inconsiderably, in spite of their
importance and significance. However the speed of the development of this methods is rather
high. The most rapid is the development of ultrasound diagnostic and computed tomography.
Presently magnetic-resonance tomography (MRT) has joined them, positron-emission
tomography (PET) is coming up and the future radiology belongs to these new methods.
There are 4150 physicians, 103 radiologist and 235 X-ray unit for 1 million population in
Russia. On one equipment 5260 examinations a year are held. An average X-ray examinations
for 1 radiologist is 12385 a year. Recently an average effective dose from X-ray examinations
has had a 20% decline from 1,0 to 0,8 mSv which is caused by change in the structure of X-
ray examinations (table 2).

IAEA-CN-85-136
66
Table 2. Average effective individual and collective dose in radiology
Index Year
1980 1985 1990 1997
X-ray examinations
Individual effective dose, mSv per:
procedur * * 0.79 0,65
patient * * 1,20 1,10
Annual effective dose 1,26 1,32 1,00 0,80
per caput, mSv
Including, mSv:
Screening * * 191,1 189,0
Mammography * * 1,26 2,05
Dental * * 2,5 3,0
Collective dose, 175 189 148 117
thousand.man-Sv
Contribution dose, %
Fluoroscopy 45,8 37,5 33,1 25,4
Radiography 26,1 29,7 38,3 39,5
Fotofluorography 26,0 31,3 28,6 35,1
Screening 19,9 23,1 19,2 23,8
Dental * * * 0,4
Mammography * * * 0,3
Localization dose, %
Chest 31 33,5 31,2 37,4
Including screening 21 22,9 20,4 29,4
Digestive 58 52 41 29
Skeleton 6,4 9,4 13,8 16,2
Other 4,6 5,0 12,7 11,4
Nuclear medicine
Annual effective dose 45,0 52,2 76,7 62,8
per caput ,mkSv
Collective dose, 6,23 7,47 11,35 9,19
thousand man-Sv
Further reduction of medical exposure is possible on the base of optimization of equipment
and personnel usage, integration level, single information space on the base of computer, the
priority of primary radiology help to the population as well as centralization, concentration
and unification of various radiation methods, submission of radiology activity to economic
advisability. It’s also necessary to provide high-quality training of wide-profile specialists in
the radiology. For this purpose all educational and post-educational cycle should be reformed.
The problem of complex education and complex diagnostics should be provided with
complex equipment of radiology. To gain this, big medical institutions should firstly the
whole range of equipment for full-scale examinations, including angiographic, CT, MRT,
PET etc., and secondary to introduce new methods of radiology, including intervention ones.
The exceptional significance of medical exposure is detriment not only by the level of its
contribution to a population dose, but also by possessing the most considerable, economically
not burdensome reserves to reduce this contribution and consequently to provide a
considerable decline of the whole dose on population from all the sources of radiation.
IAEA-CN-85-142
67
RADIATION DOSE IN RADIOGRAPHY AND METHODS FOR DOSE REDUCTION
B. Yue, K. Wei, Q. Zhou, Y. Cheng, C. Hou, L. Ge, X. Qi
Laboratory of Industrial Hygiene, Beijing, China
Abstract
The research contract between the International Atomic Energy Agency (IAEA) and laboratory of Industrial
Hygiene(LIH), China, was conducted from 1994 to 1998 and entitled “Radiation Dose in Diagnostic Radiology
and Methods for Dose Reduction”, involving some of Asia and Far East countries. The results of the research
have demonstrated significant dose reduction has been achieved without any loss of diagnostic information. The
CEC diagnostic reference dose values can be valid for conventional radiography examinations in China.
1. Introduction
A Coordinated research programme of IAEA in cooperation with 9 countries in Asia and the
Far East has been launched since 1994 [1].
The programme of four years was instituted in two phases. Phases 1 of the CRP dealed with
conventional radiographic units and phases 2 with fluoroscopy and computed tomography
units. The report is the results obtained in the phase 1.
The scope of the phase was the participant to be asked to assess the radiation dose reduction
due to implementation of QC procedures in the sample of hospitals. This assessment involved:
classification by type and frequency of X-ray examinations; Analysis of film-reject rate;
Measurement of patient dose in radiography pre and post-QC implementation of each selected
examination; QC measurements of X-ray performance; Dissemination of Information and
training of the hospitals and image quality evaluation of using image quality criteria in the
CEC working document [2].
2. Materials and methods
Four hospitals were selected as the co-ordinator on implementing the project. In each hospital
two X-ray conventional radiography rooms were chosen to collect information of eight X-ray
projections which should estimate the frequency of examinations and the film reject rate
during a period of two weeks for pre- and post –QC implementation.
In order to obtain entrance surface dose (ESD) values for each projection performed in each
hospital, measurements should be carried out on a sample of 10 adult normal sized patients
(65Kg5) using sets of 4 chips of LiF TLD to the patient's skin in the center of the beam for
pre- and post-QC implementation. The organ dose and effective dose were calculated using
software programmes provided by IAEA from NRPB in English and NRL in New Zealand.
The TLD systems were sent to the NRL to perform calibration and intercomparison exercise.
QC tests for each X-ray unit were made with RMI QC kit (USA) according to the technical
prerequisites of the CRP. Once the QC tests are finished, the results were analyzed in order to
identify possible improvement and to implement corrective actions with the relevant
parameters which may influence the ESD.

IAEA-CN-85-142
68
Table I. The results of measured ESD (mean ����SD, mGy)
Projection Types
Hospital Chest Skull Lumber Spine Pelvis
PA PA LAT AP LAT AP
pre-QC
A
B
C
D
0.27�0.04
0.45�0.13
0.28�0.05
0.38�0.06
3.81�0.66
3.23�0.57
5.05�1.47
***
3.53�0.87
2.24�0.40
4.02�0.91
***
12.36�1.30*
8.24�2.20
7.00�1.00
6.54�1.40
14.88�3.30*
19.06�2.54
15.70�1.80
13.50�2.90
11.70�2.60*5.
07�1.26
2.60�1.20
7.16�0.87
post-QC
A
B
C**
D
0.29�0.05
0.33�0.03
0.09�0.02
0.24�0.05
5.88�1.09
3.70�1.00
4.70�2.10
***
4.84�0.77
2.97�0.64
***
***
8.39�0.68
5.35�0.94
3.90�1.40
7.78�2.07
8.03�0.62
15.2�1.39
8.40�1.20
16.26�5.43
1.74�0.49
4.60�0.70
1.20�0.30
6.42�1.94
*: Tube potential is incorrect. **: Adopted high speed class of screen film combination.
***: Patient number is less than 10.
Table II. The results of E (mean ����SD,mSv)
Projection Types
Hospital Chest Skull Lumber Spine Pelvis
PA PA LAT AP LAT AP
pre-QC
A
B
C
D
0.04�0.008
0.07�0.02
0.06�0.04
0.06�0.01
0.02�0.06
0.03�0.01
0.04�0.01
*
0.03�0.005
0.02�0.01
0.03�0.01
*
1.13�0.14
0.76�0.21
0.76�0.14
0.67�0.17
0.24�0.06
0.30�0.04
0.29�0.04
0.24�0.06
1.67�0.42
0.69�0.17
0.39�0.19
1.07�0.16
post-QC
A
B
C
D
0.05�0.01
0.05�0.003
0.01�0.004
0.04�0.01
0.04�0.007
0.03�0.01
0.03�0.02
*
0.03�0.006
0.02�0.06
*
*
0.93�0.09
0.48�09
0.41�0.15
0.82�0.24
0.16�01
0.22�0.03
0.14�0.02
0.29�0.11
0.27�09
0.62�0.12
0.19�0.05
1.11�0.52
*: Patient number is less than 10.
Table III. Results of Different dose reduction actions
Dose Reduction
Action
Hospital/
Room
Projection Average Dose
Reduction(%)
Increased Tuble Potential
Increased Screen Film Sensitivity
Increased Filtration
Increased Tube Potential & Increased
Screen Film Sensitivity
A/2
A/2
C/1
C/2
C/2
C/2
B/1
A/2
Lumber Spine (AP)
Lumber Spine (LAT)
Chest (PA)
Lumber Spine (AP)
Lumber Spine (LAT)
Pelvis (AP)
Chest (PA)
Pelvis (AP)
32
45
67
44
46
54
27
85

IAEA-CN-85-142
69
Table IV. Examination frequencies by hospital (%)
Total Projection Types
Hospital Patients Chest Skull Lumber Spine Pelvis
Number PA LAT PA LAT AP LAT AP
Pre-QC
A
B
C
D
908
1269
1091
766
37.7
55.7
53.8
41.8
10.6
17.3
10.4
11.0
0.7
2.1
0.01
0.0
0.8
2.0
0.01
0.0
24.9
10.3
17.4
23.0
23.7
9.9
16.0
21.4
3.0
2.7
2.4
2.8
post-QC
A
C
929
522
37.2
35.6
12.9
14.8
0.01
0.02
0.01
0.02
27.1
27.8
22.8
21.8
0.02
0.02
Table V. Film reject rate by hospital and by case
Films Rejected Rejected Cases
Hospital No. Films No. Rate(%) Too Dark Too Light Position Others
Pre-QC
A
B
C
D
Post-QC
A
C
908
1269
1091
766
929
522
34
72
39
25
12
4
3.7
5.6
3.6
3.3
1.3
0.8
12
28
14
11
5
3
18
36
15
9
6
0
1
3
3
2
1
1
3
5
7
3
0
0
3. Results
Table I presents the results of measured ESD by projection type and by hospital. Table II
shows the results of calculated effective doses E(ICRP 60). Table III shows the percentage of
average dose reduction where different kinds of technical actions were adopted. Table IV
presents the examination frequencies of each hospital during 2 weeks for pre-and post-QC
implementation. Table V presents the film reject rate of each hospital during 2 weeks for pre-
and post-QC implementation.
4. Conclusions
1. The High chest (PA) frequency projection is 50% and the Low skull frequency projections
(AP and LAT) are less than 1% because of the use of CT scanner.

IAEA-CN-85-142
70
2. The film reject rate varied from 3.3% to 5.6% in these four hospitals pre-QC due to the
inappropriate set of the parameters. After the corrective actions for post-QC the reject rate
reduced to less than 1.3%.
3. Most of the measured ESD for the projections is lower than the CEC reference values.
4. Four kinds of dose reduction methods used in different X-ray rooms, the dose reduction
varied from 27% to 85%.
Acknowledgements
This work was supported in part by the IAEA under contract number 8221/R1, We would like
to thank Ms. Modupe Oresegun and Mr. P. Ortiz-lopez for their assistance.
References
[1] IAEA-TECDOC-796, Radiation dose in diagnostic radiology and methods for dose
reduction. IAEA, Vienna (1995)
[2] CEC, Quality Criteria for diagnostic radiographic images, Working document, 3rd
edition, June. (1995)
[3] NRPB, National protocol for patient dose measurements in diagnostic radiology,
Institute of physical sciences in Medicine. (1992)
IAEA-CN-85-151
71
ESTIMATION OF PATIENT RADIATION DOSES DURING
RADIOLOGIC EXAMINATIONS IN THE REPUBLIC OF HAITI
G. Massillon J.
Instituto de Ciencias Nucleares UNAM, México, Mexico
C. Borrás
Pan American Health Organization/World Health Organization, Washington, DC,
United States of America
Abstract
The International Commission on Radiological Protection and the international organizations that co-sponsored
the International Basic Safety Standards for the Protection against Ionization Radiation and for the Safety of
Radiation Sources (BSS) –among them PAHO and WHO– recommended the use of investigation levels to
provide guidance for medical exposures. In this work, entrance surface doses for several common diagnostic
radiology procedure have been determined from exposure rate measurements and patient technique factors in
seven “World Health Imaging System – Radiography” (WHIS-RAD) units, installed in public health services
facilities of the Republic of Haiti. The results show the entrance surface doses below the guidance levels
published in the BSS. Concomitant image quality measurements performed, however, indicate serious artifacts
in the film processing, calling for the need of additional training of the technologists.
1. Introducción
Haití tiene una población de alrededor de 8 millones de habitantes. En los servicios públicos,
se estima hay unos 20 equipos de rayos X. Entre 1993 y 1996 la Organización Panamericana
de la Salud / Organización Mundial de la Salud (OPS/OMS), dotó al país de 11 equipos de
radiografía del tipo “WHIS-RAD” –World Health Imaging System– Radiography, 7 de la
firma Philips y 4 de la firma Bennett. Este equipo se caracteriza por tener un sistema de
soporte en arco C que mantiene el receptor de imagen siempre alineado con el tubo de rayos
X a una distancia fija de 1,4m, con una mesa flotante. El tubo de rayos X tiene un punto
focal de menos de 1mm y una potencia de 24 a 30kWs. El generador es de alta frecuencia y
funciona con baterías [1].
2. Objetivo
El objetivo de este trabajo, es hacer una estimación de la dosis de entrada en la superficie del
paciente (DES), utilizando las técnicas radiológicas recomendadas por la OMS (kVp y mAs)
[2] y las tasas de exposición en aire medidas en 7 de estas unidades, para compararlas con
los niveles orientativos de dosis publicados en las Normas básicas internacionales para la
protección contra la radiación ionizante y para la seguridad de las fuentes de radiación,
(NBS) [3] copatrocinadas por seis organismos internacionales –entre ellos la OPS y la
OMS– y publicadas (en castellano) por el Organismo Internacional de Energía Atómica
(OIEA) en 1997. De acuerdo con los criterios de las NBS, se evaluó también la calidad de la
imagen radiológica.
3. Métodos
Durante las pruebas de aceptación de los equipos se verificó que todos cumplían con las
especificaciones de la OMS.[1] Se midieron: el tamaño del punto focal, la exactitud del
potencial, la congruencia del campo luminoso y el de radiación, la calidad de la imagen, la
capa hemirreductora (CHR), la reproducibilidad y linealidad del generador, y la tasa de
exposición en aire. Para las cuatro últimas medidas se usó un monitor de rayos-X (MDH

IAEA-CN-85-151
72
Radcal-1015) y filtros de aluminio. De los valores de CHR medidos, se determinó que la
filtración total de los equipos era de 3 mm de aluminio, de acuerdo con las especificaciones
de la OMS. La calidad de la imagen se determinó radiografiando dos patrones de resolución
espacial de pares de líneas, uno de alto contraste y otro de bajo contraste.
Se determinaron las DES para cada una de las técnicas recomendadas �2� por la OMS,
utilizando un factor de conversión de 0.00877 para convertir de mR a mGy y corrigiendo por
la geometría de medición.
4. Resultados
En la figura-1 se presentan la tasa de exposición y la CHR en función del potencial del tubo,
medidas en cada una de las unidades. Las variaciones mínima y máxima de los valores
obtenidos para la tasa de exposición son del orden de 5 y 19% a 70 y 53 kVp
respectivamente y hay una variación de 5% para las CHR, independientemente de la energía
del haz.
40 50 60 70 80 90 100 110 1201.0
1.5
2.0
2.5
3.0
3.5
4.0
4.5
5.0
1
2
3
4
5
6
7
CH
R (
mm
de
Al)
Potencial del Tubo (kV)
0
2
4
6
8
10
12
14
16
18
20 1
2
3
4
5
6
7
Exp
osi
cio
n (
mR
/mA
s a 1
m)
Figura-1. Tasa de exposición y CHR en función del potencial del tubo medidas en las 7
unidades WHIS-RAD
En la figura-2 se presenta la variación de las DES promedio en función del espesor del
paciente para 6 proyecciones radiográficas. Las desviaciones estándar varían entre 8 y 12%,
independientemente de la técnica.

IAEA-CN-85-151
73
21 22 23 24 25 26 27 28 29 300.2
0.3
0.4
0.5
0.6
0.7
0.8
Torax AP
Espesor (cm)
DE
S (
mG
y)
16 18 20 22 24 26 28 30 32 34 36 38 40
0.5
1.0
1.5
2.0
2.5
3.0
Abdomen PA
Torax PA
21 22 23 24 25 26 272
4
6
8
10
12
14
16
18
DE
S (
mG
y)
16.0 16.5 17.0 17.5 18.0 18.5 19.0 19.5 20.01.0
1.5
2.0
2.5
3.0
26 28 30 32 34 36 38 40
0.5
1.0
1.5
2.0
2.5
3.0
3.5
Abdomen AP
Espesor (cm)
Torax LaT
DE
S (
mG
y)
16 17 18 19 20 212
3
4
5
6
7
8
9
10
Pelvis
Figura-2 Dosis de entrada en la superficie del paciente en función del espesor del paciente
para diferentes proyecciones radiográficas
Tabla-1 Comparación de los valores de DES determinados en este trabajo, asumiendo un
espesor del paciente de 20 cm y una anchura de 34.4 cm, con los reportados en las NBS
Examen DES (mGy)
NBS HAITI
Tórax PA 0.4 0.23 � 11%
AP 0.24 � 7.7%
LAT 1.5 1.19 � 12%
Abdomen AP 10 2.76 � 9.7%
PA 3.51 � 9.7%
Cráneo PA 5 3.01 � 10.6%
LAT 3 1.33 � 10.6%
Pelvis 10 6.66 � 10.6%
Tabla-2. Evaluación de la calidad de imagen en las unidades WHIS-RAD ����Patrones de barras
sobre el receptor de imagen: 0.1 mm Pb (AC) y 0.001 mm Pb (BC); 70 kV, 3.2 mAs����
Unidad Contraste* Resolución
(pl/mm)
Revelado
AC BC
1 1.27 3.1 2 OK
3 0.71 4.0 2.2 OK
4 0.37 3.1 2.2 Artefactos
5 1.04 3.4 2.2 Artefactos
6 0.47 3.7 2.5 Artefactos
7 0.41 3.1 2.8 Artefactos
*Diferencia en la densidad óptica entre las áreas opaca y transparente en el patrón de barras de Pb.

IAEA-CN-85-151
74
En la tabla-1 se presentan los valores de DES, con sus desviaciones estándar, obtenidos en
este trabajo y los publicados en la literatura para un adulto típico
Los resultados de la evaluación de la calidad de imagen se presentan en la tabla-2.
3. Conclusiones
Los valores presentados en la tabla-1 muestran que la dosis que recibe un paciente durante
los exámenes radiológicos estudiados es más baja que los niveles orientativos publicados en
las NBS. Sin embargo, los resultados de la tabla-2 indican que sólo dos instituciones
producían placas radiográficas sin artefactos serios, factor que afecta significativamente la
calidad de la imagen, y como consecuencia en las otras instituciones, la probabilidad de que
el médico no haga una interpretación radiológica adecuada, lo cual implica la posible
necesidad de repetir la radiografía y por tanto duplicar la dosis al paciente. Ello muestra la
importancia de entrenar bien a los técnicos en los procesos de revelado como parte integral
de un servicio de radiología.
Referencias
[1] César Arias et al, Organización, desarrollo, garantía de calidad y radioprotección en
los servicios de radiología: imaginología y radioterapia, OPS/OMS (Cari Borrás ed)
Washington 1997.
[2] T. Holm, P.E.S. Palmer and E. Lehtinen. Manual de técnica radiográfica, Sistema
radiológico básico de la OMS, Organización Mundial de la Salud, Ginebra, 1986.
[3] Organización de las Naciones Unidas para la Agricultura y la Alimentación, Organismo
Internacional de Energía Atómica, Organización de Cooperación y de Desarrollo
Económico, Organización Internacional del Trabajo, Organización Mundial de la Salud,
Organización Panamericana de la Salud. Normas básicas internacionales de seguridad
para la protección contra la radiación ionizante y para la seguridad de las fuentes de
radiación. Viena: Organismo Internacional de Energía Atómica; 1997. (Colección
seguridad 115).

IAEA-CN-85-209
75
MEDICAL RADIATION EXPOSURE AND USAGE FOR
DIAGNOSTIC RADIOLOGY IN MALAYSIA
Kwan-Hoong Nga, Premavathy Rassiah
a, Hwee-Beng Wang b, Ahmad Shariff Hambali b,
Pirunthavany Muthuvelu b, B.J.J. Abdullaha, S. Sivalingamc
a University of Malaya Medical Centre, Kuala Lumpur, Malaysia
b Ministry of Health, Kuala Lumpur, Malaysia
c Kuala Lumpur Hospital, Kuala Lumpur, Malaysia
Abstract
A national dose survey of routine X-ray examinations in Malaysia (a Level II country) from 1993 to 95 had
established baseline data for seven common types of x-ray examinations. A total of 12 randomly selected public
hospitals and 867 patients were included in this survey. Survey results are generally comparable with those
reported in the UK, USA and IAEA. The findings support the importance of the on-going national quality
assurance programme to ensure doses are kept to a level consistent with optimum image quality. The data was
useful in the formulation of national guidance levels as recommended by the IAEA. The medical radiation
exposure and usage for diagnostic radiology (1990-1994) enabled a comparison to be made for the first time with
the UNSCEAR 2000 Report. In 1994, the number of physicians, radiologists, x-ray units and x-ray examinations
per 1000 population was 0.45, 0.005, 0.065 and 183 respectively; 3.6 million x-ray examinations were
performed; the annual effective dose per capita was 0.05 mSv and collective dose was 1000 person-Sv. Chest
examinations contributed 63% of the total. Almost all examinations experienced increasing frequency except for
barium studies, cholecystography, and intravenous urography (-23%, -36%, -51%). Notable increases were
observed in computed tomography (161%), cardiac procedures (190%), and mammography (240%).
1. Introduction
There is a continuing need to analyze the frequencies, doses and trends of medical radiation
procedures to permit comparison with medical radiation usage in other parts of the world,
comparisons with other sources of radiation, and identification of areas of concern. It also
helps to assess how the introduction of new techniques, radiation protection actions or quality
assurance programs affect the trends. Exposures from medical radiation world-wide have
been assessed by the United Nations Scientific Committee on the Effects of Atomic Radiation
[1]. Worldwide interest in patient doses has been stimulated by a report of the National
Radiological Protection Board (NRPB) [2].
2. National Dose Survey of Routine X-ray Examinations
Malaysia with 2216 persons per physician in 1994 belongs to health care Level II according
to UNSCEAR [3]. A national survey initiated by the University of Malaya and the Ministry of
Health has been conducted from 1993 to 95 to establish baseline data on patient doses from 7
routine types of x-ray examinations (12 projections) in 12 public hospitals following the
protocols of NRPB [4]. For each x-ray room machine specific data such as type, model,
waveform, filtration, film-screen combination, and output were recorded. Basic equipment
quality control including the processor had been implemented in these hospitals since 1992
[5]. 867 patients with a mean weight around 60 kg (45-75kg) were included in this study. For
each patient and x-ray unit the following parameters were recorded: sex, ethnic origin, age,
weight, height, body mass index, focus-skin distance, focus-film distance, field size, kVp, and
mAs. Entrance skin dose (ESD) was measured using LiF TLD chips (TL-100, Harshaw)
calibrated by the Primary Standard Dosimetry Laboratory at the National Radiation
Laboratory, New Zealand and the Secondary Standard Dosimetry Laboratory at the Malaysian

IAEA-CN-85-209
76
Institute for Nuclear Technology Research (MINT) within the recommended precision and
accuracy levels [4].
Table 1 compares the ESD values [6] of this survey with established reference dose values
from other countries. The reference dose values recommended by the IAEA Basic Safety
Standard [9] are based on the Commission of the European Communities (CEC) [10].
Table 1. Comparison of ESD (mGy) with international established reference dose values [6]
Radiograph Projec-
tion
Malaysia
(1996) [6]
Median
Values
USA (1992)
CRCPD/CDRH
[7]
Median values
NRPB
(1986) [8]
Median
values
NRPB
(1992) [4]
IAEA Basic
Safety
Standard
(1996) [9]
Chest PA 0.3 0.17 0.18 0.3 0.4
LAT 1.2 Not given 0.99 1.5 1.5
Abdomen AP 9.2 5.6 6.68 10 10
Pelvis/ Hip AP 5.3 Not given 5.67 10 10
Skull AP/PA 4.7 Not given 4.20 5 5
LAT 3.0 1.6 2.19 3 3
Cervical
Spine
AP 0.7 1.5 - - -
LAT 1.5 Not given - - -
Thoracic
Spine
AP 6.4 Not given - 7 7
LAT 15.9 Not given - 20 20
Lumbar Spine AP 9.1 6.4 7.68 10 10
LAT 14.0 Not given 19.7 30 30
3. Medical Radiation Usage and Exposure in Diagnostic Radiology
The medical radiation usage for diagnostic radiology (1990-1994) [11] enabled a comparison
to be made for the first time with the UNSCEAR Report 2000 [12]. In 1994, the number of
physicians, radiologists, x-ray units and x-ray examinations per 1000 population was 0.45,
0.005, 0.065 and 183 respectively. The increase from 1990 to 1994 for population, number of
physicians and radiologists was 10%, 26%, 47% respectively. The total number of x-ray units
increased from 889 in 1990 to 1270 in 1994 (43%), with an increase in the number of
examinations from 2.88 million to 3.58 million (24%). The average number was estimated to
increase from 162 to 183 per 1000 persons (13%). Almost all examinations experienced
increasing frequency except for barium studies, cholecystography, and intravenous urography
(-23%, -36%, -51%). Notable increases were observed in computed tomography (161%),
cardiac procedures (190%), and mammography (240%).

IAEA-CN-85-209
77
Fig. 1 Frequency of x-ray examinations in
Malaysia,1994 [11]
Skull/
extremities
22.4%
Chest
63.0%
Abdomen/
pelvis
8%
Barium
studies 0.2%
IVU
0.4%
Angio/
cardiac 0.2%
Mammo
0.7%Others
2.5%
CT
2.4%
The distribution of the types of x-ray examinations for 1994 [11] is shown in Fig 1. A total of
3.6 million x-ray examinations were performed. Chest radiography was the most frequent
examination (63%); followed by skull and extremities (22.4%). On the whole plain
radiography accounted for 93.4% of radiological procedures with the others e.g. CT,
mammography, making up the remainder.
Table 2 shows the annual examination per capita, effective dose per examination and annual
effective dose per capita for various types of x-ray examinations in 1994. The annual effective
dose per capita to the population was estimated as 0.05 mSv per person and the collective
dose, 1000 person-Sv [13].
Table 2. Exposure from diagnostic medical x-ray examinations in Malaysia (1994) [13]
Examination Annual exams
per capita
Effective dose
per exam (mSv)
Annual effective dose
per capita (mSv)
Chest 0.115 (63%) 0.03 0.0035
Skull/ extremities 0.041 (22.4%) 0.04 0.0016
Abdomen/ pelvis 0.015 (8.3%) 1.05 0.0159
Barium studies 0.0003 (0.2%) 6.0 0.002
Cholecystography (0.01%) 1.5 0.000037
Hysterosalpingography (0.02%) 1.36 0.00007
Angiography (0.03%) 6.8 0.0004
Cardiac procedures (0.13%) 6.8 0.002
Intraven. Urography 0.0006 (0.4%) 2.4 0.002
Mammography 0.001 (0.7%) 0.1 0.0001
Computed Tomography 0.004 (2.4%) 4.85 0.021
Others 0.005 (2.5%) 0.1 0.0023
Total 0.183 (100%) 0.275* 0.0503
* value is a weighted average
4. Discussion
The results of this survey provide valuable baseline data for Malaysian patient doses. Survey
results arte generally compatible with those reported in the UK, USA and IAEA. Wide
variations of typically range over factors between 5 and 30 for individual patient dose
suggested that significant dose reductions is possible without adversely affecting image
quality [6]. This survey has also led to an increased awareness amongst professionals in

IAEA-CN-85-209
78
diagnostic radiology in Malaysia of the need for dose management. Since the survey, faster
film-screen combinations have been introduced and greater emphasis placed on quality
assurance. Furthermore the data would be useful for the formulation of a national guidance
dose level for incorporation in the amendments of the 1988 Malaysia Radiation Protection
Regulations (Basic Safety Standard). We have also participated in an IAEA coordinated
research project on ‘Radiation protection and quality assurance in diagnostic radiology’.
Information on medical radiation exposure and usage in Malaysia allows appropriate radiation
protection measures to be implemented and diagnostic radiology standard to be improved.
References
[1] BENNETT, B.G. Exposures from medical radiation world-wide. Radiat. Protect.
Dosimetry 36 (1991) 237-242.
[2] NRPB/RCR. Patient Dose Reduction in Diagnostic Radiology. Documents of the
NRPB. London: HMSO 1,3 (1990).
[3] United Nations. Sources, Effects and Risks of Ionizing Radiation. United Nations
Scientific Committee on the Effects of Atomic Radiation, UNSCEAR 1988 Report to
the General Assembly, with Scientific Annexes. United Nations Sales Publication
E.88.IX.7. New York: UN (1988).
[4] NRPB National Protocol for Patient Dose Measurements in Diagnostic Radiology
Dosimetry. Working Party of the Institute of Physical Sciences in Medicine. NRPB,
Chilton: HMSO (1992).
[5] WANG, H.B., NG, K.H. “Quality Assurance Programme in Radiology - the Malaysian
experience”. World Congress on Medical Physics and Biomedical Engineering, Rio de
Janeiro, Brazil, Aug 21-25, 1994. Phys Med Biol 39a, 1 (1994) 305.
[6] NG, K.H., RASSIAH, P., WANG, H.B., HAMBALI, A.S., MUTHUVELLU, P., LEE,
H.P. Doses to patients in routine X-ray examinations in Malaysia. Brit J Radiol 71
(1998) 654-60.
[7] CRCPD/CDRH. Conference on Radiation Control Program Directors/ Center for
Devices and Radiological Health. Average patient exposure/dose guides - 1992. CRCPD
Pub 92-4. Frankfurt: CRCPD (1992).
[8] SHRIMPTON, P.C., WALL, B.F., JONES, D.G. et. al. A National Survey of Doses to
Patients Undergoing a Selection of Routine X-ray Examinations in English Hospitals.
NRPB- R200. London: HMSO (1986).
[9] IAEA. International Basic Safety Standards for Protection Against Ionising Radiation
and for the Safety of Radiation Sources. Safety series no. 115-1. Vienna: International
Atomic Energy Agency (1996).
[10] EUR16260 EN. European Guidelines on Quality Criteria for Diagnostic Radiographic
Images, EC DGXII (1996).
[11] NG, K.H., ABDULLAH, B.J.J., RASSIAH, P., SIVALINGAM, S. X-ray based
Radiological Procedures in Malaysia - 1990-1994. Med J Malays 54, 2 (1999) 185-191.
[12] United Nations. Sources, Effects and Risks of Ionizing Radiation. United Nations
Scientific Committee on the Effects of Atomic Radiation, UNSCEAR 2000 Report to
the General Assembly, with Scientific Annexes. United Nations Sales Publication
E.00.IX.3 New York: UN (2000).
[13] NG, K.H., ABDULLAH, B.J.J., SIVALINGAM, S. Medical radiation exposures for
diagnostic radiology in Malaysia. Health Physics 77, 1 (1999) 33-36.

IAEA-CN-85-217
79
PATIENT DOSE SURVEYS FOR RADIOLOGICAL EXAMINATIONS
IN DUTCH HOSPITALS BETWEEN 1993 AND 2000
F.M. Spoelstra, J. Geleijns, J.J. Broerse, W.M. Teeuwisse, D. Zweers
Leiden University Medical Centre, Leiden, Netherlands
Abstract
Our inventory studies on radiation dose to patients in Dutch hospitals are reviewed and compared with current
European guidelines on patient dose and reference dose values of the NRPB. Between the years 1993 and 2000
doses were measured and effective dose was assessed at 14 hospitals for paediatric radiography, at 18 hospitals
for PA chest radiography, at 10 respectively 9 hospitals for barium meal and barium enema examinations and at
18 hospitals for CT scans of the brain, chest (including high resolution CT of the chest), abdomen and lumbar
spine in The Netherlands.
Effective doses varied from 1 µSv (AP chest radiograph premature) to 26 mSv (CT abdomen scan). Doses were
in general well below the reference dose values, with the exception of CT where the dose length product often
exceeded reference levels. Interhospital variations were considerable, the largest range was observed for PA chest
examinations, i.e. a ratio of 27 between maximum and minimum effective dose.
1. Introduction
It is recommended that periodic dose measurements are performed to evaluate the
optimisation of patient dose, as well as to test compliance with guidelines and regulations.
Quality control, including patient dosimetry, has even become a legal requirement under the
new European legislation [1]. This paper is a review of dose assessment studies in several
hospitals in the Netherlands concerning paediatric radiography, chest radiography, barium
meal and barium enema examinations and CT scans. For all examinations the operational
dosimetric quantities as well as the effective dose are presented. The following operational
quantities have been measured: the entrance skin dose (including backscatter) for paediatric
radiographs, the entrance air kerma free-in-air for PA chest radiographs of adults, the dose
area product for barium contrast examinations and the weighted CTDI for computed
tomography. For adult chest X-rays, multiplication of the measured air kerma free-in-air with
backscatter factors resulted in entrance skin doses (including backscatter). For computed
tomography, the weighted CTDI and dose-length product were derived.
2. Dose surveys
Paediatric radiography
Special attention for patient dose in paediatric radiology is indicated since it is generally
assumed that children are a factor 2 to 3 more sensitive to radiation than adults. The entrance
dose and effective dose for 6 frequently applied projections in paediatric radiology, i.e. pelvis,
abdomen and chest radiographs in infants and for children aged 5 years were established at 14
hospitals [2]. PMMA phantoms of different thicknesses were used to simulate the attenuation
of the infants and the 5-year-old children. Entrance skin dose was measured on these
phantoms with an ionisation chamber. Effective doses (E) were calculated using the NRPB
effective dose conversion factors for paediatric X-ray examinations [3]. The dosimetric
findings of the paediatric X-ray projections (Table I) can be compared to the European
Commission (EC) guidelines [4]. Effective dose ranged from 1 to 70 µSv per radiograph. The
highest values were found for radiographs of the abdomen of 5 year old children. Entrance
skin dose varied between 6 and 417 µGy. Not a single hospital exceeded the entrance skin
dose values as recommended in the EC guidelines. However, the interhospital variation was

IAEA-CN-85-217
80
large and due to large differences in applied tube voltage, additional filtration and film-screen
combination speed class. In half of the hospitals tube voltages were outside the range
suggested in the EC guidelines. Low tube voltage, lack of copper filtration, low speed class
film-screen combination and high ratio anti-scatter grids lead to relatively high effective
doses.
Table I. Effective dose, entrance skin dose and EC reference dose values for paediatric
radiography (AP projections except for (PA) chest radiographs of 5 year old children). Doses are
presented as mean values, minimum and maximum values appear between brackets.
Region Effective dose (µSv) Entrance skin dose (µGy)
Infant* 5 year old child Infant* EC 5 year old child EC
Pelvis 9 [5-14] 26 [8-55] 48 [23-83] 200 202 [53-417] 900
Abdomen 10 [3-21] 43 [20-70] 37 [10-75] 1000 239 [116-391] 1000
Chest 5 [1-15] 7 [2-14] 28 [6-66] 80 41 [14-90] 100
EC = dosimetric guidelines of the European Commission
* for pelvis projection the patient age is 5 months, chest and abdomen projections apply to premature children.
PA chest radiography
Chest radiography yields relatively low doses to the adult patient but is the most frequently
performed X-ray examination. At 18 hospitals, air kerma free-in-air was measured with an
ionisation chamber whilst simulating the exposure during routine PA chest X-ray radiographs
at each of these hospitals with a LucAl chest phantom [5]. Tube voltage, filtration and film-
screen combination were noted. Effective dose was subsequently calculated using conversion
factors from Schultz et al [6]. These conversion factors were derived by means of Monte
Carlo calculations for the computational phantoms Adam and Eva representing standard male
and female patients. Entrance skin dose for patients was assessed from air kerma free-in-air
using backscatter factors published by Petoussi-Henss et al [8]. Mean effective dose and
entrance skin dose are shown in Table II, as well as the recommended values from the EC
guidelines [7]. Only one hospital did not comply with the EC guidelines for patient dose due
to a low (i.e. 100) speed class film-screen combination. The interhospital variation in effective
dose of a factor 34 is, compared to the other examinations, the largest observed during the
Dutch field surveys.
Table II. Effective dose, entrance skin dose and EC reference dose values for PA chest
radiography in adult patients. Doses are presented as mean values, minimum and maximum
values appear between brackets.
Region Effective dose (µSv) Entrance skin dose (µGy) EC Entrance skin dose (µGy)
PA chest 22 [5-137] 107 [30-390]
300
3. Gastrointestinal examinations
Barium meal examinations for exploration of the upper gastrointestinal tract and barium
enema for assessment of the colon lead to a relatively high radiation burden and they are
estimated to contribute about 13% to the collective dose due to diagnostic radiology. Barium

IAEA-CN-85-217
81
meal examinations include visualisation of the oesophagus, stomach and duodenal bulb. In
both barium meal and barium enema examinations a large number of different projections is
used during fluoroscopy and radiography. For assessment of the dose area product (DAP)
during 2323 procedures (590 barium meal, 1733 barium enema) flat ionisation chambers were
installed in 10 hospitals [9,10]. Furthermore, parameters such as tube voltage, focus skin
distance, projection angle, field size and filtration were registered. Effective dose was
calculated from the measured DAP values by multiplication with effective-dose-conversion
factors [11]. Three hospitals had higher DAP values for barium meal examinations than
recommended, but all hospitals complied with NRPB guidelines for barium enema
examination (Table III). Differences between hospitals were due to e.g. differences in
fluoroscopy times (meal: 1.7-7.0 minutes, enema 2.8-8.8), the number of exposures (meal: 9-
28, enema: 7-27), the tube voltage (meal: 72-117 kV, enema: 72-126), the application of
copper filtration, the entrance image intensifier dose rates (meal: 0.16-1.27 µGy/s, enema:
0.19-1.30), different protocols as well as over- or undertable tube position.
Table III. Dose area product (DAP), effective dose (E) and NRPB reference values [12] for
gastrointestinal radiology. Doses are presented as mean values, minimum and maximum values
appear between brackets.
Examination Region DAP (Gy.cm2) NRPB DAP (Gy.cm
2) E (mSv) NRPB E (mSv)
Barium meal Upper GI 21 [7-56] 25 7 [3-19] 3
Barium enema Colon 29 [18-53] 60 5 [3-8] 7
The NRPB effective dose is a typical value from a recent dose review [13]
4. Computed tomography
Computed tomography (CT) has become a frequently used X-ray examination for
visualisation of transsections in different parts of the body. It is also a technique that is
associated with a relatively high radiation dose to the patient, the contribution of CT to the
collective dose due diagnostic radiology is estimated to be in the range of 40 to 50%. Different
scan protocols at various hospitals can cause large variations in patient dose. An effective
method for CT dosimetry is assessment of the weighted computed tomography dose index
(CTDIw) which reflects the average absorbed dose within a single slice. Multiplication of the
weighted CTDI with the product of slice thickness and number of slices yielded the dose-
length product. This quantity is indicative for the exposure of the entire CT examination.
CTDIw was assessed at 18 hospitals for different scan parameters. Scan parameters such as
tube voltage and current, thickness and spacing of slides, patient variables and use of contrast
were collected for about 3000 clinical CT examinations. Patient effective dose was assessed
for these examinations using effective dose conversion factors published by Jones and
Shrimpton [14] and by Jansen et al [15]. Five CT examinations were considered: brain, chest,
abdomen, lumbar spine and HRCT (high resolution computed tomography) chest [16]. A
summary of the results is shown in Table IV. Dose values are compared to values
recommended by the European Commission [17] and the NRPB [12]. CT examinations of the
chest and abdomen gave the highest effective dose. Interhospital variations in the number of
slices, slice thickness, and tube current contribute most to the large ranges in patient dose.

IAEA-CN-85-217
82
Table IV. CTDIw, dose length product and EC reference values, effective dose and typical values
for effective dose from the NRPB. Doses are presented as mean values, minimum and maximum
values appear between brackets.
Region CTDIw EC CTDIw DLP EC DLP E NRPB E
(mGy) (mGy) (mGy.cm) (mGy.cm) (mSv) (mSv)
Brain 71 [23-159] 60 702 [315-1537] 1050 3 [1-5] 2
Chest 22 [10-38] 30 593 [269-1168] 650 10 [4-19] 8
Abdomen 27 [10-50] 35 950 [396-1551] 780 17 [7-26] 10
Lumbar spine n.a. 570 5 [2-12] 10*
HRCT chest 35 280 2 [1-7]
n.a.= not available, * CT pelvis
4. Conclusion
Patient dosimetry is often applied as an instrument for optimisation of radiological techniques.
Interhospital, interregional and international comparisons provide insight in the radiation
exposure of patients. Comparison of the survey results with European guidelines shows that
the entrance skin doses for paediatric and adult radiographs are well below the European
reference values, with only one exception, i.e. at one hospital the measured entrance skin dose
was slightly higher than the reference value. The considerable variations between hospitals
suggest that there is still an opportunity for further optimisation of radiographic techniques.
Reference dose levels in The Netherlands could be more restrictive than the European values.
There are no European criteria for patient dose of barium contrast examinations. Comparison
with reference values of dose-area-product published by NRPB showed that in The
Netherlands the mean barium meal values are high and the mean barium enema values are
below the reference values. For computed tomography, all reference doses were exceeded at
one or more hospitals. For a CT abdomen examination even 13 out of 18 hospitals exceeded
the dose-length-product reference value.
Assessment of image quality has hardly ever been realised satisfactory in dosimetric field
studies. Current guidelines and reference values on patient dose are generally derived from a
percentile (often the 75-percentile) of the observed distribution. Future reference doses should
be related to the radiographic technique that yields a good diagnostic sensitivity at a dose that
is ‘as low as reasonably achievable’.
References
[1] Council directive 97/43/EURATOM. Official journal of the European Communities, No.
L 180, 22-27 (1997).
[2] GELEIJNS, J., BROERSE, J.J., VAN VLIET, M., LOPEZ, M., ZONDERLAND H.M.,
Assessment of effective dose in paediatric radiology: a survey at 14 Dutch hospitals,
Radiation Protection Dosimetry 90 (2000) 135-140.
[3] HART, D., JONES, D.G., WALL, B.F., Normalised Organ Doses for Paediatric X-ray
Examinations Calculated using Monte Carlo Techniques. NRPB-SR279, National
Radiological Protection Board, Chilton, Didcot, UK (1996).
[4] EUROPEAN COMMISSION, European Guidelines on Quality Criteria for Diagnostic
Radiographic Images in Paediatrics, EUR 16261 EN (1996).
IAEA-CN-85-217
83
[5] GELEIJNS, J., Patient dosimetry in diagnostic radiology: chest examinations and
computed tomography, PhD thesis,Leiden University, Leiden (1995).
[6] SCHULTZ, F.W., GELEIJNS, J., ZOETELIEF, J., Effective doses for different
techniques used for PA chest radiography. Radiation Protection Dosimetry 57 1995 371-
376.
[7] EUROPEAN COMMISSION, European Guidelines on Quality Criteria for Diagnostic
Radiographic Images, EUR 16260 EN (1996).
[8] PETOUSSI-HENSS, N., ZANKL, M., DREXLER, G., PANZER, W., REGULLA, D.,
Calculation of backscatter factors for diagnostic radiology using Monte Carlo methods,
Phys. Med. Biol. 43 (1998) 2237-2250.
[9] GELEIJNS, J., BROERSE, J.J., CHANDIE SHAW, M.P., SCHULTZ, F.W.,
TEEUWISSE, W., VAN UNNIK, J.G., ZOETELIEF, J., A comparison of patient dose for
examinations of the upper gastrointestinal tract at 11 conventional and digital X-ray
units in The Netherlands, Br. J. Radiol. 71 (1998) 745-753.
[10] GELEIJNS, J., BROERSE, J.J., CHANDIE SHAW, M.P., SCHULTZ, F.W.,
TEEUWISSE, W., VAN UNNIK, J.G., ZOETELIEF, J., Patient dose due to colon
examination: dose assessment and results from a survey in The Netherlands, Radiology
204 (1997) 553-559.
[11] SCHULTZ FW, GELEIJNS J, JANSEN JTHM, ZOETELIEF J, BROERSE JJ,
Application of numerical dosimetry to diagnostic radiology: calculation of dose
conversion factors, proceedings of the 11th ICRR, 1999, S-25.5 (in print).
[12] NATIONAL RADIOLOGICAL PROTECTION BOARD, Guidelines on Patient Dose to
Promote the Optimisation of Protection for Diagnostic Medical Exposures, Vol. 10, No.
1, NRPB Chilton, Didcot, UK (1999).
[13] WALL, B.F., HART D., Revised radiation doses for typical X-ray examinations. Report
on a recent review of doses to patients from medical X-ray examinations in the UK by
NRPB., Br. J. Radiol. 70 (1997) 437-439.
[14] JONES, D.G., SHRIMPTON, P.C., Survey of CT practice in the UK. Part 3: Normalized
Organ Doses Calculated using Monte Carlo Techniques, NRPB R250 (1991).
[15] JANSEN JT, GELEIJNS J, ZWEERS D, SCHULTZ FW, ZOETELIEF J., Calculation of
computed tomography dose index to effective dose conversion factors based on
measurement of the dose profile along the fan shaped beam. Br. J. Radiol. 69 (1996) 33-
41.
[16] VAN UNNIK, J.G., BROERSE, J.J., GELEIJNS J., JANSEN J.T.M., ZOETELIEF J.,
Survey of CT techniques and absorbed dose in various Dutch hospitals, Br. J. Radiol. 70
(1997) 367-371.
[17] EUROPEAN COMMISSION, European Guidelines on Quality Criteria for computed
tomography, EUR 16262 EN (1999).

IAEA-CN-85-263
84
PATIENT DOSES AND EXAMINATION FREQUENCY FOR
DIAGNOSTIC RADIOLOGY IN ICELAND 1993-1998
G. Einarsson, S.M. Magnusson
Icelandic Radiation Protection Institute, Reykjavik, Iceland
Abstract
Presented are data on the frequency of x-ray examinations that have been gathered in two surways with a five
year interval. There is a 17% increase in the number of x-ray examinations from 1993 to 1998. At the same time
computed tomography examinations are nearly doubled. Patient dose data for the different types of examinations
are also presented and an assessment is made of the contribution of these examinations to the Collective Effective
Dose. The number of CT examinations has increased from 8,3% of all x-ray examinations in 1993 to 13,6% in
1998 and contributes more the 50% of the CED in 1998.
1. Introduction
The Icelandic Radiation Protection Institute (IRPI) performed two surveys on the frequency of
diagnostic x-ray examinations in Iceland in 1993 and 1998. Measurement of patient doses for
over 4500 conventional x-ray examinations have been performed at 14 x-ray departments all
over the country, in more than 28 x-ray rooms. These measurements were made with Dose
Area Product meters (DAP). Dose evaluation for CT examination have been made for all the
CT units in the country. Patients doses for breast examinations have also been evaluated.
This paper will present results of these efforts, revealing trends in the frequency of
radiological examinations and patient doses and an assessment of the collective effective dose
(CED)(1)
contributed by diagnostic radiology examinations. Of particular interest are trends in
patient doses and examination frequency in computed tomography and its contribution to the
CED.
2. Material and Methods
Examination frequency
Data on examination frequency was collected by IRPI on two separate occasions, in 1994 (for
examinations made in 1993) and again in 1999 (for examinations made in 1998). Earlier data
collections have been made in Iceland, but not in the detail necessary for comparison with the
this data. Data was collected from all x-ray departments in the country, covering more than
95% of the medical diagnostic imaging examinations done in Iceland in these years. About
80% of the data was detailed with information on examination types, age and sex of the
patient.
Patient doses
In 1994 IRPI started a program to evaluate patient doses by using dose measurement systems
consisting of DAP meters connected to PC-computers. A software was developed, that made it
easy for the radiographers to collect data about all x-ray examinations made with the x-ray
equipment. This includes information such as examination type, age, weight and sex of the
patient, the high tension (kV) used, number of films used and the film-screen combination
used. The software collected data from the DAP meters during the x-ray procedure and could
separate DAP for fluoroscopy and radiographs. It could also calculate the fluoroscopy time.
From this data the effective dose [1] for the different x-ray examinations could be calculated
using appropriate conversion coefficients from the literature [2].
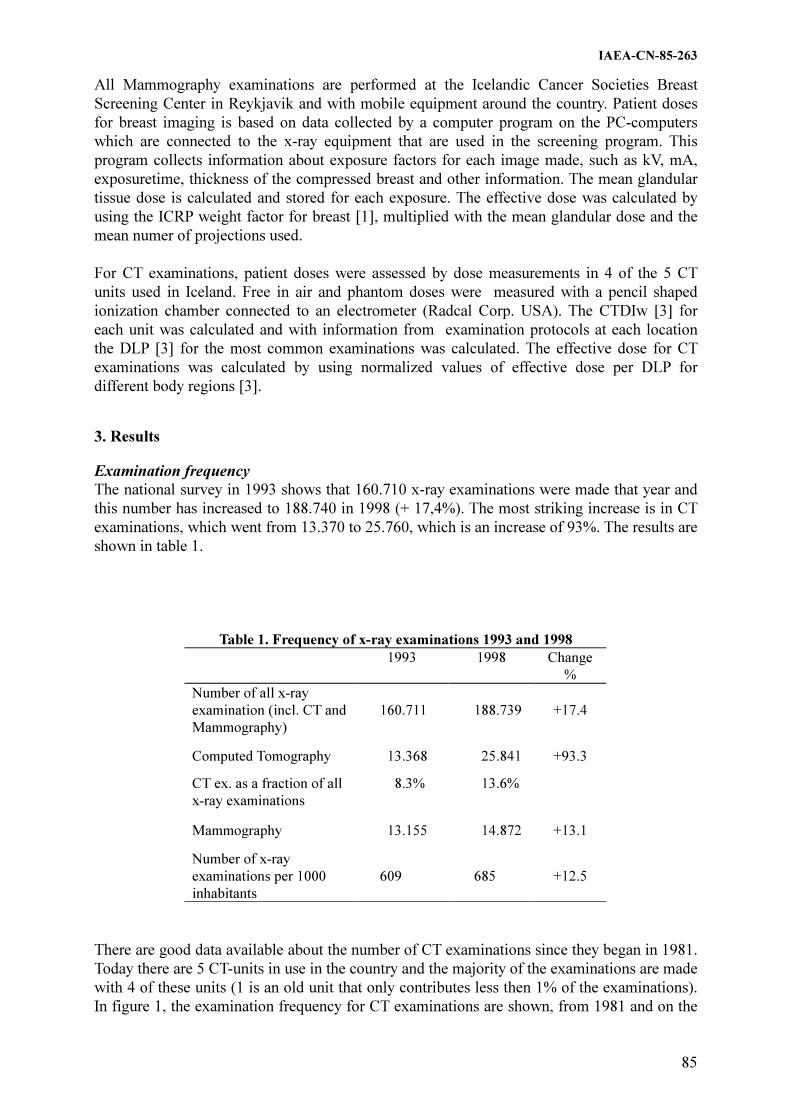
IAEA-CN-85-263
85
All Mammography examinations are performed at the Icelandic Cancer Societies Breast
Screening Center in Reykjavik and with mobile equipment around the country. Patient doses
for breast imaging is based on data collected by a computer program on the PC-computers
which are connected to the x-ray equipment that are used in the screening program. This
program collects information about exposure factors for each image made, such as kV, mA,
exposuretime, thickness of the compressed breast and other information. The mean glandular
tissue dose is calculated and stored for each exposure. The effective dose was calculated by
using the ICRP weight factor for breast [1], multiplied with the mean glandular dose and the
mean numer of projections used.
For CT examinations, patient doses were assessed by dose measurements in 4 of the 5 CT
units used in Iceland. Free in air and phantom doses were measured with a pencil shaped
ionization chamber connected to an electrometer (Radcal Corp. USA). The CTDIw [3] for
each unit was calculated and with information from examination protocols at each location
the DLP [3] for the most common examinations was calculated. The effective dose for CT
examinations was calculated by using normalized values of effective dose per DLP for
different body regions [3].
3. Results
Examination frequency
The national survey in 1993 shows that 160.710 x-ray examinations were made that year and
this number has increased to 188.740 in 1998 (+ 17,4%). The most striking increase is in CT
examinations, which went from 13.370 to 25.760, which is an increase of 93%. The results are
shown in table 1.
Table 1. Frequency of x-ray examinations 1993 and 1998
1993 1998 Change
%
Number of all x-ray
examination (incl. CT and
Mammography)
160.711
188.739
+17.4
Computed Tomography 13.368 25.841 +93.3
CT ex. as a fraction of all
x-ray examinations
8.3% 13.6%
Mammography 13.155 14.872 +13.1
Number of x-ray
examinations per 1000
inhabitants
609
685
+12.5
There are good data available about the number of CT examinations since they began in 1981.
Today there are 5 CT-units in use in the country and the majority of the examinations are made
with 4 of these units (1 is an old unit that only contributes less then 1% of the examinations).
In figure 1, the examination frequency for CT examinations are shown, from 1981 and on the

IAEA-CN-85-263
86
figure are indicators for the number of CT units that are in use at each time. In 1993 the first
spiral CT unit was introduced and today there are 2 spiral units and one multi-slice unit.
CT examinations in Iceland
1981 - 1998
0
5000
10000
15000
20000
25000
30000
1981
1982
1983
1984
1985
1986
1987
1988
1989
1990
1991
1992
1993
1994
1995
1996
1997
1998
Num
ber o
f C
T e
xam
inati
ons
2 CT
Units
4 CT
Units
5 CT
Units
(1 spiral)
5 CT
Units
(2 spiral)
Figure 1 Frequency of CT examinations in Iceland 1981 - 1998
The increase in Mammography examination are mainly due to different coverage of the
country in the screening program for these years. The average number of Mammography
examinations per year from 1989-1998 is 14100.
Patient doses
Patient mean effective dose for the most common conventional x-ray examinations, based on
DAP measurements are shown in table 2. The table also shows information on mean high
tension (kV) used, the mean number of films, and mean DAP values (in Gycm2) and
measurement range. There is a very wide range in DAP measurements for most of these
examinations.
Table 2. Mean effective doses for some common conventional x-examinations, with information about used kVp, number ofused, mean measured DAP and measurement
RangeGycm2Examination
typeMeankVp
Meannumberof films
MeanDAP
Gycm2 Min Max
Meaneffective
dosemSv
Barium Enema 99 15,4 56,6 1,5 204,7 11,9
MUCG 74 11,0 34,5 2,3 51,9 10,7
ERCP 80 7,5 22,1 0,1 100,6 4,4
Urography 72 11,2 18,2 0,8 64,8 3,5
Lumbal Spine 73 4,6 12,9 0,2 97,6 2,0
Abdomen 76 3,2 6,1 0,2 40,1 1,4
Pelvis 74 1,4 3,4 0,1 24,6 0,7
Thoracal Spine 71 2,9 5,2 0,3 18,5 0,7
Cervical Spine 69 5,8 1,0 0,05 3,6 0,2
Lung 122 2,2 0,6 0,01 5,4 0,1
Skull 72 3,8 2,0 0,02 4,3 0,05

IAEA-CN-85-263
87
The mean effective dose for Mammography is 0,36 mSv and contribute 5,4 manSv to the
CED. The method of data collection and dose measurements in CT, only gives average doses
for the different examinations, with no indication of range. The mean effective dose for the
most common CT examinations are shown in table 3 with assessment of their contribution to
the CED. The contribution of the different x-ray examinations to the Collective Effective
Dose are shown in figure 2.
Table 3. Number of CT examinations in 1998,
mean effective dose and contribution to CED
Examination
Type
Number
of
examin.
1998
Mean
Effective
Dose
mSv
Collective
Effective
Dose
manSv
Head 10.888 1,3 14,6
Lung/Chest 4.186 8,5 35,5
Neck 437 4,0 1,7
Spine 3.309 3,3 10,8
Kidneys 435 5,3 2,3
Abdomen 3.154 13,2 41,6
Liver/Spleen 2.046 5,8 11,9
Pelvis 775 6,1 4,7
Other 532 4,5 6,8
Total: 25.762 129,9
Collective Effective Dose 1998
Mammo-
graphy
2%
Intervent.
4%
CED = 240 manSv 0,87 mSv/inhabitant
Conventional
X - Ray 40 %
Computed Tomography
54 %
Figure 2 Collective effective dose for x -ray examinations in Iceland
4. Discussion and conclusion
Examination frequency is increasing in Iceland but the number of examinations per thousand
inhabitants is very similar in Iceland (689) as in the neighbouring countries, such as Norway
(708), Sweden (568) and Finland (704) [4]. But lower then the average number for Level I
countries according to the latest UNSCEAR report (920) [4]. The most pronounced trend in
examination frequency is the increase in CT examinations which has nearly doubled.

IAEA-CN-85-263
88
CT examinations now contributes more than 50% of the total CED from all x-ray
examinations, similar to trends in other countires(5)
. The highest doses arise from CT
examination of the abdomen, chest and pelvis. On average CT examinations are high dose
examinations which have a great effect on CED. Patient dose measurements for conventional
examinations show a wide range, which indicates a potential for optimization in performance.
Advances in CT technology are opening new diagnostic possabilities for the benefit of the
patient and CT examinations are becoming the examination of chocie for more and more
indications. Even though new CT equipment can achieve examinations with lower patient
doses compared to older CT units, changes in examination protocolls can include larger parts
of the patient being irradiated and higher doses. The CED is increasing rapidly due to both
higher number of CT examinations performed and increasing doses per examination. Efforts
to reduce doses should inlude optimisation of both how CT examinations are performed and
the criteria for requesting them.
References
[1] ICRP. Annals of the ICRP, Recommendations of the International Commission on
Radiological Protection. ICRP Publication 60, 1990
[2] Hart, D., Jones, D.G., and Wall, B.F., Estimation of effective dose in diagnostic
radiology from entrance surface dose and dose-area product measurements. Chilton,
NRPB-R262 (1994), London HMSO.
[3] EUR 16262 - Euorpean Guidelines on Quality Criteria for Computed Tomography.
Luxembourg 2000, Office for Official Publications of the European Communitites.
[4] UNSCEAR (2000). United Nations Scientific Committee on the Effects of Atomic
Radiation. UNSCEAR 2000 Report to the General Assembly, Annex D: Medical
Radiation Exposures. United Nations, New York NY.
[5] RCR. Making the Best Use of a Department of Radiology. Guidelines for Doctors, 4th
edition 1998. The Royal College of Radiologist, London, UK.

IAEA-CN-85-91
89
CAN PATIENT POSITIONING USING AN ULTRASHORT FLUOROSCOPIC PULSE
BE JUSTIFIED?
T. Deprez, L. Schrijvers, H. Pauwels, H. Bosmans, G. Marchal
Department of Radiology, UZ Gasthuisberg, Leuven, Belgium
Abstract
A study was performed to find out if a new fluorography procedure, a so-called pre-shot technique, could be
justified as a tool for patient positioning to reduce patient dose and/or the amount of retakes with conventional X-
ray examinations. The ratio of fluorography (S) and radiography (G) for two tissue types was obtained from dose
measurements (PMX-III; RTI Electronics) by performing a simulation on a RANDO skull (0.69% S/G) and an
abdomen (2.49% S/G) phantom. During 8 weeks, the radiographic technique (type of examination, incidence,
number of necessary pre-shots and the number of radiographs per imaging session) was recorded from
musculoskeletal examinations performed on a modified X-ray system (Siemens, Seregraph CF fluorospot).
Analyses of the data shows that in up to 40% of the cases more than one shot has been used. This increases the
relative amount of patient entrance dose up to respectively 1.31% (skull) and 3.0% (abdomen). Taking into
account the retake rates with blind positioning (from literature: 3,2%-10%) and high patient dose with
fluoroscopically guided positioning, we may justify the use of this alternative technique for X-ray departments
with high retake rates and/or fluoroscopically guided positioning. The use of the proposed technique will reduce
the retake rate to a minimum or zero and/or the overall patient dose. Several advantages are gained when
combining this technique with storage phosphor plates: increase of patient throughput, decrease or removal of the
clear room functionality.
1. Introduction
The use of fluorography to position the patients for conventional X ray examinations is
forbidden in many European countries. In other countries, however, this is common practice.
Whether this procedure necessarily leads to higher averaged patient dose depends on the
retake rate of radiographs due to wrong positioning when fluorography is not applied. With a
retake rate because of wrong positioning of n%, the use of fluorography is acceptable if the
associated extra dose for the patient is less than n% of the dose for the radiographs. A few
dose measurements have shown that in most cases the use of fluorography cannot be justified.
Recently, we have modified a digital X-ray system such that pressing the fluorography button
results in a fixed fluorography time of 0.5s only. We have studied the doses necessary for
positioning with this fluorography mode and we investigated whether this practice could be
justified.
2. Material and methods
The study was performed in an X-ray room in which radiographs of thorax and skeleton are
acquired.
The equipment consisted of a Seregraph CF fluorospot (Siemens, Erlangen) and storage
phosphor plates of Agfa (Mortsel, Belgium). The newly developed so-called pré shot
technique restricted the fluoroscopy time to a maximum of 0.5s per shot. As the digital system
was foreseen of an image hold option, the fluoroscopic image remained visible and allowed
for further improvement of the positioning. Occasionally, this position adjustment could be
verified with an extra fluoroscopy shot.
The doses caused by this new procedure for patient positioning evaluations were measured.
Two parts of a RANDO phantom were used for this purpose: the skull to simulate an exposure
with a lot of bony structures and the abdomen mainly consisting of soft tissue. An experienced
radiographer was asked to position the phantoms 5 successive times using the pré shot

IAEA-CN-85-91
90
fluoroscopy mode with the same characteristic curve and mA as had been used before. Doses
were measured with a PMX-III solid state dosimeter (Mölndal; Sweden). This device
measures the entrance dose without taking into account the back scatter fraction.
During a period of 8 weeks, the following data were recorded for all examinations: the type of
examination, the incidence, the number of necessary pre-shots and the number of radiographs
per imaging session. For each examination, the radiographers indicated also how the
positioning was performed: (1) without fluorography, (2) using 1 scopy pulse without any
further need for correction, (3) using 1 scopy pulse and correction of positioning, however
without any further fluorographic control, and (4) using more than 1 scopy pulse. In total,
2363 examinations were performed. Only examinations with a high occurrence rate were
further evaluated in the study.
3. Results
The comparative dose studies for fluoroscopy versus radiography in the phantom studies are
summarized in Table 1. For the examination of the skull, the averaged entrance dose for
fluoroscopy was 27.4 µGy (st dev 4.5 µGy). The entrance dose for the radiography of the skull
phantom was 3998 µGy (stdev 0.7 µGy). The dose associated with the pre-shot fluoroscopy
technique was therefore 0.69% of the dose for the corresponding radiograph. For the
abdomen, the dose from fluoroscopy was 17.6 µGy (st dev 3.6 µGy) and the radiography gave
a dose of 704.5 µGy (stdev 2.5 µGy). The dose ratio in this case was higher: 2.49%.
The number of pre-shots for the whole series of examinations is summarized in Table 2. In up
to 40% of the cases more than 1 shot has been used. In Fig. 1 we show the average number of
pre-shot fluoroscopy pulses for the 20 most frequently performed small musculoskeletal
examinations in the X-ray room. Fig. 2 represents the frequency of necessary adjustments to
the patient positioning after a first fluoroscopic pre-shot pulse. In our radiological practice, an
average of 1.4 pre-shots is necessary. The number of shots for the skull examination is up to
1.9. The abdominal examinations require only 1.2.
4. Discussion
From the dose investigations, it is clear that the dose associated with a single pre-shot
exposure is very low as compared to the dose from radiography. For the skull, we note a dose
ratio between fluoroscopy and radiography of 0.69% and for the abdomen 2.49%. Taking into
account the number of fluoroscopic pulses for these examinations, the relative amount of
patient entrance dose increases up to respectively 1.31 % and 3.0 %. This dose ratio has to be
compared with the retake rate due to false positioning.
This parameter is, however, not always known. From a literature search we retrieved a few
retake rates for centers using blind positioning. Arvanitis [1] reported an overall retake rate of
3.2%. Lewentat [2] reports up to 7.6%. After improving the working procedure, it went down
to 5.0%. These values represent an upper limit of the real retake rates due to wrong
positioning. Hence, when using conventional cassettes, a major source of retakes is caused by
over or under exposure. Hill [3] summarizes his literature review with the indication of a 10%
retake rate, of which 19% is due to wrong positioning. Highest retakes are observed for skull
(18.9%) and abdomen (19.2%) and lowest for IVU (5.3%) and chest (6.3%). Retake rates due
to wrong positioning for skull and abdomen are thus about 3.6 %. It is obvious that for these
type of examinations, patient doses would be reduced if the pre-shot fluoroscopic technique
would be used for positioning instead of blind positioning. This situation may be different for
other types of examinations.

IAEA-CN-85-91
91
In centers in which positioning is usually performed by means of fluoroscopy, the dose
reduction is guaranteed. For departments that use fluoroscopically guided positioning, the
results of this study may be important. Indeed, the use of fluoroscopy as it is today is usually
not justified. This new option justifies the use of fluoroscopically guided positioning, as long
as the number of pre-shots is limited. There are multiple other advantages of the technique
when used in combination with storage phosphor plates. First, the patient can leave the
radiology department immediately after the X-ray is taken. Hence, both problems due to
positioning or wrong exposure are eliminated. This leads to a significant increase in through
put. Second, there is no need anymore for a clear room. Third, the total patient dose can be
lower, especially for departments with high retake rates.
A surprising result from this study is that in more than 40% of the cases repositioning of the
patient was performed after the fluoroscopy pulse. This may be due to several reasons: (1)
only a few radiographers are expert in blind positioning; (2) requirements on image quality are
very high; (3) radiographers want to reach perfection. In the frame of the European directive
97/43 and the ALARA principle, it may be necessary to reduce the image quality requirements
in a controlled manner. Finally, the teaching about how to position the patient in a blind way
remains important since doses can then be reduced even when the pre shot technique is
available.
5. Conclusion
This study shows that the use of ultrashort fluoroscopic pulses for patient positioning may be
justified for a large number of X-ray departments.
References
[1] ARVANITIS, T.N., PARIZEL, P.M.; DEGRYSE, H.R., DE SCHEPPER, A.M., Reject
analysis: a pilot programme for image quality management, Eur. J. Radiol. 12 3 (1991)
171-176.
[2] LEWENTAT, G., BOHNDORF, K., Analyse verworfen Filmmaterials als Element der
Qualitätssicherung in der Diagnostischen Radiologie, Röfo. 166 5 (1997) 376-381.
[3] HILL, S.J., Reject Analysis in ERPET training course for medical physicist, “Quality
Assurance and patient radiation protection in diagnostic radiology”, Passau (1996).
Table I. Comparative dose evaluation of pre-shot fluoroscopy versus radiography
Phantom: SKULL ABDOMEN
Scopy [S] Graphy
[G]
ratio Scopy [S] Graphy [G] ratio
Settings: dose [uGy] dose
[uGy]
dose [uGy] dose [uGy]
87 kV 73 kV 87 kV 73 kV
2,2 mA 70,1 mAs 2,2 mA 12,7 mAs
Measurement: AEC 0 S/G progr. AE S/G
1 31,33 3999 0,78% 15,54 703,2 2,21%
2 31,93 3998 0,80% 20,91 704,2 2,97%
3 29,20 3998 0,73% 21,61 705,1 3,06%
4 21,74 3998 0,54% 16,64 701,6 2,37%
5 24,14 3997 0,60% 13,10 708,3 1,85%
Average: 0,69% 2,49%

IAEA-CN-85-91
92
Table II. Overview of the use of fluoroscopy for conventional X-ray
examinations: skeletal and abdominal radiography
Overview of fluoroscopy n
No scopy used 213 8,45%
One scopy without correction 482 19,12%
One scopy with correction 657 26,06%
More than one scopy 1011 40,10%
Total examinations 2363
Average number of fluoroscopy pulses per examination
0,00
0,50
1,00
1,50
2,00
2,50
3,00
Examination
1 2 3 4 5 6 7 8 9 10 11 12 13 14 15 16 17 18 19 20
Figure 1 Average number of fluoroscopy pulses for musculoskeletal examinations
(1: upper arm, 2: ankle P, 3: femur ¾, 4: femur F/P, 5: hand ¾, 6: hand F, 7: knee ¾, 8: knee
ax, 9: knee condyl, 10: knee F, 11: knee P, 12: nose F, 13: nose P, 14: lower leg F, 15: lower
leg P, 16: wrist ¾, 17: wrist F, 18: wrist P, 19: foot ¾, 20: wrist P)
Average number of positoioning corrections after a first fluoroscopy pulse
-0,10
0,00
0,10
0,20
0,30
0,40
0,50
0,60
0,70
0,80
0,90
1,00
1 2 3 4 5 6 7 8 9 10 11 12 13 14 15 16 17 18 19 20
Examination
Figure 2 Average number of corrections to the position of the patient. Same examinations as in Fig. 1

IAEA-CN-85-269
93
DEVELOPMENT OF AN INTERNATIONAL CODE OF PRACTICE FOR
DOSIMETRY IN X-RAY DIAGNOSTIC RADIOLOGY
F. Pernicka
International Atomic Eenergy Agency, Vienna
G.A. Carlsson
University of Linköping, Linköping, Sweden
D.R. Dance
The Royal Marsden NHS Trust, London, United Kingdom
L.A. DeWerd
University of Wisconsin, Madison, Wisconsin, United States of America
H.-M. Kramer
PTB, Braunschweig, Germany
K.-H. Ng
University of Malaya, Kuala Lumpur, Malaysia
Abstract
Medical x-ray examinations contribute greatly to the population dose from man-made radiation sources. There is
a need to control this dose and therefore to optimise the design and use of x-ray imaging systems. A key stage in
this process is the standardisation of the procedures for dose measurement in the clinic. The Dosimetry and
Medical Radiation Physics section of the IAEA has a number of activities to further advance the standards for x-
ray diagnostics. One of these activities is the coordination of a working group to develop a code of practice,
which will facilitate the IAEA calibration activities, TLD intercomparisons and audits, educational activities, and
a technical assistance to Member States. The code of practice will aid in the standardisation of various
dosimetric techniques in x-ray diagnostic radiology. The CoP working group has had an initial meeting to review
the current status of dosimetry for conventional radiology, fluoroscopy, mammography, computed tomography
and dental radiology. The CoP will include the establishment of standards and calibrations at the SSDLs,
phantom and patient measurements and procedures for dosimetry in the clinic.
1. Introduction
A key stage in controlling x-ray irradiation of patients is the standardisation of the procedures
for dose measurement in the clinic. In many situations, it is of interest to make measurements
directly on the patient. However, for the control of technical parameters, for the comparison
of different systems and for optimisation of the systems, it is preferable to make
measurements using a standard phantom to simulate the patient. With the exception of
mammography, there is hardly any international advice available for the performance of such
measurements or the selection of phantoms for use in different situations.
Approximately 40% of Secondary Standard Dosimetry Laboratories (SSDLs) are currently
involved with calibration of diagnostic ionization chambers. At present, the manner in which
calibrations at diagnostic radiation qualities are performed at SSDLs is not co-ordinated.
Many use different radiation qualities and standards, some of which may be unsuitable.
Quality control can only work satisfactorily if correct measurements are made. A large
number of SSDLs are requesting guidance on establishing calibration facilities.
The objective of the Dosimetry and Medical Radiation Physics (DMRP) section of the IAEA
is to enhance the capacity of Member States to achieve and maintain a high level of quality in
dosimetry and medical radiation physics, to improve the implementation of traceable
standards at the national level and to ensure control of radiation dose in the Member States.
This goal has as its precedent the prior work in radiation therapy. A series of

IAEA-CN-85-269
94
recommendations for dosimetry have been published with the latest dosimetry protocol
“Absorbed Dose Determination in External Beam Radiotherapy: An International Code of
Practice for Dosimetry based on Standards of Absorbed Dose to Water”, published in 2000
[1]. The increased need to standardize dosimetric measurements in x-ray diagnostic radiology
led the DMRP to establish a working group with the aim of preparing the new Code of
Practice (CoP) that will review the current status of dosimetric measurements in conventional
radiology1, fluoroscopy, mammography, computerized tomography and dental radiology and
give recommendations on selection of the instruments, their calibration and procedures for
clinical dosimetry.
2. Background of X-ray diagnostic dosimetry
In developed countries about 90% of medical radiation dose is due to x-ray diagnostics and
10% to nuclear medicine [2]. Since the risk for stochastic effects (induction of cancer and
genetic disorders) is believed to be without a threshold, the detriment to the population
increases with increasing population dose. An increasing part of this dose from diagnostic x-
rays is due to the use of procedures such as fluoroscopy in interventional radiology and
computed tomography (CT). Patient dose measurements are therefore becoming increasingly
important. For example, in the International Basic Safety Standards [3] it is stated that
representative dose values shall be determined in radiological examinations. The European
Union has adopted a directive towards “health protection of individuals against the dangers of
ionising radiation in relation to medical exposures” which requires extensive dose
measurements [4]. This translates into a need to optimise the design and use of x-ray imaging
systems. It is generally recognized that even a 10% reduction in patient dose is a worthwhile
objective for optimisation. In this context it is important to note that the image quality should
always be sufficient for the clinical need.
Due to the increased need for quality assurance in diagnostic radiology, it has become
important to provide traceability of measurements in this field. The Standing Advisory
Committee “SSDL Scientific Committee” recommended in 1996 that the experience of the
IAEA in the field of standardization at radiotherapy and radiation protection levels for the
IAEA/WHO Network of SSDLs be extended to the field of x-ray diagnostics. This
recommendation has led DMRP to start the development of the necessary facilities and
procedures for the calibration of ionization chambers [5].
Various examination techniques are used in x-ray diagnostics. They include conventional
radiography, fluoroscopy and other interventional radiological procedures, mammography, CT
and dental. In some cases specialised dosimeters are required, whose design and performance
must be matched to the needs of the clinical measurement. The use of such dosimeters and/or
the interpretation of the results obtained may require specialised techniques and knowledge. In
addition there are special requirements for the calibration of such instruments at the SSDLs.
Methods to perform such calibrations are not yet completely developed. The most common
type of radiation detector for diagnostic radiological dose measurement is a parallel plate
ionization chamber. There may be special requirements for the calibration and use of each
type of chamber. All ionization chambers should have a sufficiently flat energy response over
the range of the relevant radiation qualities. Mammographic ionization chambers generally
require a thin entrance window and a construction using low atomic number materials, e.g. air
equivalent or plastic materials. A CT-chamber, often called a pencil chamber, has an active 1 In this paper the term conventional radiology is used to cover all x-ray imaging modalities other than dental
radiography, fluoroscopy, mammography and CT.

IAEA-CN-85-269
95
volume in the form of a thin cylinder about 100 mm in length. Its response should be uniform
along its entire axial length. In fluoroscopy there is a need to measure the input air kerma rate
to the image intensifier and the patient dose. The chambers used for each aspect need to be of
adequate design and size. Air Kerma Area Product (KAP) meters are also used in fluoroscopy.
They are mounted on the x-ray housing and their sensitive area extends over the entire cross-
section of the beam. The signal from a KAP meter is proportional to the product of air-kerma
and field size at any plane perpendicular to the beam axis. For the measurement of panoramic
dental examinations, ionisation chambers need to be cylindrical.
Although ionization chambers are the main devices used for dosimetric measurements, other
devices with special properties are frequently used. Important examples are semiconductor
diodes and thermoluminescent dosimeters (TLDs). Because of the inherent problems involved
in the use of these two devices, they should not be used for calibrations at SSDLs. They are
used for quality control and in clinical dosimetry.
The contrast in a radiographic image is mainly determined by the x-ray tube voltage. It is
standard practice, therefore, to measure this voltage as part of quality control. Non-invasive
instruments are mostly used for this purpose. Such instruments require special calibration
consideration [6].
It is obvious, that standardisation of procedures for measurements in the clinic and the SSDLs
is of great importance. The CoP will address both of these areas to bring coordination to them.
3. Present status of the code of practice
The working group established to prepare the CoP has met in November 2000 to review the
current status of dosimetry in diagnostic radiology and prepare an initial draft of the
document. Its basic concepts are briefly outlined below.
Requirements for calibrations at SSDLs
The chamber and electrometer (or charge-measuring device) both need to be calibrated at an
SSDL, either separately or as a system. The quality for which the calibration was performed
must be stated, since past work has indicated a significant energy dependence of response of
some chambers. For this reason, the SSDLs need to establish radiation qualities suitable for
each application. Radiation qualities as given in IEC 61267 [7] provide some guidance but
these are in the process of revision. Where such radiation qualities do not exist, appropriate
beams must be identified. Each SSDL must have chambers calibrated at the reference
radiation qualities. For a chamber with sufficiently flat energy dependence, interpolation can
be done for any intermediate point. Sufficiently flat energy response depends on the
application, e.g. for conventional x-rays this is a maximum variation within +3% across the
energy range. An application of this response is in the measurements of HVL with ionization
chambers. These measurements can be affected by the energy dependence of response [8],
and by the beam diameter used.
When choosing an instrument for dosimetry in diagnostic radiology, it is important to match
the instrument to the task. This will include the size and sensitivity of the instrument and its
response to different radiation qualities. The use of an appropriate instrument is essential. In
some cases, the commercially available instrumentation marketed for general or particular
applications does not meet these requirements [9] and there may be no internationally agreed
specification. This can create difficulties, particularly where there is no local expertise
available. Specific devices are designed for use in the clinic. For example, the KAP meter is a
very useful instrument for dosimetry in diagnostic radiology as ‘kerma-area product’ is more
IAEA-CN-85-269
96
directly related to radiation risk than dose itself. Opinion is divided about the calibration of
KAP meters, whether they should be calibrated at the SSDL or in situ. Examples of
calibration procedures are given by IPEM [10] and by Larsson et al. [11]. Semi-conductor
devices can be as small as TLDs and have the advantage that they allow real time
measurement. A problem is that the inherent response of semi-conductor devices is not
sufficiently flat. This problem is sometimes compensated for by the software corrections in
the instrument.
Clinical measurements
Many times it is preferable to make dose measurements using a phantom to simulate the
patient. When a phantom is used, the measured dose will depend upon the phantom shape and
size and it is essential that the phantom is standardised so that such variations are avoided.
Ideally, standard phantoms should be designed to offer the same primary attenuation and
scatter production as a representative patient. The phantom only needs to be representative of
average or mean values of a typical patient. It is not the intention that the result of dose
measurements with phantoms should equal that from measurements with patients. When a
phantom is used to simulate the patient, the x-ray equipment should be set up in the same way
as for the real examination. Dose measurements made at the surface of the phantom include
backscatter whereas those made free in-air do not. It is desirable to standardise the dose
specification to avoid ambiguity. In this regard, standardized worksheets will be provided for
each application. These worksheets will facilitate the international intercomparison of results.
Two applications are discussed below as representative of the needs suggested by the CoP.
Mammography
During the past few decades there have been significant advances in the equipment used for
mammography. Even when the latest equipment is used, there is considerable variation from
centre-to-centre in the choice of imaging parameters and techniques. Thus, there may be quite
large differences in breast dose. A review of the development and current status of dosimetry
for mammography is given in Dance et al. [12].
The most practical dose measurement for mammography is an estimate of the incident air
kerma at the surface of the breast (with or without backscatter). Since a low energy x-ray
spectrum is used for the examination, the dose decreases rapidly with increasing depth in the
breast. More appropriate quantities for specifying breast dose have therefore been suggested.
The use of the mean dose to the glandular tissues within the breast (MGD) has been generally
adopted. Direct measurement of MGD is not possible. Instead, use is made of conversion
factors that relate measurements of entrance air kerma to MGD. Several countries have
introduced protocols for dosimetry in mammography but there is wide variation in the
methodology suggested.
CT
CT examinations constitute about 4% of all radiographic examinations but can contribute 40%
of collective dose [13]. It is therefore of considerable importance to monitor the dose for such
examinations. In conventional CT scanning, the patient dose is built up from that received
from each individual CT slice. In-phantom measurements are more representative of the
patient dose. Standard phantoms are available for both body and head examinations [14] and
are in common use. Within the last decade helical CT scanning has been introduced. Care
must be taken to ensure that the guidance is appropriate for this imaging technique.
IAEA-CN-85-269
97
4. Conclusion
The need for standardization of dosimetry measurements in diagnostic radiology and for
calibrations of the measurement equipment is obvious. A limited international guidance is
available for the performance of measurements in the hospital. A few SSDL laboratories offer
a calibration service for diagnostic radiology instruments but a greater uniformity amongst the
SSDLs is needed. Methods to perform such calibrations are not yet completely developed. The
CoP should identify separately the requirements for conventional radiology, fluoroscopy,
mammography, CT and dental radiography. It is expected that the document will be published
in the beginning of 2003.
References
[1] INTERNATIONAL ATOMIC ENERGY AGENCY, Absorbed Dose Determination in
External Beam Radiotherapy: An International Code of Practice for Dosimetry based on
Standards of Absorbed Dose to Water”, Technical Report Series 398, in print
[2] UNITED NATIONS SCIENTIFIC COMMITTEE ON THE EFFECTS OF ATOMIC
RADIATION, UNSCEAR 2000 Report to the General Assembly with Scientific
Annexes, United Nations Sales Publication E.00.IX.3, New York (2000).
[3] INTERNATIONAL ATOMIC ENERGY AGENCY, International Basic Safety Standards
for Protection Against Ionizing Radiation and for the Safety of Radiation Sources: A
Safety Standard, Safety Series No.115 [Jointly sponsored by FAO, IAEA, ILO,
OECD/NEA, PAHO, WHO], IAEA, Vienna (1991).
[4] THE COUNCIL OF THE EUROPEAN UNION, Council Directive 97/43/Euratom of
30 June 1997 on health protection of individuals against the dangers of ionizing
radiation in relation to medical exposure, and repealing Directive 84/466/Euratom.
Official Journal of the European Communities L180 40 (1997) 22-27.
[5] PERNICKA, F., ANDREO, P., MEGHZIFENE, A., CZAP, L., GIRZIKOWSKI, R.,
Standards for Radiation Protection and Diagnostic Radiology at the IAEA Dosimetry
Laboratory, SSDL Newsletter 41 (1999)12-23.
[6] KRAMER, H.-M., SELBACH, H.-J., ILES, W. J., The practical Peak Voltage of
Diagnostic X-Ray Generators, British Journal of Radiology 71 (1998) 200-209.
[7] INTERNATIONAL ELECTROTECHNICAL COMMISSION, Medical electrical
equipment - Dosimeters with ionization chambers and/or semi-conductor detectors as
used in x-ray diagnostic imaging, IEC 61267, IEC, Geneva (1997).
[8] WAGNER, L. K., FONTENLA, D. P., KIMME-SMITH, C., ROTHENBERG, L. N.,
SHEPARD, J., BOONE, J. M., Recommendations on the Performance Characteristics of
Diagnostic Exposure Meters, Report of AAPM Diagnostic X-Ray Imaging Task Group
No. 6, Med. Phys. 19 1 (1992) 231-241.
[9] DeWERD, L.A., WAGNER, L.K., Characteristics of radiation detectors for diagnostic
radiology, Applied Radiation and Isotopes 50 (1999) 125-136.
[10] NATIONAL RADIOLOGICAL PROTECTION BOARD, National protocol for patient
dosimetry measurements in diagnostic radiology, Didcot (1992).
[11] LARSSON, J.P., ALM CARLSSON, G., PERSLIDEN, J., SANDBORG, M.,
Transmission ionization chambers for measurements of air collision kerma integrated
over beam area. Factors limiting the accuracy of calibrations, Phys Med Biol.41 (1996)
2381.

IAEA-CN-85-269
98
[12] DANCE, D.R., SKINNER, C.L, ALM CARLSSON, G., Breast dosimetry. Applied
Radiation and Isotopes 50 (1999) 185-203.
[13] JESSEN, K.A., SHRIMPTON, P.C., GELEIJNS, J., PANZER, W., TOSI, G., Dosimetry
for optimisation of patient protection in computed tomography. Applied Radiation and
Isotopes 50 (1999) 165-172.
[14] AMERICAN ASSOCIATION OF PHYSICISTS IN MEDICINE, Standardized methods
for measuring diagnostic x-ray exposures. AAPM Report 31, AAPM, New York (1990).

IAEA-CN-85-288
99
QUALITY CONTROL AND PATIENT DOSES FROM X-RAY EXAMINATIONS
IN SOME HOSPITALS IN THAILAND
P. Plainoi, W. Diswath, N. Manatrakul
Ministry of Public Health, Nonthaburi, Thailand
Abstract
Quality control measurements on 203 diagnostic X-ray units were carried out in 126 hospitals in the central
region of Thailand during 1998-2000. The measurements consisted of tube voltage, half-value layer (HVL),
exposure time, radiation output, beam alignment, light beam diaphragm and entrance surface dose (ESD) in four
common radiographic procedures namely adult chest PA, adult mass chest PA in mobile bus unit, abdomen AP
and mammography (cephalo caudal view). ESD measurements of 320 examinations were performed using
parallel plate ionization chamber and Keithley model 35050A Dosimeter on 192 X-ray units (conventional and
mobile) and 11 mammography units.
The analysis of test results showed that:
1. 92% had X-ray tube voltage within the tolerance limit of 10% and HVL 3.03 mmAl � 0.55 SD at 80 kVp
measured
2. 90% had exposure time within tolerance limit of 10%
3. 86% and 98% had acceptable beam alignment and light beam diaphragm
4. 95% had radiation output � 25 �Gy at 1 m. for true 80 KVp
5. It was found that the ESD values were
�� adult chest (PA) varied from 0.18 mGy to 1.17 mGy (mean 0.2021 � 0.2218 SD)
�� adult mass chest (PA) varied from 0.043 mGy to 1.03 mGy (mean 0.2935 � 0.2195 SD)
�� abdomen (AP) varied from 0.302 mGy to 6.30 mGy (mean 2.177 � 1.4818 SD)
�� mammography (cephalo caudal view) varied from 3.49 mGy to 12.21 mGy (mean 7.788 � 2.9896
SD)
Further surveys are necessary and are being done to include measurements of image quality and for propagation
of quality assurance activities in Thailand so as to reduce patient doses while maintaining the image quality.
1. Introduction
Diagnostic radiology is the main contributor to the man-made exposure of general population.
Since Quality Assurance (QA) programmes ensure high quality diagnostic images with the
least possible radiation dose to the patient, all countries have been recommended to introduce
programmes for their radiological facilities. In Thailand periodic quality control of all X ray
equipment in use is required by legislation. For monitoring purposes radiation leakage, total
beam filtration, exposure time, tube voltage (kVp), radiation output, accuracy of beam
limiting devices and adequacy of room shielding design were measured. Where available,
tolerance limits established by FDA, NCRP, AAPM and ACR were used as a reference [1-4].
According to a programme of patient dose measurements was introduced as part of the quality
assurance service already provided for X-ray departments throughout many countries. The
emphasis that each patient exposure should be as low as reasonably practicable and
encouragement to X ray departments to formulate a strategy for dose reduction [5]. We,
therefore, initiated to add the patient dose measurement of entrance surface dose in four
common radiographic procedures into our routine protocol as a pilot study. The performance
characteristics of 203 diagnostic X-ray units were carried out in 126 hospitals during 1998-
2000. These diagnostic units were located in the central region of Thailand in government and
private hospitals; they covered the whole range of commercial equipment in Thailand. They
represent 8% of the total diagnostic units of central region and 3% of the country.

IAEA-CN-85-288
100
2. Materials and methods
The quality control measurements were carried out on 203 X ray units. The measured units
consisted of conventional and mammographic X ray units. Performance measurements were
focused on tube voltage, beam quality (half - value layer), exposure time, radiation output,
beam alignment and accuracy of beam limiting devices, and entrance surface dose (ESD) in
four common radiographic procedures namely adult chest PA, adult mass chest PA in mobile
bus unit, abdomen AP and mammography (cephalo caudal view).
The parameters which were measured are listed in Table 1 and Table 2 for conventional and
mammography X ray units respectively, as well as the acceptability criteria [1-4]. The X ray
tube potential and exposure time were measured at 60, 70, 80, 90 and 100 kV using Keithley
dosimeter/kVp readout model 35050A and kVp divider model 35080A at 56 cm. X ray source
to table top.
The X ray beam quality, radiation output and radiation output reproducibility were performed
at 80 kV actual beam for 20 mAs at 40 cm. from the X ray tube focus to chamber using
Keithley dosimeter/kVp readout model 35050A, ionization chamber model 96035 B and 100
cm. aluminuim sheets (No.1100) were insert between the tube and ionization chamber in case
of beam quality measurement. The linearity of the radiation output (variation of the output as
a function of mAs) was checked between 5 mAs and 64 mAs.
The correspondance between the light beam and the actual X ray beam, and X ray beam
alignment were tested using the collimator and beam alignment test tools by RMI at 100 cm.
from the X ray tube focus to the test tool which was placed on the table.
The patient doses for conventional X ray units, were calculated measuring the X ray output
and using the tabulated exposure parameters of each X ray examination used in the hospital in
question. While the surface dose of the mammographic X ray units were measured on RMI
acryric phantom as required by the American College of Radiology (ACR) with the Keithley
dosimeter/kVp readout model 35050A, ionization chamber model 96035 B using the local
examination technique in each place.
Table 1. Acceptability criteria of the measured parameters for conventional X ray units
kV accuracy �10%
kV reproducibility 5%
Filtration at 80 kV actual beam � 2.3 mmAl
Tube output (80 kV at 1 m from the focus) �25 �Gy(mA.s) -1
Reproducibility of the tube output 5%
Linearity of the tube output �10%
Exposure time
�� Accuracy �10%
�� Reproducibility 5%
Correspondance light beam and actual X ray beam � 2% of FID
Leakeage radation at 1m from the focus in any direction �1 �Gy.s -1

IAEA-CN-85-288
101
Table 2. Acceptability criteria of the measured parameters for mammography X ray units.
Results
kV accuracy �5%
kV reproducibility 2%
Filtration at 30 kV actual beam � 0.3 mmAl
Reproducibility of the tube output 5%
Linearity of the tube output �10%
Automatic exposure cells reproducibility 5%
Correspondance light beam and actual X ray
beam � 1% of FID
Leakage radiation at 1 m from the focus in any
direction �1 �Gy.s
-1
The analysis of X ray units test results showed that 92% had acceptable deviation between
nominal and measured values of X ray tube voltage with in the tolerance limit of 10% and
HVL 3.03 mm.Al � 0.55 SD at 80 kVp actual beam whereas 90% of the X ray units meet the
recommended limits of exposure time (deviation � 10%). Of the X ray generators assessed,
84% had tolerable (�Gy/mAs) linearity. For the light beam and actual X ray beam 2% of the X
ray units showed a difference of more than 2% of FID (focus to image distance). Moreover, in
86% of the X ray tubes, the beam was properly aligned. Measurements on the X ray tubes
showed that 96% had adequate beam filtration (HVL � 2.3 mm.Al, 80 kVp) and 95% had
radiation output less than 25 �Gy at 1 m. for true 80 kVp whereas in 98% exposure
reproducibility had acceptable variation within the tolerance limit of 5%.
The entrance surface doses for three main types of examinations (some variety of chest such
as adult chest PA nonbucky, adult chest PA with bucky and adult mass chest PA in mobile bus
units, abdomen, and mammogram) which were measured during the years 1998-2000, are
presented in Table 3.
Figures 1 to 5 show the entrance surface dose of three categories of chest techniques,
abdomen and mammogram respectively in term of mode (frequency of data) and median
values for entrance surface dose of each technique.
Table 3. Entrance surface dose for three main types of examinations in different years
Examination mean ESD (mGy)
1998 1999 2000
Adult Chest PA
(without bucky)
0.25 0.31 0.22
Adult chest PA (with
bucky)
0.25 0.22 0.30
Adult mass chest PA
(mobile bus unit)
0.31 0.47 0.30
Abdomen 2.79 2.84 1.96
Mammogram 8.81 11.07 7.65

IAEA-CN-85-288
102
Figure 1. Entrance surface dose of adult chest PA nonbucky
0
2
4
6
8
10
0.04 0.05 0.06 0.07 0.08 0.09 0.10 0.11 0.12 0.13 0.14 0.15 0.16 0.17 0.18 0.19 0.20 0.21 0.22 0.23 0.24 0.25 0.26 0.27 0.28 0.29 0.30
Entrance surface dose (mGy)
Frequency
Figure 2. Entrance surface dose of chest PA with bucky stand
0
2
4
6
0.08 0.09 0.10 0.11 0.12 0.13 0.14 0.15 0.16 0.17 0.18 0.19 0.20 0.21 0.22 0.23 0.24 0.25 0.26 0.27 0.28 0.29 0.30 0.31
Entrance surface dose
Frequency
Figure 3. Entrance surface dose of adult mass chest PA in mobile bus units
0
1
2
3
0.050.050.060.070.080.100.110.110.120.130.130.140.150.160.170.180.180.190.200.200.220.230.260.270.270.290.310.320.330.330.340.340.350.350.370.370.380.40
Entrance surface dose
Frequency

IAEA-CN-85-288
103
Figure 4. Entrance surface dose of abdomen
0
5
10
15
0.35 0.46 0.60 0.61 0.92 0.96 0.99 1.03 1.04 1.05 1.07 1.08 1.10 1.10 1.10 1.10 1.16 1.21 1.22 1.25 1.26 1.26 1.26 1.26 1.26 1.28 1.29 1.30 1.30
Entrance surface dose
Frequency
Figure 5. Entrance surface dose of MAMMOGRAM
0
2
4
6
8
10
4 5 6 7 8 9 10 11 12 13 14 15
Entrance surface dose
Frequency
3. Discussion
The results presented here confirm that the acceptable level of the quality control in diagnostic
X ray equipment have led to the improvement and reduction in patient doses. In addition, the
procedure which was adopted has been well received by the radiologists, commercial firms
and public services. This encouraged us to extend the inspection to technical parameters such
as focus, image quality, image recording system, television monitors, film storage conditions,
and film development methods. The implemention of Quality Assurance in Thailand may take
time. Staff training and administrative actions of the radiation protection authorities will
improve the existing situation for the benefit of patients and staff.
References
[1] Title 21, Code of Federal Regulations, Part 800-1299, FDA, U.S. Government Printing
Office, Washington, D.C., 1991 and revisions.
[2] National Council on Radiation Protection and Measurements: Quality Assurance for
Diagnostic Imaging Equipment. NCRP 99, NCRP, Bethesda, Meryland, 1988.
[3] AAPM report No. 31, Standardized Methods for Measuring Diagnostic X-Ray
Exposures, AAPM Diagnostic X-Ray Imaging Committee TG #8 (1991).
[4] American College of Radiology, Mammography Quality Control Radiologist's manual,
Radiologic Technologist's Manual and Medical Physicist's Manual, 1992.
[5] Guidance Note PM77 from the Health and Safety Executive. Fitness of Equipment used
for Medical Exposure to Ionizing Radiation (1992).

IAEA-CN-85-205
104
QUALITY CONTROL OF DIAGNOSTIC X-RAY UNITS
O. Marinkovic, S. Milacic, D. Jovicic, I. Tanaskovic
CCS Institute of Occupational and Radiological Health, Belgrade, Yugoslavia
Abstract
The quality control program for diagnostic x-ray units has started at the Institute of Occupational and
Radiological Health during 1990. It includes, among other measurements, reproducibility of dose, high voltage
and exposure time. Dose reproducibility was less than 5% for 70% of tested x-ray units. The exposure time and
high voltage reproducibility were less than 5% in 60% cases. The cassettes with amplifying foils made from
components of rare earth are used in 10% of all x-ray departments. It is very important to work as much as it is
possible to modernize general infrastructure as the radiological protection of patients would be better.
1. Introduction
All ionizing irradiation sources in FR Yugoslavia are constantly subjected to the regular
dosimetric control performed by specialized institutions authorized by Federal legal
regulations.
The medical radiological equipment is of the special importance as includes radiological
protection of patient, besides public (and/or environment) and occupational protection. The
radiological protection of patient has specific characteristics in diagnostic radiology,
radiotherapy or nuclear medicine.
In the diagnostic radiology if the image is not of adequate quality it may lead radiologist to an
incorrect diagnosis. If the quality of the radiograph is so poor that it cannot be used, than the
patient will be exposed again. That cause an unjustified increase in patient dose and increase
in the cost of diagnosis.
The most objective evaluation of image quality is the physical measurement of X-ray unit
parameters. The quality control program for diagnostic X-ray units has started at the Institute
of Occupational and Radiological Health during 1990. The certain results of generator
investigations to date are present in this paper.
2. Instruments and methods
The kVp applied to the X-ray tube should be checked to ensure that it is in reasonable
agreement with the kVp indicated on the control panel. The direct measurement of kVp is not
practicable as a routine test. The most common indirect method is to determine the peak
voltage from measurements of radiation quality. We have used digital kVp meter, Victoreen,
Model 07-473 or Victoreen, NERO, Model 6000M. The measurements were done in the
interval from 60 to 100 kVp in steps of 10 kV.
The radiation output was measured for dose reproducibility testing by Victoreen RAD
CHECK Plus, Model 06-526 or Victoreen, NERO, Model 6000M, with parameters: 100 kVp,
320 mAs and distance 1m from focus.
And, for the exposure time reproducibility testing we have used instruments Victoreen, Model
07-457 or Victoreen, NERO, Model 6000M. The duration of scannings was selected at the
control panel as 1 s, 0.5 s or 0.32 s.

IAEA-CN-85-205
105
3. Results
During last ten years about 250 X-ray tubes have been tested annually. But, 318 X-ray tubes
have been tested from January, 1999 to September, 2000.These results are presented in this
paper as they represent the quality level of X-ray units.
A patient can receive widely different exposure depending on the facility. In the Table I are
given doses per mAs for different X-ray generators at the patient position.
Table I. The dose in mGy/mAs
The type of
X-ray unit
�D
�
Dmin
Dmax
half-wave 1.3 0.500 0.054 2.807
6,12- rectifiers 0.117 0.060 0.015 0.352
�D – mean value; � - standard deviation; Dmin , Dmax - extreme value
The results of dose, high voltage and exposure time reproducibility are shown according
strong criteria (less than 5%), and following the accepted criterion by our legal regulations
(less than 10%). They are given in the Table II.
Table II. The reproducibility for various type of X-ray units
Reproducibility
Number of
tested units Measured deviations
< 5 % > 5% and <10% > 10 %
DOSE
318
72.54%
10.96%
16.50%
kVp (for 80 kV)
249
59.73%
35.71%
4.56%
TIME
318
63.28%
15.44%
21.28%
4. Discusion
Although the majority of analyzed generators (83.5%) showed satisfied reproducibility of dose
(less than 10%), the mean values of measured quantity ranged over two orders of magnitude
due interaction of numerous factors.
There have been 79 dental X-ray tubes tested. About 30% units have had inaccurate timer, and
were repaired after control.
The cassettes with amplifying foils made from components of rare earth are used in 10% of all
x-ray departments.
It is very important to work as much as it is possible to modernize general infrastructure as the
radiological protection of patients would be better.
References
[1] Quality Assurance in Diagnostic Radiology, WHO, Geneva, (1982).
[2] CIRAJ O., et al., “Dose reproducibility for diagnostic X-ray units”, (Proc. XX Yu
Symp.on Rad. Pr., Tara, 1999), Vinca Press, Belgrade, (1999) 273-276.
[3] TOMASEVIC M., et al., “Implementation of the quality assurance programe of the X-
ray radiation in Serbia”, (Proc. IRPA 8, Montreal, 1992), Vol 1, 219-222.

IAEA-CN-85-107
106
DIGITAL TECHNOLOGY INFLUENCE ON PATIENT DOSE IN THE
RADIOLOGICAL EXAMINATION OF THE UPPER DIGESTIVE APPARATUS
E. Núñez, X. Pifarré, J. Ruiz, C. Escalada, M.C. Paredes
Hospital Universitario Clínica Puerta de Hierro, Madrid, España
Abstract
The radiological study of the superior digestive apparatus (oesophagus, stomach and duodenum) throughout the
barium contrast is a kind of exploration which provides medium-high dosage levels for patients. In these studies
the fluoroscopy and the acquisition of images for the diagnosis are shared. The acquisition of images, up until a
few years ago, was accomplished through radiographic film and chemical processing; nowadays, the new
generation of image-intensifier tube incorporates a new utility to digitally capture the images.
This new capturing method, with higher sensitivity, allows us to obtain images with a mAs 5 times smaller than
the classical system of radiological film (reduction of the dosage up to 80%). This leads us to expect very
important reductions in dosage in the studies conducted with this new technology. Nonetheless, these
expectations haven't been reflected in the dosimetric samples that our work team has conducted in several centers
of the community of Madrid these past years. In this work, the reasons of this phenomenum are analyzed.
1. Introducción
El estudio radiológico del aparato digestivo superior (esófago, estómago y duodeno) mediante
contraste de bario es un tipo de exploración que conlleva niveles de dosis medios-altos para
los pacientes. La bibliografía cita valores de alrededor de 8 mSv de dosis efectiva [1]. En estos
estudios se simultanea el uso de escopia y la adquisición de imágenes para el diagnóstico.
Suelen usarse equipos telemandados con intensificador de imagen.
La adquisición de las imágenes, hasta hace unos años, se llevaba a cabo mediante películas en
chasis con pantallas de refuerzo y procesado químico de las mismas; en la actualidad, las
nuevas generaciones de telemandos implementan una utilidad de captura digital de las
imágenes a través del intensificador. Este nuevo modo de captura, de mayor sensibilidad,
permite conseguir imágenes, a igualdad de kilovoltajes, con un mAs cinco veces menor que el
sistema clásico de película+pantalla de refuerzo (reducción de dosis de hasta un 80%). Esto
hace esperar unos niveles de reducción de dosis muy importantes en los estudios realizados
con esta nueva tecnología.
Sin embargo, estas expectativas no se han reflejado en los muestreos dosimétricos que nuestro
grupo de trabajo ha llevado a cabo en los últimos años en varios centros sanitarios públicos de
la Comunidad de Madrid. En este trabajo se analizan las razones de este fenómeno.
2. Objetivos
El objetivo del presente trabajo es analizar la influencia de los sistemas digitales de
adquisición de imagen en las dosis a pacientes en los estudios del aparato digestivo superior
(esófago-estómago-duodeno).
3. Material y método
El estudio se basa en la recogida de datos dosimétricos en muestras suficientes de pacientes y
en su posterior análisis estadístico. Las medidas se han realizado en cinco equipos distintos
ubicados en cuatro centros de la red pública sanitaria española. Los cuatro centros se
encuentran en la Comunidad Autónoma de Madrid y se trata de dos Hospitales grandes y dos

IAEA-CN-85-107
107
Centros de Especialidades. Dos de los equipos incorporan sistemas digitales de adquisición a
través de intensificador y los otros tres funcionan con película y pantallas de refuerzo (tabla I).
En estos tres casos la sensibilidad de las cadenas de imagen es similar, con una velocidad
relativa de 400.
Tabla I. descripción de los equipos en los que se ha medido
Equipo Marca Modelo Ubicación Adquisición Línea de imagen
A General
Electric
Prestilix 1600 X Hospital 1 Digital -
B Philips Multidiagnost 3 Hospital 2 Digital -
C General
Electric
Telegem II Hospital 2 Película Agfa Ortho Regular/
Agfa ST-G2
D General
Electric
Prestilix 1600 X Centro Especialid.
1
Película Agfa Ortho Regular/
Agfa ST-G2
E General
Electric
Telegem II Centro Especialid.
2
Película Kodak Lanex
Regular/ Kodak PDS
Se han medido exclusivamente estudios gastrointestinales realizados mediante ingestión de
contraste (papilla de bario), también llamados EED's (Esófagos-Estómagos-Duodenos). Para
cada paciente se han registrado los siguientes datos de interés:
1. Número de adquisiciones de imagen
2. Tiempo total de escopia (en minutos)
3. Producto dosis x área (en cGy x cm2)
4. Técnica media de la escopia (kV y mA)
5. Técnica de cada adquisición (kV y mAs)
Las medidas del producto dosis x área se llevaron a cabo con una cámara de transmisión
Diamentor de PTW-Freiburg que, en todos los casos, se instaló en el colimador de los
equipos. Dicha cámara estaba convenientemente calibrada y sus lecturas eran corregidas por
los factores ambientales de Presión y Temperatura. El resto de datos son proporcionados por
los mismos equipos de Rayos-X en sus consolas de control.
Paralelamente se ha medido el rendimiento de los cinco equipos para aquellos kilovoltajes de
interés (kV’s promedios en escopia y adquisición); estas medidas se han realizado con un
analizador de haces PMX-III de RTI Electronics.
Las medidas presentadas en este trabajo han sido recogidas durante el periodo 1997-1999 por
este Servicio de Radiofísica, dentro del proceso de registro de datos dosimétricos obligatorio
por ley en España en todas las instalaciones de Radiodiagnóstico médico desde 1996 [2], [3].
Se han rechazado medidas sobre pacientes de complexiones extremas (delgados y/o gruesos).
4. Resultados
En la tabla II se presentan los resultados obtenidos. La tabla contiene el tamaño de la muestra
en cada caso, los productos dosis x área, datos radiológicos correspondientes a la escopia (kV
medios, mA·min promedio por estudio y tiempos medios de escopia) y datos radiológicos
correspondientes a adquisición de imagen (kV medios, mA·min promedio por estudio y
número medio de adquisiciones por estudio).

IAEA-CN-85-107
108
Tabla II. registro de datos dosimétricos y técnicas radiológicas según centros
Equipo Tamaño
muestra
Producto
dosis x área
(cGy x cm2)
Datos de escopia Datos adquisición
kV
medio
mA·min
promedio
debido a
escopia
Tiempo
medio de
escopia
(minutos)
kV
medio
mA·min
promedio
debido a
adquisición
Número
medio de
adquisiciones
A (digital) 54 2796 101 10.0 4.0 123 0.7 17.8
B (digital) 30 2384 81 18.7 5.5 134 1.0 21.3
C
(película)
13 3569 119 14.0 4.5 116 3.2 18.1
D
(película)
41 1530 111 5.5 2.0 110 4.1 16.6
E
(película)
47 1696 111 2.0 1.4 111 2.0 14.2
Lo que se quiere determinar es qué proporción de la dosis-paciente es atribuible a la escopia y
cuál lo es a la adquisición de imagen. Para ello no basta con comparar los mA·min promedios
para cada uno de los dos conceptos, ya que los kV’s promedios de escopia y adquisición
pueden ser distintos. Como ejemplo, cabe señalar el equipo B: un mA·min de escopia (a 81
kV) producirá una dosis menor que un mA·min de adquisición (a 134 kV).
Lo que se ha hecho es medir para cada equipo y cada kilovoltaje de interés los rendimientos a
1 metro (Tabla III). Estos rendimientos permitirán ponderar los mA·min de escopia y los de
adquisición para hacerlos comparables, aún a pesar de haber sido generados a distintas
energías.
Tabla III. Rendimientos a 1 metro (X), en ����Gy/mAs, para cada equipo y para cada kV de interés
Modo
trabajo
Equipo A Equipo B Equipo C Equipo D Equipo E
KV X
(�Gy/mAs)
kV X
(�Gy/mAs)
kV X
(�Gy/mAs)
kV X
(�Gy/mAs)
KV X
(�Gy/mAs)
Escopia 101 90.0 81 57.5 119 107.5 111 137.5 111 107.8
Adquis. 123 130.0 134 153.8 116 102.5 110 136.3 111 107.8
�
�
Con estos rendimientos se puede determinar la relación entre la dosis recibida por el paciente
procedente de la escopia y la dosis recibida procedente de la adquisición de imágenes. A esta
relación la llamamos r y la calculamos mediante la siguiente relación:
r = (mA·min escopia · X kV medio escopia) / (mA·min adquisición · X kV medio adquisición)
donde X es el rendimiento para cada uno de los kV’s indicados en los subíndices y mA·min es
el mA·min medio por estudio imputable a escopia y a adquisición respectivamente.
La tabla IV contiene los resultados obtenidos para el parámetror.

IAEA-CN-85-107
109
Tabla IV. relación entre las dosis imputables a los tiempos de escopia y las imputables a la
adquisición de imagen
Equipo Datos de escopia Datos de adquisición Dosis debido a escopia /
dosis debido a adquisición
( r )
kV medio mA·min medio
por estudio
kV medio mA·min medio
por estudio
A 101 10.0 123 0.7 9.9
B 81 18.7 134 1.0 7.0
C 119 14.0 116 3.2 4.6
D 111 5.5 110 4.1 1.3
E 111 2.0 111 2.0 1.0
5. Conclusiones
La primera conclusión es que la mayor reducción de dosis en este tipo de estudios se consigue
al disminuir los tiempos de escopia; los equipos D y E, aún con un sistema de adquisición
convencional, son los que menores productos dosis x área han proporcionado a los pacientes
debido a sus reducidos tiempos medios de escopia.
No parece que la introducción de sistemas digitales de adquisición influya tanto en la
reducción de dosis. Así, en el equipo C, con adquisición convencional y tiempos altos de
escopia, la introducción de un sistema digital de captura de imagen podría reducir los 3.2
mA·min que se dedican actualmente a adquisición hasta un 0.7 mA·min (equivalente al de la
sala A). No obstante, si se mantienen los 14.0 mA·min usados en escopia, la reducción final de
la dosis (de 17.2 mA·min a 14.7 mA·min) no representará más que una reducción del 15%,
lejos de aquel 80% que habíamos previsto. (1)
Este factor de disminución será más importante en equipos en los que se trabaja con bajos
tiempos de escopia. Así, las salas D y E, de seguir trabajando en las actuales condiciones,
conseguirían reducir sus dosis en un 35% y un 40% respectivamente, al implementar un
sistema de captura digital de imágenes.
Por otra parte existe la sospecha de que la operativa de un sistema digital, mucho más simple
que la de un sistema convencional de chasis con película, puede conllevar la captura de un
número mayor de imágenes. En los equipos A y B, la media de adquisiciones por estudio es de
19.1, mientras que en los tres restantes este valor es de 15.7. Hay que tener en cuenta que en
un sistema digital se capturan imágenes sin más que pulsar un botón; el sistema clásico
supone la colocación de chasis en la bandeja, retirada del mismo y procesado en reveladora
luz-día o cuarto oscuro.
Referencias
[1] Calzado, A. et al., The British Journal of Radiology, 1991; 64.
[2] Real Decreto 2071/1995 de 22 de Diciembre (Boletín Oficial del Estado nº 20 de 23 de
Enero de 1996). Ministerio de la Presidencia.
[3] Real Decreto 1976/1999 de 23 de Diciembre (Boletín Oficial del Estado nº 311 de 29 de
Diciembre de 1999). Ministerio de la Presidencia.

IAEA-CN-85-257
110
RADIATION PROTECTION AND QUALITY ASSURANCE
IN DENTAL RADIOLOGY: I. INTRAORAL RADIOGRAPHY
Y. Martinez-Beneyto, M. Alcaraz, S. Jódar-Pórlan, A.M. Saura-Iniesta
Area de Radiología y Medicina Física, Universidad de Murcia, Espinardo, Spain
E. Velasco-Hidalgo
Unidad Técnica de Protección Radiológica ASIGMA S.A., Cartagena, Spain
Abstract
This paper studies 2524 official reports on quality assurance in dental radiography, made in the context of the
three first revisions of these dental clinics as a result of the entry into force of the regulations establishing the
duties for this type of facilities. In the results section we present a quantitative analysis of the facilities equipped
with an intraoral device, making a especial reference to the brands they have available, as well as their physical
features (KV, mAs, filtration, length of cone) and the deviations detected in their operation. Some of the features
in the process of obtaining radiological images at those facilities (Film control, development time, liquid
renewal) are determined, and the average dose of ionizing radiation used in order to obtain the radiological image
of the same tooth is presented. This paper shows, in a quantitative way, the characteristic features of intraoral
dental radiology in our medium. The study is intended to be continues during the next years, what would allow
the assessment of the prospective improvement in dental radiological performances as a result of the newly
established regulations.
1. Introducción
La radiología dental es la exploración de diagnóstico radiológico más frecuente del mundo
industrializado y representa casi el 25% de todos los exámenes radiológicos realizados en la
Unión Europea.
En 1996 se instauró una nueva normativa en la que, con carácter de norma básica sanitaria, se
establecen los criterios de calidad en radiodiagnóstico para mejorar el acto radiológico médico
y evitar exposiciones inadecuadas o excesivas. Como consecuencia de su entrada en vigor, las
clínicas odontológicas que utilizan este tipo de aparataje radiológico dental, se han ido
sumando al proceso de control de calidad realizado por unidades técnicas, instituciones u
organismos previamente homologados por el Consejo de Seguridad Nuclear.
En este trabajo se presenta el primer análisis cuantitativo de los parámetros controlados en
estos informes preceptivos de control de calidad y supone una revisión del proceso de
obtención de imagen radiológica en estas clínicas odontológicas. Esto podría representar la
situación actual de la radiología dental intraoral en nuestro país.
2. Material y método
Se estudian 2524 informes oficiales de control de calidad en radiodiagnóstico de clínicas
odontológicas en las dos primeras revisiones de la instalación radiológica como consecuencia
de la entrada en vigor del Real Decreto 2071/1995, por el que se establecen los criterios de
calidad en radiodiagnóstico. Los informes se han realizado desde la segunda mitad del año
1996 hasta diciembre de 1998, por la U:T:P:R Asigma S:A., y corresponden
fundamentalmente a instalaciones de carácter privado. Todas las clínicas habían sido
previamente verificadas por diversas Unidades Técnicas de Protección Radiológica
homologadas por el Consejo de Seguridad Nuclear. Todas las clínicas se encontraban
legalmente autorizadas como instalaciones de rayos X con fines de diagnóstico dental en el
momento de la realización de los informes.

IAEA-CN-85-257
111
3. Resultados
Las clínicas estudiadas poseen algún tipo de aparatos de radiodiagnóstico para radiografía
intraoral y se encuentran ubicadas en territorio español, fundamentalmente en tres
comunidades autónomas españolas: Andalucía (1105/2524), Murcia (383/2524) y Comunidad
Valenciana (361/2524).
Los resultados obtenidos contabilizan 52 modelos de aparatos de rayos X para radiografía
intraoral, correspondientes a 22 fabricantes diferentes, y en donde estaca la casa Trophy con
cerca del 59.74% (1524/2551) de todos los aparatos intraorales descritos. Estos aparatos
funcionan con valores de kilovoltaje que oscilan entre los 50 kV y los 70 kV como valores
mínimo y máximo respectivamente, funcionando el 71.36% (1563/2190) de los equipos con
valores de 70 kV; la filtración del haz primario de radiación ha variado entre los 0.4 mm y los
3.4 mm de Al como valores extremos, observándose que el 98.85 % (2495/2524) de los
equipos incorpora valores de filtración superior a 1.5 mm de Al, valor recomendado
actualmente por la Unión Europea para la utilización de aparatos que funcionen a menos de 70
kV. Los equipos incorporan valores de miliamperaje que oscilan entre los 7-11 mA, siendo el
75.78% (1912/2523) de estos aparatos los que funcionan con 8 mA. La longitud del colimador
que se utiliza para establecer la distancia recomendada entre el foco y la piel del paciente ha
variado desde la inexistencia del mismo en algún caso hasta los 40 cms, según modelos
descritos; el 87.47% de los equipos utiliza colimadores de 20 cm de longitud.
Los parámetros obtenidos sobre el funcionamiento del aparato estudiado en cada una de las
clínicas dentales han puesto de manifiesto que el 10.61 % (268/2524) de los aparatos
presentaban alteraciones superiores al 20 % en alcanzar el kV que venía descrito por el
fabricante del aparato, un 7.05% (178/2524) de los equipos presentaban alteraciones en el
tiempo de exposición marcado por el cronómetro del aparato y un 9.23% (223/2524) de las
instalaciones presentaban desviaciones superiores al 20% en el rendimiento del tubo de rayos
X (dosis de radiación por unidad de tiempo, mAs). Otras alteraciones importantes se han
detectado con una frecuencia mucho menor; desviaciones en la reproducibilidad de la
linealidad (no hay aumento de la dosis proporcional al tiempo de exposición) en un 4.36%,
pero durante las dos primeras revisiones se observó además desviaciones en la
reproducibilidad de la dosis ( una misma técnica de exposición produce diferente dosis de
radiación)(3/1370) y reproducibilidad del tiempo (una misma técnica de exposición se realiza
con diferente tiempo de exposición) (3/1370).
Sólo el 16.14% (388/2404) de las instalaciones dispone de un disparador fijo instalado fuera
de la sala de exploración, aunque un 82.53% (1984/2404) de las instalaciones dispone de un
cable alargador de una longitud mayor de 2 metros. Se ha puesto de manifiesto que durante la
segunda revisión se produce un aumento significativo de las instalaciones las que ubicaron
disparadores fijos situados fuera de la sala de exposición (5.54% anual). Además se ha
constatado la utilización de cables disparadores de menos de 1 metro de longitud, e incluso la
instalación de un dispositivo de exposición fijo dentro de la sala de exploración. Respecto a la
señal acústica-luminosa de exposición a la radiación cabe reseñar que en el 4.86 % (122/2508)
de los informes revisados esta señal no funciona.
Las películas radiográficas intraorales más utilizadas en la clínica diaria dental ha sido la
fabricada por la casa Kodak, siendo el modelo Ultraspeed, de sensibilidad D, la utilizada por
el 75.77% (1561/2060) de las clínicas; observándose un aumento significativo del 10.94% en
la utilización de este tipo de película durante la segunda revisión (1998) con respecto de la
primera (1996-1997). Solamente el 16.31% (336/2060) de las instalaciones utiliza películas de
sensibilidad E, tipo Ektaspeed de Kodak, películas que disminuyen un 50% la dosis de

IAEA-CN-85-257
112
radiación a la que se expone el paciente. El sistema digital de obtención de imagen, se utiliza
en cerca del 5.3% (115/2166) de las instalaciones revisadas, aumentando esta cifra en un
2.55% durante la segunda revisión efectuada en el año 1998. Las películas radiográficas
intraorales se almacenan dentro de la sala de exploración en el 38.67% (741/1916) de las salas
dentales, mostrándose una disminución significativa (23.66%) de las instalaciones que
seguían almacenándolas dentro de la sala durante la segunda revisión. Generalmente se
controla la fecha de caducidad de las películas (96.9%:1814/1872) por el personal que trabaja
en la instalación.
El revelado radiográfico mayoritariamente es un revelado manual (88.20% (1824/2066), que
suele realizarse a temperatura ambiente en el 99.9% de las instalaciones en donde se realiza de
esta forma. Una parte importante de las instalaciones estudiadas (77.25% (1389/1798)) admite
no mantener un tiempo de revelado o procesado radiográfico fijo, la renovación de los
líquidos es semanal en el 73.42% (1293/1761) de las instalaciones.
La dosis de radiación estimada en dichas instalaciones odontológicas para la exposición de un
molar superior en las condiciones habituales de cada sala ha puesto de manifiesto que una
dosis inferior a 5 mGy es la empleada en el 83.35% (2083/2499) de las instalaciones
odontológicas, que alcanzaría hasta el 98.2% (2454/2499) si se establece en 10 mGy la dosis
máxima empleada para obtener dicha imagen radiológica. La dosis media empleada en dicha
exploración atendiendo a todos los informes que recogen este dato es el 4.14 mGy,
observándose una disminución de un 30 % en la dosis media de radiación empleada durante el
años 1998 con respecto a los años 1996-1997. El 93.5% de las instalaciones cumpliría con las
recomendaciones oficiales actuales de utilizar dosis de radiación inferiores a 7 mGy en esta
exposición. En la actualidad se esta llevando a cabo el estudio de los informes
correspondientes a la tercera revisión (1999), y se han obtenido datos de dosis medias para
dicha exploración de 3.18 mGy , que supone una dosis inferiores a la empleada en la primera
revisión (1996-19979) de 4.87 mGy, y a los 3.41 mGy empleados durante la segunda revisión
efectuada en 1998.
4. Discusión
En términos generales, los equipos para radiología intraoral que se han encontrado en las
clínicas odontológicas son de características físicas habituales en el entorno del medio de
desarrollo en el que nos encontramos [1,2�. Si las alteraciones de los parámetros físicos se
hubiesen producido siempre en aparatos diferentes, podría decirse que aproximadamente un
tercio de los equipos revisados (28%) pueden presentar alteraciones significativas (kV, mA,
filtración, señal acústica, disparador) en el momento de las revisiones de control de calidad.
Las actuales recomendaciones oficiales de utilizar un aparato que funcione a 70 kV, 8 mA, 20
cms de distancia foco-piel y una filtración del haz superior a 1.5 mm de Al se cumplirían
como máximo en el 71.36% de las instalaciones radiológicas dentales revisadas (2524).
Gracias a este procedimiento obligatorio de control de calidad que deben cumplir todas las
clínicas odontológicas con aparatos de radiología intraoral, se ha podido aumentar en casi un
14.5% el número de clínicas que durante la segunda revisión cumplirían con las
recomendaciones oficiales de la Unión Europea con respecto a los años anteriores.
Se ha observado una ausencia completa en la utilización de un colimador rectangular adaptado
al tamaño de la película radiológica en los informes (2524) de las clínicas estudiadas, frente al
5-7.33% con el que se emplea en Estados Unidos [3,4�, o frente al 29-36% que se describe en
instalaciones con aparatos intraorales en Suecia [6,7�.

IAEA-CN-85-257
113
Por otro lado, otros parámetros fundamentales han quedado excluidos de los requisitos
controlables en los informes de garantía y/o control de calidad y que pueden ser las causas del
incremento considerable de las dosis de radiación administradas en las exploraciones
radiológicas: el revelado de la película fotográfica [7�. En este sentido, destaca que el 88.20%
del revelado de la película radiográfica en nuestro medio es manual y sólo un 6´3% de las
instalaciones realiza un procesado radiográfico automático. Estos resultados son
significativamente inferiores al 50% de procesado automático en Dinamarca [1,2�, el 88% en
Suecia [5�, o el 93% en Canadá [8�.
La dosis de radiación de calidad suficiente de un molar superior en nuestro estudio es inferior
a 7 mGy en el 93.5 % de los casos, en donde se ha puesto de manifiesto una dosis media de
4.14 mGy, disminuyendo este valor a 3.18 mGy durante la tercera revisión correspondiente a
1999.
En general, numerosos autores ponen de manifiesto un grado significativo de insatisfacción en
incumplimiento de las recomendaciones oficiales para la reducción de la dosis de radiación en
las instalaciones radiológicas odontológicas tanto en Europa [2,5�, como en Estados Unidos
[9�. Los resultados obtenidos del presente estudio han puesto de manifiesto, que en España y
tras la instauración obligatoria de la normativa mediante la cual todas las clínicas
odontológicas con aparatos de radiología intraoral deben de someterse a estudios de control de
calidad efectuados por empresas externas homologadas, se ha reducido las dosis de radiación
en un 30% y se ha conseguido aumentar en un 14.5% el número de instalaciones que
cumpliría las Recomendaciones Oficiales de Protección Radiológica; todo ello en sólo dos
años de evolución tras el citado requisito legal.
Se pretende continuar con este estudio durante los próximos años, lo que permitiría evaluar
una posible mejoría en las actuaciones radiológicas dentales de nuestros profesionales y
personal auxiliar como consecuencia de la nueva normativa instaurada.
Referencias
[1] ALCARAZ, M., MARTÍNEZ-BENEYTO, Y., and VELASCO, E., Control de calidad en instalaciones de radiodiagnóstico dental, Revista Europea de Odontoestomatología. 11 (1999) 265-274.
[2] HINTZE,H., Radiographic screening examination: frequency, equipment, and film in general dental practice in Denmark, Scand.J.Dent.Res, 101 (1993) 52-56.
[3] PLATIN,E.; JANHOM,A., and TYNDALL,D., A quantitative analysis of dental radiography quality assurance practices among North Caroline dentists. Oral Sur, Oral Med. Pathol. Oral Radiol. Endod. 86 (1998) 115-120.
[4] HORNER,K., and HIRSCHMANN,P.N., Dose reduction in dental radiography, J.Dent. 18 (1990) 171-184.
[5] SVENSON,B., and PETERSSON,A., Questionnaire survey on the use of dental X-rays film and equipment among general practitioners in the Swedish Public Dental Health Service, Acta Odontol. Scand. 53 (1995) 230-235.
[6] SVENSSON, B.; SEDERFELDT, B., and GRONDAHL, H.G., Attitudes of Swedish dentists to the choice of dental x-ray film and collimator for oral radiology, Dentomaxillofac. Radiol. 25 (1996) 157-161.
[7] HAVUKAINEN, R., Survey of dental radiographic equipment and radiation doses in Finland. Acta Radiol. 29 (1988) 481-485.
[8] NAKFOOR, C.A., and BROOKS, S.L., Compliance of Michigan dentists with radiographic safety recommendations, Oral Surg. Oral Med. Oral Pathol. 73 (1992) 510-513.

IAEA-CN-85-258
114
RADIATION PROTECTION AND QUALITY ASSURANCE
IN DENTAL RADIOLOGY: II. PANORAMIC RADIOLOGY
S. Jódar-Pórlan, M. Alcaraz, Y. Martinez-Beneyto, A.M. Saura-Iniesta Area de Radiología y Medicina Física, Universidad de Murcia, Spain E. Velasco-Hidalgo Unidad Técnica de Protección Radiológica ASIGMA S. A., Cartagena, Spain
Abstract
This paper studies 278 official reports on quality assurance in dental radiology in the context of the first revision
of these dental clinics, as a result of the entry into force of the regulations establishisng the duties for this type of
facilities. In the results section we present a quantitative analysis of the facilities equipped with an panoramic
radiology apparatus, making a special reference to the brands they have available, as well as their physical
features (kV, mA, filtration) and the deviations detected in their operation. Some of their features in the process
of obtaining radiological images at those facilities (film control, development time, liquid renewal) are
determined, an the average dose of ionising radiation used in order to obtain the same tooth radiological image is
presented. This paper shows, in a quantitative way, the characteristic features of panoramic radiology in our
medium. The study is intended to be continued during the next years, what would allow the assessment of the
prospective improvement in dental radiological performances as a result of the newly established regulations.
1. Introducción
La exploración radiológica en Odontología representa aproximadamente el 25% de todas las exploraciones radiológicas con fines de diagnostico medico que se realizan anualmente en al Unión Europea [1,2�. La radiología intraoral constituye casi el 90% de todas las exploraciones realizadas en odontología [1�, campo en donde la radiología panorámica constituye también un elemento esencial en la radiología oral actual, constituyendo la segunda exploración odontológica por su número de exploraciones realizas [3�. Sin embargo, recientes estudios ponen de manifiesto, tanto en Europa como en Estados Unidos, que muchas exploraciones radiológicas son de escasa calidad o representan imágenes sin calidad diagnóstica, bien porque se ha realizado una mala técnica radiológica o bien porque se ha realizado un inadecuado procesamiento de la película radiográfica [1,4�. En este trabajo se presenta el primer análisis cuantitativo de los parámetros controlados en los informes oficiales de control de calidad y supone una revisión del proceso de obtención de la imagen radiológica en las clínicas odontológicas que realizan radiografías panorámicas. Por ello, podría ayudar a reflejar la situación de desarrollo en la que se encuentra la radiología dental de nuestro país.
2. Material y método
Se estudian 278 informes oficiales de control de calidad en radiodiagnóstico de clínicas odontológicas que emplean radiología panorámica, generalmente desde la primera revisión de la instalación radiológica y hasta la tercera revisión, como consecuencia de la entrada en vigor del Real Decreto 2071/1995 de 22/12/95, en el que se establecen los criterios de control de calidad en radiodiagnóstico. Los informes se han realizado desde la segunda mitad del año 1996 hasta final de 1999, por la U.T.P.R. Asigma S.A.L. y corresponden fundamentalmente a instalaciones de carácter privado. Todas las clínicas han sido previamente verificadas por diversas Unidades Técnicas de Protección Radiológica homologadas por el Consejo de Seguridad Nuclear. En el momento de la primera revisión, todas las clínicas odontológicas analizadas ya se encontraban legalmente autorizadas como Instalaciones de Rayos X con fines de diagnostico dental.

IAEA-CN-85-258
115
3. Resultados
Los informes de control de calidad estudiados corresponden a clínicas odontológicas que poseen algún tipo de aparato de radiodiagnóstico para la realización de radiografía panorámica/ortopantomografia y se encuentran ubicadas en territorio español, fundamentalmente en tres comunidades autónomas: Murcia (82/278), Andalucía (79/278) y Comunidad Valenciana (63/278). Los resultados obtenidos contabilizan más de 49 modelos de aparatos de rayos X para radiografía panorámica, correspondientes a 19 fabricantes diferentes, y en donde destaca la casa Trophy con cerca del 32% (90/278) de todos los equipos de radiología descritos. Estos aparatos funcionan con kilovoltajes variables que oscilan entre los 50 kV y los 130 kV como valores mínimo y máximo respectivamente, miliamperaje entre los 5 y los 400 mA, y una filtración del haz primario de radiación que ha variado entre los 2 mm y los 3.2 mm de Al como valores extremos, utilizando siempre filtración de Aluminio. Los parámetros obtenidos sobre el funcionamiento del aparato estudiado en cada una de las clínicas dentales han puesto de manifiesto que el 4.18% (10/259) de los aparatos presentaban alteraciones superiores al 10% en alcanzar el kV que venia descrito por el fabricante del aparato y que por ello se han considerado fuera de tolerancia; un 2.1% de los equipos (5/237) han presentado alteraciones respecto al tiempo de exposición marcado por el cronómetro del aparato y un 4.8% (8/173) presentaban desviaciones superiores al 20% en el rendimiento del tubo de rayos X (dosis de radiación por unidad de tiempo). El revelado radiográfico de la radiografía panorámica se realiza en procesadora automática mayoritariamente (63.92%:163/255), y en donde la renovación de los líquidos de revelado se hace mensualmente en el 61.5% (147/239) de las clínicas odontológicas analizadas en las que se ha recogido este dato. El tipo de película más frecuentemente utilizada para la realización de la radiología panorámica es la Kodak T-MAT en sus diferentes modalidades con el 53.78% (142/264) de todas las instalaciones dentales verificadas en el control de calidad, en donde destaca la utilización de las pantallas de refuerzo Kodak Lanex en sus diferentes modalidades en el 89.71% (192/214) de todas las instalaciones revisadas. En los informes de Control de Calidad que se han analizado se han descrito otras irregularidades en algunos parámetros sometidos a estudio: a) se pone de manifiesto que en el 5.43% (13/239) se realiza un almacenamiento incorrecto de la película radiográfica, ya que se mantiene dentro de la sala de exposición, expuesta a la radiación dispersa producida durante la exploración, con el consiguiente aumento del velo por la radiación de la película radiográfica; b) en el 6.43% (11/171) se encuentran entradas de luz en el cuarto oscuro que aumentarían el velo por luz de las películas radiográficas durante su manipulación; y c) se describe una ausencia completa de control en el tiempo de revelado de la película radiográfica en el 75% (33/44) de las instalaciones dentales en las que se ha recogido este dato. En el 11.87% de los informes (33/278) se reflejan recomendaciones de carácter imperativo que exigen una corrección inmediata: en 25 instalaciones se exige revisión/reparación de los equipos (8.99%: 25/278); en otras 2 se recomienda la revisión de la instalación eléctrica (0.71%:2/278) por alterar el funcionamiento del equipo; en otra (0.35%: 1/278) se recomienda

IAEA-CN-85-258
116
el cambio del tipo de líquidos empleados por ser completamente inadecuados para el procesado de la película radiográfica empleada. La dosis de radiación de radiación se ha determinado con un detector de semiconductor (PMX III) en la posición de telerradiografia del aparato de radiodiagnóstico estudiado y en las condiciones habituales en al que se realizan en la exploración de cada sala. La determinación de la dosis de radiación ha puesto de manifiesto un descenso significativo de las dosis empleadas durante los últimos años. La dosis media de radiación ha disminuido desde 1.473 mGy en 1996, 1.16 mGy en 1997, 0.37 mGy en 1998, hasta 0.21 mGy en 1999. Ello pone de manifiesto que desde la entrada en vigor de la reglamentación de control de calidad las dosis empleadas se han reducido hasta casi 8 veces respecto de las empleadas en 1996. La dosis media empleada en el conjunto global de todos los años analizados es de 0.80 mGy, siendo como valores máximos extremos alguna instalación que llegaron a emplear 18 mGy (en 1996), 28 mGy (en 1997) , o 12.75 mGy (en 1998). En 1999 ninguna instalación ha superado 1 mGy como nivel máximo de radiación administrada para dicha exploración. La determinación de la dosis de radiación ha puesto de manifiesto un significativo descenso de las dosis empleadas durante los últimos años.
4. Discusión
Recientemente se ha publicado que el 95% de las clínicas odontológicas en la Comunidad de Murcia utilizan habitualmente un aparato de radiología intraoral, y que, además, durante 1996 un 2.8% de las mismas dispone de un aparato para radiología intraoral [5�. Esta situación refleja la segunda plaza que ocupa la práctica de la radiología panorámica en el diagnostico odontológico en nuestro medio. Según nuestros resultados al menos un 4.5% de las clínicas odontológicas poseen un aparato para radiología panorámica actualmente en esta misma comunidad; resultado todavía muy distante al descrito en otros países en donde casi el 22% de las clínicas odontológicas [6� disponía de un aparato de estas características. Los equipos de radiología panorámica que se han encontrado en las clínicas odontológicas son de características físicas (kV, mA, filtración) habituales en el entorno del medio desarrollado en el que nos encontramos [3�. Si las alteraciones de los parámetros físicos se hubiesen producido siempre en aparatos diferentes, podría decirse que más del 16% de los equipos revisados pueden presentar alteraciones significativas en el momento de las revisiones de control de calidad, y de los casi el 13% ha debido necesariamente solucionar algún tipo de problema antes de volver a trabajar. Cabe destacar que el 63.92% del revelado de la película de la radiografía panorámica en nuestro medio es automático, y solo un 30% de las instalaciones realizada un procesado manual.. Se asume que el procesado radiográfico automático permite administrar menos dosis de radiación aumentando la calidad de la imagen radiológica [7�; siempre que se realiza el revelado de forma manual, todos los autores describen resultados similares a los nuestros en cuanto a una gran variedad de tiempos de revelado, tiempos de cambio de líquidos y temperaturas empleadas, actuaciones que pueden suponer un incremento de la dosis de radiación administradas y del número de exploraciones innecesarias que se realizan [2,3�. Igualmente se admite que entre el 26 y el 33% de las radiografías panorámicas que se realizan son inaceptables y carecen de suficiente calidad para la interpretación diagnostica [1,8�, atribuyéndose al inadecuado procesamiento y /o movimientos del paciente y al escaso

IAEA-CN-85-258
117
contraste o ennegrecimiento los defectos más frecuentes que las producen [9�. Otros estudios han descrito que hasta el 40% de los equipos de rayos X para radiología dental sobrepasan los valores óptimos recomendados. Si a ello se suma que algunos autores han asociado las exposiciones múltiples en exámenes radiológicos dentales con mayor incidencia de cáncer de glándulas salivales y tumores cerebrales [1� parece evidente la necesidad de optimizar las dosis de radiación empleadas en Odontología. A pesar de lo anterior, las dosis de radiación empleadas en la radiología panorámica han ido disminuyendo significativamente durante los años sometidos al estudio. La técnica empleada para la determinación de la dosis de radiación no es la más recomendable y se han descrito en los informes las dificultades para obtener un valor de dosis aceptable en aparatos que no disponían de telerradiografía, por lo que algunos de los valores más altos pueden deberse a medidas realizadas en la posición de realización de la radiografía panorámica y que no se han eliminado hasta la última revisión realizada en el año 1999. Aunque existen instalaciones que han empleado 151 veces más dosis de radiación que la media obtenida para 1999 en la realización de una misma exploración radiológica, la dosis actual ha disminuido el 14% de la dosis de 1996. La dosis media en nuestro estudio es de 0.80 mGy y se encontraría en la misma línea de las descritas por otros autores para la misma exploración radiológica. En general, numerosos autores ponen de manifiesto un grado significativo de insatisfacción en el cumplimiento de las recomendaciones oficiales para la reducción de dosis de radiación en las instalaciones odontológicas tanto en Europa [10,11� como en Estados Unidos [12�. Dado que en nuestro estudio alguno de los parámetros analizados se alejan significativamente de las recomendaciones generales de protección radiológica resulta comprensible que se pretenda aunar esfuerzos para disminuir o eludir algunos de los factores que más influyen en el incremento de la dosis de radiación administrada o en la perdida de la calidad diagnostica de la imagen radiológica. Pretendemos continuar este estudio durante los próximos años, lo que permitiría evaluar la posible mejoría que puede experimentar la practica de la radiología panorámica en nuestro país, como consecuencia de la normativa instaurada.
Referencias
[1] HORNER, K., Review article: radiation protection in dental radiology, Br. J. Radiol. 67 (1994) 1041-1049.
[2] VAN DEL STELT, P.F., Radiation protection and quality assurance in dental radiography. A treatise from the European Community, Rev. Belge Med. Dent. 51 (1996) 111-22.
[3] MOLANDER, B., Panoramic Radiography in Dental Diagnostics, Swed. Dent. J. 119 (1998) 6-52.
[4] RUSHTON V.E., HORNER K., The use of panoramic radiology in dental practice. J. Dent. 1996; 24(3): 185-201.
[5] PONCE, R.; and GÓMEZ, J., Centro de Odonto-Estomatología. Análisis de la situación actual. Región de Murcia 1996. Serie Registro de Establecimientos sanitarios nº1, Dirección General de Salud, Murcia , (1997) 106págs.
[6] OSMAN, F., SCULLY, C., DOWELL, T.B., and DAVIES, R.M., Use of panoramic radiographs in general dental practice in England. Community Dent, Oral Epidemiol. 14 (1986) 8-9.

IAEA-CN-85-258
118
[7] ERASO, F.E., LUDLOW, J.B., PLATIN, E., TYNDALL, D., and PHILLIPS, C., Clinical and in vitro film quality comparison of manual and automatic exposure control in panoramic radiography, Oral Surg. Oral Med. Oral Pathol. Oral Radio. Endod.; 8784 (1999) 518-23.
[8] RUSHTON, V.E., HORNER, K., and WORTHINGTON, H.V., Aspects of panoramic radiography in general dental practice, Br. Dent. J. 10 (1999) 342-344.
[9] RUSHTON, V.E., HORNER, K., and WORTHINGTON, H.V., The quality of panoramic radiographs in a sample of general dental practices, Br. Dent. J.186 (.1999) 630-3.
[10] HINTZE, H, Radiographic screening examination: frequency, equipment, and film in general dental practice in Denmark. Scand. J. Dent. Res. 101 (1993) 52-56.
[11] SVENSON, B., and PETERSSON, A., Questionnaire survey on the use of dental X-rays film and equipment among general practitioners in the Swedish Public Dental Health Service, Acta Odontol. Scand. 53 (1995) 230-235.
[12] NAKFOOR, C.A., and BROOKS, S.L., Compliance of Michigan dentists with radiographic safety recommendations, Oral Surg. Oral Med. Oral Pathol. 73 (1992) 510-513.

Topical Session 1b
RADIOLOGICAL PROTECTION OF PATIENTS
IN GENERAL DIAGNOSTIC RADIOLOGY
(FLUOROSCOPY)

.

IAEA-CN-85-152
121
FLUOROSCOPY WITHOUT IMAGE INTENSIFIER
L. Canevaro
Instituto de Biología, Universidade do Estado do Rio de Janeiro, Brasil
G. Drexler
GSF Forschungszentrum, Institut für Strahlenschutz, and Laboratório de Ciências
Radiológicas, Universidade do Estado do Rio de Janeiro, Brasil
Abstract
The objective of the present work was to evaluate the doses received by patients during fluoroscopy procedures
carried out with an equipment without image intensifier. This evaluation is providing dose levels that our patients
are presently exposed, as gives the data for epidemiological studies on risk estimate of cancer induction in
patients exposed earlier when no image intensifiers existed. Diamentor M4 and E meters were used to measure
the product dose-area (DAP). The data were acquired during barium enema, barium meal, barium swallow and
histerosalpingographies. The measured values of DAP are considered high. This work intends to call the
attention toward the optimization of the radiological protection in facilities that still use equipment without image
intensifiers. While these equipment cannot be disabled, the patient exposure monitoring should be incentivated,
and the application of radiological protection practices and programs of quality assurance should be of priority.
1. Introducción
En la actualidad, siguiendo las recomendaciones de la ICRP [1][2] y las directivas sobre
protección radiológica del paciente [3], la preocupación por los métodos de optimización de la
calidad de la información diagnóstica, el establecimiento de niveles de referencia y la
reducción de dosis, tiene caracter prioritario. Esto sucede hoy, en tiempos en que equipos de
rayos X sin intensificador de imagen ya fueron desactivados en paises desarrollados, pero
continuan siendo usados en paises en desarrollo.
En los últimos años ha surgido gran interés por las exposiciones de pacientes en
procedimientos fluoroscópicos diagnósticos e intervencionistas. Se trabaja intensamente en
investigaciones sobre protección radiológica, niveles de exposición y recomendaciones al
respecto [4][5][6][7][8] debido, en parte, a que la tecnología de los equipos es cada vez mas
sofisticada. Por otro lado, al igual que en muchos países en desarrollo, en Brasil existen pocos
estudios dosimétricos sobre fluoroscopía [9][10] y pocas recomendaciones y reglamentaciones
sobre el asunto. Recién en junio de 1998 fue publicado el Reglamento Técnico "Portaria
453/98" del Ministerio de Salud de Brasil [11], que establece la obligatoriedad de la
aplicación de programas de garantía de calidad, el uso de intensificadores de imagen en
equipos fluoroscópicos, y la sustitución hasta 2003 de los actuales existentes sin este
dispositivo.
Tanto en Europa como en Estados Unidos ya no es posible la dosimetria en fluoroscopía
realizada con equipos sin intensificador de imagen, porque éstos fueron desactivados hace
varias décadas. Sin embargo, en Brasil y otros países, todavía se puede medir exposiciones a
pacientes en estos equipos. La evaluación de las exposiciones a pacientes irradiados de esta
manera, proporcionará los niveles de dosis a los que nuestra población está actualmente
expuesta, así como datos que permitan estimar dosis recibidas en el pasado en países donde
equipos sin intensificador no existen mas, y datos para estudios epidemiológicos sobre
estimativas de riesgos de inducción de cancer en los pacientes expuestos.
El presente trabajo forma parte de un proyecto de optimización de la protección radiológica en
fluoroscopía, apoyado por la IAEA [12] aplicado en instituciones médicas de Rio de Janeiro,

IAEA-CN-85-152
122
siendo uno de los objetivos la evaluación de dosis recibidas por pacientes en procedimientos
fluoroscópicos realizados con y sin intensificador de imagen. Se presentan aqui algunos
resultados parciales de esta investigación en un hospital.
2. Materiales y métodos
Los exámenes fueron realizados con un equipo (Philips Müller Technique) con 30 años de
uso, generador trifásico Müller-Medio 50, pantalla intensificadora, tubo de raios X bajo la
mesa, diafragma regulable, focos fino y grueso de 1,2 e 2,0 mm, respectivamente, usandose
normalmente el foco grueso. Todos los controles son manuales. Para escopía, la corriente
puede variarse entre 0 y 6 mA y la tensión del tubo entre 40 y 110 kVp, y dispone de un
indicador de tiempo de escopia con alarma sonora a los 5 minutos. El seriógrafo se acciona
manualmente para obtener radiografías desplazando el chasis a una posición debajo de la
pantalla, lo que acciona un disparador para exponer la película con la técnica radiográfica
seleccionada. La película puede ser dividida para obtener dos imágenes radiográficas en la
misma, desplazando manualmente una lámina de plomo debajo de la pantalla fluorescente,
antes de la exposición. Existe una rejilla antidifusora sostenida por resortes para permitir su
movimiento en el momento de la exposición.
Se utilizaron medidores Diamentor M4 y E (PTW, Freiburg, Alemania) para medir el
producto dosis-área (DAP). La calibración de los instrumentos fue realizada in situ,
considerando la atenuación de la mesa de exámen. El fabricante garantiza una incertidumbre
de �1% en la medida del DAP [13]. Se aplicó un único factor de calibración: el promedio de
los obtenidos para los diferentes kVp utilizados, porque esto no introdujo errores
significativos.
Se adquirieron datos en 23 exámenes de enema de bario con doble medio de contraste
(clisteropaco), 13 seriografías gastroduodenales, 3 esofagografías y 13 histerosalpingografías,
realizados según los protocolos médicos de la institución. Los exámenes fueron conducidos
por médicos del primer año de la residencia en radiología. Los datos registrados en cada
examen fueron: técnica fluoroscópica (kVp, mA), tiempo de exposición, técnica radiográfica
(kVp, mAs), número total de imágenes, tamaño de campo fluoroscópico y radiográfico y DAP
total. En los exámenes de enemas de bario y de histerosalpingografía fue posible registrar el
DAP de la parte fluoroscópica y el DAP de la parte radiográfica del examen y estimar la dosis
por imagen y la tasa de dosis en fluoroscopía.
3. Resultados y discusión
En las tablas I y II se presentan los resultados obtenidos en los exámenes evaluados. De la
tabla I, es posible observar que los valores de DAP total resultaron extremamente elevados al
compararlos con los niveles de referencia para fluoroscopía actualmente disponibles
[4][5][14][15][16] (entre paréntesis y en negrito en la tabla I). La comparación directa de
nuestros resultados con estos valores derivados de dosimetría en equipos con intensificador de
imagen no es rigurosamente procedente pero sí válida a fin de tener una referencia en relación
a los valores típicos actuales para los procedimientos evaluados.
En histerosalpingografías, Fernández et al [16] midieron en España valores de DAP total entre
2,5 y 16 Gycm2, con una media de 7,5 imágenes y tiempos de exposición entre 0,1 e 1 minuto.
Los DAPs totales (3er. cuartil) obtenidos en nuestro estudio fueron alrededor de 15 veces
mayores, a pesar de que el número promedio de imágenes es el mismo. Esto evidencia, al

IAEA-CN-85-152
123
igual que para enemas de bario, la contribución al DAP total de la parte fluoroscópica del
examen, mostrada en la tabla II. Para seriografías, las medidas resultaron de 3 a 6 veces
mayores que los valores de referencia, y para enemas de bario, superiores por un factor de 3 a
5. Estos hechos sugieren que los protocolos médicos sean revistos, además de evaluar el
desempeño del equipo.
Algunos problemas detectados em relación a la ausencia total o parcial de procedimientos de
optimización se deben, en general, a la falta de recursos financieros y otras dificultades (como
la falta de físicos médicos y la escasa formación en protección radiológica de los radiólogos)
que la mayoría de las instituciones de salud pública tienen que enfrentar en muchos países en
desarrollo. Los exámenes tienen que ser realizados por los profesionales con los equipos y
herramientas disponibles.
En los casos evaluados, las dosis/imagen fueron relativamente bajas, aunque no se evaluó la
calidad de imagen (combinación película-pantalla verde). Las tasas de dosis son consideradas
elevadas, en función de las recomendaciones actuales [11].
Tabla I. Resultados de las medidas realizadas en la evaluación de procedimientos fluoroscópicos
realizados con el equipo de rayos X sin intensificador de imagen. n: número de exámenes
evaluados. Los valores de los niveles de referencia actualmente disponibles están indicados entre
paréntesis y en negrito en la tercera columna
Tiempo
[min]
No.
Imágene
s
DAP total
[Gycm2]
Dosis por
imagen
[mGy]
Tasa de dosis
escopía
[mGy/min]
ENEMA DE BARIO (n = 23) (37-62)
Rango 3,8-21,7 5-14 85-316 50
Media 8,8 9,7 159 4 16
Desviación Estandar 4,2 1,8 63 4 56
3er Cuartil 11,2 10,0 190 1
SERIOGRAFIA (n = 13) (25-53)
Rango 3,4-16,1 8-17 62-345
Media 8,0 13,8 136
Desviación Estandar 3,1 3,2 74
3er Cuartil 9,3 17,0 164
HISTEROSALPINGOGRAFIA (n = 13)
Rango 1,2-7,2 5-10 25-118
Media 3,9 7,3 107 3 24
Desviación Estandar 1,6 1,4 51 2 3
3er Cuartil 4,5 8,0 136 4 26
ESOFAGOGRAFIA (n = 3) (10)
Rango 3-7,3 6-10 40-106
Media 5,1 8,7 105
Desviación Estandar 2,2 2,3 44

IAEA-CN-85-152
124
Tabla II Estimativas de las contribuciones radiográfica y fluoroscópica en exámenes de enema
de bario e histerosalpingografía
Tiempo No.
Imág.
DAP
total
DAP
grafía
%
Grafía
DAP
escopía
%
Escopía
[min] [Gycm2] [Gycm
2] [Gycm
2]
ENEMA DE BARIO (n = 23)
Rango 3,8-21,7 5-14 85-316 1073-3437 6-25 76-288 75-95
Media 8,8 9,7 159 2056 13 147 87
Desviación Estandar 4,2 1,8 63 717 6 67 6
3er Cuartil 11,2 10,0 190 2594 17 179 92
HISTEROSALPINGOGRAFIA (n = 13)
Rango 1,2-7,2 5-10 25-118 504-1109 13,5-15,2 32-62 85-87
Media 3,9 7,3 107 807 14,4 47 86
Desviación Estandar 1,6 1,4 51 428 1,2 21 1
3er Cuartil 4,5 8,0 136 958 14,8 54 86
4. Conclusiones
Hoy en dia se dedica mucha atención a la dosimetría en equipos modernos y sofisticados, pero
en algunos países, la población continúa siendo irradiada con equipos fluoroscópicos sin
intensificador de imagen. Este trabajo pretende llamar la atención hacia la optimización de la
protección radiológica en instalaciones que todavía usan equipos sin intensificadores. Aún
cuando su uso esté “justificado” en ciertas situaciones, es posible aplicar medidas de
protección radiológica a pacientes que inevitablemente serán expuestos. Mientras estos
equipos no puedan ser desactivados, debería incentivarse la dosimetría a pacientes, la
aplicación de conductas de protección radiológica y de programas de garantía de calidad.
Estos resultados preliminares muestran que aún existen muchos problemas que deben ser
resueltos en nuestro país. El hecho de disponer de valores numéricos para los parámetros
evaluados constituye un paso importante que servirá para tomar acciones a ser implementadas
en fluoroscopia. En Brasil estos equipos serán desactivados hasta 2003, las mejorías se hacen
de forma gradual y las disposiciones legales ayudan a corregir los desvíos. Sin embargo, en
otros países que no disponen de esta posibilidad, probablemente estos equipos seguirán siendo
utilizados, con la consiguiente exposición a los pacientes.
Agradecimientos: Los autores agradecen a los Dres. J.E. Peixoto e H.A. Koch, a los médicos
residentes R1 E.P. Dias, F.P. Nobre, A.R. Vianna, L.T. Ramos, L. Risk, M.V. Esquivel, P.V.
Madeira, F. Lima, N. S. S. Louzada y C.F.Costa, a los físicos A. de Amorim e M. Balthar y a
los tecnólogos R. Silva y J. Portela. Este trabajo fue realizado con el apoyo de CNPq (Brasil),
GSF (Alemanha) e IAEA (Contract BRA 11061).
Referencias
[1] International Commission on Radiological Protection (ICRP). "1990 Recommendations
of International Commission on Radiological Protection". Publication 60. Annals ICRP
21 (1-3). Pergamon Press. 1991.
[2] International Commission on Radiological Protection (ICRP). Publication 73
"Radiological Protection and Safety in Medicine". ICRP Committee 3. March, 1997.
IAEA-CN-85-152
125
[3] European Commission (EC), Council Directive 97/43/EURATOM of June 30th
1997 on
health protection of individuals against the dangers of ionizing radiation on relation to
medical exposures. Official Journal from the European Communities. 1997.
[4] European Commission (EC), European Radiation Protection, Education and Training
(ERPET), “Training Course for Medical Physicists on Establishment of Reference
Levels in Diagnostic Radiology”. Passau, Germany. 13-15 September, 1999.
[5] European Commission (EC). “Guidance on Diagnostic Reference Levels (DRLs) for
Medical Exposures”. Radiation Protection 109. Directorate-General Environment,
Nuclear Safety and Civil Protection. European Commission. 1999.
[6] American College of Radiologists/Food and Drug Administration, (ACR/FDA).
“Proceedings of the ACR/FDA Workshop on Fluoroscopy – Strategies for Improvement
in Performance, Radiation Safety and Control”. Workshop 16 and 17, October, 1992.
[7] Vañó, E.; González, L.; Guibelalde, E.; et al. ”Patient and Staff Dose Values in
Interventional Radiology”. In: Workshop do WHO/ISH. Efficacy and Radiation Safety in
Interventional Radiology. Munich. 1995.
[8] Faulkner, K.; Corbett, RH. “Reference Doses and Quality in Medical Imaging”. Br. J.
Radiol., 71, pp.1001-1002. 1998.
[9] Canevaro, LV., Carlos, MT., Drexler, G., et al. "Assessment of Doses to Patients
Submitted to Fluoroscopic Gastrointestinal Tract Examinations”. Radiat. Prot. Dosim.,
Vol 80, Nos. 1-3, p. 155-158. 1998.
[10] Costa, MMB.; Canevaro, LV.; Azevedo, ACP. “Análise Dosimétrica do Método
Videofluoroscópico Aplicado ao Estudo da Dinâmica da Deglutição”. Aceptado para ser
publicado en la revista Radiol. Bras., 34, No. 6, Diciembre, 2000.
[11] BRASIL. Ministério da Saúde. “Diretrizes de Proteção Radiológica em
Radiodiagnóstico Médico e Odontológico”. Portaria No. 453. 1/6/98. Brasil.
[12] Proyecto IAEA BRA 11061. “Dose Reference Levels in Fluoroscopy”. Laboratório de
Ciências Radiológicas A partir de diciembre de 1999.. Rio de Janeiro, Brasil.
[13] Physikalisch Technische Werkstätten (PTW-Freiburg). “DIAMENTOR M4. User
Manual for Diamentor M4 type 11006 and Ionization Chamber type 57523-1”. PTW-
Freiburg. Germany. 1996.
[14] Saxebøl, G.; Olerud, HM.; Hjardemaal, O.; Leitz, W.; Servomaa, A.; Walderhaug, T.
“Nordic Guidance Levels for Patient Doses in Diagnostic Radiology”. Radiat. Prot.
Dosim., Vol. 80, Nos. 1-3, p.99-101. 1998.
[15] Vañó, E. “Estimación de Datos Españoles para el Comité UNSCEAR”. Madrid. España.
Febrero 2000. Comunicación personal.
[16] Fernández, JM.; Vañó, E.; Guibelalde, E. “Patient Doses in Histerosalpingography”. Br.
J. Radiol., 69, p.751-754. 1996.

IAEA-CN-85-157
126
EVALUATION OF THE DOSIMETRIC PERFORMANCE CHARACTERISTIC OF
FLUOROSCOPY SYSTEM USED IN MEDICINE
Qi Xuesong, Wei Kedao, Cheng Yuxi, Zhou Qifu, Ge Lijuan, Hou Changsong
Laboratory of Industrial Hygiene, Beijing, China
Abstract
Objective: To discuss establishment of diagnostic reference dose value in fluoroscopic examinations, for survey
of 16 different types of fluoroscopy systems.
Methods: Choosing dosimetric characteristic parameters including: IIESDR, ESDR(typical value) and
ESDRmax (ESDR maximum), DAP which was calibrated in situ on the X-ray unit.
Results: Results of dose survey are summarized in three tables, from these we could get wide changes in
accordance with those in many other countries were resulting from maximum and minimum of IIESDR, ESDR
and ESDRmax when measurements were performed at same entrance field size on I.I. Image Intensifier of the 15
fluoroscopy systems and under conditions of ABC. And also we could get less changes of DAP mean values,
though differences for patient weight, technological parameters of fluoroscopic exam setting, fluoroscopic time
and number of film were more remarkable.
Conclusions: Measurements on IIESDR, ESDR(typical value) and ESDRmax (ESDR maximum) are not
satisfied as diagnostic reference level. But it is suggested that DAP values, in fluoroscopic exam, are used as a
tool to achieve this.
1. Introduction
Recently, medical diagnostic X-ray fluoroscopy systems with Image Intensifier (I.I.) have been
used extensively in complex X-ray examination. They have occupied 25-40% of all the
diagnostic X-ray exams for collective effective dose, which cause people’s attention. This
paper discusses the establishment of diagnostic reference dose value in fluoroscopic exams by
dosimetric characteristic measurements for 16 different types of fluoroscopy systems.[1,2,3]
2. Material and methods
16 types of fluoroscopy systems from 4 hospitals, three dosimetric characteristic parameters
were chosen: (1) Entrance Surface Dose Rate of Image Intensifier (IIESDR), (2) Entrance
Surface Dose Rate of phantom (typical ESDR and maximum ESDRmax), (3) Dose Area
Product (DAP) in upper gastrointestinal (GI) Barium meal exam of patient.
The measure equipment often used includes: (1) a DIADOS dosemeter of PTW made in
Germany, (2) a Solidose 400 dosemeter of RTI made in Sweden, (3) a DOSEGUARD-100
dose area product dosemeter of RTI made in Sweden. Moreover, using two pieces of 20 mm
Al plates and a piece of 2 mm Pb plate simulated typical adult patient and a fat adult patient.
The three dosemeter were calibrated by the Secondary Standard Dosimetry Laboratory
(SSDL) of LIH.
For twenty patients of Barium meal exam four fluoroscopy systems which were undertable
were chosen, each patient (male or female) weight was 60 +/- 10kg . The DAP meter was
calibrated in situ on X-ray unit to which was attached, then put the Solidose 400 dosemeter on
10 cm x 10 cm field and measured dose, put the film in a magazine with screen to measure the
true size of exposure field, made the product of acquired dose and true area of exposure field
calibrate to reading of DAP meter, and got a calibrating factor of DAP meter in situ for every
fluoroscopy system, then we could calculate each patient DAP value(Gycm2) and DAP mean
values of five patients in Barium meal exam for every fluoroscopy system.

IAEA-CN-85-157
127
3. Results
Table I gives main characteristics of 16 fluoroscopy systems. Table II gives dosimetric
performance characteristic of IIESDR, ESDR and ESDRmax for 16 fluoroscopy systems. Table
III gives DAP measurements of twenty upper GI Barium meal exam for 4 fluoroscopy
systems.
Table���
�I. Characteristics of 16 fluoroscopy systems investigated in several hospitals
Hospitals/Room
Number
X-ray System
Type Total filtration
mmAl
Focus spot
size mm
Size of II
cm
Using Time of I.I.
year
A/1 RCT - 0.6 0.2 23 30 6
A/2 RCT - - 23 14
A/3 RCT - - 23 4
A/4 C-arm - - 13 17 30 3
A/5 RCT - 0.6 0.2 23 8
A/6 RCT - 0.6 0.2 23 4
A/7 RCT 5.2 - 23 13
B/1 RCT 4.8 0.6 0.2 23 7
B/2 RCT - - 23 30 2
B/3 C-arm - - 17 25 38 1
B/4 RCT - 0.6 0.2 23 2
B/5 RCT 3.5 0.6 0.2 23 13
C/1 RCT 4.0 - 23 2
C/2 C-arm 3.8 - 15 23 30 2
C/3* W II - - - -
D/1 RCT 3.5 0.6 0.2 23 3
* Indicate W II =without image intensifier RCT= Remote control table
4. Discussion
From table II it can be seen that 15 fluoroscopy systems were performed at same entrance field
size on I.I. and measured under conditions of ABC, though changes of their maximum and
minimum values of IIESDR, ESDR and ESDRmax are in accordance with those in many other
countries.
From table III it can be seen 20 patient weight and technical parameters of fluoroscopic exam
setting (such as kV, mA, size of exposure field, fluoroscopic time and number of film) were
more different, but the maximum of DAP mean value was 2.1 times more than the minimum.
The change of DAP was less than that of three dosimetric performance parameters by far,
because many factors affecting patient dose in fluoroscopic exam changed dynamicly, and
their overlapping became the total exposure effects of patients.
In respect of establishment to diagnostic reference dose value of fluoroscopic exam many
authors have discussed it further since ICRP publication 73 and IAEA Safety Series No. 115
were published [2,3,4]. They give respectively diagnostic reference dose value to different
types of fluoroscopy systems, for example, guide level in IAEA Safety Series No. 115 is
25 mGy/min to typical ESDR and 100 mGy/min to ESDRmax for fluoroscopic exam. Britain
gave 25Gycm2 as DAP reference value for fluoroscopic exam in 1992, revised 7.6Gycm
2 for
digital fluoroscopy system and 15.5 Gycm2 for none-digital fluoroscopy system in 1998.
Countries in North Europe believe that 25 Gycm2 is valid as reference dose value (DAP) in
Barium meal exam.

Tab
le I
I. M
easu
rem
ents
of
thre
e d
osi
met
ric
char
acte
rist
ic p
aram
eter
s (I
IES
DR
, E
SD
R a
nd E
SD
Rm
ax)
for
16
flu
oro
sco
py s
yst
ems
no
rmal
mo
de
of
fluoro
scop
ic g
rid
in
, fi
eld
siz
e o
f 2
3 c
m,
wit
h A
BC
Hosp
ital
s/R
oo
m
Nu
mb
er
IIE
SD
R
Gy/m
in
ES
DR
m
Gy/m
in
ES
DR
max
* m
Gy/m
in
kV
mA
M
easu
rem
ent
kV
m
A
Mea
sure
men
t kV
mA
M
easu
rem
ent
A/1
8
5
1.7
108
90
1.7
16.1
1
24
2
.4
36
.9
A/2
7
9
2.0
40
77
2.0
23.5
1
12
4
.0
99
.1
A/3
8
5
1.4
20
79
1.4
7.9
9
5
1.4
1
1.4
A/4
7
6
6.3
27
73
6.8
5.7
1
25
1
6
60
.8
A/5
8
8
1.4
44
89
1.4
10.7
1
21
2
.6
33
.34
A/6
7
6
1.6
58
77
1.6
11.4
1
24
2
.4
40
.0
A/7
7
8
0.2
9.0
70
2.0
6.8
3
10
0
4.0
2
6.7
B/1
7
6
1.3
33
76
1.2
6.5
1
20
3
.0
41
.2
B/2
7
5
2.1
68
78
1.6
9.9
1
14
2
.4
29
.4
B/3
7
1
3.2
36
71
3.0
11.5
1
11
6
.0
58
.6
B/4
8
0
1.5
72
83
1.7
12.0
1
15
2
.3
27
.9
B/5
8
5
0.5
33
80
1.0
3.9
1
20
1
.0
8.2
C/1
7
0
1.0
21.4
74
1.1
5.5
1
20
1
.9
24
.0
C/2
8
8
2.1
67.8
89
2.1
13.9
1
25
4
.0
55
.7
C/3
70
2.0
46.8
D/1
8
8
2.0
44.9
74
1.3
5.6
1
23
2
.5
29
.4
Mea
n v
alu
e 45.5
10.1
38
.8
Tab
le I
II. V
alu
e o
f 2
0 p
ati
en
t m
ea
surem
en
ts i
n B
ariu
m m
eal
(up
per G
I) e
xam
inati
on
Hosp
ital
s/R
oo
m
Num
ber
Pat
ien
ts
nu
mb
er
Pat
ient
wei
ght
Kg
Flu
oro
scopic
tim
e
min
Nu
mb
er o
f im
ages
(fi
lms)
D
AP
val
ue
Gycm
2
Ran
ge
Mea
n v
alue
Ran
ge
Mea
n v
alue
Ran
ge
Mea
n v
alue
Ran
ge
Mea
n v
alue
A/1
5
5
7-6
7
47.4
0.5
7-8
.7
4.8
5
-12
9
.0
8.1
6-4
7.8
9
27
.9
B/2
5
5
4-6
5
54.6
3.3
2-6
.92
6.1
8
-12
9
.2
9.8
4-1
5.3
8
13
.6
C/1
5
6
3-7
0
56.3
3.1
-8.7
6.1
3
-9
5.2
1
0.3
7-3
5.5
0
18
.8
D/1
5
5
9-6
8
51.0
3.2
-6.1
4.4
6
6
1
5.4
9-3
1.2
4
22
.0
IAEA-CN-85-157
128

IAEA-CN-85-157
129
There are many complicated factors affecting the patient dose in the same exam, such as
difference of fluoroscopic time, the number of film and patient size [5]. The author thinks
DAP is better than IIESDR and ESDR (or ESDRmax) for evaluating patient stochastic effects.
But in interventional radiological exam, ESDRmax of skin for evaluating deterministic effect
of skin is better than the other parameters.
5. Conclusions
First, according to IAEA Safety Series No 115, 16 fluoroscopy systems investigated (except
traditional fluoroscopy system C/3) satisfy the guide level. But IAEA Safety Series No 115
just gives typical ESDR (mGy/min) and ESDRmax, they can not be satisfied with requirements
of all kinds of fluoroscopic exam .we should stipulate diagnostic dose guide level (also called
diagnostic reference dose level) for every item of fluoroscopic exam.
Secondly, Britain and countries in North Europe make DAP value 25Gycm2 as diagnostic
reference dose level. According to the stipulation, we chose 4 fluoroscopy systems to measure
the DAP mean values in Barium meal exam for 20 patients, DAP mean value of one
fluoroscopy system (A/1) is 27.9 Gycm2 more than 25 Gycm
2, but ESDR and ESDRmax of this
fluoroscopy system are all under the guide level limits of IAEA Safety Series No. 115. Thus it
can be seen that ESDR and ESDRmax reflected the characteristics of equipment, but to
evaluate the dose which is accepted by patient in fluoroscopic exam, we still should consider
many subjective and objective factors, such as patients’size, fluoroscopic time, the number of
films, operator technical skill and so on. It is DAP that synthesized all kinds of affecting
factors for patients and got DAP mean value. The author thought DAP value is fit for the
diagnostic reference level of patient dose in fluoroscopic exam.
Acknowledgement
This work was supported in part by IAEA under the contract number 8221/R2. We would like
to thank Ms. Modupe Oresegun for her assistance.
References
[1] IAEA Safety Series No.115, International Basic Safety Standards for Protection against
Ionizing Radiation and for the Safety of Radiation Sources. Vienna: IAEA, (1995).
[2] ICRP. Radiological Protection and Safety in Medicine. ICRP Publication 73, Oxford:
Pergamon Press, (1996).
[3] CEC. Quality criteria for diagnostic radiographic images. 3rd ed. CEC Working
Document, Luxembourg: Office for Official Publications of the European
Communities, (1995).
[4] WEI KEDAO, ZHOU QIFU, CHENG YUEXI, HOU CHANGSONG et al, Reduced
patient dose and improved image quality in conventional Radiography. Chinese Journal
of Radiation Medicine and Protection, (1998) 18(5):334-337(in Chinese).
[5] K.WEI, B.YUE, Q.ZHOU, Y.CHENG, C.HOU, L.GE, X.QI, Radiation Dose and
Quality Control in Fluoroscopy and Computed Tomography Scanning, IAEA-CN-
70/17, these Proceedings.

IAEA-CN-85-93
130
PATIENT DOSE MEASUREMENTS IN FLUOROSCOPIC EXAMINATIONS,
AIMING TO THE ESTABLISHMENT OF REFERENCE LEVELS IN BRAZIL
L. Canevaro Instituto de Biologia. Departamento de Biofísica e Biometria, Universidade do Estado do Rio de Janeiro, Brasil G. Drexler GSF Forschungszentrum, Institut für Strahlenschutz, Neuherberg, Germany, y Laboratório de Ciências Radiológicas, Universidade do Estado do Rio de Janeiro, Brazil
Abstract
This work was performed to investigate the actual exposure levels of the patients submitted to fluoroscopic
procedures in diagnostic radiology. The data will be useful for a baseline in the establishment of local reference
levels for fluoroscopic procedures, as recommended by the European Commission and IAEA. At present time
there are not internationally accepted definitions for references levels for fluoroscopic complex procedures.
Dose-area product (DAP) meters were employed in a pilot survey expressing the radiation exposures in terms of
this quantity. This class of instrumentation has not been employed in Brazil yet. Parameters recorded were
radiographic technique, fluoroscopy time, number of images, fluoroscopic and radiographic field sizes and
DAPs. For fluoroscopy practice, a reference parameters set is recommended, instead of one diagnostic reference
level. High patient exposures were found, calling for joined actions of health authorities, physicians, medical
physicists, technicians and manufacturers. Monitoring of patient exposure, optimizing the radiation protection
and establishing quantitative assessments of the exposition to the population in Brazil in this kind of procedure is
important.
1. Introducción
Las Normas Básicas Internacionales para Protección Contra las Radiaciones Ionizantes (BSS) [1], recomiendan el uso de niveles orientativos para fluoroscopía en téminos de tasas de dosis de entrada en la superficie de la piel. En 1999 la Comisión Europea publicó un documento con orientaciones relacionadas a los niveles de referencia de diagnóstico [2], teniendo en cuenta que la directiva 97/43/Euratom [3] exige que los Estados-Miembros promuevan la fijación y uso de niveles de referencia. Este documento presenta valores de referencia propuestos para fluoroscopía, expresados en la magnitud producto dosis-área (DAP), y reconoce que aun no se han resuelto todas las cuestiones en relación a esta práctica. En Brasil, el Reglamento Técnico del Ministerio de Salud, Portaria 453/98 [4], establece niveles de referencia para algunos procedimientos radiográficos. Para fluoroscopía exige el registro de la tasa de dosis al paciente y del tiempo de examen o del producto dosis-área, y una tasa de kerma menor que 50 mGy/min en la entrada de la piel. Esta reglamentación fue establecida siguiendo las orientaciones de las BSS [1]. Sin embargo, en procedimientos fluoroscópicos los estudios dosimétricos a pacientes son relativamente recientes, existen pocos datos disponibles [5][6][7][8], los medidores del producto dosis-área han sido usados apenas en forma experimental [9] y aún no está definida la metodología que debe aplicarse para determinar niveles de referencia de diagnóstico locales. El presente trabajo forma parte de un proyecto de optimización de la protección radiológica en fluoroscopía, apoyado por la IAEA [10] aplicado en instituciones médicas de Rio de Janeiro, siendo uno de los objetivos la evaluación de las dosis recibidas por pacientes, a fin de conocer los niveles de exposición y servir de punto de partida para el establecimiento de niveles de referencia. Se presentan aqui algunos resultados preliminares de esta investigación en un departamento de radiodiagnóstico.

IAEA-CN-85-93
131
2. Materiales y métodos
Los exámenes fluoroscópicos evaluados fueron realizados en un equipo de rayos X telecomandado marca GE, con generador de alta frecuencia MPG 50 e intensificador de imagen de 23 cm de diámetro, debajo de la mesa de exámenes. La técnica fluoroscópica es determinada por el control automático de brillo. En el panel de comando, se puede seleccionar la tensión del tubo, el producto mAs y el tiempo de exposición para grafía, presentando también opciones para dividir automaticamente la película. El foco grueso (2 mm) es utilizado para grafía y el foco fino (1,2 mm) para escopía. Dispone también de un indicador de tiempo de escopia con alarma sonora a los 5 minutos. Se utilizaron medidores Diamentor M4 y E (PTW, Freiburg, Alemania) para medir el producto dosis-área (DAP). La calibración de los instrumentos fue realizada in situ. El fabricante garantiza una incertidumbre de �1% en la medida del DAP [11]. Se aplicó un único factor de calibración: el promedio de los obtenidos para los diferentes kVp utilizados, porque esto no introdujo errores significativos. La dosimetría a pacientes fue realizada en 60 procedimientos: 9 enemas de bario con duplo medio de contraste (clisteropaco), 39 esofagografías, 5 seriografías gastroduodenales, 4 uretrocistografías y 3 urografías intravenosas, siguiendo los protocolos médicos de la institución. Los exámenes fueron conducidos por médicos del primer año de la residencia en radiología. Los datos registrados en cada examen fueron: técnica fluoroscópica (kVp, mA), tiempo de exposición, técnica radiográfica (kVp, mAs), número total de imágenes, tamaño de campo fluoroscópico y radiográfico, distancia foco-piel, distancia foco-receptor de imagen, DAP de la parte fluoroscópica del examen, DAP de la parte radiográfica del examen, DAP por imagen y DAP total. Se calculó la tasa de dosis de entrada en la superficie de la piel en fluoroscopía de la siguiente manera:
Donde DAPescopia es el DAP medido correspondiente a la parte fluoroscópica del examen, en cGycm2. El Áreafluoro fue calculada en la superficie de entrada del paciente, a partir de las distancias foco-receptor de imagen y foco-piel y del área del intensificador de imagen. BSF es el factor de retro-dispersión, adoptado como 1,35, y el factor 10 es un factor de conversión de cGy para mGy. 3. Resultados y discusión
En la tabla I se presentan los resultados obtenidos en los exámenes evaluados. Los valores de DAP totales son muy elevados si se comparan con los propuestos en la literatura [12][13][14][15] como niveles de referencia para fluoroscopía (entre parentesis y en negrito en la tabla I). Las grandes desviaciones estandar obtenidas en el número de imágenes y en el tiempo total de examen sugieren la necesidad de una revisión de los protocolos médicos de los exámenes por
10BSF
���
fluorototal
escopia
Áreatiempo
DAPTasa

IAEA-CN-85-93
132
parte de los médicos radiólogos, a fin de establecer procedimientos estandarizados para cada tipo de examen.
Las tasas de dosis variaron entre 46 y 77 mGy/min (tercer cuartil), con valores promedios entre (42 � 20) y (65 � 21) mGy/min, superiores a los recomendados por la Portaria 453/98 [4] (50 mGy/min) y por las BSS [1] (25 mGy/min, bajo nivel), lo que sugiere que debería realizarse una revisión del equipo. La parte fluoroscópica del examen osciló entre 40 y 76% del DAP total, dependiendo del tipo de procedimiento: para esofagografías fue de (58 � 15)%, para enemas de bario de (66 � 13)%, para seriografías de (76 � 16)%, para uretrocistografías de (61 � 10)% y para urografías intravenosas de (40 � 7)%.
En la tabla II se muestra un resumen de los parámetros (“valores típicos”) considerados importantes para caracterizar cada tipo de examen. En todos los casos, el criterio usado para establecer los valores típicos fue el de adoptar el tercer cuartil de la distribución del parámetro correspondiente, considerando que estos datos fueron adquiridos por primera vez. En el presente trabajo se propone la caracterización de los exámenes complejos mediante un conjunto de “parámetros de referencia”. Debido a los diversos factores que intervienen en los procedimientos fluoroscópicos, un único parámetro de referencia no posibilita la identificación de los posibles motivos de exposiciones elevadas o alejadas de los valores típicos, si es que esto sucede. En un primer nivel de información, consideramos fundamental cuantificar tres “parámetros de referencia”: DAP total, tiempo de irradiación del paciente y número de imágenes. Un analisis mas profundo debería considerar las contribuciones fluoroscópica y radiográfica al DAP total, aspectos mas relacionados con el protocolo médico. Esto permite una revisión del procedimiento de realización del examen. Un conjunto completo de “parámetros de referencia” debería incluir también la tasa de dosis de entrada en la superficie de la piel y el tamaño de campo (área irradiada). 4. Conclusiones
Este trabajo proporciona los primeros valores locales de DAP para los tipos de exámenes fluoroscópicos evaluados, con la intención de servir de punto de partida para, que una vez evaluados otros equipos y prácticas, se pueda llegar a proponer valores provisionales de referencia en fluoroscopía en Brasil. Los elevados valores de DAP medidos en todos los casos, sugieren la necesidad de implementar una metodología padronizada para definir niveles de referência regionales en fluoroscopía y su posterior optimización, mediante el analisis de las causas que originan estos resultados. Es imprescindible la monitoración de las exposiciones a pacientes durante los procedimientos, mediante la instalación de medidores del producto dosis-área en los equipos fluoroscópicos y del registro dosimétrico del paciente, aspectos ya obligatorios en otros países [16]. Los niveles de referencia para fluoroscopía deberían establecerse midiendo un conjunto de parámetros, en vez de un único indicador. Tiempo de exposición, número de imágenes y DAP total constituyen la base de este conjunto. Un conjunto mas completo incluye el DAP de la parte radiográfica y el DAP de la parte fluoroscópica del examen, separadamente.
En función de los resultados, medidas inmediatas deben ser tomadas. Acciones conjuntas entre autoridades sanitarias, médicos, físicos médicos, técnicos y fabricantes deben ser

IAEA-CN-85-93
133
establecidas. Una revisión cuidadosa de los protocolos médicos de los exámenes podría permitir, en ciertas situaciones, la diminución de las dosis. Por lo tanto, los radiólogos deben ser concientizados sobre la importancia de esta cuestión e involucrados en la problemática de la determinación de niveles de exposición de pacientes. Tabla I. Resultados de las medidas realizadas. n: número de exámenes evaluados. Los valores de
los niveles de referencia disponibles internacionalmente [12][13[14][15] están indicados entre
paréntesis y en negrito en la tercera columna
Tiempo
[min]
No.
Imágenes
DAPtotal
[Gycm2]
Tasa Dosis
escopia[mGy/min]
ESOFAGOGRAFIA (n = 39) (10)
Rango 0,7-6,4 2-27 4-33
Media � Desv. Estandar 2,7 � 1,5 11,2 � 5,5 13 � 7 46 � 15
3er Cuartil 3,6 14,0 17 56
ENEMA DE BARIO (n = 9) (37-62)
Rango 3,8-23 7-24 37-324
Media � Desv. Estandar 10,1 � 6,6 13,8 � 5,8 118 � 81 65 � 21
3er Cuartil 12,1 19,0 108 77
SERIOGRAFIA (n = 5) (25-53)
Rango 5,8-17,9 15-24 26-140
Media � Desv. Estandar 12,4 � 4,4 20,0 � 3,3 84 � 41 42 � 20
3er Cuartil 13,6 21,0 93 46
URETROCISTOGRAFIA (n = 4) -
Rango 2,8-5,8 9-10 38-46
Media � Desv. Estandar 4,3 � 1,5 9,3 � 0,6 43 � 4 51 � 10
3er Cuartil 4,5 10,0 44 48
UROGRAFIA INTRAVENOSA (n = 3) (20-40)
Rango 1,5-3,5 6-11 23-59
Media � Desv. Estandar 2,4 � 1,0 8,7 � 2,5 42 � 18 56 � 14
3er Cuartil 2,9 10,0 52 64
Tabla II. “Valores típicos” obtenidos para los diferentes exámenes evaluados
Examen Tiempo total
[min]
No. de
imágenes
DAP total
[Gycm2]
Tasa de dosis
[mGy/min]
Enema de bário 12 20 108 77
Seriografia 14 21 93 46
Esofagografia 4 14 17 56
Uretrocistografia 5 10 44 48
Urografia intravenosa 3 10 52 64
Agradecimientos: Los autores agradecen a la Dra. Denise Madeira Moreira, a los médicos residentes R1: LC. Campos, HC. Marques y AA. Salomão F., a las enfermeras VL. de Oliveira, AC. de Oliveira y RN. Eiras, a los físicos A. de Amorim y M. Balthar y a los tecnólogos R. Silva y J. Portela. Este trabajo fue realizado con el apoyo de CNPq (Brasil), GSF (Alemanha) e IAEA (Contract BRA11061).

IAEA-CN-85-93
134
Referencias
[1] International Atomic Energy Agency (IAEA). “International Basic Safety Standards for Protection Against Ionising Radiation and for the Safety of Radiation Sources”. IAEA Safety Series No. 115. Vienna, Austria. Feb., 1997.
[2] European Commission (EC). “Guidance on Diagnostic Reference Levels (DRLs) for Medical Exposures”. Radiation Protection 109. Directorate-General Environment, Nuclear Safety and Civil Protection. European Commission. 1999.
[3] European Commission (EC), Council Directive 97/43/EURATOM of June 30th 1997 on health protection of individuals against the dangers of ionizing radiation on relation to medical exposures. Official Journal from the European Communities. 1997.
[4] BRASIL. Ministério da Saúde. “Diretrizes de Proteção Radiológica em Radiodiagnóstico Médico e Odontológico”. Portaria No. 453. 1/6/98. Brasil.
[5] Costa, MMB.; Nova, JLL.; Carlos, MT, et al. “Videofluoroscopia - Um novo método”. Radiol. Bras., 25, p.11-18. 1992.
[6] Costa, MMB. “Uso de bolo contrastado sólido,líquido e pastoso no estudo videofluoroscópico da dinâmica da deglutição”. Radiol. Bras., 29, p.35-39. 1996.
[7] Canevaro, LV., Carlos, MT., Drexler, G., et al. "Assessment of Doses to Patients Submitted to Fluoroscopic Gastrointestinal Tract Examinations”. Radiat. Prot. Dosim., Vol 80, Nos. 1-3, p. 155-158. 1998.
[8] Costa, MMB.; Canevaro, LV.; Azevedo, ACP. “Análise Dosimétrica do Método Videofluoroscópico Aplicado ao Estudo da Dinâmica da Deglutição”. Aceptado para ser publicado en la Revista Radiol. Bras., 34, No. 6. Diciembre 2000.
[9] Canevaro, LV. “Otimização da proteção radiológica em fluoroscopia. Níveis de referência de diagnóstico”. Tesis de Doctorado. Universidade do Estado do Rio de Janeiro. Rio de Janeiro. Brasil. Agosto 2000.
[10] Proyecto IAEA BRA 11061. “Dose Reference Levels in Fluoroscopy”. Laboratório de Ciências Radiológicas A partir de diciembre de 1999.. Rio de Janeiro, Brasil.
[11] Physikalisch Technische Werkstätten (PTW-Freiburg). “DIAMENTOR M4. User Manual for Diamentor M4 type 11006 and Ionization Chamber type 57523-1”. PTW-Freiburg. Germany. 1996.
[12] European Commission (EC), European Radiation Protection, Education and Training (ERPET), “Training Course for Medical Physicists on Establishment of Reference Levels in Diagnostic Radiology”. Passau, Germany. 13-15 September, 1999.
[13] European Commission (EC). “Guidance on Diagnostic Reference Levels (DRLs) for Medical Exposures”. Radiation Protection 109. Directorate-General Environment, Nuclear Safety and Civil Protection. European Commission. 1999.
[14] Saxebøl, G.; Olerud, HM.; Hjardemaal, O.; Leitz, W.; Servomaa, A.; Walderhaug, T. “Nordic Guidance Levels for Patient Doses in Diagnostic Radiology”. Radiat. Prot.
Dosim., Vol. 80, Nos. 1-3, p.99-101. 1998. [15] Vañó, E. “Estimación de Datos Españoles para el Comité UNSCEAR”. Madrid. España.
Febrero 2000. Comunicação pessoal. [16] ESPAÑA. Real Decreto 1976/1999, de 23 de diciembre, por el que se establecen los
critérios de calidad en radiodiagnóstico. Boletin Oficial del Estado de 29 de diciembre de 1999 (45891-45900).

IAEA-CN-85-73
135
PATIENT AND STAFF DOSE DURING HYSTEROSALPINGOGRAPHY
N. Buls, M. Osteaux Department of Radiology and Medical Imaging Free University Hospital Brussels (AZ-VUB), Belgium Abstract
Hysterosalpingography (HSG) is a useful and widely employed technique which uses X-ray fluoroscopy to
investigate the female genital tract. Fluoroscopy is assessed by a gynaecologist, a physician who is not always
trained to work with ionising radiation. Dose-area product measurements in a group of 34 patients allowed an
estimation of the median effective dose (0,83 mSv) and the median dose to the ovaries (1,63 mGy) of the patient
per procedure. The dose to the staff was estimated using thermoluminescent dosimetry. The following median
entrance surface doses were estimated per procedure: 0,22 mGy to the lens of the eye, 0,15 mGy to the neck at
thyroid level and 0,19 mGy to the back of the hand. The annual eye dose limit could be exceeded if the
gynaecologist is a member of the public.
1. Introduction
Hysterosalpingography (HSG) with water-soluble contrast media is a useful and widely employed method of investigating the female genital tract. The most common indication to perform an HSG is infertility. During an HSG, X-ray fluoroscopy is carried out by a gynaecologist to visualise the genital tract (uterus and Fallopian tubes). Since most patients (age between 20-40) desire pregnancy and the X-rays are targeted at the gonadal region, optimisation in terms of dose reduction and image quality is essential. A gynaecologist is a physician who is generally speaking not trained and used to work with ionising radiation as a radiologist and therefore not always familiar of the harmful effects to himself and his patient. Often he is not an occupational exposed worker but a member of the public. This clinical study is undertaken to estimate the effective dose and organ doses to the patient with respect to articles 4 and 9 the Euratom 97/43 directive [1] which imposes the European member states the promotion of the establishment and use of diagnostic reference levels. The doses to the eye, neck and hands of the staff (gynaecologist) were also estimated by using thermoluminescent dosimetry. Several international papers have already been published regarding the patient dose in HSG [2-6], but no recent papers, to our knowledge, could be found regarding the dose to the staff.
2. Material and Methods
A total of 34 patients were evaluated on a over-couch General Electric Prestilix 1600 DRS radiographic unit. The input air kerma rate for the smallest field size (12.5 cm) in high dose rate selection measured on top of the image intensifier with a 15 cm³ ionisation chamber and 2 mm additional copper filtration is 0.68 µGy.s-1. Digital acquisition is used during the examinations. The dose area product (DAP) as a measure of radiation dose was determined for each radiographic and fluoroscopic exposure to each patient. Accordingly, the kilovoltage and view/projection for each single exposure were documented. The effective dose and doses to the ovaries and uterus were estimated using the recorded DAP value in combination with effective dose conversion factors derived from Monte Carlo computer calculations for a

IAEA-CN-85-73
136
female mathematical anthropomorphic phantom [7]. These factors are expressed in function of beam quality, applied kilovoltage and anatomical projection. For the staff dosimetry, entrance surface doses (ESD) were measured by using thermoluminescent dosimeters TLD-100H (LiF: Mg, Cu, P) at different positions on the body of the gynaecologist. Three TLD chips were attached to the skin between the eyes, three to the skin of the neck at the level of the thyroid and three to the skin of the back of the hands for each examination. The ESD at one position (eye, thyroid or hand) was calculated as the average of the three readings. The TLD’s were calibrated in air at 96 kVp (= energy used during ERCP) on the same X-ray unit. They were processed with a Harshaw-Bicron 5500 TLD reader and annealed in a PTW-TLDO oven. The gynaecologist wears a wrap around apron with 0,25 mm lead equivalence as personal protection.
3. Results and discussion
3.1. Dose to the patient
An overview of the patient exposure data per HSG procedure in terms of dose area product (DAP), fluoroscopy screening time, ovarian dose, uterus dose and effective dose is presented in table 1. 80 % of the dose to the patient is due to the contribution of fluoroscopy. Since the data presents not a normal distribution, the 1st quartile, median, 3rd quartile and maximum values are provided besides the mean.
Table 1. Patient exposure data evaluated for 34 examinations
Exposure indicator Hysterosalpingography (34 studies evaluated)
Mean 1st quartile Median 3
rd quartile Maximum
Dose Area Product (Gy cm²) 5,62 3,54 4,30 6,38 23,2
Fluoroscopy screening time
(s)
58 34 43 66 210
Ovarian dose (mGy) 2,70 1,36 1,63 2,82 15,5
Uterus dose (mGy) 4,06 1,81 2,15 4,32 27,8
Effective dose (mGy) 1,39 0,70 0,83 1,44 8,53
From the data in table 1 can be seen that the exposure to the patient shows a large variation. This can easily be understood considering the influence of the patient size on the tube load and the variation in the assessed screening time according to the conduct of the procedure and the patient condition. The effective dose of the HSG patient is comparable to the dose resulting from other conventional radiological examinations. Table 2 compares our data to this from other studies previously published in literature. All the values presented are median values recorded on digital units unless stated different. The data shows a large variation due to the difference in radiographic equipment, applied clinical technique and statistical analysis.
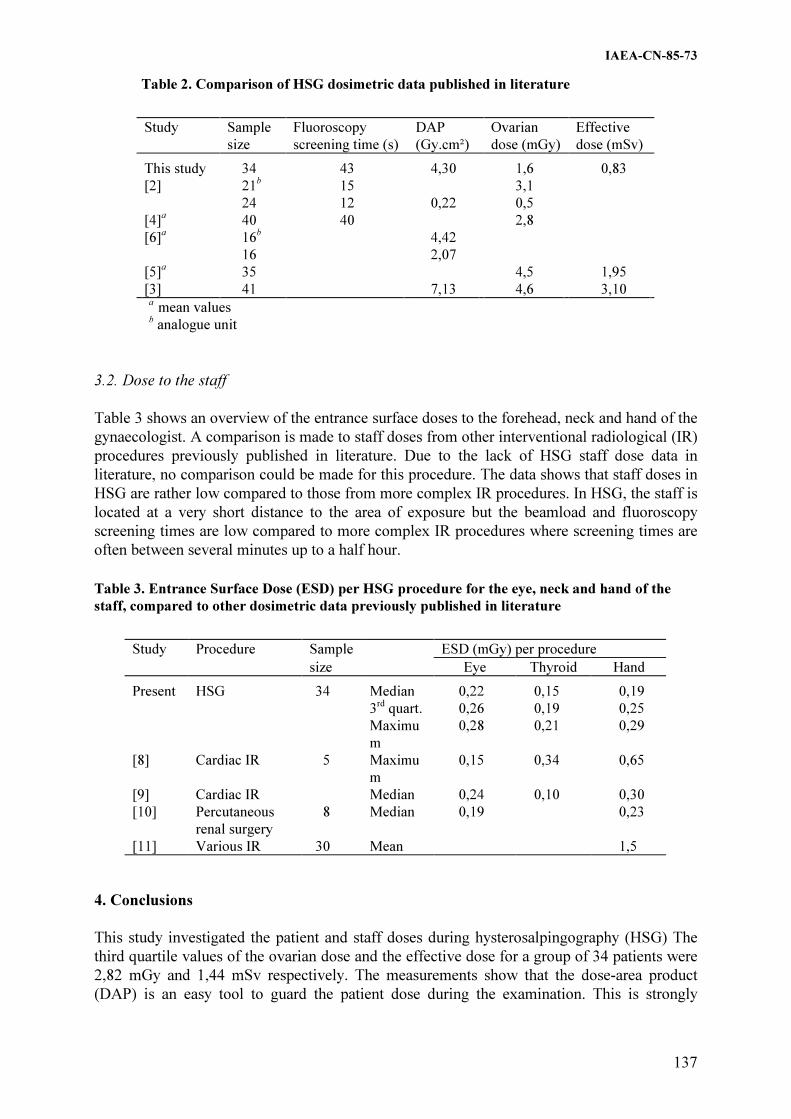
IAEA-CN-85-73
137
Table 2. Comparison of HSG dosimetric data published in literature
Study Sample
size
Fluoroscopy
screening time (s)
DAP
(Gy.cm²)
Ovarian
dose (mGy)
Effective
dose (mSv)
This study 34 43 4,30 1,6 0,83
[2] 21b
15 3,1
24 12 0,22 0,5
[4]a 40 40 2,8
[6]a
16b
4,42
16 2,07
[5]a 35 4,5 1,95
[3] 41 7,13 4,6 3,10 a
mean values b analogue unit
3.2. Dose to the staff
Table 3 shows an overview of the entrance surface doses to the forehead, neck and hand of the gynaecologist. A comparison is made to staff doses from other interventional radiological (IR) procedures previously published in literature. Due to the lack of HSG staff dose data in literature, no comparison could be made for this procedure. The data shows that staff doses in HSG are rather low compared to those from more complex IR procedures. In HSG, the staff is located at a very short distance to the area of exposure but the beamload and fluoroscopy screening times are low compared to more complex IR procedures where screening times are often between several minutes up to a half hour.
Table 3. Entrance Surface Dose (ESD) per HSG procedure for the eye, neck and hand of the
staff, compared to other dosimetric data previously published in literature
Study Procedure Sample ESD (mGy) per procedure
size Eye Thyroid Hand
Present HSG 34 Median 0,22 0,15 0,19
3rd
quart. 0,26 0,19 0,25
Maximu
m
0,28 0,21 0,29
[8] Cardiac IR 5 Maximu
m
0,15 0,34 0,65
[9] Cardiac IR Median 0,24 0,10 0,30
[10] Percutaneous
renal surgery
8 Median 0,19 0,23
[11] Various IR 30 Mean 1,5
4. Conclusions
This study investigated the patient and staff doses during hysterosalpingography (HSG) The third quartile values of the ovarian dose and the effective dose for a group of 34 patients were 2,82 mGy and 1,44 mSv respectively. The measurements show that the dose-area product (DAP) is an easy tool to guard the patient dose during the examination. This is strongly
IAEA-CN-85-73
138
advised since the gonadal region is exposed and all patients are young women who desire pregnancy. Considering an average of 85 annually performed HSG examinations and the data (third quartile values) presented in table 3, the gynaecologist would receive an annual ESD of 22 mGy at eye level, 16 mGy at thyroid level and 21 mGy to the skin of the hand. This is, in general, lower than doses to staff-members who perform more complex IR procedures (angiography and cardiology) but the gynaecologist is often a member of the public who is not trained to work with ionising radiation. Moreover, the annual dose limit of 15 mSv to the lens of the eye could be exceeded. From the view of patient protection, it is clear that gynaecologists who perform HSG should be properly trained to use ionising radiation and especially in limiting the fluoroscopy screening time. He should also be a member of the occupational exposed workers. It is advised that HSG should be included in future clinical multi-center patient and staff dose surveys at national and international level. References
[1] Council directive 97/43Euratom on Health protection of individuals against the dangers
of ionising radiation in relation to medical exposure, Official J Eur Commun L180 (1997) 22-27.
[2] GREGAN, A.C.M., PEACH, D., McHUGO, J.M., Patient dosimetry in hysterosalpingography: a comparative study, Br J Radiol 71 (1998) 1058-1061.
[3] FERNANDEZ, J.M., VAÑO, E., GUIBELALDE, E., Patient doses in hysterosalpingography, Br J Radiol 69 (1996) 751-754.
[4] FIFE, I.A.J., WILSON, D.J., LEWIS, C.A., Entrance surface and ovarian doses in hysterosalpingography, Br J Radiol 67 (1994) 860-863.
[5] CALICCHIA, A., CHIACCIARARELLI, L., DE FELICE, C., GIGLIOTTI, T., INDOVINA, P.L., MAZZEI, F., PORFIRI, L.M., Assessment of radiation dose to patients in hysterosalpingography, Radiol Med (Torino) 95 (1998) 93-97.
[6] HAUSSLER, M.D., MERK, J., TOMCZAK, R., SCHNARKOWSKI, P., Radiation dosage during hysterosalpingography using a digital image intensifying technique, Rofo Fortschr Geb Rontgenstr Neuen Bildgeb Verfahr 157 (1992) 596-598.
[7] HART, D., JONES D.G., WALL, B.F., Estimation of effective dose in diagnostic radiology from entrance surface dose and dose-area product measurements, Rep. NRPB-R262, London (1994).
[8] JANSSEN, R.J., HADDERS, R.H., HENKELMAN, M.S., BOS, A.J., Exposure to operating staff during cardiac catheterisation measured by thermoluminescence dosimetry, Radiat Prot Dosim 43 (1992) 175-177.
[9] IMA, F.R.A., KHOURY, H.J., HAZIN, A., LUZ, L.P., Doses to the operating staff during interventional cardiology procedures (Proc. 10th Int. Congress of the IRPA, 2000), IRPA, Hiroshima (2000).
[10] BOWSHER, W.G., BLOTT, P., WHITFIELD, H.N., Radiation protection in percutaneous renal surgery, Br J Urol 69 (1992) 231-233.
[11] FELMLEE, J.P., McGOUGH, P.F., MORIN, R.L., CLASSIC, K.L., Hand dose measurements in interventional radiology, Health phys 60 (1991) 165-167.
IAEA-CN-85-94
139
PATIENT DOSIMETRY IN HISTEROSALPINGOGRAPHY
H.J. Khoury, A. Maia, M. Oliveira, R. Kramer
Departamento de Energia Nuclear, UFPE, Brazil
G. Drexler
Laboratório de Ciências Radiológicas, UERJ, Rio de Janeiro, and
GSF Forschungszentrum, Munich, Germany
Abstract
The objectives of this study were to determine the entrance surface dose to the patient and to estimate the dose to
the uterus and ovaries due to hysterosalpingography (HSG) diagnostic examinations performed in Recife-Pe,
Brazil. The entrance doses were measured using four thermoluminescent dosimeters per patient, attached to
anatomical landmarks on the patient's skin. The study was carried out on 25 patients between 21 and 45 years of
age who underwent the HSG examinations in two training hospitals and one private radiodiagnostic institute.
The number of exposures performed ranged from 4 to 15 radiographs per patient measured. Entrance surface
doses varied between 4.99 and 36.6 mGy, with an average of 12.6mGy. The doses to the ovaries and uterus
ranged from 0.80 mGy to 5.8 mGy and 1.10mGy to 8.05 mGy, respectively.
1. Introduction
Hysterosalpingography (HSG) is a radiological procedure which is performed on young
women to investigate the causes of infertility and sterility or to check the patency of the tubes
following reversal of sterilization. Many patients undergoing HSG are between 20 to 40 years
old and desire pregnancy. The average patient age according to Tyrell et.al is 31 years [1].
During this diagnostic examination many different radiographic projections and fluoroscopies
are made resulting in a high patient dose. The uterus and the ovaries are the main irradiated
organs [2,3]. For this reason, this examination requires rigorous optimization of the
procedures in order to have the image quality required for the diagnosis with the lowest
patient dose possible.
There are only few publications on patient dosimetry in HSG in Brazil, one of which is the
study made by Canevaro in Rio de Janeiro [4].
The current study was undertaken to evaluate the dose received by the patients during the
HSG examination performed in Recife, the Capital of the State of Pernambuco, located in the
Brazilian northeastern region. Its aim was to obtain dose values for the same procedure
performed in different hospitals in order to help to estabilish a reference dose level for this
radiodiagnostic procedures in Pernambuco.
2. Material and methods
This study was performed in two hospitals (A and B) and one radiodiagnostic private institute
(C). Both hospitals are educational institutions were radiologist residents performed
specialized training. At A and C HSG was performed by series of exposures and the tube
potential (kV) and mA were set manually by the radiographer. The X-ray equipment used are,
respectively, Siemens Polimat B and EMIC. Hard copy images were obtained on 24 x 30 cm
film using standard film screen radiography only. In hospital B a fluoroscopic technique
irradiation was used to position the patient adequately for the radiography. The equipment is

IAEA-CN-85-94
140
the Phillips Super 80CP. On this unit both kV and mA are controlled automatically following
operating algorithms programmed into the x-ray generator.
The measurements were made with in a total of 25 patients with ages ranging from 27 to 42
years and abdomen thickness ranging from 16 to 20 cm. The examinations were performed
with 100 to 110cm focus-film distance and the field size, determined by the radiographer,
varied between 19 cm x 15cm and 30cm x 24cm on the patient’s surface. Table I shows some
of the exposure parameters.
Table I. Values of The Main Technical Parameters for the institutions A,B and C
Parameter
Mean Value
Min Max
A B C
A B C
Tube potential (kV) 70.8 73.0 69.9 66-77
71-75 64-77
No. of films 5.9 6.8 4.7 4-15
5-7 4-5
The dosimetric evaluation was performed with LiF TLDs (TLD-100) calibrated with radiation
energies similar to the ones used in clinical setting. The results were corrected to take into
account backscattering. Two dosimeters were packaged in a polyethylene case and heat
sealed. Two bags were placed on the surface of each patient, one on the right and the other on
the left side of the abdomen, 3 cm from the field center. The TLDs were processed on a
Victoreen readout system model 2800M and the average of their readings corresponds to the
entrance surface dose.
In order to obtain reasonable estimates for the dose to the uterus and to the ovaries, the HSG
was simulated with the Monte Carlo program EVA [5]. This program determines among other
doses quantities also conversion coefficients between organ doses and entrance surface dose.
A simple multiplication of the measured entrance surface doses (Table II) with the appropriate
conversion coefficient leads to the organ doses shown in Table III.
3. Results
Figure 1 shows the distribution of entrance surface doses. Table II on the other hand shows
the mean values obtained for the three institutions. In spite of having more experience
physicians in the institution C, the entrance dose received by the patients during the exams
were higher than those observed in the other two (A and B). Probably this is due to the fact
that the value of the total filtration of the x-ray equipment used in institution B (2.5mm of Al)
is lower than the ones used in the other two institutions (3.5mm of Al).

IAEA-CN-85-94
141
Figure 1: Frequency distribution of entrance surface doses for HSG Examinations
Table II. Entrance surface doses in mGy obtained at institutions A,B and C, for HSG
examinations
Institution
Entrance Surface Dose ( mGy)
Mean Min-Max
A
8.44
4.99 - 14.28
B
17.36
6.08- 36.40
C
31.74
26.41- 36.60
Table III shows the doses to the uterus and to the ovaries determined as the mean absorbed
dose to each organ. The results are similar to the other found in the literature.
Table III. Mean ovaries and uterus doses obtained at institutions A,B and C for HSG
examinations
Institution Ovaries dose
(mGy)
Uterus dose
(mGy)
A 1.18 1.71
B 5.27 6.97
C 2.38 3.42
Mean Dose (mGy) 2.94 4.03

IAEA-CN-85-94
142
4. Conclusion
The large range of entrance surface doses found is due to several factors like variation in
patient thickness, field size, potential x-ray tube, etc. Different procedures for the examination
generate different doses to the ovaries and what seems to improve positioning ( case B) needs
the major number of radiographs. The results obtained provide useful guidance on dose levels
and optimization strategies.
Acknowledgements
The authors would like to thank the radiologists and radiographers that contributes to this
study, for the institutions that allowed us to use their installation and to the CNPq for the
financial support.
References
[1] TYRELL, P.N.M; MCHUGO, J.M AND HALE, M., Patients perception of the
hysterosalpingogram: the initial stages of the audit cycle. Br. J. Radiol., 66, (1993)103-
107.
[2] FIFE, I. A . J.; WILSON, D.J AND LEWIS, C. A, Entrance surface and ovarian doses in
hysterosalpingography. Br.J.Radiol. 67, (1994) 860-863.
[3] FERNANDEZ, J.M., VANO, E. AND GUIBELALDE, E. Patient doses in
hysterosalpingography. Br. J. Radiol. 69, (1996)751-754 .
[4] CANEVARO, L.V.- Otimizaçào da Proteção radiologica em Fluoroscopia: Niveis de
referência de diagnóstico, tese de Doutorado, Universidade Federal do Rio de Janeiro,
(2000)
[5] KRAMER,R.,ZANKL,M.,WILLIAMS,G.AND DREXLER,G. – The Calculation of Dose from
External Photon Exposures Using Reference Human Phantoms and Monte Carlo
MethodsPart I: The Male (ADAM) and Female (EVA} Adult Mathematical Phantoms
GSF-Bericht S-885, (1982), Reprinted (1986) and (1999).
IAEA-CN-85-67
143
DOSIMETRIC ASSESSMENT OF SWALLOWING EXAMINATIONS WITH
VIDEOFLUOROSCOPY
M.M.B. Costa
Laboratório de Motilidade Digestiva/Imagem e Laboratório de Videofluoroscopia do Serviço
de Radiodiagnóstico do HUCFF, CCS, UFRJ, Rio de Janeiro, Brasil
L.V. Canevaro
Laboratório de Ciências Radiologicas, Instituto de Biologia, UERJ, Rio de Janeiro, Brasil
A.C.P. Azevedo
Faculdade de Medicina, Universidade Federal do Rio de Janeiro, Brazil Abstract
Dosimetric analysis measurements of the Dose-area-product (DAP) of 7 individuals were estimated for the
deglutition dynamic using the videofluoroscopic method. The aim of this study is to establish in a preliminary
way, typical DAP values, for this kind of study. The DAP values were obtained attaching to the X ray tube exit,
an ionization chamber from PTW and a Diamentor M4 meter. The typical DAP values obtained during the
videofluoroscopic evaluation of the deglutition dynamic including its three phases was 4101 +/- 881 cGy.cm2
and the typical DAP rate was 577 +/- 94 cGy.cm2/min. These values refer to a standard patient (1.57 cm height,
56 kg. weight) and a protocol that can be performed in about 7 minutes. The values, defined herein as typical
refer to the used protocol. To our knowledge, the mean DAP rate is a good parameter to estimate radiation
exposure from videofluoroscopic study of swallowing process.
1. Introduction
The efficiency and the quality of a semiotic method is represented by its ability of solving
questions and indicating solutions. Videofluoroscopy has been accepted as the “gold standard”
for the evaluation of the oral and pharigeal phases of the swallowing process. Its efficiency is
unquestionable for the study of the esophageal phase, as well.
To study swallowing in its three phases, including the esophageal one in the disphagia
protocol evaluation, in spite of increasing the examination time, is indeed an important
decision. Not seldom, oro-pharingeal disphagias are associated with some morfological or
functional involvement of the esophagus. Besides this, low tract disphagias of esophageal
origin are commonly refered to, by the patient, as high disphagia due to upper transmission.
These facts are more than adequate justifiactions to the inclusion of the esophageal evaluation
in the protocol for disphagia studies, by the videofluoroscopic method.
However, in radiological examinations, exposure time to radiation must be taken into account
in the cost-benefit analysis. Therefore it is important to evaluate the radiation doses to which
the patients will be exposed when evaluated by a protocol that includes swallowing in its three
phases. On the other hand, medical procedures are the most important causes of human
exposure to artificial radiation sources.
The Committee of Radiological Protection from the Pan American Health Organization [1],
points out that a radiological examination, clinically justified, generally causes a benefit to the
patient and compensates the associated radiation exposure risk. The fact of recognizing the
possibility of harmful effects, is the resposible for safety in radiodiagnostic methods
nowadays.
Radiation interacts with the body determining the energy absorption by mass unit in a given
tissue or organ, characterizing the absorbed dose. The dose received in a given kind of

IAEA-CN-85-67
144
examination is distributed in a variable mode in the body being maximun at the skin surface.
Dose in tissues greatly depend on the radiographic technique. The unit of absorbed dose is the
Gray (J/kg).
Costa et al [2,3,4] have evaluated patient doses using TLD’s the videofluoroscopic method
and compared the results with the deglutogram which uses radiograpic film, and concluded
positively, with respect to the videofluoroscopy.
The low radiation in videofluroscopy was shown more evident when compared to classical
radioscopy, the method where the images in the fluorescent screen were directly observed in
dark room. It was observed [2] that the method that uses fluoroscopy with image intensifier
causes an exposure around 13 times lower than the classical radioscopy.
The overall radiation emitted during an examination can be measured with a “dose x area
meter”, an equipment that registers in cGy.cm2 the radiation quantity that may reach the
patient during an examination. The DAP (Dose Area Product) is a dosimetric quantity
specifically related to patient exposure. It reflects the greater or smaller exposure determined
by the procedure. Therefore, not only the radiation dose but also the field size in cm2, are
important in the evaluation of radiation exposure produced by a given examination.
The most appropriate parameter to evaluate patient exposure in fluoroscopic examinations is
the DAP, that registers the absorbed dose in the air multiplied by the total irradiated area
during the examination. The DAP, generally expressed in cGy.cm2, must not be mistaken with
the concept of radiation dose per area expressed in cGy/cm2, that is the dose per unit area
where each cm2 receives the dose. The DAP does not measure the dose in a particular body
region, the expressed value is proportional to the total energy imparted to the patient during
the whole procedure.
In this regard, we have tried to adopt, for patient radiological protection the reference doses,
and standardize the radiation that is needed to correctly perform a given type of examination
[5,6].
Dosimetric data depend on the kind of radiological equipment, the degree of patient
cooperation, the radiologist ability and the exposure time. Preliminary results [3,10], coincide
with data from the European Comunity
are of the order of 1100 cGy.cm2 for an
esophagography, of 4000 cGy.cm2 for barium meal and 6000 cGy.cm
2 for barium enema. In
these examinations, radiographies represent 20-50 % of DAP [7,8].
In a dynamic examination, different regions with distinct densities are exposed to radiation.
Therefore, different DAP are to be expected. Different registred DAP are summed up by the
DAP meter allowing the quantification of the total overall radiation produced during a
videofluoroscopic examination. This characteristic of summing up in the examination time the
DAP variations, makes the videofluoroscopic method an excelent standard to study
deglutition dynamic. For these reasons, the present study can offer in preliminary values of
typical DAP which could represent this type of examination.
2. Materials and methods
The videofluoroscopic examinations were performed using an X ray equipment from Medicor
model UV 56M, type FR2 with undercouch tube model D19-12/50-150. The tv system is

IAEA-CN-85-67
145
Vidiomed 2, with image intensifier type RBV 23/13. It uses a Vidicon tube with 525 lines, 60
Hz, interlacing 2:1. The images were registered in the VHS format with a video/monitor
Samsung high speed mechanism model-CXE 1331. The DAP values were obtained attaching
to the X ray tube exit a Diamentor model M4 from PTW.
Radiation exposure of 7 persons were analyzed during the videofluorsocopic examination,
two men and 5 women, with ages between 21 and 72. The individuals were evaluated for the
three phases of swallowing (oral, pharingeal and esophageal). One woman, a volunteer, had
no complain and the remaining 6, refered to disphagia related to Parkinson disease.
The oral, pharingeal and esophageal phases were examined with a previously defined protocol
[9] which includes observation during deep nasal inspiration and expiration and deglutition of
saliva, water and contrasted home made test bolus (moisturized and homogenized bread with
powder barium sulfate in soft consistency) from 0.5 to 2,5 cm diameter as well as barium
sulfate solution.
The radiation doses to which the patients were exposed were calculated using the relation :
(DAP = DAPm x 0,97 x 1,14) where DAP represents the actual value, DAPm is the measured
value without correction. Correction factors are 0,97 determined by the manufacturer for
undercouch tubes and 1,14 is the ionization chamber calibration factor.
3. Results and discussion
To our knowledge, there is no similar protocol for the evaluation of either DAP of
swallowing, radiographic nor videofluoroscopic methods. For this reason, results obtained
here can serve as a reference and a basis for future evaluations. It is necessary to take into
account, the kind of protocol employed in the evaluation of swallowing when comparing
DAP. Does the protocol include the three phases of swallowing? What kind of equipment is
used for registering the events?
Protocols that do not include the three phases of swallowing can present lower values of DAP,
limiting information that could be obtained in exchange of a shorter examination time.
Observation with fluoroscopy first and then registration in a radiographic film causes a loss of
dynamic information and the use of a higher dose rate to sensitize the radiographic film that,
depending on the used protocol, can cause in a higher DAP.
Aiming the reduction of this possible discrepancy we have considered DAP rate
(cGy.cm2/min). Therefore, the exclusion of one examination phase would generate reduced
DAP but similar values of DAP rate.
An analysis of table 1 allows the evaluation of sample quality, radiological technique, time
variations necessary for fulfilling the proposed protocol and data registred by the Diamentor
for each one of the individuals in cGy.cm2. This table also shows the DAP rate in
cGy.cm2/min. Table 1 shows also the normalized values obtained by the product of
examination time multiplied by the mean DAP rate. Results show new values for DAP
comparable to the measured in each examination.This table, points out to the fact that, in the
evaluation of swallowing which occurs in head, neck and mediastinum regions, where the
contrasted esophagus is visualized in its cranio-caudal transit, the mean DAP does not change
much with individual physical completion. Its variation depends on a larger scale on the
changes of employed technique. Therefore, even a small sample was representative of

IAEA-CN-85-67
146
exposure to radiation in this protocol that can be verifyed by the small variance of the results.
Consequently, a larger sample, that could present a greater dispersion depending on physical
completion is out of procedure control. Dose control can and must be performed according to
the protocol and in the proposed time.
Table 1. Data
Hight
(cm)
Weight
(kg)
mA
(aver.)
kV Total
time
(min)
DAPm
(cGy.cm2)
DAP
(cGy.cm2)
DAP rate
(cGy.cm2/min)
DAP rate
normalized
(cGy.cm2/min)
CMF 1.48 42 1.0 65 7.1 3061 3385 477 4096
SIF 1.65 60 1.6 70 7.5 4777 5282 704 4327
MLO 1.49 59 1.0 64 7.7 4107 4541 590 4442
JM 1.60 63 1.2 65 6.7 4125 4561 680 3865
AFS 1.60 60 1.6 70 7.8 4257 4707 603 4500
PFM
C
1.65 54 1.1 65 5.9 2694 2979 505 3404
CDP 1.55 52 1.1 60 6.8 2941 3252 478 3923
St.dev
.
881.5 387
In table 2, the descriptive statistics is discussed and allows the evaluation of the influence of
the different variables in DAP values. Age, sex and physical complexion, represented by
height and weight are determining factors in density variations and consequently in final DAP.
These parameters, inherent to the patient, do not change, nevertheless its observation will help
the interpretation of the DAP found for each individual. The location of a determined DAP in
one or other end of the gaussian distribution can point out towards a better or worse
performance of the applied methodology or radiological equipment. When patient who were
expected to be located in the lower part of the curve appear in the upper part, it can be an
indicative of careless examination, lack of examinator expertise or deficient equipment.
Another important factor to be considered is collimation. As the measurement is done after the
collimator, to colimate a field, whenever possible, reduces exposure area and consequently the
DAP.
The DAP obtained in our study can be related to other studies of dose-area of digestive system
[7,8]. Our results are distributed in the lower dose level obtained up to date in radiological
procedures of this system. The examination time is the parameter that can be easily
manipulated to reduce DAP together with an optimized technique. For this reason, we define
exposure by an examination per unit time (minutes). This exposure was obtained for each
examination dividing total DAP by the time required for that specific examination.
Examination time is clearly dependent on the protocol and depends on the examinator’s
expertise and the degree of difficulty presented to perform the examination. However, it is
here that the efforts to reduce DAP must be directed. This reduction can be achieved
improving the examinator’s performance, specially through the elaboration of protocols which
clearly define the sequence of events to be observed. However, to reduce DAP, the
examination quality can not be degraded.
The DAP rates served as a basis to obtain a mean value of what exposure during the
evaluation of swallowing. We believe that it is the best parameter to represent exposure. This
resource allows the reduction of several variables interfeering in the generarion of DAPs. If
we compare standard deviation which covers 68% of mean dispersion, we can see that it from

IAEA-CN-85-67
147
about 21% of total exposure to around 16% in exposure per minute, showing less disperssion
in the average when considering exposure/minute.
Table 2. Descriptive Statistics
Age
(y)
High
t
(m)
Weigh
t
(kg)
KV mA Total
time
(min)
DAPm
(cGy.cm2)
DAP
(cGy.cm2)
DAP rate
(cGy.cm2/min)
Average 53,5
7
1,57 55,71 65,5
7
1,23 7,07 3709 4101 577
Standard
error 7,79 0,03 2,7 1,32 0,1 0,25 301 333 35
Standard
deviation 20,6
1
0,07 7,13 3,51 0,26 0,67 797 881 94
Minimum 21 1,48 42 60 1 5,9 2694 2979 477
Maximum 72 1,65 63 70 1,6 7,8 4777 5282 704
Sum 375 11,0
1
390 459 8,6 49,5 25962 28709 4038
Counts 7 7 7 7 7 7 7 7 7
Conclusion
Typical value of DAP obtained during the videofluoroscopic analysis of swallowing with
analysis of its three phases is 4101 +/- 881 cGy.cm2 and the typical DAP rate was 577 +/- 94
cGy.cm2/min for individuals 1,57 cm height, 56 kg weight, examined with protocols which
can be performed in around 7 minutes. The values defined here as typical refer to the used
protocol. To our knowledge, the mean DAP rate is a good parameter to estimate radiation
exposure due to videofluoroscopic study of swallowing.
References
[1] ORGANIZACION PANAMERICANA DE LA SALUD. “Protecion del Paciente en
Radiodiagnóstico”. Caderno Tecnico 3 (1987).
[2] COSTA, M.M.B., NOVA, J.L.L, CARLOS, M.T., PEREIRA, A.A., KOCH, H.A.,
Videofluoroscopia - Um novo método. Rad. Bras. 25 (1992)11-18.
[3] CANEVARO, L.V., Avaliação de doses em fluoroscopia gastrointestinal. M.Sc. Thesis,
COPPE-UFRJ, Rio de Janeiro, Brazil (1995).
[4] CANEVARO, L.V., CARLOS, M.T., BORGES, J.C., DREXLER G., KOCH, H.A.,
Assessment of doses to patients submitted to fluoroscopic gastrointestinal tract
examinations. Rad. Prot. Dos. 80 (1998) 155-158.
[5] INTERNATIONAL COMMISSION ON RADIOLOGICAL PROTECTION. ICRP
Publication 60. Pergamon Press, Oxford (1990).
[6] INTERNATIONAL COMMISSION ON RADIOLOGICAL PROTECTION. ICRP
Publication 73. Pergamon Press, Oxford (1996).
[7] EC, “Guidance on Diagnostic Reference Levels (DRLs) for Medical Exposures”.
Radiation Protection 109. Directorate-General Environment, Nuclear Safety and Civil
Protection. European Commission (1999).
[8] EC, European Radiation Protection, Education and Training (ERPET), “Training
Course for Medical Physicists on Establishment of Reference Levels in Diagnostic
Radiology”(1999) Passau.
IAEA-CN-85-67
148
[9] COSTA, M.M.B., Uso de bolo contrastado sólido, líquido e pastoso no estudo
videofluoroscópico da dinâmica da deglutição, Rad.Bras. 29 (1996) 35-39.
[10] COSTA, M.M.B., CANEVARO, L.V., AZEVEDO, A.C.P. Análise Dosimétrica do
Método Videofluoroscópico aaaploicado ao Estudo da Dinâmica da Deglutição. Rad.
Bras. 6 (2000).

Topical Session 2
RADIOLOGICAL PROTECTION ISSUES IN SPECIFIC
USES OF DIAGNOSTIC RADIOLOGY, SUCH AS
MAMMOGRAPHY AND COMPUTED TOMOGRAPHY
(WITH SPECIAL CONSIDERATION OF THE
IMPACT OF DIGITAL TECHNIQUES)

.

IAEA-CN-85-103
151
EVALUATION OF DIAGNOSTIC RADIOLOGY SERVICES IN FIVE LATIN
AMERICAN COUNTRIES: RESULTS FOR MAMMOGRAPHY
M.E. Brandan1, C.E.M. Caspani
2, R. de la Mora
3, A.A. Miranda
4,
M.-C. Plazas5, C. Borrás
6
1 IFUNAM, México DF, Mexico
2 RFSF, Santa Fé, Argentina
3 CCEEM, La Habana, Cuba
4 IBTEN, La Paz, Bolivia
5 INC, Santafé de Bogotá, Colombia
6 PAHO/WHO, Washington, DC, United States of America
Abstract
Under the auspices of PAHO/WHO, a multicentric investigation is carried out in five Latin American countries.
Its aim is to correlate quality indicators of radiology services with the accuracy of the radiological interpretation
as determined by a panel of experts. We present preliminary results from mammographic imaging facilities,
which indicate that the failure to comply with the international standards of quality control produces images of
unacceptable quality, as measured either by using a phantom or by an independent evaluation of the clinical
images.
1. Introduction
Quality assurance programs in health services, in particular in radiology services are slowly
being implemented in Latin America and the Caribbean some under Government Regulations.
They will require the conjunction of strong political will, financial support and professional
training to become a relevant factor in the routine service offered by radiological facilities.
The Pan American Health Organization/World Health Organization, (PAHO/WHO)
coordinates and partially funds an investigation aimed at correlating quality indicators of
radiology services with the accuracy of the radiological interpretation. Grants have been
awarded to government, academic and/or professional multidisciplinary teams in Argentina,
Bolivia, Colombia, Cuba and Mexico to pursue these studies following common procedures
based on internationally accepted protocols. The project should be completed after 12 months
of work, and here we present preliminary results obtained during the first half of the grant
duration.
2. Experimental procedure
2.1. Selection
The selected pathologies (and their associated radiological technologies) are: breast lumps
(screening and diagnostic mammography), gastrointestinal ailments (radiography and
fluoroscopy), back pain (computed tomography) and tuberculosis (radiography). The selected
services belong to the medium complexity classification and are located in urban areas. The
common quality control protocols are based on those endorsed by the American College of
Radiology (ACR) �1�, the American Association of Physicists in Medicine (AAPM) �2�, the
European Community (EC) �3�, etc. The panels of radiology experts in charge of evaluating
the accuracy of the radiological interpretation are endorsed by the national radiological
societies.

IAEA-CN-85-103
152
2.2. Documentation
Records are collected in relation to the population covered by the services (public vs. private),
the type of facility, the patient workload, the radiological, imaging and processing equipment
and supplies, the staff education and training, the quality assurance and maintenance programs
and the radiation safety standards.
2.3. Measurements
The measurements performed include the evaluation of devices (X-ray units, image receptors,
and image processors), darkroom and viewing conditions, patient dose, and image quality.
The clinical film evaluation by the expert panels considers imaging aspects (view and
labeling, patient positioning, contrast and latitude, and artifacts) as well as the radiological
interpretation report performed at the radiological service by the local physicians.
3. Results for mammography
Results from the study of mammography services are available from the five teams. The
IFUNAM group evaluated a total of 31 parameters in three mammo units �4� functioning in
two Mexico City public hospitals. The out-of-compliance results corresponded to beam
collimation and alignment (in the three units), viewbox illuminance and homogeneity (in the
three units), and darkroom conditions. One of the units, “Number 1”, operated at an X-ray
tube potential 10% higher than the nominal value and the cleanliness of the intensifying
screens was considered totally unacceptable. In this unit “Number 1”, chemicals’ temperature
in the two film processors was monitored during one month, finding unacceptable results
(discrepancy larger than 2o
C between the unit temperature reading and that given by the
control thermometer). Image quality was evaluated using the ACR accreditation phantom
under five technical factors, as indicated by the ACR protocol �1�. Unit Number 1 failed the
criterion for acceptable contrast, optical density and resolution at all five tube factors. The
other two systems passed the test in either one or two, out of the five technical modalities.
Mean glandular doses were calculated out of kerma in air measurements performed according
to the ACR manual; the obtained values are 1.4, 1.6 and 1.0 mGy respectively.
The RFSF group studied four mamography units, each at a different hospital in the city of
Santa Fé. All systems passed the 8 tests performed on the equipment performance (focal spot
size, beam alignment, tube potential accuracy and reproducibility, timer accuracy, HVL, air
kerma rate, SID, leakage radiation). However, all of the viewboxes were out-of-compliance
due to their poor illuminance homogeneity. The radiological interpretation study was
performed with 25, 20 and 16 clinical images obtained in three of the hospitals. The image
quality was evaluated by a Panel that gave qualifications equal to 2.9, 3.2 and 4.2, over a
maximum of 5. The lowest grade was due to finding 24/25 films dirty, 17/25 scratched and
12/25 with artifacts which simulated microcalcifications. The positioning was evaluated by
the Panel with grades equal to 3.3, 4.3 and 3.6 over a maximum of 5. The diagnosis by the
Panel coincided with that by the hospital facility in 60/61 cases.
The CCEEM group evaluated 255 clinical films corresponding to 80 patients in 2 hospitals.
Positioning problems were detected and correlated with technologist training. The radiological
interpretation by the Expert Panel coincided with that by the institution in 68/80 patients. Of
the 80 patients, 27 received fine needle aspiration biopsy, as part of their clinical management.
In 21 of them, the biopsy was done in patients where the panel and the facility physician
IAEA-CN-85-103
153
concurred in the radiological interpretation. 2 biopsies confirmed the institution’s assessment,
and 4 concurred with the Panel.
The IBTEN group evaluated 64 clinical films from 28 patients obtained at 2 hospitals and one
clinic. The Panel detected positioning problems as well as inadequate film labeling for 27/28
patients.
The INCAN group performed quality control measurements on 3 units belonging to 2
hospitals in Bogota. 24 tests on equipment performance were used. The units were out-of-
compliance in 4%, 4% and 30% of these tests, respectively. The system which presented the
most serious problems, “Hospital 2”, lacks a maintenance program and the radiation safety
conditions were considered inadequate. The mammo Expert Panel analyzed 20 films obtained
with this same system. The results showed that none of the films had a label recording the
technical parameters. Furthermore, 28% of the oblique and 18% of the craneocaudal views
were considered non acceptable in terms of technical quality, and 45% of the films were
considered to present a non acceptable optical density.
4. Conclusions
We have presented partial results for the evaluation of mammographic equipment
performance, image quality, dose and radiological interpretation corresponding to 14 systems
in five Latin American countries. Even though the study is still in progress, some general
results seem to appear already. The UNAM and INCAN results indicate a correlation between
the failure to pass the equipment quality control tests and the poor quality of the image;, this
one assessed either using the accreditation phantom or as determined by the panel of radiology
experts. Concerning the dose to the patient, the only calculations to date (UNAM) indicate
values well below the guidance levels published in the BSS [5], but similar to those published
by the FDA in their MQSA program [6]. Since the ultimate goal is an image of sufficient
diagnostic quality to produce an accurate radiological interpretation, the possibility that low
values indicate insufficient film exposure needs to be explored. The completion of the tests,
and a careful statistical analysis of the results, as well as the study of other radiological
techniques, should help better understand the intricate relation among the various equipment
parameters and the final image quality in radiological procedures. The knowledge and
experience gained by the participants of these five research teams should promote better
conditions for radiological services in Latin America and the Caribbean.
References
�1� AMERICAN COLLEGE OF RADIOLOGY, Mammography Quality Control Manual, 1990.
�2� AAPM REPORT 29, Equipment Requirements and Quality Control for Mammography, 1990.
�3� CEC, European Protocol for the Quality Control of the Technical Aspects of Mammography
Screening, 1992.
�4� C RUIZ-TREJO et al., these Proceedings.
�5� FAO, IAEA, ILO, OECD/NEA, PAHO and WHO, International Basic Safety Standards for
Protection against Ionizing Radiation and for the Safety of Radiation Sources, Vienna 1994.
[6] SULEIMAN OH, SPELIC DC, MCCROHAN JL, SYMONDS GR, HOUN F, Mammography in
the 1990s: The United States and Canada. Radiology, 210 (1999) 345-352.

IAEA-CN-85-144
154
STUDY ABOUT DIAGNOSTIC QUALITY IN A PUBLIC-CENTER OF
MAMMOGRAPHY OF SANTA FE, ARGENTINA
R. Lescano, J. Kiguen, L. Gaitán
Radiofísica Sanitaria, DiGAM, Mnisterio de Salud de Santa Fe, Santa Fe, Argentina
C. Caspani
Escuela Superior de Sanidad, FBCB, Universidad Nacional del Litoral, Santa Fe, Argentina
Abstract
The objective is to apply a method that allows us to evaluate the diagnostic quality of a public-center of
mammography and to validate it.
The representative centers of a social class were grouped; this one is evaluated measuring the mechanics,
electrics, dosimetrics and personal parameters of the process to get the mammography diagnostic. The original
study and the respective report, was submitted to the valuation of a panel of experts, who evaluated image,
technique and diagnostic. The equipment and techniques used are described in this case.
The judgment of the ACR and the Argentine legislation are applied. The dosimetric results of the mammography
practice, serve to determine the local reference levels. The whole people who has intervened in the diagnosis is
evaluated, and the services that can influence it. Seeking the parametric sensibility in relationship with the
succeeded and precocious diagnosis, the success of it is confirmed by the panel of experts.
We concluded indicating that the success percentage in the diagnosis is about 98,36%, that there is 100% of
coincidence among the perception and the value of the study quality. The valuation of the image reaches 69,2%
of the maximum score, and the placement technique, 73,9%. The parametric sensibilities of the principal
variables are discussed.
1. Objetivo
El objetivo es evaluar la calidad que tiene el centro para emitir un diagnostico precoz y certero
sobre mastología y relacionarlo con los diferentes parámetros que intervienen en el proceso de
obtención de dicho diagnostico.
2. Metodo y equipos
Se seleccionó un centro al azar que representara al acceso que tienen un determinada clase
social y se evaluaron cada uno de los parámetros cuya nomina se puede apreciar en la tabla de
resultados que se informa como N° 1.
Con la aceptación de las pacientes, el centro y el médico que diagnosticó originalmente los
estudios, se realizó la copia del diagnostico y de las placas y se hacen todos anónimos para
someterlos a la evaluación de un panel de expertos, reconocidos por la sociedad profesional,
que evalúa la calidad de la imagen ( Blanda / Normal / Quemada – Sobrexpuesta / Normal /
Subexpuesta ); la técnica utilizada para el posicionamiento y proceso de obtención de la
imagen ( Identificación – Artefactos – Sucia - Mal comprimida – Movida - Vista del músculo
pectoral – Pliegues - Nariz de camello - Pezón incluido – Axila – imagen cortada); el
Diagnóstico ( Coincidencia total / parcial / no hay coincidencia – informe inespecífico –
sugerencias explicitadas correctas / incorrecta ) y por último se considera la evaluación
general de la placa con su capacidad para emitir el diagnostico y si ha lugar, se explicite un
comentario general de la mismas.

IAEA-CN-85-144
155
Para la evaluación de los parámetros mecánicos, eléctricos y dosimétricos del centro se
aplicaron los criterios de la ACR (1) y de la legislación Argentina (2) además de las
recomendaciones que se explicitan en el material no impreso (3) y la tesina (4).
Los equipos y herramientas utilizadas fueron: Densitómetro Digital Tobias Associates Modelo
TBX, Sensitómetro Nuclear Ass., Precision Photometer Nuclear Ass., Thermometer Digital
RMI, HVL of Al and CU, Mamographic Resolution Estándar, Star X-Ray Test Patterns 0,50°
y 1°, Slit Cameras, Mamographic Step Wedge 18-239 Nuclear Ass., Control Tools Screen
Film, duplicator AGFA, mAmeter UNFOR y Dosimeter PTW DI4/DL4 con camera PTW
Modelo 3223, para baja energía.
3. Resultados
El equipo evaluado es un GE Senographic 600T- Senix HF, la maquina reveladora automática
es AGFA y se usa compartida con el servicio de Radiología general, las pantallas reforzadoras
y las películas usadas son KODAK. La carga de trabajo es de 200 estudios por mes.
Table 1. Los parámetros evaluados y su resultados se explicitan en la tabla N° 1
Tamaño de la mancha focal Nominal: 0,3 Medido:Ô 0,34 - 0,39 Tol = 0,45 Pass
kVp – Reproducibilidad R = 0 Tol = 2% Pass
kVp – Precisión P = 1,9% Tol = 4% Pass
Tiempo de exposición A 24 kVp, R = 0,7 Tol = 10% Pass
HVL A 24 kVp, <0,3 mm de Al Pass
Rendimiento a 24 kVp, 9,8 mR/mAs Tol = 8 Pass
Distancia foco imagen Nominal 65cm Medido 63 cm Ä1,8% Tol = 2% Pass
Fuga < de 1mGy a 1 m Pass
Campo de luz / de radiación 1,5 mm en la peor condición < ± 5 Pass
Dosis Kerma en aire 18,7 mGy
Dosis Glandular Media 3,12 mGy Tol=4mGy Pass
Revelado Temp.. y tiempo Revel 34,8ºC/Fija 34,1ºC Total 210s
Sensitometria v+b=0,19 IV=1,2 paso 15 IC=2,69-0,54=2,15 P 17- P 14
Cuarto oscuro Hermeticidad = Buena, Luz de seg.= no usa, Frecuencia de limpieza y cambio = 15 días
Negatoscopio, luminancia Centro 2012 nit Fail
Negatoscopio, homogenidad 31% Fail
Lectura Iluminación ambient 25 lux < 50 lux Pass
El médico informante es uno (1)( por lo que no se realizan la doble lectura del film) y su
especialidad es en mastología, no es radiólogo tiene entre 15 a 20 años de experiencia y ha
asistido a 37 cursos, conferencias, talleres y congresos en los últimos 5 años.
Las técnicas de mamografía son dos ambas con titulo terciario, especialización no
estructurada en mamografía y con asistencia a conferencias y congresos en los últimos 5 años.

IAEA-CN-85-144
156
Tabla 2. La evaluación de la calidad diagnóstica de la placa se usó dos grupos diferentes de
evaluadores, arrojando el resultado que se muestra
Nº IMAGEN TECNICA DIAG. EV. GRAL TOTAL OBSERVACIONES
1 2 3 4 5 1 2 3 4 5 1 2 3 4 5 1 2 3 4 5
1 X X X X 13 Sucio,Rayas,Falta pectoral,
Falla revelado
2 X X X X 13 Sucio,Rayas,Pezón incluido
3 X X X X 13 Sucio,Rayas
4 X X X X 13 Sucio,Rayas,Pliegues,
Pezón incluido,Artef Cal
5 X X X X 13 Sucio,Rayas,Imagen
cortada,Blanda, Artef Cal
6 X X X X 16 Sucio,Rayas,Quemada
7 X X X X 12 Sucio,Rayas,Pezón incluido,
Falta desc Cal vasc
8 X X X X 14 Sucio,Rayas, Falta pectoral,
Artef Cal
9 X X X X 11 Sucio,Rayas,Falta pectoral,
Artef,Diag Bien/Mal descri
10 X X X X 17 Sucio,Rayas,Pezón
incluido,Pliegues, Artef Cal
11 X X X X 13 Sucio,Rayas,Pezón
incluido,Pliegues
12 X X X X 14 Sucio,Rayas,Blanda,Imagen
cortada
13 X X X X 14 Sucio,Rayas,Blanda, Falta
compresión
14 X X X X 13 Sucio,Rayas,
15 X X X X 17 Sucio
16 X X X X 14 Sucio,Pliegues,
Pezón incluido
17 X X X X 14 Sucio,Rayas, Artef,
Imagen cortada
18 X X X X 16 Sucio,Blanda,Pezón inclui,
Artfac,Falta descr Cal benig
19 X X X X 13 Sucio,Pezón incluido,Artef
20 X X X X 13 Sucio,Pezón incluido,Artef
21 X X X X 14 Sucio,Rayas,Artef
22 X X X X 12 Sucio,Rayas,Pezón incluido,
Artef
23 X X X X 17 Pezón incluido
24 X X X X 11 Sucio, Imagen cortada
Diagnós observado
25 X X X X 10 Sucio,Pezón incluido,Artef,
Error Diagnóstico

IAEA-CN-85-144
157
El centro tiene servicio de mantenimiento interno de malas condiciones de prestación, no tiene
servicio de física médica y el oficial de protección radiológica es el medico con reciente
autorización individual para el manejo de equipos Rayos-X.
Para la evaluación de la calidad diagnóstica de la placa se usó dos grupos diferentes de
evaluadores, arrojando el resultado que se muestra en la tabla N° 2
En el 92% de las placas, la calidad diagnóstica fue evaluada como Regular o Buena, (58%
Regular y 42% Buena), solo dos estudios resultaron con una valoración por debajo de regular.
La evaluación total fue el 82,4% del valor máximo.
El diagnóstico fue coincidente en 24/25 de los casos, solo se observó en 1 caso que faltaba la
descripción de microcalcificaciones agrupadas, en 1 faltaba describir microcalcificaciones
vasculares, en 1 falta descripción de microcalcificaciones benignas y 2 se observaron por
informe escueto.
La imagen fue calificada con un promedio de 2,88/5, porque el 96% de las placas se encontró
que estaban sucias, en el 68% rayadas, en el 48% con artefactos que simulaban
microcalcificaciones y/o masa y 16% estaban blandas o quemadas. Se llegó a la conclusión
que existen severos inconvenientes antes y durante el procesado de la película.
La técnica se evaluó en promedio con 3,28/5, por el posicionamiento y la compresión de la
mama, (se encontró que en el 50% de los estudios tenían alguna placa con pezón incluido, en
el 16% de los estudios alguna placa con pliegues, en alguna placa del 10% no se tomaba el
pectoral y solo en el 16% de los estudios alguna placa estaba recortada y en 1 le faltaba
compresión.
La evaluación por item de las placas arrojó que la Imagen se valuaba con 2,88/5, La técnica
con 3,28/5, el diagnóstico con 4,12/5 y en Percepción general 3,25/5. Arrojando la Evaluación
general del Servicio 10,28/15.
4. Conclusiones
Los parámetros del equipo dan en todos los casos como cumpliendo con las tolerancias
establecidas, excepto los negastoscopios que dan francamente mal.
Se destaca primero la validez del método elegido ya que la Percepción de la calidad del
Servicio para emitir un diagnóstico certero (0,66), coincide con la valoración que se desprende
de cada uno de sus ítems (0,68).
La otra cosa importante es la relación encontrada entre la evaluación de los expertos y las
causas de esa valoración, así mencionamos cuatro:
1º) La falta de un revelador cautivo, la mezcla de marcas, así como el descuido en la limpieza
de los chasis, pantallas y películas traen como consecuencia la suciedad, rayas, artefactos,
placas blandas y duras, que encontraron los evaluadores y que hacen perder calidad
diagnóstica a la placa.
2º) Por otro lado la falta de posibilidad de contar con un chasis de mayor tamaño (24 x 30) y
las películas correspondientes (a pesar de contar la máquina con la platina compatible), traen

IAEA-CN-85-144
158
como consecuencia directa las Imágenes cortadas en las placas de mamas grandes y concurren
con otras causas que también influencian, a encontrar pliegues, pezón incluido y falta del
músculo pectoral.
3º) La alta carga de trabajo, junto con la expertice de las dos técnicas radiólogas y los detalles
enunciados en el ítems anterior tienen que ver con la la falta de compresión y problemas de
posicionamiento como pezón incluido y pliegues.
4º) Las imágenes sucias y rayadas sumada a los artefactos y a la muy mala calidad de los
negatoscopios, agravado por la imposibilidad de doble lectura, son la consecuencia de los
inconvenientes detectados en el diagnóstico.
Bibliografía
[1] Mammography, Quality Control Manual. ACR. 1999.
[2] Resolución Nº 045/91 del Ministerio de Salud y Medio Ambiente de la Provincia de
Santa Fe-Argentina. 1991.
[3] Delineamientos Básicos en el Control de Calidad en Mamografía. Ministerio de Salud y
Acción Social de la Nación. Argentina. 1999.
[4] Protocolo de Control de los parámetros técnicos del Sistema de Imágenes
Mamográficas. A. Krivoy y E. Carli. Facultad de Ingeniería. UNER. 2000

IAEA-CN-85-166
159
BENEFIT AND RISK IN BREAST SCREENING
J. Law
Edinburgh University Department of Medical Physics, Western General Hospital, Edinburgh,
United Kingdom
K. Faulkner , F. Neilson
Quality Assurance Reference Centre, Newcastle General Hospital, New Castle,
United Kingdom
Abstract
Justification of breast screening in radiation protection terms both for the screened population and on an
individual basis is necessary. In this paper the number of cancers detected, and the number of cancers potentially
induced by radiation, in the UK National Health Service Breast Screening Programme (NHS BSP) are compared.
Detection rates reported up to 1998 are used, with x-ray doses for 1997 and 1998 and breast cancer induction risk
factors, stratified by age, recommended by the National Radiological Protection Board in 1994. Cancers detected
exceed those potentially induced at all ages from 50 – 64. The relationship between these cancer numbers and the
associated benefit and risk, in terms of breast cancer deaths avoided and induced, is then investigated. Improved
values of the Nottingham Prognostic Indicator (NPI) attributed to screening provide one means of doing this.
Using this strict criterion the breast-screening programme is also justified in radiation protection terms.
1. Introduction
It is widely considered that breast cancer can be induced by high doses of ionising radiation,
such as X rays. The probability or risk of induction is believed to be dependent on dose. The
time lapse between exposure to ionising radiation and development of breast cancer is
generally agreed to be at least 10 years for women in the screening age group. Breast cancer
induction decreases with increasing age at exposure [1]. In a breast-screening programme, the
benefits achieved in the form of lives saved or prolonged should clearly exceed the risks
arising from any breast cancers that may be induced from the associated radiation exposure.
In this context both benefit and risk can only be estimated statistically, so that it is the
probability of each which must be compared. Many attempts to consider the balance between
radiation risk and benefit have been published. Most have considered only the numbers of
cancers detected and induced, both of which can be estimated with relative confidence (e.g.
[2]). Assessing benefit from treatment outcome is a much harder task. Treatment outcome is
statistically more difficult to predict, especially in breast cancer, for which 5-year survival is a
less reliable indication of “cure” or final outcome than in many other cancers [3].
This paper will consider the latest cancer detection rates and dose estimates, and hence the
relative numbers of cancers detected and induced. It will then use treatment outcome data in
an attempt to relate those numbers to the balance of benefits and risks.
2. Breast doses in the NHS BSP
The mean dose to breast glandular tissue (MGD) is generally considered to be the dose
quantity most relevant to the risk of radiation induction of breast cancer. Average values of
MGD for the NHS BSP have recently been reported by Young and Burch [4], who have found
mean dose levels per film of 2.03 � 0.02 mGy for lateral oblique views and 1.65 � 0.02 mGy
for craniocaudal (CC) views. The mean dose per woman is slightly higher because a small
minority of women have more than one film per view, especially where the larger film size of
24 x 30cm is not available. The corresponding mean doses per woman for single view and
two-view screening are 2.14 � 0.04 and 3.65 � 0.07 mGy respectively.

IAEA-CN-85-166
160
Current routine practice in the NHS BSP is to perform two view screening on the first round
(ages 50 – 52) and single view screening on subsequent rounds. In the calculations that
follow later in this paper, the dose levels for both single and two-view screening will be used
for the 50 – 64 year age band.
The highest doses are likely to be received by women with the thickest breasts (around 10cm).
These women also require more than one film per view, possibly up to four such films.
However, the number of women in this subgroup is extremely small and difficult to predict.
Young and Burch [4] report that for oblique films only, one film per thousand exceeded
8.6mGy, and they describe this as the maximum dose per film that may normally be expected.
The corresponding dose level for CC films was 7.1mGy, giving a combined normal maximum
dose for two-view screening of 15.7mGy at one film per view. Even for the 0.1% of the
screened population receiving the highest doses (mainly those having the thickest breasts), the
dose should not exceed 20 mGy.
3. Radiation risk factors for breast cancer induction
The risk of radiation induction of breast cancer decreases with increasing age of the woman at
time of exposure (e.g. [1]). Numerical values for the magnitude of this risk factor are based
on work by the National Radiological Protection Board (NRPB), with further subdivision
from 10 to 5 year age bands following discussion with NRPB [2]. Although this data is 5
years old, these estimates of the risk factors are considered to remain the best available for the
UK population. They refer to all breast cancers in a female population, not fatal cancers in a
mixed population as in some earlier studies, and are given in Table I.
Table I. Radiation Risk Factors For Breast Cancer Induction – UK Female Population
Age Band Breast Cancers Induced per Million women
per mGy
50-54 13.2
55-59 11.5
60-64 9.4
Screening detection rates in the NHS BSP are reported at annual intervals. Those for the last
four years for which figures are available are given in Table II and refer to England rather than
the UK [5].
Table II. Cancer Detection Rates in the English Breast Screening Programme (/1,000) [5]
Age Band 1994-95 1995-96 1996-97 1997-98 Mean
50-54 4.3 4.6 5.0 5.4 4.8
55-59 4.7 4.7 5.0 5.3 4.9
60-64 6.3 5.9 6.0 6.0 6.1
Mean 50-64 5.1 5.1 5.3 5.6 5.3
4. Cancers detected and cancers induced
Table III gives the ratios of cancers detected/induced, using the data from Table II, for three 5-
year age bands of the NHS BSP, and for the various dose levels discussed earlier. These

IAEA-CN-85-166
161
ratios are all in double figures, i.e. the cancers detected exceed the numbers induced even for
almost all the women in the highest dose subgroup.
Table III. Ratio of Cancers Detected to Cancers Induced at Various Dose Levels
Age Band Radiation Dose Levels (mGy)
2.14 3.65 11 20
50-54 170 100 33 18
55-59 199 117 39 21
60-64 303 178 59 32
5. Breast cancer treatment outcomes
In many types of cancer, 5-year survival is used as an indicator of outcome because, beyond
this interval after initial treatment, life expectancy is restored to that of a normal population of
the same age. With breast cancer, however, long-term recurrence is such that this position
may not be achieved until 20 years after treatment or even longer.
To relate cancer detection and induction to benefit and risk, it is necessary to consider
outcomes both with and without screening. Thus the benefit of screening is not the proportion
of those with screen detected cancers who survive a given period, but the difference between
that proportion and the corresponding proportion who would have been predicted to survive if
they had been in a comparable unscreened population.
Thus one possible measurement of Benefit/Risk may be taken to be:
Benefit/Risk = Detections x (A –B)
Inductions x M
Where: A = % survival of screen detected cases, B = % survival of symptomatically detected
cases and M = % mortality of symptomatically detected cases. M is defined here in terms of
symptomatic detection because it must be assumed at present that the majority of induced
cancers will appear in women over the age of 64 who do not refer themselves for screening. If
screening of older age groups in future years could be assumed, the mortality of screen-
detected cancers would replace that for cancers detected symptomatically.
5.1. Nottingham prognostic indicator (NPI)
Of the various sources of data to be considered, that based on the NPI appears to be the most
firmly based, and the easiest to interpret and apply. The NPI is calculated as (0.2 x size in cm)
+ Stage + Grade. The lower the NPI, the better the prognosis. It was first derived empirically
from observation and case records, and subsequently verified in a study of 1662 further cases.
The introduction of breast screening leads to the detection of smaller cancers which have a
lower NPI value and hence a better chance of long-term survival. Table IV summarises the
15-year survival for different groups of women. The proportion of women presenting in each
group before screening is taken from a symptomatic clinic, where as the screening data is
based upon a large-scale survey of screen-detected cancers in the Northern and Yorkshire
Region of England. (The 15-year survival of an age-matched population of women without
breast cancer was 83%.)

IAEA-CN-85-166
162
Table IV. Nottingham Prognostic Indicator Data
NPI 15-Year Survival (%) Proportion of Women Presenting
Actual Age Corrected Before Screening After Screening
<3.4 80 96 29 76
3.4-5.4 42 51 54 20
>5.4 13 16 17 4
5.2. Benefit/risk ratio
The benefit risk ratio may be calculated using the above equation. Table V is a summary of
the ratio of lives saved to the possible fatal cancers induced.
Table V. Benefit/Risk Ratio (Lives Saved/Possible Fatal Cancers Induced)
Age Band Single View Two Views Highest Dose
50-54 105 62 11
55-59 123 73 13
60-64 188 110 20
6. Discussion
Justification is a fundamental concept in radiation protection legislation and in radiology. A
practice is justified when it is beneficial and the benefit can be shown to exceed the associated
radiation risk. Justification for a medical radiation procedure can properly be considered in
terms of the average dose to all patients, without the need to allow for higher doses that may
be received by sub-groups. Nevertheless it would provide added reassurance if it could be
shown that benefit exceeded risk for all sub-groups or even for all individuals in a screening
programme
In attempting to convert from detection/induction to benefit/risk, data from a variety of
sources may be used. Of these data sources, those based upon the NPI may be the best for
this purpose. The NPI is derived from parameters that are relatively easy to determine, and
its relationship to survival has been established. Survival at 15 years is a much better basis
than the 5 years survival widely used for other cancers.
7. Conclusions
For the NHS BSP as it is at present, there appears to be an ample margin of benefit over risk.
This statement applies on the basis of the average MGD per woman, i.e. on a population dose
basis. Radiological Justification can properly be based on this. At a dose level exceeded by
only 0.1% of women screened this remains true. Newer designs of X-ray equipment should
lead to further improvements in this position.
Thus, despite all the uncertainties and shortcomings of present information, it does appear
that in the NHS BSP radiation hazards if they exist are quite small compared to the benefits.
In these terms, the NHS BSP achieves radiological justification. Nevertheless, it remains
essential that radiographic image quality, with its implications for cancer detection rates, and
radiation dose levels continue to be closely monitored in the NHS BSP and in other breast
screening programmes.

IAEA-CN-85-166
163
References
[1] STOKELL PJ, ROBB JD. SPIDER-I Software for evaluating the detriment associated
with radiation exposure, NRPB-SR261. Chilton: NRPB, 1994.
[2] LAW J. Risk and benefit associated with radiation dose in breast screening programmes.
Br J Radiol. 1995; 68: 870-6.
[3] YOUNG KC, BURCH A. Radiation doses received in the UK BSP in 1997 and 1998.
Br J Radiol. (in press).
[4] NATIONAL HEALTH SERVICE BREAST SCREENING PROGRAMME REVIEWS,
1994-5 to 1997-8 inclusive. Statistical Bulletin, Department of Health, London.
[5] KERR GR, KUNKLER IH, LANGLANDS AO, RODGER A. (In)curability of breast
cancer: a 30-year report of a series of 3933 cases. The Breast 1998, 7:90-94.

IAEA-CN-85-235
164
QUALITY ASSURANCE PROGRAMME IN MAMMOGRAPHY OF THE SOCIEDAD ESPAÑOLA DE DIAGNÓSTICOS POR IMAGEN DE LA MAMA (SEDIM) B. Fernández, C. González, I. Hernando, M. Iríbar, J.A. López, R. Salvador, A. Vega, I. Vizcaino Sociedad Española de Diagnósticos por Imagen de la Mama (SEDIM), Madrid, Spain
Abstract
The European Union Council Directive 97/43/Euratom of 30 June 1997 on health protection of individuals
against the dangers of ionizing radiation in relation to medical exposure has been partially transposed to the
Spanish national law by the Real Decreto 1976/1999, which establishes the quality criteria in Diagnostic
Radiology. A key instrument in this legal regulation is the so-called Quality Assurance Program (QAP) which has
to be implemented in each Diagnostic Radiology unit.
The Spanish Breast Imaging Diagnostic Society (Sociedad Española de Diagnóstico por Imagen de la Mama,
SEDIM) has proposed a reference QAP to be used as a guide in all the mammography units in the country. Its
main issues are displayed in the present paper. The SEDIM QAP includes some items related to justification and
optimization of mammography exams as well as a proposal for the assignment of functions and responsibilities.
A guide for the image and technical parameters quality evaluation is also included. Some keys on equipment
acquisition, maintenance and on continuing education and information management can also be found in that
document.
1. Introduction
El 29 de Diciembre de 1.999 se publicó en España el Real Decreto 1976/1999 [1], por el que se establecen los criterios de calidad en radiodiagnóstico. Dicho Real Decreto, que tiene carácter de norma básica sanitaria, persigue, entre otros fines, incorporar a la legislación española los preceptos de la Directiva 97/43/EURATOM [2] en lo que al diagnóstico médico con rayos X se refiere. Para ello, y como instrumento clave, exige la confección e implantación de un Programa de Garantía de Calidad (PCG) en todas las unidades asistenciales de radiodiagnóstico. Por un lado, la norma legal citada presta atención particular y establece requisitos especiales para las instalaciones y los equipos de mamografía. Por otro, puntualiza que el PGC ha de elaborarse de acuerdo con protocolos nacionales o internacionales. Por estas razones, la Sociedad Española de Diagnóstico por Imagen de la Mama (SEDIM) decidió preparar un documento [3] que contuviera las bases para la elaboración, con arreglo a criterios unificados, de los programas de garantía de calidad en mamografía. El documento, del que se hace una breve presentación en este trabajo, pretende facilitar a profesionales y titulares de unidades de diagnóstico mamográfico la confección de sus propios programas. El Programa de Garantía de Calidad de la SEDIM es el punto de partida de una serie de iniciativas y recomendaciones que esta Sociedad tiene intención de acometer para contribuir a optimizar adecuadamente la práctica del diagnóstico por imagen de la mama en España, de una forma similar a la que ya existe en otros países tanto de Europa como de América. 2. Contenido del programa de garantia de calidad El Programa de Garantía de Calidad de la SEDIM contempla un conjunto de aspectos que pretenden cubrir todos los requisitos de la normativa española antes citada, a la vez que

IAEA-CN-85-235
165
resulten de aplicación práctica y directa en las instalaciones concretas. El índice del documento, es el siguiente:
�� Datos identificativos de la unidad asistencial �� Justificación: Indicaciones, protocolos y requisitos técnicos de los estudios
mamográficos
�� Descripción y ubicación de los recursos técnicos y clínicos �� Descripción de los recursos humanos: Cualificación profesional. Distribución de
responsabilidades y funciones �� Catálogo y protocolos de estudios mamográficos �� Evaluación de la calidad �� Adquisición de equipamiento �� Control del mantenimiento de los equipos �� Plan de formación continuada del personal. �� Metodología de los informes radiológicos y custodia de la Información �� Registro de incidentes y accidentes.
El documento se completa con dos anexos:
��Anexo I Protocolo de control de calidad de parámetros técnicos ��Anexo II. Protocolo de control de calidad para el screening.
2.1 Desarrollo de los criterios de protección radiológica. Justificación y optimización.
Indicación de las exploraciones
El Programa de Garantía de Calidad de la SEDIM desarrolla los criterios básicos de justificación y optimización. La justificación de un estudio radiológico está esencialmente asociada a la existencia de una indicación clínica correctamente establecida. Por ello, el PGC da una relación de los casos en que, en el estado actual de los conocimientos, está indicada, y por tanto justificada, la exploración mamográfica. Se transcriben a continuación:
��Mamografía en mujer asintomática (chequeo/”screening”): - Mujeres a partir de los 40 años (inclusive) hasta los 75 años, con periodicidad
anual. - Mujeres con antecedentes familiares directos de carcinoma de mama: madre,
hermana o hija, a partir de los 35 años (inclusive), con periodicidad anual. - Mujeres con factores considerados de riesgo para cáncer de mama. - Mujeres sometidas a tratamiento hormonal sustitutorio, de cualquier edad. - Mujeres candidatas a transplante de algún órgano. - Mujeres que van a someterse a mamoplastia de reducción o aumento.
��Mamografía en mujer sintomática (“diagnóstica”):
- Pacientes a partir de los 30 años (inclusive) con sintomatología mamaria no
aclarada con la valoración clínica. - Pacientes menores de 30 años, con sintomatología mamaria no aclarada con la
valoración clínica y ecográfica (mamografía del lado afecto).

IAEA-CN-85-235
166
- Pacientes de cualquier edad, a las que se ha diagnosticado un cáncer mamario por otros métodos diagnósticos, y no dispongan de Mamografía, como estudio basal de referencia.
- Pacientes de cualquier edad, con enfermedad metastásica demostrada, sin tumor primario conocido.
- Pacientes con antecedentes personales de cáncer mamario, con periodicidad anual.
��Mamografía en varones sintomáticos
��Controles mamográficos "cortos"
- Cuadros probablemente inflamatorios/infecciosos, o postraumáticos, con traducción exclusivamente mamográfica, para evaluar curso, tras oportuno tratamiento.
- Imágenes múltiples, probablemente benignas (BIRADS-3), con traducción exclusivamente mamográfica.
- Imagen probablemente benigna (BIRADS-3), cuyas características (tipo, ubicación y tamaño) y/o no disponibilidad de medios impiden aplicar estudios complementarios.
��Magnificación / Compresión localizada.
- Imágenes mamográficas de existencia dudosa, para confirmar o descartar su
presencia. - Imágenes mamográficas de presencia real, para una mejor evaluación de su
semiología.
��Otras proyecciones mamográficas complementarias.
- Visualización y localización de lesiones no aclaradas en proyecciones estándar
��Neumoquistografía:
- Por motivos diagnósticos, ante formaciones quísticas con criterios ecográficos de dudosa “habitación” o sin claros criterios semiológicos de quiste simple.
- Por motivos terapéuticos, ante formaciones quísticas simples que causen síntomas o angustia a la paciente.
��Galactografía:
- Secreción mamaria uniorificial espontánea.
�� Punción percutánea bajo control estereotáxico:
- Lesiones no palpables, o palpables sin adecuada precisión, sólo visibles en
mamografía. Se preferirá la monitorización ecográfica cuando sea posible.

IAEA-CN-85-235
167
��Marcaje prequirúrgico de lesión no palpable mediante métodos mamográficos:
- Lesiones no palpables, o palpables sin adecuada precisión, sólo visibles en mamografía.
En cuanto al criterio de optimización, se entiende centrado en el objetivo de una calidad de imagen idónea obtenida con la menor dosis compatible. La consecución de ese objetivo está relacionada con las características del equipo disponible y con el uso que de él se hace. Se establecen en el PGC pautas para las características técnicas exigibles en el equipamiento (mamógrafos y sistema de imagen), y también, en otro capítulo, se indican los controles de calidad periódicos a los que debe someterse. Pero igualmente se presta atención a los requisitos a considerar en la realización de mamografías. Se incluyen recomendaciones concretas en lo relativo a posición, compresión, contraste, exposición, ruido, definición de imagen, artefactos, colimación y marcado de películas, que se relacionan en cada caso con sus efectos sobre las características de la imagen. Se discuten en el mismo apartado los requisitos, las posibilidades y las limitaciones de las más importantes proyecciones mamográficas. 2.2. Descripción de los recursos técnicos y humanos El PGC de la Sociedad Española de Diagnóstico por Imagen de la Mama propone unos formularios para el registro de las características técnicas del equipamiento, básicos para un adecuado control de calidad posterior. Además presenta un modelo de distribución de responsabilidades y funciones entre los diferentes profesionales que trabajan en una unidad asistencial. En esa asignación de funciones y responsabilidades se atiende de manera muy particular a aquellos aspectos que tienen que ver con el control y con la garantía de calidad. 2.3. Evaluación de la calidad La evaluación de la calidad se articula en dos apartados:
��Determinación del estado de referencia inicial ��Verificación periódica y evaluación continua de sistemas y componentes
El PGC da una relación de los parámetros que deben incluirse en los controles de calidad, tanto para los sistemas de registro y visualización de imágenes como para el mamógrafo. La periodicidad recomendada para estos controles varía en función del tipo de control y también en función de que la unidad se destine a mamografía diagnóstica o de cribado (screening). En cualquier caso, se entiende obligado un control de todos los parámetros y dispositivos en el momento de la instalación del equipo, con carácter previo a su puesta en funcionamiento, que sirva de referencia para sucesivos controles. En sendos anexos, se recogen formularios y tablas para la toma de datos en las operaciones de control de calidad típicas. Cubren diversos aspectos, desde la identificación y descripción de los componentes y de la propia sala de exploración, hasta la verificación de los parámetros técnicos fundamentales: indicadores de funcionamiento, características del haz de radiación, características del compresor, respuesta del sistema de exposimetría automática, estado de chasis y pantallas, calidad objetiva sobre maniquí de la imagen, etc.
IAEA-CN-85-235
168
En cuanto a la evaluación de dosis, se recomienda realizar estimaciones tanto de la dosis de entrada como de la dosis glandular promedio. En cuanto a la calidad de imagen, se recomienda valorarla sobre imágenes reales tanto como sobre objetos de test. 3. Adquisición de equipo. Mantenimiento Dentro del programa de calidad se reconoce que toda instalación, modificación o ampliación que suponga la adquisición de equipo ha de efectuarse conforme a especificaciones en cuya elaboración intervendrán el radiólogo y el radiofísico responsables. Se indican los elementos mínimos de dichas especificaciones. Además, de acuerdo con lo establecido en la normativa española, se indica que la instalación de un nuevo equipo llevará aparejada una prueba de aceptación, previa al uso clínico, realizada por el suministrador en presencia de un representante del titular. Se recomienda que este representante sea, siempre que resulte posible, un especialista en radiofísica hospitalaria. 4. Otros aspectos El PGC propuesto se completa con otros aspectos como los relativos a la formación continuada del personal, para la que se sugieren pautas iniciales así como periodicidades y contenidos concretos. Un sistema de acreditación a desarrollar por la propia SEDIM completa el cuadro de recomendaciones. En el texto se ofrece también una relación de criterios para la elaboración y custodia de los informes radiológicos, así como para la identificación y registro de posibles accidentes o incidentes. Referencias
[1] REAL DECRETO 1976/1999, de 23 de diciembre, por el que se establecen los criterios
de calidad en radiodiagnóstico. B.O.E. núm. 311, 29.12.1999. [2] EUROPEAN COMMISSION. COUNCIL DIRECTIVE 97/43/EURATOM of 30 June
1997 on health protection of individuals against the dangers of ionizing radiation in relation to medical exposure. Official Journal of the European Communities, L180:22-27; 9.7.97.
[3] SOCIEDAD ESPAÑOLA DE DIAGNÓSTICO POR IMAGEN DE LA MAMA (SEDIM), Programa de Garantía de Calidad en Mamografía, Doyma, S.L., Madrid (2000) 48 págs.
IAEA-CN-85-108
169
IMAGE QUALITY AND PATIENT DOSE OPTIMIZATION IN MAMMOGRAPHY
IN HUNGARY
S. Pellet1, A. Motoc
1, F. Giczi
2, E. Vano
3, C. Maccia
4, M. Gödény
5, B. Kovács
6,
G. Forray7
1National Research Institute for Radiobiology and Radiohygiene, Budapest, Hungary
2County Institute of National Public Health and Medical Officer Service, Gyõr, Hungary
3Universidad Complutense de Madrid, Madrid, Spain
4C.A.A.T.S., Bourg-La-Reine, France
5National Institute for Oncology, Budapest, Hungary
6County Hospital of Vas, Szombathely, Hungary
7“Haynal Imre” Medical University, Budapest, Hungary
Abstract
In 1999 the International Atomic Energy Agency initiated a coordinated research program (CRP) of the aims to
define a methodology for the implementation of the European QA/QC protocol for mammography in the Eastern
European countries. In Hungary three mammography centers with dedicated mammography devices and film-
screen systems have been selected for participation in the program. The outcome of mammography can be
predicted by image quality evaluation on clinical and test phantom images and the patient doses. The
improvement of these performance indicators after QA/QC program implementation should be an outcome of the
project. The authors summarize the program of work, the activities and their preliminary results.
1. Introduction
It is scientifically justified that acceptable performance of mammography can only be
achievable through rigorous and consistent Quality Assurance and Quality Control activity.
QC helps us to ascertain a constant high quality level of mammography equipment’s and
auxiliary devices’ performance. In 1999 the International Atomic Energy Agency initiated a
coordinated research program (CRP) of the aims to define a methodology for the
implementation of the European QA/QC protocol for mammography in the Eastern European
countries.
Experience shows that the outcome of mammography can be predicted by image quality
evaluation on clinical and test phantom images and the patient doses. The improvement of
these performance indicators after QA/QC program implementation should be an outcome of
the project.
2. Preconditions
A research group for participation in the CRP has been organized. The chief scientific
investigator has been a health physicist and the co-investigator has been a radiologist, an
expert of mammography. The coordinator of the National Patient Dose Evaluation Program
(NPDEP) and 3 competent radiologists of participating mammography centers have also
become the members of the research group.
Three mammography centers with dedicated mammography devices and film-screen systems
have been selected for participation in the program. The mammography centers of National
Institute for Oncology, Budapest (OOI) and the "Haynal Imre" Medical University, Budapest
(HIE) are only involved in diagnostic mammography, but the mammography center of the
County Hospital of Vas, Szombathely (VAS) is also involved in mammography screening.

IAEA-CN-85-108
170
The most important dosimetry and QC devices were available, but the PMMA plates, the
image phantom for constancy tests and the film-screen contact test tool were required from the
Agency.
3. Program of work
A Research Coordination Meeting was organized in Prague, 3-6 November, 1999, when
details of work plan and timetable were discussed and accepted:
�� Evaluation of the image quality of a set of 120 clinical images using the European image
quality criteria [1],
�� Evaluation of the image quality using mammography test phantom images,
�� Film reject analysis using a sample of a minimum 1000 images per mammography
centers,
�� Intercomparison of TLD systems,
�� Assessment of first set of patient entrance doses and glandular doses with their respective
radiographic techniques, breast thickness and comparison with reference/guidance levels,
�� Implementation of QC program to the mammography units, processors and viewing
boxes,
�� Corrective actions if necessary,
�� Repetition of the above activities (evaluation of image quality and patient doses, QC
program).
4. Activities and results
Total of 120 clinical images (10 patients per center, 4 images per patient) have been evaluated
by the field radiologists according to the EC criteria using the forms supplied. The clinical
images and the evaluations were sent to Spain and France for independent assessment. All the
films were accepted by the field radiologists for diagnostic purposes. However only 63% of
images were considered by the French specialist who evaluated the films as accepted.
The image qualities in the mammography centers were evaluated using the RMI 156
mammography accreditation phantom according to the phantom instructions. The phantom
images and the evaluations were also sent to Spain for independent assessment. The results of
the parallel assessments are correlate and each of our mammography systems could fulfill the
accreditation level of the American Mammography Accreditation Program.
For film reject analysis for at minimum 1000 films the rejected films were collected. The
rejecter (radiologist or radiographer) and cause of rejection were registered. The results have
been analyzed and the rejected films were sent to the Agency. Reject rates by causes of
rejection can be seen in Table 1.
Table 1. Reject Rates by Causes of Rejection
Causes Reject Rate (%)
VAS OOI HIE
Too light 34,5 13,9 21,0
Too dark 20,4 2,3 11,9
Positioning 32,1 61,9 14,0
Motion 3,8 2,4 1,4
Technical 9,8 12,5 37,6

IAEA-CN-85-108
171
In cooperation with the Dosimetry and Medical Radiation Physics Section of NAHU, IAEA
we participated in an intercomparison of the TL systems. The “European Protocol for
Dosimetry in Mammography” requires that the accuracy and precision of the dosimetric
results are both to be better than � 10 % [2]. Our results were outside of these limits (up to
17%) for all 3 beam qualities.
Patient dose measurements were made with TLDs on 10 patients per mammography center for
CC projections. The results of dose measurements were sent to the Agency. The mean ESD
were 2.73, 14.3 and 15.8 mGy, respectively.
Overall QC measurement were performed based on the European Protocol for the Quality
Control of the Physical and Technical Aspects of Mammography Screening [3]. Summary of
the QC activity is presented in Table 2.
Table 2. Summary of the QC Measurements of the Physical and Technical Aspects of
Mammography
Mammography center VAS OOI HIE
X-RAY SOURCE
Focal spot size: star pattern method X A X
Source-to-image distance A A A
Alignment of field/image rec. (chest wall side) A X N
Alignment of field/image rec. (short edges) A X A
Radiation leakage X X X
Specific tube output at 1 m D D D
Tube output rate at FFD D D D
TUBE VOLTAGE
Reproducibility A A A
Accuracy N N N
Half Value Layer A A A
AEC-SYSTEM
Optical density control setting: central value A N A
Optical density control setting: range A A A
Opt. dens. control setting: difference per step A A N
Guard timer X X X
Short term reproducibility A A D
Long term reproducibility N N N
Object thickness compensation N N N
Tube voltage compensation D A N
COMPRESSION
Compression force A A A
Compression plate alignment X N A
BUCKY
Grid system factor A A A
Grid imaging A A A
SCREEN-FILM
Inter cassette sensitivity: mAs variation A N N
Inter cassette sensitivity OD variation D A N
Screen-film contact N A A

IAEA-CN-85-108
172
FILM PROCESSING
Temperature N/A N/A N/A
Processing time N/A N/A N/A
FILM AND PROCESSOR
Sensitometry N N N
Artefacts A A N
DARKROOM
Light leakage N A A
Safelights N N N
Film hopper X X X
Cassettes A A A
VIEWING BOX
Luminance A A A
Homogeneity A A A
AMBIENT LIGHT LEVEL A N A
SYSTEM PROPERTIES
Entrance surface air kerma A A
Image Quality A N N
X: The parameter is not measured
A: The measured value is better than the acceptable level
D: The measured value is better than the desirable value
N: The measured value is not acceptable
N/A: The parameter is measured but there is no limiting value
5. Conclusions
The Directive 97/43 EURATOM of European Council regulates the health protection of
individuals against the dangers of ionizing radiation in relation to medical examination or
treatment. According to the Directive all doses due to medical exposure for radiological
purposes shall be kept as low as reasonably achievable consistent with obtaining the required
diagnostic information. This optimization process shall include the consistent production of
adequate diagnostic information as well as the QA/QC activity.
In Hungary about 70 mammography equipment are in operation and 12 mammography centers
are involved in mammography screening. A significant factor is that there are no any
compulsory regulations for the quality assurance activity currently in place in Hungary to
ensure optimal exposures and film processing. However, meeting the requirements of
harmonization of legislation derived from our partnership with the EU, we also have to
complete the regulations of the medical exposures. The present coordinated research program
is an outstandingly valuable help of the International Atomic Energy Agency in this process.
References
[1] J.-W. Oestmann; European Guidelines on Quality Criteria: Current Status and Future,
with Special Emphasis on Mammography Radiation Protection Dosimetry, Vol 90, Nos
1-2, pp. 35-38 (2000).

IAEA-CN-85-108
173
[2] European Protocol on Dosimetry in Mammography. CEC Report EUR 16263 EN
(1996).
[3] CEC European Guidelines for Quality Assurance in Mammography Screening. 2nd
edn,
CE-96-96-659-EN-C, (Luxembourg: EC Publications) Luxembourg (1996).

IAEA-CN-85-305
174
A REVIEW OF THE ROLE OF RADIATION METROLOGY IN THE SAFETY OF
DIAGNOSTIC RADIOLOGY PATIENTS
J.G.P. Peixoto1, C.E. de Almeida
2,
1Instituto de Radioprotecao e Dosimetria – IRD/CNEN, Rio de Janeiro, RJ, Brasil
2Laboratorio de Ciencias Radiologicas – LCR/UERJ, Rio de Janeiro, RJ, Brasil
Abstract
A discussion is conducted on the parameters associated with the radiation metrology in the mammography range
and the uncertainties involved in all steps of the calibration chain as contained in the ISO recommendations. It is
recognized by the international guidelines that there is a need to offer calibration for the mammography beam
qualities by the radiation metrology network in order to improve the quality of the clinical diagnostic procedures
and enhance the safety aspects of the medical practice. Major efforts have been made by several laboratories to
establish appropriate and traceable calibration infra-structure to provide the basis for a quality control program in
mammography in order to reduce the unnecessary patient exposure.
1. Introduction
During the past few decades significant technological advances has been observed concerning
the equipment specifications used for mammography. Nowadays, there is wide variety of
choices of anode, filter materials and potential voltage applied as produced by the most
modern high frequency generators. As result of the technical developments on the equipment
as well as on the film-screen characteristics, the breast doses are now much lower than the
ones delivered by the first mammography units.
The range of tube voltages used in clinical mammography x-ray varies from 22 to 50 kV
depending on anode-filter materials. According to the National Council on Radiation
Protection and Measurement – NCRP [1] the combination of a Mo anode and filter is stated as
the best technical option for clinical purpose. These combination of filtration and anode has
been the one selected for the European intercomparison of diagnostic dosimeters [2]. Peixoto
and de Almeida describes in details the implementation using different anode such tungsten -
W, Molybdenum - Mo, and rhodium – Rh and its filtration combination with Mo and Rh [3].
2. The main physical factors and its associated uncertainties in performing
mammography calibrations
The Secondary Standard Dosimetry Laboratories– SSDL main responsibility is to establish the
metrological link between the Primary Standard Dosimetry Laboratory – PSDL and the
hospital users as well as to provide calibration data and technical advice to guaranty the basis
for a quality control program for clinical mammography units.
The evaluation of the experimental uncertainties is indeed an important step to define the
limitations and applicability of a particular method and its assessment should follow the
recommendations given by ISO [4], where the uncertainties are expressed as relative standard
uncertainties whose evaluation are classified as type A and type B. The method of evaluation
of type A standard uncertainty is by statistical analysis of a series of observations, whereas the
method for evaluation of type B standard uncertainty is based on means other than statistical
analysis. The classification rests exclusively on the procedure used to evaluate the uncertainty,
and does not relate to the origin of the uncertainty. Type A and type B uncertainties may be
combined in quadrature to yield the combined standard uncertainty, uc, and an expanded
IAEA-CN-85-305
175
uncertainty (previously called overall uncertainty) can be built by multiplying uc by a factor,
which must always be stated. This factor is chosen on the basis of the desired level of
confidence to be associate with the uncertainty.
The associated type B uncertainty used in this work and given below, consider a as the half-
width of the extreme values interval:
3auB� , Assuming a uniform rectangular distribution (1)
u aB� 6 , Assuming a uniform triangular distribution (2)
2.1. Main Factors Influencing the Ionometric Standards
2.1.1. Current measurements
The estimated standard uncertainty associated with the ionization current measurements or
scale reading may be divided in two situations. Firstly, when the calibration of an ionization
chamber is performed with the associated electrometer, the type A uncertainty on the scale
reading is estimated from the measurements with the system (chamber plus electrometer),
whose values are typically about 0.3 %.The type B uncertainty is included in the calibration
factor provided by the standard laboratory [5]. Secondly, when the calibration of an
ionization chamber is done alone in other words, separately from the electrometer (in terms of
mGy/nC). In this case, the current I is integrated by an external capacitor until a specified
voltage V is reached, for a specified time interval t being determined according to the basic
relation I=C V/t. The typical values for the standard uncertainties for voltage are 0.01 % and
0.02 %, and for capacitance 0.04 % type A and type B respectively, and for the time base is of
the order of 0.01 % for type B.
2.1.2. Recombination Loss
The absorbed dose deposited in the chamber gas volume as result of the ionization produced is
proportional to the charge Q produced. The collected charge Q’ trough may be less than Q,
because of ion recombination in the gas. An ion chamber is said to be completely saturated
when the ionic recombination is minimum [6].
Assuming a uniform rectangular distribution for the extreme values in the applied potential
range between –100 and –300 V, the typical values for the uncertainty due to the ion
recombination loss is 0.08 %.
2.1.3. Current Leakage
The leakage current measurement in the absence of radiation is obtained during a set of
measurement, for a secondary standard class instrument. The estimated uncertainty for current
leakage has to be negligible otherwise it will require a correction [6].
2.1.4. Energy dependence
Assuming a uniform triangular distribution for the extreme values of the PTB calibrations
factors for non-attenuated and attenuated qualities, combined standard uncertainty in the
energy dependence is 0.03 %.
2.1.5. Long term stability of the secondary standard
The reproducibility of a set of measurements is defined as the agreement between the results
of measurements of the one parameter carried out under somewhat different conditions [4].

IAEA-CN-85-305
176
The coefficient of exposure reproducibility represents the degree of stability of the response of
the system. Assuming a uniform rectangular distribution the uc is 0.23%.
2.1.6. Focus-to-chamber distance
The variations of focus-to-chamber distances are not expected to deviate from the well
known inverse of the square of the distance relation. The uncertainty estimation assumes a
uniform rectangular distribution is of the order of 0.03% for the extreme values obtained in all
beam quality measurements [6].
2.2. Factors Influencing only the Calibration of the user’s Chamber
2.2.1. Current measurements or scale reading. See section 2.1.1.
2.2.2. Recombination loss. See section 2.1.2.
2.2.3. Leakage. See section 2.1.3.
2.3. Factors influencing both types of instruments
2.3.1. Chamber Positioning
The estimated chamber positioning uncertainty must be considered when the substitution
method is used free in air at 100 cm of distance from the x-ray target. Assuming a uniform
rectangular distribution the ub is 0.02 %.
2.3.2. Effect of the exposure repeatability
The repeatability of the measurements values is defined as the agreement between the results
successive readings of the same parameter carried out under the same conditions of
measurement[4]. Assuming a uniform rectangular distribution the ub is 0.09%.
2.3.3. Air density (kt,p)
The pressure and temperature measured values during the experimental procedure are
normalized for the reference value of 20�C and 101,325 kPa. Assuming a uniform rectangular
distribution the ub is 0.06 % [6].
2.3.4. Field homogeneity
The uncertainty estimation assuming a uniform rectangular distribution is typically 0.01 % for
the extreme values obtained in the 6 cm field homogeneity. This interval is sufficient to satisfy
all the mammography chambers in all beam quality measurements obtained from constant
potential with different anode filter combinations.
2.3.5. Radiation background
The estimated standard uncertainty for radiation background is negligible.
2.3.6. Humidity
The relative humidity shall be kept between 30 and 70% during the measurements and in this
case the associated uncertainty is negligible.
2.3.7. Difference in x-ray spectra
The uncertainty due to effect of different x-ray spectra is estimated assuming a uniform
rectangular distribution smaller than 0.46 %.

IAEA-CN-85-305
177
2.3.8. Air Kerma rate
The typical results obtained for all qualities shows a linear relationship for tube loading for the
interval from 10 and 200 mAs. Assuming a uniform rectangular distribution ub is 0.13 %.
3. Conclusions
The SSDL’s main responsibility is to provide instrument calibration with appropriate
radiation beam qualities and its energy dependence as well as, to give technical advice to the
users on how to develop quality control for diagnostic radiology procedures traceable to the
metrological network.
It is very important to state that one should not need to carry out uncertainty calculations for
each instrument to be calibrated although, representative calculations must be performed for
typical calibration procedures. In order to clarify the recommended method of uncertainty
estimation, and to show the typical values for each parameter, Table 1 presents the overall
values for the calibration of a typical mammography ionization chamber.
Table 1. Typical estimated uncertainty analysis for calibration of mammography chambers.
Source of uncertainty Type A (%) Type B (%)
a. Factors influencing only the secondary standard:
a.1. Current measurements
a.1.1. Voltage 0.01 0.02
a.1.2. Capacitance 0.04 0.04
a.1.3. Time base 0.01
a.2.Recombination loss 0.0 0.08
a.3.Leakage
a.4. Energy dependence 0.03
a.5. Long term stability of the secondary standard 0.23
a.6. Focus-to-chamber distance 0.03
b. Factors influencing only the instrument to be calibrated:
b.1. Current measurements or scale reading
b.1.1. Voltage 0.01 0.02
b.1.2. Capacitance 0.04 0.04
b.1.3. Time base 0.01
b.2. Recombination loss 0.08
b.3. Leakage 0.0
c. Factors influencing both instruments:
c.1. Chamber Positioning 0.02
c.2. Exposure reproducibility 0.09
c.3. Air density (kT,P) 0.04 0.06
c.4. Field homogeneity 0.01
c.5.Radiation background 0.0
c.6. Humidity 0.0
c.7. Difference in x-ray spectra 0.46
c.8. Air Kerma rate 0.13
Combined standard uncertainty (quadratic sum) 0.56 %
Combined standard uncertainty, PSDL (expanded � by k) 0.7 %
Combined standard uncertainty, PSDL + SSDL 1.8 % (k = 2)a
a if the SSDL uses the same x-ray spectra, air kerma rate and focus-to-chamber distance as the PSDL the
combined uncertainty is 1,5 % (k=2).

IAEA-CN-85-305
178
References
[1] National Council on Radiation Protection and Measurement (NCRP) 1986
Mammography – A user’s Guide NCRP report 85 (Bethesda, MD).
[2] Kramer H M 1992 European intercomparison of diagnostic dosimeters: Calibration of
the reference dosimeters Rad. Prot. Dos. 43 75-79.
[3] Peixoto J G P and de Almeida C E 2001 The radiation metrology network related to the
field of mammography Meas. Sc. Tech.(submited).
[4] International Organization for Standard (ISSO) 1995 Guide to the expression of
uncertainty in measurement, 2nd ed, Published by ISO in the name of BIPM, IEC,
IFCC, IUPAC, IUPAP and OIML (Geneva)
[5] Attix F H 1986 Introduction to radiological physics and radiation dosimetry A Wiley-
Interscience publication ISBN 0-471-01146-0 (U.S.A).
[6] International Atomic Energy Agency (IAEA) 2000 Report of a consultants meeting on
development of a quality assurance programme for SSDLs SSDL Newsletter 42, 12-23
(Vienna: IAEA).

IAEA-CN-85-210
179
IMAGE QUALITY AND DOSE IN MAMMOGRAPHIC IMAGES OBTAINED IN
MEXICO CITY HOSPITALS
C. Ruiz-Trejo, M.-E. Brandan
Instituto de Física,UNAM, A.P. 20-364, México
M. Verdejo, A. Flores
Dirección de Riesgos Radiológicos, Secretaría de Salud, Mexico
M. Guevara, J. Martín
Hospital General de México, Mexico
L. Madero-Preciado
Hospital de Oncología, Centro Médico Nacional Siglo, Mexico
Abstract
The performance of three mammographic systems in large mexican hospitals has been evaluated, as well as the
image quality and associated dose. Quality control tests include examination of X-ray equipment, darkroom
conditions, film processor, and viewboxes. Systems referred to as “1”, “2”, and “3” passed 50%, 75% and 75%
of these tests, respectively. Quality image is assessed using five images obtained under similar nominal
conditions in each X-ray equipment. System 1 generates no image of acceptable quality, while equipments 2 and
3 produce one and two, respectively. The mean glandular dose for the best images obtained in each service with
an accreditation phantom has been measured, and the values are 1.4 mGy, 1.6 mGy, and 1.0 mGy, respectively.
1. Introducción
En 1997 la Secretaría de Salud (SSA) emite cuatro Normas Oficiales Mexicanas (NOM),
donde se regula en materia de protección radiológica el uso adecuado de los equipos de rayos
X con fines de diagnóstico médico. Al poner en práctica lo exigido por las NOM para los
sistemas de mamografía, se detectan una serie de carencias, entre otras, la falta de aplicación
de programas de garantía de calidad en esta área, lo que ocasiona: a) falta de equipo apropiado
para realizar pruebas de control de calidad en los equipos de rayos X, b) falta de
conocimientos para realizar una correcta evaluación de la calidad de la imagen, y c) necesidad
de capacitar recursos humanos en esta área a todos niveles (técnicos y médicos radiólogos,
físicos médicos e ingenieros de servicio).
A inicios del año 2000, contando con el apoyo de la Secretaría de Salud, el Instituto de Física
de la Universidad Nacional Autónoma de México (IFUNAM) y la Organización
Panamericana de la Salud (OPS), inician el proyecto de investigación: “Calidad de Imagen y
Dosis en Estudios Mamográficos Realizados en México” [1]. En este trabajo se presentan los
resultados, a la fecha, de este proyecto de investigación.
2. Objetivos
�� Verificar las condiciones de operación de tres sistemas de mamografía, situados en dos
hospitales públicos de alto impacto, en México, D.F.
�� Relacionar estas condiciones de operación con la dosis glandular promedio impartida a
las pacientes y con la calidad de la imagen de un maniquí de acreditación reconocido
por el Colegio Estadounidense de Radiología (ACR).
IAEA-CN-85-210
180
3. Equipo
Para realizar este trabajo se utilizó el equipo recomendado por el ACR [2] y por la Comunidad
Europea (EC) [3].
4. Procedimiento
Todas las pruebas se realizaron de acuerdo a lo estipulado por el ACR[2]. Las pruebas no
contempladas dentro de estos procedimientos, se realizaron de acuerdo a la EC [3].
Las 31 pruebas realizadas, agrupadas en 7 rubros generales, son: Equipo de mamografía:
Estabilidad mecánica, distancia foco - imagen, tamaño de punto focal, tensión en el tubo,
tiempo de exposición, capa hemirreductora, rendimiento, coincidencia del campo luminoso
con el receptor de imagen, alineación del campo de radiación con el receptor de imagen,
alineación de la placa de compresión con el receptor de imagen, reproducibilidad del control
automático de exposición (CAE), capacidad de desempeño del CAE, control de densidad del
CAE, fuerza de compresión, deformación de la placa de compresión, factor de rejilla.
Receptor de imagen: Contacto pantalla–película, uniformidad de la velocidad de las pantallas.
Equipo de revelado: Temperatura del revelador, tiempo de revelado, sensitometría, artefactos.
Cuarto oscuro: Fugas de luz, luces de seguridad. Negatoscopios: Brillantez, homogeneidad.
Dosis: Exposición de entrada, dosis glandular promedio. Calidad de imagen: Densidad óptica
al centro del maniquí, resolución, contraste.
En particular, la prueba de calidad de imagen se realizó haciendo 5 exposiciones en modo
semiautomático sobre el maniquí de acreditación, para un valor de la tensión nominal en todos
los casos igual a 28 kV, y para valores del control de densidad iguales a -4, -2, 0, +2 y +4.
El interés por la dosis entregada a la paciente, llevó a que se le midiera durante exposiciones
en modo manual, seleccionando el técnico radiólogo, de acuerdo a su criterio, los factores
técnicos adecuados para obtener la mejor imagen del maniquí de acreditación.
5. Resultados
Entre las pruebas de control de calidad relativas al funcionamiento del equipo, la mayor
deficiencia con respecto a lo establecido en las NOM, se refiere a la exactitud en la tensión de
operación. La Figura 1 muestra los resultados de esta prueba realizada en los tres equipos. Las
discrepancias entre los valores medidos del sistema 1, superan de manera consistente y
reproducible lo permitido por las normas.
Los resultados del control de calidad realizado se resumen en la Tabla I.
La Figura 2 resume los resultados de la calidad de la imagen para los tres sistemas. El número
indica cuantas imágenes, de las cinco estudiadas, cumplen con el criterio de aceptación del
ACR. Se puede concluir que solamente los sistemas 2 y 3 producen imágenes (1y 2,
respectivamente) con la calidad requerida de acuerdo al criterio del ACR.

IAEA-CN-85-210
181
Figura 1: Tensión medida en los equipos de rayos X. La línea continua muestra la identidad, las
líneas punteadas muestran las tolerancias aceptadas por la NOM.
Tabla I: Control de calidad
Sistema 1 Sistema 2 Sistema 3
Funcionamiento general Aprueba Aprueba Aprueba
Generación de rayos X No Aprueba Aprueba
Colimación No No No
Compresión No No No
Control automático de exposición Aprueba Aprueba Aprueba
Rejilla antidispersora Aprueba Aprueba Aprueba
Receptor de imagen No Aprueba Aprueba
Equipo de revelado No No No
Cuarto oscuro No No No
Negatoscopios No No No
0
1
2
3
4
Densidad Resolución Contraste
Sistema 1
Sistema 2
Sistema 3
Figura 2: Calidad de la imagen

IAEA-CN-85-210
182
La Tabla II muestra los resultados de la dosis. Los valores listados son el promedio (y su
desviación estándar) de tres exposiciones realizadas con los factores técnicos escogidos por el
técnico radiólogo. Los tres sistemas imparten a la paciente dosis inferiores a los 3 mGy
establecidos en la NOM. En particular, para el sistema 1, los factores técnicos usados para la
medida de dosis no corresponden a ninguna de las cinco medidas de calidad de la imagen.
Tabla II: Dosis glandular promedio
Sistema 1 1.4 � 0.1 mGy Aprueba
Sistema 2 1.6 � 0.1 mGy Aprueba
Sistema 3 1.0 � 0.1 mGy Aprueba
6. Conclusiones
�� Los sistemas estudiados no cumplen con las Normas Oficiales Mexicanas. Esto es
comprensible ya que no existe todavía un programa de garantía de calidad asociado a
ellos.
�� En términos generales, el funcionamiento apropiado del sistema, de acuerdo a los
criterios de la garantía de calidad se ve reflejado en la calidad de la imagen evaluada
con el maniquí aceptado por el ACR.
�� Las dosis bajas no garantizan que se estén obteniendo imágenes de calidad adecuada.
�� A pesar de no cumplir con las especificaciones de calidad exigidas por la NOM, los
sistemas estudiados producen imágenes aceptadas por la plantilla de profesionales
asociados. Esto se debe a la pericia y experiencia de los técnicos radiólogos que operan
los equipos. Sin embargo, debe recordarse de que esta experiencia fue adquirida a
costa de exposiciones innecesarias a las pacientes.
�� En hospitales de alto impacto, la gran cantidad de pruebas requeridas al establecer un
programa de garantía de calidad, hace imprescindible que su realización sea vigilada
por un físico médico de tiempo completo.
�� Los resultados de este trabajo deberán ser de utilidad para hacer ajustes a las Normas
Oficiales Mexicanas, en lo referente a mamografía, cuando la Secretaría de Salud
considere conveniente su revisión.
Referencias
[1] M.-E. BRANDAN et al., these Proceedings.
[2] AMERICAN COLLEGE OF RADIOLOGY, Mammography, Quality Control Manual,
USA (1999), 339 pp.
[3] CEC, The European Protocol for the Quality Control of the Technical Aspects of
Mammography Screening, (1992), 47 pp.

IAEA-CN-85-171
183
A COMPARISON OF TWO DIFFERENT PROCESSING CHEMICALS FOR
MAMMOGRAPHY: REPERCUSSION ON DOSE TO PATIENTS
F. Sendra-Portero, E. Ristori-Bogajo, P. Buch-Tomé, M. Martínez-Morillo Dpto de Radiología y Medicina Física, Universidad de Málaga, Spain E. Nava-Baro Dpto de Ingeniería de Comunicaciones, Universidad de Málaga, Spain
Abstract
The main technical objective of screen-film mammography is to reach the best image quality with the lowest dose
to the breast. Sensitometric gradient and speed are factors related with both subjects respectively. For a given
choice of film, these factors are affected by processing variables. By this reason, manufacturers have developed
diferent types of films that are recommended for particular processing conditions.
The purpose of this work is to compare the variations of both sensitometric characteristics of mammographic
screen and film systems induced by two different manufactured chemicals: RPX-Omat EX/LO (Kodak) and
G139/G334 (Agfa). A comparison of thirteen mammographic films by means of light sensitometry was
performed at different processing conditions: 90s/Kodak, 120s/Kodak, 180s/Kodak, 90s/Agfa, 120s/Agfa and
180s/Agfa. Secondly, 99 combinations of screens and films were evaluated by X-ray sensitometry at 120s/Kodak
and 120s/Agfa processing. At light sensitometry, variations in processing time led to different modifications in
film speed, depending on the chemicals used. At X-Ray sensitometry, Agfa chemicals induced higher values of
sensitivity for almost all combinations, while Kodak chemicals gave higher gradient/speed quotient. The results
show that dose to patients in mammography and image contrast are highly dependent on the chemicals selected at
medium cycle (120s) processing.
1. Introducción
La mamografía es un procedimiento radiológico cuyo uso ha tenido un importante incremento en los últimos 15 años, debido a su demostrada rentabilidad en la detección precoz del cáncer de mama, pues contribuye a reducir la mortalidad e incrementar el número de tratamientos conservadores. Diversos estudios han demostrado la utilidad de realizar mamografías a mujeres asintomáticas en las edades de mayor riesgo, en la cuarta, quinta y sexta décadas de la vida [1]. Técnicamente, la mamografía se realiza mediante películas radiográficas de una sola emulsión y una pantalla de refuerzo, con un sistema de procesado automático dedicado. Utilizar una emulsión simple en lugar de doble permite conseguir mayor resolución espacial a costa de disminuir la sensibilidad del sistema. Para la obtención de imágenes de calidad diagnóstica en una zona anatómica con bajo contraste de objeto como es la mama, es preciso que el receptor de imagen ofrezca suficiente contraste intrínseco. Uno de los elementos clave en la calidad de imagen mamográfica y la dosis suministrada por exploración es el sistema pantalla-película empleado. En tal sentido, el contraste y la sensibilidad de dicho sistema, que pueden determinarse mediante técnicas de sensitometría, son parámetros técnicos que deben evaluarse como un estándar de calidad. Parámetros sensitométricos como el gradiente o la velocidad están relacionados con el contraste y la sensibilidad del sistema, es decir, con la calidad de imagen y la dosis empleada respectivamente.

IAEA-CN-85-171
184
El procesado afecta tanto al gradiente como a la velocidad. Los principales factores que afectan ambos parámetros son: el tiempo de inmersión en el baño de revelado, la temperatura de revelado y el grado de reciclado de los líquidos. Los fabricantes han desarrollado diferentes tipos de películas y pantallas de refuerzo, recomendándolas para ciclo estándar (90s), extendido (180s) o ambos. El objetivo de este trabajo es comparar las variaciones de gradiente y velocidad inducidas por dos tipos de productos químicos de procesado, mediante sensitometría de luz y de rayos X. 2. Material y método
En el presente trabajo se ha realizado un estudio comparativo incluyendo 13 películas y 9 pantallas de refuerzo para mamografía, comercializadas por seis fabricantes diferentes. 2.1. Sensitometría de luz
Se han utilizado trece películas comercializadas por 6 fabricantes: Trimax FM, Trimax HM y Trimax HM2 (Imation); MR3-II, MR5-II y MR6 (Agfa); UM-MA HC (Fuji); Min-R MA, Min-R E y Min-R 2000 (Kodak); CM-New y CM-H (Konika), y Microvision-C (Sterling). Las películas se expusieron con un sensitómetro de luz verde (07-456 Victoreen), que proporciona una tira de 21 escalones de diferente exposición (E), que aumenta 0,15 LogE en cada escalón, desde 0,05 hasta 3,05. Una vez expuestas, las películas se procesaron en 6 condiciones de procesado diferentes (Tiempo de procesado/Líquidos/temperatura del revelador): 90s/Kodak/37.6°C, 120s/Kodak/34.3°C, 180s/Kodak/34.7°C, 90s/Agfa/34.0°C, 120s/Agfa/34.0°C y 180s/Agfa/34.7°C. Los líquidos(revelador/fijador) Kodak fueron RP X-Omat EX/LO, y los Agfa fueron G139/G334. El tiempo de procesado se midió desde la entrada en el baño de revelado hasta la salida eal exterior (tiempo seco-seco). La densidad óptica de la tira sensitométrica se leyó mediante un densitómetro digital (07-424 Victoreen). Se obtuvieron las curvas características de logE frente a densidad óptica (DO) y se calculó la velocidad como el inverso del LogE necesario para alcanzar una DO de 1+velo+base (1+VB), siendo VB la densidad óptica obtenida sin exposición. El gradiente medio se calculo como la pendiente entre DO iguales a 0,25+VB y 2+VB. El procedimiento concreto se repitió cuatro veces. Los resultados se presentan en términos de la media de las cuatro series. 2.2. Sensitometría de rayos X
Para este estudio, se realizó sensitometría de rayos X, mediante una cuña escalonada de aluminio, a 99 combinaciones pantalla/película (11 películas combinadas con 9 pantallas de refuerzo) en dos unidades mamográficas diferentes (UC Mammo Diagnostic y Senograph 800T), con procesados de 120s, y líquidos Kodak y Agfa respectivamente. La cuña de aluminio se calibró para cada unidad empleando dosímetros de termoluminescencia. La velocidad se calculó como el inverso de la exposición necesaria para obtener una DO de 1+VB y el gradiente medio como se ha descrito en la sensitometría de luz. El procedimiento se repitió con las 99 combinaciones tres veces, en días diferentes y los resultados se presentan en términos de media y desviación estándar.

IAEA-CN-85-171
185
3. Resultados y conclusiones
En la sensitometría de luz, el incremento del tiempo de procesado repercute en un aumento de la sensibilidad o el gradiente más marcado, según se empleen líquidos Agfa o Kodak, respectivamente (Figura 1). Los resultados de la sensitometría de luz han sido presentados con detalle anteriormente [2]. Sería deseable haber utilizado una procesadora única, pero es una tarea cara y difícil de conseguir. Desafortunadamente la temperatura de revelado de la procesadora a 90s/Kodak excedió en 3 ºC a las restantes, lo cual debe tenerse en cuenta. Todas las películas alcanzaron la mayor velocidad, en términos absolutos con procesado Kodak/118s. La desviación estándar de las cuatro series varió entre 0,00 y 0,03. Al evaluar los resultados entre 90s y 120s asi como 120s y 180s, puede verse que la relación entre velocidad y tiempo de procesado es muy diferente según el tipo de químicos empleado. Con líquidos Kodak, la velocidad aumentó siempre según se incrementó el tiempo de procesado, pero con líquidos Agfa no varió o incluso disminuyó en un 84% de los casos.
2
2,5
3
3,5
4
2
2,5
3
3,5
4
2
2,5
3
3,5
4
0,4 0,45 0,5 0,55 0,6 0,65 0,7 0,75 0,4 0,45 0,5 0,55 0,6 0,65 0,7 0,75
Kodak 90s
Kodak 120s
Kodak 180s
Agfa 90s
Agfa 120s
Agfa 180s
Velocidad
Gra
die
nte
Med
io
Figura 1. Sensitometría de luz. Se presenta el gradiente medio de las 13 películas estudiadas
frente a la velocidad empleado diferentes tipos de procesado: químicos Kodak y Agfa a ciclos
(seco-seco) de 90, 60 y 120 s
Los resultados de la sensitometría de rayos X (ciclo 120 s) mostraron una mayor velocidad del sistema pantalla película cuando se emplearon líquidos Agfa (Figura 2). Estos resultados coinciden con lo encontrado en la sensitometría de luz para un ciclo de 120 s (figura1). La utilización de químicos Kodak, en cambio, muestran un cociente gradiente velocidad mayor que con procesado Agfa (figura 3). Esta tendencia a favorecer velocidad o contraste según los químicos de procesado empleados no ha sido descrita anteriormente en nuestro conocimiento.
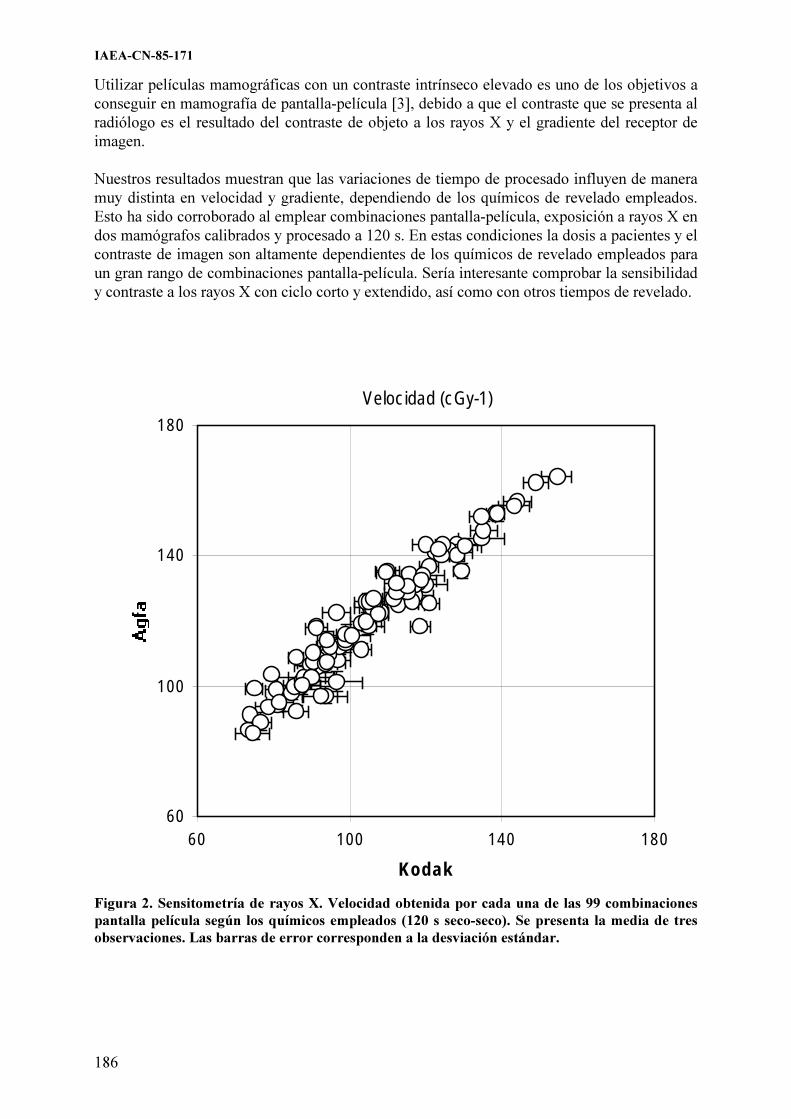
IAEA-CN-85-171
186
Utilizar películas mamográficas con un contraste intrínseco elevado es uno de los objetivos a conseguir en mamografía de pantalla-película [3], debido a que el contraste que se presenta al radiólogo es el resultado del contraste de objeto a los rayos X y el gradiente del receptor de imagen. Nuestros resultados muestran que las variaciones de tiempo de procesado influyen de manera muy distinta en velocidad y gradiente, dependiendo de los químicos de revelado empleados. Esto ha sido corroborado al emplear combinaciones pantalla-película, exposición a rayos X en dos mamógrafos calibrados y procesado a 120 s. En estas condiciones la dosis a pacientes y el contraste de imagen son altamente dependientes de los químicos de revelado empleados para un gran rango de combinaciones pantalla-película. Sería interesante comprobar la sensibilidad y contraste a los rayos X con ciclo corto y extendido, así como con otros tiempos de revelado.
Velocidad(cGy-1)
60
100
140
180
60 100 140 180
Kodak
Figura 2. Sensitometría de rayos X. Velocidad obtenida por cada una de las 99 combinaciones
pantalla película según los químicos empleados (120 s seco-seco). Se presenta la media de tres
observaciones. Las barras de error corresponden a la desviación estándar.

IAEA-CN-85-171
187
3
5
7
9
60 100 140 180
Velocidad
Kodak
Agfa
Figura 3. Sensitometría de rayos X. Representación gráfica de velocidad frente a gradiente para
las 99 combinaciones pantalla película, con procesado AGFA (puntos negros) y Kodak (puntos
blancos).
Referencias
[1] KOPANS, D.B., La mama en imagen. 2.ª ed., Marbán, Madrid (1999) 879 pp. [2] F. SENDRA, P. BUCH, J. PASTOR, M. MARTÍNEZ-MORILLO “Study on the
influence of film processing in speed and gradient of currently available mammographic films” (Proc 10th Int. Cong. on Senology). J. CARDOSO DA SILVA ed.) Monduzzi Editore, Bolonia (1998) 553-557.
[3] HAUS, A.G., Technologic improvements in screen-film mammography. Radiology. 174 (1990) 628-37.

IAEA-CN-85-234
188
STUDY OF RADIOLOGICAL RISK IN BREAST CANCER SCREENING
PROGRAMME AT COMUNIDAD VALENCIANA
J.I. Villaescusa
Servicio de Protección Radiológica, Hospital Universitario La Fe, Spain
A. León, G. Verdú
Dpto. Ingeniería Química y Nuclear, Universidad Politécnica de Valencia, Spain
M.D. Cuevas
Dirección General de Atención Especializada, Consellería de Sanidad de Valencia, Spain
M.D. Salas
Dirección General de Salud Pública, Consellería de Sanidad de Valencia, Spain
Abstract
It is demostrated that screening mammography¨s programmes reduces breast cancer mortality considerably.
Nevertheless, radiology techniques have an intrinsic risk being the most important late somatic effect the
induction of cancer. This study is made in order to evaluate the risk produced into the population by the
Comunidad Valenciana Breast Sceening Programme. All The calculations are carried out for two risk models,
UNSCEAR 94 and NRPB 93. On the one hand, screening series detriment are investigated as a function of doses
delivered and other parameters related to population structure and X-ray equipment. And on the other hand
radiation induced cancer probability for a woman who starts at 45 years and remains into the programme until 65
years old is calculated as a function of mammography unit¨s doses and average compression breast thickness.
1. Introducción
El estudio cuyos resultados se exponen en este trabajo surgió como respuesta a las inquietudes
de la sociedad que demandan una sanidad de mayor calidad con los mínimos riesgos posibles.
En el caso de los programas de detección precoz del cáncer de mama basados en
exploraciones de Rayos-X, pese al beneficio intrínseco que la experiencia ha demostrado, no
deja de ser una práctica con una serie de riesgos asociados. Entre ellos se encuentra la
posibilidad de inducir un cáncer al paciente debido a la radiación recibida durante la
exploración, con una probabilidad muy baja pero no nula. El grupo de investigación formado
por miembros del Departamento de Ingeniería Química y Nuclear de la U.P.V, la Unidad de
Prevención del Cáncer de la Consellería de Sanidad de Valencia y el Servicio de Protección
Radiológica del hospital La Fe decidió emprender un estudio que incluye la dosimetría y
cuantificación del detriemento radiológico implícito en el Programa de Detección Precoz del
Cáncer de Mama de la Comunidad Valenciana.
2. Metodología
2.1. La dosimetría
El detrimento radiológico, entendido como el número de cánceres inducidos por la radiación,
depende de la dosis impartida en el órgano. Así, el primer paso fue el cálculo de este
parámetro.
La dosimetría empleada se basó en técnicas de simulación por métodos de Monte Carlo
empleando el código MCNP-4B (Monte Carlo Neutron Particle). Se trata de un software
público de gran aceptación desarrollado en Los Alamos Laboratory.

IAEA-CN-85-234
189
Para abarcar la diversidad de casos posibles se utilizó un modelo de la mama análogo al
empleado por Dance [1], un semicilindro de radio 8 cm y altura variable entre 3 y 9 cm con
incrementos de 0,5 cm. Se supuso que dicho órgano está compuesto por un recubrimiento de
tejido adiposo de 0,5 cm de espesor y una parte interior formada por una mezcla del 50% de
tejido adiposo y 50% de tejido glandular, con las composiciones de Hammerstein et al [2]. Se
pueden consultar más detalles en el artículo "Mammographic Dosimetry Using MCNP-4B"
[3] publicado por este grupo.
En la modelización se empleó un espectro teórico del catálogo de Birch and Marshall[4]
de
características acordes con las de los equipos habituales en mamografía y que opera a 30 kV,
tiene ánodo de molibdeno, filtro de 1 mm de berilio y HVL comprendidos entre 0,31 y 0,49
mm de aluminio.
Los resultados de las simulaciones suministraron valores de dosis en función del espesor de la
mama y por mAs aplicado. Para completar el estudio era necesario conocer los mAs.
2.2. Toma de datos de las exploraciones
Aprovechando el control de calidad anual de los equipos realizado a finales de 1998, se tomó
una muestra de exploraciones correspondientes a 100 mujeres por cada unidad (en ese
momento existían 11) y se registraron los valores de espesor de compresión y a los mAs
aplicados, así como las condiciones de irradiación. Con ellos se determinó una correlación
estadística entre los mAs y el espesor de la mama propia de cada equipo cuyos resultados
completaron el cálculo de la dosis recibidas en cada caso.
2.3. Estructura de la población por edad
La dosis no es el único factor que afecta al riesgo intrínseco a la radiación. También influye la
edad del paciente en el momento de la exposición. Para emprender el estudio del detrimento
radiológico se hizo un análisis de las mujeres que se habían sometido al programa desde su
inicio y se determinó su edad. Con ello se podía deducir el número de mujeres de cada edad
que había sido irradiada por cada equipo.
2.4. El cálculo del detrimento radiológico
Este apartado se llevó a cabo con el software ASQRAD (Assesment System for the
Quantification of Radiation Detriment) que es una herramienta aplicable en los cálculos del
detrimento radiológico (forma cuantitativa de expresar la combinación de probabilidad de que
ocurra un efecto contra la salud y la gravedad de tal efecto) desarrollada conjuntamente por el
CEPN (Centre d’Etude sur l’Evaluation de la Protection dans le Domaine Nucléaire) en
Francia y la NRPB (National Radiological Protection Board) en el Reino Unido.
Con él se determinaron los efectos somáticos, expresados como la probabilidad de aparición
de un cáncer de mama inducido por la radiación. De los múltiples modelos de riesgo que
contiene el programa se emplearon los dos más recientes, el UNSCEAR 94 y el NRPB 93.

IAEA-CN-85-234
190
El ASQRAD permite introducir los datos demográficos de una población determinada. Como
el estudio se basó en el Programa de la Comunidad Valenciana, se elaboró una tabla específica
de esta población con datos suministrados por la Unidad de Prevención del Cáncer y el
Instituto Nacional de Estadística.
Los datos de partida son la dosis recibida, el órgano irradiado, la edad y sexo del paciente. Se
observó una variación lineal del detrimento con la dosis en el intervalo de valores propios de
la mamografía, así que se calculó un detrimento por unidad de dosis para todas las edades
incluidas en el intervalo de estudio. Seguidamente se multiplicaron por la dosis real y el
número de mujeres irradiadas a esa dosis. El resultado fue el detrimento global de la
población.
3. Resultados
El estudio tuvo en cuenta la metodología del programa valenciano en el que las series de
cribado son bienales, con doble proyección en la primera serie y proyecciones simples en
series sucesivas. Desde su inicio hasta el momento del estudio se habían completado tan solo
3 series. El número de cánceres totales inducidos por la radiación en cada una de las series,
por cada unidad mamográfica y cada uno de los modelos de riesgo empleados se refleja en las
siguientes las tablas 1,2 y 3.Los resultados globales se muestran en la tabla 4.
Datos por unidades
Tabla 1. Cánceres totales inducidos en la primera serie
Unidad Población Cánceres Mortales Cánceres Mortales por
100000
Exceso de Cánceres Exceso of Cánceres
por 100000
Unscear
94
NRPB 93 Unscear
94
NRPB 93 Unscear
94
NRPB 93 Unscear
94
NRPB 93
Unidad1 16525 0,47 0,91 2,8 5,5 0,94 1,817 5,7 11 Unidad2 12438 0,19 0,36 1,5 2,9 0,38 0,72 3,1 5,8 Unidad3 13780 0,15 0,29 1,1 2,1 0,29 0,58 2,1 4,2 Unidad4 15764 0,32 0,63 2 4 0,65 1,25 4,1 7,9 Unidad5 14713 0,28 0,56 1,9 3,8 0,56 1,12 3,8 7,6 Unidad6 17509 0,23 0,44 1,3 2,5 0,46 0,88 2,6 5 Unidad7 18755 0,27 0,52 1,4 2,8 0,65 1,05 3,5 5,6 Unidad8 13245 0,16 0,33 1,2 2,5 0,28 0,66 2,1 5 Unidad9 3225 0,06 0,14 2 4,2 0,11 0,26 3,4 8,1 Unidad10 16937 0,13 0,28 0,8 1,6 0,25 0,51 1,5 3 Unidad11 18696 0,32 0,61 1,7 3,3 0,64 0,61 3,4 3,3

IAEA-CN-85-234
191
Tabla 2. Cánceres totales inducidos en la segunda serie
Unidad Población Cánceres Mortales Cánceres Mortales por
100000
Excesos de Cánceres Excesos de Cánceres
por 100000
Unscear
94
NRPB 93 Unscear
94
NRPB 93 Unscear
94
NRPB 93 Unscear
94
NRPB 93
Unidad1 17324 0,33 0,62 1,9 3,6 0,65 1,16 3,7 6,7 Unidad3 14877 0,10 0,18 0,6 1,2 0,19 0,34 1,3 2,3 Unidad6 19577 0,22 0,39 1,1 2 0,43 0,73 2,2 3,7 Unidad7 20755 0,17 0,32 0,8 1,5 0,34 0,60 1,6 2,9 Unidad8 15784 0,15 0,34 1 2,2 0,30 0,72 1,9 4,6 Unidad9 3528 0,04 0,08 1,1 2,3 0,08 0,16 2,3 4,5 Unidad10 18292 0,13 0,28 0,7 1,5 0,25 0,56 1,4 3,1
Tabla 3. Cánceres totales inducidos en la tercera serie
Unidad Población Cánceres Mortales Cánceres Mortales per
100000
Excesos de Cánceres Excesos de Cánceres
por 100000
Unscear
94
NRPB 93 Unscear
94
NRPB 93 Unscear
94
NRPB 93 Unscear
94
NRPB 93
Unidad1 16409 0,30 0,54 1,8 3,3 0,605 1,015 3,7 6,2 Unidad3 14877 0,10 0,16 0,6 1,1 0,18 0,32 1,2 2,2 Unidad6 19577 0,13 0,25 0,7 1,3 0,27 0,47 1,4 2,4 Unidad8 15784 0,10 0,19 0,6 1,2 0,208 0,36 1,3 2,3
Resultados globales
Tabla 4. Número de cánceres totales inducidos por la radiación en toda la
población examinada durante las tres series primeras.
UNSCEAR 94 NRPB 93
Primera Serie 3.22 6.04
Segunda Serie 2.06 4
Tercera Serie 1.9 3.27
4. Conclusiones
Como conclusión global se observa que los mayores detrimentos los da el modelo NRPB 93
en todos casos [5].
En cuanto a la evolución del detrimento dependiendo de la serie del programa, ambos
modelos predicen resultados mayores en la primera serie, fenómeno que responde a dos
causas: en ella se realiza doble proyección en cada seno y el factor de proyecciones
adicionales es mayor en esta serie que en las restantes, lo que hace que la dosis promedio por
individuo sea mucho mayor.
Los resultados por unidades son bastante diferentes debido fundamentalmente a la diferencia
de dosis impartidas.
IAEA-CN-85-234
192
Referencias
[1] D R Dance, “Monte Carlo Calculation of conversion factors for the estimation of mean
glandular breast dose”Phys. Med. Biol 29 ,1211-1219 (1990).
[2] G.Richard Hammerstein, M.S., Daniel W. Miller, Ph. D., David R. White, Ph. D., Mary
Ellen Masterson, M.S., Helen Q. Woodard, Ph. D., and John S. Laughlin. “Absorbed
Radiation Dose in Mammography”, Radiology 130, 485-491 (1979).
[3] G. Verdú, A. León, J.I. Villaescusa, M.D. Salas, M.D. Cuevas, F. Bueno,
"Mammographic Dosimetry Using MCNP-4B", 9th
International Conference on
Radiation Shielding (ICRS9), Tsukuba, Japan. Oct. 17-22, 1999.
[4] Birch, Marshall and Ardran, “Catalogue of Spectral Data for Diagnostic X-Rays” The
Hopital Physicists’ Association. Scientific Reports Series – 30 (1979).
[5] A. León, G. Verdú, et al “Riesgo Inducido por la Radiación en un Programa de
Cribado Mamográfico en Función de la Edad de Inicio”, 25 Reunión anual de la SNE.

IAEA-CN-85-128
193
MAMMOGRAPHY QUALITY ASSURANCE IN MOROCCO
F. Zaoui, K. Talsmat, K. Lalaoui Departement des Applications Medicales et Biologiques, Centre National del’Energie des Sciences et des Techniques Nucléaires, Rabat, Morocco
Abstract
The “Centre National de l’Energie, des Sciences et des Techniques Nucléaires” (CNESTEN) realised, from
February 1999 to March 2000, a quality control of 41 mammography facilities in Morocco. The protocol and
standards adopted for achieving the control of elements constituting the mammography chain are those
elaborated by GIM and Qualix association. Statistics and conformities results are presented. The program was
performed in order to demonstrate to the practitioners in mammography field, the utility and necessity to have a
national quality assurance policy. The main objective of CNESTEN is to be accredited by the Moroccan
government as a reference laboratory in quality control and dose evaluation in medical imaging and radiotherapy.
To achieve this goal the CNESTEN has set up Medical Physic Unit well trained and equipped with the necessary
instruments.
1. Introduction
The mammography is considered as an important tool for the early detection of the breast cancer. However the value and the diagnostic performance depend closely on the performance of elements constituting the mammography chain. The institution of procedures of quality control and assurance quality program, specific to the mammography, is considered as factor permitting to get the maximum diagnostic information with minimizing the dose delivered to the patient and the medical personal. The cost of the exam is also reduced. Several procedures of quality control, aiming to improve and to assure quality of the images, have been developed and adopted in several countries: USA, Canada, European Union, etc. In Morocco, the quality assurance in medical imaging is not regulated, and is therefore not adopted and performed by the different centres of medical imaging. Rare are practitioners who judge usefulness to adopt procedures of quality control for monitoring the performance of theirs facilities. The CNESTEN, national institute, is considered as the main promoter of the use of nuclear techniques in the different socio-economic sectors in Morocco. The Department of the Medical and Biological Applications of CNESTEN via the Medical Physics Unit has start work in order to institute a national mammography assurance quality program. With the collaboration of the National Federation of Radiologists (FNR) and the Moroccan Society of Radiology(SMR), the CNESTEN undertook the realisation, free of charge, of quality control of mammography facilities. The goal is to demonstrate the interest to adopt a quality assurance program for improving the quality of images and reducing the cost of exams.
2. Technical procedures
The number of mammography facilities in Morocco is 80 distributed mainly between cities of Casablanca and Rabat. For reasons of logistical order we were not able to achieve the control of all facilities. Only 41 facilities benefited from this program: Casablanca: 20, Rabat: 12, Fez: 4 and Tangier: 5 facilities. A detailed information letter concerning the progress and the

IAEA-CN-85-128
194
objective of the program was sent to responsible person in all facilities before the realisation of installation check. The tests were done according to the French protocol, elaborated by the interdisciplinary grouping of mammography (GIM)[1] and the European committee [2]. Several parameters are concerned [3]: Storage film local, Dark room, Processor film, Screens–films systems, Mammography unit and the viewing conditions, as well as a global evaluation of the image quality with MTM 100 French phantom breast in the usual clinical conditions exposition.
After control, the results have been analysed [4-5] and have been interpreted [6-7] in accordance with French Standard Qualix Association [8]. A final report regrouping the results, noted irregularities as well as recommendations have been sent to the responsible of the installation concerned under confidential letter. 3. Statistics and conformities results
3.1. Storage film local and dark room
In the storage local, The visual inspection of films storage conditions revealed that: The storage was vertical in 22 facilities (53%) while it was horizontal in 6 facilities (15%). 13 facilities (32%) have not storage local. The temperature measured inside the local was in accordance with French standards ( 21°C). However the temperature inside the dark room was higher than the standards in 25 facilities (61%), while it was from 17°c to 21 °C in 18 facilities (39%).
For the darkroom fog check, a film was half covered in the room for two minutes and then processed. The difference of optical density between the two areas (covered and not covered) should be inferior to 0.20 OD according to the French standards. In 31 facilities (75%) the darkroom fog was correct. In 2 facilities (5%) the power lamp was superior to 25 KW. The others facilities (20%) were not equipped with lamp.
3.2. Processing film It is demonstrated that conditions of processing film have a big influence on the contrast and level of dose irradiation. The timing processing and developer temperature should be adjusted to obtain high quality mammography images. Only 4 facilities (9.7%) are equipped with the processing film machine dedicated only to the mammography exams. 3.2.1. Sensitometric film
The parameters measured are base fog density and film’s speed and contrast. The methodology consisted of sensitising a strip film by the sensitometer, running it through the processor, and measuring, by the densitometer the optical density in different steps. �� Base fog density: In 34 facilities (83%) the base fog density was lower than 0.2 OD while
it was higher than 0.2 OD in the others facilities (17%). �� Sensitivity screen-film:In almost facilities visited we noted that the reference conditions
processor were not respected. In 15 facilities (37 %) the sensitivity film-screen was inside the range: from steps 10 to 11, and in 26 facilities (63%) the sensitivity was from steps 12 to 14.

IAEA-CN-85-128
195
�� Film Contrast: this parameter is considered as the difference value of the optical densities between the interest and surrounded regions. In 24 facilities (58%), the contrast values was from 0.40 to 1. In 13 facilities (32%), the contrast value was within 1.1 and 1.40 and in 4 facilities ( 10%) it was within 1.41 to 1.60.
3.2.2. The processing time
The processing time was measured by the chronometer. It’s the time taking by the film from his entrance and exit through the processor. In 10 facilities (24%) the time of processing was from 75 to 90 s. In 20 facilities (49%), it was from 100 to 120 s, in 8 facilities ( 20%) from 130 to 150 s and finally, it was from 160 to 180 s in 3 facilities (7 %).
3.2.3 Cassettes - screen – film contact
In all facilities visited we noted only one contact screens- film problem.Two cassettes had a bad closing in 2 facilities but tracks of dust were present on the screens in 38 facilities.
4. Mammography units statement
The mammography unit mechanical state was controlled by checking the: rotator and translator movements, compression breast (force, thickness), paddle, grid etc…
4.1. X-ray field congruence
According to the Qualix standards, we fixed the acceptability margin at ± 5 mm between the X-ray limit and the external board of the breast table. In 35 facilities (85%) the difference was within the margin fixed. In 6 facilities (15%) the difference was superior to ± 5 mm. 4.2. kVp accuracy and reproducibility
This test consist of checking out the accuracy and the reproducibility of kVp. We compared the kVp delivered by the X-ray generator and those measured by the kVp Divider. The range of kVp checked was from 25 to 30 kVp and the difference acceptability was fixed to ± 1.5 kVp. In 22 facilities( 54%), the difference was � 1.5 kVp wile it was � 1.5 kVp in 9 facilities (22%). In 10 facilities (24%) equipped with the SIEMENS Mammomat B mammography unit, the test was not achieved because of the no compatibility of the kVp Divider’s operative mode with the specified mammography unit.
4.3. Automatic exposure control AEC
To check out the AEC set-up and performance, we selected several cassettes which had very close speed. when it was not possible we used only one cassette. We realized several expositions, from 25 to 31 kVp, using a Plexiglas phantom of 4 cm thickness. The kVp were increased by step of one kVp. Then we varied progressively the thickness of the Plexiglas phantom: 2, 3, 4, 5 and 6 cm while keeping the same kVp. The optical density was measured in all films.The optical density should be between 1.45 to 1.60 OD and the variation densities should be from 1.20 to 1.30. In 17 facilities (41%), the automatic exposure was efficient when in 20 facilities (49%) failures or problems in AEC density tracking or density calibration were noted. The test was not performed in 4 facilities because they are not equipped with an automatic exposure.

IAEA-CN-85-128
196
4.4. Image quality evaluation
For image quality evaluation, we used the MTM 100 French phantom breast. Its semicircular shape, 4 cm thickness, made with PMMA material and contained some inclusions like aspects of human equivalence (fibber, masses, microcalcifications). The phantom was positioned on the breast table with its longest edge centrally with the chest wall edge of the table. We exposed the phantom in the same conditions as used clinically for a standard sized breast. The film density in the reference zone should be inside the range of 1.30 to 1.6 OD. If The film density is outside the range we made an other exposure in order to have the density in the specified range: 1.3 to 1.6 OD. A score number was calculated, it’s relating to the visualisation ( partially or totally) of inclusions. A total score which is the summary of score’s number inclusions, was attributed for each facility. A minimum score of 24 points is required for accrediting the facility. In 14 facilities (34%) the score was lower than 24. In 16 facilities (34%) the score number was from 24 to 38 and in 11 facilities (27%) it was from 40 to 56. Some artifacts were observed on the phantom image. This was attributed to the dust and the mod processing ( roller, developer was mixed with the fixer, concentration of the developer, chemistry replenishment.. ). In one facility we noted a grid artifact.
5. Viewing conditions
We tested the luminance of the monitors brightness using a photometer. Five measurements in the coins and in the middle for each monitor were performed. The luminance should be superior to 1700 Candela/m2. In 15 facilities (37%), the luminance was superior to the standard fixed. In 18 facilities (43%), the brightness was insufficient and in the others facilities (20%), the test was not performed because the photometer was not available at that time. We point out that others tests like; the humidity, focal spot performance, breast exposure entrance and dose and beam quality (half-value layer) were also not performed because of the late purchase of the material.
6. Conclusion This study which concerned 41 facilities of mammography permitted to reach a certain number of main objectives. Although the majority of mammography facilities are recent, some abnormalities degrading the quality of the images and therefore decreasing the diagnostic value of the exam were discovered. The detailed reports sent to practitioners convinced them of the necessity and the utility to institute a quality assurance program of their installation. Some radiologists follow our suggestions and recommendations and corrected the abnormalities noted. A final report including all results of this study will be presented to the Ministry of Health, Moroccan Federation of Radiologists and the Moroccan Society of Radiology, during special seminar dedicated to the quality assurance in mammography. We hope to arrive at the mechanism to regulate the quality assurance in mammography.

IAEA-CN-85-128
197
References [1] NOEL,A., STINES,J, LELOUP, P., Centre Alexis Vautrin, Protocole de contrôle de
qualité en mammographie, Rep. Nancy, France (1996). [2] European protocol on dosimetry in mammography EUR-16263 EN- March 1996, Rep.
ECSC-EC-EARC, Brussels. Luxembourg (1996). [3] STINES,J., NOEL, A., Influence des facteurs techniques sur la qualité de l’image et la
dose, L’imagerie du sein,, Formation permanente, École de manipulateurs en radiologie Médicale de C.H.U., Bourdeaux, France (1997).
[4] STINES, J., NOEL,A., Assurance de qualité en mammographie et évaluation des coûts sur 28 installations, Revue d’Imagerie Médicale, 4 (1992) 361-369.
[5] ROBERT, C., Université de Technologie de Compiégne, Démarche pour le contrôle qualité de la chaîne imagerie en radiologie conventionnelle, Rep., SPIBH, UTC, France (1997).
[6] MONNIER, J-P., and coll., Pratique des techniques du radiodiagnostic, Masson, Paris, France (1985).
[7] The Expanding Role of Medical Physics in Diagnostic Imaging ( Proc. Int. Summer School. Nice, 1997) AAPM, Madison, Wisconsin, USA(1997).
[8] Contrôle de qualité en mammographie, Critères d’acceptabilité des performances., Qualix association, Paris, France.

IAEA-CN-85-201
198
ORGAN DOSES IN CT OF THORAX:
SEQUENTIAL SLICES VERSUS HELICAL SLICES
C. Bodineau Gil1,2
, J. Macías Jaén2, I. Tort Ausina
1, R. Ruiz-Cruces
1,
P. Galán Montenegro2, A. Díez de los Ríos
1
1Grupo de Investigación en Protección Radiológica de la Universidad de Málaga, Málaga,
Spain 2Radiofísica Hospitalaria, Complejo Hospitalario Carlos Haya, Málaga, Spain
Abstract
Helical scanning introduces additional choices in technical parameters and has an impact on how much radiation
dose a patient receives. Helical scanning allows the entire thorax to be scanned within a single breathold,
reducing slice registration due to breathing artifacts. Organ doses from thoracic computed tomography have been
estimated in an anthropomorphic phantom using thermoluminescence dosimeters. With a very similar
radiological techniques in helical and axial scanning the absorbed organ dose measured were more relevant in
lung 12,0 � 2,0 mGy and 11,0 � 2,0 mGy respectively; and in heart 9,0 � 4,0 mGy and 9,0 � 5,0 mGy. Our
results show that contiguous helical CT scans acquired with the same technical factors as contiguous axial scans,
imply approximately the same radiation dose.
1. Introduction
Helical computed tomography
Helical Computed Tomography (CT), involves simultaneous transport of a patient at a
constant speed through the gantry while helical CT data are continuously acquired over
multiple gantry rotation, instead of stationary gantry when the table was moving in the
conventional CT. In our days the new CT equipment are helical, so CT is synonymous of
helical CT or volumetric reconstruction [1].
Successful application of CT in medical diagnosis is given by the volume coverage speed of a
scanner, which refers to its capability to scan rapidly a large volume of interest.
To receive images of high quality it is important that the patient does not move during the data
acquisition process, in order to avoid:
1. loss of sharpness of the image (as happens in classical radiography), and
2. motion artifacts (inherent to image reconstruction in computed tomography when
inconsistent data are received).
Short scan times are desirable to limit such motion effects in single scans. Short total
examination times are also desirable to limit motion between scans, since it can cause
omission of anatomical levels.
Helical CT does a volumetric exploration simultaneously with the acquisition by means of
rotations of the tube, with the patient over a table, that moves at the same time than the tube
over the gantry. The acquisition does not stop, while the system tube-detector spins around the
patient.
The selection of basic scan parameters for spiral CT is the same as in conventional CT. The
parameter value may differ slightly, with any possible limitation for spiral mode.
IAEA-CN-85-201
199
The principal advantages of this technique are:
�� the elimination of motion artifacts,
�� the use of less contrast media,
�� the shortened examinations times,
�� the new reconstructions and data presentations available through workstation
technologies.
The applications of thoracic helical CT [2]. Helical CT depicts small pulmonary nodules not
seen at conventional CT by elimination of respiratory loss of registration. Pulmonary lesions
can be analysed in detail using retrospective reconstruction of the data volume. Multiplanar
and three-dimensional images of lung mass and arteriovenous malformations are free of
motion artifacts. In comparison to conventional CT, helical CT provides a more consistent
level of vascular enhancement because of the shortened acquisition time.
2. Materials and methods
Thermoluminescence dosimetry
To measure organ doses, we have used thermoluminescence dosimeters, and the material
employed is available as TLD-100 (FLi:Mg,Ti with 7,5% of 6Li and 92,5% of
7Li). The
selected form of TLD is a small cylindrical rod (1mm diameter y 6 mm high), the most
appropriate geometry to CT dosimetry.
Dosimeters calibration was made at the Centro Nacional de Dosimetría (National Dosimetry
Center) in Valencia, Spain. The dosimeters were irradiated with photons generated by x-ray
equipment with the code D-120: x-ray tube potential of 120 kVp, the mean photon energy is
54 keV, the first half value lawyer is 4,33 mm of Al and the second one is 6,84 mm of Al.
Kerma in air and air as medium was 10,14 � 0,36 mGy over the surface of phantom with
dimensions 295 x 295 x 153 mm3, but without phantom.
The thermoluminescence dosimeter reader is the a Harshaw 5500 (Bicron-Harshaw, USA),
including user interface, acquisition, storage and retrieval of TLD data and application
software are performed in a separate computer.
The TLDO (PTW- Freiburg, Germany) Annealing Oven is controlled by a programmable
microprocessor with profiles for annealing and preheating cycles.
In this study, we have used 243 TLD dosimeters in each thoracic CT examinations.
The Rando phantom
The Rando phantom (New York Laboratory), is one of the most used physical phantom
simulating the head and trunk of an average male adult.
The most realistic tissue substitutes for use in phantom construction are probably those based
on epoxy resins, which effective atomic number is 7.30 and density 0,985 g cm-3
. Its weight is
73,5 kg and its height 175 cm.
The Rando phantom consists of 25 mm thick transverse slices containing each of theme
rectangular grid of plugs which can be replaced by capsules containing TLDs.

IAEA-CN-85-201
200
In conventional and helical CT, TLD were located on the surface of the patient, in the slice at
the Rando phantom, in the middle of the longitudinal dimension of the irradiated volume.
Examinations: sequential and helical CTs.
This study presents the dosimetric results obtained during computed tomography thorax
examinations, carried out using two different techniques, sequential and helical CT with a
helical CT scanner (Tomoscan AV, Philips).
Table 1. Sequential technique in thoracic examinations
Parameters Reference
Number of scans 20
Slice collimation 10 mm
Scan increment 10 mm
Voltage 120 kVp
Tube current*scan time (one rotation) 280 mAs
The performance of helical CT requires several user-defined parameters that exceed the
requirements of conventional CT. One needs to carefully selects the collimation, table
increments and reconstruction interval. The miliampere-second is for the whole examination.
Pitch (dimensionless) is the table feed per 360� rotation divided by the slice thickness.
Table 2. Helical technique in thoracic examinations
Parameters Reference
Scan range 20 cm
Slice collimation 10 mm
Pitch 1
Voltage 120 kVp
Tube current*scan time (spiral) 5600 mAs
3. Results and discussion
Table 3 shows the organ doses with two different techniques: sequential and helical.
Table 3. Absorbed Doses in organs (mGy)*
Organs Sequential Helical
Thyroid 2,4 � 0,7 2,5 � 0,6
Oesophagus 5,8 � 0,5 7,4 � 0,6
Red bone marrow 7,0 � 4,0 7,0 � 5,0
Breastbone 14,2 � 1,3 14,6 � 1,1
Ribbons 12,0 � 2,0 11,0 � 2,0
Heart 9,0 � 4,0 9,0 � 5,0
Center of patient 14,0 � 5,0 14,0 � 5,0
Lungs 11,0 � 2,0 12,0 � 2,0
Surface (skin) 23,0 � 3,0 21,0 � 2,0
*Mean � Standard deviation

IAEA-CN-85-201
201
Our results are in agreement with McNitt-Gray et al [3].
The comparison of the dosimetric data obtained using the two different techniques shows that
there is not any relevant difference between them as far as the surface dose and the doses
received by the organs of interest.
References
[1] KALENDER, WA. Principles and Performance of Spiral CT. AAPM Summer School,
(1995).
[2] COSTELLO, P. Thoracic helical CT. Radiographics 14 (1994) 913 - 918.
[3] MCNITT-GRAY MF, CAGNON CH. Radiation dose in Spiral CT: The relative effects
of collimation and pitch. Med Phys 26 (1999) 409 - 414.
[4] EUROPEAN COMMISSION; Quality criteria for Computed Tomography. EUR 16262,
EC, Luxembourg (1999).
[5] HUDA, W., SCALZETTI, E.M., ROSKOPF, M.L., Effective doses to patients
undergoing thoracic computed tomography examinations, Medical Physics 27 (2000)
838 - 844.
[6] ROTHENBERG LN, PENTLOW KS. Radiation dose in CT. Radiographics 12 (1992)
1225 - 1243.
[7] SHRIMPTON, P.C., EDYVEAN, S., CT scanner dosimetry, British Journal of
Radiology 71 (1998) 1 - 3.

IAEA-CN-85-63
202
HOW WILL THE INTRODUCTION OF MULTI-SLICE CT AFFECT
PATIENT DOSES?
W. Huda
Department of Radiology, SUNY Upstate Medical University, Syracuse, New York, USA
P.J. Mergo
Department of Radiology, University of Florida, Gainesville, Florida, USA
Abstract
Imaging protocols for patients undergoing CT examinations on a conventional single section scanner (GE CT/i)
were compared with those developed after a multi-slice scanner (GE LightSpeed) was introduced into clinical
practice. For multi-slice CT, the reduction in patient scan time was a more than a factor of two for head scans,
and approximately 25% for body scans. The number of images available for review on the multi-slice CT system
increased by approximately 40%. Use of this multi-slice CT scanner resulted in an effective dose of 1.2 mSv for
head examinations and 9.1 mSv for body examinations. The increase in patient effective dose after the
introduction of multi-slice CT was approximately 30% for head CT examinations and 150% for body
examinations. Higher patient doses were due to a shorter CT geometry, x-ray beam profiles that are greater than
the detector width, and the use of a pitch ratio of only 0.75. Since multi-slice CT offers major reductions in scan
time as well as improved image quality, it is anticipated that both individual and collective doses from CT will
continue to increase for the foreseeable future.
1. Introduction
Multi-slice CT systems, which were introduced into routine clinical work in 1999 [1],
significantly improve utilization of the x-ray tube output. These multi-slice systems typically
use multiple detectors that can cover between 20 mm and 40 mm of axial distance, and can
acquire four simultaneous sections for each 360� revolution of the x-ray tube. In this study, we
investigated the how the introduction of multi-slice CT affected radiation doses to patients
undergoing head and body CT examinations.
2. Method
2.1. CT scanners. We compared the protocols used for patients undergoing CT examinations
on a conventional single section scanner (GE CT/i) with those introduced after a multi-slice
scanner (GE1 LightSpeed) was installed at the University of Florida. The single section
scanner generated axial sections for head CT scans, whereas spiral CT was used for chest and
abdomen examinations. The LightSpeed was operated in axial mode for head imaging, and in
helical mode with a pitch ratio of 0.75 for body imaging (i.e., collimator is 20 mm & table
increment of 15 mm per 360� x-ray tube rotation).
Computed Tomography Dose Index (CTDI) data are shown in summary form in Table 1. The
CT/i dose data are for a section thickness of 10 mm, and the LightSpeed data are for four 5
mm sections (� 20 collimator thickness). These data show that for the same techniques
(kVp/mAs), the LightSpeed has a 20% higher head dose and 40% higher body dose.
1 General Electric Medical Systems, Milwaukee, WI.
IAEA-CN-85-63
203
Table 1. CTDI doses for the CT/i and LightSpeed scanners (@ 120 kVp and 340 mAs)
Phantom size Location CTDI for CT/i CTDI for LightSpeed
Head Periphery 40 mGy 48 mGy
Head Center 40 mGy 48 mGy
Body Periphery 20 mGy 32 mGy
Body Center 11 mGy 14 mGy
2.2. Spiral/Axial protocols. Head CT scans were performed at 120 kVp using axial scans. In
the posterior fossa, 15 sections (3 mm thick) were obtained with a table increment distance of
5 mm, a tube current of 200 mA and a scan time of 2 seconds. The rest of the brain was
covered using 8 sections (10 mm thick) with a table increment of 10 mm, a tube current of
140 mA and a scan time of 2 seconds.
Chest CT scans were performed at 120 kVp in helical mode with a pitch ratio of 1.5. In the
shoulder region, approximately 10 x 7 mm sections were acquired using 400 mA and in the
lung region, 50 x 7 mm sections were acquired using 230 mA. The scan time was 1 second,
and the total coverage length (420 mm) required 41 rotations of the x-ray tube. Abdominal CT
scans were performed at 120 kVp in helical mode with a pitch ratio of 1.5. A total of 36 x 7
mm sections were acquired using 320 mA and a scan time of 1-second which required 25 x-
ray tube rotations.
2.3. Multi-slice protocols. With the introduction of multi-slice, CT imaging typically uses 4 x
5 mm thick detector which acquire data for four images in one rotation of the x-ray tube (1
second). Total z-axis coverage distance remained the same as for single slice CT, with all
scans performed at 120 kVp. Head CT scans used 140 mA and 2 seconds and contiguous
sections. Total axial distance covered (155 mm) requires 8 rotations of the x-ray tube. Chest
CT scans have a 1-second scan time with the shoulder region using 400 mA and the lung
region using 220 mA. The scan length of 420 mm requires a total of 29 rotations at a pitch of
0.75. Abdomen CT scans are performed using 240 mA and a 1-second scan time, and require
18 rotations of the x-ray tube.
2.4. Patient doses. Patients undergoing CT examinations were modeled as uniform cylinders
of water with a diameter of 17.6 cm for the head [2], 21 cm for the chest [3] and 27.7 cm for
the abdomen [4]. The mean dose for a single section for the CT/i was obtained using
published Monte Carlo dosimetry data [5]. CT/i mean section dose data were scaled for the
LightSpeed using a factor of 1.2 for head CT scans, and 1.4 for body CT scans.
Mean section dose data were used to compute the energy imparted for a single section [6]
using CTDI data given in Table 1. The total energy imparted to a patient was obtained by
taking into account the mAs, scanned section thickness and total number of rotations of the x-
ray tube. Energy imparted was converted into the corresponding values of effective dose using
conversion factors of 9.1 mSv/J for a head CT examination and 18 mSv/J for a body CT
examination [7].
3. Results
3.1. Scan times/images. Table 2 shows the scan times and total number of images generated
for the conventional and multi-slice CT scanners. For multi-slice CT, the reduction in patient

IAEA-CN-85-63
204
scan time was a more than a factor of two for head scans, and 25% for body scans. The
average number of images from the multi-slice CT system increased by approximately 40%.
Table 2. Scan times and # of images for spiral/axial and multi-slice CT
Examination type Spiral/Axial Multi-slice
Head ~70 seconds/23 images ~30 seconds/32 images
Chest ~40 seconds/60 images ~30 seconds/84 images
Abdomen ~25 seconds/36 images ~20 seconds/50 images
3.2. Effective doses. Table 3 provides a summary of the effective doses for the three types of
CT examination for the conventional and multi-slice CT scanners. Current multi-slice CT
scanners result in average effective dose of 1.2 mSv for head examinations and 9.1 mSv for
body examinations. The average increase in patient effective dose from the introduction of
multi-slice CT was approximately 30% for head CT examinations and 150% for body
examinations.
Table 3. Radiation dose summary for spiral/axial and multi-slice CT.
Examination type Spiral/Axial Multi-slice
Head 0.9 mSv 1.2 mSv
Chest 3.9 mSv 10.5 mSv
Abdomen 3.5 mSv 7.7 mSv
4. Discussion
Published CTDI doses for the LightSpeed are between 20% and 40% higher, which is partly
due to a shorter geometry. The increased CTDI value is also due to the use of wide x-ray beam
profiles which are needed to maintain a constant radiation dose for an irradiated section whilst
the focal spot moves during the rotation of the x-ray tube [1, 8]. In the future, it can be
expected that the multi-slice CT systems will be designed to have collimation systems that
move with the focal spot size [8], which will help ensure that no unnecessary radiation is
incident on the patient.
Another important reason for higher patient doses on the LightSpeed system is because of the
use of a low pitch ratio in helical scanning (i.e., 0.75). The LightSpeed system offers a pitch
ratio of 1.5, and use of this scanning mode would reduce patient effective doses by a factor of
two! In the future, it is likely that pitch ratios � 1.0 will be used, which will help to reduce
patient doses. Nonetheless, patient doses for multi-slice CT will still likely be larger than for
single slice CT systems. Multi-slice systems have thinner sections, and the mAs will need to
be increased to maintain a constant level of quantum mottle. In addition, the increased
utilization of the x-ray tube output results in shorter scan times allowing higher tube currents
to be used.
In the United Kingdom, CT examinations have been reported to account for 4% of all
radiographic examinations, yet account for up to 40% of the collective dose from medical
exposure [9]. It is notable that multi-slice CT reduces scan times, improves z-axis resolution
and provides the radiologists with more images. In the future, CT scans performed on a given
patient are therefore likely to use more radiation (e.g., multi-phase liver scans or general body
surveys). In addition, the improved imaging performance will also serve to have CT replace

IAEA-CN-85-63
205
conventional radiographic examinations [10, 11]. The data presented here indicate that
individual and collective patient effective doses from CT examinations are likely to continue
to increase for the foreseeable future. It is therefore important that the radiology profession
reviews patient scanning protocols to ensure that patient exposures are justified by the
diagnostic information that is obtained during CT examinations, and that all radiation doses
are kept as low as reasonably achievable (ALARA).
Acknowledgements
The authors are grateful to Dr. Neil Bromberg for supplying the CTDI data. Robert Rothermel
RT and William Garrisi RT are thanked for their technical assistance with CT protoocls.
References
[1] McCOLLOUGH, C.H., ZINK, F.E., Performance evaluation of a multi-slice CT system,
Medical Physics 26 (1999) 2223-2230.
[2] HUDA, W., CHAMBERLAIN, C.C., ROSENBAUM, A.E., GARRISI, W. Radiation
doses to infants and adults undergoing head CT examinations, Submitted to Medical
Physics.
[3] HUDA, W., SCALZETTI, E.M., ROSKOPF, M.L., Effective doses to patients
undergoing thoracic computed tomography examinations, Medical Physics 27 (2000)
838-844.
[4] WARE, D.E., HUDA, W., MERGO, P.J., LITWILLER, A.L., Radiation effective doses
to patients undergoing abdominal CT examinations, Radiology 210 (1999) 645-650.
[5] HUDA, W., ATHERTON, J.V., WARE, D.E., CUMMING, W.A., An approach for the
estimation of effective radiation dose at CT in pediatric patients, Radiology 203 (1997)
417-422.
[6] HUDA, W., ATHERTON, J.V., Energy imparted in computed tomography, Medical
Physics 22 (1995) 1263-1269.
[7] ATHERTON, J.V., HUDA, W., Energy imparted and effective doses in computed
tomography, Medical Physics 23 (1996) 735-741.
[8] TOTH, T.L., BROMBERG, N.B., PAN, T-S., RABE, J., WOLOSCHEK, S.J., LI, J.,
SEIDENSCHNUR, G.E., A dose reduction x-ray beam positioning system for high
speed multislice CT scanners, Medical Physics (In press).
[9] SHRIMPTON, P.C., EDYVEAN, S., CT scanner dosimetry, British Journal of
Radiology 71 (1998) 1-3
[10] JACKMAN, S.V., POTTER, S.R., REGAN, F., JARRETT, T.W., Plain abdominal x-
ray vs computerized tomography screening: sensitivity for stone localization after
nonenhanced spiral computerized tomography. J Urol 164 (2000) 308-10
[11] LIU, W, ESLER, S.J., KENNY, B.J, et al., Low-dose nonenhanced helical CT of renal
colic: assessment of ureteric stone detection and measurement of effective dose
equivalent. Radiology 215 (2000) 51-54.
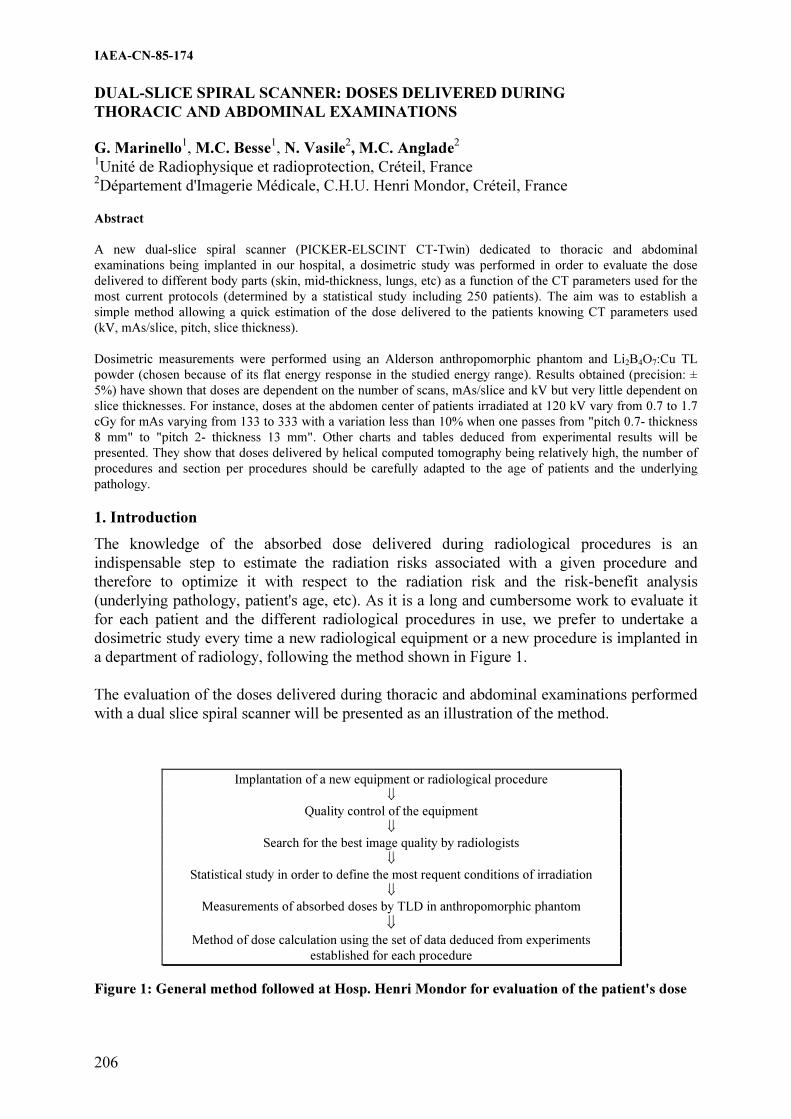
IAEA-CN-85-174
206
DUAL-SLICE SPIRAL SCANNER: DOSES DELIVERED DURING
THORACIC AND ABDOMINAL EXAMINATIONS
G. Marinello1, M.C. Besse
1, N. Vasile
2, M.C. Anglade
2
1Unité de Radiophysique et radioprotection, Créteil, France
2Département d'Imagerie Médicale, C.H.U. Henri Mondor, Créteil, France
Abstract
A new dual-slice spiral scanner (PICKER-ELSCINT CT-Twin) dedicated to thoracic and abdominal
examinations being implanted in our hospital, a dosimetric study was performed in order to evaluate the dose
delivered to different body parts (skin, mid-thickness, lungs, etc) as a function of the CT parameters used for the
most current protocols (determined by a statistical study including 250 patients). The aim was to establish a
simple method allowing a quick estimation of the dose delivered to the patients knowing CT parameters used
(kV, mAs/slice, pitch, slice thickness).
Dosimetric measurements were performed using an Alderson anthropomorphic phantom and Li2B4O7:Cu TL
powder (chosen because of its flat energy response in the studied energy range). Results obtained (precision: ±
5%) have shown that doses are dependent on the number of scans, mAs/slice and kV but very little dependent on
slice thicknesses. For instance, doses at the abdomen center of patients irradiated at 120 kV vary from 0.7 to 1.7
cGy for mAs varying from 133 to 333 with a variation less than 10% when one passes from "pitch 0.7- thickness
8 mm" to "pitch 2- thickness 13 mm". Other charts and tables deduced from experimental results will be
presented. They show that doses delivered by helical computed tomography being relatively high, the number of
procedures and section per procedures should be carefully adapted to the age of patients and the underlying
pathology.
1. Introduction
The knowledge of the absorbed dose delivered during radiological procedures is an
indispensable step to estimate the radiation risks associated with a given procedure and
therefore to optimize it with respect to the radiation risk and the risk-benefit analysis
(underlying pathology, patient's age, etc). As it is a long and cumbersome work to evaluate it
for each patient and the different radiological procedures in use, we prefer to undertake a
dosimetric study every time a new radiological equipment or a new procedure is implanted in
a department of radiology, following the method shown in Figure 1.
The evaluation of the doses delivered during thoracic and abdominal examinations performed
with a dual slice spiral scanner will be presented as an illustration of the method.
Implantation of a new equipment or radiological procedure
�
Quality control of the equipment
�
Search for the best image quality by radiologists
�
Statistical study in order to define the most requent conditions of irradiation
�
Measurements of absorbed doses by TLD in anthropomorphic phantom
� Method of dose calculation using the set of data deduced from experiments
established for each procedure
Figure 1: General method followed at Hosp. Henri Mondor for evaluation of the patient's dose

IAEA-CN-85-174
207
2. Materials and method
2.1. CT equipment
A whole body dual-slice spiral computed tomography (CT) CT-Twin PICKER-ELSCINT was
used. It permits rapid scanning of a large volume of tissue, the X-ray tube rotating
continuously in a circular motion while the patient is transported on a table at a constant
velocity through the center of the circle, so that the X-ray beam describes a spiral path through
the patient �1�. Moreover the CT-Twin offers the particularity to have a wide fan beam of X-
rays striking two side-by-side parallel arcs of detectors, producing a double spiral of spatial
information. Data are interpolated from the raw data collected with the two detectors arrays.
Such CT permitting to achieve faster scanning compared single-slice spiral ones �2� are
relatively new so that only a few dosimetric data are available for them.
Irradiation parameters used for the present study were:
�� Helix mode, i.e. dual-slice spiral mode
�� Scan diameter 430 mm
�� Voltages: 120 and 140 kV
�� Number of mAs/slice varying from 100 to 333
�� Pitch values (defined as the table feed distance per 360° rotation divided by the nominal
section thickness): 0.75, 1 and 2
�� Slice thickness varying from 8.8 to 13 mm.
They cover all the range of irradiation parameters noted in the files of 250 patients submitted
to thoracic and abdominal examinations.
2.2. Phantom
Experiments have been performed by simulating patients of average size with an
anthropomorphic phantom type ALDERSON and irradiating it in the different conditions used
for patients (see §2.1). In order to improve the accuracy, multiple scans on the same area have
sometimes been made, and the dose obtained divided by the number of scans.
2.3. Thermoluminescent dosimetry (TLD)
Experiments were performed using Li2B4O7:Cu TL powder �3� chosen because of its energy
response better than LiF in the energy range of diagnostic radiology �4, 5�. As an indication,
the mass energy absorption ratio of Li2B4O7:Cu and Lif to tissue in the energy range 20 to 200
keV, vary of 11% and 43%, respectively.
TL powder was spread out in very thin envelops made of black paper and stuck at the entrance
and exit surface of the Alderson phantom (for evaluation of the skin doses), or contained in
opaque cylindrical containers which were inserted in the holes of the phantom for evaluation
of the dose at mid-thickness or within the organs). Previously to experiments a direct
calibration of the powder under both the presentations have been carried out by comparing its
response to the response of a calibrated ionization chamber specially dedicated to low-energy
X-rays.
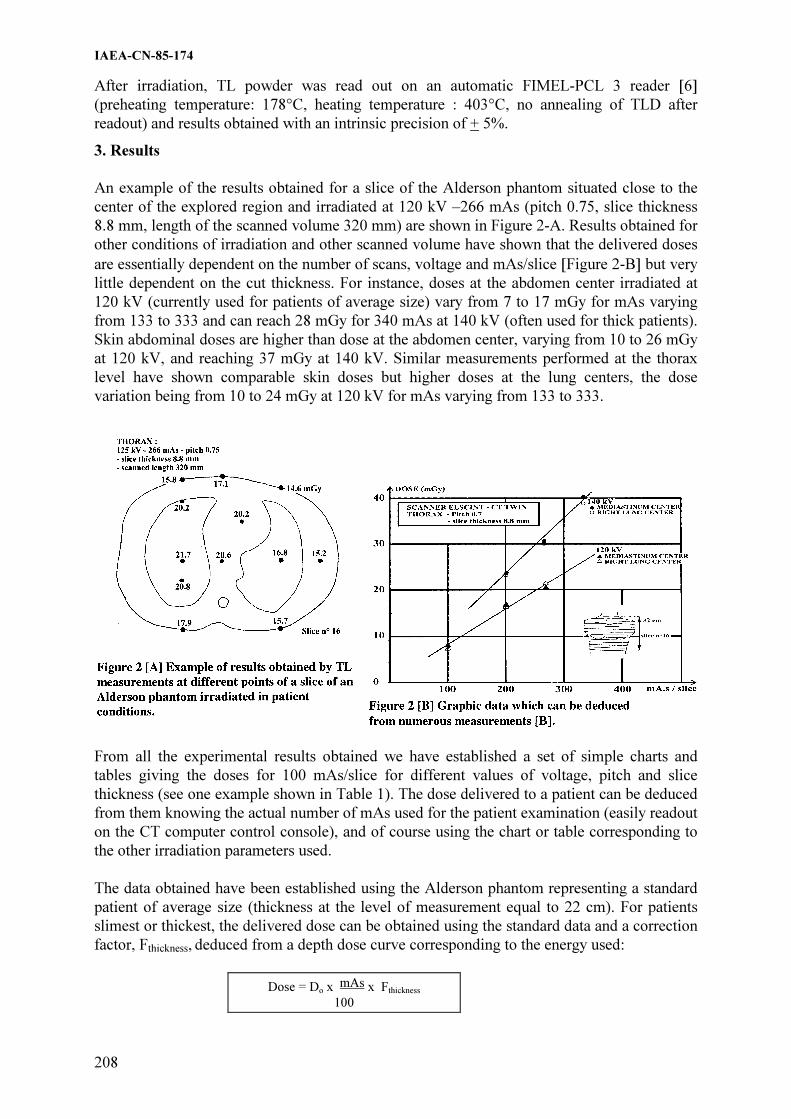
IAEA-CN-85-174
208
After irradiation, TL powder was read out on an automatic FIMEL-PCL 3 reader �6�
(preheating temperature: 178°C, heating temperature : 403°C, no annealing of TLD after
readout) and results obtained with an intrinsic precision of + 5%.
3. Results
An example of the results obtained for a slice of the Alderson phantom situated close to the
center of the explored region and irradiated at 120 kV –266 mAs (pitch 0.75, slice thickness
8.8 mm, length of the scanned volume 320 mm) are shown in Figure 2-A. Results obtained for
other conditions of irradiation and other scanned volume have shown that the delivered doses
are essentially dependent on the number of scans, voltage and mAs/slice �Figure 2-B� but very
little dependent on the cut thickness. For instance, doses at the abdomen center irradiated at
120 kV (currently used for patients of average size) vary from 7 to 17 mGy for mAs varying
from 133 to 333 and can reach 28 mGy for 340 mAs at 140 kV (often used for thick patients).
Skin abdominal doses are higher than dose at the abdomen center, varying from 10 to 26 mGy
at 120 kV, and reaching 37 mGy at 140 kV. Similar measurements performed at the thorax
level have shown comparable skin doses but higher doses at the lung centers, the dose
variation being from 10 to 24 mGy at 120 kV for mAs varying from 133 to 333.
From all the experimental results obtained we have established a set of simple charts and
tables giving the doses for 100 mAs/slice for different values of voltage, pitch and slice
thickness (see one example shown in Table 1). The dose delivered to a patient can be deduced
from them knowing the actual number of mAs used for the patient examination (easily readout
on the CT computer control console), and of course using the chart or table corresponding to
the other irradiation parameters used.
The data obtained have been established using the Alderson phantom representing a standard
patient of average size (thickness at the level of measurement equal to 22 cm). For patients
slimest or thickest, the delivered dose can be obtained using the standard data and a correction
factor, Fthickness, deduced from a depth dose curve corresponding to the energy used:
Dose = Do x mAs x Fthickness
100

IAEA-CN-85-174
209
Table 1. ELSCINT – CTTWIN ( Helix mode)
Doses (mGy) for 100 mAs/slice
(Pitch = 0.75 – slice thickness = 8.8 mm
and length scanned = 320 mm)
Voltage THORAX *
kV Skin Mediastinum Lung Center
Right Left
120 6.1 8.1 8.1 6.7
140 9.1 11.9 11.9 10.2
* Measurements performed with slice n°16 (Alderson phantom)
Validity of results obtained using the above formula has been checked experimentally using
TLD method.
4. Conclusion
When the radiological procedures are clearly defined and currently practiced in a department
of radiology, it is possible to establish a set of simple charts and tables allowing a quick and
fairly accurate estimation of the dose delivered to each patient. TLD has been shown a good
tool to obtain such data which must be available for the different anatomical sites explored.
The work could be considered as cumbersome but data are determined just once for a given
protocol and then used for a great number of patients as long as the radiological protocol
remains unchanged.
Experimental results obtained have also shown that doses delivered by helical computed
tomography using dual-slice helix mode were comparable to doses delivered at the thorax
level by other type of CT scanners �1, 7�. As they are relatively high, the number of
procedures must not be increased even though the helix mode has improved the image quality
and made CT faster. The length of the examined volume should be also carefully adapted to
the underlying pathology.
References
[1] BUSHBERG, J.T., SEIBERT, J.A., LEIDHOLDT, E.M. and BOONE, J.M., The essential
physics of medical imaging, Williams and Wilkins, Baltimore (1994), chapter 10, 728 pp.
[2] �LIANG, Y., and KRUGER, R.A., Dual-slice spiral versus single-slice spiral scanning:
comparison of the physical performance of two computed tomography scanners, Med. Phys. 23
(1996) 205-220.
[3] VISOCEKAS, R., LORRAIN, S. and MARINELLO, G., Evaluation of a preparation of
Li2B4O7:Cu for thermoluminescence dosimetry, Nucl.Sc. 22 ( 1985), 61-66.
[4] BASSI, P., BUSUOLI G., and RAIMON O., Calculated energy dependence of some RTL and
RPL detectors, Int. J.Appl. Radiat. Isot. 27 ( 1976), 291-305.
[5] WALL, B.F., DRISCOLL, C.M.H., STRONG, J.C. and FISCHER, E.S., The suitability of
different preparations of thermoluminescent borate for medical dosimetry. Phys.Med.Biol. 27
(1982) 1023-1034.
[6] MARINELLO, G., BARTHE, J., POLLACK J. and PORTAL, G, "PCL", a new automatic fast
reader suitable for in vivo dosimetry, Radiother. Oncol. 25 (1992), 63-66.
[7] MINI, RL., VOK, P., MURY R. and Col., Radiation exposure of patients who undergo CT of
the trunk, Radiology (1995), 195, 557-562.

IAEA-CN-85-39
210
PATIENT DOSES FOR COMPUTED TOMOGRAPHY IN HUNGARY
S. Pellet, L. Ballay, A. Motoc, D. Heissler, A. Temesi National Research Institute for Radiobiology and Radiohygiene, Budapest, Hungary F. Giczi Györ-Moson-Sopron County Institute of National Public Health and Medical Officer Service, Györ, Hungary Abstract
The latest initiative of the National Patient Dose Evaluation Program was an overall evaluation of patient doses
for computed tomography. The aim of the survey was to collect data from which the patient doses of the CT
examination of different body parts can be estimated and the most important technical parameters affecting on the
patient exposures can be evaluated. The 54 CT scanners in clinical use in Hungary can be categorized into 31
different models from 8 manufacturers. Per caput frequency for CT is about 62.3 examinations per 1000
inhabitants. 59% of all examinations are connected to the head imaging. The highest mean effective dose arising
from the chest and pelvis examinations, 6.98 mSv and 6.64 mSv, respectively. The yearly collective effective
dose has been estimated at about 1700 manSv. This total dose is as much as the figure of 1785 manSv previously
assessed for photofluorography applied in mass chest screening in Hungary.
1. Introduction
The results of surveys from the most developed countries show that the frequency of CT examinations and consequently the collective dose are increasing steadily, constituting a significant part of the collective dose of the population arising from the medical applications of ionizing radiation [1-3]. Diagnostic importance of CT examinations is outstanding, so the increase of examination frequency is justified. According to the International Commission on Radiological Protection (ICRP) dose limits should not be applied for medical exposures either diagnostic or therapy, because patients have direct benefit from the exposure. However according to the basic principles of radiation protection the medical diagnostic procedures should be optimized and unjustified exposures should be minimized [4,5]. Since the beginning of the eighties computed tomography (CT) plays a significant role in medical diagnostics in Hungary too. According to the records there are 54 CT scanners in clinical use in Hungary which can be categorized into 31 different models from 8 manufacturers. 2. Methods In the two stages of the survey program scanner specific dosimetric data and examination specific data were collected. Free-in-air and phantom doses were measured by a special pencil-shaped ionization chamber coupled to the electrometer (type 1015 10.3CT, Radcal Corp., California, USA). The phantom measurements were made in PMMA head and body phantoms - 16 cm and 32 cm diameter, respectively - at the center of the phantom and at 10 mm beneath the surface. In addition to the phantom measurements, free-in-air measurements in the rotation center were made. According to the minimum survey program, the dose measurements were made on the two most frequently used tube voltages, at the minimal, the maximal and 2 mm slice thickness. At

IAEA-CN-85-39
211
workplaces where we had more time this dose collection program were extended to additional slice thickness. The clinical performance was investigated by monitoring all CT examinations during one week, comprising all relevant technical and clinical data. The collected data were partly patient related: sex, year of birth, body height and weight of the patient, diagnostic purpose of the examination, body region examined and use of contrast agent. The exposure related data were as follows: scan mode (axial or spiral), gantry tilt angle, tube voltage and loading, slice thickness, table movement increment or pitch factor, number of scans and the start position of the scans. From the measured dosimetric data the Computed Tomography Dose Indexes, nCTDIair and the nCTDIw,body were calculated on each relevant tube voltage and slice thickness. The CTDI for each patient examination was calculated from the relevant value of nCTDIw,body data multiplied it by the tube loading C used in the patient examination. The CTDI gives the average dose per slice to the patient. The dose-length product (DLP) was calculated from the CTDI multiplied it by the slice thickness and the number of slices [6,7]. The effective dose of patient exposure was calculated applying the normalized values of effective dose per dose-length product over various body regions. 3. Results
Typical patient attendance for individual scanners varied in a wide range with a mean for the sample of around 110 patients per week. These data indicate an annual total of 623000 CT examinations in 1999 from the 54 scanners in operation, involving 303000 patient attendance. It is an important fact that in our survey a CT examination means a sequence of scans with identical technical parameters of tube voltage, tube loading, slice thickness, etc. The corresponding per caput frequency for CT is about 62.3 examinations per 1000 inhabitants. Frequency data for different types of examination shows that 59% of all examinations are connected to the head imaging (see Figure 1.). The next most important region of the body in terms of examination frequency is the abdomen, which represents 23% of all examinations, with smaller contributions from the chest (12%), and pelvis (4%). Representative information on the age and sex of patients undergoing CT has been obtained from a sample of 2052 patient records. The shapes of general distribution for patients undergoing CT indicate a bias towards relatively elderly persons compared with the general population. The average age of CT patients and the general population of Hungary is 54 and 39 years, respectively. The percentages of CT patients aged over 43 years and over 64 years are 75% and 25%, respectively. The significant number of older CT patients has important implications for the expression of delayed radiation effects. The 49% of CT patients were male and 51% of them were female.

IAEA-CN-85-39
212
0 10 20 30 40 50 60 70
Head
Neck
Chest
Abdomen
Pelvis
Others
% contribution
Frequency Collective dose
Figure 1. Contribution to CT practice by examination type
Effective dose from CT by examination type can be seen in Figure 2. The highest mean effective dose arising from the chest and pelvis examinations was and 6.64 mSv and 6.98 mSv respectively. There is no significant difference between these figures. The CT examinations of the abdominal region cause about 3.7 mSv mean effective dose. The CT examinations of the head performed with the highest frequency account for only 0,83 mSv mean effective dose.
0,83
2,88
6,64
3,73
6,98
2,46
0 2 4 6 8
Head
Neck
Chest
Abdomen
Pelvis
Total
mSv
Figure 2. Effective dose from CT by examination type
A relatively wide variation can be observed in mean effective doses for examinations between workplaces, which can be explained by the variations in inherent parameters of scanners, the technical parameters and the frequency distribution of different type of examinations. The collective effective dose from the 54 scanners operating in Hungary in 1999 has been estimated at about 1700 man Sv. This total dose is as much as the figure of 1785 man Sv

IAEA-CN-85-39
213
previously assessed for photofluorography applied in mass chest screening in Hungary [8]. The consequent average effective dose per CT examination of about 2.5 mSv was estimated (see Figure 2). Consequently, each scanner gives rise to a collective dose of about 32 man Sv a year. Contributions to the collective effective dose from CT by examination type can be seen in Figure 1. Whereas examinations of the head represent nearly 60% of all CT examinations, they account for only 20% of the collective dose, which is dominated by examinations of the abdomen and the chest. References
[1] P. C. SHRIMPTON, B. F. WALL; CT – an increasingly important slice of the medical
exposure of patients The British Journal of Radiology, 66 (1993), 1067-1068.
[2] J G VAN UNNIK, J J BROERSE, J GELEIJNS, J TH M JANSEN, J ZOETELIEF AND D ZWEERS; Survey of CT techniques and absorbed dose in various Dutch
hospitals The British Journal of Radiology, 70 (1997), 367-371.
[3] D. GOSCH, R. KLOEPPEL, S. LIEBERENZ AND H.-G. SCHULZ; Radiation exposure in computed tomography Radiation Protection Dosimetry, Vol. 80, Nos. 1-3. pp. 167-169 (1998).
[4] 1990 Recommendations of the International Commission on Radiological Protection. ICRP Publication 60. Annals of ICRP, Volume 21 No. 1-3. Pergamon Press, Oxford, 1991.
[5] International Basic Safety Standards for Protection against Ionizing Radiation and for the Safety of Radiation Sources, Safety Series No. 115., International Atomic Energy Agency, Vienna, 1996.
[6] P. C. SHRIMPTON, K. A. JESSEN, J. GELEIJNS, W. PANZER AND G. TOSI; Reference doses in computed tomography. Radiation Protection Dosimetry, Vol. 80 Nos.1-3 pp. 55-59 (1998).
[7] European Commission Study Group; Quality criteria for computed tomography. EC Working Document EUR 16262. Brussels: EC, 1998.
[8] S. PELLET, F. GICZI, L. BALLAY L., A. MOTOC, ZS. PÉCSI, A. TEMESI; Hungarian Patient Dose Survey for Photofluorography Applied in a Mass Chest Screening Program Radiation Protection Dosimetry, Vol. 80, Nos. 1-3. pp. 115-116 (1998).

IAEA-CN-85-141
214
RADIATION DOSE AND QUALITY CONTROL IN FLUOROSCOPY AND
COMPUTED TOMOGRAPHY SCANNING
K. Wei, B. Yue, Q. Zhou, Y. Cheng, C. Hou, L. Ge, X. Qi
Laboratory of Industrial Hygiene, Beijing, China
Abstract
The total of 16 fluoroscopic units were selected in this study. Basic QC tests were performed on all the units with
RMI QC kit and a TRI SOLIDOSE 400 dosimeter. 20 patients for 4 fluoroscopic units were selected for barium
meal (upper GI) and the doses were measured using two calibrated DAP meters (a RTI DOSEGUARE 100 and a
FJ 2020). 3 CT scanner were selected in this study. The QC tests were made with VICTOREEN CT performance
phantoms. The doses were measured with pencil ionization chamber and standard head/body phantoms. The dose
profile and CTDI in free air were measured using a set of 36 LiF chips inside a specific holder. The results of QC
tests for 16 fluoroscopic and 3 CT units reveal that most performance parameters are satisfactory. The DAP
values varied from 8 to 48 Gycm2 with an average value of 21 Gycm2. According to chest examination procedure
used and CT characteristics, weighted CTDIw, Dose-Length product (DLP) and effective dose (E) for 15 patients
were estimated. The average values of them were 29mGy, 612mGycm and 10 mSv respectively. The conclusion
from this study was drawen that possible to choose dose reference level can be valid worldwide for all X-ray
examinations.
1. Introduction
A co-ordinated research programme (CRP) in 9 countries of Asia and Far East with IAEA,
entitled “Radiation Dose in Diagnostic Radiology and Methods for Dose Reduction”, has been
launched since 1994. The aim of the project was to explore the potential for dose reduction for
some types of X-ray examination [1], to assess whether available dose reference values could
be applied in Asia region [2].
The programme of four years has been instituted in two phases.
The first phase of the CRP dealed with conventional radiographic units and the second phase
with fluoroscopy and computed tomography. This paper reports work on second phase of the
CRP.
2. Materials and methods
The fluoroscopic systems selected in the programme included: 3 mobile C-arm systems, 12
remote control tables, and 1 system without image intensifier. The total 16 units were selected
from 4 hospitals.
The service lives of CT scanners selected in the programme are: 2 years for 1 CT, 4 years for
1CT and 5 years for 1 CT.
The 2nd round of intercomparison and calibration of TLD systems was finished in January
1998. 50 chips of China-made LiF-TLD were sent to National Radiation Laboratory (NRL) in
New Zealand which was responsible for the TLD intercomparison and calibration [3].
The quality control(QC) tests for fluoroscopic units were made with RMI QC kit. The dose
and dose rate for the fluoroscopic units were measured with the PTW DIADOS and TRI
Solidose 400 dosimeters.
Five patients per hospital(room) were selected for barium meal(upper GI) fluoroscopic
examinations and the dose was measured using a calibrated DAP meter consisting of made
Sweden RTI DOSEGUARD 100, or China made FJ2020.

Tab
le I
. Q
uali
ty c
on
trol
mea
sure
men
ts o
n f
luoro
scop
ic u
nit
s
Para
met
ers
(tole
ran
ces
ind
icate
d w
ith
*)
A/1
A
/2
A/3
A
/4
A/5
A
/6
A/7
B
/1
B/2
B
/3
B/4
B
/5
C/1
C
/2
C/3
*
D/1
kV
Acc
ura
cy(1
0%
)*
NM
A
N
M
NM
A
A
A
A
A
N
M
A
A
A
A
NA
A
HV
L, m
m o
f A
l,(m
easu
re a
t 8
0 k
V)
NM
N
M
NM
N
M
NM
A
A
A
N
M
NM
N
M
A
A
A
NM
A
Tim
er A
ccu
racy
(1
0%
)*
NM
N
M
NM
N
M
NM
A
A
N
M
NM
N
M
NM
N
M
NM
N
M
NM
A
mA
s li
nea
rity
(1
0%
)*
NM
N
M
NM
N
M
NM
A
A
A
N
M
NM
N
M
NM
A
A
N
M
A
Ou
tpu
t (m
Gy/m
As)
at
80
kV
, at
50
cm
N
M
NM
N
M
NM
N
M
NM
N
M
NM
N
M
NM
N
M
NM
N
M
NM
N
M
NM
Lig
ht/
Rad
iati
on
Bea
m A
lign
men
t (d
evia
tio
n a
t
1m
)(±
2%
)
NM
N
M
NM
N
M
NM
N
M
NM
N
M
NM
N
M
NM
N
M
NM
N
M
NM
N
M
Hig
h c
on
tras
t re
solu
tio
n (
fiel
d s
ize
of
23
cm
or
nea
rest
, n
orm
al m
od
e o
f fl
uo
ro):
—at
th
e ce
ntr
e (l
p/m
m)
—in
th
e p
erip
her
al (
lp/m
m)
1.2
1.0
1.4
1.2
0.6
0.6
1.6
1.6
1.2
1.2
1.0
0.8
0.6
0.6
0.8
0.8
1.4
1.4
2.4
2.4
1.2
1.2
0.6
0.6
1.2
1.2
2.4
2.4
0.9
0.9
1.2
1.2
Do
se r
ate
at t
he
entr
ance
of
I.I
(fie
ld s
ize
of
23
cm
of
nea
rest
, n
orm
al m
od
e o
f fl
uo
ro):
—G
rid
(Y
/N)
—A
BC
(Y
/N)
—kV
,_m
A
—D
ose
rat
e (µ
Gy/m
in)
Y
Y
85
1
.7
10
8
Y
Y
79
2
.0
40
Y
Y
85
1
.4
20
Y
Y
76
6
.3
27
Y
Y
88
1
.4
44
Y
Y
76
1
.6
58
Y
Y
78
0
.2
9.0
Y
Y
76
1
.3
33
Y
Y
75
2
.1
68
Y
Y
71
3
.2
36
Y
Y
80
1
.5
72
Y
Y
85
0
.5
33
Y
Y
70
1
.0
21
.4
Y
Y
88
2
.1
67
.8
No
ne
No
ne
- -
Y
Y
88
2
.0
44
.9
En
tran
ce d
ose
rat
e to
th
e p
atie
nt
(fie
ld s
ize
of
23
cm
or
nea
rest
, n
orm
al m
od
e
of
flu
oro
gri
d i
n):
—kV
, m
A
—D
ose
(m
Gy/m
in)
90
1
.7
16
.1
77
2
.0
23
.5
79
1
.4
7.9
73
6
.8
5.7
89
1
.4
10
.7
77
1
.6
11
.4
70
2
.0
6.8
3
76
1
.2
6.5
78
1
.6
9.9
70
3
.0
11
.5
83
1
.7
12
.0
80
1
.0
3.9
74
1
.1
5.5
89
2
.1
13
.9
70
2
.0
46
.8
74
1
.3
5.6
Max
imu
m e
ntr
ance
do
se r
ate
to t
he
pat
ien
t
(hig
hes
t im
age
qu
alit
y,
bo
ost
mo
de)
:
—L
ow
est
fiel
d s
ize/
cm
—kV
, m
A
—D
ose
rat
e at
30
cm
(m
Gy/m
in)
23
12
4 2
.4
36
.9
23
11
2 4
.0
99
.1
23
95
1
.4
11
.4
13
12
5 1
6
60
.8
23
12
1 2
.6
33
.34
23
12
4 2
.4
40
.0
23
10
0 4
.0
26
.7
23
12
0 3
.0
41
.2
23
11
4 2
.4
29
.4
17
111
6
.0
58
.6
23
11
5 2
.3
27
.9
23
12
0 1
.0
8.2
23
12
0 1
.9
24
.0
15
12
5 4
.0
55
.7
- - -
23
12
3 2
.5
29
.4
NM
= N
ot
Mea
sure
d
A
= A
ccep
tab
le
*
wit
hou
t im
age
inte
nsi
fier
215

IAEA-CN-85-141
216
T able II. Quality control of CT units; summary of QC results for a 10 mm slice thickness.*
Hospital/Room E/1 F/1 G/1
kV 120 125 130
mAs 320 455 210
Scan time (s) 4 7 3
FOV (cm) 25 24 24
Matrix 512 x 512 512 x 512 512 x 512
Algorithm(soft tissue) standard standard standard
High contrast resolution 1.0 1.0 1.0
CT number calibration: — air -976.0±1.0 -999±2.2 -1000.7 ± 2.5 —polye -71.8±3.1 -101±4.8 -81.3 ± 3.0 —polys -35.2±3.4 -51±3.3 -23.6 ± 2.8 —water 1.1.±3.0 -28±4.6 1.6 ± 3.0 —nylon 85.9±3.5 74±4.1 100.5 ± 3.9 —polyc 93.3±3.1 91±6.1 104.0 ± 3.2 —acrylic 116.0±3.6 95±2.7 127.1 ± 3.2
CT# contrast scale
CS = 1/ (Ctair — CTwater ) -1/977 -1/971 -1/1002
Low contrast delectability (mm)3.0 3.0 3.0
Noise: SD of water SD*100*CS(%) 0.30 0.44 0.42
Uniformity(min-max) 3.0 5.0 2.0
nCTDI10cm air ( mGy/mAs)0.334 0.215 0.302
* Standard head techniques for the CT units.
Table III . Patient dose measurement; barium meal(upper GI, not follow through) examination*
Parameters
(tolerances indicated with) A/1 B/2 C/1 D/1
Patient data:
- Average age(year±sd)
- Average weight(kg±sd)
52±6
57.2±9.8
51±4
59.8±5.2
39±19
63±6.7
40±19
59.4±8.4
Mean number of images(n±sd) 9±2.9 9.2±1.6 5.2±2.4 6±0
Mean fluoroscopy time (minutes±sd) 4.8±3.0 6.1±2.3 6.1±2.6 4.4±1.2
Dose Area Product(Gy.cm 2
±sd) 27.9±14.3
(27.9-47.89) **
13.6±2.5
(9.84-15.38)**
18.8±9.7
(10.37-35.50) **
22.0±6.8
(15.49-31.24) **
* The data for 5 patients per room has been recorded and the patient weight 60± 10kg has been selected.
** Range in parentheses.
The QC tests for CT scanners were made with VICTOREEN 76-410-4130 and 76-421
phantoms. The dose for CT scanner was measured with VICTOREEN Model 660, 660-6 CT
probes and the head/body dose phantoms.
In order to use the Monte Carlo data to calculate effective dose to patients for a CT
examination, it is necessary to know the absorbed dose free-in-air on the axis of rotation of the
CT scanner [2]. This can be determined using a set of 36 LiF-TLD chips stacked together
inside a specific holder which can be aligned along the axis of rotation of the CT scanner
using simple support jig. The TLD were calibrated in air kerma with calibration factor from
NRL, New Zealand.

IAEA-CN-85-141
217
Table IV. patient dose evaluation in CT; chest, general examination *
Hospital Room E/1 F/1 G/1
Average age (year±sd) 66±5.3 55±4.6 58±6.0
Average weight (kg±sd) 57±2.7 60±1.5 55±3.5
Technical parameters:
Average kV 120 130 125
Average mAs (C) 300 455 150
Scan time(s) 3.0 7 3.0
Slice thickness(mm) (T) 10 10 10
Average no. of slices (N) 22±4 20±3 22±2
Average couch increment (mm) 10 10 10
Examination performed: without(N), with(Y)
or without and with contrast media(NY)None None None
Dose evaluation:
Average CTDIw = nCTDIw.C (mGy) 27.1 43.0 17.2
Average DLP = nCTDIw.C.T.N(mGy.cm) 596.2 860.0 378.4
Average Effective Dose (mSv) 9.8 10.4 8.2
* The data for 5 patients per room has been recorded and the patient weight 55±10kg has been selected.
The dose descriptor relating to a single CT slice is expressed as the CTDI. A weighted
CTDI(CTDIw) and the Dose –Length Product(DLP) in the head or body CT dosimetry
phantoms were derived from the measured CTDIair 10. [2]
The organ doses and effective
dose(E) to patients in the study may be derived from kVp, mAs, slice thickness, number of
slices, couch increment, start and finish positions and the CTDI/mAs measured free-in-air on
axis for the CT scanner, using CTDOSE programme supplied by New Zealand and NRPB250
data base by UK. The patient weight of 55+/-10kg was selected for the chest CT examination.
3. Results and discussion
From results of TLD calibration a precision of 5% or better at 0.1 mGy could be achieved.
This fact makes the system attractive for low dose measurements in diagnostic radiology with
satisfactory accuracy and precision.
The results of QC tests for 16 fluoroscopic units are summarized in Table I and for 3 CT
scanners in Table II. A large majority of the units is satisfactory.
Table III summarizes all mean values of the radiological factors and the DAP for barium meal
examination.
Assessing dose to patients from fluoroscopic examinations was always difficult, mainly due to
the dynamic nature of the investigation: many parameters (kVp, mA, field position and size)
were variable during the same examination and others (number of exposures, fluoroscopy

IAEA-CN-85-141
218
time) from patient to patient. From Table III it can be seen that the range of mean DAP values
(13.6 - 27.9 Gycm2) as encountered in clinical practice at 4 fluoroscopic units for the upper GI
studies is relatively small, especially when it is taken into account that large variation existed
in numerous aspects of each examination, all were closely related to patient dose. This
involves, for example, the variations in the fluoroscopy time (0.57–8.7 minutes), in the dose
rate at the entrance surface of image intensifier (9.0–108�Gy/min), in the entrance dose at the
surface of phantom (3.9–23.5mGy/min) and in number of exposures(3 – 12 images).The
highest Dose-Area Product was measured at fluoroscopic unit A/1 which can be explained by
the combination of high required entrance dose at the surface of the image intensifier during
fluoroscopy and radiography, long fluoroscopy time and great number of exposures.
The results of patient dose evaluation in CT chest examination are summarized in Table IV.
The table shows the average weighted CTDI for a single slice in the patient chest examination,
the Dose-Length Product for the complete examination and the average effective dose. These
average dose values in hospitals E/1 and G/1 compare rather well with the CEC reference
dose values for the chest CT examination, the average in hospital F/1 is higher than the
reference value.
4. Conclusions
Quality assurance programme for X-ray diagnosis were begun in China in the mid 1980s and
became firmly established in early 1990s, when the national regulations and standards were
made. This kind of CRP is considered a good and cost effective start for national projects on
radiation protection and quality assurance in diagnostic radiology in developing countries.
It was noted in the studies that the traditional fluoroscopy (without II), upper GI with barium
meal for fluoroscopy, and the CT examinations often caused higher absorbed doses to patients
than these of conventional radiography [4]. It seems possible to choose reference levels of
dose indicator that are valid worldwide for all X-ray examinations, including radiography,
fluoroscopy and CT scanning [5].
Acknowledgement
This work was supported in part by IAEA under the contract number 8221/R2. We would like
to thank Ms. Modupe Oresegun for her assistance.
References
[1] IAEA-TECDOC-796, Radiation Dose in Diagnostic Radiology and Methods for Dose
Reduction, IAEA, Vienna
[2] CEC, Quality Criteria for Computed Tomography, EUR 16262 (1997).
[3] NRPB, National Protocol for Patient Dose Measurements in Diagnostic Radiology,
Institute of Physical Sciences in Medicine (1992).
[4] UNSCEAR, Source and Effects of Ionizing Radiation, United Nations, New York,
(1993).
[5] X. Qi, K. Wei, B. Yue et al. Evaluation of the Dosimetric Performance Characteristics of
Fluoroscopy System used in Medicine. IAEA-CN-70/17, these Proceeding.

IAEA-CN-85-116
219
PATIENT DOSES FROM COMPUTED TOMOGRAPHY IN THE
NORTH-EAST REGION OF UKRAINE
N. Pylypenko, V. Kornyeyeva, H. Gur
Grigorev Institute for Medical Radiology, Kharkov, Ukraine
Abstract
Survey of CT-examinations, including the measurements of a computed tomography dose index (CTDI) and
patient dose assessment was implemented in CT departments of north-east region of Ukraine. The value of CTDI
differs by factor 1.3 – 2 for the different units of one type of CT scanner. Total number of CT examinations has
increased from 19,717 in 1997 to 46,374 in 1998. The number of CT examinations of children is about 7.6% of
total number of examinations. The collective effective dose to the patients due to CT examinations was 160.7
man.-Sv in 1998. The comparison of number and collective effective doses for different kind of CT examinations
shows that although only 21.6% of the CT examinations concern to abdomen, the contribution of this kind of CT
examination to collective effective dose is the highest and makes about 50%. Whereas CT examinations of head
represent 65.4% of the all examinations in 1998, its contribution to the collective dose is only 15%.
1. Introduction
In accordance with the state documents, accepted recently in Ukraine in the field of nuclear
regulation, a problem of the population exposure control at medical use of ionising radiation
sources is very actual now. A realisation of such monitoring is in need of the implementation
of both organisational and practical measures.
Computed tomography takes the special position among other methods of receiving the
diagnostic information and finds more and more broad use in practice of medical
establishments. At the same time doses of patients undergoing the CT examinations are much
higher, than ones from the conventional radiography. It caused an increase in the contribution
of CT-examinations to a collective dose from a medical exposure.
The purpose of this study was to survey the state of computed tomography in the four regions
of the north-east area of Ukraine and assess the collective dose from this X-ray diagnostic
method.
2. Material and methods
Dosimetry measurements and patient dose assessment at the CT-examinations were carried
out in 11 hospitals of the north-east area of Ukraine, including the Dnepropetrovsk, Donetsk,
Poltava and Kharkov regions.
The quantity computed tomography dose index (CTDI) was measured free-in-air at each
operating CT scanner by means of a specially designed dosimeter with thermoluminescent
detectors (TLD). The dosimeter consists of the PMMA capsule with the outer and inner
diameter equal 8 and 5 mm, accordingly. Inside the capsule the LiF:Mg,Ti thermoluminescent
pellets with a diameter of 4,5 mm and thickness of 0,8 mm (type MTS-N, Krakow Institute of
Nuclear Physics) are placed. Length of an accommodation area of the detectors was selected
to be sufficient to enclose the full dose profile at free-in-air measurements. The dosimeters
were placed along a rotation axis of the scanner so that a single slice scanning plane crosses
the centre of the dosimeter. The exposure of the dosimeters were performed at the

IAEA-CN-85-116
220
combinations of scan parameters, such as tube voltage, current-time product and slice
thickness that are most frequently used in routine practice of the CT department.
The measured CTDI were used for the calculation of effective doses apply to average sized
adult patient for the routine CT-examination of head, chest, abdomen and pelvis. For an
evaluation of doses from CT examinations carried out on the scanners type CT-1010
(Ukraine) and GE CT-MAX the effective dose conversion factors were obtained using the
heterogeneous anthropomorphic phantoms (Riga, Latvia) and thermoluminescent detectors
based on LiF type MTS-N and MCP-N (Krakow Institute of Nuclear Physics). For the
calculation of effective doses from CT-examinations performed on other types of CT scanners
the effective dose conversion factors readily available in publications [1,3] were used.
The data about the number and the structure of CT-examinations carried out in 11 hospitals in
1997-1999 were obtained from the special questionnaires sent to every CT department. The
information received has provided the age distribution of CT-examinations and taken into
consideration a scanning of the following body sections: head, chest, abdomen and pelvis.
3. Results
The measurements of CTDI were performed on 6 types of CT scanners. The results have
shown that the value of computed tomography dose index measured for the relevant
combinations of scan parameters differs by factor 1.3 – 2 for the same type of CT scanner.
The age distribution of CT-examinations performed during 1997-1999 is presented on Figure
1. It can be seen that the number of child examinations is rather small, being about 7.6% of all
patients.
Figure 1. Age distribution of CT-examinations in north-east region of Ukraine
in 1997-1999
adults
92,4%
12 - 17 years
4,2%
7 - 12 years
2,0%
0 - 7 years
1,4%
Figure 2 shows the data about the number and structure of CT examinations of adults carried
out in north-east region of Ukraine. As it follows from Figure 2, the total number of CT
examinations is gradually increased from 19,717 in 1997 to 46,374 in 1998. The structure of
the examinations in 1997-1998 was as follows: head - 65.2%, abdomen -19.5%, chest –

IAEA-CN-85-116
221
10.0%, pelvis – 5.3%. One of the reason the substantial contribution of the head examination
is the relatively large number of CPT–1010 type scanners which are constructed specially for
the head scanning.
Figure 2. Number and structure of CT examinations
in north-east region of Ukraine in 1997-1998
12776
2628 28951418
30340
3988
9994
2052
43116
12889
3470
6616
0
5000
10000
15000
20000
25000
30000
35000
40000
45000
50000
Head Chest Abdomen Pelvis
1997
1998
Total
The results of determination of effective doses apply to average sized adult patient for the
routine CT-examination of head, chest, abdomen and pelvis obtained using the heterogeneous
anthropomorphic phantoms are given in the Table 1. The data are expressed in the terms of an
effective dose conversion factor - effective dose normalized to CTDIn.
Table 1. Effective dose conversion factors for different kinds of CT examinations
female phantom male phantom
GE CT-MAX
19.5
18.7
13.8
6.4
Chest
Abdomen
Pelvis
19.9
17.4
9.6
Effective dose conversion factors E/CTDIn, (mSv/mGy/mAs))
Type of scanner Examination
CPT-1010 Head 11.3 14.0
Head 6.6
The patient effective doses received during CT-examinations were assessed from CTDI
measured of each CT scanner and changed for head from 0.3 up to 3.0 mSv, for chest from 2.6
to 12.4 mSv, for abdomen from 3.5 to 26.5 mSv, for pelvis from 2.0 to 18.5 mSv.

IAEA-CN-85-116
222
The derived collective doses from CT examinations performed in 1998 for adult patients are
show on Figure 3. In addition, the comparison of number and collective effective doses for
different kind of CT examinations is given on this Figure. The conclusion may be done that
although only 21.6% of the CT examinations concern to abdomen, the contribution of this
kind of CT examination to collective effective dose is the highest and makes about 50%.
Whereas CT examinations of head represent 65.4% of the all examinations in 1998, its
contribution to the collective dose is only 15%.
Figure 3. Number of CT examinations and collective effective dose (adults)
in 1998
30340
3988
35437
78362,2
22692,3
9994
2052
24223,6
0
10000
20000
30000
40000
50000
60000
70000
80000
90000
Head Chest Abdomen Pelvis
Number of CT examinations
in 1998
Collective effective dose,
man.-mSv
4. Conclusion
Realisation of regular CTDI measurements in CT departments is necessary for the evaluations
of patient doses and for the estimations of the relative contribution of different kinds of CT
examinations to collective effective dose.
References
[1] SHRIMPTON, P.C., HART, D., HILLIER, M.C., et al. Survey of CT Practice in the
UK. Part 2: Dosimetric aspects, Rep. NRPB-R249, Chilton, Didcot, Oxon, UK, NRPB
(1991).
[2] JONES, D.G., SHRIMPTON, P.C. Survey of CT Practice in the UK. Part 3: Normalised
Organ Doses Calculated using Monte Carlo Techniques, Rep. NRPB-R250, Chilton,
Didcot, Oxon, UK, NRPB (1991).
[3] ZANKL, M., PANZER, W., DREXLER, G. The Calculation of Dose from External
Photon Exposures using Reference Human Phantoms and Monte Carlo Methods. Part
VI: Organ Doses from Computed Tomographic Examinations, Rep. GSF-Bericht 30/91,
Neuherberg, Germany, GSF (1991).

IAEA-CN-85-175
223
USE OF THE EC QUALITY CRITERIA AS A COMMON METHOD OF
INSPECTING CT LABORATORIES– A PILOT PROJECT BY THE NORDIC
RADIATION PROTECTION AUTHORITIES
C.G. Torp1, H.M. Olerud
1, G. Einarsson
2, P. Grøn
3, W. Leitz
4, A. Servomaa
5
1Norwegian Radiation Protection Authority, Østerås, Norway
2Icelandic Radiation Protection Institute, Reykjavik, Iceland
3National Institute of Radiation Hygiene, Herlev, Denmark
4Swedish Radiation Protection Institute, Stockholm, Sweden
5 Finnish Centre for Radiation and Nuclear Safety (STUK), Helsinki, Finland
Abstract
In the frame of Nordic radiation protection co-operation quality criteria for computed tomography (CT) as
published by the European Commission were used for the evaluation of selected CT laboratories in each of the
Nordic countries. The mean values for all five countries of the weighted CT dose index (CTDIw) and dose length
product (DLP) were 60 mGy and 740 mGy�cm for CT of the brain, 11 mGy and 420 mGy�cm for CT of the
chest, and 40 mGy and 420 mGy�cm for CT of the lumbar spine, respectively. A comparison with the reference
levels set in the above mentioned publication gives a diversified result: compliance for the DLP-values is
generally achieved with good margins whereas the CTDIw–values were frequently larger for brain and lumbar
spine examinations. The radiographic technique was generally also within the recommendations from the EC.
Generally most of the image quality criteria were fulfilled, but it must be born in mind that the study was biased
in the way that two local radiologists in consensus evaluated their own images. Image material from only three
patients was selected for each of the clinical indications, that means the project was not designed for ranking
laboratories, but it is a way of making the departments aware of the need for optimisation regarding image quality
and patient dose, and also on the problems associated with this task. During the study suggestions were brought
forward concerning amendments of the quality criteria: some need a better definition, some are not relevant for
the diagnostic task in question, some could be added. Instead of “yes” and “no” a range of maybe 5 levels of
visualisation should be introduced in order to better characterize the level of diagnostic performance.
1. Introduction
The radiological community has for long been aware of the increasing contribution from
computed tomography (CT) to the collective effective dose. The reduction of exposures by
optimisation of CT procedures is therefore of principal concern in radiological protection. The
concept of “diagnostic reference levels” was promoted by the International Committee on
Radiological Protection (ICRP) in 1996 [1], and adopted in the Medical Exposure Directive
[2] by the European Commission, which also recently provided a set of image quality criteria
for various CT procedures [3]. The radiation protection authorities in the five Nordic countries
have for long been co-operating on surveys of patient doses in diagnostic radiology [4, 5], and
also on legislation and inspection strategies. Within the frame of Nordic radiation protection
co-operation a pilot project was initiated. The goal was to try whether the EC quality criteria
for CT can be used as an inspection tool, and as a way of getting in touch with the local
clinical practice.
2. Materials and methods
Data from five hospitals in each of the Nordic countries were collected. The image quality
was evaluated according to the EC quality criteria for three examination types, with suggested
specific clinical indications (to ensure that the patient group is homogenous): (a) Brain,

IAEA-CN-85-175
224
general (differential diagnosis of haemorrhage versus thrombosis/emboli) (b) Chest, general
(suspected lung metastasis), and (c) CT of Lumbar Spine, discal herniation (sciatica/disc
diagnosis, uncertain which root affected). Each of the hospitals was asked to select three
representative patients for each indication (9 patients in total), to perform the examinations
according to normal practice, and to present the images from the examinations on film. Staff
from the radiation protection authority met at the hospital with two experienced CT
radiologists and one CT radiographer (and a hospital physicist if present). The two local
radiologists were evaluating the images in consensus, following the schemes in EUR
16262EN Appendix II [3]. The various criteria for visualisation and critical reproduction of
anatomical details in the images should be answered with either “yes” or “no”. If a criterion
could not be evaluated it was marked by “NA” in the “yes” box. The radiographic technique
for each of the patients was recorded with assistance of the CT radiographer (EUR 16262EN
Appendix I). The CTDIw , corrected for the pitch, and the DLP values were calculated from
the exposure parameters using the nominal CTDI values for the respective scanners, using
information from http://www.sghphy.demon.co.uk/index.htm (Impact, St. Georges’ Hospital,
London). If CTDIw and DLP values were provided on the CT monitor, compliance was
checked by comparison with the calculated values. From EUR 16262EN Table 2 (page 67) the
effective dose from the examination was assessed. In Norway the conversion factors provided
by the National Radiological Protection Board (NRPB) in UK [6] were used additionally. The
software called CTDOSE (Heron Le JC, National Radiation Laboratory, Christchurch, New
Zealand), and the scanner matching data from the Impact group, were then used to calculate
the effective dose and some organ doses (lenses, gonads).
3. Results
There were totally twenty-five laboratories included in the survey. The distribution of CT
scanners is given in Table I. All except two were helical scanners, illustrating the development
of technology during the past decade [7, 8].
Table I. The manufacturers of CT scanners in the survey
Manufacturer Number of various CT
scanner models
Elscint, Picker 1
General Electric 7
Picker 3
Toshiba 4
Philips 3
Siemens 6
Hitachi 1
Image criteria
The fulfilment of the EC quality criteria is shown in Table II, as the percentage of “yes”
answers (that means the rest is the sum “No” or “NA” answers). The criteria for visualisation
and critical reproduction of anatomical details are presented separately. In brain examinations,
the percentage of “NA” answers approached 35 %, while the corresponding figure for lumbar
spine examinations was 57 %. In both cases this was due to criteria connected to contrast
administration, but the clinical indication did not require use of contrast. That means the
number of not fulfilled criteria was actually rather small.

IAEA-CN-85-175
225
Table II. Total percentage fulfilled of the entire EC image quality criteria in each of the
Nordic countries for CT examinations of brain, chest and lumbar spine
# Criteria Denmark Finland Iceland Norway Sweden
Brain Visualisation 4 75 % 85 % 60 % 47 % 82 %
Critical rep. 6 89 % 93 % 86 % 63 % 73 %
Chest Visualisation 5 91 % 98 % 88 % 98 % 95 %
Critical rep. 10 95 % 97 % 93 % 90 % 87 %
LS Visualisation 3 40 % 53 % 33 % 43 % 33 %
Critical rep. 8 85 % 87 % 82 % 76 % 53 %
Radiation dose to the patient
The mean values for each country of weighted CT dose index, dose length product and
effective dose for all examinations of the brain, chest and lumbar spine are given in Table III,
IV and V respectively. The number of examinations included in each country is given in
parenthesis (the number of patients multiplied with the number of hospitals). The mean values
for all five countries are also given in each table to be compared with the EC reference values.
Table III. Dose figures CT of the brain
Denmark
(15)
Finland
(12)
Iceland
(12)
Norway
(18)
Sweden
(15)
Mean
value
EC
reference
value
CTDIw (mGy) 53 60 64 56 67 60 60
DLP(mGy�cm) 600 740 700 640 1030 740 1050
E (mSv) 1.4 1.7 1.6 1.5 2.4 1.7 �
Table IV. Dose figures CT of the chest
Denmark
(15)
Finland
(12)
Iceland
(12)
Norway
(17)
Sweden
(15)
Mean
value
EC
reference
value
CTDIw (mGy) 10.6 10.6 11.7 10.5 10.9 10.8 30
DLP(mGy�cm) 420 530 440 350 350 420 650
E (mSv) 7.2 9.0 7.5 6.0 6.0 7.1 �
Table V. Dose figures CT of the lumbar spine
Denmark
(15)
Finland
(12)
Iceland
(12)
Norway
(18)
Sweden
(12)
Mean
value
EC*
reference
value
CTDIw (mGy) 40 40 45 32 40 40 35
DLP(mGy�cm) 430 460 450 250 500 420 800
E (mSv) 8.2 8.6 8.6 4.8 9.5 7.9 �
* no specific values provided, the values are for routine abdomen
The effective dose calculated from the DLP values compared with the effective dose based on
the NRPB method was within 2% for the brain, 15% lower for the chest, and 22% higher for
the LS columna. For brain examinations in Norway the lens doses ranged from 4.8–56.3 mGy
depending on whether the lenses were included in the primary scan volume or not. The uterus

IAEA-CN-85-175
226
doses ranged from 4.5–10.9 mGy for lumbar spine examinations, while the uterus dose for
chest examinations generally were below 0.1 mGy.
Imaging technique
The radiographic technique was generally in accordance with the European guidelines [3].
However, it was some variance in window width and window level settings, and some
laboratories used pitch higher than one for the brain examinations. Most brain and lumbar
spine examinations were done using axial scan technique, while helical technique with pitch
around 1.5 was used for chest examinations.
For the chest examinations it varied between the laboratories whether the upper abdomen was
included or not. It also varied whether a separate series was done before the contrast
administration or not. The total scan length calculated as the sum of the scan lengths for all
series therefore ranged from 160–780 mm, with a mean of 370 mm.
4. Discussion and conclusion
The dose results
CTDIw as defined in the EC guidelines is not corrected for the pitch. The lower CTDIw values
for chest examinations in the Nordic countries compared to the reference value is partly
explained by this fact. Otherwise, the mean CTDIw values from this survey are equal to or
higher than the EC reference values. The DLP values were considerably lower than the EC
reference values, probably because of shorter total scan lengths, for example, the higher DLP
value in the Swedish brain examinations is explained by procedures including both series with
and without contrast. The effective doses in the present survey are in the same range as
previously published Nordic results [8, 9].
The image evaluation
�� The noise, spatial resolution and diagnostic acceptability were generally valued as good.
�� A low percentage “yes” in the image evaluation schemes did not necessarily indicate poor
quality. Patient age and pathology was certainly also an explanation for both “NA” and
“no” answers, in addition to the various use of pre-contrast series.
�� The image evaluation was film based, while now it is more common to use a workstation
for diagnostics. This may have affected the choice of window settings, and the selection of
images recorded on film, which in some respect differed from the EC recommendations.
The inspection strategy
This Nordic pilot project shows that the EC quality criteria can be used as a collaborative
inspection tool. The main benefit from the method was to get in touch with the hospitals and
introduce the EC quality criteria to the local staff. This may have encouraged discussion about
local techniques, image quality and optimisation of the CT procedures. However, the
radiologists work within their own reference frames. That introduces a bias, and the survey
design is not suitable for ranking. For that purpose it would be better using an independent
panel of radiologist evaluating the images, and a grading system for image evaluation.

IAEA-CN-85-175
227
References
[1] International Commission on Radiological Protection, Radiological Protection and
Safety in Medicine, ICRP Publication 73, Pergamon Press, Oxford (1996).
[2] Council directive 97/43/EURATOM on Health Protection of Individuals against the
danger of Ionising Radiation in Relation to Medical Exposures, Official Journal L 180,
p 22 (1997).
[3] European guidelines on quality criteria for computed tomography, Report EUR 16262,
Office for Official Publications of the European Communities, Brussels (1999).
[4] Saxebøl, G., Olerud, H.M., Hjardemaal, O., Leitz, W., Servomaa, A., Walderhaug, T.,
Nordic guidance levels for patient doses in diagnostic radiology, Radiat. Prot. Dosim.
89 (1998) 99�101.
[5] Grön, P., Olerud, H.M., Einarsson, G., Leitz, W., Servomaa, A., Schoultz, B.W.,
Hjardemaa, O., A Nordic survey of patient doses in diagnostic radiology, Eur. Radiol.
10 (2000) 1988 – 1992.
[6] Jones, D.G., Shrimpton, P.C., Survey of CT practice in the UK. Part 3: Normalised
organ doses calculated using Monte Carlo techniques, NRPB-R250, National
Radiological Protection Board, Chilton, Didcot (London, HMSO) (1991).
[7] Olerud, H.M., Saxebø,l G., Diagnostic radiology in Norway from 1983 to 1993 –
examination frequency and the collective effective dose to patients, Radiat. Prot.
Dosim. 74 (1997) 247�260.
[8] Leitz, W., Axelsson, B., Szendrö, G., Computed tomography dose assessment � a
practical approach, Radiat. Prot. Dosim. 57 (1995) 377�380.
[9] Olerud, H.M., Analysis of factors influencing patient doses from CT in Norway,
Radiat. Prot. Dosim. 71 (1997) 123�134.

IAEA-CN-85-203
228
ESTABLISHMENT OF COMPUTED TOMOGRAPHY REFERENCE DOSE
LEVELS IN ONASSIS CARDIAC SURGERY CENTER
V. Tsapaki, E. Kyrozi, T. Syrigou, I. Mastorakou
Onassis Cardiac Surgery Center, Athens, Greece
S. Kottou
Athens University, Med. Physics Dept., Medical School, Athens, Greece
Abstract
The purpose of the study was to apply European Commission (EC) Reference Dose Levels (RDL) in Computed
Tomography (CT) examinations at Onassis Cardiac Surgery Center (OCSC). These are weighted CT Dose Index
(CTDIw) for a single slice and Dose-Length Product (DLP) for a complete examination. During the period 1998-
1999, the total number of CT examinations, every type of CT examination, patient related data and technical
parameters of the examinations were recorded. The most frequent examinations were chosen for investigation
which were the head, chest, abdomen and pelvis. CTDI measurements were performed and CTDIw and DLP were
calculated. Third Quartile values of CTDIw were chosen to be 43mGy for head, 8mGy for chest, and 22mGy for
abdomen and pelvis examinations. Third Quartile values of DLP were chosen to be 740mGycm for head,
370mGycm for chest, 490mGycm for abdomen and 420mGycm for pelvis examination. Results confirm that
OCSC follows successfully the proposed RDL for the head, chest, abdomen and pelvis examinations in terms of
radiation dose.
1. Introduction
The development of Computed Tomography (CT) scanners has been one of the most
explosive phenomena in modern medicine. They were introduced in clinical practice in
1972[1]. CT provides high quality cross-sectional images and increasing application of this
modality has made a substantial impact on both patient care and population exposure from
medical X-rays. Conditions of exposure during CT examinations differ from those in
conventional X-ray procedures. National surveys on CT practice have established the
increasing importance of CT as significant source of medical exposure to X-rays [2]. The
growth of CT technology and its widespread use make CT scanners to account for around
40% of medical exposure to X-rays for the general population, while representing only 4% of
the total number of such procedures [3]. The European Council Directive 97/43/Euratom [4]
suggests that an examination should only be carried out on the basis of a justifiable clinical
indication, and exposure of the patient should always be limited to the minimum necessary to
meet clinical objectives. The optimal use of ionizing radiation involves the interaction of three
important aspects of imaging process. These are the image quality, radiation dose to the
patient, and choice of examination technique. One of the basic principles of radiation
protection is to try and keep the dose to the patient As Low As Reasonably Achievable
(ALARA) consistent with the clinical requirements. The European Commission (EC) recently
proposed certain guidelines in order to optimize the protection of patients [5]. These
guidelines suggest quality criteria in order to define a level of performance considered
necessary to produce images of standard quality for a particular anatomical region. Quality
criteria are presented for several CT examinations and apply to standard adult patients
undergoing usual application of the technique for the type of examination under consideration.
These are divided into four parts which are diagnostic requirements, criteria for radiation dose
to the patient, example of good imaging technique and clinical conditions with impact on
imaging performance.
The guidelines also introduce the concept of Diagnostic Reference Levels (RDL). These are
defined in order to facilitate optimization of protection in medical exposure and to allow
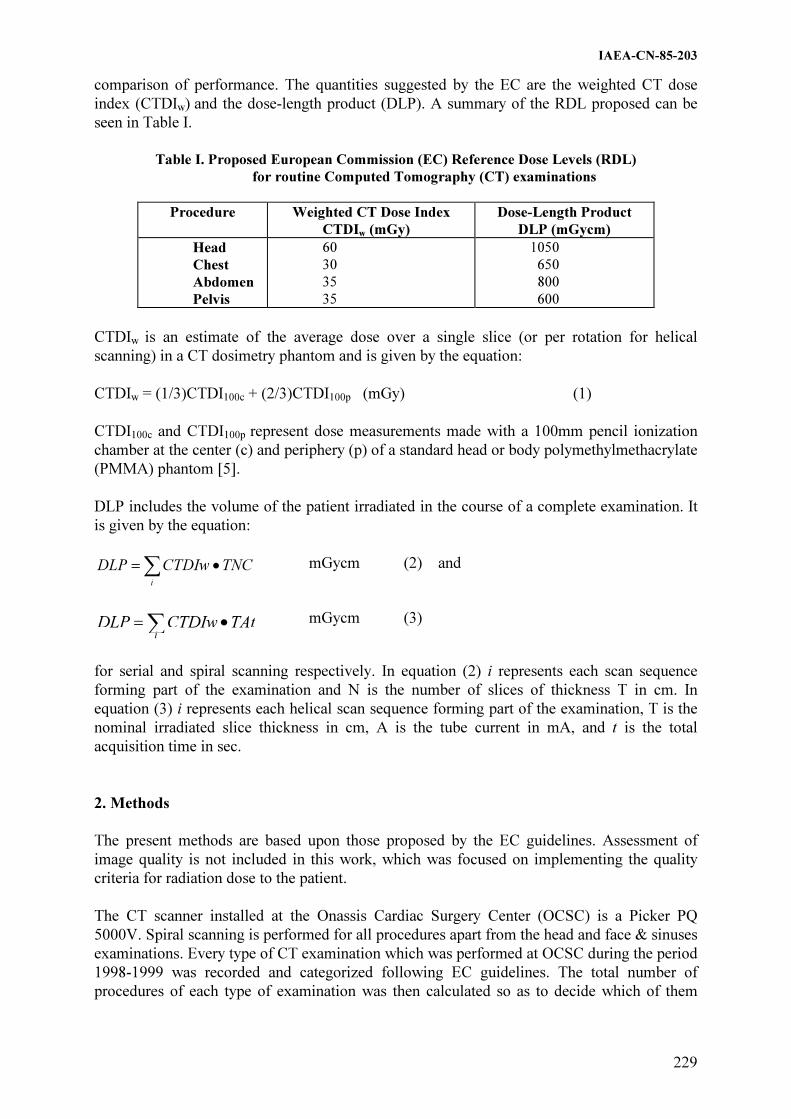
IAEA-CN-85-203
229
comparison of performance. The quantities suggested by the EC are the weighted CT dose
index (CTDIw) and the dose-length product (DLP). A summary of the RDL proposed can be
seen in Table I.
Table I. Proposed European Commission (EC) Reference Dose Levels (RDL)
for routine Computed Tomography (CT) examinations
Procedure Weighted CT Dose Index
CTDIw (mGy)
Dose-Length Product
DLP (mGycm)
Head
Chest
Abdomen
Pelvis
60
30
35
35
1050
650
800
600
CTDIw is an estimate of the average dose over a single slice (or per rotation for helical
scanning) in a CT dosimetry phantom and is given by the equation:
CTDIw = (1/3)CTDI100c + (2/3)CTDI100p (mGy) (1)
CTDI100c and CTDI100p represent dose measurements made with a 100mm pencil ionization
chamber at the center (c) and periphery (p) of a standard head or body polymethylmethacrylate
(PMMA) phantom [5].
DLP includes the volume of the patient irradiated in the course of a complete examination. It
is given by the equation:
� ��
i
TNCCTDIwDLP
mGycm (2) and
� ��
i
TAtCTDIwDLP
mGycm (3)
for serial and spiral scanning respectively. In equation (2) i represents each scan sequence
forming part of the examination and N is the number of slices of thickness T in cm. In
equation (3) i represents each helical scan sequence forming part of the examination, T is the
nominal irradiated slice thickness in cm, A is the tube current in mA, and t is the total
acquisition time in sec.
2. Methods
The present methods are based upon those proposed by the EC guidelines. Assessment of
image quality is not included in this work, which was focused on implementing the quality
criteria for radiation dose to the patient.
The CT scanner installed at the Onassis Cardiac Surgery Center (OCSC) is a Picker PQ
5000V. Spiral scanning is performed for all procedures apart from the head and face & sinuses
examinations. Every type of CT examination which was performed at OCSC during the period
1998-1999 was recorded and categorized following EC guidelines. The total number of
procedures of each type of examination was then calculated so as to decide which of them
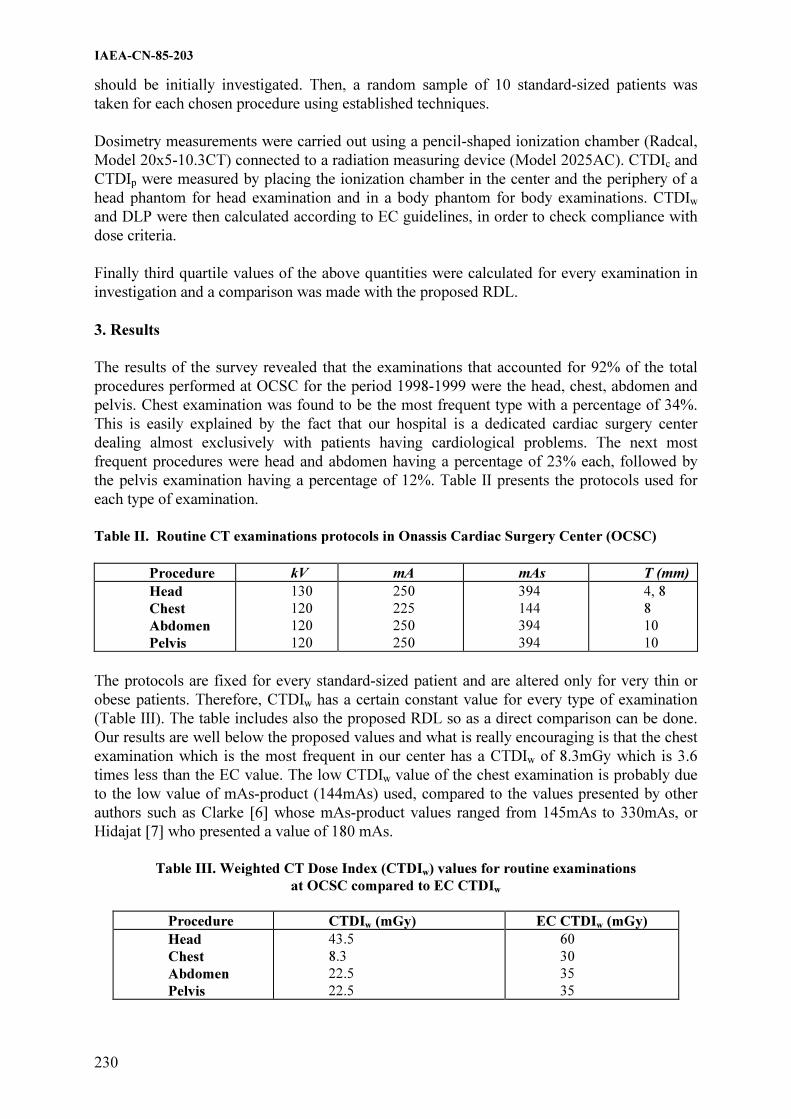
IAEA-CN-85-203
230
should be initially investigated. Then, a random sample of 10 standard-sized patients was
taken for each chosen procedure using established techniques.
Dosimetry measurements were carried out using a pencil-shaped ionization chamber (Radcal,
Model 20x5-10.3CT) connected to a radiation measuring device (Model 2025AC). CTDIc and
CTDIp were measured by placing the ionization chamber in the center and the periphery of a
head phantom for head examination and in a body phantom for body examinations. CTDIw
and DLP were then calculated according to EC guidelines, in order to check compliance with
dose criteria.
Finally third quartile values of the above quantities were calculated for every examination in
investigation and a comparison was made with the proposed RDL.
3. Results
The results of the survey revealed that the examinations that accounted for 92% of the total
procedures performed at OCSC for the period 1998-1999 were the head, chest, abdomen and
pelvis. Chest examination was found to be the most frequent type with a percentage of 34%.
This is easily explained by the fact that our hospital is a dedicated cardiac surgery center
dealing almost exclusively with patients having cardiological problems. The next most
frequent procedures were head and abdomen having a percentage of 23% each, followed by
the pelvis examination having a percentage of 12%. Table II presents the protocols used for
each type of examination.
Table II. Routine CT examinations protocols in Onassis Cardiac Surgery Center (OCSC)
Procedure kV mA mAs T (mm)
Head
Chest
Abdomen
Pelvis
130
120
120
120
250
225
250
250
394
144
394
394
4, 8
8
10
10
The protocols are fixed for every standard-sized patient and are altered only for very thin or
obese patients. Therefore, CTDIw has a certain constant value for every type of examination
(Table III). The table includes also the proposed RDL so as a direct comparison can be done.
Our results are well below the proposed values and what is really encouraging is that the chest
examination which is the most frequent in our center has a CTDIw of 8.3mGy which is 3.6
times less than the EC value. The low CTDIw value of the chest examination is probably due
to the low value of mAs-product (144mAs) used, compared to the values presented by other
authors such as Clarke [6] whose mAs-product values ranged from 145mAs to 330mAs, or
Hidajat [7] who presented a value of 180 mAs.
Table III. Weighted CT Dose Index (CTDIw) values for routine examinations
at OCSC compared to EC CTDIw
Procedure CTDIw (mGy) EC CTDIw (mGy)
Head
Chest
Abdomen
Pelvis
43.5
8.3
22.5
22.5
60
30
35
35

IAEA-CN-85-203
231
DLP was then calculated and the results are found in Table IV together with the proposed EC
values. The third quartile values which were found at OCSR are almost half the proposed EC
RDL for the body examinations. It should be noted that all these examinations are performed
using spiral scanning and that in most cases no additional scanning is performed since the
software of the scanner is able of reconstructing images at every direction inside the body of
the patient.
Table IV. Third quartile values of Dose-Length Product (DLP) for
routine examinations at OCSC compared to EC DLP
Procedure DLP (mGy cm) EC DLP (mGy cm)
Head
Chest
Abdomen
Pelvis
740
374
491
424
1050
650
800
600
Taking into consideration all the above results, it was decided that the RDL at OCSC will be
the ones found in Table V.
Table V. Reference Dose Levels for routine CT examinations at
Onassis Cardiac Surgery Center
Procedure CTDIw (mGy) DLP (mGy cm)
Head
Chest
Abdomen
Pelvis
43
8
22
22
740
370
490
420
4. Conclusion
The initial investigation of the state of the art of CT examinations in terms of radiation dose
revealed that OCSC CT scanner has a satisfactory dosimetric performance as far as the most
frequent protocols are used. However, it should be noted that the setting and review of RDL
should be a continuing process in order to promote continuous improvement over time. This
means that they should always be pursued to achieve further dose reduction without
compromising the diagnostic value of an individual examination.
Therefore, our study should extend to the other parts of the EC quality criteria so as to
investigate the suitability of the proposed diagnostic requirements and the imaging techniques
and if yes to ensure that they are also fulfilled.
References
[1] JOHNS, HE & CUNNINGHAM, JR, The physics of radiology, 4th
edition, Thomas
Publisher, Illinois (1983), 796pp.
[2] SHRIMPTON PC and WALL BF, The increasing importance of X-ray Computed
Tomography as a source of medical exposure, Rad. Prot. Dos, 57, (1995) 413-415.
[3] NATIONAL RADIOLOGICAL PROTECTION BOARD, Guidelines on patient dose to
promote optimization of protection for diagnostic medical exposures, V10, N1 (1999)
26-28.

IAEA-CN-85-203
232
[4] COUNCIL DIRECTIVE 97/43, Euratom 30-June-1997 on Health protection of
individuals against the dangers of ionizing radiation in relation to medical exposure,
O.J. No. L 180, (1997).
[5] ECquality criteria for computed tomography. EC Working Document EUR 16262
Brussels: EU 1998.
[6] CLARKE J, CRANLEY K, ROBINSON J, SMITH P and WORKMAN A, Application
of draft European Commission reference levels to a regional CT dose survey, BJR, 73
(2000), 43-50.
[7] HIDAJAT N, J MAURER, SCHRODER RJ, NUNNEMANN A, WOLF M, PAULI K
and FELIX R, Relationships between physical dose quantities and patient dose in CT,
BJR, 72 (1999), 556-561.

IAEA-CN-85-10
233
RADIATION PROTECTION OF PATIENTS DURING CT FLUOROSCOPY
J.E. Aldrich, B.B. Forster
Department of Radiology, The Vancouver Hospital, Vancouver, Canada
Abstract
CT fluoroscopy provides pseudo real-time cross sectional imaging and has been used in our clinic for biopsies,
drainage and pain control. In the fluoroscopic configuration the radiologist stands in the room adjacent to the
table as in conventional angiography. Because of concerns regarding patient doses, measurements were made to
estimate doses.
Effective doses were calculated using the method of Huda and the data of NRPB. It was found that as far as the
patient is concerned, two minutes of CT Fluoroscopy gave a similar effective dose as a standard abdomen CT
exam. As in other CT scanners, the scattered dose decreases rapidly away from the radiation plane and is 1 mGy
per minute at 10 from the image plane.
1. CT Fluoroscopy/Background
Our existing CT Scanner (Toshiba Express SX) can be used for fluoroscopic CT. In this
pseudo real-time mode eight 512x512 frames are displayed per second. For each progressive
frame only one eighth of the data (or 450) is changed. All the other back projections remain
the same facilitating fast computation. The scanner can operate up to 50 mA for a fluoroscopy
time of 120 seconds. The fluoroscopy system appears just as a normal angiography suite with
a footswitch and video monitor in the room. When the scanner was first installed we carried
out some measurements to look at staff and patient doses. Only patient doses are reported
here.
2. Methods
Measurements were performed with the standard 32 cm diameter cylindrical acrylic dosimetry
phantom, using a Radcal model 9010 dosimeter with a uniform response 10 cm CT chamber
(model 20X5-10.3CT). Scatter measurements were made with a Keithley 36150 radiation
survey meter. Because the surface dose changes in the phantom on a cyclic basis because of
tube rotation, most measurements were made in the integral mode of operation.
3. Calculation of effective dose
There are two basic ways to approach the calculation of effective dose in CT. One is to
estimate from actual CT scans the percentage volume of an organ irradiated to give average
organ doses, and using doses from phantom measurements and tissue weighting factors arrive
at E. This is extremely time consuming, so most efforts have been directed at computational
methods using Monte Carlo techniques. Here average organ doses are estimated using a
mathematical model of the body. The NRPB(National Radiological Protection Board, Oxford,
UK) have been one of the groups involved in this and have published their data [1,2].
Dr Walter Huda and his colleagues at New York State University have built upon the work of
NRPB to provide conversion factors from CTDI measurements [3-6], which are more
commonly used by manufacturers to describe scanner performance. Over the thorax and
abdomen the conversion factor from imparted energy to effective dose varies from about 15 to

IAEA-CN-85-10
234
23 mSv per J5(The author suggest an average value of about 18). Because of this relatively
small variation, given the many assumptions we make to calculate any human effective dose,
it is straightforward to pro rate the effective dose for different slice sequences.
4. Patient dose
Measurements made in the acrylic phantom were converted to patient effective dose by
calculation of energy imparted to the phantom. For normal single slice operation of the CT
scanner for the abdomen at 120 kVp and 200 mAs and the effective dose was 0.24 mSv per
cm slice. For fluoroscopic operation of the CT scanner for the abdomen at 120 kVp and 50
mA and 1 cm slice thickness the effective dose was 3.56 mSv per minute. Two minutes of CT
fluoroscopy therefore gives an effective dose similar to a standard abdomen CT exam.
5. Radiation scatter
The radiation scatter was measured under the same scan conditions as for fluoroscopic CT
described above. Because of the highly collimated narrow x-ray beam, the scattered radiation
decreases rapidly outside the actual beam. At 10 cm from the beam plane on the surface of the
phantom the air kerma dose rate has dropped to 1 mGy per minute(272 mGy per minute in the
beam).
6. Clinical uses
For us the major uses so far for CT fluoroscopy have been 1.Biopsies: probably the most
commonly used application 2. Drainage: Abscesses mostly, and again main advantage over
US is visualizing the fluid collection deep in abdomen/pelvis, and ensuring safe pathway to
access collection via percutaneous route (avoiding bowel, major vessels etc.), and 3. Much
less commonly, injection of structures such as celiac plexus for pain control.
7. Future fluoroscopic CT
Several manufacturers have shown prototype multislice scanners which are capable of
fluoroscopic use [7], and which we be available in the next 24 months.. In general these are
multislice scanners with slice thicknesses of less than 1 cm. As the effective dose increases as

IAEA-CN-85-10
235
the slice thickness decreases in order to counteract the reduction in data, procedural doses are
likely to be in excess of current CT doses.
References
[1] NRPB Report R249 Survey of CT Practice: Dosimetric Aspects 1991.
[2] NRPB Report R250 Survey of CT Practice: Normalised Organ Doses 1991).
[3] Huda W and Sandison GA CT Dosimetry and Dose Estimates Radiation Protection
Dosimetry 1985 12:241-249.
[4] Huda W and Atherton JV Energy Imparted in Computed Tomography Medical Physics
1995:22: 1263-1269.
[5] Atherton JV and Huda W Energy Imparted and Effective Dose in CT Medical Physics
1996 23:735-741.
[6] Huda W Atherton JV et al Estimation of Effective Dose in CT of Pediatric Patients
Radiology 1997 203:417-422 ).
[7] Radiological Society of North America 86th
Scientific Assembly and Annual Meeting,
Chicago, Illinois, November 26th
2000.


Topical Session 3
RADIOLOGICAL PROTECTION IN
INTERVENTIONAL RADIOLOGY, INCLUDING
FLUOROSCOPY NOT CARRIED OUT BY RADIOLOGISTS

.

IAEA-CN-85-190
239
PATIENT DOSE IN INTERVENTIONAL RADIOLOGY
M. Fernández Bordes, R. Berenguer, P. Gómez, M.J. Béjar, S. González1
Servicio de Radiofísica y Protección Radiológica, 1Servicio de Radiodianóstico,
Hospital Universitario de Salamanca, Salamanca, Spain
Abstract
This paper presents the estimation of dose-area product (DAP) received by 128 patients during different
interventional radiological procedures in the Hospital Universitario de Salamanca, analyzing the differences
between procedures classified as either vascular, non vascular, diagnostic or therapeutic. These differences can
be assessed and reference dose levels can be established as a function of the variation of those parameters.
Comparisons between dose-area product values obtained from this study are made with the data from nine other
patient dose surveys, although explanations for some of the differences could not be obtained in some cases.
The reference values in these procedures in our centre are very high due to a great number of images, so the
clinical protocol should be changed to avoid this problem.
1. Material y método
Todos los procedimientos han sido realizados en un equipo Philips Integris V-3000
Sincraboost T que lleva incorporada una cámara de transmisión PTW Diamentor que presenta
un grado de incertidumbre menor al 10% tal y como demuestra el último control de calidad a
la que fue sometida.
Para cada exploración radiológica se recogen datos que permitan realizar la estimación de la
dosis de entrada en superficie (DES) en cada una de las localizaciones exploradas por el
radiólogo. Los métodos de trabajo incluyendo las tablas de recogida de datos están explicados
en la referencia [1]. En el caso de arteriografías cerebrales, adicionalmente se ha empleado
TLD-100 con el fin de poder estimar los valores de dosis piel en el paciente tal y como se
detalla en [1].
2. Resultados
En la tabla 1 se ofrecen los datos clasificados según sea el tipo de procedimiento: vascular o
visceral, diagnóstico o terapéutico con datos del valor de PDA y su distribución porcentual y
parámetros relevantes de la técnica empleada. Además se citan una serie de porcentajes, a
saber:
% magnificación es el porcentaje del tiempo de escopia en el que se magnifica la
imagen.
% cateterización muestra el porcentaje de tiempo de escopia empleado para el
posicionamiento del catéter o para la colocación del stent.
% colimación expresa el porcentaje de pacientes en los que se ha empleado la
colimación.
Los niveles de dosis obtenidos en arteriografía y flebografía son semejantes si bien el
porcentaje de dosis debido a la escopia es mayor en el segundo caso y el número de imágenes
es menor.
En el caso de procedimientos vasculares no se encuentran diferencias apreciables de niveles
de PDA entre los diagnósticos y los terapéuticos. Cabe destacar que la edad media de los
pacientes sometidos a embolización de varicocele es de 21 años y son irradiados en la zona

IAEA-CN-85-190
240
pélvica. Con respecto a otros procesos terapéuticos vasculares, en los que se cuenta con pocos
estudios, sí hemos encontrado unos valores algo superiores como en el caso de embolización
de shunt portacava percutáneo, en la embolización de hemorragias digestivas y en las
angioplastias.
En el caso de procedimientos viscerales, hemos encontrado valores reducidos de PDA como
en la dilatación esofágica (terapéutico). El valor de PDA está por debajo de 50 Gy*cm2 con un
número de imágenes reducido debido a que la finalidad es corroborar el procedimiento.
En la tabla 2, se muestran los valores de dosis piel medidos con TLD-100 en arteriografías
cerebrales. El valor medio obtenido es de 338,9 mGy, siendo el máximo 1135 mGy, valor
próximo al umbral de dosis única para el efecto en piel de eritema temporal (2 Gy).
La tabla 3 muestra los resultados obtenidos de PDA (Gy*cm2) así como de tiempo de escopia
y número de imágenes de los trabajos analizados en la bibliografía. Como se puede apreciar
no es posible la comparación de todos los datos que este trabajo propone en ninguno de ellos.
3. Conclusiones
Los valores de referencia de nuestro centro, aunque en algún caso con un número de pacientes
muy reducido, presentan unos valores muy elevados debido fundamentalmente al gran número
de imágenes. Por lo tanto, el protocolo médico de este centro que exige un gran número de
imágenes, redunda en un PDA muy alto.
La variabilidad de los resultados que se observa en la bibliografía presentada corrobora la
dependencia de éstos con los distintos procedimientos clínicos y con el equipo usado en cada
caso. Por lo tanto, el establecimiento de valores de dosis de referencia en radiología
intervencionista debe tener en cuenta las variaciones intrínsecas debidas a estos efectos.
Un número de imágenes elevado, como el que se presenta, condiciona el resultado de PDA
obtenido y en los casos en los que se puede comparar, existe correlación entre el valor de la
estimación dosimétrica y el número de aquellas.
El porcentaje de magnificación en la mayoría de los procedimientos es bastante bajo salvo en
arteriografías cerebrales en los que se emplean tamaños de intensificador más pequeños. Con
respecto al porcentaje de cateterización se observa que es muy alto en los procedimientos
diagnósticos, como se esperaba, pero no lo es tanto en los terapéuticos ya que en este caso el
tiempo de escopia dedicado a la colocación del stent o del balloon es pequeño frente al tiempo
que se dedica a la aplicación del mismo.
Finalmente, el tipo de resolución empleado ha sido siempre el medio y creemos que en algún
caso se podría haber optado por el bajo con la consiguiente optimización de la dosis obtenida.

TA
BL
A 1
P
rod
uct
o D
osis
por
Áre
a (G
y. C
m2)
Téc
nic
a %
Pro
ced
imie
nto
(N
º)
Med
io
Med
ian
a R
ango
G
rafí
a E
scop
ia
T.e
(m
) S
erie
s Im
áge
nes
M
agn
ific
ació
n
Cat
eter
izac
ión
C
oli
ma
ció
n
Pro
cedi
mie
ntos
DIA
GN
ÓS
TIC
OS
VA
SC
UL
AR
ES
– A
RT
ER
IOG
RA
FÍA
S **
Cer
ebra
l (4
8)
182.
4 15
3.6
[491
.3 -
19
.5]
150.
4 32
10
.6
9 23
9 39
.7%
58
.7%
0%
Tro
nco
s su
p.(
21
) 11
3.3
105.
5 [1
84 –
51.
6]
94.6
18
.6
6 6.
3 18
7 0%
76
.6%
10
0%
M.i
nfe
rio
res
(20
) 12
9.6
104.
3 [3
27.5
-
54.3
] 11
8.9
10.7
2.
6 5.
2 12
0 0%
71
,1%
42
%
Via
ven
osa
(3
)*
115.
9 11
6.1
[118
.5 -
11
3.2]
11
0.2
5.8
1.7
3.7
90.3
0%
80
.8%
0%
Ab
dom
ina
l (3
)*
99.5
93
.4
[179
.2 -
26]
90.8
8.
7 1.
8 2.
3 84
.7
0%
85.3
%
33%
Ren
al
(5)
300.
9 27
3.6
[530
.1 -
63]
21
3.7
87.3
14
.1
6.8
177.
6 11
.8%
89
.7%
33
%
Pu
lmon
ar
(4)
138.
3 15
1.1
[172
.5 –
78
.3]
90.8
47
.5
12.8
5
20.7
0%
95
.8%
0%
Pro
cedi
mie
ntos
DIA
GN
ÓS
TIC
OS
VA
SC
UL
AR
ES
– F
LE
BO
GR
AF
ÍAS**
Esp
erm
áti
ca (
3)*
22
5.8
194.
1 [4
07.1
–
76.2
] 12
0.4
105.
4 23
.9
3.7
138.
3 8.
6%
90.3
%
67%
Ovári
ca (
3)*
19
8.5
216.
7 [2
54.0
-
124.
7]
125.
6 72
.9
16.3
6.
3 18
5.7
0%
66.4
%
0%
Fis
tulo
gra
fía
(5
) 25
.8
36.6
[3
9.7
– 4.
5]
24.6
1.
2 1.
5 4.
4 8.
2 0%
79
.6%
20
%
Pro
cedi
mie
ntos
TE
RA
PÉ
UT
ICO
S V
AS
CU
LA
RE
S –
EM
BO
LIZ
AC
IÓN
**
Em
.vari
coce
le
(10)
153.
5 13
0 [3
24.6
– 6
0]
79.2
74
.3
17.3
4.
3 10
8.9
21.9
%
65.9
%
20%
Pro
cedi
mie
ntos
TE
RA
PE
ÚT
ICO
S V
ISC
ER
AL
ES
– A
PA
RA
TO
DIG
ES
TIV
O**
Dil
. E
sofá
gic
a (
3)*
42
41
.4
[55.
2 –
29.5
]1.
2 40
.8
12
4 7.
3 0%
33
.6%
0%
* D
atos
Pre
lim
inar
es.
** R
esolu
ción d
e la
im
agen
uti
liza
da:
ME
DIA
.
(Nº)
: re
pre
senta
el
núm
ero d
e pro
cedim
iento
s.
IAEA-CN-85-190
241

IAEA-CN-85-190
242
TABLA 2 * MEDIA MEDIANA 1º PERCENTIL 3º PERCENTIL MÁXIMO MÍNIMO
Dosis piel máximo en
Art. Cerebral (37)
338.9
mGy
250.2 mGy 93.5 mGy 527.9 mGy 1135 mGy 12 mGy
El valor de dosis en piel ha sido asignado al valor de dosis en piel máximo de entre 5 TLDs colocados
en la cabeza del paciente [1]. () indica número de estudios
.TABLA 3 (*) indica valores preliminares
Procedimiento [autor] (nº proc) PDA
medio
PDA
mediana
PDA
rango
PDA
grafía
PDA
escopia
T.esc.
(min)
Nº de
imágenes
Art. Cerebral Este trabajo (48) 182.4 153.6 20-491 150.4 32 10.6 239
[3] (28) 74.1 69.6 21-196 45.8 28.2 12.1 -
[4] (90) 45.8 - - - - - -
[8.a] (-) 67 - - - - - -
[8.b] (-) 23 - - - - - -
[8.c] (-) 82 - - - - - -
[9.a] (9) 50.53 53.6 21-79 - - 16 172
[9.b] (9) 82.83 74.8 39-131 - - 18 81
[10] (40) 66.63 51.8 15-232 - - - -
Art. Miembros
inferiores
Este trabajo (20) 129.6 104.3 54-328 118.9 10.7 2.6 120
[2] (35) 61 33 9-77 19 11 4 37
[3] (15) 79.8 61.7 8.5-187 51.9 28 7.5 -
[7] (323) 77.9 68.6 <306 - - - -
[8.a] (-) 66 - - - - - -
[8.b] (-) 30 - - - - - -
[8.c] (-) 58 - - - - - -
[9.a] (18) 28 16 11-81 - - 5 92
[9.b] (12) 58.2 52 39-90 - - 6 43
[10] (40) 66.63 51.8 15-232 - - - -
Aortografía
abdominal
Este trabajo (3) 99.5 93.4 26-179 90.8 8.7 1.8 84.7
[2] (16) 61 33 8-192 25 36 7 37
[3] (21) 118 102 22-301 72.1 46.1 8 -
[10] (-) 24.7 - - - - - -
Art. Renal Este trabajo (5) 300.9 273.6 63-560 213.7 87.3 14.1 177.6
[3] (6) 39.8 36.5 17-72 22.1 17.7 5.1 -
[5] (8) 95 - 41-186 - - 12.1 -
[6] (36) 77 75.3 <170 - - - -
[8.a] (-) 92 - - - - - -
[8.c] (-) 75 - - - - - -
[9.a] (9) 81.6 78.1 62-108 - - 11 92
[9.b] (10) 74.6 81 31-106 - - 7 43
[10] (14) 92.9 82.7 32-186 - - - -
Art. Pulmonar Este trabajo (4) 138.3 151.1 78-173 90.8 47.5 12.8 207.3
[3] (7) 85.2 39 14-185 36.2 49 22.1 -
TIPS (vascular
terapéutico)
Este trabajo (*) 444.8 - - 382.4 62.4 12 82
[3] (4) 524 347 <1131 125 400 48.4 -

IAEA-CN-85-190
243
[7] (56) 182 158 <470 - - - -
[8.a] (-) 354 - - - - - -
[8.b] (-) 457 - - - - - -
[8.c] (-) 310 - - - - - -
Embolización
varicocele
(vascular
terapéutico)
Este trabajo (10) 153.5 130 60-325 79.2 74.3 17.3 108.9
[2] (20) 75 62 7-260 2 73 13 3
[8.b] (-) 75 - - - - - -
[8.c] (-) 106 - - - - - -
[9.a] (10) 80.4 79.1 37-135 - - 20 38
[9.b] (10) 106.3 101.8 43-180 - - 30 2.2
Bibliografía
[1] Gómez P. y col. Dosis de entrada en superficie en arteriografías cerebrales.
Radioprotección nº extr. (2000), 196-198.
[2] Ruiz-Cruces R. y col. Estimation of effective dose in some digital angiographic and
interventional procedures. Br. J. Radiol., 71 (1998), 42-47.
[3] McParland BJ. A study of patient radiation doses in interventional radiological
procedures. Br. J. Radiol., 71(1998), 175-185.
[4] Marshall NW. y col. Patient and staff dosimetry in neuroradiological procedures. Br. J.
Radiol. 1995;68:495-501
[5] Steele HR. y col. Patient doses received during digital substraction angiography. Br. J.
Radiol. 1993;66:452-6
[6] Broadhead DA. y col. Doses received during interventional procedures. In: Proceedings
of the International Congress on Radiation Protection, Vienna, 1996. 1996:3-438-40.
[7] Williams J. The interdependence of staff and patient doses in interventional radiology. Br.
J. Radiol. 1997;70:494-503.
[8] Ruiz-Cruces R. y col. Metodología para la obtención de niveles de referencia de dosis en
radiología intervencionista. [a]:Complutense; [b] : La Laguna; [c] Málaga.
[9] Ruiz-Cruces R. y col. Patient dose in radiollogically guided interventional vascular
procedures: conventional versus digital systems. Radiology 1997; 205:385-393.
[a]:Convencional; [b] Digital.
[10] Vañó E. y col. Patient dose values in interventional radiology. Br. J. Radiol., 68, 1215-
1220.

IAEA-CN-85-200
244
PATIENT DOSES IN INTERVENTIONAL CARDIOLOGY
F. Carrera
1,2, C. Ojeda
2,
A. Sánchez1,
I. Tort1,
R. Ruiz-Cruces2,
J. Francisco Díaz2
1Grupo de Investigación en Protección Radiológica de la Universidad de Málaga, Malaga, Spain 2Área Hospitalaria Juan Ramón Jiménez de Huelva, Huelva, Spain Abstract
Cardiovascular diseases are the first cause of dead in Spain. The most usual procedures in interventional
cardiology are coronariography and PTCA. The first is a diagnostic technique, and the second one is
interventional. Our goal has been to study procedures made during the first six months in the Interventional
Cardiology Unit of the Juan Ramón Jimenez Hospital (Huelva-Spain), having in account radiation protection
issues.
We have studied 178 patients; 145 of them were underwent coronariography, and 33 of the patients had PTCA
too. Every case was analyzed having in account technical and dosimetric parameters.
We show parameters values gathered: Diagnostic techniques (valvular and non-valvular patients), and
interventional techniques (coronariography and PTCA in different or in the same intervention.
Higher doses were obtained with valvular patients, although the number of frames was similar. Attending to
therapeutic procedures, the highest values were got with the “double” interventions. Interventional procedures
exceed in 60% doses got in diagnostic studies; this is because of the number of series and number of frames per
series. Similar values obtained by other authors have been got.
1. Introducción
Las enfermedades cardiovasculares son la primera causa de muerte en España (un 38 por ciento del total de los decesos: 44,4 por ciento mujeres y 32,5 por ciento hombres) [1]. Estas enfermedades se agrupan en tres grandes bloques: patología coronaria (angina de pecho, infarto de miocardio y muerte súbita), valvulopatías (procesos que afectan a las cuatro válvulas cardiacas: aórtica, pulmonar, mitral y tricúspide) y dolencias congénitas. Los procedimientos más habituales en un laboratorio de hemodinámica y cardiología intervencionista de pacientes adultos son: coronariografías, estudios de pacientes valvulares en los que se incluye casi siempre la coronariografía de forma asociada y finalmente los procedimientos intervencionistas de dilatación coronaria (angioplastia).
La coronariografía o estudio del árbol coronario con la ayuda de la radioscopia sigue constituyendo el patrón de referencia para estudiar la presencia y extensión de la enfermedad coronaria. Su realización estará indicada si la presencia de enfermedad coronaria va a determinar de manera significativa el manejo del paciente, cuando se quiera valorar las posibilidades de revascularización coronaria o identificar a aquellos pacientes que presentan alto riesgo de complicaciones isquémicas. El procedimiento de coronariografía diagnóstica implica la canulación selectiva de la coronaria derecha y de la coronaria izquierda y la inyección de contraste yodado con filmación en diversas proyecciones. Finalmente, con otro catéter, se opacifica con 40 cc de contraste el ventrículo izquierdo y se filma en proyección OAD. El procedimiento valvular suele incluir la coronariografía anterior y manipulaciones adicionales con monitorización en radioscopia para mediciones fisiológicas. A veces se realiza además opacificación de la aorta ascendente con 60 cc de contraste. La angioplastia coronaria transluminal percutánea (ACTP) se ha convertido desde 1992 en la técnica de revascularización miocárdica más frecuentemente utilizada en España[2,3]. Consiste en la dilatación de una o varias estenosis dentro de una o varias arterias coronarias.

IAEA-CN-85-200
245
Según la complejidad se necesitan periodos variables de radioscopia y filmación coronariográfica. Habitualmente, la angioplastia precisa de un estudio coronariográfico previo completo que puede hacerse en una sesión aparte o bien en inmediata continuidad con la angioplastia. La proliferación de ACTP es creciente[4], y ha venido acompañada de la descripción de casos de efectos deterministas, fundamentalmente en piel, debidos a las altas dosis de radiación involucradas en los procedimientos tanto diagnósticos [5] como terapéuticos [6]. En nuestro trabajo hemos pretendido caracterizar desde el punto de vista de la protección radiológica las intervenciones realizadas durante el primer semestre de funcionamiento del Laboratorio de hemodinámica del Área Hospitalaria Juan Ramón Jiménez de Huelva.
2. Material y métodos Hemos analizado los datos de los procedimientos realizados sobre 178 pacientes, en el periodo comprendido entre el 22 de junio y el 29 de septiembre de 2000. De esos pacientes, 133 (74.7%) sufrieron únicamente coronariografía diagnóstica (identificados como “CORO”), 12 (6.7%) eran pacientes valvulares que sufrieron coronariografía (identificados como “VAL-CORO”), 20 (11.2%) fueron citados tras una coronariografía para una ACTP (identificados como “ACTP”), y 13 (7.3%) sufrieron la coronariografía y la angioplastia en la misma sesión (identificados como “CORO-ACTP”). De cada paciente se dispuso de los siguientes datos: Producto dosis-área (PDA) por radioscopia, por grafía y total; nº de series de grafía realizadas, y para cada serie, nº de imágenes, velocidad de adquisición, identificada por el protocolo de adquisición empleado (“ventrículo” con 25 imágenes por segundo, y coronario, con 12.5), kVp, mA y tiempo de exposición, ángulos cráneo-caudal y lateral del arco, distancia foco-receptor de imagen y tamaño de campo empleado. 3. Resultados Se muestran, para cada uno de los cuatro grupos, los valores promedio, intervalos de incertidumbre al 90% de confianza, de acuerdo a una distribución t de Student salvo para el grupo “CORO” que suponemos se ajusta bien a una distribución normal, valores máximo y mínimo de todos los parámetros disponibles para cada estudio. Se agrupan en coronariografías generales y de pacientes valvulares (CORO Y VAL-CORO) en la Tabla I, y pacientes coronariográficos que sufrieron posteriormente (ACTP) o en el mismo acto (CORO-ACTP) una angioplastia, en la Tabla II. 4. Discusión Para procedimientos exclusivamente diagnósticos, en pacientes valvulares se ha obtenido una dosis a paciente similar por radioscopia que por grafía, con un PDA total de 41.3 Gy·cm2. Para pacientes no valvulares, el tiempo y la dosis por radioscopia es aproximadamente la mitad, con la consiguiente reducción en el PDA (27.8 Gy·cm2). El número de series y el número de imágenes por serie, en promedio, son prácticamente iguales en ambos tipos de pacientes.

IAEA-CN-85-200
246
Tabla I. Coronariografías generales y de pacientes valvulares (CORO Y VAL-CORO)
ESTUDIO VAL-COROS COROS
12 Pacientes 133 Pacientes
Med. Inc. Máx. Min. Med. Inc. Máx. Min.
PDA Radioscopia 20.0 21.2 45.5 3.6 8.2 6.1 31.7 0.6
PDA Radiografía 21.3 29.4 50.8 4.9 19.6 9.9 66.6 0.3
PDA Total 41.3 48.5 96.3 8.5 27.8 15.9 98.3 0.9
t Radioscopia.(min.) 10.7 8.2 22.3 4.5 4.4 2.8 18.4 1.5
Nº Series 12 9.0 28 7 11 4 36 1
Nº Imágenes 723 517.3 1551 276 758 325 2114 32
kVp 73.8 10.0 89.0 64.8 72.7 4.0 86.9 60.0
mA 621.8 151.4 752.3 433.4 620.2 77.6 789.9 315.0
Edad 68.9 129.8 84.6 42.3 62.0 90.3 99.9 38.8
Uso APR "Ventrículo" 1.1 1.8 4.0 0.0 0.9 0.8 7.0 0.0
Uso APR "Coronario" 11.3 10.0 28.0 3.0 10.3 4.3 36.0 0.0
Distancia FR 105.1 5.2 110.7 99.7 103.7 2.5 115.4 98.1
Uso lupa 17 7.1 10.3 28.0 0.0 8.1 4.4 19.0 0.0
Uso lupa 23 5.3 5.6 13.0 0.0 3.2 3.9 29.0 0.0
Med. Media; Inc. Incertidumbre; Máx. Máximo; Min. Mínimo; PDA.- Producto de la dosis por el área
irradiada.
Tabla II. Pacientes coronariográficos más angioplastia posterior (ACTP) o en el mismo acto
(CORO-ACTP) una angioplastia
ESTUDIO ACTP-H CORO-ACTP
13 Pacientes 20 Pacientes
Med. Inc. Máx. Min. Med. Inc. Máx. Min.
PDA Radioscopia 22.8 29.9 53.3 3.9 19.1 30.8 84.3 6.6
PDA Radiografía 28.2 35.8 59.3 8.2 48.1 45.2 126.2 15.6
PDA Total 51.0 60.6 112.6 12.1 67.2 74.0 210.5 26.1
t Radioscopia.(min.) 11.1 10.7 27.6 3.4 7.5 6.7 14.9 3.2
Nº Series 28 21.5 51 9 20.9 11.5 38.1 12.2
Nº Imágenes 923 795.1 2304 366 1191.3 787.9 2183.8 478.7
kVp 76.2 8.3 87.2 69.4 60.2 5.8 68.6 55.0
mA 703.1 113.8 815.8 576.5 539.5 102.2 632.2 423.0
Edad 61.9 126.1 89.0 43.7 47.7 118.2 61.4 0.1
Uso APR "Ventrículo" 0.1 0.4 1.0 0.0 1.3 3.9 7.3 0.0
Uso APR "Coronario" 27.8 21.6 51.0 8.0 19.7 14.3 37.3 6.5
Distancia FR 105.3 6.6 113.6 97.2 84.8 3.0 88.7 82.4
Uso lupa 17 26.0 24.5 51.0 0.0 18.1 12.8 37.3 5.7
Uso lupa 23 1.9 8.7 22.0 0.0 2.9 4.1 8.9 0.0
Med. Media; Inc. Incertidumbre; Máx. Máximo; Min. Mínimo; PDA.- Producto de la dosis por el área
irradiada.
Para pacientes que sufren angioplastia, se observan valores superiores de PDA por grafía en aquellos en los que se realiza la misma a continuación del estudio diagnóstico, como es de esperar al tratarse de un estudio “doble”. Los valores de radioscopia son similares, e incluso los de número de series, pero no así el de imágenes por serie, que es casi de 300 imágenes superior, en promedio, para el procedimiento extendido.

IAEA-CN-85-200
247
Comparando procedimientos terapéuticos frente a diagnósticos, se evidencia una mayor dosis a paciente en los primeros, de casi un 60% superior en promedio, debido fundamentalmente a que se duplican las series por paciente, y el número de imágenes por serie, que es superior en promedio en unas 300 imágenes. En todos los procedimientos son mayoritarios el uso de tamaño de campo de 17 cm. y velocidad de adquisición de 12.5 imágenes por segundo. En la Tabla III comparamos nuestros valores (en cursiva) con valores de otros autores, encontrando buena correspondencia.
Tabla III. Análisis comparativo de nuestros resultados con los obtenidos por otros autores
Tiempo de radioscopia
(min.)
media (min.-máx.)
PDA (Gy·cm2) Nº de imágenes
Coronariograf
ía
ACTP Coronariograf
ía
ACTP Coronariograf
ía
ACTP
4.4
(1.5-18.4)
11.2
(3.4-27.6)
27.8
(0.9-98.3)
51
(60.6-112.6)
758
(32-2114)
923
(366-
2304)
0.35 [7] 12
(7-35) [8]
72.18 [7] 100 [8] 1550 [7] 450 [7]
3.55 [9] 12.8
(0.1-180)
[10]
39.3 [9] 81.68 [11] 1434 [9]
15.5
(2.63-61.1)
[7]
93
(33-402)
[12]
18.6 [9] 28.5
(20-50.5)
[13]
110
(40-340)
[16]
87.5
(67-122)
[15]
58
(0.5-810)
[10]
101.9 [9]
93.3 [7]
91.8 [17]
42.0 [14]
60.0 [18-19]
Entre paréntesis el rango.
Es oportuno destacar, como queda de manifiesto en este trabajo, las cada vez mayores posibilidades que ofrecen los equipos dedicados a estudios hemodinámicos, a la hora de caracterizar de forma precisa la dosis efectiva al paciente, como resultado de la identificación exhaustiva de las proyecciones y tamaños de campo empleados, como de los PDA obtenidos.

IAEA-CN-85-200
248
Queda, para completar un nivel superior de información del detrimento radiológico al paciente, de acuerdo a la clasificación del grupo de expertos del Artículo 31 de la Directiva MED [20], la implementación de métodos asumibles [21] para la determinación de la dosis a órganos y dosis efectiva, que, en cardiología intervencionista, es especialmente complicado por la profusión de proyecciones no coplanares. Bibliografia [1] FUNDACIÓN ESPAÑOLA DEL CORAZÓN. Revista Corazón y Salud, 16 (2000). [2] SORIANO J, ALFONSO F, CEQUIER A, MORÍS C. Registro de actividad de la
sección de hemodinámica y cardiología intervencionista del año 1997. Rev Esp Cardiol (1998); 51: 927-938.
[3] IGUAL A, SAURA E. Cirugía cardiovascular en España en el año 1996. Registro de intervenciones de la Sociedad Española de Cirugía Cardiovascular. Cir Cardiovas (1998); 5: 115-124.
[4] UNGER F. Cardiac Interventions in Europe 1996: Open Heart surgery and coronary revascularization. Report of the European Heart Institute of the European Academy of Sciences and Arts. Cor Europeum (1998); 7: 81-93.
[5] LICHTENSTEIN D.A., KLAPHOLZ, L., VARDY, D.A., LEICHTER, I., MOSSERI, M., KLAUS, S.N., GILEAD, L.T. Chronic radiodermitis following cardiac catheterization. Arch Dermatol 132, 663-7.
[6] SOVIC, E., KLOW, N.E., HELLESNES, J., LYKKE, J. Radiation-induced skin injury after percutaneous transluminal coronary angioplasty.
[7] MACCIA, C. An optimization study of cardiac interventional radiology procedures: an experience in France. Proceedings of the ERPET Course “Radiation Protection in Interventional Radiology”(1997) Madrid - Spain.
[8] ZEITLER, E. Joint WHO/Institute for Radiation Hygiene Workshop on efficacy and radiation safety in Interventional Radiology. Proceedings of the ERPET Course “Radiation Protection in Interventional Radiology”, (1997), Madrid - Spain.
[9] PADOVANI, R. Experience in Italy: Cardiological and neuroradiological data. Proceedings of the ERPET Course “Radiation Protection in Interventional Radiology” (1997) Madrid - Spain.
[10] SCHMIDT, T. Personal Communication (1995). [11] VAÑÓ, E., GONZÁLEZ, L. Patient dose: Reference Values for I.R. Possibilities and
advantages. Proceedings of the ERPET Course “Radiation Protection in Interventional Radiology” (1997) Madrid (Spain).
[12] NEOFOTISTOU, V. Personal Communication. (1995). [13] FAULKNER, K., LOVE, H. G., SWEENEY, J. K., BARDSLEY, R.A. radiation dose
and somatic risk to patients during cardiac radiological procedures. Br J Radiol 59 (1986) 359-363.
[14] HUYSKENS, C.J., HUMMEL, W.A. data analysis on patient exposures in cardiac angiography. Radiation Protection Dosimetry, 57 (1995) 475-480.
[15] BERNHARDT, J., VEIT, R., BAUER, B. Erhebungen zur effektiven Dosis und zur Kollektivdosis bei der Röntgendiagnostik in den alten Bundesländern. Veröffentlichungen der Strahlenschutzkommission, Bd 30. Gustav Fischer Verlag. (1995).
[16] BAKALYAR, D.M., CASTELLANI, M.D., SAFIAN, R.D., TIMMIS, G.C. Radiation exposure to patients during diagnostic and interventional cardiac catheterization procedures. catheterization and cardiovascular Diagnosis, 52 (1994), 94.
[17] MACCIA, C. CEC Research Project. Contract: F13PCT930070, (1992-1994).

IAEA-CN-85-200
249
[18] HEINRICH, K.W. Personal Communication. [19] GLEINCHMANN, U., MANNEBACH, H., LICHTIEN, P. Bedcht Cjber Struktur und
Leistungszahien der Hertzkatheterfabors in der Bundesrepublik Deutschland. Z. Kardiol. 82 (1993) 46-50.
[20] WORKING PARTY ON MEDICAL EXPOSURE. GROUP OF EXPERTS OF THE ARTICLE 31 OF THE EURATOM TREATY. Reference Levels for Interventional Radiology. Ref. IR (EC99c). Document. 1999
[21] VAÑÓ, E., GUIBELALDE, E., FERNÁNDEZ, J.M., GONZÁLEZ, L., TEN, J.I. Patient dosimetry in interventional radiology using slow film systems. British Journal of Radiology, 70 (1997) 195-200.

IAEA-CN-85-76
250
RADIATION RISK EVALUATION AND REFERENCE DOSES IN
INTERVENTIONAL RADIOLOGY
K. Faulkner1, E. Vano
2, R. Padovani
3, J. Zoetelief
4
1Quality Assurance Reference Centre, Newcastle General Hospital,
Newcastle upon Tyne, United Kingdom 2
Department of Radiology, Faculty of Medicine, Complutense University, Madrid, Spain 3Azienda Ospedaliera S. Maria Della Misericordia, Istituto di Fisica Sanitaria, Udine, Italy
4 Delft University of Technology, Interfaculty Reactor Institute/Radiation Technology/
Medical Physics, Delft, Netherlands
Abstract
In interventional radiology, there are two potential hazards to the patient. These are somatic risks and, for certain
procedures, deterministic injuries. The task of radiation protection in interventional radiology is to minimise
somatic risks and avoid deterministic injuries. Radiation protection tools and protocols must be developed to
achieve these two objectives. Reference doses have been proposed as a method of identifying high dose centres
and equipment. The role of reference doses in interventional radiology will be discussed. There are two
approaches to reference doses in interventional radiology. These are the measurement of patient entrance skin
dose or skin dose rate, or image intensifier input dose rate. Alternatively, dose area product or effective dose to
the patient may be monitored. These two main approaches have their advantages and disadvantages.
1. Introduction
The International Commission on Radiological Protection first introduced the concept of
reference doses in Publication 60 [1]. The use of reference doses has been expanded in Report
73 [2]. In paragraph 100 ‘the commission now recommends the use of diagnostic reference
levels for patients. These levels which are a form of investigation level apply to an easily
measured quantity, usually the absorbed dose in air or in a tissue equivalent material at the
surface of a simple standard phantom or representative patient’. ICRP introduced the concept
of reference doses as a means of identifying centres, equipment or procedures that consistently
exceeded the appropriate reference dose level. If these reference dose levels were exceeded,
then it was intended that there would be a local review of practice and procedures within the
centre and that optimisation studies would be concentrated on high dose equipment as a
consequence.
Reference levels were intended to apply to medical exposures and not to occupational or
public exposures and are therefore entirely different in nature from dose limits and dose
constraints. In practice, reference doses may be regarded as an optimisation tool for the
reduction of patient doses in radiology. It was intended by ICRP that the reference dose levels
would be selected by professional medical bodies and reviewed as they regarded reference
doses as an evolving concept that would continually drive down radiation dose levels to
patients.
2. Interventional radiology
Interventional radiology procedures almost invariably involve the use of fluoroscopy using
image intensification. There has been a number of reports of deterministic injuries occurring
in patients undergoing certain types of interventional radiology procedures that have long
fluoroscopy times. Thus, the purpose of applying reference doses in interventional radiology is
to minimise the risk of somatic effects and to avoid the occurrence of deterministic injuries for
certain types of procedure.
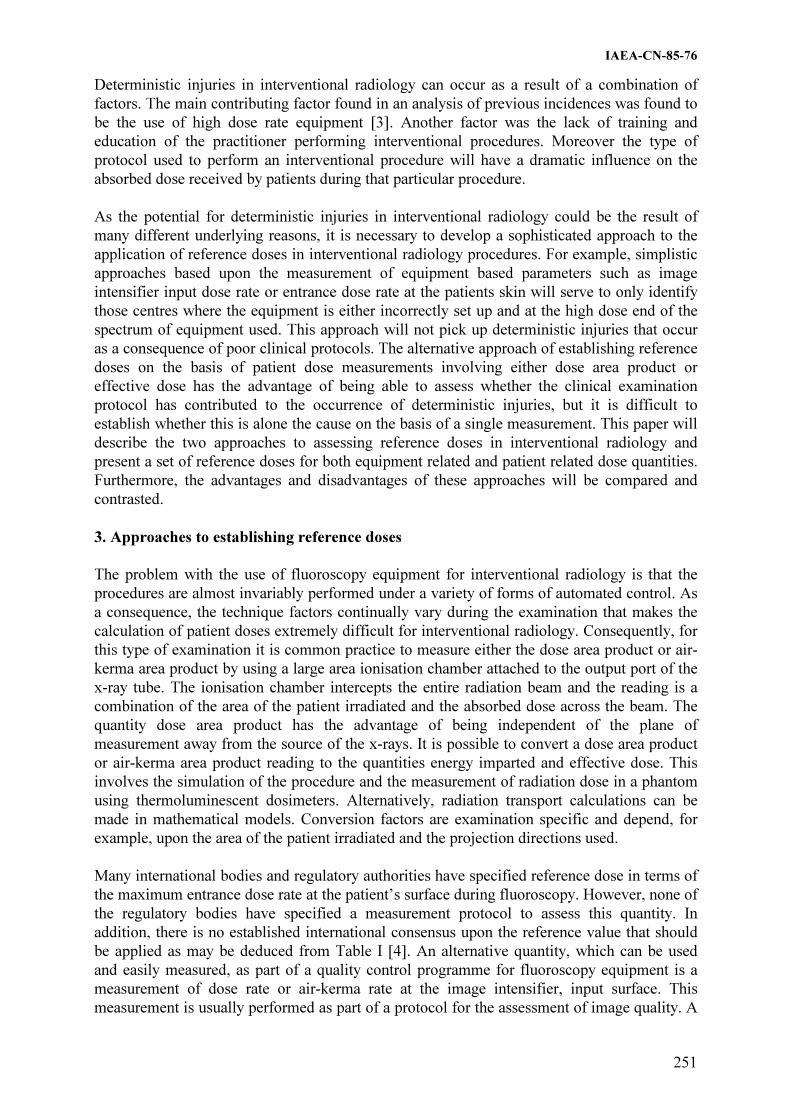
IAEA-CN-85-76
251
Deterministic injuries in interventional radiology can occur as a result of a combination of
factors. The main contributing factor found in an analysis of previous incidences was found to
be the use of high dose rate equipment [3]. Another factor was the lack of training and
education of the practitioner performing interventional procedures. Moreover the type of
protocol used to perform an interventional procedure will have a dramatic influence on the
absorbed dose received by patients during that particular procedure.
As the potential for deterministic injuries in interventional radiology could be the result of
many different underlying reasons, it is necessary to develop a sophisticated approach to the
application of reference doses in interventional radiology procedures. For example, simplistic
approaches based upon the measurement of equipment based parameters such as image
intensifier input dose rate or entrance dose rate at the patients skin will serve to only identify
those centres where the equipment is either incorrectly set up and at the high dose end of the
spectrum of equipment used. This approach will not pick up deterministic injuries that occur
as a consequence of poor clinical protocols. The alternative approach of establishing reference
doses on the basis of patient dose measurements involving either dose area product or
effective dose has the advantage of being able to assess whether the clinical examination
protocol has contributed to the occurrence of deterministic injuries, but it is difficult to
establish whether this is alone the cause on the basis of a single measurement. This paper will
describe the two approaches to assessing reference doses in interventional radiology and
present a set of reference doses for both equipment related and patient related dose quantities.
Furthermore, the advantages and disadvantages of these approaches will be compared and
contrasted.
3. Approaches to establishing reference doses
The problem with the use of fluoroscopy equipment for interventional radiology is that the
procedures are almost invariably performed under a variety of forms of automated control. As
a consequence, the technique factors continually vary during the examination that makes the
calculation of patient doses extremely difficult for interventional radiology. Consequently, for
this type of examination it is common practice to measure either the dose area product or air-
kerma area product by using a large area ionisation chamber attached to the output port of the
x-ray tube. The ionisation chamber intercepts the entire radiation beam and the reading is a
combination of the area of the patient irradiated and the absorbed dose across the beam. The
quantity dose area product has the advantage of being independent of the plane of
measurement away from the source of the x-rays. It is possible to convert a dose area product
or air-kerma area product reading to the quantities energy imparted and effective dose. This
involves the simulation of the procedure and the measurement of radiation dose in a phantom
using thermoluminescent dosimeters. Alternatively, radiation transport calculations can be
made in mathematical models. Conversion factors are examination specific and depend, for
example, upon the area of the patient irradiated and the projection directions used.
Many international bodies and regulatory authorities have specified reference dose in terms of
the maximum entrance dose rate at the patient’s surface during fluoroscopy. However, none of
the regulatory bodies have specified a measurement protocol to assess this quantity. In
addition, there is no established international consensus upon the reference value that should
be applied as may be deduced from Table I [4]. An alternative quantity, which can be used
and easily measured, as part of a quality control programme for fluoroscopy equipment is a
measurement of dose rate or air-kerma rate at the image intensifier, input surface. This
measurement is usually performed as part of a protocol for the assessment of image quality. A
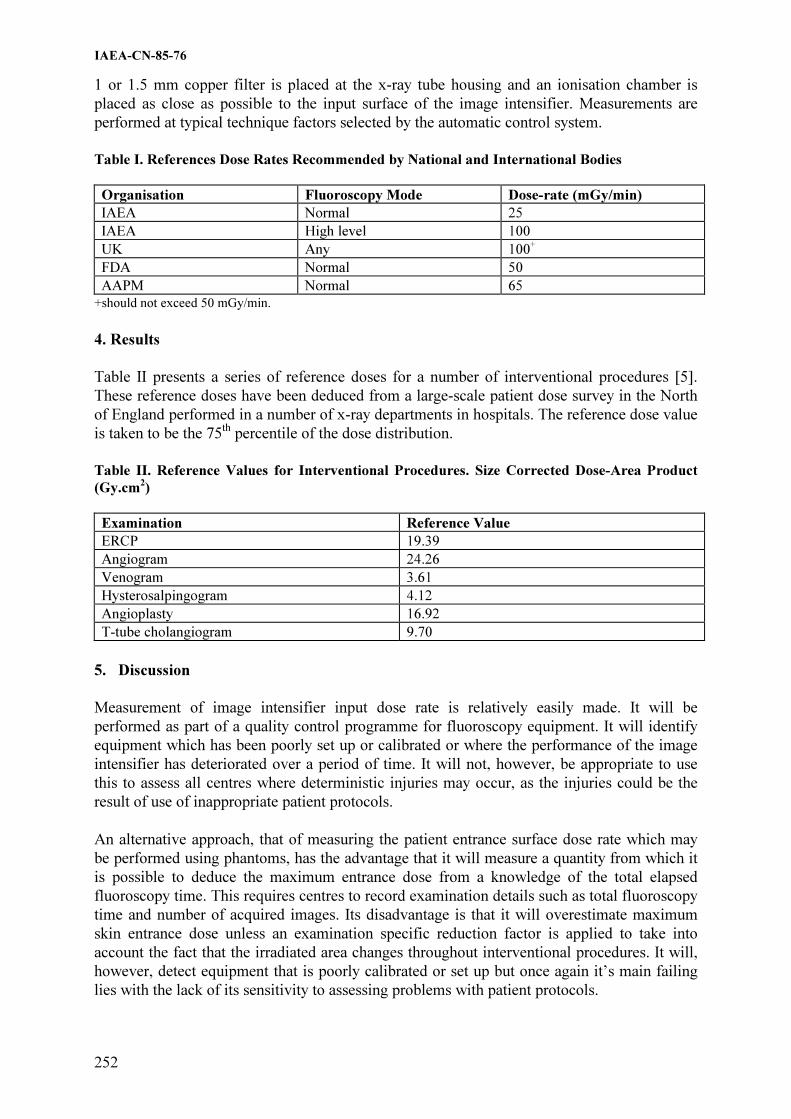
IAEA-CN-85-76
252
1 or 1.5 mm copper filter is placed at the x-ray tube housing and an ionisation chamber is
placed as close as possible to the input surface of the image intensifier. Measurements are
performed at typical technique factors selected by the automatic control system.
Table I. References Dose Rates Recommended by National and International Bodies
Organisation Fluoroscopy Mode Dose-rate (mGy/min)
IAEA Normal 25
IAEA High level 100
UK Any 100+
FDA Normal 50
AAPM Normal 65
+should not exceed 50 mGy/min.
4. Results
Table II presents a series of reference doses for a number of interventional procedures [5].
These reference doses have been deduced from a large-scale patient dose survey in the North
of England performed in a number of x-ray departments in hospitals. The reference dose value
is taken to be the 75th
percentile of the dose distribution.
Table II. Reference Values for Interventional Procedures. Size Corrected Dose-Area Product
(Gy.cm2)
Examination Reference Value
ERCP 19.39
Angiogram 24.26
Venogram 3.61
Hysterosalpingogram 4.12
Angioplasty 16.92
T-tube cholangiogram 9.70
5. Discussion
Measurement of image intensifier input dose rate is relatively easily made. It will be
performed as part of a quality control programme for fluoroscopy equipment. It will identify
equipment which has been poorly set up or calibrated or where the performance of the image
intensifier has deteriorated over a period of time. It will not, however, be appropriate to use
this to assess all centres where deterministic injuries may occur, as the injuries could be the
result of use of inappropriate patient protocols.
An alternative approach, that of measuring the patient entrance surface dose rate which may
be performed using phantoms, has the advantage that it will measure a quantity from which it
is possible to deduce the maximum entrance dose from a knowledge of the total elapsed
fluoroscopy time. This requires centres to record examination details such as total fluoroscopy
time and number of acquired images. Its disadvantage is that it will overestimate maximum
skin entrance dose unless an examination specific reduction factor is applied to take into
account the fact that the irradiated area changes throughout interventional procedures. It will,
however, detect equipment that is poorly calibrated or set up but once again it’s main failing
lies with the lack of its sensitivity to assessing problems with patient protocols.

IAEA-CN-85-76
253
The assessment of dose area product or effective dose using a dose area product meter has the
advantage of producing a quantity that is closely related to the somatic risk of the procedure.
For this reason, it is recommended for use, as it will give an indication of those centres where
the somatic risks are going to be the greatest. Unfortunately, its relationship to maximum skin
entrance dose is somewhat tenuous. For example, examinations that have a high dose area
product will not necessarily result in a high risk of deterministic injuries to the patient because
the irradiated area may change during the examination. It is therefore recommended that a
combined approach to the application of reference doses in interventional radiology be
adopted. This would involve the measurement of phantom related dose quantities such as
image intensifier, input dose rate or maximum skin entrance dose rate at the surface of a
patient equivalent phantom, as well as the assessment of effective dose using dose-area for
procedures actually performed on patients.
One problem with the use of effective dose measured on patients could be the difficulty of
measuring the quantity on a group of patients whose size and build correspond to that of
reference man or woman. Interventional radiology is a type of procedure that is performed on
relatively sick patients who may not have the same size and composition as reference man. As
a result, it may be difficult to determine the reference dose for a group of patients whose size
corresponds to that of reference man. In these circumstances it is probably best to perform the
series of measurements on all patients who attend the clinic for a specific interventional
procedure and apply a height and weight conversion factor to allow for any deviation in size
and composition from that of reference man [6]. This technique was first proposed by
Linskoug [6] and has been further developed by Chapple et al [7]. It enables reference doses
to be obtained from large-scale patient dose surveys by correcting each individual dose
quantity into that which it would have been if the individual corresponded to the size and
composition of reference man. Thus, there will be a greater statistical certainty are put on the
dose quantity derived in this manner.
References
[1] INTERNATIONAL COMMISSION ON RADIOLOGICAL PROTECTION. 1990
Recommendations of ICRP. Report 60. (Pergamon Press, Oxford). 1991.
[2] INTERNATIONAL COMMISSION ON RADIOLOGICAL PROTECTION. Protection
of the patient in diagnostic radiology. Report 73. (Pergamon Press, Oxford). 1997.
[3] K FAULKNER, E VANO (in press). Deterministic effects in interventional radiology.
Radiation Protection Dosimetry.
[4] K FAULKNER (in press). Introduction to constancy check protocols in fluoroscopic
systems. Radiation Protection Dosimetry.
[5] DA BROADHEAD, C-L CHAPPLE, K FAULKNER. Reference doses during
fluoroscopic procedures. Radiation Protection Dosimetry 80 (1998) 143-144.
[6] BA LINDSKOUG. Reference man in diagnostic radiology. Radiation Protection
Dosimetry 43 (1992) 111-114.
[7] C-L CHAPPLE, DA BROADHEAD, K FAULKNER. A phantom based method for
deriving typical patient doses from measurements of dose-area product on populations
of women. British Journal of Radiology 68 (1995) 1083-1086.

IAEA-CN-85-61
254
AN ASSESSMENT OF METHODS FOR MONITORING ENTRANCE SURFACE
DOSE IN FLUOROSCOPICALLY GUIDED INTERVENTIONAL PROCEDURES����
J.C. Waite
Medical Physics Directorate, St Thomas’ Hospital, London, United Kingdom
M. Fitzgerald
Radiological Protection Centre (RPC), Department of Medical Physics and Bioengineering,
St George’s Hospital, London, United Kingdom
Abstract
In the light of a growing awareness of the risks of inducing skin injuries as a consequence of fluoroscopically
guided interventional procedures (FGIPs), this paper compares three methods of monitoring entrance surface
dose (ESD) It also reports measurements of ESDs made during the period August 1998 to June 1999 on 137
patients undergoing cardiac, neurological and general FGIPs. Although the sample is small, the results reinforce
the need for routine assessments to be made of ESDs in FGIPs. At present, the most reliable and accurate form
of ESD measurement would seem to be arrays of TLDs. However, transducer based methods, although likely to
be less accurate, have considerable advantages in relation to a continuous monitoring programme. It is also
suggested that there may be the potential locally for threshold dose area product (DAP) values to be set for
specific procedures. These could be used to provide early warning of the potential for skin injuries.
1. Introduction
In fluoroscopically guided interventional procedures, patients are being exposed to highly
localised X-ray sources for extended periods of time long enough to cause possible skin
injuries. A number of cases of severe skin injuries have been reported, which illustrate the
importance of dose saving techniques and monitoring procedures [1, 2]. The severity of
deterministic skin injuries increases with increasing absorbed dose and has a threshold level
under which no noticeable effects occur. Above a dose of 2 Gy, a transient erythema can
develop within hours of the procedure. This erythema is temporary and will fade within a
week or two. Skin injuries such as dermal necrosis and talangiectasis occur at much higher
doses of between 12 Gy and 20 Gy [3] and although cases have been reported of patients
receiving serious skin injuries suggestive of such high doses [4], most patients receive ESDs,
which are significantly below this level. A dosimetry study was undertaken comparing several
methods of monitoring patient dose with a view to identifying the most reliable and ‘user-
friendly’ method for routine use in a clinical environment.
2. Methods and materials
Doses were measured in one of three ways.
1. Thermoluminescent Dosemeters (TLD)
Lithium Fluoride (LiF) dosemeter chips were arranged in arrays of up to 35 chips. The
number of TLDs in each array and the position on the patient was optimised for each
procedure, based on a number of previous experimental trials. Patient details and exposure
factors were noted together with DAP meter readings. The maximum TLD reading was used
for comparison with the other measurement methods.
� Project partly funded by the Department of Health, United Kingdom.

IAEA-CN-85-61
255
2. McMahon Medical ‘Skin Dose Monitor’ (SDM) Model 104-101
The sensor contains a small scintillator in a reflective plastic housing, linked by a fibre optic
to a meter. The sensor is placed at the centre of the field on the skin using a disposable pad.
The energy range of the sensor is given by the manufacturer as being between 50 and 150 kVp
with a dose-rate range between 0.1 mGymin-1
and 3 Gymin-1
. Calibration of the SDM was
carried out using a calibrated ionisation chamber. The SDM was used in conjunction with a
TLD array on each patient for direct comparison.
3. PTW M4-KDK Dose Area Product (DAP) Meter
The M4-KDK consists of two parallel plates, separated by a non-sensitive region. The plates
each have two chambers, connected to an electrometer. The central chamber is entirely within
the x-ray beam and measures the air kerma at the output face of the x-ray tube; an inverse
square calculation is performed to calculate ESD.
3. Results
1. ESD Measurements
ESD measured for cardiac, neurological and general procedures are shown in Tables I-III.
Results shown were obtained using the TLD arrays. Most ESD values are below 1 Gy.
Table I. ESDs measured during cardiac procedures
Procedure
RF
Ablation
Angioplasty
PTCA
Diagnostic
LHC
EPS
Diagnostic
LHC &
Grafts
Range (Gy) 0.03 –
1.01
0.38 – 1.10 0.02 –
0.94
0.06 –
0.33
0.37 –
0.42
0.24 –
0.34
Mean ESD (Gy) 0.13 0.73 0.31 0.18 0.40 0.29
Sample Size 6 3 19 9 2 2
Table II. ESDs measured during neurological procedures
Procedure Angiogram Embolisation GDC Coiling
Range (Gy) 0.02 – 0.36 0.08 – 1.28 0.62 – 1.65
Mean ESD (Gy) 0.14 0.72 1.20
Sample Size 19 3 4

IAEA-CN-85-61
256
Table III. ESDs obtained for two types of general interventional procedures
Procedure Aortic Stent
Graft
PTA Iliac
Artery
Range (Gy) 0.37 – 3.34 0.23 – 0.97
Mean ESD (Gy) 3.09 0.42
Sample Size 3 4
Some monitored procedures do not appear in the above tables as insufficient numbers of
patients have been monitored. The highest ESD recorded (4Gy) was for a patient undergoing
a Renal PTA and Aortic Stent Graft.
A more simple method of monitoring ESD would be to establish a relationship between
measured ESD and DAP reading or fluoroscopy time. Correlation was determined through an
ordinary least squares regression model. No correlation between ESD and DAP data was
obtained for cardiac PTCA procedures. Some degree of correlation between ESD and
fluoroscopy time for general interventional procedures was found (R2
= 0.75, 16 patients) and
between DAP and ESD readings for neurological procedures using a 20cm field of view (R2
=
0.87, 10 patients).
4. Assessment of monitoring equipment
1. Thermoluminescent Dosemeters (TLD)
Each TLD was measured to be within 6% of the mean for each batch. TLD arrays were
considered the most consistent and accurate means of measuring ESDs. Consequently, the
SDM was compared against them. In addition, TLD arrays were the method of choice by
clinical staff. However, TLD arrays suffer from the substantial drawback of requiring labour
intensive post-exposure processing. Obviously, this will lead to delays before ESDs are
available for assessment.
2. McMahon Medical ‘Skin Dose Monitor’ (SDM) Model 104-101
The SDM was placed on a phantom at the centre of the field together with a calibrated
ionisation chamber and readings were compared. The SDM and chamber response agreed at �
90 kV but deviated at lower kVs. Monitor reproducibility was within � 1% over a five-hour
period. Stability was also tested and was found to agree with specifications. In the clinical
environment, the SDM was simple to operate. However, the fixing bracket designed to allow
the electrometer to be attached to the table rail was inconvenient and not used. Instead,
clinical staff tended to position the meter on the table.
3. PTW M4-KDK DAP Meter
The M4-KDK was found to have a similar uncertainty in its response to that of conventional
DAP meters. There was a slightly greater dependence of response with field area at field sizes
less than 200 cm2.

IAEA-CN-85-61
257
5. Discussion
During cardiac procedures, the majority of patients received skin doses below the level of 1
Gy. Results for neurological procedures show that monitoring every patient may not be
necessary for angiograms but routine monitoring of GDC coilings and embolisations should
be carried out. ESD values show the highest skin doses occurring during general
interventional procedures with most readings either approaching or exceeding 1 Gy. Although
routine monitoring is carried out by a DAP meter, the ESD is not usually known. The results
show that routine ESD monitoring should be considered, particularly for patients undergoing
multiple procedures. Although the threshold for transient erythema is recognised to be 2 Gy,
individual sensitivities may vary [5]. Therefore ESDs greater than 1 Gy should be recorded.
Correlation between ESD and DAP or fluoroscopy time could not be established for certain.
The best correlation between DAP and ESD seemed to be for neurological examinations.
This is not surprising since these examinations are unlikely to have large variations in field
size. On the whole, the correlation of DAP and measured ESD seems relatively poor.
Therefore, monitoring ESD, in addition to DAP and fluoroscopy time is necessary for
interventional procedures where there is a risk of high skin doses. However, the use of DAP
to monitor threshold values should not be discounted, especially if threshold values can be set
for individual centres and for specific examinations. The validity of this approach will
probably need to be established locally.
The most reliable method for monitoring skin dose was the use of TLDs. This was the most
popular method with clinical staff, although the slowest method, perhaps best suited to
‘sample monitoring’.
The SDM compared favourably with a calibrated ionisation chamber in the laboratory. It was
easy to use and produced a real time running total of the ESD. However, there were a number
of significant issues surrounding its design. The sensor had a small surface area and therefore
monitored a limited area of the skin. The success of the result was highly dependent upon the
skill of the radiographer in positioning the monitor correctly. This was not always possible.
The bracket supplied with the SDM was too bulky and was not used by any of the
departments. The fibre optic cables are fragile and in practice, should be replaced more often
than recommended. Cables were crushed underfoot or were coiled too tightly by staff. In
some procedures, the weight of the patient reduced the life of the cable significantly due to
crushing. Many procedures produced zero readings, attributable to cable damage.
The PTW M4-KDK proved difficult to place since most fluoroscopy units had an integral
DAP meter and did not have the required rails at the output face of the tube. Consequently,
this method will be unsuitable for some departments. Laboratory results show that corrections
may be required at field sizes less than 200cm2.
6. Conclusion
The periodic assessment of ESD is strongly encouraged. The most suitable method for this
would seem to be TLD arrays. This method also seems to be favoured by clinical staff.
However, TLD arrays are not suitable for continuous monitoring of, for example, general
FGIPs. Instruments such as a twin chamber DAP meter or a SDM, design and positioning
considerations apart, should be more suitable for this application especially if used only to
provide an early warning of potential skin injury. In addition, it may be possible to set

IAEA-CN-85-61
258
threshold DAP readings locally for specific examinations to alert clinical staff of the potential
for a skin injury.
Acknowledgements
The authors are grateful to Wardray Premise (UK) and to PTW (Freiberg) for the loan of the
equipment, to the radiographers who assisted in data collection and to Tony Cotterill, Jane
Utting, Abrar Qureshi and Angela Pettett for their input during this study.
References
[1] SOVIK, E., KLOW, N.E., HELLESNES, J., LYKKE, J. Radiation Induced Skin Injury
after Percutaneous Transluminal Coronary Angioplasty, Case Report. Acta Radiologica.
37 (1996) 305-306.
[2] HUDA, W., PETERS, K., Radiation Induced Temporary Epilation after a
Neurologically Guided Embolisation Procedure. Radiology. 193(3) (1994) 642-644.
[3] WAGNER, L.K., EIFEL, P.J., GEISE, R.A. Potential Biological Effects Following High
X-ray Dose Interventional Procedures. J Vasc Interv Radiol, 5(1) (1994) 71-84.
[4] SHOPE, T.B. Radiation Induced Skin Injuries from Fluoroscopy. Radiographics 16(5)
(1996) 1195-1199
[5] CENTER FOR DEVICES AND RADIOLOGICAL HEALTH, FOOD AND DRUG
ADMINISTRATION. Avoidance of Serious X-ray-Induced Skin Injuries to Patients
during Fluoroscopically Guided Procedures. Public Health Advisory. FDA (Sep 30
1994)

IAEA-CN-85-69
259
RADIATION DOSE DURING ANGIOGRAPHIC PROCEDURES
Ch. Lavoie
Radiation Protection Bureau, Health Canada, Ottawa, Ontario, Canada
P. Rasuli
Department of Radiology, Ottawa Hospital, Ottawa, Ontario, Canada.
Abstract
The use of angiographic procedures is becoming more prevalent as new techniques and equipment are developed.
There have been concerns in the scientific community about the level of radiation doses received by patients, and
indirectly by staff, during some of these radiological procedures. The purpose of this study was to assess the level
of radiation dose from angiographic procedures to patient at the Ottawa Hospital, General Campus. Radiation
dose measurements, using Thermo-Luminescent Dosimeters (TLDs), were performed on more than 100 patients
on various procedures. The results show that while the patient dose from the great majority of angiographic
procedures is less than 2 Gy, a significant number of procedures, especially interventional procedures may have
doses greater than 2 Gy and may lead to deterministic effects.
1. Introduction
In the last few years, the number, the type and complexity of interventional radiological
procedures has dramatically increased. These changes were driven by improvements in
equipment design, the need for improved patient prognoses and the necessity for more cost
effective treatments. With the increased complexity of these procedures, the irradiation time
has also increased, giving rise to concern about patient doses. There have been a few reports
of deterministic effects from angiographic procedures, especially interventional procedures.
For instances, Carstens et al have reported a case of radiation dermatitis after embolization
[1], Freedman et al reported radiation burns during a transjugular intrahepatic portosystemic
shunt (TIPS) procedure [2], Huda et al reported cases of temporary epilation after an
neurological procedure [3], and Shope reported a few cases of radiation induced skin injuries
from interventional procedures [4].
Following the reported cases of radiation damage from interventional procedures, the United
States Food and Drug Administration had issued a bulletin to health care professional on the
potential for radiation injuries from angiographic procedures [5]. This bulletin requests that
the absorbed dose to the irradiated areas, likely to approach the threshold for radiation injury,
be estimated for angiographic procedures, including interventional procedures. The area of
interest when performing these evaluations for angiographic procedures is the skin area
closest to the entrance X-ray beam since it will receive the largest amount of radiation.
2. Equipment and method
All procedures were done by the same team of radiologists using an Omnicon L Digital
Subtraction Angiography (DSA) unit (Picker, Cleveland OH), utilizing 15 pulse/s
fluoroscopy. The entrance doses were measured by placing several equally spaced packets of
three thermo-luminescent dosimeters (TLDs) on the table under the patient’s pelvis to cover
the area exposed to radiation during the procedure. Three TLDs were used per packet to
provide confidence for each measurement point. The TLDs used were TLD-100 (LiF)
(Harshaw, Cleveland, OH). TLD-100 (LiF) has been shown to be appropriate for the
measurements of both skin entrance and organ doses in diagnostic radiology [6]. Each TLD
measures approximately 3 x 3 x 1 mm3. The separation between the packets used was 10 cm

IAEA-CN-85-69
260
at first and was subsequently decreased to 3 cm. This change in the packet separation was
made to increase the number of measurement points to confirm the radiation pattern of
entrance dose. The TLDs were calibrated for the energies used during the procedures and were
processed at Health Canada laboratories on a Harshaw Nuclear Systems Model 2000D TLD
reader (Harshaw, Cleveland, OH). Technical data, such as the tube voltage, current,
fluoroscopy time, the number of DSA images and the tube position were recorded for each
procedure.
3. Results
The skin entrance doses and pertinent information for angiographic procedures are presented
in Table 1. The values presented are the average for all patients undergoing the specific
procedure. The numbers in parentheses show the range of values measured for each category.
Table 1. Results of the radiation dose measurement for diagnostic angiographic procedures
Procedure # of
proc.
Patient
weights (kg)
Irradiation
time (min.)
# images Dose (mGy)
Aorta/Iliac Arteries
Translumbar aortogram
3 99
(70-136)
3.5
(2.3-5.2)
88
(76-104)
162
(45-299)
Iliac artery angioplasty &
stenting
3 71
(68-84)
20.5
(3.8-43.1)
88
(43-190)
1,028
(161-2,560)
Carotid Artery
Carotid artery angiogram 1 64 3.3 97 80
Carotid artery angioplasty
& stenting
1 74 27.3 93 188
Embolization
Embolization of liver
tumours
8
78.5
(48-117)
20.2
(12.7-43.5)
144
(56-473)
2,062
(137-9,329)
Uterine Artery
Embolization
28 73
(53-120)
29.2
(13.3-54.1)
124
(66-241)
1,289
(383-3,363)
Abdomen
Inferior Vena Cava filter
placement
2 66
(64-68)
3.0
(2.9-3.1)
25
(22-27)
44
(41-47)
Abdominal angiogram 3 79
(50-114)
6.8
(4.8-8.1)
243
(163-311)
935
(138-2,450)

IAEA-CN-85-69
261
One of the major problems in assessing the patient dose is that the range of doses for a
specific procedure can be quite considerable. Table 2 shows the individual patient skin
entrance dose for embolization of liver tumours. The entrance skin dose values presented are
the maximum measured doses for each patient.
Table 2. Results of the radiation dose measurement for embolization of liver tumours
Patient Age/sex Weight (kg) Irradiation
i ( i )
# images Dose (mGy)
17 47 / M 84 13.1 69 1,032
22 56 / M 97 20.2 162 999
30 71 / F 50 23.2 95 222
35 59 / M 86 18.1 114 573
49 71 / F 48 18.0 108 137
51 68 / M 82 43.5 473 9,329
61 64 / F 117 12.7 74 3,273
63 40 / M 64 13.1 56 930
Average 78.5 20.2 144 2,062
4. Discussion
The measurement of patient doses is not an easy task. If properly handled, TLDs can provide
an accurate value of skin doses. Unfortunately, TLDs are complicated to use and have limited
usage in a clinical setting. Another method of measurement is the use of a detector to measure
the dose-area product. The major drawback of the use of dose-area product measurement
during angiographic procedures is that it is often difficult to relate the result to the skin dose
or to a specific organ dose. This is especially true with angiographic procedures where
patients are being irradiated at different angles and skin surface locations for various
irradiation times.
In general, patient doses are greater in interventional procedures than in diagnostic
angiographic procedures. Not all interventional procedures generate large skin doses. For
example, the skin dose produced during the placement of an inferior vena cava filter is small.
One of the most difficult problems in assessing the risk from an angiographic procedure is the
large variability of skin doses for different patients. For each procedure, it is important to
know the range of skin doses that can be attained since this range can be very wide. For
example, the embolization of liver tumours, as demonstrated in Table 2, the range of skin
doses is from 137 mGy to 9,329 mGy. Two of the eight patients received skin doses greater
than the threshold level of 2 Gy. Other procedures show the same characteristics; for iliac
angioplasty and stenting, the range of doses is from 161 mGy to 2,560 mGy, for uterine artery
embolization, the range is from 383 mGy to 3,363 mGy, and for abdominal angiogram, the
range is from 138 mGy to 2,450 mGy. The most important factors responsible for such large
variations of skin doses are the size of the patient, the expertise of the operator, and the
difficulty in performing the procedure.

IAEA-CN-85-69
262
Skin doses can be greater than 2 Gy for many interventional procedures. A complete
assessment of the range of skin doses should be done to evaluate the risk of deterministic
effects for specific procedures.
References
[1] CARSTENS, G.J., HOROWITZ, M.B., PURDY, P.D., et al., Radiation dermatitis after
spinal arteriovenous malformation embolization: case report. Neuroradiol. 38 (1996)
S160-S164.
[2] FREEDMAN, A.M., SANYAL, A.J., Complications of transjugular intrahepatic
portosystemic shunts. Semin. Intervent. Radiol. 11 (1994) 161-177.
[3] HUDA, W., PETERS, K.R., Radiation-induced temporary epilation after a
neuroradiologically guided embolization procedure. Radiol. 193 (1994) 642-644.
[4] SHOPE, T.B., Radiation-induced skin injuries from fluoroscopy. Radiographics 16
(1996) 1195-1199.
[5] FOOD AND DRUG ADMINISTRATION, Important information for physicians and
other healthcare professionals: recording information in the patient’s medical record that
identifies the potential for serious x-ray-induced skin injuries following fluoroscopically
guided procedures. Rockville, Maryland (1995).
[6] PRADHAN, A.S., SASANE, J.B., GOPALAKRISHNAN, A.K., et al, A TLD method
for evaluation of radiation quality and measurement of entrance skin dose from
diagnostic X-ray practices, Radiat. Prot. Dosim. (United Kingdom) 40 (1992) 49-52.

IAEA-CN-85-80
263
RADIOLOGICAL PROTECTION IN INTERVENTIONAL
CARDIOLOGY IN CHILE
A. Ramírez
1, E. Vañó
2, F.A. Leyton
1, C. Oyarzún
3, J. Gamarra
3, E. Farias
1, A.M. Silva
1,
P. Ortiz4
1Hospital Clínico de la Universidad de Chile, Santiago, Chile 2Hospital Universitario San Carlos. Universidad Complutense, Madrid, Spain 3Comisión Chilena de Energía Nuclear, Santiago, Chile 4International Atomic Energy Agency, Vienna Abstract
In September 2000, an expert mission was assigned to Chile, under the regional project named "International
BBS in Medical Practices Radiation Protection and Quality Assurance In Interventional Radiology" (ARCAL
XLIX). The objectives of the mission were to evaluate the level of radiation protection (RP) and safety in
interventional cardiology ( IC ) installations.
A team of local cardiologists, medical physicists and technologists was created for this purpose and during one
week, several cardiology laboratories were evaluated and some basic quality controls (QC) were carried out. A
basic pilot training course in radiation protection was imparted at the Hospital of the University of Chile in
Santiago de Chile and some of the key objectives for a future national quality assurance programme were
presented during the national congress of IC. In addition, a national survey on radiation protection aspects was
circulated and its results evaluated. These activities enabled the local team to become familiar with the
methodology of assessment of the level of protection and the organization of a programme, which was illustrated
with the examples of similar European programmes.
As result of these actions, several proposals were made to both the local authorities and the IAEA. The most
important were: a) to initiate a basic QC programme, b) to organize a training in RP for cardiologists in order to
formalize their accreditation, c) to improve personal occupational dosimetry, d) to initiate a programme of patient
dosimetry, e) to optimize the technical and clinical protocols, f) to create a national registry of incidents with skin
injuries.
1. Introduction
In Chile there are 48 specialists in interventioal cardiology ( IC ) training in renowed European and North American centers. They perform nearly 1,500 therapeutic and 6,000 diagnostic procedures in a year. Facilities and procedures for cardiac electro-physiology are not included in these figures. For comparison, in Spain (data from 1999), there are 110 hemo-dynamic rooms (in 83 hospitals) where 575 therapeutic procedures (22% of the total) per million of population are performed and 2,070 diagnostic procedures per million of population (78% of the total) [1]. These numbers are 50 % of the procedures in other European countries, such as Austria, Switzerland and Germany [2].
Considering the rate of development in Chile, it can be assumed that in a medium term it will reach the current levels of Spain.
There is no specific programme for training cardiologists in radiation protection. There are, however, protective elements in most of the facilities, such as couch- supported articulated shielded screens and personal shielded garment (aprons and thyroid shielding). Personal monitoring does not seem to be used systematically and the dosemeter reading are made by institutions not dependent on the "Comisión Chilena de Energía Nuclear" and with unknown quality control and no systematic participation in intercomparative round . Personal exposure monitoring is done using one single dosimeter which may be insufficient for IC. [3].

IAEA-CN-85-80
264
With regard to the RP of patients, there is neither a general culture and awareness of cardiologist nor of suppliers of x-ray equipment. The current organization of the IC is structured around the Chilean Society of Cardiology and Cardiovascular Surgery. The interest by its members in achieving a qualitative and quantitative change towards a culture of patient protection and towards implementation of a QA programme in a short time, provides ideal conditions for moving in this direction.
2. Material and methods
In September 2000, an expert mission was assigned to Chile, under the regional project named "International BBS in Medical Practices Radiation Protection and Quality Assurance In Interventional Radiology" (ARCAL XLIX). The objectives of the mission were to evaluate the level of RP and safety in IC . In addition a basic training action in RP and a pilot QA programme should be initiated.
A team of local cardiologists, medical physicists and technologists was created for this purpose and during one week, several cardiology laboratories were evaluated and some basic QC were carried out. A basic pilot training course in RP was imparted at the Hospital of the University in Santiago de Chile and some of the key objectives for a future national quality assurance programme were presented during the national congress of IC. In addition, a national trial on RP aspects was circulated and its results evaluated.
Previous contact with the local delegations of the main industry supplying X ray systems in Chile (Philips, General Electric, Siemens and Toshiba) was established in order to obtain support for these evaluations. The basic QC carried out, during the mission, in several installations was a reduced version of the European DIMOND (Digital Imaging: Measures for Optimizing Radiological Information Content and Dose) protocol [4] .. In addition, the maximum patient entrance dose rate and the image quality obtained with a test object (TOR 18-FG, from the Leeds University) was measured. In the cardiology lab of the Hospital Clinico of the University of Chile, some patient doses were measured with a transmission chamber together with skin dose evaluation using slow radiotherapy films [5]. A basic pilot training course in RP was imparted at the Hospital of the Chile University in Santiago and during the National Congress of IC held in Antofagasta. A national survey on radiation protection and collateral aspects was prepared similar to one used in Spain by the Spanish Section of IC to be answered by the medical specialists in Chile. 3. Results
Survey
A survey on RP aspects was made on a personal and anonymous basis. It was distributed to 16 of the 19 existing centers in the country and reply was obtained from 13 of them. Of the 46 professionals involved in IC 39 responded, which gives the survey a valuable indicator of the activity at national level. 56% of those polled consider that their knowledge of RP are adequate for their professional activity, however 97% considers appropriate to perform

IAEA-CN-85-80
265
continuous training in radiation protection as well as in QC in order to optimize the use of their equipment.
Equipment Equipment in Chile is uneven. Three of units are of a design of the 1977, 1979 and 1986 all of them had to be adapted for IC. 71% of the equipment used in Chile includes digital image acquisition. 53% of those polled in the survey consider that their facilities are adequate and 38% consider that they should be renewed as RP is concerned. Half of those polled feel acquainted with the features and capabilities of their equipment, while the other half mean to have incomplete knowledge of the use of the equipment; 80% would like to have more detailed information on the capabilities of the equipment.
Occupational dose assessment Dose monitoring is available to 67 % of the interventional cardiologists but only 61% of those polled use it on a regular basis and 33% lack dosimetric control. In none of the centers are TLD dosimeters available. 54% of the cardiologists are aware of their occupational dose values and pay attention to them and 33% are not aware of them. However, 92% indicate that no professional advice is available on radiological protection; this advice is wanted by 90% of those polled and all participants in the survey consider that effort and investments should be made to improve the level of protection to the professionals involved in IC. The average team for an IC unit in Chile consists of four interventionists, two to three nurses, one to two technologist, two to four nursing assistants. There is only one center with a medical physicist. 92% of those polled declare to have quality control and maintenance for the equipment, and 48% of them indicate that this is performed on scheduled basis. 61% report to be aware of the results of maintenance activities.
Patient dose assessment All participants in the survey consider that patient dose assessment is of prime importance and 97% agree to participate in comparative studies with other countries, although when interrogated about a possibly excessive exposure, 84% declare that this never occurred and 90% state that never know about of any skin injuries related to the area of incidence of the radiation beam on patients who underwent IC procedure.
4. Conclusions
1. Interventional cardiology in Chile is well organized and a programme of QC and RP could be easily implemented. Cardiologists performing interventional procedures show a great interest in radiation protection and demand a training programme in order to achieve the necessary knowledge to adequately protect their patients and to obtain an accreditation in radiation protection from the Chilean health authority.
2. A pilot training course in radiation protection has been designed for interventional cardiologists (20-30 hours following the European approach on protection in medical exposure).
3. Occupational protection conditions are in general adequate but personal monitoring should be improved by recommending the use of two TLD dosimeters by professionals with a significant workload in IC.
4. Equipment assessed is in good condition in general although there is not yet a culture of radiation protection of patient, which must be implemented in a near future.

IAEA-CN-85-80
266
5. It is advisable to initiate a programme of patient dose monitoring, to optimize the technical and clinical protocols and to initiate a national registry of incidents with skin injuries.
Acknowledgements
This paper is the result of the work started with an IAEA mission under the Project No. C3-RLA/9/035-0101. References
[1] SECCIÓN DE HEMODINÁMICA Y CARDIOLOGÍA INTERVENCIONISTA DE LA SOCIEDAD ESPAÑOLA DE CARDIOLOGÍA. Registro de Actividad de Hemodinámica y Cardiología Intervencionista 1998. Revista Española de Cardiología 1999; 52(12). Available at: http://www.hemodinamica.com/
[2] AUSTRIAN SOCIETY OF CARDIOLOGY. European cardiology data. Available at: http://gin.uibk.ac.at/iik/visitors/sta_98/tab_6.htm
[3] FAULKNER K., MARSHALL NW. The relationship of effective dose to personnel and monitoring reading for simulated fluoroscopic irradiation conditions. Health Phys 1993; 64:503-508.
[4] Dimond Protocol. Essays and Controls related to Patient and Staff Dose Measurements in Diagnostic Radiology . DIMOND EC Concerted Action. Edited by the Medical Physics Group. Radiology Department. Complutense University. Madrid, 1999.
[5] VANO E, GUIBELALDE E, FERNÁNDEZ JM, GONZÁLEZ L AND TEN JI. Patient dosimetry in interventional radiology using slow film systems. Br J Radiol 1997; 70: 195-200.

IAEA-CN-85-111
267
ABSORBED DOSES TO PATIENTS FROM ANGIORADIOLOGY
R.
Rodríguez-Romero1, F. Díaz-Romero
2, J. Hernández-Armas
1 1Servicio de Física Médica. Hospital Universitario de Canarias, La Laguna, Tenerife, Spain 2Servicio de Radiodiagnóstico, Hospital Universitario de Canarias, La Laguna,
Tenerife, Spain Abstract
The aim of study was to know patients doses exposes when three different procedures of angioradiology were
carried out. The explorations considered were drainage biliary, varicocele embolization and dacriocistography
made in the Radiodiagnostic Service at the University Hospital of Canary Islands, Tenerife (Spain). In total 14
patients were studies. The measurements were made using large area transmission ionisation chamber which
gives the values of Dose Area Product (DAP). In adition, thermoluminiscent dosimeters type TLD-100 were used
in anthropomorphic phantom in order to obtain values of organ doses when the phantom was submitted to the
same procedures than the actual patients. Furthermore, the Effdose program was used to estimate the effective
doses in the procedures conditions. The values for DAP were in the range of 70 – 300 for drainage biliary, 43 –
180 for varicocele embolization and 1.4 – 9 for dacriocistography. The organ doses measured with TLD-100
were higher than the corresponding values estimated by Effdose program. The results for varicocele embolization
were higher than other published data. In the case of drainage biliary procedure, the values were closed to other
published results. It was not possible to find data for dacriocistography from other authors.
1. Introducción
Los valores de las dosis de radiación a pacientes debidas a diversos procedimientos de Radiología Vascular e Intervencionista han sido determinados por diversos autores [1-5] en los últimos años. En general, las dosis medidas o estimadas son altas debido a las características propias de estos procedimientos radiológicos: grandes tiempos de escopia y alto número de imágenes. Al mismo tiempo se ha constatado la gran dependencia de las dosis con las características técnicas y con la experiencia del personal médico que la realiza. Por todo ello, la comparación entre resultados de diversos autores puede ser complicada y también la comparación entre medidas directas de dosis y estimaciones de las mismas haciendo uso de diversos procedimientos de cálculo.
El procedimiento más frecuentemente usado para la caracterización dosimétrica de los procedimientos de Radiología Vascular e Intervencionista es la medida de la magnitud Producto Dosis Área (P.D.A.). También se han llevado a cabo medidas de dosis, aplicables a los pacientes, usando dosímetros termoluminiscentes en maniquíes. En este trabajo, se han realizado ambos tipos de medidas en 3 procedimientos propios de Angiorradiología: drenaje biliar, embolización de varicocele masculino (en adelante varicocele) y dacriocistografía (en adelante dacrio). Las dos primeras corresponden a procedimientos de Radiología Intervencionista, mientras que la tercera de la exploraciones sirve para diagnosticar el estado del conducto lacrimal. En los tres procedimientos hemos planteado el objetivo de conocer el nivel de riesgo estocástico y determinístico en los pacientes, como también han hecho otros autores [6]. Asimismo, se realiza un estudio comparativo de los valores de dosis obtenidos utilizando un programa de cálculo (con los parámetros radiológicos de la exploración y el P.D.A.), con los resultados de las medidas con dosímetros termoluminiscentes colocados en un maniquí antropomórfico (RANDO).

IAEA-CN-85-111
268
2. Material y método
Se tomaron datos referidos a 14 pacientes (6 mujeres y 8 hombres). A 5 de ellos se les realizó drenaje biliar; a otros 5 pacientes, con edades comprendidas entre 16 y 27 años, la intervención fue por varicocele masculino. A los 4 pacientes restantes se les hizo un estudio diagnóstico de dacriocistografía.
En todos los casos, se registraron los siguientes parámetros radiológicos: kV, mA, tamaño de campo, tiempo de escopia, número de disparos en grafía, y proyección utilizada. Todas las exploraciones se realizaron en un equipo de rayos X marca Philips, modelo Integris V3000. En todos los casos, se midió el P.D.A. (escopia y grafía) con una cámara de ionización DIAMENTOR M2 suministrada y calibrada por PTW – Freiburg (Alemania). Posteriormente, se hizo uso de un maniquí antropomórfico Rando y de dosímetros termoluminiscentes marca Harshaw tipo TLD – 100 para realizar medidas de dosis en el maniquí. Los dosímetros empleados fueron calibrados para las energías de Rayos X diagnósticos (50 – 120 kV) en el Centro Nacional de Dosimetría (Valencia) . También se verificaron frente a una cámara de ionización PTW calibrada (conectado a un electrómetro PTW DL4-DI4) utilizando Rayos X de 80 kV proporcionados por un equipo radiológico que cumplía las especificaciones del Protocolo Español de Control de Calidad en Radiodiagnóstico. Los tratamientos térmicos de los TLD (previo lectura, borrado + restaurado) se llevaron a cabo con una estufa PTW THELDO siguiendo los procedimientos estándares de nuestro laboratorio y se realizaron las lecturas de los dosímetros utilizando el Lector termoluminiscente HARSHAW 4000. Las medidas del PDA, dadas en Gy·cm2, para cada exploración y paciente, se realizaron distinguiendo entre el modo escopia y el modo grafía en las distintas proyecciones utilizadas. Se utilizaron los valores medios de los parámetros radiológicos de cada exploración y los datos de PDA promedios registrados en los pacientes para reproducir cada uno de los 3 procedimientos sobre el maniquí Rando en el que se colocaron los dosímetros TLD-100. Por otra parte, se utilizó el programa de cálculo de dosis efectiva EFFDOSE, que utiliza los factores de ponderación tisulares propuestos en las recomendaciones ICRP-60 [1] y que permite también estimar las dosis en órganos en cada una de las exploraciones teniendo en cuenta todas las características de las mismas.
3. Resultados y discusión
Los rangos de los valores de los parámetros medidos en cada una de las exploraciones se presentan en la Tabla I.
Las diferencias entre las características de las exploraciones debidas, sobre todo, a las diferencias anatómicas entre pacientes, quedan reflejadas en esta tabla. Así, el diferente grado de dificultad entre pacientes justifica las importantes variaciones observadas entre los tiempos de escopia para la realización del drenaje biliar que se refleja en el amplio rango de valores de P.D.A. Asimismo, los distintos datos en el modo grafía, para esta exploración, ocasionan una gran variabilidad en los valores de P.D.A. totales. Es de señalar que estos resultados hacen

IAEA-CN-85-111
269
Tabla I. Resultados obtenidos con pacientes Exploración Diámetro
Campo (cm)
ESCOPIA GRAFÍA P.D.A. TOTAL
kV mA t (min) P.D.A. kV mA Nº
imágenes
P.D.A.
Drenaje
biliar
31-38 81-110 5 - 6 10-34 68-273 70-110 310-425 1-2 1-28 70-300
Varicocele
20-25 68-80 4 - 5 14-61 42-180 70-76 386-486 1-5 0,28-7 43-180
Dacrio 17 73-77 3 - 5 0,1-0,3 0,44-1 70-75 120-585 12-15 1-7,6 1,4-9
Los rangos de valores de P.D.A. se expresan en Gy·cm2. poco representativo un valor medio de P.D.A. como característico de esta exploración. Estascircunstancias se repiten, como puede observarse en la Tabla I, en el caso de varicocele y también para la dacriocistografía. Después de la reproducción de las condiciones de irradiación para cada una de las exploraciones, utilizando un maniquí antropomórfico Rando, se midió las dosis en los “órganos” del mismo mediante la colocación en ellos de un conjunto de dosímetros termoluminiscentes en número y distribución variable según las características de la exploración y los órganos considerados. En total se usaron 40 dosímetros TLD-100 colocados en los órganos indicados en la Tabla II en el caso de la reproducción del estudio de drenaje biliar,, mientras que se utilizaron 38 dosímetros para las medidas en los órganos correspondientes al estudio de varicocele. En la exploración diagnóstica de dacriocistografía fueron 17 los dosímetros utilizados. También en esta Tabla II se muestran los valores de dosis estimadas en los mismo órganos mediante la aplicación del programa Effdose para cuyo uso se utilizaron los datos promedios para cada exploración de kV, filtración, P.D.A. y la proyección más similar a la exploración real de entre las propuestas por NRPB [8] Se observa que, en general, las dosis estimadas con el programa Effdose en cada órgano son inferiores a los valores promedios medidos con dosímetros termoluminiscentes. Puede deberse esta circunstancia al hecho de que los valores promedios utilizados para estimar las dosis usando el programa informático, tienen una gran desviación estándar consecuencia del amplio rango de valores que se indicaron en la Tabla I. Por tanto, para disminuir esta causa de incertidumbre se requiere incrementar el número de pacientes analizados o bien analizar poblaciones homogéneas de pacientes, próximos a las dimensiones del hombre estándar representado con el maniquí antropomórfico. Por otra parte, la reproducción precisa del estudio con el maniquí es compleja debido a la diversidad de proyecciones utilizadas y al tiempo de radiación correspondiente a cada una de ellas, así como a los cambios de tamaño de campo que tienen lugar durante el estudio. Por todo ello, se considera conveniente que los sistemas de medida y registro de dosis que han de colocarse obligatoriamente en estos equipos en España desde hace unos meses, incorporasen el registro de dichos parámetros para una mejor estimación de la dosis a pacientes.

IAEA-CN-85-111
270
Tabla II. Dosis en órganos (medidas y estimadas) para las 3 exploraciones
DOSIS (mGy) Órgano Drenaje biliar Varicocele Dacrio
Medida estimada Medida estimada medida estimada
Tiroides 0,35 0,09 0,12 0,00 0,15 0,30
Estómago 29,18 38,03 1,71 2,39 0,07 0,00
Esófago 6,00 8,72 0,66 0,08 0,10 0,06
Hígado 116,31 59,76 2,85 1,99 0,06 0,00
Mama 2,92 1,07 0,26 0,02 0,07 0,00
Vejiga 8,02 0,79 8,02 14,80 0,05 0,00
Pulmón 24,44 7,71 1,50 0,08 0,11 0,01
Colón 28,92 4,96 43,61 24,45 - -
Testículos 0,17 0,06 1,30 8,08 - -
Ovarios 1,48 4,02 - - - -
Vesícula biliar - 45,89 - - - -
Cristalino - - - - 0,82 2,03
Parótidas - - - - 1,33 -
El cómputo de la dosis efectiva a los pacientes realizada mediante el programa Effdose, proporcionó los valores siguientes: 19 mSv para el drenaje biliar; 9 mSv para el varicocele y 0.13 mSv para dacriocistografía. Como ya se observaba en la Tabla II, las características de la exploración lacrimal (campo pequeño centrado en los ojos durante toda la exploración) justifican tanto los bajos valores de dosis en órganos como el pequeño valor de dosis efectiva. Aunque no se colocaron suficientes dosímetros para poder medir todos los datos necesarios para la obtención de la dosis efectiva, la aproximación que puede darse con los valores medidos es de: 17 mSv para el drenaje biliar, 7 mSv para el varicocele y 0.04 mSv para dacriocistografía. Considerando únicamente los mismos órganos con sus correspondientes dosis medidas y estimadas, las diferencias entre ambos métodos son grandes. Este resultado parece indicar una cierta tendencia del programa Effdose a repartir la dosis total entre los diversos órganos estrictamente determinado por las características geométricas de la exploración establecidas matemáticamente. Por tanto, hay que usar con precaución la asimilación de exploraciones a la hora de comparar exploraciones intervencionistas reales con proyecciones normalizadas de exploraciones radiológicas sencillas.
4. Conclusiones
1.- Los valores de dosis medidos con dosímetros termoluminiscentes y los estimados a partir de la medida de los productos dosis-área para las exploraciones Drenaje Biliar, Varicocele y Dacriocistografía, son indicativos de un bajo riesgo de efectos estocásticos debidos a la radiación X usada. La incidencia negativa de la radiación como inductora de enfermedades malignas hereditarias graves es baja, incluso en la intervención de Varicocele masculino que, a priori, era susceptible de ocasionar mayor riesgo. 2.- No se alcanzan, en ningún caso, valores de dosis superiores a los umbrales de efectos determinísticos.

IAEA-CN-85-111
271
3.- La discordancia entre los valores de dosis estimados y medidos pueden ser debidos a la extrema variabilidad de los parámetros radiológicos usados en las exploraciones. Para intentar conocer la relación entre ambos conjuntos de valores se requiere incrementar el número de pacientes estudiados y asegurar la homogeneidad de características anatómicas entre ellos, al objeto de disminuir la incertidumbre en los resultados. Referencias
[1] McPARLAND, B.J. A study of pacient radiation dosis in interventional radiological
procedures. Br. J. Radiol. 71(1998) 175-185. [2] MÜLLER, HEICAPPELL, STEINER, MERKLE, JASCHOFF & MILLER. The
average dose-area product at intravenous urography in 205 adults. Br J Radiol 71 (1998) 210-212.
[3] DÍAZ–ROMERO, F., & HERNÁNDEZ–ARMAS, J. Doses and detriment to patients
from vascular and interventional radiology. (Proc. 8th Int Congress I.R.P.A., Montreal 1992).Vol 1, Montreal, (1992) 363-366.
[4] RUIZ – CRUCES, R., GARCÍA – GRANADOS J., DÍAZ-ROMERO F. & HERNÁNDEZ – ARMAS J. Estimation of effective dose in some digital angiographic
and interventional procedures. Br J Radiol 71 (1998) 42-47 [5] VAÑÓ, E., GONZÁLEZ, L., FERNÁNDEZ, J.L. GUIBELALDE, E. Patient dose
values in Interventional radiology. Br J Radiol 68 (1995) 1215-1220 [6] CHALMERS, N., HUFTON, A.P., JACKSON, R.W. & CONWAY, B. Radiation risk
estimation in varicocele embolization. Br. J Radiol. 73 (2000) 293-297. [7] ICRP, 1990. Recommendations of the International Comission on Radiological
Protection. SEPR publicación. Madrid 1995. [8] HART, D., JONES, D.G., WALL, B.F., Normalised organ doses for medical X-ray
examinations calculated using Monte

IAEA-CN-85-71
272
INVESTIGATION OF RADIATION SKIN DOSE IN
INTERVENTIONAL CARDIOLOGY
C.M. Webster1, D. Hayes
2, J. Horrocks
1
1 St Bartholomew’s Hospital, London, United Kindom
2 City University, London, United Kindom
Abstract
Background - The study investigated the radiation skin doses for interventional patients in cardiology; two
procedures which have the highest radiation dose are Radiofrequency Catheter Ablation (RFCA) and
Percutaneous Transluminal Coronary Angioplasty (PTCA).
Methods and Results - 56 patients were randomly selected and investigated; 23 patients in the RFCA group and
33 in the PTCA group. Skin and effective dose were calculated from Dose Area Product (DAP).
Thermoluminescent Dosimetry was the second method of dose measurement used. Patients were followed-up for
a three month period to check for possible skin reactions resulting from the radiation dose during the procedure.
Radiation skin doses in 14 patients were calculated to be more than 1 Gy, including three patients who received
more than 2 Gy, the threshold dose for deterministic effects of radiation. 7 patients (12.5%) reported skin
reactions as a result of the radiation received to their backs during the procedure. Mean DAP and estimated
effective doses were 105 Gycm2 and 22.5 mSv for RFCA, and 32 Gycm2 and 6.2 mSv for PTCA procedures
respectively.
Conclusion - Complex procedures in Interventional Cardiology can exceed the threshold level for deterministic
effects in the skin.
1. Introduction
Patients undergoing Percutaneous Transluminal Coronary Angioplasty (PTCA) and
Radiofrequency Catheter Ablation (RFCA) may receive considerable doses of X-radiation
during the procedure. These two procedures are both complex and lengthy to achieve the
desired result; both treat cardiological medical conditions. Unlike PTCA most RFCA
procedures involve the investigative test for diagnosis followed by the treatment.
1. The aims of the study were:
a) to evaluate the magnitude and range of radiation skin doses received by patients during
PTCA and RFCA procedures,
b) to find if there were any deterministic effects of radiation manifested by the patient such as
skin reddening (erythema) with a follow-up for a three month period.
2. Background
Several incidents of radiation induced skin problems have been reported in the USA as a
result of high dose examinations (Shope, 1996) [1]. Shope stated that 26 injuries had been
reported to the Food and Drug Administration (FDA) between 1992 and 1995; 12 of the
patients underwent RFCA procedures and 4 received PTCA examinations. The FDA issued a
health warning in 1994, that patients undergoing interventional procedures, could suffer from
late radiation skin injury and that it would not be sufficient for clinicians to check patients
before they were discharged from hospital (FDA, 1994) [2]. The FDA recognised that a
threshold dose of 2 Gy would cause deterministic effects of radiation but recommended that a
safety margin of 1 Gy should be observed. The advent of digital equipment with

IAEA-CN-85-71
273
microprocessor controlled X-ray generators allow higher outputs and X-ray tubes with better
cooling capabilities have enabled longer fluoroscopy times and uninterrupted acquisitions of
images (Philips, 1995) [3]. A paper written by Park et al, (1996) [4] studied 500 RFCA
patients with 5.6% of patients exceeding threshold doses for signs of early transient erythema.
2. Methods
Symptomatic patients were enrolled into PTCA and RFCA groups, monitored for radiation
skin dose and followed up for possible deterministic effects of radiation. The investigation
took place over 4.5 months between 24th September 1998 and 5th February 1999. 56 patients
were studied, 23 patients in the RFCA group and 33 patients in the PTCA group. Patients of
both sexes aged between 18 and 75 years were randomised into the study.
1. Radiation skin dose was estimated by two methods; via dose-area product meter (DAP
meter) and radiation field area measurement and via Thermoluminescent Dosimetry
(TLD). The DAP meter was already installed as an integral part of the equipment. The
DAP method gives an average value and does not take account of the distribution of the
skin dose due to movements of the x-ray tube. The TLD method allowed point
measurements. During the procedure projection, field size, focus skin distance,
fluoroscopy time, DAP, kV and mA per 5 minutes RFCA fluoroscopy time and PTCA
acquisition.
2. TLDs were placed directly on the patient’s back to measure entrance surface dose (ESD)
including backscatter. TLDs were placed in the following places: bilaterally midway
between the spine and the lateral chest wall at the level of the lower end of the scapula in
the region of the ninth thoracic vertebra (T9), one placed over the spine, one placed
bilaterally on the lateral chest wall at the same level and one placed half way between the
lower costal margin and the axilla on both sides of the patient giving a total of 7 TLDs per
patient in the RFCA patients. A further two TLDs were placed in the PTCA group at the
level of the lower costal margin.
3. The patients’ backs were checked by a nurse for any skin condition prior to the patient
leaving hospital within 24 hours of the procedure and by the patients’ husband, wife,
partner or friend on six dates over a three month period. A form was provided to assist in
providing information of any skin condition that may have occurred at that time. The
patient was phoned by the researcher after three months to enquire if any skin problems
had occurred.
4. The skin dose for each projection was calculated by dividing the DAP by the field size at
the patient's skin. Field sizes were estimated from an acquisition taken from rulers placed
on the table top in identical projections that the equipment was in when the original
acquisition was taken; the same table height and source image distance was used. The
estimated skin dose from DAP was multiplied by the backscatter factor. A backscatter
correction was used so that results could be compared to TLD measurements which
included backscatter. However this method does not take the movement of the tube within
a projection into account and therefore would tend to overestimate skin dose in a given
projection.
5. Skin dose for each of the three main projections of the C-arm; left and right anterior
oblique (LAO & RAO) and postero anterior (PA), were summated and compared.
6. Effective dose was calculated by multiplying the DAP by a conversion factor taken from
NRPB-R2625. The factors depend on projection, kV and filtration.

IAEA-CN-85-71
274
3. Results and discussion
Table 1. RFCA & PTCA DAP, Fluoroscopy Time and Images
RFCA DAP
(Gycm2)
FLUORO
(minutes)
IMAGES PTCA DAP
(Gycm2)
FLUORO
(minutes)
IMAGES
(number)
MIN 14 7 0 MIN 8 5 236
MAX 341 117 1806 MAX 76 54 1854
MEAN 105 37 144 MEAN 32 12 733
ST DEV 85 27 78 ST DEV 18 9 392
Table 1 shows the minimum, maximum, mean and standard deviation of both groups studied.
Table 2. Comparison of RFCA & PTCA skin doses from DAP/ field size in LAO, RAO and PA
projections
RFCA SKIN
DOSE (mGy)
LAO
(mGy)
RAO
(mGy)
PA
(mGy)
PTCA SKIN
DOSE (mGy)
LAO
(mGy)
RAO
(mGy)
PA
(mGy)
MIN 54 89 100 MIN 42 6 4
MAX 2422 1939 791 MAX 1470 1018 306
MEAN 777 403 284 MEAN 409 258 70
ST DEV 648 445 223 ST DEV 366 268 87
1. Skin dose calculated from DAP was recorded for each patient and compared to the
maximum TLD reading for each patient.
The RFCA mean for skin dose from DAP = 777 mGy and mean for TLD dose = 531 mGy. A
correlation but not significant could be made between the two sets of measurements.
(Correlation = 0.76261 p = 0.08 ns).
The PTCA mean for skin dose from DAP = 522 mGy and mean for TLD dose = 135 mGy. No
significant correlation could be found comparing the two doses. (Correlation = 0.15 p = ns).
There was a wider difference between the two measurements in the PTCA group as it could
not be predicted which projections would be used prior to the procedure and many more views
were generally taken than in the RFCA group.
Table 3. Characteristics and doses of patients with skin reactions
No
Exam
Age
Sex
Fluoro time
(minutes)
Equipment
DAP
(Gycm2)
TLD Max
Dose (mGy)
Skin Dose
(mGy)
from DAP
Effective
Dose (mSv)
from DAP
1 RFCA 66 F 18.9 38.9 147.8 264 5.16
2* RFCA 63 M 50.3 288.2 1346.59 1880 47.0
3* RFCA 58 M 117.3 195.6 236.0 1386 25.2
4 PTCA 59 M 6.6 15.5 12.52 187 1.7
5* PTCA 55 M 53.5 103.8 237.4 1516 13.1
6 PTCA 72 F 8.9 22.4 316.48 289 3.3
7 PTCA 45 M 15.8 30.4 18.29 394 3.4
* denotes patients receiving a skin dose of more than 1 Gy.
Table 3 summarises the seven patients suffering from skin reactions indicating fluoroscopy
time, DAP, maximum TLD dose, skin and effective doses. Most of the patients experienced
itching prior to redness appearing in the subscapular region on their backs and the time of

IAEA-CN-85-71
275
onset varied between 24 hours and twelve weeks. None of the estimated doses for these 7
patients exceeded 2 Gy.
2. Threshold doses. 9 of 23 RFCA patients received a total skin dose calculated from DAP of
more than 1 Gy. Three of these patients received more than 2 Gy but reported no reaction.
5 patients received skin doses in excess of 1 Gy when the C-arm was angled to the LAO. 2
of the 9 patients received skin doses in excess of 1 Gy when the angulation of the C-arm
was in the RAO projection and one of these patients received almost a deterministic level
of 1939 mGy. 2 of the 9 patients reported skin injury.
5 PTCA patients received a total skin dose measured from DAP in excess of 1 Gy. Two of
these patients received more than 1 Gy to the right side of the back in the direction of the X-
ray tube in the LAO angulation. One patient reported a skin reaction.
3. Effective dose. Total body effective dose E was calculated from the DAP using conversion
factors from NRPB-R262 [5].
Table 4. Effective dose from the two procedures
Procedure Mean DAP
(Gycm2)
Mean E ±
SD
Min E
(mSv)
Max E
(mSv)
RFCA 105 22.5 ± 20 2.8 79.6
PTCA 32 6.2 ± 4.0 1.2 16.8
4. The risk factor coefficient for cancer for the adult working population = 0.037 per Sv or 1
in 27,027 per mSv. Younger patients who are exposed to radiation have a greater risk of
fatal malignancy than older patients. Lindsay et al, (1992) [6] stated that there is also a
higher risk of fatal malignancy in females for increasing lengths of fluoroscopy time. The
likelihood of cancer increases with increased radiation doses but not the severity Wagner
et al. (1994) [7].
If patients returned with a late skin injury following a procedure with prolonged fluoroscopy
time, Nahass (1995) [8] indicated that they should be diagnosed as having radiodermatitis and
that they should be followed-up at regular intervals as this condition could later develop into a
carcinoma.
4. Actions taken at the time of the procedure and future recommendations were made:
(a) More explanation given to patients as to the amount of radiation they may be receiving.
The researcher noticed on consenting patients for the procedures that many patients were
unaware of any X-radiation involved.
(b) Patients should be informed of the potential radiation risks involved with RFCA or PTCA
procedures.
(c) Patients should be checked regularly for skin reactions for deterministic effects of
radiation if a certain dose has been exceeded and asked to report if any should arise.
(d) Collimation should be used wherever possible to reduce field size to observe only the area
in question.
(e) Ensure that the table height is at least 60 cms from the tube focus to reduce ESD.
(f) Magnification for RFCA procedures should be used as little as possible.

IAEA-CN-85-71
276
(g) The angulation of the C-arm should be changed to prevent over exposure in one area
remembering that the LAO position produces the most radiation dose. The lateral
projection should not be liberally used as the focus to skin distance is minimal.
(h) Use appropriate equipment to deliver the lowest overall exposure dose required for the
procedures.
(i) Protocols should be observed and updated regularly with time limits set for lengthy
fluoroscopy procedures.
5. Conclusion
It can be seen from the results that very high radiation skin doses were received by several
patients in the RFCA and PTCA groups of patients. Seven of these patients have reported skin
injury and three of these patients received doses more than 1 Gy. However the remaining four
received estimated doses of less than 400 mGy.
Unlike other studies, the researcher followed the patients for a three month period and the skin
reactions would have been unnoticed if the follow-up had not taken place.
References
[1] SHOPE, T.B., Radiation induced skin injuries from fluoroscopy, Radiographics 16
(1996) 1195 - 1199.
[2] FOOD AND DRUG ADMINISTRATION, Avoidance of serious X-ray induced skin
injuries to patients during fluoroscopically guided procedures, FDA Medical Bulletin,
Centre for Devices and radiological Health, (1994).
[3] PHILIPS MEDICAL SYSTEMS, Integris Series Cardiac Imaging, (1995).
[4] PARK, T.H., EICHLING, J.O., SCHECHTMAN, K.B., BROMBERG, B.I., SMITH,
J.M., LINDSAY, B.D., Risk of Radiation induced injuries from Arrhythmia Ablation
Procedures, PACE 19 (1996) 1363 - 1369.
[5] HART, D., JONES, D.G., WALL, B.F., Estimation of effective dose in Diagnostic
Radiology from Entrance Surface Dose and Dose Area Product Measurements NRPB-
R262, NRPB, Oxford, Chilton (1994) 57pp.
[6] LINDSAY, B.D., EICHLING, B.D., AMBOS, H.D., CAIN, M.E., Radiation Exposure
to Patients and Medical Personnel During Radiofrequency Catheter Ablation for
Supraventricular Tachycardia, American Journal of Cardiology 70 (1992) 218 - 223.
[7] WAGNER, L.K., EIFEL, P.J., GEISE, R.A., Potential Biological Effects following High
X-ray Dose Interventional Procedures, Journal of vascular Intervention, Radiology 5
(1994) 71-84.
[8] NAHASS, G.T., Fluoroscopy and the skin: Implications for Radiofrequency catheter
Ablation, American Journal of Cardiology 76 (3) (1995) 174-176.

IAEA-CN-85-64
277
PATIENT DOSES IN DIGITAL CARDIAC IMAGING
W. Huda1, K. Phadke
2, K.M. Ogden
1, M.L. Roskopf
1
Departments of Radiology1 and Medicine,
2 SUNY Upstate Medical University,
New York, United States of America
Abstract
In this pilot study, we obtained estimates of entrance skin doses and the corresponding effective doses to patients
undergoing digital cardiac imaging procedures on a GE Advantx LC/LP Plus system. Data were obtained for six
patients undergoing diagnostic examinations and six patients who had interventional procedures. For each patient
examination, radiographic techniques for fluoroscopic and digital cine imaging were recorded, together with the
irradiation geometry. The projection with the highest exposure resulted in an average skin dose of 0.64 � 0.41 Gy
(maximum of 1.6 Gy). The average patient skin doses taking into account overlapping projections was 1.1 � 0.8
Gy (maximum of 3.0 Gy). The exposure area product (EAP) incident on the patient was converted into the
energy imparted to the patient and the corresponding effective dose. The average patient effective dose was 28 �
14 mSv (maximum 62 mSv), with the resultant average fatal cancer risk estimated to be of the order of 8 x 10⁻³.
Average doses for interventional procedures in cardiac imaging are higher than those associated with diagnostic
examinations by approximately 50%.
1. Introduction
Cardiac imaging is recognized as a procedure that results in relatively high patient doses [1].
Cine film is currently being replaced by digital x-ray imaging equipment, and the resultant
images are increasingly being viewed using (soft copy) display stations. It is therefore of
interest to obtain doses to patients who undergo digital cardiac imaging procedures, and to
produce quantitative estimates of the corresponding patient radiation risks.
In this pilot study, we quantified the entrance skin doses that predict the possibility of
inducing a deterministic effect to the skin, as well as patient effective doses that quantify the
stochastic risk of inducing cancer and genetic effects. Cardiac imaging may be performed for
obtaining a diagnostic information (i.e., diagnostic) or during procedures that attempt to treat
the patient (i.e., interventional), and data were obtained for both types of examination.
2. Method
1. Cardiac imaging workload
Each year, about 860 diagnostic examinations and 160 angioplasty examinations are
performed in the catheterization suite at University Hospital, Upstate Medical University,
Syracuse NY. The imaging is performed on a GE Advantx LC/LP Plus1 system that was
installed in 1999. In this pilot study, data was collected on twelve randomly selected patients
undergoing digital cardiac imaging. Six patients underwent diagnostic examinations and the
other six patients underwent interventional procedures (e.g., angioplasty).
X-ray beam characteristics were measured at the x-ray tube potential used clinically. The x-ray
output was determined in terms of air kerma (�Gy) per unit mAs, where an exposure of 1 R
(2.58 x 10⁻⁴
C kg-1
) corresponds to an air kerma of 8.73 mGy. For the frontal plane operated at
80 kVp, the measured output at 60 cm was 130 �Gy/mAs at a distance of 60 cm, and the
corresponding Half Value Layer was 3.4 mm Al.
1 General Electric Medical Systems, Milwaukee WI, United States of America.

IAEA-CN-85-64
278
2. Skin doses
In fluoroscopy, information was recorded for the selected x-ray tube potential (i.e., kVp), tube
current (mA) and total fluoroscopy time. In digital imaging, information was recorded for the
average x-ray tube potential (kVp), tube current (mA), exposure time per frame (s), and the
total number of image frames acquired.
The source to patient skin distance was determined from the source to image receptor distance
(SID), together with the air gap between the patient and the image intensifier. Patients were
modeled as elliptical cylinders with dimensions of 27 cm (Anterior-Posterior) and 40 cm
(Lateral).
Data were recorded for each separate projection. For any patient, the projection with the
maximum skin dose was termed projection 1, the second highest skin dose was projection 2
and so forth. Since it is inappropriate to arithmetically sum all entrance skin doses [2], we
explicitly estimated the maximum skin dose by taking into account any overlap of the x-ray
projections used for each patient [3].
3. Effective doses
Data on the image receptor size and x-ray tube output permitted the exposure-area product
(EAP) incident on the patient to be determined. The EAP was converted into the
corresponding value of energy imparted taking into account both the x-ray beam quality
(HVL) and the patient thickness [4], with the effective density in the cardiac region taken to
be 800 kg m-3
. Values of energy imparted were converted into effective doses using a
conversion factor of 19 mSv J-1
, which is a representative value of the effective dose per unit
energy imparted in cardiac imaging [5].
3. Results & discussion
1. Skin doses.
Table 1 summarizes the entrance skin doses for the twelve patients included in this study.
Data in Table 1 show that the entrance skin doses falls off rapidly with projection number. For
example, the mean dose for the fifth projection was <20% of the value of the average dose for
projection 1.
Table 1. Entrance skin dose (Gy) summary for twelve patients, when no account is taken of any
overlap of different projections
Projection # of patients Mean � � Minimum Maximum
1 12 0.64 � 0.41 0.28 1.6
2 12 0.48 � 0.35 0.12 1.4
3 12 0.23 � 0.11 0.07 0.47
4 7 0.21 � 0.14 0.03 0.44
5 5 0.11 � 0.08 0.02 0.21
For most patients, there was some overlap of entrance skin doses between adjacent projections
(e.g., PA & RAO 45� or LAO 45� & LAO 25�). Taking into account projection overlap, the
average maximum skin doses was 1.1 � 0.8 Gy. The highest maximum skin dose was 3.0 Gy,
and the lowest maximum skin dose was 0.38 Gy.

IAEA-CN-85-64
279
2. Effective doses.
The average effective dose for digital cardiac imaging was 28 � 14 mSv. The minimum
patient effective dose was 7.8 mSv and the maximum patient effective dose was 62 mSv. The
nominal radiation risk coefficient for an adult working population is taken to be 4% per Sv[6].
Taking into account the demographic data for patients undergoing medical examinations
would likely reduce the radiation risk. In this study, we used a risk reduction factor of ~0.34 as
a representative value for a population undergoing x-ray studies [7]. The average stochastic
risk of inducing fatal cancer for patients undergoing digital cardiac imaging is therefore of the
order of 8 x 10⁻³
.
3 Diagnostic examinations vs Interventional procedures.
The data in Table 2 show average dose parameters for patients undergoing diagnostic
examinations and interventional procedures. Average doses for interventional procedures are
higher than those associated with diagnostic examinations by approximately 50%. It is also
notable that the variability in patient doses is considerably higher for interventional
procedures than for diagnostic procedures.
Table 2. Comparison of patient doses between diagnostic and interventional procedures
Dose parameter Diagnostic procedures Interventional procedures
Effective dose 23 � 4 mSv 33 � 19 mSv
Projection 1 skin dose 0.54 � 0.20 Gy 0.74 � 0.56 Gy
Maximum skin dose 0.84 � 0.20 Gy 1.3 �1.0 Gy
4. Conclusions
Digital cardiac imaging results in relatively high skin doses and effective doses. The highest
skin doses observed in this study are comparable to threshold doses for the induction of
deterministic effects such as skin erythema [8]. Effective doses in cardiac imaging are much
higher than those encountered in most areas of diagnostic radiology and nuclear medicine [1,
9].
Acknowledgements
The authors gratefully acknowledge the financial and technical support of General Electric.
Maryana Kushnir RT provided valuable assistance in helping to collect radiation technique
data on patients undergoing cardiac catheterization.
References
[1] UNITED NATIONS SCIENTIFIC COMMITTEE ON THE EFFECTS OF ATOMIC
RADIATION (UNSCEAR), 1993 Report to the General Assembly, (United Nations,
NY) 1993.
[2] CUSMA, J.T., BELL, M.R., WONDROW, M.A., TAUBEL, J.P., HOLMES, D.R.,
Real-time measurements of radiation exposure to patients during diagnostic coronary
angiography and percutaneous interventional procedures, Journal of the American
College of Cardiology 33 (1999) 427-435.
[3] STERN, S.H., ROSENSTEIN, M., RENAUD, L., ZANKL, M., Handbook of selected
tissue doses for fluoroscopic and cineangiographic examination of the coronary arteries,
HHS Publication FDA 95-8289, September 1995.

IAEA-CN-85-64
280
[4] [GKANATSIOS, N.A., HUDA, W., Computation of energy imparted in diagnostic
radiology, Med. Phys. 24 (1997) 571-579.
[5] HUDA, W., GKANATSIOS, N.A., Effective dose and energy imparted in diagnostic
radiology, Med. Phys. 24 (1997) 1311-1316.
[6] INTERNATIONAL COMMISSION ON RADIOLOGICAL PROTECTION (ICRP),
1990 Recommendations of the ICRP. Pergamon Press (Oxford), 1991.
[7] HUDA, W., BEWS, J., Population irradiation factors (PIFs) in diagnostic medical
dosimetry, Health Physics 59 (1990) 345-347.
[8] WAGNER, L.K., ELFEL, P.J., GEISE, R.A., Potential biological effects following high
x-ray dose interventional procedures, JCIR 5 (1994) 71-84.
[9] HUDA, W. Radiation dosimetry in diagnostic radiology, AJR 169 (1997) 1487-1488.
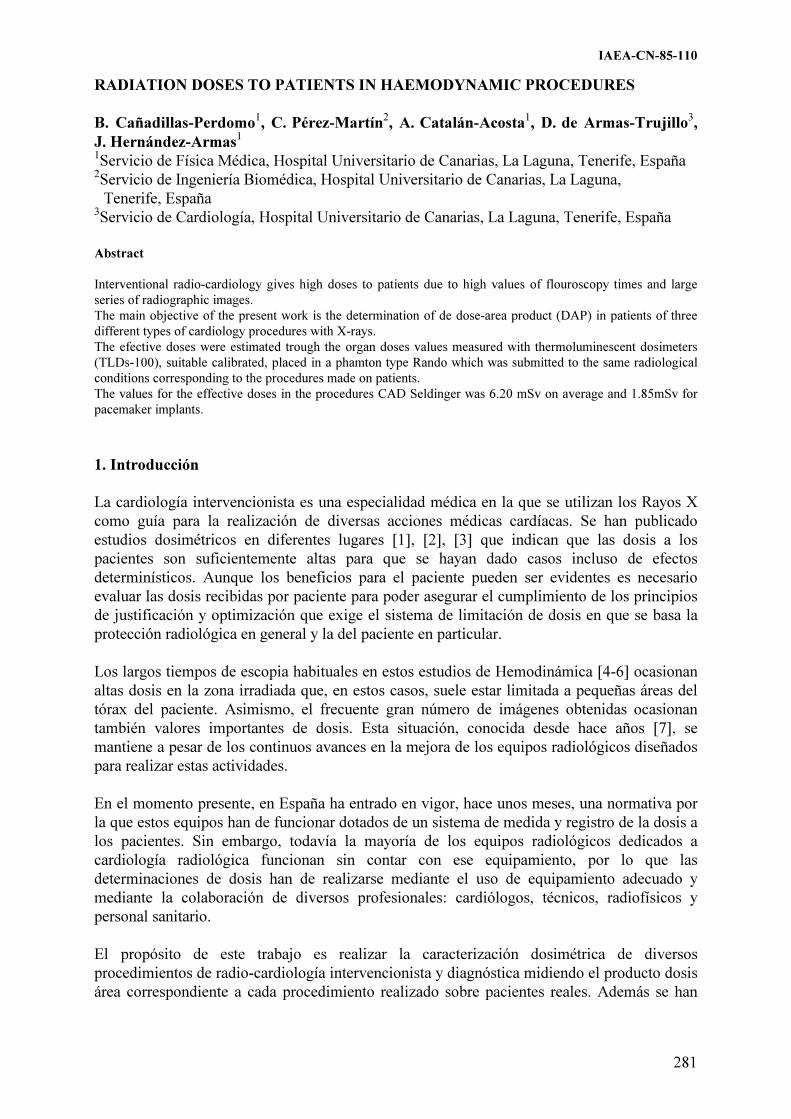
IAEA-CN-85-110
281
RADIATION DOSES TO PATIENTS IN HAEMODYNAMIC PROCEDURES
B. Cañadillas-Perdomo1, C.
Pérez-Martín2, A.
Catalán-Acosta1, D.
de Armas-Trujillo3,
J. Hernández-Armas1
1Servicio de Física Médica, Hospital Universitario de Canarias, La Laguna, Tenerife, España
2Servicio de Ingeniería Biomédica, Hospital Universitario de Canarias, La Laguna,
Tenerife, España 3Servicio de Cardiología, Hospital Universitario de Canarias, La Laguna, Tenerife, España
Abstract
Interventional radio-cardiology gives high doses to patients due to high values of flouroscopy times and large
series of radiographic images.
The main objective of the present work is the determination of de dose-area product (DAP) in patients of three
different types of cardiology procedures with X-rays.
The efective doses were estimated trough the organ doses values measured with thermoluminescent dosimeters
(TLDs-100), suitable calibrated, placed in a phamton type Rando which was submitted to the same radiological
conditions corresponding to the procedures made on patients.
The values for the effective doses in the procedures CAD Seldinger was 6.20 mSv on average and 1.85mSv for
pacemaker implants.
1. Introducción
La cardiología intervencionista es una especialidad médica en la que se utilizan los Rayos X
como guía para la realización de diversas acciones médicas cardíacas. Se han publicado
estudios dosimétricos en diferentes lugares [1], [2], [3] que indican que las dosis a los
pacientes son suficientemente altas para que se hayan dado casos incluso de efectos
determinísticos. Aunque los beneficios para el paciente pueden ser evidentes es necesario
evaluar las dosis recibidas por paciente para poder asegurar el cumplimiento de los principios
de justificación y optimización que exige el sistema de limitación de dosis en que se basa la
protección radiológica en general y la del paciente en particular.
Los largos tiempos de escopia habituales en estos estudios de Hemodinámica [4-6] ocasionan
altas dosis en la zona irradiada que, en estos casos, suele estar limitada a pequeñas áreas del
tórax del paciente. Asimismo, el frecuente gran número de imágenes obtenidas ocasionan
también valores importantes de dosis. Esta situación, conocida desde hace años [7], se
mantiene a pesar de los continuos avances en la mejora de los equipos radiológicos diseñados
para realizar estas actividades.
En el momento presente, en España ha entrado en vigor, hace unos meses, una normativa por
la que estos equipos han de funcionar dotados de un sistema de medida y registro de la dosis a
los pacientes. Sin embargo, todavía la mayoría de los equipos radiológicos dedicados a
cardiología radiológica funcionan sin contar con ese equipamiento, por lo que las
determinaciones de dosis han de realizarse mediante el uso de equipamiento adecuado y
mediante la colaboración de diversos profesionales: cardiólogos, técnicos, radiofísicos y
personal sanitario.
El propósito de este trabajo es realizar la caracterización dosimétrica de diversos
procedimientos de radio-cardiología intervencionista y diagnóstica midiendo el producto dosis
área correspondiente a cada procedimiento realizado sobre pacientes reales. Además se han

IAEA-CN-85-110
282
medido las dosis equivalentes necesarias para el calculo de la dosis efectiva al paciente a
partir de la simulación de los procedimientos en un maniquí antropomórfico tipo Rando, en el
que se colocaron dosímetros termoluminiscentes.
2. Material y método
El estudio se ha realizado en la Unidad de Hemodinámica del Servicio de Cardiología del
Hospital Universitario de Canarias (HUC). Está compuesto de dos salas:
- Sala 1: donde se realizan todos los procedimientos relacionados con marcapasos cardíacos.
- Sala 2: donde se realiza estudios de angiografía coronaria diagnóstica (CAD) tipo Seldinger
y tipo Sones ,y estudios de angioplastia coronaria transluminal percutánea (PTCA).
En la sala 1 el equipo usado fue también de la marca Siemens con un tubo Megalix 125/20/82
y generador Polydoros 80.
Todos los estudios realizados en la sala 2 se hicieron con un equipo de la marca Siemens, con
generador Polydoros IS-C y con adquisición digital de imágenes. En ambas salas se da escopia
pulsada.
Estos equipos cumplieron, durante la realización del estudio, las especificaciones fijadas en el
Protocolo Español de Control de Calidad en Radiodiagnóstico [8].
La medida del producto dosis–área se hizo con una cámara de transmisión PTW modelo
Diamentor M2, la cual se adosaba al diafragma del tubo de rayos X y cuyo sistema de registro
se situaba en la consola de control del equipo radiológico.
En cada uno de los procedimientos se tomaron los siguientes datos:
a) Datos del paciente: edad, sexo, peso, talla, diámetro anteroposterior (AP), y diámetro
lateral o transverso. Los diámetros se tomaron a la altura del tórax.
b) Datos del procedimiento:
�� Cinegrafia: kV , mA, distancia foco-intensificaddor (SID), tiempo de grafía, nº
fotogramas, todo esto para cada serie.
�� Fluoroscopia: kV, mA, tiempo escopia.
�� El tamaño del campo usado en grafía fue siempre de 17 cm de diámetro, y en
escopia de 23cm, para las exploraciones realizadas en la sala 2. Para los estudios
relacionados con marcapasos cardíacos (sala 1) el tamaño del campo usado fue
de 27cm.
El número de fotogramas por segundo usado en grafía fue siempre de 12,5 excepto para el
ventrículograma (que es normalmente la última serie de cine) que fue de 50.
Las proyecciones usadas durante los procedimientos, fueron:
Posteroanterior, posteroanterior-caudal, posteroanterior-craneal, derecha anterior oblicua,
derecha anterior oblicua - caudal, derecha anterior oblicua - craneal, izquierda anterior
oblicua, izquierda anterior oblicua - craneal, izquierda anterior oblicua - caudal.
Se han realizado medidas en 62 pacientes. En 38 de ellos se hicieron CAD tipo Seldinger (18
mujeres y 20 hombres),. En 7 pacientes los CAD fueron tipo Sones En 6 pacientes se

IAEA-CN-85-110
283
realizaron PTCA. En 11 pacientes se realizaron implantes de marcapasos tipo DDD bicameral
(colocación de dos cables, uno en aurícula y otro en ventrículo).
Todos los pacientes que fueron incluidos en este estudio tuvieron un peso comprendido entre
50 kg y 90 kg.
Se ha usado un maniquí Rando para estimar las dosis en órganos, mediante la utilización de
dosímetros termoluminiscentes Harshaw tipo TLD-100 que se distribuyeron por todo el
maniquí en posiciones correspondientes a los órganos y tejidos establecidos en las
recomendaciones ICPR-60 para el cálculo de dosis efectiva.
La dosis asignada a cada órgano fue determinada haciendo un promedio de todos los
resultados proporcionados por los TLDs colocados en el mismo,como es habitual [9]
La dosis de cada TLDs fue medida usando un lector Harshaw 4000, siguiendo para ello el
procedimiento habitual en nuestro laboratorio.
La reproducción de los datos en el maniquí se hicieron para dos exploraciones: CAD tipo
Seldinger y DDD.
En total fueron usados 65 TLD en la reproducción de el CAD tipo Seldinger y 55 TLDs para
los implantes DDD de marcapasos.
3. Resultados
Las medidas realizadas de los parámetros representativos de cada tipo de exploración han
dado lugar a los valores medios y desviaciones estándar (SD) que se presentan en la Tabla I.
La complejidad de las exploraciones PTCA se refleja en el alto valor promedio del producto
dosis área.
En las exploraciones CAD tipo Seldinger cuyos resultados se presentan en esta Tabla I, sólo
se han considerado las exploraciones “típicas”: coronariografia y ventriculografia.
Puede observarse en la tabla como en el cateterismo tipo Sones el valor del PDA es un algo
más elevado que en el tipo Seldinger. Probablemente se debe a la mayor dificultad de
realización del primer tipo.
La contribución de fluoroscopia y cinefluorografía al PDA en cada exploración, está
representada en la figura 1. Se puede observar que en CAD (tipo Seldinger y tipo Sones) se da
más cineflourografía que flouroescopia al contrario que en PTCA. En la sala 1, de los
marcapasos sólo usa escopia.
Para reproducir las exploraciones cuando se usó el maniquí se utilizaron los valores medios de
los parámetros medidos sobre los pacientes reales. En particular, se tenía muy en cuenta la
máxima similitud entre el valor medio de PDA en los pacientes y el valor alcanzado en la
irradiación del maniquí.
En la Tabla II se presentan los valores de las dosis medidas en “órganos” [10] del maniquí
antropomórfico utilizando dosímetros termoluminiscentes TLD-100, que habían sido
calibrados en el Centro Nacional de Dosimetría. Los datos corresponden a las dos
exploraciones anteriormente indicadas. Es de señalar que estas dosis corresponden a los
valores medios obtenidos a partir del conjunto de dosímetros colocados en cada órgano.

IAEA-CN-85-110
284
Tabla I. Parámetros radiológicos y dosimétricos de las tres exploraciones
Cine Escopia
Tipo de exploración
Nº pacientes kV (SD) mAs (SD)
Nº FOTOGRAMA (SD)
SERIES CINE (SD)
KVp (SD)
mAs (SD)
DAP cGy*cm2 (SD)
CAD
(Seldinger)
38 70,5 (3,7) 3050,2
(231,1)
85,9
(9,5)
8,4 (2,0) 78,8
(7,2)
2271
(2653,3)
1907,5
(1171,1)
CAD (Sones) 8 75,5 (5,1) 3764,7
(511,4)
89,5
(8,1)
9,75
(2,1)
79,4
(1,7)
2567,1
(913,2)
2817
(1092,7)
PTCA 6 90,6(10,5) 2749
(5075)
95,2
(15,6)
9 (3,2) 98,3
(9)
10334.4
(2869)
4115
(4669.3)
Tipo de exploración
Nº pacientes kV mA DAP (cGy*cm2) (SD)
Marcapaso tipo
DDD
11 77 4.6 1495
(632.7)
0
20
40
60
80
100
CAD Seld CAD Soner PTCA
Tipo de exploración
PD
A (
%)
cineflourografia Flouroescopia
Figure 1. Contribución de la escopia y cine al producto dosis área para los tres tipos de
exámenes
Tabla II. Dosis tejido/órgano
CAD tipo Seldinger Marcapasos tipo DDD Órgano / tejido Nº de
TLDs Dosis (mGy)
Nº de TLDs
Dosis (mGy)
Gónadas
Testículos 1 0.18 1 0.06
Ovarios 2 0.28 2 0.40
Colon 7 0.64 4 0.09
Pulmón 25 15.37 18 2.07
Estómago 1 15.76 1 6.84
Vejiga 1 1.90 2 1.68
Esófago 6 6.90 6 2.80
Hígado 6 9.58 1 0.63
Tiroides 2 0.92 1 0.65
Corazón 3 12.82 3 3.70
Mama 2 2.25 2 2.25
Cristalino 2 0.25 2 0.10
Superficie ósea 1 28.60
Piel 9 1.48 11 7.43
Total TLDs 68 55

IAEA-CN-85-110
285
4. Conclusiones
1. La dosis efectiva (considerando solamente los órganos para los que ICRP-60 establece un
factor de ponderación) para los dos tipos de exploraciones de cardiología intervencionista,
estimada a partir de las medidas de dosis en órganos con dosímetros TLD en maniquí
Rando son:
�� CAD tipo Seldinger : 6.2 mSv
�� Implante de marcapasos tipo DDD: 1.85 mSv
2. En los cateterismos, el 60% del PAD total fue impartido en cine-radiografía, este datos es
similar al de otros autores (6). En el caso de los procedimientos PTCA el valor impartido
en cine-radiografía fue de un 20% del total, este valor es inferior al porcentaje aparecido
en la bibliografía.
Referencias
[1] Karppinen,J.; Parviainen,T.; Servomaa,A. And Komppa,T. Radiation risk and exposure
of radiologists and patients during coronary angiography and percutanous
transluminal coronary angioplasty Rad.Prot.Dosim. 57(1-4), 481-485 (1995).
[2] Faulkner,K.; Love,H.G.; Sweeney, J.K. and Bardsley,R.A. Radiation Doses and Somatic
Risk to Patients During Cardiac Radiological Procedures. Br.J. Radiol. 59, 359-363
(1986).
[3] Vañó,E.; González,L.; Fernández, J.M. and Guibelalde,E. Patient dose values in
interventional radiology. Br.J.Radiol.68, 1215-1220 (1995).
[4] Huyskens,C.J. and Hummel,W.A. Data analysis on patient exposures in cardiac
angiography. Rad.Prot.Dosim. 57 (1-4), 475-480 (1995).
[5] Broadhead,D.A.; Chapple,C.L.; Faulkner,K.; Davies,M.L. and McCallum,H. Local
Reference Doses During Cardiology Procedures. Rad. Prot. Dosim. 80 (1-3), 149-
150(1998).
[6] Betsou,S.;Pefstathopoulos,E.; Katritsis,D.; Faulkner,K. And Panayiotakis,G. Patient
radiation doses during cardiac catheterization procedures. Br.J.Radiol. 71,634-639
(1998).
[7] Neofotistou,V.; Karoussou,A.; Lobotesi,H. And Hourdakis,K. Patient dosimetry during
interventional cardiology procedures. Rad. Prot. Dosim. 80 (1-3),151-154 (1998).
[8] Protocolo Nacional de Control de Calidad en Radiodiagnóstico. ISBN:84-87450-70-
9.Madrid (1996).
[9] Padovani,R.; Novario,R. and Bernardi,G. Optimisation in corfonary angiography and
percutaneous transluminal coronary angioplasty. Rad.Prot.Dosim. 80 (1-3), 303-306
(1998).
[10] ICRP,1990. Recommendations of the International Comission on Radiological
Protection. SERP publicación. Madrid 1995.

IAEA-CN-85-177
286
COMPARISON BETWEEN THERMOLUMINISCENCE DOSIMETRY AND
TRANSMISSION IONIZATION CHAMBER MEASUREMENTS
I. Hernando, R. Torres
Servicio de Radiofísica y Protección Radiológica, Hospital Universitario Río Hortega,
INSALUD, Valladolid, Spain
Abstract
Radiofrequency catheter ablation is an effective option to treat life-threatening arrhytmias. Among the risks of
this type of procedures are the high radiation doses to patients. The major concern for monitoring of doses has
been related to skin damage. Skin dose can be measured directly with thermoluminiscence dosimeters (TLDs) or
can be determined from the dose-area product (DAP). In this work these two different methods are discussed.
The radiation doses have been estimated in more than 20 patients with the two types of monitoring. In order to
find the location of the maximum dose from the procedure with TLDs, dosimeter arrays can be placed on the
patient. Unfortunately TLDs do not allow immediate feedback to the fluoroscopist. They require a fair amount of
handling, calibrating, processing and annealing. On the other hand, the DAP provides immediate feedback of the
cumulative dose. To obtain the skin dose from DAP the area of the radiation field on the skin must be
determined, and it is necessary to correct the result by a factor that includes the variation of geometry during the
procedure. Nevertheless these and other factors can lead to significant errors in dose estimation.
1. Introduccion
La ablación con radiofrecuencia es una alternativa efectiva a la terapia médica para pacientes
con arritmias [1]. A pesar de ello es una técnica que presenta sus riesgos entre los que se
encuentran las altas dosis de radiación recibidas por el paciente, que pueden alcanzar el
umbral de los efectos deterministas y producir eritema e incluso radiodermitis en la zona del
paciente directamente expuesta al haz de radiación [2]. Este es un aspecto que exige atención
desde el punto de vista de protección radiológica y que tiene obvias implicaciones clínicas.
Para prever el alcance del posible daño producido por la radiación es necesario medir las
dosis recibidas por los pacientes. Uno de los métodos más simples consiste en calcularlas a
partir de medidas de rendimiento o de la tasa de dosis del equipo de rayos X, teniendo en
cuenta el tiempo total de fluoroscopia utilizada. Sin embargo este método está sujeto a fuentes
de error considerables, ya que tanto la geometría como los valores de tensión y corriente
varían considerablemente durante la exploración. Entre los métodos alternativos se pueden
destacar la medida de dosis mediante dosímetros de termoluminiscencia y la medida del
producto dosis*área mediante cámaras de transmisión. El objeto de este trabajo es intentar
comparar estos dos últimos métodos para desarrollar procedimientos razonablemente sencillos
y fiables de estimación de la dosis que reciben los pacientes.
2. Material y metodos
Se han realizado medidas sobre un grupo de más de 20 pacientes que han sido sometidos a
procedimientos terapéuticos de ablación en el laboratorio de electrofisiología cardiaca del
Hospital Universitario de Valladolid (España) [3]. Para estimar las dosis recibidas por los
pacientes se han utilizado simultáneamente dosímetros TLD-100 y las lecturas recibidas por
una cámara de transmisión. Para intentar obtener el punto en la piel que recibe mayor cantidad
de dosis se ha colocado en la espalda de cada paciente dos filas de 10 dosímetros cada una,
con una separación de 2 cm entre ellas. Dentro de cada tira la distancia entre dosímetros

IAEA-CN-85-177
287
también es de 2 cm. Los dosímetros se leyeron en un equipo Victoreen 2800M siguiendo los
procedimientos descritos en la referencia [4].
Como cámara de transmisión se ha utilizado una cámara PTW Diamentor M2 colocada a la
salida del tubo de rayos X. Por último y para obtener una idea de los campos de radiación
utilizados a lo largo del procedimiento se ha colocado para cada paciente una placa
radiográfica lenta (Kodak X-Omat V) en la superficie de la mesa de intervención.
3. Resultados
En función de las características de cada procedimiento se han obtenido valores distintos de
tiempo de fluoroscopia, tensión y corriente. Los tiempos son habitualmente grandes y pueden
llegar a superar de manera no demasiado infrecuente las 2 horas, con un valor medio superior
a la hora de fluoroscopia. Además cuando se trata de pacientes gruesos el sistema de imagen
requiere un haz de radiación con tensiones superiores a 90 kV y corrientes de más de 3 mA.
1. DOSIMETRIA DE TERMOLUMINISCENCIA
En la figura 1 se muestran los valores máximos de dosis registrados en los dosímetros
colocados en la espalda del paciente y los tiempos de fluoroscopia para la misma muestra de
pacientes. Los valores de dosis son siempre altos (en ocasiones y en puntos concretos de la
piel han superado 4 Gy), aunque variables entre pacientes debido a la particularidad de cada
exploración, y dentro de la tira entre dosímetros debido a que cada uno de ellos está un tiempo
distinto dentro del haz directo de radiación. Para ilustrar este último comentario en la figura 2
se muestran los resultados típicos de una tira de 20 dosímetros. A pesar de las precauciones
tomadas, no puede garantizarse que el punto de la piel del paciente que ha recibido la máxima
dosis haya quedado registrado dentro la lectura de los veinte dosímetros.
2. CAMARA DE TRANSMISION
La cámara de transmisión presenta los resultados en forma de producto dosis*área. Para el
cálculo de la dosis en la espalda del paciente a partir de dicho valor puede utilizarse la
siguiente expresión:
LS
FFTpFD tr
in*
*),( �
�
donde Din es la dosis a la entrada de la superficie del paciente, F(p,T) es el factor de
corrección por presión y temperatura, Fr es el factor de retrodispersión, Ft es el factor de
transmisión de la mesa radiológica, S es el área irradiada en la espalda del paciente y L es la
lectura de la cámara. Todos los factores pueden ser evaluados con lo que en definitiva Din
puede ser calculada como el producto de un factor por la medida de la cámara. En la tabla 1 se
resumen los resultados obtenidos. La variabilidad en los mismos puede explicarse en función
de los distintos tiempos de fluoroscopia utilizados, de los parámetros geométricos y de las
características de espesor de los pacientes.

IAEA-CN-85-177
288
En condiciones ideales, si la
geometría no se hubiera
modificado durante un
procedimiento, la lectura
proporcionada por la cámara
debería coincidir con la dosis
máxima de la tira de
dosímetros. Sin embargo dada
la variabilidad de la misma no
es el mismo punto de la espalda
del paciente el que recibe la
máxima dosis por lo que la
medida del Diamentor tiende a
sobrestimarla en un valor
próximo, según estos cálculos,
al 30%, aunque en algunos casos han llegado a ser del 50%. Estas variaciones pueden ser
debidas a que no se ha conseguido registrar el punto de mayor dosis en el paciente dentro de la
superficie registrada por la tira de dosímetros.
4. Discusion
Aunque la radiación puede producir efectos estocásticos y deterministas, en este caso son
estos últimos los que adquieren una gran importancia debido por una parte a las altas dosis de
radiación recibidas por los pacientes y por otra a que el grupo de población que es sometido a
este tipo de procedimientos es relativamente pequeño si se compara con otro tipo de
exploraciones de radiodiagnóstico. Aunque pueda haber órganos que tengan riesgo de
alcanzar los efectos deterministas, la mayor preocupación a la hora de evaluar las dosis está en
el daño sufrido por la piel [5]. Más aún, una vez que se conoce la dosis a la entrada hay
distintos métodos para determinar la dosis a órganos internos [6]. En este trabajo se han
utilizado dos métodos distintos de obtener la dosis máxima en la piel de los pacientes
sometidos a ablación por radiofrecuencia.
La mayor dificultad en la dosimetría con TLD’s está en garantizar una correcta colocación de
los mismos en la espalda del paciente para asegurar que el punto de la piel que recibe mayor
dosis puede quedar registrado con la lectura de los dosímetros irradiados. Obviamente para
soslayar esta dificultad puede recurrirse a una matriz más compacta (con menos distancia
entre dosímetros) y bidimensional [7]. Con todo uno de los mayores problemas del método es
su laboriosidad que lo puede hacer poco recomendable para un uso sistemático. Además los
valores obtenidos no pueden verse durante el desarrollo de la exploración, sino que requiere
una lectura y limpieza en un laboratorio. Los dosímetros utilizados habitualmente para
dosimetría de pacientes son los de fluoruro de litio que presentan una variación en su
respuesta con la energía de un 30% - 40% desde 30 keV hasta 100 keV. Además las dosis en
estos procedimientos pueden alcanzar el rango en el que la respuesta del TLD se convierte en
supralineal (en torno a 6 Gy), lo que obligaría a utilizar necesariamente factores de corrección.
La utilización de una cámara de transmisión tiene inicialmente la ventaja de que los valores
medidos se presentan en tiempo real en pantalla con lo que el cardiólogo puede tener una idea
de la cantidad de dosis que está recibiendo el paciente. Sin embargo a diferencia de los TLD la
medida de dosis en la piel se convierte en indirecta y es necesario estimar el área del haz de
radiación. Una incertidumbre de un 5% en la medida de las distancias se traduce en una
Mínimo Median
a
Media Máximo
Parámetros haz radiación
Tensión (kV) 64 73 76 96
Intensidad (mA) 1.6 2.0 2.2 3.4
Tiempo escopia (min) 20 63.3 73.2 139.1
Medida con TLD
Máximo de dosis (Gy) 0.3 0.9 1.5 4.7
Abdomen (mGy) 0.5 1.5 1.9 4.5
Frente (mGy) < 0.01 0.15 0.25 0.76
Medida con Diamentor
Dosis*àrea (cGy/cm2) 5600 23400 25700 77000
Dosis máxima calculada (Gy) 0.41 1.25 1.8 5.61
Figure 1 Datos estadísticos correspondientes al haz de rayos X y
a las medidas con TLD y cámara de transmisión

IAEA-CN-85-177
289
incertidumbre del 10% en el valor del área. Además no debe olvidarse que dicho área cambia
con la orientación de la geometría, con el modo de magnificación usado y con el ajuste de los
colimadores. Por otra parte debe aceptarse la inclusión de un factor de corrección que tenga en
cuenta la variación del campo de entrada a lo largo del procedimiento.
También el resto de factores presentes en el cálculo presentan una incertidumbre. El factor de
retrodispersión depende del tamaño de campo del haz de radiación y de la energía pero su
variación puede estar acotada en un 10% de su valor medio para el intervalo de campos y
energías utilizados en este tipo de exploraciones [8]. El factor de transmisión de la mesa
radiológica depende de la energía pero también del ángulo de incidencia del haz de radiación.
Por último si el colimador dispone de filtros compensadores, la utilización de los mismos
subestimará la medida de la dosis en las zonas no atenuadas por los mismos mediante el
método de cámara de transmisión.
5. Conclusion
Los dos métodos estudiados de estimación de dosis a pacientes en procedimientos de ablación
por radiofrecuencia presentan ventajas e inconvenientes que los pueden hacer más o menos
recomendables en función del objetivo que se tenga en mente. En este tipo de procedimientos
con tan altas dosis puede ser necesario un conocimiento más preciso de las mismas para
establecer criterios de vigilancia y actuación específicas para aquellos casos en que se superen
determinados niveles. La medida directa con una matriz bidimensional de TLD’s
suficientemente compacta parece ser la respuesta a esta necesidad ya que es el método que
presenta menor grado de error, aunque sea poco práctico. Sin embargo también puede ser muy
interesante para el cardiólogo tener en tiempo real la dosis recibida por el paciente durante una
intervención para poder determinar si debe ser modificado el procedimiento para proteger la
piel del paciente de daños debidos a la radiación. La medida de tiempos de fluoroscopia y
parámetros del haz de rayos X (tensión y corriente) puede dar aproximaciones adecuadas,
aunque con un margen de error que puede ser muy importante.
Si se está dispuesto a asumir un cierto grado de incertidumbre (que puede ser superior al 30%
en determinados casos) en la medida de la dosis para así poder obtener las lecturas durante la
intervención, el modo más simple y práctico parece la medida sistemática del producto
dosis*área con una cámara de transmisión, con la inclusión de un factor de corrección que
tenga en cuenta la variación del campo de entrada a lo largo del procedimiento.
Referencias
[1] KATZ HV, “Cardial Electrophysiology: principles and instrumentation”, RSNA 1998
Categorical Course in Diagnostic Radiology Physics: Cardiac Catheterization Imaging:
31 a 36
[2] ROSENTHAL L., BECK TJ, WILLIAMS J. y otros, “Acute radiation dermatitis
following radiofrequency catheter ablation of atrioventricular nodal reentrant
tachycardia”, Pacing Clin Electrophysiol (1997), Vol. 20: 1834 a 1839
[3] SALVADOR FJ, HERNANDO I., TORRES R, “Dosimetría de pacientes en
procedimientos de ablación por radiofrecuencia en cardiología”, Comunicación al XII
Congreso Nacional de Física Médica. Santander 1999.

IAEA-CN-85-177
290
[4] HERNANDO I., TORRES R., BARQUERO R., “Puesta a punto de un sistema de
dosimetría de anillo por termoluminiscencia”, Radioprotección, nº extraordinario.
Septiembre 1996
[5] WAGNER LK, EIFEL PJ, GEISE RA, “Potential biological effects following high x-ray
dose interventional procedures”, JVIR (1994), Vol 5: 71 a 84
[6] STRAUSS KJ, “Clinical radiation dose monitoring”, RSNA 1995 Categorical Course in
Physics: Physical and Technical Aspects of Angiography and Interventional Radiology:
171 a 187
[7] PINA MV, DEYE JA, “Entrance skin and organ doses from cardiac catheterization
procedures”, Med Phys (1997); Vol 24: 992
[8] GEISE RA, “Clinical Dose Monitoring”, RSNA 1998 Categorical Course in Diagnostic
Radiology Physics: Cardiac Catheterization Imaging: 241 a 247

IAEA-CN-85-168
291
RADIOFREQUENCY CATHETER ABLATION:
RELATIONSHIP BETWEEN FLUOROSCOPIC TIME AND
SKIN DOSES ACCORDIND TO DIAGNOSES.
BASIS TO ESTABLISH A QUALITY ASSURANCE PROGRAMME
E. Cotelo
1, J. Pouso
2, W. Reyes
3 1Escuela Universitaria de Tecnología Médica, Universidad de la República, Montevideo, Uruguay 2Centro de Cómputos y Estadística del Departamento de Cardiología de Casa de Galicia, Montevideo, Uruguay 3Laboratorio de Electrofisiología de Casa de Galicia, Montevideo, Uruguay Abstract
Radiofrequency Cardiac Catheter Ablation is an Interventional Radiology procedure of great complexity because
of the cardiologist needs of a simultaneous evaluation of fluoroscopic images and electrophysiologic
information.. Therefore, the procedure typically involves extended fluoroscopic time that may cause radiation-
skin injures to patients. Skin doses depend on many factors: equipment design features and its proper use,
cardiologist practice, fluoroscopic time, irradiated areas, application of radiation protection recommendations,
etc. We evaluate fluoroscopic time in relation to pathology and we estimate skin doses on 233 procedures at the
Electrophysiology Laboratory in Casa de Galicia, Montevideo, Uruguay. Significant differences among the
medians of fluoroscopic time were found in those procedures depending on diagnoses and results. Higher
fluoroscopic time was found in flutter and auricular tachycardia (median was 83 minutes, p=0.0001). In
successful procedures (almost 90%), median skin doses was 2.0 Grays(p=0.0001). On the basis of records
information, the standard operating procedure and the clinical protocol, expanding close cooperation between the
cardiologists and the experts in Radiation Protection will secure the establishment of an Assurance Quality
Program.
1. Introduccion
La ablación por catéter utilizando radiofrecuencia(AC) es la primera opción terapéutica para un numeroso grupo de pacientes con taquiarritmias. La mayoría de las taquicardias de significación clínica se deben al mecanismo de reentrada, es decir, a la existencia en el corazón de un circuito anatómica y electrofisiológicamente definido que depende para su funcionamiento de una zona crítica. Identificando el circuito mediante un estudio electrofisiológico(EEF) y aplicando radiofrecuencia(AC) en su zona crítica, puede eliminarse la arritmia y curar al paciente. La ubicación de los catéteres se realiza a partir de imágenes fluoroscópicas. La complejidad del procedimiento hace que, en algunos casos, las dosis recibidas por los pacientes pueden producir efectos determinísticos en su piel[1].Uruguay no tiene un Programa Nacional de Protección Radiológica(PR) y el currículum de la especialidad Cardiología no tiene horas asignadas a la formación en PR. Esto motivó el inicio a partir de agosto del año 2000, de un Programa de Educación en PR en Cardiología Intervencionista. Al iniciarse la etapa de evaluación de los procedimientos, los profesionales del Laboratorio de Electrofisiología Cardíaca de Casa de Galicia son ampliamente receptivos a la implementación de un Programa de Garantía de Calidad [2]. Con el fin de evaluar indicadores de posibles efectos determinísticos en la piel de los pacientes sometidos a AC, el presente trabajo tiene como objetivo determinar los tiempos de fluoroscopía (t)y estimar las dosis en piel de pacientes(D)en función del diagnóstico que justifica el procedimiento.

IAEA-CN-85-168
292
2. Material y metodos
El trabajo se realizó en el Laboratorio de Electrofisiología de Casa de Galicia sobre un total de 383 procedimientos en el período diciembre de 1992 a octubre de 2000.Se consideraron únicamente aquellos procedimientos realizados una única vez por sesión (n = 283) en los que se aplicaron los siguientes criterios de exclusión: carencia o dudas en los datos de t (n = 22), diagnósticos poco concluyentes (n = 10) o más de uno (n = 17) en el EEF, con lo que la población definitiva queda reducida a 233 AC en 218 pacientes, de las cuales 12 (5.2%) son reintervenciones en procedimientos independientes. Los diagnósticos del EEF fueron clasificados en 4 grupos (Tabla I). Tabla I. Agrupación de Diagnósticos en el EEF
Diagnóstico N (%) Reentrada Nodal (RN) 103 (44.2) Vías Accesorias (VA) 66 (28.3) Flutter y Taquicardias Auriculares (FT) 37 (15.9) Otros diagnósticos (*) 27 (11.6)
(*) Fibrilación auricular crónica(n=17), Fibrilación auricular paroxística (n = 7)yTaquicardias ventriculares
(n=3).
Los tiempos de fluoroscopía fueron registrados sistemáticamente en el período junto a características básicas de los pacientes de interés para este estudio registradas en las historias clínicas y en la base de datos del Servicio de Electrofisiología (Tabla II). Tabla II. Características básicas de los pacientes sometidos a AC
Diagnóstico RN VA FT Otros N 103 66 37 27 Hombres (%) 23 (22.3) 37 (56.1) 20 (54.1) 22 (81.5) Edad +/- 1ds (años) 49.7 +/- 18 37.1 +/- 18 56.7 +/- 14 58.8 +/- 10 Talla +/- 1ds (cm) 164 +/- 8 168 +/- 13 169 +/- 10 173 +/- 11 Peso +/- 1ds (Kg) 67 +/- 16 75 +/- 18 78 +/- 12 86 +/- 21
El equipo de fluoroscopía utilizado en todas las AC fue Siemens Elema modelo Angioskop D (año 1991), no tiene radioscopía pulsada ni mantiene la última imagen y careció de controles de calidad. Todas las AC fueron realizadas por el mismo equipo de médicos electrofisiólogos, y se utilizaron los siguientes protocolos estandarizados: a) clínico, que comprende la inserción como mínimo de 4 catéteres: uno en seno coronario por vía subclavia y los restantes en aurícula y ventrículo derechos por vía femoral. El catéter de ablación siempre dispuso de un electrodo distal de 4 mm de superficie, con y sin control de temperatura, conectado a un generador de radiofrecuencia Medtronic-Cardiorrythm modelo Atakr. b)radiológico, inserción del catéter en seno coronario con proyecciones AP y OAI en un t promedio de un minuto. Inserción del resto de los catéteres, procedimientos diagnósticos y terapéuticos con proyecciones OAD (60% de t) y OAI (40% de t). Durante toda la práctica: diámetro de entrada del II es 23 cm, máxima distancia foco-piel y mínima distancia intensificador-piel. Debido a que, no se dispone de instrumental, se optó por el método que sigue para estimar D. Las constantes para la estimación de D fueron proporcionadas por la empresa CONATEL, que

IAEA-CN-85-168
293
realiza el Servicio Técnico del equipo radiológico. De acuerdo al equipo radiológico utilizado y los protocolos arriba señalados, se aplicó la siguiente: D (Gy) = 1.35x(Rendimiento)x (m A)x tiempo de Fluoroscopía
Donde: 1.35 es el factor de retrodispersión, m A es el promedio estimado a partir del equipo y del protocolo practicado[3][4]. Se aplican los factores de equivalencia entre unidades de medida y se realiza la corrección de la distancia para obtener el rendimiento a la entrada de la piel. Este método sobrestima la dosis en piel [3][4]. Se consideraron finalmente los resultados de la AC de acuerdo a los siguientes criterios clínicos: a) Éxito. Eliminación de la taquicardia por modificación o eliminación de la conducción en
la vía lenta(en RN), por eliminación del o las VA, y en el flutter auricular la demostración de bloqueo bidireccional a nivel del istmo cavo-tricuspídeo.
b) Éxito Parcial. No se cumplen totalmente los criterios de éxito aunque los circuitos de taquicardia son modificados. Solamente la evolución clínica podrá definir el éxito total.
c) Falla. El procedimiento no cumple con ninguno de los objetivos.
3. Metodos estadisticos
Las variables centrales del estudio son estimadores de la radiación recibida por los pacientes sometidos a AC: los t registrados y una estimación de D durante las AC a través de la ecuación lineal descrita en métodos. Las variables de agrupamiento y comparación son los diagnósticos establecidos en el EEF y los resultados de la AC. Las distribuciones de ambos estimadores según diagnósticos difirieron significativamente de la normalidad según el test de Shapiro-Wilk, solamente se comportaron como normales las pequeñas distribuciones (éxito parcial y falla) por lo cual las comparaciones de t y de D se realizan a través de las pruebas no paramétricas de Kruskall-Wallis y Mann-Whitney. Las comparaciones de proporciones de éxito según los diagnósticos se establecieron por medio de chi cuadrado, 1 grado de libertad. En todos los casos alfa = 0.05. Los datos fueron procesados en EPI INFO 6.04 B y Prophet V5.0.
4. Resultados
Las medianas de t (83 min) y D estimada (5.0 Gy) para el diagnóstico FT fueron significativamente mayores que para los otros diagnósticos, los que no mostraron diferencias significativas entre sí (Tabla III y Figura 1). Tabla III. Tiempos de Fluoroscopia ( t en minutos) y Dosis (D en Gy) según diagnósticos
Diagnóstico RN VA FT Otros t Media +/- 1ds 36 +/- 25 52 +/- 43 91 +/- 50 42 +/- 35 t Mediana 28 42 83 36 D Media +/- 1ds 2.1 +/- 1.5 3.1 +/-2.6 5.5 +/- 2.9 2.5 +/- 2.1 D Mediana 1.7 2.5 5.0 2.2
Las medianas de t (33 min) y D estimada (2.0 Gy) para el resultado éxito fueron significativamente menores que para los otros resultados, los que tampoco mostraron diferencias significativas entre sí (Tabla IV y Figura 2)

IAEA-CN-85-168
294
Figura 1. Comparaciones de tiempos de fluoroscopia en 233 ablaciones por catéter de radiofrecuencia según diagnósticos en un servicio de Electrofisiología de Montevideo, Uruguay, entre 1992 y 2000. El tiempo de FT es significativamente mayor que el del resto de los diagnósticos (kruskall-wallis, p = 0.0001) quienes no mostraron diferencias significativas entre sí.
RN : reentrada nodal (n = 103), VA: vías accesorias ( n = 66), FT: flutter y taquicardias auriculares (n = 37) y Otros (n = 27. Figura 2. Comparaciones de tiempos de fluoroscopia en 233 ablaciones por catéter de radiofrecuencia según resultados obtenidos en un servicio de Electrofisiología de Montevideo, Uruguay, entre 1992 y 2000. El tiempo de éxito es significativamente menor que el de los otros resultados (kruskall-wallis, p = 0.0001) quienes no mostraron diferencias significativas entre sí. Éxito (n= 207), éxito parcial (n = 8) y falla (n = 18).
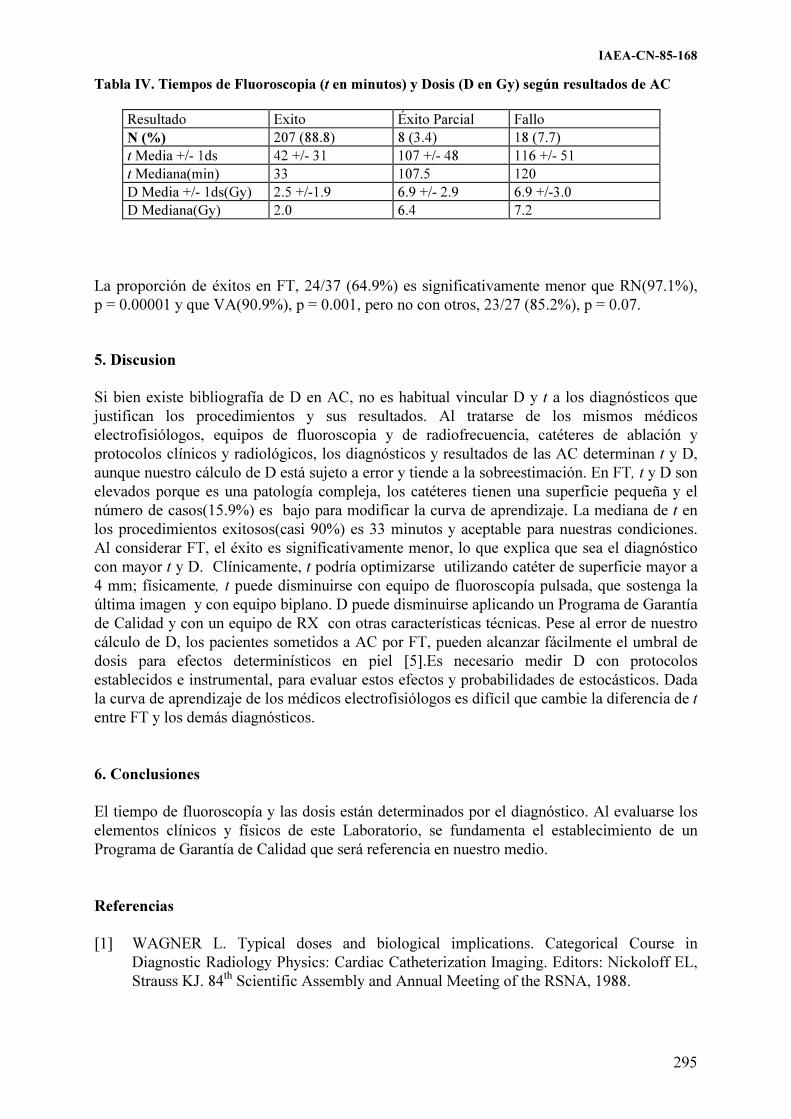
IAEA-CN-85-168
295
Tabla IV. Tiempos de Fluoroscopia (t en minutos) y Dosis (D en Gy) según resultados de AC
Resultado Exito Éxito Parcial Fallo N (%) 207 (88.8) 8 (3.4) 18 (7.7) t Media +/- 1ds 42 +/- 31 107 +/- 48 116 +/- 51 t Mediana(min) 33 107.5 120 D Media +/- 1ds(Gy) 2.5 +/-1.9 6.9 +/- 2.9 6.9 +/-3.0 D Mediana(Gy) 2.0 6.4 7.2
La proporción de éxitos en FT, 24/37 (64.9%) es significativamente menor que RN(97.1%), p = 0.00001 y que VA(90.9%), p = 0.001, pero no con otros, 23/27 (85.2%), p = 0.07. 5. Discusion
Si bien existe bibliografía de D en AC, no es habitual vincular D y t a los diagnósticos que justifican los procedimientos y sus resultados. Al tratarse de los mismos médicos electrofisiólogos, equipos de fluoroscopia y de radiofrecuencia, catéteres de ablación y protocolos clínicos y radiológicos, los diagnósticos y resultados de las AC determinan t y D, aunque nuestro cálculo de D está sujeto a error y tiende a la sobreestimación. En FT, t y D son elevados porque es una patología compleja, los catéteres tienen una superficie pequeña y el número de casos(15.9%) es bajo para modificar la curva de aprendizaje. La mediana de t en los procedimientos exitosos(casi 90%) es 33 minutos y aceptable para nuestras condiciones. Al considerar FT, el éxito es significativamente menor, lo que explica que sea el diagnóstico con mayor t y D. Clínicamente, t podría optimizarse utilizando catéter de superficie mayor a 4 mm; físicamente, t puede disminuirse con equipo de fluoroscopía pulsada, que sostenga la última imagen y con equipo biplano. D puede disminuirse aplicando un Programa de Garantía de Calidad y con un equipo de RX con otras características técnicas. Pese al error de nuestro cálculo de D, los pacientes sometidos a AC por FT, pueden alcanzar fácilmente el umbral de dosis para efectos determinísticos en piel [5].Es necesario medir D con protocolos establecidos e instrumental, para evaluar estos efectos y probabilidades de estocásticos. Dada la curva de aprendizaje de los médicos electrofisiólogos es difícil que cambie la diferencia de t entre FT y los demás diagnósticos.
6. Conclusiones
El tiempo de fluoroscopía y las dosis están determinados por el diagnóstico. Al evaluarse los elementos clínicos y físicos de este Laboratorio, se fundamenta el establecimiento de un Programa de Garantía de Calidad que será referencia en nuestro medio.
Referencias
[1] WAGNER L. Typical doses and biological implications. Categorical Course in Diagnostic Radiology Physics: Cardiac Catheterization Imaging. Editors: Nickoloff EL, Strauss KJ. 84th Scientific Assembly and Annual Meeting of the RSNA, 1988.

IAEA-CN-85-168
296
[2] Practical Aspects of Radiation Protection in Interventional Radiology. Working material. Safety Report Series. Reproduced by the IAEA. Vienna . Austria. 1999
[3] International Commission on Radiological Protection. Protection of the patient in diagnostic radiology. ICRP Publication 34. Annals of the ICRP 1982.
[4] Diagnostic Physics Review Course. World Congress on Medical Physics. July 2000. Chicago.
[5] International Commission on Radiological Protection. 1990. Recommendations of the IRCP Publication 60. Annals of the IRCP.1994
IAEA-CN-85-62
297
ESTIMATION OF SKIN DOSE IN INTERVENTIONAL NEURO
AND CARDIAC PROCEDURES
P.J. Marsden1, Y. Washington
2, J. Diskin
3
1Department of Medical Physics and Bioengineering, UCL Hospitals NHS Trust,
London, United Kingdom 2Department of Imaging, UCL Hospitals NHS Trust, London, United Kingdom
3Formerly UCL Hospitals NHS Trust, now at The Walton Centre for Neurology and
Neurosurgery, Liverpool, United Kingdom
Abstract
The dose thresholds for inducing deterministic effects such as erythema and epilation are now within the range of
some interventional radiology procedures. It is important to identify those procedures where such dose levels are
possible so that more detailed dosimetry and dose reduction can be introduced to minimise the risk of such effects.
This paper presents results of work on anthropomorphic phantoms to establish a link between a commonly measured
dose indicator (dose-area product) and skin dose, for equipment and geometries commonly used for cardiac and
neurological interventional radiology procedures. The results indicate that a conversion to skin dose is equipment
specific and furthermore depends on field size and projection. By auditing a sample set of patient data, however, it is
possible to identify potentially high dose procedures.
1. Introduction
The increased use of radiology for the guidance of interventional procedures, and the increase in
complexity of such use, has led to higher patient doses in recent years, with reported cases of
deterministic effects in patients [1,2]. The US Food and Drug Administration (FDA) have issued
guidance for those procedures where there is a likelihood of significant skin doses [3].
Implementation of the Medical Exposures Directive [4] in member states of the European Union
requires us to define standard operating protocols and to apply reference doses to diagnostic
(including interventional) procedures.
This paper presents measurements made on anthropomorphic phantoms which can be used to
link dose area product (DAP) values to skin dose for situations typically encountered in both
interventional neuroradiology and cardiac procedures.
2. Method
For both cardiac and neurological procedures typical exposure conditions were set up by
experienced operators on dedicated radiology equipment. In each case the patient was
represented by an appropriate Temex anatomical phantom comprising a skeleton encased in
rubber. For the chest phantom there were appropriate air cavities to represent the lungs. Skin
doses were measured directly using a Skin Dose Monitor (SDM supplied by McMahon Medical)
placed on the entrance surface at the centre of the field of view. DAP readings were obtained
simultaneously from pre-installed meters (Diamentor, PTW).
Cardiac measurements were performed on an Advantx LC+ (General Electric Medical Systems).
Neurological measurements were performed on an angiographic biplanar system (Toshiba
Medical Systems) and on an Advantx single plane system (General Electric Medical Systems).
Measurements were taken for various geometric configurations and at all field sizes and dose and
fluoroscopy pulse rates in normal clinical use.

IAEA-CN-85-62
298
3. Results
The skin dose measurements from the cardiac system are presented in Table I, and from the
neuro systems in Tables II (single plane) and III (biplane).
Table I. Entrance Surface Dose Rates in Cardiac Fluoroscopy
Projection mGy/min for field size of diameter:
23cm 15cm 11cma
PA 2.4 4.2 18.4
RAO 300 + 25
0 CAU 3.0 3.6 10.0
RAO 100 + 10
0 CAU 2.0 3.4 13.8
Lateral 18.8 23.0 56.0
LAO 450 3.2 4.4 10.8
LAO 450
+ 250 CAU 6.2 9.2 27.2
RAO 300 2.4 3.2 9.4
a All fluoroscopy on the 11cm diameter field is performed using high detail mode,
which was measured in separate tests to be 66% higher than the standard medium
detail fluoroscopy mode.
Table II. Entrance Surface Dose Rates in Neurological Fluoroscopy
Procedures (Single Plane System)
Projection mGy/min for field size of diameter:
30cm 23cm 15cm
Lateral 3.0 6.0 15.4
PA (Townes) - 4.4 11.6
Table III. Entrance Surface Dose Rates in Neurological Fluoroscopy
Procedures (Biplane System)
Projection mGy/min for field size of diameter:
30 23cm 15cm 13cm
PA (Townes) 3.2 6.4 10.8 17.8
OM 4.2 8.6 12.6 19.0
Obliques 2.0 3.6 7.2 13.6
Lateral 5.6 10.0 11.2 19.0
Lateral 110 CRA/CAU - 8.6 9.6 -
In all cases the dose rate is seen to rise as the field size is reduced, and is higher for lateral
projections, particularly of the thorax.
The biplane system used for neuro-angiography has the facility for dose reduction via pulsed
fluoroscopy, with selectable pulse rates of 30, 15, and 7.5 pulses per second. The data presented
in Table III above relates to continuous fluoroscopy. It was confirmed by separate measurements
on a water phantom that the dose varies in direct proportion to pulse rate, with 30 pulses per
second giving an entrance surface dose rate equivalent to that obtained with continuous
fluoroscopy.

IAEA-CN-85-62
299
Simultaneous recording of Dose-Area Product or Dose-Area Product rate, enabled a conversion
factor to be calculated from DAP to skin dose for each of the projections given above. These
conversion factors are given in Tables IV, V and VI for cardiac, neuro (single plane) and neuro
(biplane).
Table IV. DAP to Skin Dose Conversion Factors in Cardiac
Fluoroscopy
Projection mGy per Gycm2 for field size of diameter:
23cm 15cm 11cm
PA 4.67 7.63 10.93
RAO 300 + 25
0 CAU 4.11 6.64 9.33
RAO 100 + 10
0 CAU 4.13 6.37 9.53
Lateral 7.64 12.43 17.39
LAO 450 3.56 5.73 7.86
LAO 450 + 25
0 CAU 3.55 6.08 8.27
RAO 300 3.02 5.00 7.21
Table V. DAP to Skin Dose Conversion Factors in Neurological
Fluoroscopy Procedures (Single Plane System)
Projection mGy per Gycm2 for field size of diameter:
30cm 23cm 15cm
Lateral 5.06 4.48 10.91
PA (Townes) - 3.23 5.15
Table VI. DAP to Skin Dose Conversion Factors in Neurological Fluoroscopy
Procedures (Biplane System)
Projection mGy per Gycm2 for field size of diameter:
30 23cm 15cm 13cm
PA (Townes) 2.47 4.13 7.62 12.29
OM 3.03 5.19 9.09 15.22
Obliques 1.71 3.03 5.60 9.54
Lateral 3.91 5.57 9.33 16.07
Lateral 110 CRA/CAU - 5.33 8.47 -
Similar data was accumulated for angiographic runs with acquisitions at frame rates used
commonly in clinical practice. DAP to skin dose conversion factors were found to be similar to
those established for fluoroscopy with the same geometry.
Measurements confirmed that the conversion factors were independent of fluoroscopy dose rate
and of acquisition frame rate.
4. Conclusions
The results presented above illustrate the variation that can occur in both skin dose rate and in the
relationship between DAP and skin dose between equipment of different types and between
different geometries on the same piece of equipment. In order to derive a reasonable estimate of
skin dose based on DAP readings, it will be necessary to have details of the equipment used and

IAEA-CN-85-62
300
of the proportion of total DAP at a given field size and projection. The ease with which such data
could be recorded for a limited number of cases will depend on the complexity of the
radiological technique. It would clearly be more difficult to achieve for a cardiac procedure than
for neuro-embolisation where there is a more limited number of projections and field sizes used.
Our results indicate that knowledge of dose rates or frame rates or of the fluoroscopy:acquisition
ratio is not as significant. The values presented are for a typical adult sized patient and the
variation with patient size or exposure parameter (kV or mA) has not been included.
These measurements were performed as part of an extended quality assurance programme
focussing on equipment and procedures with the potential to deliver high dose rates to the skin of
patients. In such cases it would be ideal to measure skin dose directly, but this can be expensive,
labour intensive, and inconvenient, particularly for complex cardiac procedures where the
angulation of the X-ray beam, and thus the site of skin exposure, varies considerably. A large
number of hospitals have adopted DAP as the unit for their dose reference levels in fluoroscopic
procedures, making DAP data readily available. By the process of establishing conversion factors
as described in this paper it is possible to identify those procedures which may result in high skin
doses such that efforts at more detailed dosimetry and dose reduction can be targeted effectively.
It is not intended that the derivation of skin dose from DAP values be used as an alternative to
more direct methods of skin dose measurement.
References
[1] HUDA W., PETERS K., Radiation Induced Temporary Epilation After a
Neuroradiologically Guided Embolisation Procedure, Radiology 193 (1994) 642-644.
[2] SHOPE T., Radiation-Induced Skin Injuries from Fluoroscopy, Radiographics 15 (1996)
1195-1199.
[3] Food and Drug Administration. Avoidance of Serious X-Ray-Induced Skin Injuries to
Patients During Fluoroscopically-Guided Procedures, http://www.fda.gov/cdrh/fluor.html
(1994).
[4] Council Directive 97/43/Euratom of 30 June 1997 on health protection of individuals
against the dangers of ionizing radiation in relation to medical exposure, and repealing
Directive 84/466/EURATOM. (OJ L-180 of 09/07/97).

IAEA-CN-85-112
301
PATIENT RADIATION DOSES FROM NEURORADIOLOGY PROCEDURES
M.J.
García-Román1, E.
Prada-Martínez2, J.
Abreu-Luis1, J.
Hernández-Armas1
1 Servio de Física Médica. Hospital, Universitario de Canarias, La Laguna, Tenerife, Spain
2 Servicio de Radiodiagnóstico, Hospital Universitario de Canarias, La Laguna, Tenerife, Spain
Abstract
Following the presentation of radiation-induced deterministic effects by some patients undergone
neuroradiological procedures during successive sesions, like temporary epilation, in the ‘Hospital Universitario
de Canarias’, measurements were made of dose to patients. The maximum dose-area product measured by
ionization chamber during these procedures was 39617 cGy·cm2 in a diagnostic of aneurysm and the maximun
dose to the skin measured by thermoluminescent dosemeters (TLDs) was 462.53 mGy. This can to justify certain
deterministic effects but it is unlikely that the patients will suffer serious effects from this skin dose. Also
measurements were made of effective dose about two usual procedures, embolisation of tumour und embolisation
of aneurysm. These procedures were reproduce with a anthropomorphic phantom Rando and doses were measure
with TLDs. Effective doses obtained were 3.79 mSv and 4.11 mSv, respectivily. The effective dose valued by the
program EFFDOSE was lesser than values measure with TLDs.
1. Introducción Las determinaciones de los niveles de dosis a pacientes en exploraciones de Neuro-radiología, constituyen un factor clave para el subsiguiente establecimiento de medidas de protección radiológica. Se han realizado algunas determinaciones de estas dosis [1-4] y puede concluirse que, en general, se suministran dosis relativamente altas en la cabeza de los pacientes, que pueden, incluso ocasionar efectos determinísticos tales como depilación temporal y eritemas. Los valores publicados de dosis a pacientes no son coincidentes incluso entre exploraciones similares, debido a las profundas diferencias que pueden darse entre los pacientes, a la diversa instrumentación utilizada y al grado variable de preparación y experiencia entre el personal que realiza estos procedimientos. Para establecer los riesgos asociados con la exposición de los pacientes a radiaciones en neuro-radiología se ha recomendado la utilización de la magnitud dosis equivalente [5], aunque también se ha indicado la conveniencia de usar la magnitud dosis efectiva [6], cuya evaluación puede ser problemática [7]. En Europa está muy extendido el uso de la magnitud Producto Dosis Área (PDA) para la caracterización dosimétrica de procedimientos radiológicos. El objetivo de este trabajo es determinar los valores de magnitudes dosimétricas características de 3 tipos de exploraciones neuro-radiológicas realizadas en el Hospital Universitario de Canarias (Tenerife - España) y estimar el nivel de riesgos estocásticos y determinísticos de los pacientes sometidos a las mismas. 2. Material y método Se analizaron 25 casos en procedimientos de neuro-radiología diagnóstica o intervencionista realizados durante el año 2000. Todos los estudios fueron realizados por el mismo neuro-radiólogo utilizando un equipo de angiografía por substracción digital marca Philips modelo Integris 3000, con el generador e intensificador de imágenes propios del equipo y con capacidad para proporcionar campos circulares. El tubo de rayos X y el intensificador de imágenes está dispuesto en un arco tipo C. El haz de rayos X tiene una filtración equivalente a

IAEA-CN-85-112
302
3.5 mm de aluminio. El equipo ajusta automáticamente el potencial y la corriente del tubo, si bien puede conocerse el rango de kV usado, que varió entre 62 y 97. La técnica angiográfica empleada en todos los procedimientos de neuro-radiología realizados en el Hospital Universitario de Canarias, implica la inyección automática de un agente de contraste yodado por arteria femoral. Para la medida del PDA se utilizó, en todos los estudios, una cámara de ionización de transmisión marca PTW modelo Diamentor M2, que permite obtener directamente el valor del PDA en cGy·cm2. La cámara se adosó al diafragma del tubo de rayos X, tras el filtro de aluminio y su sistema de registro se situó en la zona protegida. Los datos correspondientes a cada estudio se recogían mediante un seguimiento permanente del desarrollo del procedimiento que, en algunas ocasiones, podía prolongarse durante varias horas. Se obtuvieron, separadamente, los valores del PDA debidos al uso de rayos X en modo escopia y en modo grafía, así como las distintas proyecciones utilizadas en cada momento. Adicionalmente, en 6 de los pacientes, se colocaron 4 dosímetros termoliminiscentes de LiF (TLD modelo 100 Harshaw Chemical), adosados a la piel del paciente en aquellas zonas donde se consideraba más probable que se alcanzaran los mayores valores de irradiación: huesos fronto-temporoparietales izquierdo y derecho, frontal a la altura de las cejas y sobre la región nasal. Siempre se midieron las dosis registradas por los dosímetros antes de que transcurrieran 24 horas después de su irradiación con un lector Harshaw 4000. Los resultados se muestran en la Tabla II. La irradiación controlada de los dosímetros utilizados, realizada por un laboratorio oficial de calibración, puso de manifiesto que la respuesta de los mismos era lineal en las diversas energías de rayos X utilizadas. Una vez finalizada la recogida de los datos en los pacientes reales, se llevó a cabo una medida de dosis en un maniquí antropomórfico tipo Rando con el que se reprodujeron, en el mismo equipo radiológico y por el mismo neuro-radiólogo, las exploraciones realizadas con los valores medios de los datos medidos sobre los pacientes. El proceso se llevó a cabo para dos de las exploraciones estudiadas, colocando un total de 59 dosímetros termoluminiscentes en el maniquí, situando en su superficie y en ‘órganos’ o ‘tejidos’ interiores de forma que proporcionaran datos que permitieran calcular la dosis efectiva. 3. Resultados y discusión
En la Tabla I se presentan datos de las exploraciones realizadas y los valores de PDA en cada una de ellas. Destaca la gran variación de tiempos de escopia y valores del PDA, incluso tratándose del mismo estudio, debido, básicamente, al distinto grado de complejidad del caso de cada paciente. En la Tabla II se muestran los resultados de las dosis medidas con dosímetros termoluminiscentes. Se observa que los dosímetros colocados en uno de los lados de la cabeza dan valores de dosis superiores debido a que la exploración se realizó con predominio de la irradiación de uno de los lados, según donde estuviera localizada la lesión.

IAEA-CN-85-112
303
Tabla I. Producto dosis área medido en los distintos procedimientos
Tipo de estudio
Campo de radiación
(cm)
FLUOROSCOPIA GRAFÍA PDA Total
cGy·cm2
kV mA Tiempo (s)
PDA cGy.cm2
Nº exposiciones
PDA cGy·cm2
1. D.A. 20 78 – 90 4.3 – 6 112 387 58 2887 3274
2. D.A. 17 74 – 91 4.6 – 6 205 662 132 7490 8152
3. D.A. 20 73 – 97 2.5 – 2.8 4904 20462 317 19155 39617
4. D.A. 17, 20 73 – 96 3.9 – 5.8 2835 8549 131 9956 18508
5. D.A. 17, 20 67 – 77 3.8 – 4.9 162 626 120 7315 7941
6. D.A. 17, 20 67 – 80 3.7 – 5.9 246 1279 138 11214 12493
7. D.A. 17, 20 67 – 84 3.1 – 5.8 264 900 136 7239 8139
1. E.A. 20 62 – 87 2.4 – 5.9 2717 13315 135 8717 22032
2. E.A. 20 67 – 73 3.9 – 5 2640 5588 374 22548 28136
3. E.A. 20 67 – 72 3.8 – 5.6 264 665 176 866 9325
4. E.A. 20 67 – 72 2.4 – 5.6 42 126 60 3259 3385
5. E.A. 20 71 – 83 3.8 – 4.8 1051 2755 180 8411 11166
6. E.A. 17, 20 73 – 76 3.8 – 4.9 143 544 58 3134 3678
7. E.A. 17, 20 71 – 78 3.1 – 5.3 1337 5514 143 8510 14024
8. E.A. 20, 25 67 – 74 2.4 – 4.2 2708 4767 358 8279 13046
9. E.A. 20 70 – 86 3.9 – 4.8 2766 987 268 11637 12624
10. E.A. 20 71 – 77 3.4 – 3.9 153 429 72 4086 4515
11. E.A. 20 75 – 92 4.4 – 5.9 3684 20837 249 15253 36090
12. E.A. 17 67 – 87 4.7 – 6.0 1500 11436 151 12286 23722
13. E.A. 17, 20 66 – 83 2.5 – 5.8 1686 11775 194 14021 25796
1. E.T. 20 73 – 82 3.5 – 5.9 232 828 140 8782 9610
2. E.T. 17, 20 70 – 87 3.2 – 6 247 803 98 5071 5874
3. E.T. 20 71 – 78 4.9 - 5.8 823 3627 177 10401 14028
4. E.T. 20 77 – 91 4.3 – 5.8 1854 5065 209 9601 14666
5. E.T. 17, 20 62 – 81 2.2 – 5.7 996 5664 243 20135 25799
D.A= Diagnóstico de Aneurisma; E.A.= Embolización de Aneurisma; E.T.= Embolización de Tumor.
En la Tabla III se presentan los valores medios de dosis medidos en órganos del maniquí antropomórfico Rando, así como los resultados de las dosis medidas con dosímetros superficiales. Aplicando los factores de ponderación propios de cada tejido u órgano propuestos en las Recomendaciones ICRP 60(8), puede calcularse la dosis efectiva recibida por el fantoma RANDO, (E = �wT HT). Obteniendo las contribuciones Hmédula ósea roja y Hsuperficie ósea mediante simulación con el programa Effdose, se llegó a una dosis efectiva, con los órganos que se había medido, de 3.79 mSv para embolización de tumor y 4.11 mSv para embolización de aneurisma.

IAEA-CN-85-112
304
Tabla II. Dosis en distintos puntos de la cabeza de los pacientes
Paciente Tiempo escopia, s Nº exposiciones Posición Dosis (mGy) 5. D.A. 162 120 Frontal 3.99
Región nasal 3.84
Temporoparietal dcho. 162.50
Temporoparietal izdo. 107.55
6. D.A. 246 152 Frontal 9.02
Región nasal 4.58
Temporoparietal dcho. 63.37
Temporoparietal izdo. 281.14
7. D.A. 264 136 Frontal 3.40
Región nasal 3.05
Temporoparietal dcho. 0.03
Temporoparietal izdo. 90.86
12. E.A. 1500 151 Frontal 8.81
Región nasal 6.31
Temporoparietal dcho. 0.55
Temporoparietal izdo. 16.89
13. E.A. 1686 194 Frontal 13.97
Región nasal 7.65
Temporoparietal dcho. 68.79
Temporoparietal izdo. 15.24
5. E.T. 996 243 Frontal 7.09
Región nasal 0.01
Temporoparietal dcho. 86.49
Temporoparietal izdo. 462.53
Dcho.= derecho, Izdo.=izquierdo
Tabla III. Dosis en piel y órganos en reproducción de procedimientos con fantoma Rando
Órgano/Tejido Nº _TLDs Colocados
Dosis en Procedimiento (mGy)
E.T. E.A. Ovarios 2 0.12 0.10
Testículos 1 0.13 0.05
Colon 8 0.17 0.19
Pulmón 16 0.78 1.26
Estómago 1 0.22 0.35
Vejiga 1 0.09 0.12
Mama 2 0.61 1.85
Hígado 5 0.18 5.16
Esófago 3 1.46 7.02
Tiroides 1 2.24 7.7
Superficie cabeza 13 206.35 36.37
Cristalino 2 11.83 396.61
Glándulas parótidas 2 14.28 13.61
Oído medio 2 202.77 206.12
IAEA-CN-85-112
305
4. Conclusión Comparando con otros datos publicados [2], podemos ver como los valores de PDA con los que se trabaja en el Hospital Universitario de Canarias son del orden que los impartidos en otros lugares. Se pudo ver como cada proyección tiene una contribución diferente al DAP por lo que la dosis recibida por el paciente puede ser reducida minimizando el uso de aquellas proyecciones específicas. Otros factores para la reducción de la dosis pueden ser alternar la entrada del haz de radiación entre caras opuestas, reducir el campo a la región de interés o hacer uso de filtración adicional. Los procedimientos de neuro-radiología pueden causar dosis de radiación relativamente altas en la región craneofacial, pero en los casos estudiados, la máxima dosis en piel (462.53 mGy en el caso 5 E.T.) está muy por debajo de la dosis conocida que causa depilación temporal (3 Gy) o eritema local (6 Gy). Asimismo, para el valor más alto de dosis efectiva, 4.11 mSv, y usando el coeficiente de cáncer mortal publicado por la International Commision on Radiological Protection [5], 5·10-5 mSv-1, con este valor de dosis se provocaría un cáncer mortal por cada 4886 estudios. Este riesgo es bastante menor que el asociado a la enfermedad por la cual el paciente se somete a un procedimiento de neuro-radiología. Los valores de dosis efectiva medidos con la reproducción de los procedimientos con el fantoma supera en la mayoría de los órganos a la obtenida con el programa de simulación Effdose y esto se refleja en la dosis efectiva que para el último de los métodos fue 2.02 mSv (E.T.) y 1.77 mSv (E.A.).
Referencias
[1] Mooney,R.B.; Mc Kinstry, C. S. and Kamel, H. A. M.. Absorbed dose and deterministic
effects to patients from intervencional neuroradiology. The British Journal of Radiology 73 (2000), 745 – 751.
[2] Bergron, P.; Carrier, R.; Roy, D.; Blais, N. and Raymond, J. Radiation doses to patients in neurointerventional procedures. American Journal Neuroradiology 15: 1809 – 1812, Nov 1994.
[3] Gkanatsios, N. A.; Huda, W.; Peters, K. R. and Freeman, J.A. Evaluation on an On-line Patient Exposure Meter in Neuroradiology. Medical Physics. 1997; 203: 837 – 842.
[4] Prada, E.; Abreu, J., Guerra, M. S. and Hernández-Armas, J. Producto Dosis-Área en Pacientes de Neurorradiología. Radioprotección. Septiembre 2000: 328 – 330.
[5] International Comission on Radiological Protection (ICRP). Recomendations of the International on radiological. ICRP Pulication 60. Oxford, England: Permagon Press 1977; 21: (1 – 3): 54.
[6] Huda, W.; Lentle, B.; Sutherland, J. B.; The Effective Doses Equivalent in Radiology. Can Assoc Radiol J 1989; 40: 3 – 4.
[7] Sowby D. Efrfective Dose Equivalent. Can Assoc Radiol J 1989; 40: 332. [8] ICRP, 1991. Recommendations of the International Comission on Radiological
Protection. SERP publication. Madrid 1995.

IAEA-CN-85/68
306
RADIATION DOSES IN INTERVENTIONAL NEURORADIOLOGY
C. Theodorakou1, P. Butler
2, J.A.Horrocks
2
1 Queen Mary and Westfield College, University of London, United Kingdom
2 Bart’s and the London NHS Trust, London, United Kingdom
Abstract
Patient radiation doses during interventional radiology (IR) procedures may reach the thresholds for radiation-
induced skin and eye lens injuries. This study investigates the radiation doses received by patients undergoing
cerebral embolization. Measurements were conducted using thermoluminescent dosimeters. Radiotherapy
verification films were used in order to visualise the radiation field. For each procedure the fluoroscopic and
digital dose-area product, the fluoroscopic time, the total number of acquired images and entrance-skin dose
calculated by the angiographic unit were recorded. In this paper, the skin, eye and thyroid glands doses on a
sample of patients are presented. From a preliminary study of 13 patients having undergone cerebral
embolization, it was deduced that six of them have received a dose above 1 Gy. Detailed dose data from patients
undergoing IR procedures will be collected in the future with the aim of developing a model to allow estimation
of the dose prior to the procedure as well as to look at techniques of dose reduction.
1. Introduction
In 1994 the Food and Drug Administration (FDA) [1] reported a number of severe radiation-
induced skin injuries to patients resulting from interventional radiology (IR) procedures. Since
then numerous reports have been published on patient and staff radiation doses in IR
procedures [2,3,4]. Cerebral embolization (CE) is a neuroradiological procedure and it is
considered to be a high dose IR procedure. It is used for treatment of life-threatening diseases
such as aneurysms and/or arteriovenous malformations (AVMs). Alternative treatments are
surgery and radiosurgery. Embolization results in the occlusion of aneurysms and/or AVMs
from the blood supply. The efficacy of the procedure is monitored by injection of contrast
media in the vessels in conjunction with fluoroscopy and digital subtraction angiography
(DSA). Materials that are used for the occlusion of the vessels are metal coils (platinum) in
the case of aneurysms and chemical agents (superglue) in the case of AVMs. The metal coil is
supplied in a cartridge which allows it to be fed into the catheter and then into position in the
area of interest. Superglue has a liquid form and it solidifies as soon as it comes in contact
with blood and it reaches the area of interest via a catheter. In most of the cases, the AVM
embolization is likely to be repeated in a short period of time and it is followed by
radiosurgery at which the dose to the target volume (AVM) may reach levels as high as 25 Gy.
Thus, the cumulative dose resulting from embolization and radiosurgery may reach high
levels. Many authors have reported doses in CE varying from few hundreds of mGy up to few
Gy [2,3,4]. This study investigates the entrance-skin doses (ESD), the dose-area product
(DAP) and organ doses to thirteen patients undergoing CE and the radiation doses to the
physician performing the CE. Also, the dose distribution over the patient's skin area has been
obtained by means of thermoluminescent dosimeters (TLDs) and it is compared with that
obtained from films placed at the irradiated area. The relationship of the dose with some
technical parameters such as fluoroscopy time, number of acquired images and with the ESD
which is calculated by the unit is investigated.
2. Methods and materials
Measurements were made on a Siemens biplane X-ray system consisting of a lateral (LAT)
and a posterior-anterior (PA) Megalix X-ray tube and a Polydoros IS-Ax2 (Neurostar) pulse
generator. Tube settings are controlled by the automated exposure control (AEC). The X-ray

IAEA-CN-85-68
307
unit is equipped with a DAP-meter which provides the user with the cumulative DAP for each
plane and for each mode (fluoroscopy-DSA) separately. The ESD and the ESD rate are
calculated by the unit at a focus skin distance (FSD) of 55 cm giving an estimation of the ESD
during the procedure in each plane. It also provides the user with useful technical parameters
such as tube voltage, tube current and exposure time, magnification, frames/sec, number of
acquired images for each DSA run. During the fluoroscopy mode the ESD and the ESD rate as
well as the tube voltage, mA, pulses/sec and the DAP are provided. Three different protocols
for DSA mode can be used when CE is performed. The user has the option to change the
settings of the program and the most frequently changed parameters are the frame rate, scene
duration and pulses/sec (fluoroscopy). In the following table (I) the parameters for the three
different protocols are shown.
Table I. DSA protocols
Protocols kVp ms1 Scene(sec)
2 dose
3 Frame rate Pulses/sec
AngioDSA Carotids 73 160 80 4.8 2 7.5
Angio DSA AVM Glue 70 125 20 4.8 3 7.5
Angio DSA Vertebral 70 64 40 4.8 2 7.5 1maximum pulse width in milliseconds 2maximum duration of a scene in seconds 3input dose per frame in �Gy, measured at the following nominal conditions: 70kV, 2.5 mm Copper filter and
17cm Image Internsifier
Lithium fluoride TLDs (TLD-100) were used to measure the ESD for the PA and for the LAT
plane. The TLDs were arranged in a grid form as shown in figure 1 to measure the dose
distribution. The TLDs were placed on two exposed films. One of the two films was placed on
the back side of the patient's head to measure the dose from the PA plane and the second one
on the right side of the patient's head in order to measure the dose from the lateral plane. The
grid was square with dimensions (15x15)cm2 and every three cm for both vertical and
horizontal dimension (bullets in the figure) a TLD was placed, giving 36 TLDs for each plane.
The dose to the eyes and to the thyroid glands of the patient and the doses to the physician’s
eye were measured with TLD-100H which are suitable for measuring low doses due to their
high sensitivity.
Figure 1
For doses above 1 Gy, correction factors have been applied to TLD-100 doses in order to
account for supralinearity.
Kodak X-OMAT V radiotherapy verification film has been used to visualise the radiation
field for two patients and for both planes.
Dose rates have been measured using a tissue equivalent phantom (15x15x15) cm3 for both
fluoroscopy and DSA. Different field sizes, pulses/sec, frames/sec have been used.

IAEA-CN-85/68
308
3. Results and discussion
In figures 2 and 3 the isodose curves obtained from the TLD grids for PA plane and LAT
plane for respectively are superimposed onto the images taken from the films. Figures 2 and 3
correspond to two different patients. Starting from the edges of the grid the first isodose curve
is that of the lowest dose range. The dose scales shown in the figures are in mGy.
From figure 2 it may be seen that an area of (8x7) cm2 receives a dose above 400mGy and
from figure 3 an area of (6x6)cm2 receives a dose above 1750mGy. By not using TLDs
arranged in a grid form the irradiated area cannot be estimated and from those two examples it
may be seen that a large area of the patient’s head has received the highest dose. In both
figures the x-ray tube has been moved throughout the procedure. Due to the movement of the
X-ray tube during the procedure there is a risk of placing the TLDs outside the field size or
outside the area of the highest dose unless a large TLD grid is used. Although the grids are
(15x15) cm2, it may be seen that they are not large enough to cover the whole radiation field
since the isodose curves for the low doses are interrupted.
Figure 2. Patient A Figure 3. Patient B
In table II the results for both PA and LAT plane for the thirteen patients are shown.
It may be seen from the ESDTLD that for the PA plane 4 patients have received a dose above 1
Gy and 2 of these have exceeded the threshold of 2 Gy for transient erythema [5] while for the
LAT plane 6 patients have exceeded 1 Gy and one has exceeded the threshold of 3 Gy for
temporary epilation [5]. Comparing the ESDDAP and the ESDTLD for both PA and LAT plane
it may be seen that the ESD in most of the cases is higher than the ESD TLD. Thus, the ESD
calculated by the x-ray unit tends to overestimate the actual dose since the actual FSD is
always higher than 55cm typically between (70-80) cm and since the tube is moving during
the procedure spreading the dose over the patient’s head.

IAEA-CN-85-68
309
Table II. Patients’ results
Patient Fluoroscopy
Time (min)
Number of
images
DAP
(Gycm2)
ESDDAP
1
(Gy)
ESDTLD
2
(Gy)
PA LAT PA LAT PA LAT PA LAT PA LAT
1 4.9 22.0 73 156 52.7 61.9 0.52 0.69 0.24 0.59
2 4.6 11.0 127 316 49.5 106.7 0.53 2.00 1.20 1.44
3 8.9 2.0 52 28 30.5 6.1 0.64 0.15 0.26 0.09
4 26.3 8.0 123 118 62.1 22.9 1.48 0.61 0.90 0.38
5 1.9 18.0 90 272 72.6 76.7 0.79 2.20 0.40 1.40
6 2.5 22.0 55 725 38.3 365.2 0.27 4.44 2.44 3.2
7 9.9 16.0 229 425 92.9 127.0 2.12 2.86 1.14 1.78
8 3.9 4.0 139 159 55.1 34.6 1.09 0.96 0.63 0.63
9 1.8 31.0 59 227 25.2 129.6 0.23 1.63 0.88 1.21
10 2.0 22.0 54 87 15.1 24.6 0.37 0.63 0.18 0.52
11 6.5 14.3 216 344 52.1 43.2 0.68 0.12 0.40 0.55
12 0.9 17.2 58 137 14.1 14.8 0.21 0.32 0.10 0.18
13 2.9 10.9 767 975 218.6 231.0 5.01 2.63 2.61 1.94 1ESDDAP: the ESD calculated by the x-ray unit at 55cm FSD 2ESDTLD: the maximum TLD dose
In table III the dose for the eyes and thyroid glands of the patient, as well as the doctor’s left
eye dose who performs the CE, are shown. It may be seen that the patient’s right eye and right
thyroid gland receives a higher dose than the left eye does and this is because the lateral x-ray
tube is always on the right side of the patient’s head. The eye doses are high in some patients
but are below the threshold for formation of detectable opacities[6]. The doctor’s eye receives
a low dose and only in three cases the dose reaches the 3/10 of the annual dose limit (i.e
classified worker) if one case per day (250 each year) with such a dose is performed.
Table III. Organ doses
Patient Right eye dose
(mGy)
Left eye dose
(mGy)
Right thyroid
dose (mGy)
Left thyroid
dose (mGy)
Doctor’s eye
dose (mGy)
1 38.1 5.2 50.5 8.0 0.069
2 16.1 13.1 21.3 7.5 0.120
3 3.2 3.3 2.4 2.3 0.038
4 16.1 13.1 21.3 7.5 0.078
5 16.1 13.1 21.3 7.5 0.078
6 71.8 10.9 36.2 9.2 0.471
7 64.1 22.1 11.3 4.9 0.218
8 8.5 5.5 6.8 4.0 0.018
9 13.7 6.6 16.4 2.2 0.218
10 14.1 5.2 5.2 3.1 0.061
11 44.0 30.0 6.7 2.6 0.110
12 12.7 5.1 180.4 7.2 0.018
13 69.2 27.5 36.1 18.4 -
In figure 4 the relationship between the doctor’s eye dose, the total DAP and the LAT DAP is
shown. It may be seen that the doctor’s eye dose is correlated better with the LAT DAP than
with the total DAP since the LAT X-ray tube is always on the left side of the doctor. It may be
seen that as the LAT DAP increases the doctor’s eye dose increases linearly.

IAEA-CN-85/68
310
Figure 4 Figure 5
In figure 5 the contribution of DSA and fluoroscopy mode to the total DAP is shown for PA
plane for patient 13. It may be seen that the main contribution comes from the DSA mode and
not from the fluoroscopy mode. Thus, the use of DSA mode should be limited to the
minimum.
From quality assurance measurements it was deduced that the ESD/sec for fluoroscopy mode
is within a range of (0.029-0.2) mGy/sec which is equivalent to (1.76-11.9) mGy/min for
different technical parameters while for the DSA mode the ESD/sec is in a range of (1.6-6.62)
mGy/sec for the same parameters as in fluoroscopy. The ESD/frame for the DSA mode may
vary from (0.73-2.65) mGy/frame. Comparing the dose rates for fluoroscopy and DSA it may
be seen that the doses from DSA are much higher than that of fluoroscopy. Thus, by limiting
the images obtained during a procedure the ESD may be highly reduced.
4. Conclusions
In this paper a new method to obtain dose distribution over the patient’s skin area for CE
procedures has been introduced. This method gives accurate and reliable results of the ESD by
combining a TLD grid for measuring the ESD and films for visualising the field size. The
results show that a relatively large skin area may receive a dose that can exceed the thresholds
for skin injuries. The patient’s eye and thyroid glands may receive a relatively high dose but it
is below the threshold for causing any radiation-induced injuries. It has been found that there
is a good correlation between the doctor’s eye dose and the DAP from the LAT plane. It also
has been found that the contribution of the DSA mode to the total DAP is much higher than
that from the fluoroscopy mode. Quality assurance results showed that the ESD rate is much
higher for the DSA mode than that for the fluoroscopy mode. Thus, the number of images
obtained during a procedure should be kept to the minimum. Us eof distance and shielding
may also reduce staff doses.
References
[1] FOOD AND DRUG ADMINISTRATION. Public Health Advisory: Avoidance of
Serious X-Ray Induced Skin Injuries to Patients During Fluoroscopically-Guided
Procedures. Rockville, MD, Center for Devices and Radiological Health, FDA (1994)
[2] BERGERON, P., CARRIER, R., BLAIS, N., RAYMOND, J., Radiation doses to
patients in neurointerventional procedures, Am. J Neuroradio. 15 (1994) 1809-12
[3] O’DEA, T.J., GEISE, R., RITENOUR, E.R., The potential for radiation-induced skin
damage in interventional neuroradiological procedures: a review of 522 cases using
automated dosimetry, Med. Phys. 26, (1999) 2027-2033
PA PLANE
FLUOROSCOPY
DSA
R2
= 0.8936
R2
= 0.9385
0
50
100
150
200
250
300
350
400
450
0 0.1 0.2 0.3 0.4 0.5
Dose (mGy)
DAP(G
ycm
2
)
Total DAP
LAT DAP
Linear (TotalDAP)Linear (LATDAP)

IAEA-CN-85-68
311
[4] VANO, E., GONZALEZ, L., FERNADEZ, J.M, GUIBELALDE, E., Patient dose values
in interventional radiology, B.J.R 68 (1995) 1215-1220
[5] ZEITLER E., “Joint WHO/Institute for Radiation Hygiene Workshop on Efficacy and
Radiation Safety in Interventional Radiology”, European Radiation Protection
Education and Training (ERPET Course), Radiation Protection in Interventional
Radiology, Madrid(1997)
[6] INTERNATIONAL COMMISSION ON RADIOLOGICAL PROTECTION , 1990
Recommendations of the International Commission on Radiological Protection, Vol. 21,
No. 1-3, Pergamon Press (1990), 103pp.

IAEA-CN-85-38
312
RADIATION INJURY OF THE SKIN FOLLOWING DIAGNOSTIC AND
INTERVENTIONAL FLUOROSCOPIC PROCEDURES
T.R. Koenig, L.K. Wagner
Department of Radiology, The University of Texas - Houston Medical School,
Houston, Texas, United States of America
F.A. Mettler
Department of Radiology, University of New Mexico School of Medicine,
Albuquerque, New Mexico, United States of America
Abstract
Many radiation injuries to the skin, resulting from diagnostic and interventional fluoroscopic procedures, have
been reported in recent years. In some cases skin damage was severe and debilitating. We analyzed 72 reports of
skin injuries for progression and location of injury, type and number of procedures, and contributing patient and
operator factors. Most cases (46) were related to coronary angiography and percutaneous transluminal coronary
angioplasty (PTCA). A smaller number was documented after cardiac radiofrequency catheter ablation (12),
transjugular intrahepatic portosystemic shunt (TIPS) placement (7), neuroradiological interventions (3) and other
procedures (4). Important factors leading to skin injuries were long exposure times over the same skin area, use
of high dose rates, irradiation through thick tissue masses, hypersensitivity to radiation, and positioning of arms
or breasts into the radiation entrance beam. Physicians were frequently unaware of the high radiation doses
involved and did not recognize the injuries as radiation induced. Based on these findings, recommendations to
reduce dose and improve patient care are provided.
1. Introduction
The number of interventional cardiologic and radiologic procedures performed under
fluoroscopy has grown markedly worldwide during the last decade [1]. Advances in
interventional techniques have made more complex procedures possible. This trend results in
increased fluoroscopy use and is accompanied by a sharp increase in the number of reported
skin injuries. We reviewed over 70 case reports of skin injuries that resulted from fluoroscopic
procedures [See, for example, reference 2]. More than 90% of cases were reported since 1996.
Although the absolute number of injuries may appear very small when compared to the more
than 700,000 interventional procedures performed annually [1], skin damage is likely to be
under-reported. The main reason is widespread unawareness of this radiation effect and
consequent inability of physicians to correctly diagnose it. Radiation damage can be serious.
Chronic ulceration and tissue necrosis were documented in about half of all cases. The
purpose of our review is to describe these injuries and to investigate common factors related
to the patients and their procedures that may have led to the injuries.
2. Skin injuries
Radiation induced skin injury is usually not observed immediately after a procedure, but after
a characteristic latent period in which the patient can be free of symptoms. The latent period is
most often in the range of 2 weeks to 3 months, but varied in the reviewed case material from
a few hours to more than 3 years. Skin injury represents a deterministic radiation effect that
requires a radiation dose above a certain threshold. The following radiation skin effects were
observed and are given in order of their time of onset (threshold doses are given in brackets).
Skin erythema can occur within hours (early transient erythema, 2 Gy) or after 10 days (main
erythema, 6 Gy). When a single fixed beam orientation is employed, lesions are typically
sharply defined and match the entrance port of the radiation beam (Figure 1). Epilation can be
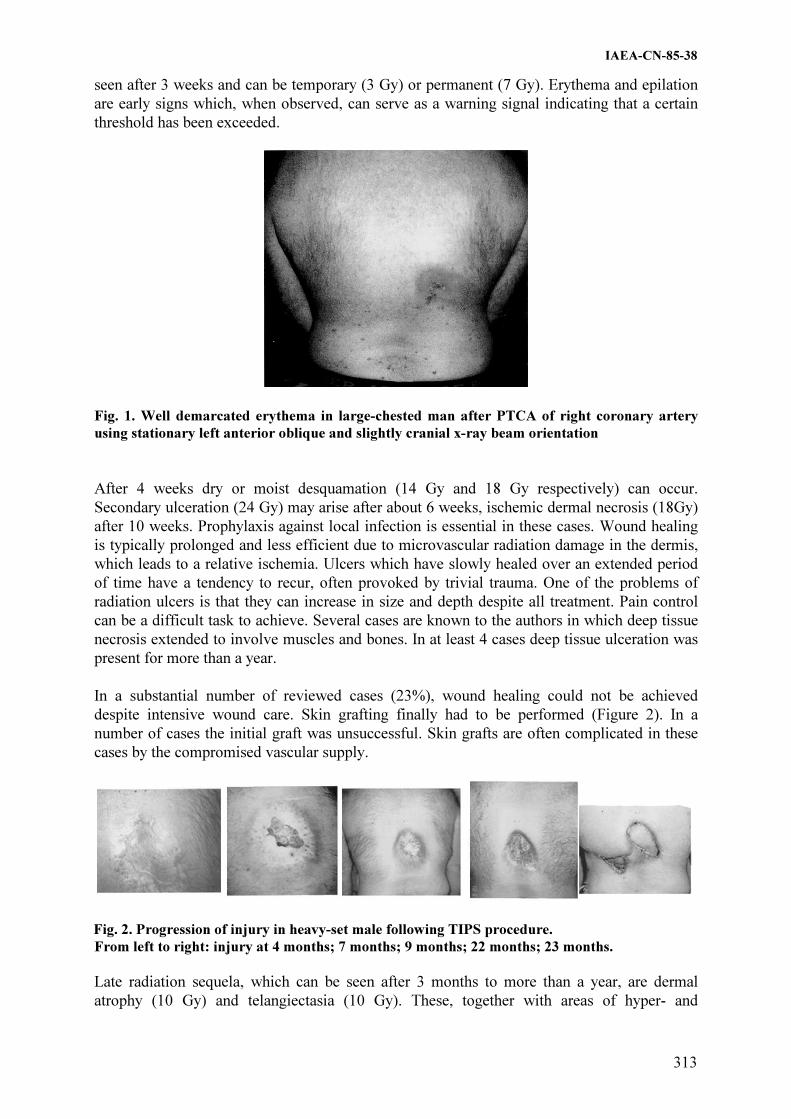
IAEA-CN-85-38
313
seen after 3 weeks and can be temporary (3 Gy) or permanent (7 Gy). Erythema and epilation
are early signs which, when observed, can serve as a warning signal indicating that a certain
threshold has been exceeded.
Fig. 1. Well demarcated erythema in large-chested man after PTCA of right coronary artery
using stationary left anterior oblique and slightly cranial x-ray beam orientation
After 4 weeks dry or moist desquamation (14 Gy and 18 Gy respectively) can occur.
Secondary ulceration (24 Gy) may arise after about 6 weeks, ischemic dermal necrosis (18Gy)
after 10 weeks. Prophylaxis against local infection is essential in these cases. Wound healing
is typically prolonged and less efficient due to microvascular radiation damage in the dermis,
which leads to a relative ischemia. Ulcers which have slowly healed over an extended period
of time have a tendency to recur, often provoked by trivial trauma. One of the problems of
radiation ulcers is that they can increase in size and depth despite all treatment. Pain control
can be a difficult task to achieve. Several cases are known to the authors in which deep tissue
necrosis extended to involve muscles and bones. In at least 4 cases deep tissue ulceration was
present for more than a year.
In a substantial number of reviewed cases (23%), wound healing could not be achieved
despite intensive wound care. Skin grafting finally had to be performed (Figure 2). In a
number of cases the initial graft was unsuccessful. Skin grafts are often complicated in these
cases by the compromised vascular supply.
Fig. 2. Progression of injury in heavy-set male following TIPS procedure.
From left to right: injury at 4 months; 7 months; 9 months; 22 months; 23 months.
Late radiation sequela, which can be seen after 3 months to more than a year, are dermal
atrophy (10 Gy) and telangiectasia (10 Gy). These, together with areas of hyper- and

IAEA-CN-85-38
314
hypopigmentation, give the skin a poikilodermic appearance. Subcutaneous induration results
from a relative increase in the fibrous component of the tissues and can be painful. It may
limit motion of it occurs close to a joint (e.g. at the shoulder in cardiac procedures). We
noticed radiation skin injuries at the breast in two female patients after interventional cardiac
procedures. One patient was only 17 years old. Breast tissue in the adolescent is among the
most sensitive tissues for development of radiation induced malignancies. This will
significantly increase the patient’s statistical risk for breast cancer in the future.
2.1. Which procedures have a potential of skin injury?
Out of 72 reviewed cases of fluoroscopically induced skin injuries, 46 cases (63%) were
related to coronary procedures. The majority of these (43 patients) underwent percutaneous
transluminal coronary angioplasty (PTCA). The high proportion of this procedure in the total
number of reported cases reflects the high number of annually performed cardiologic
interventions that far outweigh other interventional procedures (700,000 coronary procedures
versus 30,000 other procedures). In decreasing order of prevalence, the location of the skin
injury was: right and left scapular or subscapular area, right lateral chest below axilla,
midback, and right anterolateral chest. The site of the injury corresponds to the site of the
entrance beam and reflects the beam orientation predominately used during the procedure.
A smaller number of skin injuries was caused by cardiac catheter radiofrequency ablation (12
patients), transjugular intrahepatic portosystemic shunt (TIPS) placement (7 patients) and
neuroradiological interventions (3 patients). The skin injury involved the back and arm in
patients undergoing ablation and the midback and right subscapular area in patients
undergoing TIPS procedures. Four patients had other interventions in the abdomen or chest.
However, any fluoroscopic intervention has the potential to cause injury if the radiation dose
exceeds the deterministic threshold.
2.2. What factors contribute to the injury?
In many reports, a substantial delay occurred between the initial moment the patient presented
skin with changes to a physician and the moment the physician made the correct diagnosis.
Physicians did not initially associate the injury with radiation from fluoroscopy. Patients were
treated in the interim, without success, for a variety of other suspected causes. Meanwhile,
some patients underwent a second fluoroscopically guided intervention with additional
exposure to the same area. The correct diagnosis was sometimes delayed by several years, in
one case the delay was more than 5 years. The latency period between the last intervention and
the first appearance of the skin lesion probably contributes to the delay in diagnosis, as the
physician is less likely to consider radiation as the etiology.
Several reports originating from radiation therapy literature indicate a correlation between
certain diseases and an exaggerated radiation complication after treatment. These include
connective tissue diseases (scleroderma, lupus erythematosus, mixed connective tissue
disease), diabetes mellitus, hyperthyroidism and the homozygous form of ataxia telangiectasia
[3]. Some chemotherapeutic agents are also known to increase sensitivity to radiation [4, 5]. A
few reports from interventional work now cite these as probable sensitizing factors for some
observed skin reactions.
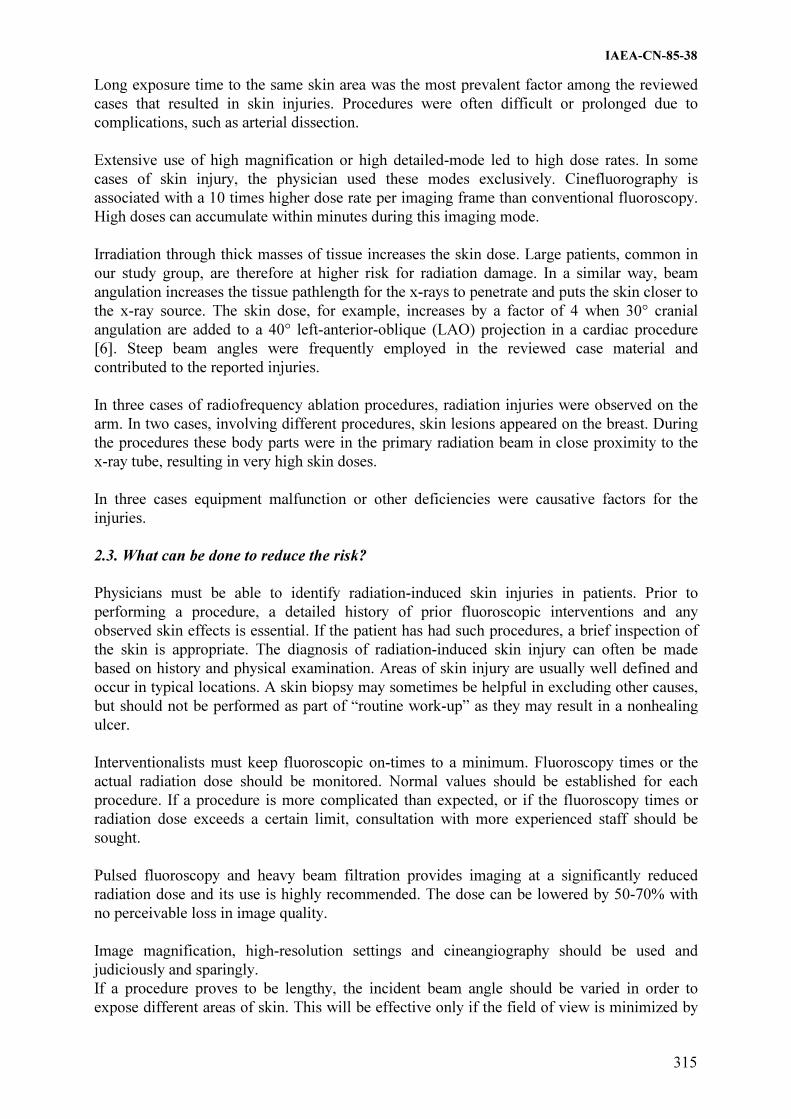
IAEA-CN-85-38
315
Long exposure time to the same skin area was the most prevalent factor among the reviewed
cases that resulted in skin injuries. Procedures were often difficult or prolonged due to
complications, such as arterial dissection.
Extensive use of high magnification or high detailed-mode led to high dose rates. In some
cases of skin injury, the physician used these modes exclusively. Cinefluorography is
associated with a 10 times higher dose rate per imaging frame than conventional fluoroscopy.
High doses can accumulate within minutes during this imaging mode.
Irradiation through thick masses of tissue increases the skin dose. Large patients, common in
our study group, are therefore at higher risk for radiation damage. In a similar way, beam
angulation increases the tissue pathlength for the x-rays to penetrate and puts the skin closer to
the x-ray source. The skin dose, for example, increases by a factor of 4 when 30° cranial
angulation are added to a 40° left-anterior-oblique (LAO) projection in a cardiac procedure
[6]. Steep beam angles were frequently employed in the reviewed case material and
contributed to the reported injuries.
In three cases of radiofrequency ablation procedures, radiation injuries were observed on the
arm. In two cases, involving different procedures, skin lesions appeared on the breast. During
the procedures these body parts were in the primary radiation beam in close proximity to the
x-ray tube, resulting in very high skin doses.
In three cases equipment malfunction or other deficiencies were causative factors for the
injuries.
2.3. What can be done to reduce the risk?
Physicians must be able to identify radiation-induced skin injuries in patients. Prior to
performing a procedure, a detailed history of prior fluoroscopic interventions and any
observed skin effects is essential. If the patient has had such procedures, a brief inspection of
the skin is appropriate. The diagnosis of radiation-induced skin injury can often be made
based on history and physical examination. Areas of skin injury are usually well defined and
occur in typical locations. A skin biopsy may sometimes be helpful in excluding other causes,
but should not be performed as part of “routine work-up” as they may result in a nonhealing
ulcer.
Interventionalists must keep fluoroscopic on-times to a minimum. Fluoroscopy times or the
actual radiation dose should be monitored. Normal values should be established for each
procedure. If a procedure is more complicated than expected, or if the fluoroscopy times or
radiation dose exceeds a certain limit, consultation with more experienced staff should be
sought.
Pulsed fluoroscopy and heavy beam filtration provides imaging at a significantly reduced
radiation dose and its use is highly recommended. The dose can be lowered by 50-70% with
no perceivable loss in image quality.
Image magnification, high-resolution settings and cineangiography should be used and
judiciously and sparingly.
If a procedure proves to be lengthy, the incident beam angle should be varied in order to
expose different areas of skin. This will be effective only if the field of view is minimized by

IAEA-CN-85-38
316
collimation. Otherwise different projections will lead to overlapping radiation fields. General
rules of dose reduction must be followed, e.g. the image intensifier should be kept as close to
the patient as possible, the distance between x-ray tube and patient should be kept large. If
large air gaps between the patient and image intensifier cannot be avoided, the grid should be
removed, if possible, as it only adds to additional radiation without effective function.
Extraneous body parts, such as an arm or a female breast, have to be positioned and secured in
a way that they will not be exposed in the primary x-ray beam.
Real-time dose monitoring enables the physician to recognize high dose levels and is
recommended. The physician can take action to lessen the dose rate early if the dose monitor
indicates high radiation levels. Dose monitors also keep track of doses from fluorography and
eliminate the need to monitor fluoroscopy time. Increased output due to equipment
malfunction can be recognized.
Patients who receive a high skin dose (e.g., in excess of 3 Gy) should be counseled and
advised on examining their skin at the proper location. If any skin changes are observed, the
patient should contact the physician who performed the procedure.
A good quality control program should be established to assure high standards in dose
reduction and image quality.
References
[1] OWINGS, M.F., KOZAK, L.J., Ambulatory and Inpatient Procedures in the United
States, 1996. National Center for Health Statistics. Vital Health Stat 13 (1998).
[2] WAGNER, L.K., "Perspectives on radiation risks to skin and other tissues in
fluoroscopy", Radiation Protection in Medicine: Contemporary Issues (Proc. Thirty-
Fifth Ann. Mtg, Arlington, Virginia, 1999), No. 21, National Council on Radiation
Protection and Measurements, Bethesda, Maryland (1999) 361-375.
[3] WAGNER L.K., MCNESSE M.D., MARX M.V., SIEGEL E.L., Severe skin reactions
from interventional fluoroscopy: case report and review of literature. Radiology 213
(1999) 773-776.
[4] METTLER F.A., UPTON A.C., Medical Effects of Ionizing Radiation. 2nd ed. WB
Saunders, Philadelphia (1995) 214-220 and 311-314.
[5] TROTT K., KUMMERMEHR J., "Radiation effects in skin", SCHERER E.,
STREFFER C., TROTT K. (eds), Radiopathology of Organs and Tissues, Springer-
Verlag, Berlin (1991) 33-66.
[6] CUSMA J.T., BELL M.R., WONDROW M.A., TAUBEL J.P., HOLMES D.R., Real-
time measurement of radiation exposure to patients during diagnostic coronary
angiography and percutaneous interventional procedures, J Am Coll Cardiol 33 (1999)
427-435.

IAEA-CN-85-78
317
IODINE VISIBILITY IN CORONARY ANGIOGRAPHY
USING COPPER FILTRATION
A.T. Rogers, M.E. Holloway Medical Physics Department, Nottingham City Hospital NHS Trust,
Nottingham, United Kingdom
Abstract
With constantly developing technology and emerging clinical applications, the field of interventional radiology is
rapidly expanding. This is bringing enormous benefits to patients in terms of less invasive procedures. However,
interventional radiology often involves prolonged fluoroscopy and cine runs which potentially leads to high staff
and patient doses. One approach to dose reduction and improved iodine contrast visibility is the use of added
copper filtration in conjunction with high heat capacity x-ray tubes which enable the x-ray spectrum to be
matched to the k-edge of iodine whilst reducing dose. This paper presents results characterising the iodine
imaging performance of a modern vascular x-ray imaging system. The results indicate that skin dose savings of
75% are possible with acceptable iodine contrast loss and that, for iodine sensitive patients, reductions of iodine
concentration of about 25% may be achievable.
1. Introduction
With constantly developing technology and emerging clinical applications, the field of
interventional radiology is rapidly expanding. This is bringing enormous benefits to patients
in terms of less invasive procedures. However, interventional radiology often involves
prolonged fluoroscopy and cine runs which potentially leads to high staff and patient doses.
Indicative of this growing awareness of safety and protection needs in interventional radiology
was the interest shown in the recent workshop on efficacy and safety in interventional
radiology [1]. One common approach to patient dose reduction has been the use of additional
beam filtration. This is well documented in the fields of paediatric and fluoroscopic imaging
[2,3]. Recent technical developments in tube technology have allowed higher copper added
filtration to be utilised along with an mA-kVp curve which maintains the beam spectrum at a
kVp advantageous to imaging iodine which is used as a contrast medium in angiography. Last
year, Nottingham City Hospital installed a new cardiac catheterisation laboratory with the
features mentioned above and this paper describes our attempts to characterise its performance
in terms of iodine visibility and dose as the extra filtration is applied.
2. Method
The installation was a Philips Integris H5000F C-arm imaging system with an x-ray tube that
could run continuously at 30mA enabling high levels of copper filtration to be employed. The
x-ray tube has three filter ‘modes’ for fluoroscopy. Mode 1 has no added filtration (HVL ~3.2
mm Al @ 80 kVp), Mode 2 has added filtration of 1.5 mm Al + 0.1 mm Cu (HVL ~5.3 mm
Al @ 80 kVp) and Mode 3 has added filtration of 1.5 mm Al + 0.4 mm Cu (HVL ~ 7.4 mm
Al @ 80 kVp). Entrance skin doses were measured using a calibrated ionisation chamber and
include backscatter.
Images were obtained of three different sized plastic tubes (1.0 mm, 1.5 mm & 2.5 mm
diameter) laid across a 10 cm PMMA phantom. For each Mode of fluoroscopy images were
obtained at four iodine concentrations (370 mg/ml, 320 mg/ml, 200 mg/ml & 100 mg/ml I2)
representing concentrations used clinically (370 mg/ml & 320 mg/ml I2) and less
concentrated contrast media. Fluoroscopic images were captured in the unit’s ‘photofile’ and
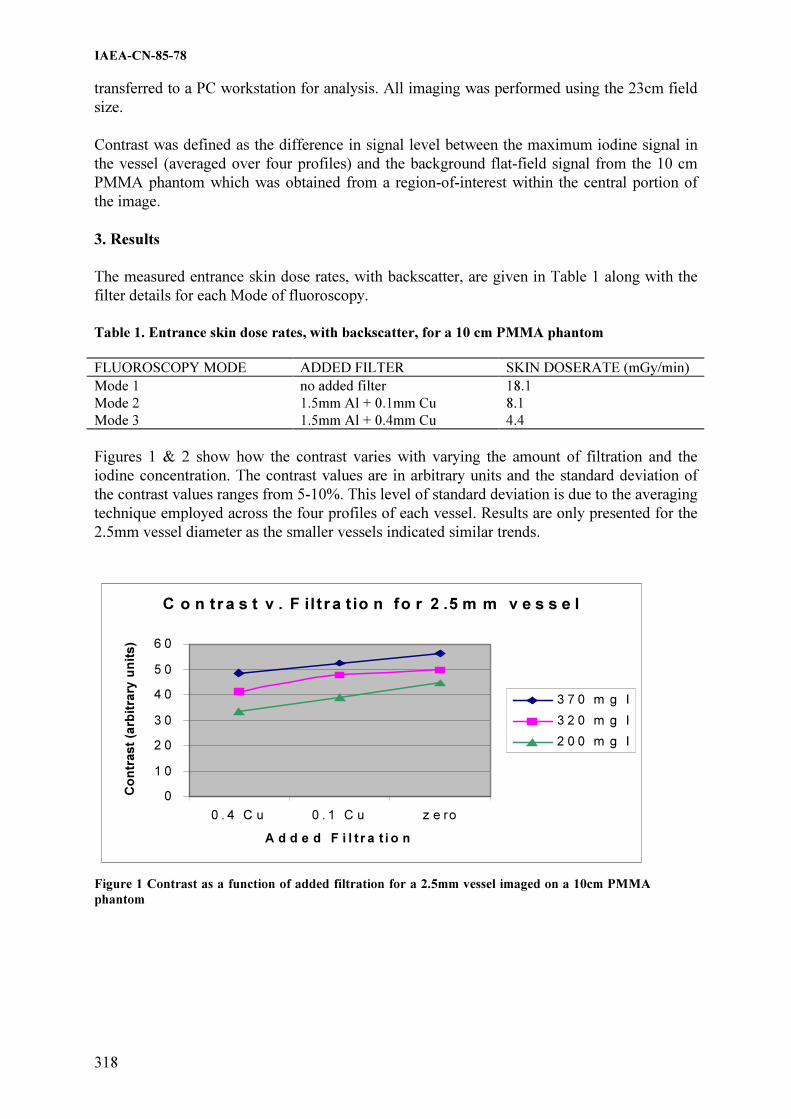
IAEA-CN-85-78
318
transferred to a PC workstation for analysis. All imaging was performed using the 23cm field
size.
Contrast was defined as the difference in signal level between the maximum iodine signal in
the vessel (averaged over four profiles) and the background flat-field signal from the 10 cm
PMMA phantom which was obtained from a region-of-interest within the central portion of
the image.
3. Results
The measured entrance skin dose rates, with backscatter, are given in Table 1 along with the
filter details for each Mode of fluoroscopy.
Table 1. Entrance skin dose rates, with backscatter, for a 10 cm PMMA phantom
FLUOROSCOPY MODE ADDED FILTER SKIN DOSERATE (mGy/min)
Mode 1 no added filter 18.1
Mode 2 1.5mm Al + 0.1mm Cu 8.1
Mode 3 1.5mm Al + 0.4mm Cu 4.4
Figures 1 & 2 show how the contrast varies with varying the amount of filtration and the
iodine concentration. The contrast values are in arbitrary units and the standard deviation of
the contrast values ranges from 5-10%. This level of standard deviation is due to the averaging
technique employed across the four profiles of each vessel. Results are only presented for the
2.5mm vessel diameter as the smaller vessels indicated similar trends.
C o n tr a s t v . F ilt r a t io n fo r 2 .5 m m v e s s e l
0
1 0
2 0
3 0
4 0
5 0
6 0
0 . 4 C u 0 . 1 C u z e ro
A d d e d F i l t r a t i o n
Co
ntr
ast
(arb
itra
ry u
nit
s)
3 7 0 m g I
3 2 0 m g I
2 0 0 m g I
Figure 1 Contrast as a function of added filtration for a 2.5mm vessel imaged on a 10cm PMMA
phantom
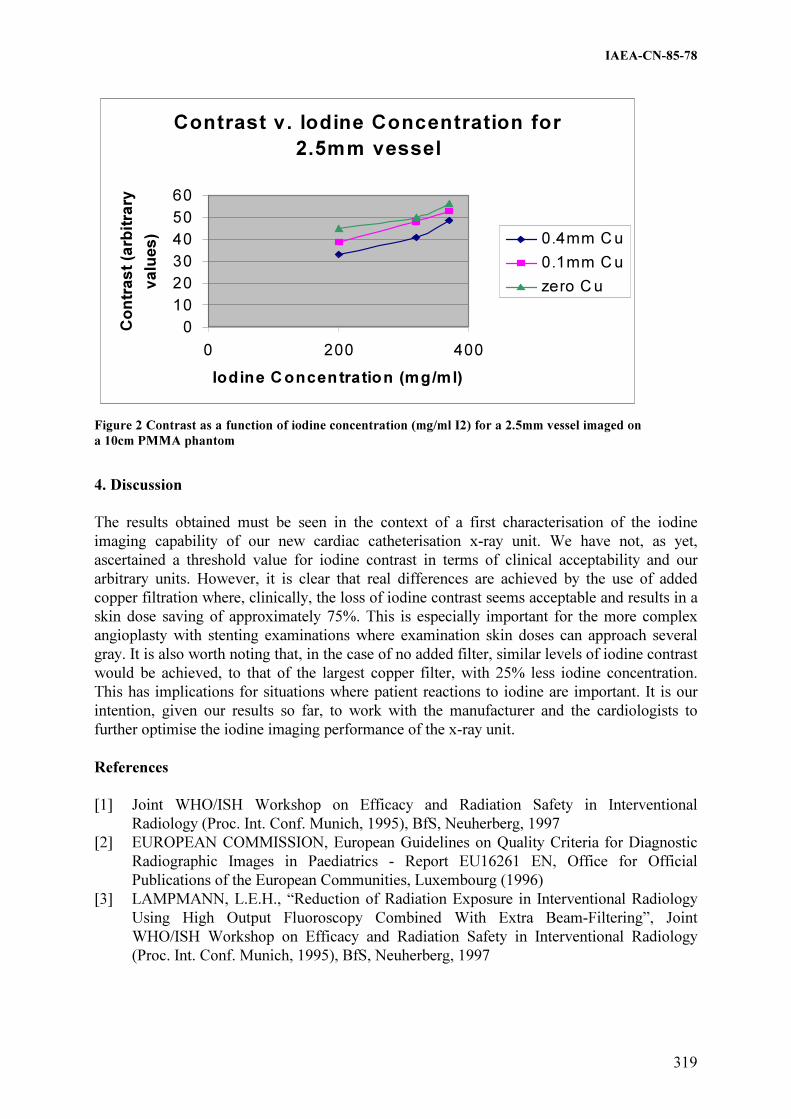
IAEA-CN-85-78
319
4. Discussion
The results obtained must be seen in the context of a first characterisation of the iodine
imaging capability of our new cardiac catheterisation x-ray unit. We have not, as yet,
ascertained a threshold value for iodine contrast in terms of clinical acceptability and our
arbitrary units. However, it is clear that real differences are achieved by the use of added
copper filtration where, clinically, the loss of iodine contrast seems acceptable and results in a
skin dose saving of approximately 75%. This is especially important for the more complex
angioplasty with stenting examinations where examination skin doses can approach several
gray. It is also worth noting that, in the case of no added filter, similar levels of iodine contrast
would be achieved, to that of the largest copper filter, with 25% less iodine concentration.
This has implications for situations where patient reactions to iodine are important. It is our
intention, given our results so far, to work with the manufacturer and the cardiologists to
further optimise the iodine imaging performance of the x-ray unit.
References
[1] Joint WHO/ISH Workshop on Efficacy and Radiation Safety in Interventional
Radiology (Proc. Int. Conf. Munich, 1995), BfS, Neuherberg, 1997
[2] EUROPEAN COMMISSION, European Guidelines on Quality Criteria for Diagnostic
Radiographic Images in Paediatrics - Report EU16261 EN, Office for Official
Publications of the European Communities, Luxembourg (1996)
[3] LAMPMANN, L.E.H., “Reduction of Radiation Exposure in Interventional Radiology
Using High Output Fluoroscopy Combined With Extra Beam-Filtering”, Joint
WHO/ISH Workshop on Efficacy and Radiation Safety in Interventional Radiology
(Proc. Int. Conf. Munich, 1995), BfS, Neuherberg, 1997
Contrast v. Iodine Concentration for
2.5mm vessel
0
10
20
30
40
50
60
0 200 400
Iodine Concentration (mg/ml)
Co
ntr
ast
(arb
itra
ry
valu
es) 0.4mm Cu
0.1mm Cu
zero Cu
Figure 2 Contrast as a function of iodine concentration (mg/ml I2) for a 2.5mm vessel imaged on
a 10cm PMMA phantom

IAEA-CN-85-196
320
THE USE OF CONSTANCY CHECKS TO OPTIMISE PATIENT DOSE IN
INTERVENTIONAL RADIOLOGY SYSTEMS
E. Vaño1,2
, J.M. Fernandez1,2
, L. Lopez3, J. I. Ten
4, L. Gonzalez
2, E. Guibelalde
2
1 Medical Physics Service, San Carlos University Hospital,. Madrid, Spain
2 Radiology Department, Medicine School, Complutense University, Madrid, Spain
3 IAEA Biomedical Engineer visitor, Mexico
4 Diagnostic Radiology Service, San Carlos University Hospital, Madrid, Spain
Abstract
Results of constancy checks using the European DIMOND protocol are reported for 10 digital fluoroscopy
systems. Fluoroscopy dose rates and dose per image at the entrance of the image intensifier and at the entrance of
copper filters are obtained together with image quality using Leeds test objects. Dose values for different
fluoroscopy modes and different image acquisition modes are presented. Values for several image intensifier
formats are also reported. Relations between values obtained with copper filters and polymethyl methacrylate are
obtained for different X-ray systems using different beam qualities, and practical recommendations to use the
results of constancy checks in the managing of patient dose in interventional radiology systems are given.
1. Introduction
The European DIMOND constancy check protocol (DIMOND = Digital Imaging: Measures
for Optimising Radiological Information Content and Dose) has been designed to harmonise
the evaluation of complex fluoroscopy systems used in interventional radiology (IR).
Simplicity in the required experimental approach and the short time necessary to carry out the
test (30-60 minutes) were two objectives in the design of the protocol. The approach requires
a calibrated ionisation chamber, copper filters, and an image quality test object. Dose rate and
dose per image at the entrance surface of the image intensifier (II) and at the entrance surface
of Cu filters are measured. The image quality of the test object is evaluated on the TV monitor
and by numerical methods whenever possible.
During the acceptance tests of the new X-ray systems to be used for IR procedures or when
establishing the baseline level (status test), dose rate and dose per image for all the
fluoroscopy modes, for all the options of image acquisition (in cine mode and in subtraction
mode), and for all the image intensifier formats available, are usually measured.
The dose values at the entrance to the copper filter normalised at a focus distance of 50 cm,
together with the obtained image quality with a test object permit to follow the performance of
the system during the clinical use of the system and to detect any problem in order to suggest
corrective action when necessary. In addition, these results provide useful information for the
medical specialist to optimise clinical procedures, supplying information about the increase in
patient dose when using high dose fluoroscopy modes or low noise imaging modes [1]. The
effect of increasing skin dose during magnification is also evaluated with the DIMOND
constancy check protocol.
One of the practical problems to take advantage of the results of the constancy checks in the
routine clinical work, is to establish the equivalence between a certain thickness of copper
with polymethyl methacrylate (PMMA) which is more similar in attenuation and backscatter
properties to patients. This equivalence depends on the different X-ray beam qualities and it is
usual for IR systems that beam qualities be very different for fluoroscopy modes and imaging
IAEA-CN-85-196
321
acquisition. Concern about the knowledge of skin dose values has been reported [2] and this
basic quality control can help to avoid deterministic effects on patients [3].
2. Material and methods
The constancy check protocol has been applied to the following systems:
�� 2 cardiology labs (Philips Optimus-200 and Philips Integris H-3000 with the "spectra
beam" option).
�� 2 interventional rooms used for cardiology, vascular and neuroradiology procedures (GE
Advantx systems).
�� 2 mobile C arm systems (Philips BV-300 and BV-300+).
�� 1 Toshiba DFP-2000 dedicated to vascular and neuroradiology procedures.
�� 1 multipurpose interventional room (Toshiba KXO-80M).
�� 1 interventional room for vascular procedures (Siemens Polydoros 1000)
�� 1 digital remote control room used provisionally for interventional urology procedures
(Philips Omnidiagnost).
Image quality has been evaluated with the Leeds test object TOR-18FG (positioned at the
entrance of the image intensifier with the copper filters or PMMA plates placed in the beam).
High contrast resolution and low contrast threshold have been evaluated by one or two
observers (always the same people) based on the visual perception on the monitor existing
inside the interventional room (live image for fluoroscopy). Geometrical circular distortion
was also observed with this test object. When storage of the images in CD-ROM or in the
PACS was possible, additional numerical evaluation was made (fig. 1).
Doses were measured with a calibrated ionisation chamber RADCAL (Radcal Corporation,
Monrovia, USA) model 20x6-60E and several copper filters of 1 mm thickness and 20x20 cm
and PMMA plates of 1 cm thickness and 20x20 cm to simulate several patient thicknesses
were used. To measure the dose at the entrance of the copper filters (or at the entrance of the
PMMA plates), the ionisation chamber was positioned over the patient couch, maintaining the
C arm in vertical position with the image intensifier over the couch. The distances during dose
measurements were 70 cm focus-chamber and 100 cm focus-image intensifier. The automatic
brightness control was activated during the measurements. Dose values were normalised at 50
cm from the focus in order to simulate one of the worst geometries (usual focus-patient skin
distance will be somewhat greater). Measurements at the entrance of the image intensifier
were also made during this protocol but these results are not reported in this paper.
3. Results and discussion
Tables 1 and 2 present the dose results measured for different X-ray systems. Some of the
systems use extra copper filtration for low dose modes (e.g. Philips Integris H-3000). This
represents an important change in the X-ray beam quality and this also means a different
equivalence between copper and PMMA. Table 3 presents the results of the entrance dose
values (dose in air with backscatter) for different copper and PMMA thicknesses, measured
for the Philips Integris H-3000.
In general, for cardiology modes, systems select higher kV values in fluoroscopy (70 kV for 2
mm Cu with the Integris system) than in cine (60 kV for 2 mm Cu) to improve contrast. For
the Integris system with additional high filtration (0.4 mm Cu + 1.5 mm Al) the entrance dose

IAEA-CN-85-196
322
rate for 20 cm of PMMA in fluoroscopy (low dose mode) is 20 mGy/min (at 50 cm from the
focus), equivalent to the dose rate measured with approximately 3.5 mm Cu. For cine, 0.3
mGy/frame is required and in this case, 20 cm of PMMA are equivalent to approximately to 2
mm Cu. Thicker patients (or cardiology projections with large angulations equivalent to 26 cm
PMMA) requires an increase of dose rate in fluoroscopy and dose/frame in a factor near 2.
Values of entrance dose rate in fluoroscopy or dose per frame for different PMMA
thicknesses, is a useful measure to be taken during the acceptance test of the systems (figure
2).
Table 1. Entrance dose values for 2 mm Cu, normalised at 50 cm focus chamber distance.
X ray system Image intensifier
format (cm)
Fluoroscopy mode Dose Rate (mGy/min)
Philips Integris H-3000 23 Low 6.7
Medium 18.8
High 61.4
Philips BV300+ 23 Normal 8.2
High 19.6
Philips Optimus 200 23 Normal 26.0
Toshiba DFP2000 24.5 Low 9.7
Medium 11.9
High 16.9
Siemens Polydoros 100 28 Normal 25.3
Toshiba KXO-80m 24.5 Default 22.5
Philips BV300 23 Normal 8.9
High 20.4
Philips Omidiagnost 25 Normal 27.2
GE Advantx I 22 Low 10.2
Medium 21.9
High 46.6
GE Advantx II 22 Low 4.7
Medium 10.0
High 18.4
Table 2. Entrance dose values for 2 mm Cu, normalised at 50 cm focus chamber distance (cine)
Modality Image intensifier
size (cm)
Cine mode Dose/image
(µGy/frame)
Philips Integris 23 Default 280
GE Advantx I 22 A 51
B 84
C 155
D 284
GE Advantx II 22 A 57
B 96
C 138
D 184
Philips Optimus 23 Default 430
Concerning skin dose increase during magnification, it should be stressed that this is also very
dependent of the X-ray system. The Philips Integris system evaluated increases dose rate and
dose/frame by a factor near 1.25 from the II format of 23 cm to 18 cm. The GE systems

IAEA-CN-85-196
323
evaluated increase dose rate and dose/frame by a factor near 1.4 from the II format of 23 cm to
18 cm. The Toshiba DFP-2000 maintain the skin dose at a similar value for 23 and 18 cm.
Another important factor to point out is the increasing in dose rate when changing from
fluoroscopy low to medium and high modes. These factors for the Philips Integris system
evaluated (for 2 mm Cu) are approximately 3, and for the GE systems evaluated are a factor of
2. The different image quality levels of cine imaging for the GE systems requires a dose factor
between 1.3 and 1.8 from one mode to the next (for 2 mm Cu).
Table 3: Entrance dose values (normalised at 50 cm focus chamber distance). Fluoroscopy low
mode includes the extra filtration: 1.5 mm Al + 0.4 mm Cu). Cine mode has any additional
filtration. Philips Integris H3000, 23 cm II format
Attenuation material Thickness Fluoroscopy
Dose rate (mGy/min)
Cine
Dose/image (µGy/fr)
Cu 1 mm 2.6 138
2 mm 6.7 280
4 mm 24.4 537
5 mm 30.9 762
6 mm 38.2 956
PMMA 14 cm 7.3 152
20 cm 19.7 280
26 cm 42.7 559
4. Conclusions
Values of dose rate and dose per image at
the entrance of the patient (simulating
different thicknesses and establishing the
equivalence with Cu filters), together with
image quality, should be determined
during acceptance tests for all the
fluoroscopy and imaging modes and for all
the image intensifier formats in IR
systems. During the DIMOND constancy
checks, the most usual operation modes
should be re-evaluated and the results
could be used to estimate patient skin doses. These values will help the medical specialists to
optimise clinical protocols managing patient dose in a correct way and also avoiding
deterministic risks in prolonged and complicated procedures.
Acknowledgements
This work has been partly supported by the European Commission (DIMOND III contract).
One of the authors (LL) would like to express particular gratitude to the IAEA for the grant
received for her stay in Madrid. Acknowledgements are also given to the Radiology
Department of the San Carlos Hospital and to the Ruber International Hospital and Clinica
Ruber for their kind co-operation in the evaluation of their systems.
0
0,1
0,2
0,3
0,4
0,5
0,6
0,7
0,8
0,9
mGy/fra
me
19 21 23 25 27 29 31 33
PM M A th ickness (cm )
FIGURE 2: Philips Integris System (Cine mode, II: 23 cm, FID 110 cm,
FSD 64,5 cm). San Carlos University Hospital Madrid
IAEA-CN-85-196
324
References
[1] WAGNER LK, ARCHER BR, COHEN AM. Management of patient skin dose in
fluoroscopically guided interventional procedures. JVIR 2000; 11:25-33.
[2] FOOD AND DRUG ADMINISTRATION, Avoidance of serious x-ray induced skin
injuries to patients during fluoroscopically guided procedures, Medical Bulletin 1994;
24(2): 7-17.
[3] VANO E, ARRANZ L, SASTRE JM, MORO C, LEDO A, GARATE MT AND
MINGUEZ I. Dosimetric and Radiation Protection considerations based on same cases
of patient skin injuries in Interventional Cardiology. Br J Radiol 1998; 71:510-516.

IAEA-CN-85-226
325
ORGAN DOSES IN INTERVENTIONAL RADIOLOGY PROCEDURES:
EVALUATION OF SOFTWARE
I. Tort, R. Ruiz-Cruces, M. Pérez-Martínez, F. Carrera, C. Ojeda, A. Díez de los Ríos
Research Group of Radiation Protection, Radiology Department, University of Malaga, Spain
Abstract
Interventional Radiology (IR) procedures require large fluoroscopy times and important number of radiological
images, so the levels of radiation to patient are high, which leads us to calculate the organ doses. The objective of
this work is to estimate and make a comparison of the results given by the different software that we have to do
the calculation of organ doses in complex procedures of IR. To do this, 28 patients have been selected,
distributed in the 3 procedures with highest doses. The determination of organ doses and effective doses has been
made using the projections utilized and different software, based on MonteCarlo Methods: Eff-dose, PCXMC
and Diasoft. We have obtained dispersion in the average organ dose between the 3 programs very high. In many
cases, it is higher than 25% and in some particular cases, is greater than 100%. Dispersion obtained in effective
doses is not so high, being under 20% in all cases. This shows that a better solution is needed to solve the
problem of the organ doses calculation, being necessary a more accurate method that brings us to a trustworthy
approach to reality, and, by the moment, we do not dispose of it.
1. Introduction and objective
Procedures in Interventional Radiology (IR) require long time of fluoroscopy and an important
number of radiological images, being very high the level of radiation doses given to patient.
This leads us to determine the dose received in organs, because in some cases can be very
high. Although the probability of the stochastic effects to appear always exists, deterministic
effects only exist if certain threshold doses are surpassed, that are different for each organ. In
the IR procedures, it is interesting to estimate if the doses given are higher than the limits we
have for deterministic effects. The objective of this paper is to estimate the organ doses and to
analyze the results given by different software available to carry out the calculation of organ
doses in complex procedures in IR.
2. Material and methods
To do this study, 28 patients have been selected, distributed in the 3 procedures considered to
have the higher risk that are:
1. Abdominal aortic aneurysm endoprothesis treatment (AAA)
2. Transjugular intrahepatic portosystemic shunts (TIPS)
3. Mesenteric arteriography with venous return (AMRT).
Measures have been obtained using a transmission ionization chamber Diamentor M2 (PTW-
Freiburg) placed at the exit of the X-ray tube of the IR equipment (Siemens Digitron 3), which
has allowed us to obtain the Dose-Area product (DAP) of the irradiated field.
Following data have been collected:
- Total DAP (in fluoroscopy and radiography)
- Characteristics of patient (age, sex, weight, and height)
- Projections utilized, as well as the anode angle
- Radiological technique (kV and mAs)
- Total time of radioscopy
- Total number of images obtained

IAEA-CN-85-226
326
The posterior determination of organ doses and effective dose has been done knowing in each
case the projections applied, and using different software based on Monte Carlo Methods: Eff-
dose, PCXMC and Diasoft.
Eff-Dose asks for data on kV, total filtration of the beam, DAP, and projections utilized. In
this work, the closer simple projection and similar to the irradiated field in each procedure has
been selected, following the methodology described by Ruiz-Cruces et al. [1-3]
PCXMC asks for more information to carry out the dosimetric estimation, requesting the
DAP, projections, kV, anode angle, total filtration of beam, age of the patient, source-patient
distance, size of the irradiated field by means of coordinates (X, Y, Z), number of energy
levels and number of photons in each level (maximum 50000). Moreover, it allows us to
adjust the field with rotation degrees, which is an advantage from the previous program. [4]
Diasoft asks for the same parameters than Eff-Dose: kV, total filtration of the beam, DAP,
projections utilized, as well as the source-patient distance. [5] This program has the possibility
of being executed directly connected to the transmission ionization chamber of PTW Freiburg.
3. Results
Table I shows the organs with doses that have a relative error higher than 25% for each
procedure, with its dose value, calculated as the dose obtained with the different programs as
well as the average that results. For the AAA and AMRT there are only 2 and 4 organs in each
case with this characteristic, meanwhile for the number increases until 19. It is important also
that there are 5 organs in this last procedure that have a relative error that surpass 100%. This
error appears as a consequence of the disparity of results between those ones given by
PCXMC and the other two of them. The values given by Eff-Dose and DiaSoft are almost
equal for all the procedures.
Table II shows the effective doses obtained with the three programs, the average value and its
standard deviation, expressed also as a relative error. The values given by Eff-Dose and
DiaSoft are almost totally equal for all the procedures, but on the other hand, the calculation
made by PCXMC is very different from the other ones. The standard deviation between the
results of the three programs varies from 6 to 8, and the relative error from 15 to 17%.
Table III shows the standard deviation end the average relative error of the organ doses in
each procedure. It stands out the relative error of 56% in the case of TIPS, meanwhile in the
other two procedures the relative errors are 16 and 14% in each case. The results given by
PCXMC are very different in some particular cases, making that the average relative error to
be as high as showed.

IAEA-CN-85-226
327
Table I. Organ doses with relative error higher than 25% for each procedure
Procedure Organ Dose
Eff-
Dose*
Dose
DiaSoft *
Dose
PCXMC*
Dose
Average*
Relative
Error (%)
AAA Adrenals 106,90 106,90 209,26 141,02 42
Lung 7,21 7,21 12,09 8,84 32
Adrenals 389,36 389,40 142,52 307,09 46
Breast 3,36 3,36 1,43 2,72 41
Bladder 129,84 129,80 42,92 100,85 50
Stomach 107,39 107,40 33,31 87,70 52
U L I 83,37 83,37 46,12 70,95 30
L L I 14,37 14,37 57,52 28,75 87
Heart 18,87 18,87 7,08 14,94 46
Kidney 606,02 606,00 237,74 483,25 44
Liver 159,83 159,80 53,53 124,39 49
TIPS Lung 21,63 21,63 7,83 17,03 47
Ovaries 12,48 12,48 68,07 31,01 103
Pancreas 175,21 175,20 53,61 134,67 52
Spleen 356,39 356,40 117,83 276,87 50
Testes 0,20 0,19 10,09 3,49 164
Thymus 2,39 2,39 0,54 1,77 60
Thyroid 0,27 0,27 0,00 0,18 140
Urinary
bladder
2,55 2,55 35,28 13,64 107
Uterus 9,67 9,67 56,45 25,26 107
Esophagus 25,17 25,17 3,81 18,05 68
Adrenals 59,49 59,49 128,45 82,48 48
AMRT Breast 0,64 0,64 1,29 0,86 44
Heart 3,59 3,59 6,38 4,52 36
Lung 249,78 249,80 214,28 4,68 44
*Given in mGy
Table II. Dispersion obtained in effective dose for each procedure
Effective Dose (mSv)
Procedure Eff-
Dose
DiaSoft PCXMC Average Standard
Deviation
Relative
Error (%)
AAA 75,68 75,68 57,48 69,6 10 15
TIPS 51,18 51,18 37,81 46,7 8 17
AMRT 40,30 40,29 29,91 36,8 6 16
Table III. Standard deviation and average relative error of the entire organ doses in each
procedure
Procedure Standard deviation* Relative error (%)*
AAA 14 16
TIPS 37 56
AMRT 6 14
*Average for all the organs

IAEA-CN-85-226
328
4. Discussion and recommendations
To have three different programs to carry out the same calculations should imply first a way to
arise a more accurate result. However, as it can be seen in this work, this is not in this way.
The results given by the three programs are very different, so in general, the dispersion error is
very high.
First, we have Eff-Dose y DiaSoft that provide values that are practically equal, which implies
that two of them can be utilized indiscriminately.
On the other hand, PCXMC, which results are very different from the other two programs, has
the advantage of be able to adjust better the angle of the field for each projection.
All we have said shows that a better solution is needed to solve the problem of the calculation
of organ doses, being necessary a more accurate method to be closer to reality, and by the
moment, we do not have this method.
As a recommendation, we propose as lesser solution to calculate an average using the three
programs, obtaining an estimated value with its relative error.
References
[1] RUIZ-CRUCES R.; PEREZ MARTINEZ, M.; MARTIN PALANCA, A; FLORES, A.;
CRISTOFOL, J.; MARTINEZ MORILLO, M.; DIEZ DE LOS RIOS,A., Patient dose in
radiologically guided vascular procedures: Conventional versus digital systems,
Radiology 205(1997): 385-394
[2] RUIZ-CRUCES R.; GARCIA GRANADOS J.; DIAZ ROMERO, F.J.; HERNANDEZ
ARMAS, J., Estimation of effective dose in some digital angiographic and
interventional procedures, British Journal of Radiology, 71(1998),42-47.
[3] NBH, National Institute of Radiation Hygiene; Eff-Dose software: Estimation of
effective and organ doses. Bronshoj, Denmark (1995) Version 1.02.
[4] TAPIOVARA, M.; LAKKISTO,M.; SERVOMAA, A., PCXMC: A PC-based Monte
Carlo program for calculating patient doses in medical X-ray examinations, Helsinki
(1997) 1-55.
[5] DiaSoft Version 5.0. Users’ manual. PTW, Freiburg (2000).

IAEA-CN-85-253
329
OCCUPATIONAL HAND DOSES IN INTERVENTIONAL RADIOLOGY
V. Spasic Jokic1, B. Djurovic
2, S. Lukac
3
1Federal Bureau of Measures and Precious Metals, Belgrade, Yugoslavia
2Military Medical Academy, Belgrade, Yugoslavia
3Military Medical Academy, Belgrade, Yugoslavia
Abstract
In this paper we present a case of radiologist performing interventional procedures. Radiologist works for
number of interventional procedures, but we reported only percutaneous nephrostomy and percutaneous biliary
drainage which represent about 30 % of his occupational exposure. Radiologist is occupationally exposed for
eighteen years and from 1995 has radiation injuries. From 1999. art. hypertension, cataract complicata incip.ou.,
onychodystrophia and hyperceratosis mani bill. The most important are hands skin injuries. In ordinary
dosimetric control low doses, less than 10 mGy per year, were recorded, so personal dosimetry results and
biological results are not in accordance. For that reason we performed additional measurements during many
procedures and in this paper we present results for two chosen procedures. Radiation exposure of radiologist
hands during 200 percutaneous nephrostomy and 63 percutaneous biliary drainage per year are reported.
Exposures were measured with thermoluminescent dosemeters (TLD) type CaF2:Mn. Hands doses of equivalent
of 221 �Sv in average per drainage and 31 �Sv in average per nephrostomy were recorded.
1. Introduction
Different radiologists at the same procedures show variation in their personal doses, specially
the hand and finger dose in interventional radiology. Factors influencing the doses are: factors
related to patients (age, sex, weight, etc.), factors related to eqipement and factors related to
radiologists (technique, screening time, number of procedures, type of procedures, etc.).
Medical staff radiation exposure is under physical and biomedical monitoring due to
radiologist protection. Sometimes, for different reasons, results of these two monitoring
techniques are not in accordance.
In this paper we present a case of radiologist performing interventional procedures, as
percoutaneus nephrostomy (unilateral, bilateral, change of a nephrostomy catheter), biliary
drainage, percutaneous apscess/pseudocyst drainage and placement of an ureteric stent.
Percutaneous nephrostomy and percutaneous biliary drainage represent about 30 % of his
occupational exposure.
This radiologist is occupationally exposed in interventional radiology for 18 years. According
to medical documentation in his family there were no hereditary important diseases. He was
healthy and had no visible (or clinical) signs of radiation leasions until 1993. Medical
examination from 1993 showed regular biochemical and hematological parameters, exept
lower white blood cells (but still in the range of expected values). The same year physician
registered dry skin of the hands. From 1995 the radiologist was not answering the calls for
medical examinations until 1999. when we found: art. hypertension, cataract complicata incip.
ou., onychodystrophia and hyperceratosis mani bill. The most important were skin changes
which can be considered as precancerogenes lesions. We tried to re-evaluate this radiologist’s
occupationally exposure because these changes can be considered as late effects of cumulative
occupational doses.
Cytogenetics tests results didn’t show unstable chromosomal aberrations as parameter of
recent irradiation. Micronucleus test showed significantly high rate - 46/1000. In vitro radio

IAEA-CN-85-253
330
sensitivity was normal (micronucleus rate was 198/1000). All these results can be considered
as late effects of ionising radiation exposure.
Previous whole body exposure mesurements were performed by TLD type CaF2:Mn worn
under the lead apron. Under these circumstances, personal monitor located under the apron on
the trunk of the individual indicates the dose equivalent to the shielded trunk of the body. Our
measurements included nine dosemeters at unshielded and shielded parts of the body.
2. Materials and methods
All measurements were performed by calibrated TLD type CaF2:Mn.
Calibration of the intensities of the radiation fields is traceable to the Federal Bureau of
Measures and Precious Metals (further: FBMPM). The ionization chambers and electrometer
used for field calibration are owned by national metrological institution FBMPM and are
traceable to primary Yugoslav standards as well as to international standards. The intensity of
the field is assessed in terms of air kerma with the field collimated to minimize unwanted
scatter. Conversion coefficients from air-kerma to the dose equivalent vary as a function of
photon energy, angle of incidence and size and shape of backscatter medium. Personal
monitors are irradiated to a known value of dose equivalent while mounted on 30 x 30 x 15
cm slab ( polymethylmethacrylate) PMMA phantom. An anterior to posterior radiation
condition is simulated. Multiple personal monitors are irradiated to obtain informations on
accuracy and precision. As there are limitations when we use radiation qualities as
metrological standards which often differ from the radiation qualities that personal monitors
encounter in the working circumstances which often cannot be fully characterized we used
users beam for the calibration purposes. We also simulated working conditions from the stand
point of distances from the beam focus as well as appropriate holders and all elements which
can be found in roentgen room. All dosimeters were put in tissue equivalent folies when we
irradiated them in free-air with well known air kerma.
We put personal monitors at seven places where we expected higher doses ( right and left eye,
thyroide, neck , right shoulder, left and right hand) as well as on two places where ordinary
low doses (chest and gonades) were expected. In estimation of effective dose we looked up
them as single personal dosimeter at one specific place. We also used direct reading electronic
device type PDM -102 Aloka placed on chest under the lead apron.
Medical examinations were performed according to recent regulatory papers for occupational
exposure.
All measurements were performed on SHIMADZU X-ray apparatus type IDR-1000, model F-
2 with 1mm Al equivalent and maximum tube voltage of 150 kV. In this work X-ray scatter
radiation was produced at various X-ray tube potentials in the range of 85 to 90 kVp with X-
ray tube in the overtable position. Medical staff were in proximity of patient undergoing a
procedure.
In the two chosen procedures duration of the procedure nephrostomy was 15 min in average
and drainage 20 min in average.
We used NCRP Rep.122 as well as ICRP Rep.47 for estimating HE in practice using personal
monitors. �1,2�

IAEA-CN-85-253
331
3. Results
Mean dose in conventional TL dosimetry was 10.52 mGy per year with dosemeter worn under
the protective apron.
Electronic device recorded about 9 �Sv per procedure also worn under the apron.
Results of individual hand doses are given in table I.
Table I. Radiologists individual hand dose measurements results
procedure biliary drainage nephrostomy
mean hand dose per procedure [�Sv] 221 31
number of procedures per year 63 200
screening time [min] 20 15
total hand dose per year [mSv] 13.9 6.2
Our measurements results are comparable with other authors results who reported similar
cases.�3,4,5�
Estimated cumulative hand dose for eighteen years occupational exposure, based on
measurements of these two procedures taking into account that they represent 30 % of total
exposure, is about 3.3 Gy. This dose can be reduced by improving tehnique and reducing the
number of procedures per radiologist.
4. Conclusion
In interventional radiology total doses at the unprotected parts of the body, especially hands,
can exceed the dose limits recommended by ICRP. Our results showed that hand doses for
mentioned two procedures did not exceeded recommended dose limits but taking into account
cumulative dose effects can cause radiation skin injuries and substantiate the need for both,
medical and physical, monitoring in aim to keep doses as low as possible.
References
[1] NCRP Report No.122: Use of personal monitors to estimate effective dose equivalent
and effective dose to workers for external exposure to low-LET radiation, NCRP,
Bethesda (1995).
[2] ICRU Rep. No.47 Measurement of Dose Equivalents from External Photon and
Electron Radiations, ICRU, Bethesda (1992).
[3] Ramsdale, W.J. Walker, P.W. Horton: Extremity doses during interventional radiology,
Clin.Radiol.41(1) (1990) 34-36.
[4] E.Vano,L. Gonzales, E.Guibelalde,J.M.Fernandez,J.I.Ten: Radiation exposure to
medical staff in interventional and cardic radiology, Br.J.Radiol. 71(849) (1998) 954-
960.
[5] T.Vehmas: What factors influence radiologist, finger doses during percutaneous
drainages under fluoroscopic guidance, Health Phys. 65(2) (1993)161-163.

IAEA-CN-85-129
332
DOSES TO PATIENTS AND STAFF FROM ENDOVASCULAR TREATMENT OF
ABDOMINAL AORTIC ANEURYSMS – PRELIMINARY RESULTS
E. G. Bjørklund1, A. Widmark
1, T. Gjølberg
2, D. Bay
2, J. J. Jørgensen
3 , L. E. Staxrud
3
1 Norwegian Radiation Protection Authority, Oslo, Norway
2 Department of Radiology , Aker Hospital, University of Oslo, Norway
3 Oslo Vascular Centre,.Aker Hospital, Universitz of Oslo, Norway
Abstract
Patient radiation doses received during endovascular treatment of abdominal aortic aneurysms (AAA) can be
significant and give rise to both deterministic and stochastic effects. Recording of dose-area product (DAP),
fluoroscopy time and number of exposures together with calculations of effective dose were performed for 8
patients. In addition, the entrance surface dose was measured for 3 of the patients. Typically, DAPs of 340
Gycm2, fluoroscopy times of 30 minutes and 310 exposures were obtained together with maximum entrance
surface doses of 1,8 Gy and effective doses of 50 mSv. Finger doses to the staff performing the procedure were in
the order of a few hundred �Sv. Conversion factors (effective dose/DAP) and (maximum entrance surface
does/DAP) of 0,61�10-2 Gy/Gycm2 and 0,15 mSv/Gycm2, were obtained respectively.
1. Introduction
Endovascular treatment of abdominal aortic aneurysms (AAA) has been carried out since the
early 90ies, but is still experimentally. The aim is to increase the survival rate and improve the
quality of life for the patients. The procedure reduces the surgical stress and there is minimal
need for intensive care. The patient is early mobilised and is discharged from hospital the third
day postoperatively. About 30-50% of the patients fulfil the physiological and anatomical
criteria necessary to be considered as candidates for this new, minimally invasive treatment
modality.
This endovascular procedure may give rise to significant patient doses, due to potentially long
fluoroscopy times, frequently use of different magnification modes together with a large
number of exposures, and are therefore associated with both deterministic and stochastic risks.
High skin doses may result in deterministic effects such as erythema, epilation, desquamation,
tissue necrosis or ulceration [1, 2]. Such radiation induced skin injuries have already been
reported in the literature following percutaneous transluminal coronary angioplasty (PTCA)
[2-4]. The severity of these effects can be quantified by the entrance surface dose (ESD),
which can be estimated using, for example, thermoluminescent dosimeters (TLDs) [5]. The
stochastic risks of carcinogenesis and genetic effects are quantified by the effective dose (ED),
which may be obtained by Monte Carlo simulations on phantoms [6].
The vascular surgeons and interventional radiologists performing the procedure may receive
large occupational doses, for instance to their hands, since they are working close to the
patient not only during fluoroscopy but also during the exposures.
Because of potential high patient doses associated with endovascular treatment of AAA, dose
monitoring is of great importance. The most common way of dose monitoring is the dose-area
product (DAP). In this procedure, DAP may be difficult to relate to the maximum entrance
surface dose (MESD) and in some extent also to ED, because the irradiated skin area is
varying during the procedure. Relationships between the easily measured DAP to both MESD
and ED would therefore be of great help in estimating the risks of both deterministic and
stochastic effects associated with this treatment.

IAEA-CN-85-129
333
In the present study, doses to the patients and staff associated with endovascular treatment of
AAA were examined as well as conversion factors between DAP to both MESD and ED were
carried out.
2. Material and methods
Eight patients (seven men, one woman) having a mean age of 66 years (range 56-79) were
treated for AAA (mean 55 mm, range 51-60 mm) with bifurcated stent-grafts (AneuRx,
Medtronics, Inc, USA). In some of the cases, stent-graft extensions were used to seal a distal
leakage or to secure the limbs near the origin of the internal iliac artery. All patients were
included and evaluated according to the Eurostar Protocol1.
All the stent-graft procedures were performed in a newly designed vascular and endovascular
operating theatre having a special designed operating table (Koordinat O.R.) [7]. Beyond that,
the theatre was fitted with all the facilities found in an ordinary angio-lab. The X-ray
equipment used in this study was a Siemens Multistar Plus equipped with a ceiling mounted
C-arm with a four-field (14/20/28/40 cm) image intensifier (Sirecon 40-4 HDR). The X-ray
generator used was a Polydoros IS-A.
DAP was measured with a transmission ionisation chamber (DAP meter) (Diamentor, PTW,
Freiburg, Germany) permanently attached to the collimator. For each patient the total DAP
was separated into contributions from fluoroscopy and exposure. At present time, no
information is available of the calibration procedure or the uncertainty in the DAP
measurements.
TLDs (LiF:Mg,Ti, Harshaw TLD-100 chips) were used to measure ESD. The TLDs were
calibrated free in air using the radiation quality ISO N-60 traceable to the measuring institute
in Utrecht, the Netherlands2 [8]. Background radiation was corrected for by means of 4 non-
irradiated TLD controls. Overall uncertainty associated with TLD readings were estimated to
be within � 10%. Patient skin doses were obtained by placing 14 TLDs in the median plane at
the patients back. The TLDs were placed with 2 cm spacing and centered at the level of crista.
Finger doses to the staff performing the procedure were obtained by placing a sterilised TLD
ring dosimeter on the middle phalanx of the middle finger bilaterally under the surgical
gloves. All TLDs were read within one day after irradiation.
Rough estimates of the effective dose to the patients were obtained from the total DAP using
the NRPB-R186 software [9]. This program uses an average adult patient of 70 kg mass and
174 cm height for its calculations. The abdominal PA projection with field size of 35 x 47 cm2
were chosen for the effective dose calculations. The use of this projection will introduce an
error to the estimated effective dose, since the field size usually used are smaller and the
irradiated area of the skin varies during the procedure. The overall error is estimated to be
within �25%.
1 Data registry center for stent-grafting in Europe. European Society for Vascular Surgery. 2 TLD ring dosimeters used for measuring finger doses were calibrated free in air on a rod PMMA phantom, 1,9
cm in diameter.

IAEA-CN-85-129
334
3. Results
The endovascular procedure was completed for all patients and the second limb was attached
without any problems. There was no 30-days mortality and no serious complications were
observed. The use of one extension in patient 2, 5 and 8 and two extensions in the case of
patient 1 and 7, matches the variations observed in DAPs, fluoroscopy times and number of
exposures taken (Figure 1). Even though the fluoroscopy times were relatively long, typically
30 minutes, the exposures contributed mainly to the total DAP. A mean total DAP of 340
Gycm2 and an average number of 310 exposures were obtained for these eight patients.
0
50
100
150
200
250
300
350
400
1 2 3 4 5 6 7 8
Procedure no.
Do
se
-are
al p
rod
uct [G
ycm
2]
0
10
20
30
40
50
60
70
Flu
oro
sco
py tim
e [m
in]
DAP Fluoroscpoy
DAP exposure
Fluoroscopy time
45
7 e
xp
.
28
3 e
xp
.
21
0 e
xp
.
20
9 e
xp
.
35
0 e
xp
.
16
8 e
xp
.
40
7 e
xp
.
37
4 e
xp
.
Figure 1. The contributions from fluoroscopy and exposure to the total DAP together
with the fluoroscopy time and the number of exposures taken during endovascular
treatment of AAA. At the present time, total uncertainty in
DAP measurements are unknown
Skin dose distributions measured along the patients’ back in the median plane are shown in
Figure 2. Maximum skin doses in the range 1,3-2,3 Gy were obtained, matching the threshold
dose for transient erythema for one of the patients. Maximum skin dose was generally
localised somewhere between 6 cm cranialt and 10 cm caudalt from crista.
ED and MESD together with DAP to ED conversion factor (ED/DAP) and DAP to MESD
conversion factor (MESD/DAP) for the procedure are given in Table I. Relatively high
effective doses around 50 mSv were obtained. A mean ED/DAP conversion factor of 0,15
mSv/Gycm2 and a mean MESD/DAP conversion factor of 0,61�10
-2 Gy/Gycm
2 were obtained
for this procedure.
The finger doses to the surgeon and radiologists performing the endovascular procedure are
shown in figure 3. The received finger doses, given a normal workload, were below the
occupational dose limits of 500 mSv/year proposed by the ICRP [10], indicating a good
working practice.

IAEA-CN-85-129
335
Entrance surface dose [Gy]
0
1
2
3
14 12 10 8 6 4 2 -2 -4 -6 -8 -10-12-14
Distance from crista [cm]
Patient 3
0
50
100
150
200
250
300
350
Sur Rad 1 Rad 2 Rad 3 Sur Rad 1 Rad 2 Rad 3 Sur Rad 1 Rad 2 Rad 3
Patient no. 1 Patient no. 2 Patient no. 3
Fin
ge
r d
os
es
Hp
(0,0
7)
(µG
y)
Right hand
Left hand
Figure 2. Skin dose distributions along the
median plane of the patients back. Distances
given in positive numbers and negative
numbers are in the cranial and caudal
direction from crista, respectively. The mean
weight of the 3 patients was 83 kg, varying
between 78-92 kg. Total uncertainty in the
TLD readings was estimated to be within ����
10%
Figure 3. Finger doses received by the staff
performing the endovascular treatment of
AAA. Sur = surgeon, Rad = radiologist.
Total uncertainty in the TLD readings is
estimated to be within ���� 10%
Table I. Mean values of total DAP, maximum entrance surface dose (MESD) and effective dose
(ED) together with DAP to maximum entrance surface dose conversion factor (MESD/DAP)
and DAP to effective dose conversion factor (ED/DAP) for the endovascular treatment
procedure of AAA. Range is given in brackets
DAP MESD ED MESD/DAP ED/DAP
[Gycm2] [Gy] [mSv] [Gy/Gycm
2] [mSv/Gycm
2]
338 � 32%
(167-439)
1,79 � 26%
(1,35-2,27)
50 � 34%
(22-64)
0,61�10-2
� 33%
(0,48-0,85)�10-2
0,15 � 7%
(0,13-0,17)
4. Discussion
Patients undergoing endovascular treatment of AAA are normally elderly and have as well,
often, severe pulmonal and cardiovascular diseases. Total survival rate of these patients vary
from 63-74%, depending on different publications [11]. Although the effective dose to the
patient from this procedure is relatively high, 50 mSv, life expectancy and age distribution of
the patients, indicate that deterministic skin injuries rather than stochastic risk of developing
cancer are the effect to be considered. The main purpose with this study was therefore to
establish a maximum advisable DAP to prevent skin damage such as transient erythema and
temporary epilation, having threshold values of 2 Gy and 3 Gy, respectively. In obtaining a
MESD/DAP conversion factor, TLDs were used to map the dose distribution along the
patients back (Figure 2). To avoid missing the maximum skin dose it is of great importance to
use many TLDs, especially in this procedure where magnification is used in combination with
a moving primary beam irradiating different skin areas. Such use may result in an overlapping
of exposed skin areas, which again can give high doses to small separated skin areas. By using

IAEA-CN-85-129
336
the MESD/DAP conversion factor of 0,61�10-2
Gy/Gycm2 (Table I), maximum advisable
DAPs to avoid transient erythema and temporary epilation of 330 Gycm2 and 490 Gycm
2 were
obtained, respectively. By having a DAP meter available during the procedure, the operator
can prevent skin injuries by not letting the total DAP exceed the limits for skin injuries. If
additional exposure is required to finish the procedure, the operator may avoid the appearance
of skin damage by changing the projection in such a way that the irradiation is spread over
different skin areas. Of the eight patients studied in this work, five of them exceeded the DAP
limit for transient erythema. Unfortunately, no follow-ups of these patients were performed to
determine if transient erythema really did occur. No complications were associated with these
eight procedures, but potentially much higher skin doses are believed to occur if
complications had appeared. Therefore, the monitored DAP should always be registered in the
patients case records and used in evaluating the need of individual patient follow-ups with
respect to skin injuries.
Patients selected for endovascular treatment of AAA will receive additional doses from
preoperative evaluations and frequently postoperative follow-up controls. CT-scan and
angiography are performed preoperatively. At the ambulatory evaluation, CT-scan and plain
X-ray of the stent-graft are performed 1, 3, 6 and 12 months postoperatively and each six
months thereafter. In addition, 12 months postoperatively one angiography is performed. The
total accumulated skin dose related to endovascular treatment of AAA, although not given as
a single exposure, may have the potential for increasing the risk of developing skin injuries.
The Norwegian Radiation Protection Authority has, in collaboration with Aker Hospital,
University of Oslo, initiated a work where the total accumulated doses to the patiens
undergoing this treatment are collected. The work will also include a close follow-up study of
patients received doses above 3 Gy, with respect to induced skin injuries.
No dose measurements from endovascular treatment of AAA could be found in the literature,
for comparison. It is believed that the variation in DAP values and skin doses are significant
from hospital to hospital, since the results are depending on the practice of the persons whom
performing the procedure and also of the weight of the treated patients. At this time, only
limited data exists and more data should be collected before reference values and conclusions
are drawn.
References
[1] WAGNER, L.K., EIFEL, P.J., GEISE, R.A., Potential biological effects following high
X-ray dose interventional procedures, J. Vasc. Interv. Radiol. 5 1 (1994) 71-84.
[2] WAGNER, L.K., “Typical Doses and Biological Implications”, Radiological Society of
North America, RSNA 1998, Categorical Course in Diagnostic Radiology Physics:
Cardiac Chaterization Imaging, Oak Brook, IL (1998) 249-254.
[3] SHOPE, T.B., Radiation-induced skin injuries from fluoroscopy, Radiogr. 16 5 (1996)
1195-1199.
[4] SØVIK, E., KLØW, N.E., HELLESNES, J., LYKKE, J., Radiation-induced skin injury
after percutaneous transluminal coronary angioplasty, Acta Radiol. 36 (1996) 1-3.
[5] National Protocol for Patient Dose Measurements in Diagnostic Radiology, Prepared by
Dosimetry Working Party of Institute of Physical Sciences in Medicine, Chilton, Didcot,
National Radiological Protection Board, NRPB (1992).
[6] JONES, D.G., WALL, B.F., Organ Doses from Medical X-ray Examinations Calculated
by Using Monte Carlo Techniques, NRPB-R186, National Radiological Protection
Board/HMSO, Chilton, Didcot/London (1985).

IAEA-CN-85-129
337
[7] WAGNER, H. J., THEIS, H., ZITZMANN, R., Endovascular Therapy Unit:
Angiography and Intervention Systems under OR conditions, Electromedia 67 (1999) 9-
14.
[8] X and Gamma Reference Radiation for Calibrating Dosimeters and Doserate Meters and
for Determining their Response as a Function of Photon Energy – Part 1: Radiation
Characteristics and Production Methods, ISO 4037-1: 1996(E), International
Organization for Standardization, ISO, Geneva (1996).
[9] HART, D., JONES, D.G., WALL, B.F., Normalised Organ Doses for Medical X-ray
Examinations Calculated using Monte Carlo Techniques, Software, NRPB-SR262,
National Radiological Protection Board, NRPB (1994).
[10] Recommendations of the International Commission on Radiological Protection. ICRP
Publication 60, Pergamon Press, Oxford (1991).
[11] HOLLAND, A. J. A., BELL, R., IBACH, E. G., PARSONS, R. W., VU, H. T., HOUSE,
A. K., Prognostic factors in elective aortic reconstructive surgery, Aust. N. Z.J. Surg. 68
1 (1998) 16-20.

IAEA-CN-85-147
338
OPTIMISATION OF PATIENT AND STAFF EXPOSURE IN INTERVENTIONAL
CARDIOLOGY
R. Padovani1, M.R. Malisan
1, G. Bernardi
1, E. Vaño
2, V. Neofotistou
3
1 Ospedale Santa Maria della Misericordia, Udine, Italy
2 Medical Physics. San Carlos Hospital and Complutense University, Madrid, Spain
3 Medical Physics Department. Athens General Hospital, Athens. Greece
Abstract
The Council Directive of the European Community 97/43/Euratom (MED) deals with the health protection of
individuals against dangers of ionising radiation in relation to medical exposure, and also focuses attention at
some special practices (Art. 9), including interventional radiology, a technique involving high doses to the
patient. The paper presents the European approach to optimisation of exposure in interventional cardiology. The
DIMOND research consortium (DIMOND: Digital Imaging: Measures for Optimising Radiological Information
Content and Dose) is working to develop quality criteria for cineangiographic images, to develop procedures for
the classification of complexity of therapeutic and diagnostic procedures and to derive reference levels, related
also to procedure complexity. DIMOND project includes also aspects of equipment characteristics and
performance and content of training in radiation protection of personnel working in interventional radiology
field.
1. Introduction
The number and complexity of diagnostic and interventional procedures (IR) done in the
medical practice have grown enormously, in particular in the last ten years, due to the
availability of more suitable materials necessary to the procedures, and to the availability of
the modern diagnostic units, either using X-rays or US, MR. However, the vast majority of
these procedures are performed in a radiological room under fluoroscopy, simply because the
vascular are the leading indications. Today, interventional radiology reduces the need for
many traditional interventions, particularly surgery, therefore reducing the overall discomfort
and risks for the patient compared to the traditional methods.
Due to the potential of high patient [1,2]
and staff [3-8] doses and to the observed
deterministic injures, after long fluoroscopic interventional procedures, the Council Directive
97/43/Euratom of 30 June 1997 includes this practice in the art. 9 of the ‘Special practices’.
The paper presents the European approach to optimisation of exposure in interventional
cardiology and some of the results obtained by the DIMOND research consortium (DIMOND
= Digital Imaging: Measures for Optimising Radiological Information Content and Dose).
DIMOND group is working on the development of quality criteria for angiographic images.
Also procedures for the classification of complexity of therapeutic and diagnostic procedures
are studied together with the proposal of reference levels, also related to procedure
complexity. DIMOND project includes also aspects of equipment characteristics and
performance, staff and patient dosimetry and content of training (9)
in radiation protection for
personnel working in interventional radiology.
2. Methods and results
2.1. Image quality criteria
An important aspect of optimisation strategy is the definition of methods for image quality
assessment. The approach of EC guidelines on ‘quality criteria for radiographic images’ was

IAEA-CN-85-147
339
assumed as a model for the implementation of similar methodology for IR images. DIMOND
has developed a preliminary set of quality criteria for coronary angiography images (table I)
[10]. The quality is assessed as a visibility level of important anatomical and, also,
pathological markers. Two pilot trials have been conducted on a set of 15 studies, obtained in
4 centres in Greece, Italy and Spain. Each study has been analysed by 6 independent
cardiologists adopting a scoring system for the quantitative assessment of image quality. The
preliminary experience indicates that criteria can be translated into a scoring system that
yields reproducible data in most instances.
1 Table I. Example of quality criteria for left coronary angiography images based
on the visibility of anatomical markers
LEFT CORONARY ANGIOGRAPHY
Image criteria
2 Performed at full inspiration if necessary to avoid diaphragm superimposition or to change anatomic
relationship (in apnoea in any case).
3 Arms should be raised clear of the angiographic field and the spine should appear as less as
possible.
4 Visually sharp reproduction of vessel walls.
5 Simultaneous and full opacification of the vessel lumen at least until the first critical lesion (70% by
visual estimation).
6 Panning should be limited. If necessary, pan in steps rather than continuously, or make subsequent
cine runs to record remote structures.
7 Visually sharp reproduction of the origin, proximal, mid and distal portion of the Left Anterior
Descending and Circumflex arteries, in at least two orthogonal views.
8 Visually sharp reproduction of the side branches > 1 mm of the Left Anterior Descending and
Circumflex arteries in at least two orthogonal views; the origin should be seen in at least one
projection.
9 Visually sharp reproduction of the lesions in vessels > 1 in at least two orthogonal views.
10 Visualisation of collateral circulation when present.
When criteria 6-9 have been fulfilled, avoid extra projections (mainly LAO semiaxial).
2. 2. Patient exposure: reference level and complexity index
Reference level (RL) is a powerful instrument for optimisation in diagnostic medical
exposures and DIMOND is trying to introduce it for interventional cardiology. But, taking
into account that in IR the patient pathology drives the procedure complexity, RL has to take
into account some of the complexity factors affecting the procedure.
From a sample of Coronary angiography (CA) and Percutaneous Transluminal Coronary
Angiograplasty procedures (PTCA) collected in 4 centres of three European Countries,
preliminary reference levels (RL) expressed in term of mean values of DAP, fluoroscopy time
and number of frames have been derived (table II). Differences between centres are evident
and the evaluation of procedures complexity is necessary in order to explain such differences.
A index of pathology severity allows to derive RL as a function of pathology, helping a better
evaluation of the optimisation level of the practice in an installation. As an example, in Udine
hospital, a partner of DIMOND consortium, the correlation of severity of cardiovascular
pathology with technical parameters adopted for the PTCA procedures was evaluated [11].

IAEA-CN-85-147
340
Table II. Mean fluoroscopy time, number of frames and dose-are product (DAP) measured in
some European centre
Interventional cardiology
nd centre
Fluoroscopy time
(min)
N°. of frames DAP
(Gycm2)
CAD
- Greece I
- Greece II
- Italy
- Spain
4.1 � 3.6
3.6
9.1
4.1
6.7
1093 � 446
1596
1715
748
918
45 � 28
54.6
124.2
38.0
48.6
PTCA
- Greece I
- Greece II
- Italy
- Spain
13.8 � 8.5
11.1
16.0
15.1
19.8
1135 � 545
1414
1702
908
995
73 � 28
54.6
124.2
73.3
64.3
The relationship between clinical and technical factors (CF) vs. fluoroscopy time and dose
area product (DAP) was examined for 402 random PTCA procedures. Good correlation was
found with: number and type of lesions treated, use of double wire or double balloon
technique, ostial stenting and bifurcation stenting techniques, simple stenting , occlusion of
vessel for more than 3 months, the presence of moderate vessel tortuosity (one bend > 90°),
severe tortuosity (two or more bends > 90°) and IVUS (intravenous ultrasonography) use.
Based on the relative weight observed in the multivariate analysis a complexity index (CI)
was derived. For a practical application the procedures were divided in three groups according
with different grades of complexity taking into account only: vessel occlusion � 3 months,
ostial and bifurcation stenting, and severe tortuosity (two or more bends > 90°) factors. Fig 1
shows the mean fluoroscopy time and DAP of the 3 groups of PTCA defined: simple,
moderate and complex procedure. Further studies in different centres can demonstrate the
applicability of this approach with the purpose to derive reference levels, complexity
dependent, for IC and others frequent IR procedures.
0
500
1000
1500
2000
2500
Simple Moderate Complex
Flu
oro
sco
py t
ime (
s)
0
50
100
150
200
250
Simple Moderate Complex
DA
P (
Gycm
2)
Figure 1. Mean fluoroscopy time and DAP for simple, moderate
and complex PTCA procedures
2. 3. Staff exposure
In interventional radiology performed with fluoroscopic systems, where body exposure is not
uniform and where part of the body is protected by lead apron or other specific mobile
screens, the evaluation of effective dose is difficult and affected by high uncertainties [6].
Published dose data have been analysed and converted in effective dose adopting the
dosimetric model proposed by Niklason [6]. The protocol is applicable when two dosimeters

IAEA-CN-85-147
341
are worn over the apron at the neck level and under the apron at the waist level or when a
single dosimeter is worn over the apron at the neck level. Table III reports the effective dose
to cardiologist (first operator) and nurse or technician per procedure. When available, dose
from diagnostic (CA) and therapeutic (PTCA) procedures are reported. For cardiologist, the
effective dose per procedure varies from 0.2 to 18.8, with a mean value of 4.7 �Sv. Only Vañó
and Steffenino report an effective dose of 18.8 and 15.1 �Sv/procedure respectively. In these
last two cases, it seems that the presence of cardiologists in training are the main cause of
higher doses.
Table III. Effective dose to cardiologist (or first operator) and nurse/technician
evaluated in different cardiac centre
Reference Effective Dose
(�Sv/procedure)
Cardiologist Nurse
Vañó et al., 1998, [8] 18.8
Padovani et al., 1998, [12] 2.2 (CA) - 8.8 (PTCA) 1.5 (CA) - 3.0 (PTCA)
Folkerts et al., 1997, [3] 2.0
Li et al., 1995, [4] 8.0 2.0
Watson et al., 1997, [13] 1.8 1.4
Zorzetto et al., 1997, [2] 3.7
Steffenino et al., 1996, [7] 15.1 3.7
DIMOND, Spain, 1999 2.2 (CA) - 4.4 (PTCA) 0.6 (CA) - 1.1 (PTCA)
DIMOND, Italy, 1999 0.5 (CA) - 1.0 (PTCA) 0.3 (CA) - 0.6 (PTCA)
DIMOND, Greece, 1999 1.0 (CA) - 2.0 (PTCA) 0.6 (CA) - 1.1 (PTCA)
Conclusions
The DIMOND approach to interventional cardiology will be refined in the context of
DIMOND III (2000-2003) project and aims to develop a methodology with a set of
instruments for the evaluation of the optimisation level in an installation including: quality
criteria for images and reference levels as a function of procedure complexity.
From the reported staff dose data the following comments and suggestions can be derived:
(a) many variables affect staff exposure: distance, direction, use of protective screens,
procedure, skill, training, equipment performance, etc
(b) the analysis of personal dosimetry data is difficult when: the dosimeters are not worn
all the time by operators or the dosimeters are worn in different or wrong positions
(c) the normalisation of the personal dose to workload, expressed in terms of number of
procedures or dose-area product, allows a straightforward comparison between
facilities and helps to identify those clinicians who are not taking effective radiation
safety precautions. In interventional radiology, Dose constraints (ICRP 60 and EC
Directive 96/29, art. 7) can be conveniently expressed them in terms of effective dose
per procedure or effective dose per unit of dose-area product.
References
[1] Fulkner, K., Love, H.G., Sweeney, B.A. and Bardsley, R.A. Radiation doses and
somatic risk to patients during cardiac radiological procedures. Br. J. Radiol. 59(700)
359-363 (1986).

IAEA-CN-85-147
342
[2] Zorzetto, M., Bernardi, G., Morocutti, G. and Fontanelli, A. Radiation exposure to
patients and operators during diagnostic catheterization and coronary angioplasty.
Cathet. Cardiovasc. Diagn. 40(4) 348-351 (1997)
[3] Folkerts, K.H., Munz, A. and Jung, S. Estimation of radiation exposure and radiation
risk for employees of a heart catheterization laboratory. Z. Kardiol. 86(4) 258-263
(1997).
[4] Li, L.B., Kai, M., Takano, K., Ikeda, S., Matsuura, M. and Kusama, T. Occupational
exposure in pediatric cardiac catheterization. Health Phys. 69(2) 261-264 (1995).
[5] Marshall, N.W. and Faulkner, K. The dependence of the scattered radiation dose to
personnel on technique factors in diagnostic radiology. Br. J. Radiol. 65(769) 44-49
(1992).
[6] Niklason, L.T., Marx, M.V. and Chan, H.P. The estimation of occupational effective
dose in diagnostic radiology with two dosimeters. Health Phys. 67(4) 611-615 (1994).
[7] Steffenino, G., Rossetti, V., Ribichini, F., Dellavalle, A., Garbarino, M., Cerati, R.,
Norbiato, A. and Uslenghi, E. Short communication: Staff dose reduction during
coronary angiography using low framing speed. Br. J. Radiol. 69(825) 860-864 (1996).
[8] Vaño, E., Gonzalez, L., Guibelalde, E., Fernandez, J.M. and Ten, J.I. Radiation
exposure to medical staff in interventional and cardiac radiology. Br. J. Radiol. 71(849)
954-960 (1998).
[9] Vano’ E., Gonzalez L, Malone JF, Faulkner K, Padovani R, Specific Training
Objectives in Radiation Protection for Medical Staff in Interventional Radiology
Installations, draft 3.1, Radiation Protection in Interventional Radiology, EC-CIEMAT-
ERPET Course, Madrid, May 1997.
[10] Padovani, R., Novario, R. and Bernardi, G. Optimisation in coronary angiography and
percutaneous transluminal coronary angioplasty. Radiat. Protec. Dosim. 80(1-3) 303-
306 (1998).
[11] Bernardi G, Padovani R, et al. Clinical and Technical Determinats of the Complexity of
Percutaneous Transluminal Coronary Angiograplasty Procedures, Cath. And Cardiov.
Interventions, 51:1-9 (2000).
[12] R. Padovani, C. Rodella, Staff Dosimetry in Interventional Radiology, Rad. Protec. Dos.
(in press).
[13] Watson, L.E., Riggs, M.W. and Bourland, P.D. Radiation exposure during cardiology
fellowship training. Health Phys. 73(4) 690-693 (1997).

IAEA-CN-85-51
343
OCCUPATIONAL EXPOSURES FROM SELECTED INTERVENTIONAL
RADIOLOGICAL PROCEDURES
J. Janeczek, A. Beal, D. James
Tawam Hospital, Al Ain, United Arab Emirates
Abstract
The number of radiology and cardiology interventional procedures has significantly increased in recent years due
to better diagnostic equipment resulting in an increase in radiation dose to the staff and patients. The assessment
of staff doses was performed for cardiac catheterization and for three other non-cardiac procedures. The scattered
radiation distribution resulting from the cardiac catheterization procedure was measured prior to the staff dose
measurements. Staff dose measurements included those of the left shoulder, eye, thyroid and hand doses of the
cardiologist. In non-cardiac procedures doses to the hands of the radiologist were measured for nephrostomy,
fistulogram and percutaneous transluminal angioplasty procedures. Doses to the radiologist or cardiologist were
found to be relatively high if correct protection was not observed.
1. Introduction
Providing proper radiation protection to the staff in interventional radiological procedures can
pose a real problem. The radiologist and other staff members are usually working close to the
area under examination and receive the dose primarily from scattered radiation from the
patient. The use of ceiling mounted protection screens is often limited because of their
inconvenience. Due to the different nature and complexity of interventional procedures, they
were divided between cardiac and non-cardiac groups and were treated separately in this
study. The recommendations of Goldstone following the review of occupational exposures in
interventional radiology [1] have been taken into account in this study.
2. Cardiac procedures
The equipment used in Tawam Hospital is a Philips digital BV-5000 bi-plane unit. During
cardiac catheterization procedures both x-ray tubes situated on C-arms work either
simultaneously or separately. The cardiologist is positioned close to both x-ray tubes and the
area under investigation as shown in Figure 1. It is apparent that the left hand side of the
cardiologist performing the procedure is particularly at risk.
C AC N
Figure 1. Positions of cardiologist (C), assistant cardiologist (AC) and nurse (N) during cardiac
catheterization procedure
3. Non-cardiac procedures
All non-cardiac procedures were performed on the Philips BV-5000 unit, using only single
plane. The following typical procedures performed at Tawam Hospital were investigated:

IAEA-CN-85-51
344
- Upper extremity - fistulogram
- Renal - nephrostomy
- Lower abdomen - percutaneous transluminal angioplasty (PTA) + stenting
For non-cardiac procedures the limiting factor is the hand dose [1]. Radiologists performing
them were issued finger dosimeters which were than read after a number of procedures.
4. Method
As a part of our quality assurance and radiation protection program, scattered radiation dose
distributions resulting from cardiac catheterization procedures are measured in areas close to
the patient [2]. Prior to the measurement, analysis of 10 cardiac procedures involving patients
of average size (60 – 80 kg) was performed. The mean dose area product (DAP) resulting
from the whole procedure was calculated as 11.8 Gycm2 and used as a reference value in
subsequent measurements. The cardiac procedure was recreated using a Rando Alderson
phantom as a scattering medium. A 3-D structure containing thermoluminescent detectors
(TLD) was positioned close to the phantom where the cardiologist, assistant cardiologist and
the nurse would be positioned during the procedure. The present study focuses on the
radiation doses received by the cardiologist left arm, eye lens, thyroid and hands resulting
from cardiac procedures. TLDs calibrated for skin dose measurements in the diagnostic
energy range were attached to the cardiologist left and right arm, close to the eye lens, on the
skin above the thyroid and on the fingers of both hands. Doses to eye lens and the thyroid
were later calculated. After each procedure DAP values were recorded and TLD readings were
corrected for the average procedure. No lead glass protective screens were used in the
procedures covered by the study. Radiologists performing non-cardiac procedures were issued
finger dosimeters. In these cases TLD readings were also corrected for an average procedure
in each group using calculated mean DAP.
5. Result
Sachets containing TLDs were attached to appropriate locations of the cardiologists
performing the procedure. Each procedure was closely watched by a monitoring team
recording protective measures used and working habits of the staff. In some cases
cardiologists did not use protective glasses or thyroid shields due to personal discomfort. A
printout indicating fluoroscopy time, number of images acquired and DAP values was
obtained at the end of each procedure. The results of the measurements are presented in Table
1 together with explanations.
Table 1. Values of doses per average procedure in cardiac catheterization
TLD location Calculated dose (mGy)
Situation 1 Situation 2
Left shoulder surface 0.86 ---
Thyroid 0.054 0.62
Eye lens 0.068 0.65
Right hand 0.36 ---
Left hand 0.19 ---
Situation 1 – protective glasses with side shield and thyroid shield worn
Situation 2 – no protective glasses and thyroid shield
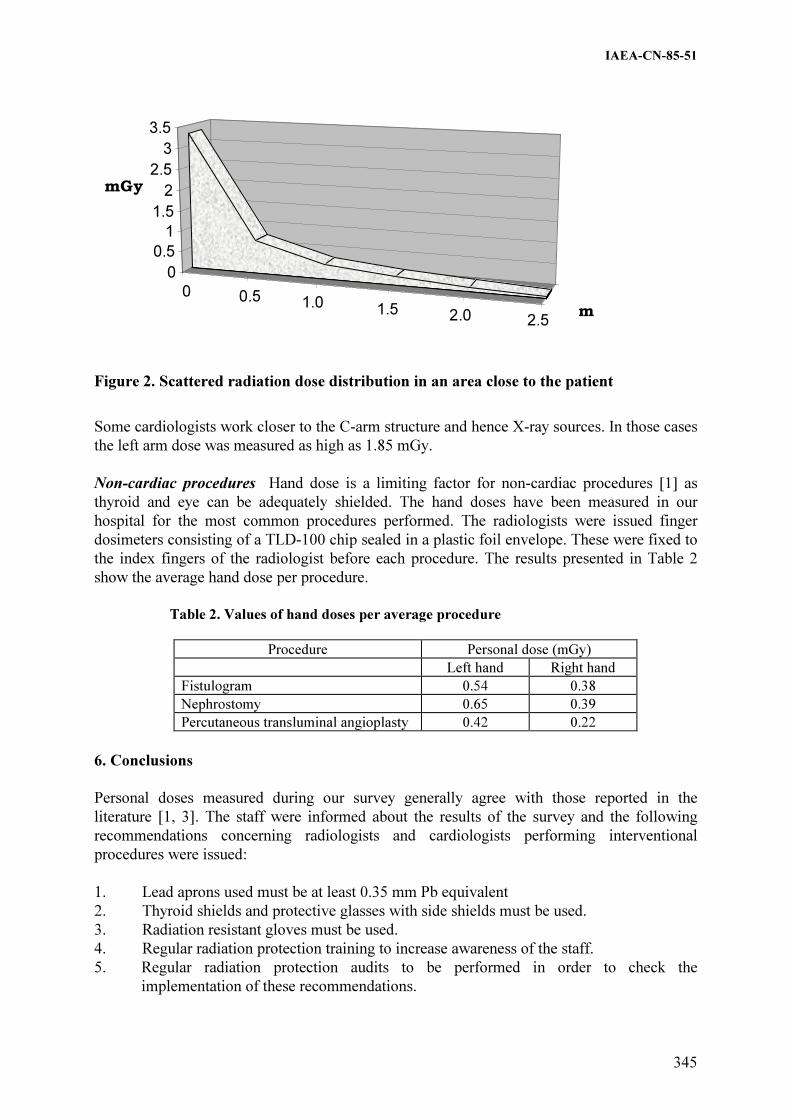
IAEA-CN-85-51
345
mGy
0
0.5
1
1.5
2
2.5
3
3.5
m
mGy
0 0.5 1.0 1.5 2.0 2.5
Figure 2. Scattered radiation dose distribution in an area close to the patient
Some cardiologists work closer to the C-arm structure and hence X-ray sources. In those cases
the left arm dose was measured as high as 1.85 mGy.
Non-cardiac procedures Hand dose is a limiting factor for non-cardiac procedures [1] as
thyroid and eye can be adequately shielded. The hand doses have been measured in our
hospital for the most common procedures performed. The radiologists were issued finger
dosimeters consisting of a TLD-100 chip sealed in a plastic foil envelope. These were fixed to
the index fingers of the radiologist before each procedure. The results presented in Table 2
show the average hand dose per procedure.
Table 2. Values of hand doses per average procedure
Procedure Personal dose (mGy)
Left hand Right hand
Fistulogram 0.54 0.38
Nephrostomy 0.65 0.39
Percutaneous transluminal angioplasty 0.42 0.22
6. Conclusions
Personal doses measured during our survey generally agree with those reported in the
literature [1, 3]. The staff were informed about the results of the survey and the following
recommendations concerning radiologists and cardiologists performing interventional
procedures were issued:
1. Lead aprons used must be at least 0.35 mm Pb equivalent
2. Thyroid shields and protective glasses with side shields must be used.
3. Radiation resistant gloves must be used.
4. Regular radiation protection training to increase awareness of the staff.
5. Regular radiation protection audits to be performed in order to check the
implementation of these recommendations.

IAEA-CN-85-51
346
References
[1] GOLDSTONE, K.E., “Occupational exposures in interventional radiology”, Radiation
Protection in Interventional Radiology (Proc. Meeting, 1993), BIR Publication, London,
1995).
[2] JANECZEK, J., JAMES, D., BEAL, A., “ Patient and Staff Doses from Digital Bi-plane
Coronary Angiography “, Proceedings IRPA-10, 10th
International Congress of the
International Radiation Protection Association, May 14 – 19, 2000, Hiroshima (CD).
[3] RAMSDALE, M.L., WALKER, W.J., HORTON, P.W., Extremity doses during
interventional radiology, Clin. Radiol., 41, 34 – 36, (1990).

IAEA-CN-85-72
347
A STUDY ON THE ANNUAL EQUIVALENT DOSES RECEIVED
BY CARDIOLOGISTS IN A UK HOSPITAL
R.Y.L. Fong, E. Ryan, S. Alonso-Arrizabalaga
Clinical Physics Group, St Bartholomew’s Hospital, London, United Kingdom
Abstract
A dose assessment study was carried out to determine the likely annual equivalent doses received by various
parts of a cardiologist’s body. High sensitivity GR-200 thermoluminescent dosemeters were attached to
cardiologists’ foreheads, little fingers, wrists, elbows, knees and ankles. Three common cardiology procedures
were investigated, namely, percutaneous transluminal coronary angioplasty (PTCA), permanent pacemaker
insertion (PPM) and left heart catheterisation (LHC). Dose monitoring was done on a case-by-case basis. Data on
ten cases of each procedure were gathered. The projected annual equivalent doses were computed by averaging
the ten doses measured at each site for each examination type and finding out from the cardiologists how many
cases of PTCA, PPM and LHC they do in a year. Results in this study show that for the lens of the eye, the
projected annual equivalent dose is below 10 mSv and for the other body parts, it is below 100 mSv per year. The
study demonstrated that the methodology used can help to optimise radiation protection in diagnostic radiology.
1. Introduction
For workers who are occupationally exposed to ionising radiations, article 9 of Council
Directive 96/29 Euratom [1] states an annual equivalent dose limit of 150 mSv for the lens of
the eye and 500 mSv for hands, forearms, feet and ankles. United Kingdom has adopted these
values in the Ionising Radiations Regulations 1999 [2]. Paragraph 1(c) of Schedule 4 of
Ionising Radiations Regulations 1999 states, “the limit on equivalent dose for the hands,
forearms, feet and ankles shall be 500 mSv in a calendar year”. For the first time in UK
legislation, specific parts of the limbs are subject to a dose limit, hence there is a need to make
some dose assessment to these body parts. In diagnostic radiology, the group of workers that
is most likely to receive the highest doses are people who are involved in interventional work.
Cardiologists are one example.
A study was carried out to (i) assess scattered doses received by different parts of a
cardiologist’s body, (ii) estimate the likely annual equivalent doses that the various body parts
would receive and (iii) establish if additional protective measures are needed.
The dose received by different parts of the cardiologist’s body depends on many factors, such
as the examination procedure, the patient and complexity of the case, the skill of the
cardiologist, the x-ray image intensifier system, the protective equipment used and the
position of the cardiologist in relation to the x-ray tube and patient. Due to this interplay of
contributing factors and for practical reasons, dose assessment was made per individual case
using small, high sensitivity thermoluminescent dosemeters (TLD) that can be attached on or
close to the body parts under study. Previous researchers [3] have studied exposure to
operating staff in cardiology using thermoluminescence dosimetry but only five cases of
cardiac catheterization were investigated. The current study investigated three common
cardiology procedures and data from many more cases were collected.
2. Materials and methods
The study was conducted in a well-established cardiology department of a large teaching
hospital. Seven cardiologists were involved, comprising one consultant and six specialist
registrars in various years of their training. Three common cardiological procedures were

IAEA-CN-85-72
348
selected for this study: percutaneous transluminal coronary angioplasty (PTCA), permanent
pacemaker insertion (PPM) and left heart catheterisation (LHC). Data on ten cases of each of
these examinations were collected. Dose monitoring was done on a case-by-case basis. The
examinations were carried out in three cardiac laboratories equipped with C-arm x-ray image
intensifier units that are less than 5 years old (table 1). Each unit has Diamentor transmission
ionisation chamber (Diamentor, PTW, Freiburg, Germany) attached to the head of the x-ray
tube.
Table 1. Specification of the x-ray equipment in the three cardiac laboratories
Laboratory 1 Laboratory 2 Laboratory 3
Manufacturer/ Model Philips Integris
V3000
Siemens Coroskop
Classic
Philips Integris
H3000
Generator Optimus CP Polydoros IS/C Optimus M2000
Field sizes (cm) 38, 31, 25, 20, 17 23, 17, 13 23, 18, 13
Copper pre-filtration None Fluoroscopy and
Acquisition*
Fluoroscopy
*No copper filter in acquisition mode if patient size is greater than 25 cm.
Individually calibrated LiF: Cu, Mg, P dosemeters were used to monitor doses at various sites
of the cardiologist’s body. They were GR-200 chip dosemeters, also called TLD-100H chips
(3mm x 3mm x 1mm) from Harshaw Bicron/NE-Technology (BICRON-NE, Solon, OH,
USA). These TLDs have high sensitivity and are able to detect doses down to 1µSv above
background. They are commonly known as Chinese TLDs. The TLDs were sealed in small
black plastic sachets and attached to the forehead, the fifth digit of each hand and the left and
right wrists, elbows, knees and ankles. The TLD sachets were taped to the body part using
micropore tape except for the forehead where a headband was used and the wrists where wrist
bands were used. The TLD at the forehead was aimed at monitoring dose to the eye. The
finger TLDs were taped at the distal end of the finger but not at the fingertip so that the
dexterity and comfort of the cardiologist were not affected. Two unexposed TLDs were used
as control dosemeters. At the end of each examination, all TLDs were removed and read out
in a Toledo 654 reader (D. A. Pitman Ltd.). They were annealed in an oven at 240° for 15
minutes followed by rapid cooling to room temperature before re-use.
In addition to the GR-200 dosemeters worn for the purpose of this study, the cardiologists also
wore their monthly dosemeters comprising a body film badge, a collar film badge, a headband
containing a TLD-100 dosemeter and a wrist band containing a TLD-100 dosemeter. They all
wore lead aprons which had 0.5mm lead (Pb) at the front and 0.35mm Pb at the back, a 0.5
mm Pb thyroid shield and no Pb glasses. During PTCA and LH catheterisation procedures,
they used a Brompton screen for protection. The screen has a cut-out in the Pb glass and has
Pb drapes at the bottom. No protective screen was used for pacemaker insertion procedures.
The projected annual equivalent doses were computed by averaging the ten doses measured at
each site for each examination type and finding out from the cardiologists how many cases of
PTCA, PPM and LHC they do in a year. These three examinations together comprise the
majority of their workload. In order to be conservative, data from a cardiologist who had the
highest caseload were used.
3. Results and Discussion
The results are presented in figures 1 and 2.

IAEA-CN-85-72
349
0
100
200
300
400
500
600
700
Abso
rbed
dose
(µ
Sv)
PTCA
PPM
LHC
Figure 1. Distribution of individual doses measured in the study. Solid markers are doses
measured on the left body part and open markers are doses measured on the right body part
Figure 1 shows all the individual doses measured in the study. For PTCA which is marked by
diamond markers, the highest doses are found in the wrists and knees. The left wrist and left
knee get a higher dose than the right side. The left is marked by solid diamonds. During
PTCA, the cardiologist stands on the right side of the patient and it is the left side of the
cardiologist that is closer to the x-ray tube, hence the higher dose. For PPM, the fingers and
knees get the highest doses. Many of these doses are also much higher than those received
during PTCA and LHC. This is because the cardiologists do not use any protective screen
during PPM. In PPM, it is the right side of the cardiologist that gets the higher dose, marked
by open triangles. This is because during PPM, the cardiologist stands on the left side of the
patient and it is the right side of the cardiologist that is closer to the tube, hence the right side
tends to get the higher doses. For LHC, the knees and ankles get the highest doses. Like
PTCA, the left side gets a higher dose than the right side. The cardiologist stands on the right
side of the patient and it is the left side of the cardiologist that is closer to the tube, hence the
higher doses marked by the solid circles. In general, doses received during LHC are lower
than those received during PTCA which is a more complicated procedure.
0
50
100
150
200
Pro
ject
ed a
nn
ual
eq
uiv
alen
t d
ose
(m
Sv
) FingerEye Wrist Elbow Knee Ankle
Lt Rt Lt RtLt RtLt RtLt Rt
Figure 2. Projected annual equivalent doses for a senior cardiology specialist registrar
Forehead Fingers Wrists Elbows Knees Ankles
IAEA-CN-85-72
350
Figure 2 shows the projected annual doses and standard error. It also marks the 150 mSv level
which is the three-tenths UK annual equivalent dose limit for the various body parts and the
full annual dose limit for the lens of the eye. All doses are well below the 150 mSv line.
Projected annual equivalent dose to the lens of the eye is below 10mSv and the spread is
small. For the other body parts, the projected annual equivalent dose is less than 100 mSv,
even taking the spread in dose into account. In each case, the left hand side gets more dose
than the right hand side because except for PPMs, it is the left side of the cardiologist’s body
that is closer to the tube. Left wrist, left knee and left ankle get the highest doses.
4. Conclusions
The use of high sensitivity GR-200 thermoluminescent dosemeters had enabled individual
doses at various sites of a cardiologist’s body to be measured on a case-by-case basis. Three
common cardiology procedures were investigated, namely, PTCA, PPM and LHC. Three
conclusions can be drawn from this study.
(1) Overall, doses on the left side of a cardiologist’s body are higher than doses on the right.
This is due to the fact that for PTCA and LHC procedures, the cardiologist stands on the
right side of the patient and it is the left side of the cardiologist’s body that is nearer to
the x-ray tube.
(2) Results from this study show that the projected annual equivalent doses are well within
three-tenths of any UK annual dose limit. Therefore there is no justification for
designating cardiologists in the establishment concerned as classified workers on the
basis of their equivalent doses. Routine personal monitoring shows that cardiologists’
body doses are also well below the three-tenths limit.
(3) Dose monitoring at the additional sites is not routinely required under current
circumstances.
(4) From this study, two recommendations are proposed. Firstly from the point of view of
radiation protection, routine monitoring of wrist doses should be done on the left wrist.
Secondly, the addition of lead curtains to beds in angiography laboratories should be
considered. This will greatly reduce doses to knees and ankles. On-going training in
radiation protection is necessary in helping radiation workers to keep their doses as low
as reasonably achievable.
Acknowledg3ments
I would like to acknowledge the dosimetry and technical work done by physicists Elaine Ryan
and Sara Alonso-Arrizabalaga while doing their training at St. Bartholomew’s Hospital and
the co-operation of the Cardiology Department at St. Bartholomew’s Hospital, London,
United Kingdom.
References
[1] Council Directive 96/29 Euratom of 13 May 1996 laying down basic safety standards
for the protection of health of workers and the general public against the dangers arising
from ionising radiation, Official Journal of the European Communities 39 L159 (1996)
1-114.

IAEA-CN-85-72
351
[2] The Ionising Radiations Regulations 1999, SI 1999/3232 Her Majesty’s Stationery
Office (1999) ISBN 0 11 085614 7.
[3] JANSSEN, R.J.J., HADDERS, R.H., HENKELMAN, M.S., BOS, A.J.J., Exposure to
operating staff during cardiac catheterisation measured by thermoluminescence
dosimetry, Radiation Protection Dosimetry 43 1/4 (1992) 175-177.
IAEA-CN-85-49
352
STAFF DOSIMETRY AND RISK ASSESSMENT DURING
DIGESTIVE AND ANGIOGRAPHIC EXAMINATIONS
J. Pages, M. Osteaux Department of Radiology and Medical Imaging, Free University Hospital Brussels, Brussels, Belgium Abstract
The use of ionizing radiation in medical applications involves not only a risk for the patient, but also for the staff
which executed the related examinations. The dose to the forehead, neck, fingers and wrist of a radiologist and
an assisting nurse were measured with thermoluminescent dosimeters during angiographic and digestive
examinations respectively. Dose to eye lenses and effective dose were estimated for a working period of one
year. Effective doses were under the established limit of 20 mSv per year. Nurse eye lens dose was higher than
the limit of 150 mSv. Differences of a factor of 3.8 were observed between nurse and radiologist doses.
Angiographic procedures are considered as high risk examinations, however, digestive examinations can have a
higher risk than interventional procedures.
1. Introduction
The use of ionising radiation in the imaging of body tissues for diagnostic and therapeutic purposes, involves not only a risk for the patient, but also for the staff which executes the related examinations. These risks can be stochastic or deterministic, and may appear minutes or years after the irradiation. Some examples of these radiation-related effects in x-ray workers are: skin cancer, an elevated incidence of leukaemia in radiologists, and radiation cataractogenesis [1�. In the following study, the dose to the forehead, neck, fingers and wrist of both radiologist and assisting nurses have been measured during angiographic and digestive x-ray examinations. From the data collected, the dose to the lens of the eye and the effective dose have been estimated for a working period of one year. Results have been compared with established limits for workers [2�. The related risks have been evaluated in order to establish adequate safety measures. 2. Materials and methods
The angiographic examinations were carried out in a digital x-ray unit Siemens Multiskop equipped with C-arm undercouch tube, high frequency generator, digital processing system and carbon fiber table. No bucky is present in the equipment. All of the examinations but one were executed in the same operation mode: fluoroscopy mode "normal", dose level "normal" (500), 3 frames per second. The dose level "low" (200) was used for the blood sampling of the parathyroid glands. The digestive examinations were executed in a General Electric Prestilix 1600X DRS unit equipped with overcouch tube and high frequency generator. Both digital and conventional radiographic techniques were used. The entrance surface dose (ESD) at different positions of the body was measured with thermoluminescent dosimeters TLD 100-H (LiF: Mg, Cu, P; Harshaw Solon). A black polyethylene sachet containing one dosimeter was placed on the forehead and neck (on the thyroid collar, at the external surface) of the radiographer and the assisting nurse. For the assisting nurse the dose to the fingers and the wrist (right hand) was also measured. For the fingers, a plastic ring was used to hold the sachet. The TLD chips were calibrated in-air with
IAEA-CN-85-49
353
a Siemens x-ray unit equipped with tube and high frequency generator . The tube potentials selected were 70 kVp for the angiographic procedures, and 81 kVp for the digestive examinations. The chips were read in an automatic Harshaw 5500 reader and annealed in a PTW-TLDO oven. The precision of the group of dosimeters was 6% at 11.4 mGy. The individual sensitivities did not differ by more than 17% from the mean sensitivity of the whole group of dosimeters. The effective dose was estimated conservatively from the measured doses at the forehead and at the neck (over thyroid collar) using conversion coefficients calculated by Faulkner [3�. These coefficients depend on the position of the x-ray tube with respect to the table, the energy of the beam, and the position of the dosimeter in the body. 3. Results and discussion
The mean number of exams per day carried out by both radiologist (4 exams) and assisting nurse (3.5 exams) were determined to estimate effective dose and eye lens dose for a working period of one year (840 exams radiologist, 735 exams nurse).
The measured values of ESD to forehead and neck are given in Table I (radiologist) and Table II (nurse). Fluoroscopy time and number of frames per type of examination are also given. The values of effective dose and dose to the lens of the eye are shown in Figure 1 and 2. The mean values were determined from the mean dose per examination calculated from all of the examinations. Minimum and maximum values were determined from the minimum and maximum doses per type of examination, from the type of examinations with the lowest and highest mean doses. In Table III the results of the measurements of dose at fingers and wrist levels of the assisting nurse are summarised.
Table I. Doses at forehead and at neck (over thyroid collar) of a radiologist executing
interventional procedures. The number of examinations executed is given between brackets
examination
type
fluoro time
(sec) � frames dose forehead
(mGy)
dose neck
(mGy)
AC-IM (9) min - max 156 - 288 150 - 459 0.06 � 0.13 0.10 � 0.31
mean � stdev 197 262 0.10 � 0.03 0.19 � 0.07
AC-HNV (12) 78 - 564 99 - 278 0.03 � 0.09 0.04 � 0.14
mean � stdev 314 188 0.06 � 0.02 0.09 � 0.03
Angioplasty (2) min - max 492 - 522 55 - 88 0.04 � 0.05 0.10 � 0.18
mean � stdev 507 72 0.04 � 0.01 0.14 � 0.05
CT-AMS (3) min - max 162 - 204 225 - 390 0.11 � 0.15 0.28 � 0.40
mean � stdev 183 320 0.12 � 0.02 0.35 � 0.06
diverse (11) min - max 108 - 2286 87 - 508 0.02 � 0.27 0.03 � 0.33
mean � stdev 468 257 0.05 � 0.04 0.11 � 0.09
total (37) min - max 78 - 2286 55 - 508 0.02 � 0.27 0.03 � 0.40
mean � stdev 407 247 0.08 � 0.05 0.16 � 0.1
AC-IM: aortic cross-inferior members; AC-HNV: aortic cross-head and neck vases; CT-ASM:
coeliaque trunk- mesantic superior artery, min: minimum; max: maximum; stdev: standard deviation.

IAEA-CN-85-49
354
Table II. Measured doses at the forehead of an assisting nurse executing digestive examinations.
The number of examinations executed is given between brackets
examination
type
fluoro time
(sec) � frames dose forehead
(mGy)
barium enema double contrast (14) min - max b
12 - 15 0.25 - 0.79
mean � stdev 403 14 0.50 � 0.1
barium meal (5) min - max b 33 - 63 0.24 - 0.85
mean � stdev 321 51 0.43 � 0.3
swallow (4) min - max b 41 - 66 0.05 - 0.24
mean � stdev 46 57 0.15 � 0.1
small bowel study via
nasoduodenal administration (10)
min - max
mean
b
1045
37 - 70
53
0.11 - 0.42
0.25
barium enema single contrast (4) min - max b 8 - 14 0.15 - 0.23
mean � stdev 246 11 0.19 � 0.04
oesophagus (1) min - max b 18 - 53
a
mean 134 40 0.15
defaecography (1) min - max b 30 - 50
a
mean 87 40 0.23
small bowel study via oral
administration (1)
min - max
mean
b
553
19 - 40
36
a
0.23
fistulography (1) min - max b
9 - 17 a
mean 113 13 0.11
all examinations (41) min - max b 8 - 70 0.11 - 0.85
mean � stdev 328 35 0.34 �0.2 a not applicable,
b values not given, min: minimum; max: maximum; stdev: standard deviation.
Table III. Measured values of entrance surface dose (ESD), and calculated values of absorbed
dose at fingers and wrist (extrapolated for one year period)of an assisting nurse in digestive
examinations
ESD at fingers
mGy
ESD at wrist
mGy
absorbed dose
fingers
(one year period)
mSv
absorbed dose wrist
(one year period)
mSv
minimum 0.07 0.08 55.4 63.3
maximum 0.50 0.68 395.4 537.8
mean � stdev. 0.26 � 0.2 0.32 � 0.2 206.8 255.3
stdev, standard deviation.
4. Summary of conclusions
Differences of a factor of 3.9 for the dose to the lens of the eye, and 3.7 for the effective dose were observed between assisting nurse and radiologist (the latest with the lowest doses). Mean effective dose for both radiologist and nurse was under the limit of 20 mSv per year [4�. Mean and maximum radiologist eye doses were under the limit of 150 mSv per year [4�. However, the nurse eye lens doses were higher than the established limit (Figure 1). The risk involved is the formation of cataracts, which is a late deterministic effect (symptoms appear many years after the irradiation). The mean dose to fingers and wrist estimated for one year were under the limit of 500 mSv for skin.

IAEA-CN-85-49
355
(a) (b)
0
5
10
15
20
25
30
minimum mean maximum
mSv
radiologist assistingnurse
limit
0
50
100
150
200
250
300
350
400
minimum mean maximum
mSv
radiologist assistingnurse
limit
Figure1. Effective dose(a) and dose to the lens of the eye(b) estimated for a period of one year
0.0
0.5
1.0
1.5
2.0
2.5
3.0
3.5
4.0
4.5
1 3 5 7 9 11 13 15 17 19 21 23 25 27 29 31 33 35 37
examination
rela
tion fore
head/n
eck
AC-IMAC-HNV
CT-AMS
Angioplasty
diverse
Figure 2. Relation effective dose estimated from dose at forehead/ effective dose estimated from
dose at neck level. To analyse the differences between effective dose estimated from doses at the forehead and at the neck level, the relation between the ED forehead and ED neck was plotted in a graphic (Figure 2). It can be observed that, with the exception of TC-MS and angioplasty procedures, differences up to a factor of 4 exist for the different examinations. This suggests the use of two dosimeters in lieu of one for the estimation of effective dose of personnel executing high-risk examinations [4,5,6�. Both the NCRP and the ICRP recommend the use of two dosimeters for the monitoring of workers wearing a protective apron: one over and one under the apron. The interpretation of the combined results is dependent on the local irradiation conditions and any regulatory requirements [7-8]. They also recommend that if only one dosimeter is used, it should be worn over the apron, high on the trunk. The result will overestimate the effective dose, but will provide information on the dose to the skin, eye, and unshielded parts of the body. Angiographic procedures are considered a type of radiological examinations with the highest risk for both patient and staff members (especially the radiologist executing the procedures). However, it has been observed that digestive examinations can have a higher risk than interventional examinations, when inadequate equipment and protocols are used (long fluoroscopy times, large number of frames, overcouch tube). It is not customary for the staff

IAEA-CN-85-49
356
to wear protective lead glasses or thyroid collars. But due to the high-risk the personnel executing these type of examinations are exposed to, the use of extra protective devices have become mandatory in the radiology department where the study was carried out. Nevertheless, digestive examination protocols should be re-evaluated in order to make the necessary changes to reduce the dose to both patient and staff, specially when it is not possible to make changes in the type of equipment used. References
[1] VAÑO, E., GONZALEZ L., BENITEZ F., Lens injuries induced by occupational exposure in nonoptimized interventional radiology laboratories, Br. J. Radiol.71(1988) 728-733.
[2] Recommendations of the International Commission on Radiological Protection. ICRP Publication 60. Ann. ICRP Vol. 21 No. 1-3 (International Commission on Radiological Protection), New York (1991) 11-201.
[3] FAULKNER, K., MARSHALL, NW., The relationship of effective dose to personnel and monitor reading for simulated fluoroscopic irradiation conditions, Health Phys. 64 (1993) 502-508.
[4] BALTER, S., et al., Guidelines for personnel radiation monitoring in the cardiac catherization laboratory, Catherization and Cardiovascular Diagnosis. 30 (1993) 277-279.
[5] ROSENSTEIN, M., Practical approaches to dosimetry for the patient and staff for fluoroscopic procedures, Food and Drug Administration. Rockville: Center for devices and radiological health (1995)1-219-1-226.
[6] ROSENSTEIN, M, WEBSTER, E., Effective dose to personnel wearing protective aprons during fluoroscopy and interventional radiology, Health Phys. 67 (1994) 88-89.
[7] General principles of monitoring for radiation protection of workers. ICRP Publication 35 (The International Commission on Radiological Protection), New York (1992).
[8] Instrumentation and monitoring methods for radiation protection. NCRP Report No. 57. (National Council on Radiation Protection and Measurements), Washington DC (1978).

Topical Session 4
RADIOLOGICAL PROTECTION OF PATIENTS IN
NUCLEAR MEDICINE

������

IAEA-CN-85-86
359
DOSES OF IONISING RADIATION RECEIVED BY PATIENTS DIAGNOSED AT
THE NUCLEAR MEDICINE DEPARTMENT IN WARSAW FROM 1985 TO 1999
J. Chaœ1, M. Marciniak
1, E. Dziuk
2, M.K. Janiak
1
1 Department of Radiation Protection and Radiobiology,
Military Institute of Hygiene and Epidemiology,
Warsaw, Poland 2
Department of Nuclear Medicine,
Central Clinical Hospital of the Military University Medical School,
Warsaw, Poland
Abstract
In order to evaluate the radiological risk incurred by patients diagnosed at the Department of Nuclear Medicine
(DNM), Central Clinical Hospital of the Military University Medical School in Warsaw, the collective committed
effective dose equivalents (CCEDE) and the mean personal effective dose equivalents (MPEDE) were calculated
for the subsequent years of the period from 1985 to 1999 and compared to the respective values obtained for the
mid-1970s. The results indicate that although the number of patients and the total radioactivities used in the
diagnostic assays at the DNM increased more than 2.5-fold in the second half of the 1980s and in the 1990s, as
compared to the years 1975-1976, the MPEDEs calculated for the periods from 1985 to 1989 and from 1990 to
1994 were similar to and two-fold lower, respectively, than those obtained for the years 1975-1976. However, in
the second half of the 1990s, these doses rose again and in 1999 they were almost three times as high as in the
mid-1970s. This latter observation results from the increased contribution to CCEDE of the doses from the
diagnostic use of I-131 which equalled to 88% in 1975, dropped to 20% in 1994, and again rose to 90% of the
total dose in 1999. In fact, beginning from 1995, a new whole-body I-131-based screening procedure was
introduced for the detection of the thyroid cancer metastases.
1. Introduction
The constantly increasing numbers of patients diagnosed in vivo with use of a variety of
radionuclides make it necessary to control and verify the absorbed doses of ionising radiation
and to estimate the risk incurred by the exposed persons.
The mean number of patients diagnosed annually at the Department of Nuclear Medicine
(DNM), Central Clinical Hospital of the Military University Medical School in Warsaw from
1985 to 1989 and from 1990 to 1999 equalled to 2,661 and 3,111, respectively. The respective
annual activities of the radiopharmaceuticals used equalled to 1.02 and 1.27 TBq. For
comparison, the mean number of patients diagnosed per year at DNM during the period from
1975 to 1976 equalled to 1,444 and the activities used averaged to 0.06 TBq. The present
work was undertaken to compare the exposure to ionising radiation in terms of the collective
effective dose equivalent and mean personal effective dose equivalent in patients diagnosed at
the DNM in a given year from 1985 to 1999 and, for comparison, in the years 1975 and 1976.
The respective dose equivalents were calculated based on the activities of different
radionuclides in different organs and tissues and the number of patients diagnosed in each
particular year.
2. Material and methods
Calculations of both the collective committed effective dose equivalents (CCEDE) and mean
personal effective dose equivalents (MPEDE) were obtained for 2,887 patients diagnosed at
the DNM in 1975 and 1976, and for 44,413 patients diagnosed during the period from 1985 to
1999 (Fig.1). The diagnostic tests consisted predominantly of scintigraphies and/or

IAEA-CN-85-86
360
radioimmunoassays utilising such radionuclides as I-131, Tc-99m, In.113m, Tl-201, Cr-51
and Hg-203. To calculate the doses we used the values of the committed effective dose
equivalents HT(�) obtained by a patient after administration of a given radionuclide per unit
radioactivity, as indicated by others [1-8]. By multiplying the HT(�) value by the activity of
the administered radionuclide and the number of patients in a given year, the CCEDEs were
obtained for all the patients diagnosed per year with a particular test. The quotient of the
CCEDEs and the number of tests performed in a given year yielded the total CCEDE per year.
The MPEDE was obtained by dividing the CCEDE in a given year by the number of patients
diagnosed in that year. Contribution of I-131 to the total collective effective dose equivalent
was defined as the quotient of the CCEDE from this radionuclide calculated for the thyroid
gland and the total CCEDE value.
3. Results and discussion
As shown in Fig. 2, total activities of the radionuclides used annually from 1985 to 1999
generally paralleled the number of patients tested and averaged 1.01 TBq for the period from
1985 to 1989, and 1.27 TBq for the period from 1990 to 1999. In fact, the highest total activity
(1.62 TBq) was noted in 1993, when the number of patients was also the greatest (3,599
patients, as shown in Fig. 1). In contrast, although the numbers of patients diagnosed in 1975
or 1976 equalled to more than one-third of the mean number of patients from the period 1985-
1996, total activities of the radioisotopes utilised during 1975 and 1976 equalled to only 0.05
and 0.06 TBq, respectively,. These results reflect the quantitative and qualitative changes in
both the radionuclides used and the types of tests employed during the 1970s and 1980s.
Indeed, in 1975 and 1976 the I-131-labelled sodium iodide, the Hg-203-labelled neohydrine,
and the In-113m-labelled compounds were the predominant radiopharmaceuticals used in the
radioisotope-based diagnostics. However, labelling of the compounds with In-113m and Hg-
203 was abandoned in 1985 and 1986 when, for the first time, most of the in vivo tests were
done using agents labelled with technetium Tc-99m and other short-lived radionuclides (e.g.
Tl-201).9-13
Moreover, the traditionally I-131-tagged compounds such as NaI, albumins,
albumin microspheres and hipuran began to be less and less frequently labelled with this
radionuclide. In fact, in 1989 approx. 42,000 diagnostic tests of the thyroid gland in Poland
were done using the I-131-labeled compounds and approx. 10,000 tests using the Tc-99m-
labeled compounds, while in 1992 the number of tests in which I-131 and Tc-99m were used
as the radionuclide tags approximated to 33,000 and 35,000, respectively.9 During the second
half of the 1990s, however, the whole-body scintigraphy with use of I-131-labelled NaI
became more and more popular for the detection of thyroid cancer metastases.
For patients diagnosed at DNM the total CCEDE during the period from 1985 to 1989
approximated 30 man-Sv. For comparison, these doses for 1975 and 1976 equalled to 20 and
16 man-Sv, respectively. With regard to the 1990s, this dose reached its nadir (15 man-Sv) in
1992, then began to rise and in 1999 equalled to 89 man-Sv (data not shown). This substantial
increase is associated with the dissemination in the mid-1990s of a new diagnostic procedure
utilising I-131 for the whole-body screening for metastases of the thyroid cancer. For example,
in 1999 as many as 60 patients were diagnosed with this particular method which alone was
responsible for 80% of the total CCEDE received by the patients in 1999.
The total CCEDE data were used to obtain the MPEDE values (Fig. 3) and the contribution of
I-131 to the total CCEDE (Fig. 4). As shown in Fig. 3, the MPEDEs were the highest during
the second half of the 1990s (mean value 19.6 mSv) and rose substantially compared to the
second half of the 1980s (mean value 11.7 mSv) Interestingly, the lowest MPEDE values per

IAEA-CN-85-86
361
patient were noted in 1992 and 1993 (5.0 and 4.9 mSv, respectively). In contrast, in 1975 and
1976, these dose equivalents equalled to 13.4 and 11.4 mSv, respectively, which in view of
the low total radioactivities used in those years (Fig. 2) are the relatively very high levels.
Nevertheless, these latter values are still below the level received by the total population of
patients from the Polish nuclear medicine departments in 1981.14
However, the values of the
MPEDE calculated for each patient diagnosed at the DNM from 1985 to 1995, although
generally oscillating around 10 mSv, were still somewhat higher than the respective doses
reported for the 1980s from other European countries.7,8,13,15,16
The reason for this discrepancy
is unclear, but it is possible that different types and doses of radionuclides, and/or different
diagnostic procedures used in these other countries are responsible.
As shown in Fig. 4, the contribution of I-131 to the total CCEDE indicates that the use of this
radionuclide was most responsible for the radiological risk of the patients during the tested
period (70-90% CCEDE) except for the first half of 1990s (20-70% CCEDE) when it was
often replaced by Tc-99m in the diagnosis of thyroid disorders.
4. Conclusion
The present results indicate that although the number of patients diagnosed at the DNM
during the last 15 years almost doubled compared to the mid-1970s the mean MPEDEs
obtained yearly by the patients from the two periods are similar. However, the lowest MPEDE
values were noted in the first half of the 1990s and the highest in 1999. In fact, these values
began to rise in 1995 as a result of the markedly increased utilisation of I-131 in the whole-
body screening for thyroid-derived metastases, the method rarely used in Poland during the
early 1990s. These elevated levels of MPEDE indicate the increased radiological risk for both
patients and personnel of the nuclear medicine departments during the last five years, the cost-
benefit of which should be carefully re-assessed.
0
500
1000
1500
2000
2500
3000
3500
4000
75 76 85 86 87 88 89 90 91 92 93 94 95 96 97 98 99
Figure 1 Numbers of patients diagnosed at the DNM per year in 1975 and 1976 and from 1985 to 1999.

IAEA-CN-85-86
362
0
0,2
0,4
0,6
0,8
1
1,2
1,4
1,6
1,8
75 76 85 86 87 88 89 90 91 92 93 94 95 96 97 98 99
Figure 2 Total activities [TBq] of radionuclides used at the DNM per year in 1975 and 1976 and from
1985 to 1999
0
5
10
15
20
25
30
35
40
75 76 85 86 87 88 89 90 91 92 93 94 95 96 97 98 99
Figure 3 Mean personal effective dose equivalents [mSv] for patients diagnosed at the DNM in 1975
and 1976 and from 1985 to 1999.

IAEA-CN-85-86
363
0
10
20
30
40
50
60
70
80
90
100
75 76 85 86 87 88 89 90 91 92 93 94 95 96 97 98 99
Figure 4 Contribution of I-131 to the total collective effective dose equivalent [%] for patients
diagnosed at the DNM in 1975 and 1976 and from 1985 to 1999
References
[1] ERTL S., DECKART H., TAUTZ M., Radiation doses and risk of patients through
nuclear medical procedures in the GDR. A comparison of 1978 and 1981,
Eur.J.Nucl.Med. 9 (1984) 241-244.
[2] METTLER Jr. F.A. et al., Population characteristics and absorbed doses to the
population from nuclear medicine: United States-1982, Health Phys. 50 (1986) 619-628.
[3] VOROBJEV E.J. et al., Radiation exposure of the population in the USSR due to
medical diagnostic procedures, Rad.Prot.Dos.11 (1985) 35-40.
[4] POPPITZ R., Patient exposure and radiation risk in Bulgarian diagnostic nuclear
medicine. I. Survey of the diagnostic nuclear medicine procedures in Bulgaria in 1980,
Nucl.Med. 21 (1982) 85-91.
[5] Medical Exposures, 31st Session of the UNSCEAR, Annex G, Vienna, 15-26 March
(1982), A/AC.82/R.40.
[6] ICRP Publ.53: Radiation Dose to Patient from Radiopharmaceuticals, Annals of the
ICRP 17 (1987).
[7] DOBICI F., WELLS S., Radiation exposure of the Italian population due to nuclear
medicine examinations (Proc. World Congress Med.Phys. Kyoto 1991).
[8] HUSAK V., RICKOVA H., Activities of administered radiopharmaceuticals and
population dose from nuclear medicine in Czechoslovakia, Cesk.Radiol. 44 (1990) 333-
339 (in Czech).
[9] DZIUK E., Current status of the nuclear medicine in Poland-1992, Probl.Med.Nukl. 7
(1993) 117-123 (in Polish).
[10] NOWAK B., STANISZEWSKA M., JANKOWSKI J., Structure of the in vivo
diagnostic assays performed in Poland, Pol.Przeg.Radiol. 50 (1986) 27-31 (in Polish).
[11] BEEKHIUS H., Medicine procedures in the Netherlands, Health Phys. 54 (1988) 287-
291.
[12] KRISTIENSEN K., NORBYGAARD E., Safety and efficacy of radiopharmaceuticals,
Martinus Nijhoff Publ.. Boston (1984) 158 pp.
IAEA-CN-85-86
364
[13] ENNOW K., Use of radiopharmaceuticals in Denmark in 1990, National Institute of
Radiation Hygiene, Danemark (1991) (in Danish).
[14] STANISZEWSKA M.A., Radiation risk to patients from nuclear medicine in Poland
(1981), Eur.J.Nucl.Med. 13 (1987) 307-310.
[15] KAUL A. et al., Arten und Hafigheit nuklearmedizinischer Untersuchungsverfahren und
dadurch bedingte Strahlenexposition von Patienten und gesamtbevolkerung,
Forschungsvorhaben Strahlenschutz 1009 des Budesministers des Innern, Bonn (1988).
[16] MOUNTFORD P. J., Risk assessment of the nuclear medicine patient., Br. J. Radiol.,
70 (1997) 671-684.

IAEA-CN-85-114
365
DOSES FROM NUCLEAR MEDICINE EXAMINATIONS:
A 25-YEAR FOLLOW-UP STUDY
K.J.A. Kairemo, H. Korpela Radiation and Nuclear Safety Authority (STUK), Radiation Practices Regulation, Helsinki, Finland Abstract
New radiopharmaceuticals have been introduced in nuclear medicine examinations, and on the other hand, the
amount of many routine nuclear medicine procedures have been replaced with clinical methods utilising non-
ionisating radiation (ultrasonography, MRI). To clarify the situation in Finland, a country wide survey on the use
of radiopharmaceuticals in diagnostics and therapy was made in 1975, 1982, 1989, 1994, 1997 and will be made
in 2000. A questionnaire was sent to all hospitals and institutes using unsealed sources in both diagnostic and
therapeutic nuclear medicine procedures. For each procedure, the pharmaceutical used, the number of procedures
and the typical administered activities were recorded. The collective effective doses from nuclear medicine
examinations were calculated according to the ICRP formulae similarly for each survey. In Finland, in each of
these years, more than 50 000 procedures in more than 30 different laboratories were performed. Significant
changes in collective doses were observed: for example, the collective dose from I-131 was 350 manSv in 1975,
and 20 manSv in 1997. In 1975, 68% (n=23967) of collective dose originated from I-131, whereas in 1997 the
percentage of I-131 in collective dose was 10 % (n=1118). In 1994 and 1997, the use of the three radionuclides
(Tc-99m, I-131 and Tl-201) accounted for 96 % and 95 %, of the collective effective dose.
Our results indicate that the collective effective dose from nuclear medicine examinations has decreased in last
25 years. National surveys form the basis when setting reference levels for typical nuclear medicine
examinations. By introducing reference levels based on national practice it is possible to even decrease the
collective effective dose.
1. Introduction
Currently more than 50 000 clinical nuclear medicine examinations in more than 30 different laboratories are performed in Finland. Exact data has to be reported regularly to the Radiation and Nuclear Safety Authority based on the implementation of MED-directive. Additionally, data on the frequency and collective effective dose of nuclear medicine examinations in Finland, were available in years 1994 �1� and 1997 �2�. Data was available in years 1975 �3� and 1982 �4� before that. However, the methods for evaluating collective effective dose have been changed. The aim of this study was to calculate collective effective doses from national surveys beginning 1975 in a similar manner, especially for iodine-131. Furthermore we wanted to find out how nuclear medicine procedures have been changed during 1975-2000. 2. Materials and methods
A country wide survey on the use of radiopharmaceuticals in diagnostics and therapy was made concerning the years 1975, 1982, 1989, 1994, 1997 and will be made concerning the year 2000. A questionnaire was sent to all hospitals and institutes using unsealed sources in both diagnostic and therapeutic nuclear medicine procedures. For each procedure, the pharmaceutical used, the number of procedures and the typical administered activitities were recorded. The collective effective doses were calculated according to the ICRP formulae similarly for each survey. The dose factors (mSv/MBq) given in ICRP 62 �5� were used.

IAEA-CN-85-114
366
3. Results
Information was obtained from all hospitals and institutes. The major component of the collective dose was I-131. Table 1 demonstrates how the collective dose from I-131 has developed between 1975 and 1997. Table 1. The collective effective doses from the use of I-131 between 1975 and 1997
Year Total number of
nuclear medicine
examinations
Collective effective
dose from I-131
(manSv)
Collective effective
dose from I-131 (%)
1975 59350 350 75,9
1982 85340 303 56,6
1989 55730 124 -
1994 50900 33,0 14,9
1997 51730 19,8 9,6
The collective effective dose from I-131 was 350 manSv in 1975, and 20 manSv in 1997, respectively (Table 1). This means, that in 1975 68% (n=23967) of collective dose originated from I-131, whereas in 1997 the percentage of I-131 in collective dose was 10 % (n=1118). The following radionuclides in descending order, Tc-99m, Tl-201, Cr-51, I-131, In-111, I-123, F-18, O-15, C-11, Se-75, Xe-133, Co-57, were used in more than 100 different investigations in 1997. In 1997, the use of Tc-99m, I-131 and Tl-201 accounted for 95 %, of the effective collective dose. Table 2 demonstrates how the use of bone scintigraphy using Tc-99m-labelled phosphates or diphosphonates has been changed between 1975 and 1997. Table 2. The collective doses from the use of Tc-99m-phosphates between 1975 and
1997
Year Number of bone
scintigraphies
Collective effective
dose from Tc-99m
(manSv)
Collective effective
dose from Tc-99m (%)
1975 2761 8,7 1,8
1982 15266 44,6 8,3
1989 19689 62,2 -
1994 20912 62,6 28,5
1997 21845 71,0 34,3
The total amount of nuclear medicine procedures was higher in the 80´s than in the 90´s (Table 1). In 1975 there were 42 laboratories and also 42 different diagnostic procedures and a total of 59350 investigations were performed. Nuclear medicine procedures were carried out in 33 laboratories in 1997, and more than 150 different diagnostic procedures were carried

IAEA-CN-85-114
367
out, eventhough the total number of investigations was 51730. The amount of bone scintigraphies has stabilized during the last 10 years. The amount of collective effective dose derived from Tc-99m in bone scintigraphy has increased gradually. Figure 1. demonstrates the current practice of bone scintigraphy in different laboratories.
0
500
1000
1500
2000
2500
3000
370 450 500 520 555 645 670 680 700 740 900
Activity (MBq)
Nu
mb
er
of
ex
am
ina
tio
ns
(n
=1
14
37
)
Figure 1. Injected mean activities in bone scintigraphy in Finland in 1997.
4. Discussion
Our results indicate that the collective effective dose from nuclear medicine examinations has decreased in last 25 years. Our results also demonstrate that the total amount of nuclear medicine procedures is nowadays lower than in the 80´s. The major constituent of the collective dose has been I-131 (Table 1 ). Its use has been decreased in a greater extent than those of other radionuclides in diagnostic nuclear medicine. The influence of Tc-99m on the collective dose derived from bone scintigraphy has increased (Table 2). There is still a great variability in the administered activities between laboratories (Figure 1). Therefore, reference levels are needed. National surveys form the basis for reference levels for administered activities in nuclear medicine examinations. By introducing reference levels based on national practice make it possible to even decrease the collective dose. The reference level planned for bone scintigraphy is 600 MBq and, if SPECT is performed 800 MBq. For comparison, in German national survey �6�, in 1992, the mean effective dose from bone scintigraphy was 4.8 mSv per examination whereas our mean effective dose was 3.2 mSv in 1989 and 3.0 mSv in 1994, respectively. In Germany in 1992 �6�, the bone scintigraphy was responsible for 38.8 % of the collective effective dose whereas the collective effective dose was in Finland in 1994 28.5%. In general, the nuclear medicine has developed into right direction during the last 25 years in Finland, i.e. the collective effective dose has decreased and the diversity of nuclear medicine procedures has increased. Also, most of the collective dose originates nowadays from Tc-99m, which is an optimal solution from the radiation protection point of view.

IAEA-CN-85-114
368
References
[1] KORPELA, H., Radioaktiivisten lääkevalmisteiden käyttö Suomessa 1994.
Säteilyturvakeskus, 1996. [2] Use of Radiopharmaceuticals in Finland in 1997. STUK - Radiation and Nuclear Safety
Authority, 1999. [3] PIETILÄ, P., KETTUNEN, E., REKONEN, A., Radioaktiivisten aineiden
lääkinnällinen käyttö Suomessa 1975-1976. STL-B11. Säteilyturvallisuuslaitos, 1977. [4] ASIKAINEN, M., Radionuklidien käyttö isotooppidiagnostiikassa ja-hoidoissa 1982.
STUK-B60. Säteilyturvakeskus, 1984. [5] International Commission on Radiological Protection. Radiological Protection in
Biomedical Research and Addendum 1 to Publication 53 – Radiation Dose to Patients from Radiopharmaceuticals. ICRP Publication 62. Oxford: Pergamon Press 1993.
[6] REINERS, C., SONNENSCHEIN W., Die Strahlenexposition durch nuklearmedizinische Untersuchungen in Deutschland (alte Bundesländer). Nuklearmedizin 33 (1994) 254-262.

IAEA-CN-85-183
369
GENERAL COMMENTS ON RADIOLOGICAL PATIENT PROTECTION IN
NUCLEAR MEDICINE
M. Téllez de Cepeda1, R. Plaza
1, E. Corredoira
1, L.M. Martín Curto
2
1Sº de Radiofísica y Radioprotección, Hospital Universitario La Paz, Madrid, Spain
2Sº de Medicina Nuclear, Hospital Universitario la Paz, Madrid, Spain
Abstract
In this paper an observations series about different aspects of the radiological protection of the patient in Nuclear
Medicine is provided. It includes : The specific legislation contribution, the justification and optimization
(specially this last one), as a fundamental base of the quality guarantee program, the importance of the fulfillment
of the program and the importance of getting done the corresponding internal audits of the pursuit, the
communication between the different groups of professionals implicated and between these and the patient, the
volunteers who collaborate in the patient's care and the people of the patient's environment, knowing that the
patient is a source of external radiation and contamination.
RESUMEN
Se resumen en este trabajo, una serie de observaciones sobre distintos aspectos de la protección radiológica del
paciente en Medicina Nuclear que incluyen: El aporte de la legislación específica, los principios de justificación
y optimización (en especial éste último) como base fundamental del programa de garantía de calidad así como la
importancia de que dicho programa se cumpla y se lleven a cabo las correspondientes auditorias internas de
seguimiento, la comunicación tanto entre los diferentes grupos de profesionales implicados como entre éstos y el
paciente, los voluntarios que colaboran en su cuidado y las personas de su entorno, teniendo en cuenta que el
paciente es una fuente de radiación externa y contaminación.
1. Legislación
Ante la pregunta legislación si o “demasiado” se puede contestar sin duda que SI. Disponer de
una legislación específica y viable, ha sido y es fundamental para la mejora o generación,
según los casos de los programas de calidad de los servicios implicados.
El Real Decreto 1841/1991 (de 5 de diciembre, por el que se establecen los criterios de
calidad en Medicina Nuclear), según indicaciones de la Directiva 97/43 Euratom, está
representando un estímulo continuo en la implantación efectiva de los programas de calidad.
El primer paso en este proceso ha sido la necesidad de elaborar un documento propio en cada
servicio de Medicina Nuclear, para presentación al correspondiente Sº de Inspección y
Acreditación Sanitaria, lo cual lleva implícito que el documento es de obligado
cumplimiento, que ha de ser periódicamente revisado y que puede ser auditado en
cualquier momento.
Implantar dicho programa requiere una conexión permanente de médicos y técnicos
especialistas, enfermería al cuidado de pacientes ingresado, empresas de mantenimiento y
radiofísicos (que se incluyen formalmente en la legislación, con misiones específicas), todo
bajo la responsabilidad final de Dirección.
Este Real Decreto, a diferencia de sus homólogos de Radioterapia y Radiodiagnóstico, no
obliga a la constitución de una Comisión de Calidad. Escalada y col. [1] indican su buena
experiencia sobre el funcionamiento de una comisión compuesta por miembros de M.
Nuclear, Radiofísica y Dirección. En nuestro Hospital se ha optado por el organigrama que
aparece en el cuadro I.

IAEA-CN-85-183
370
PROGRAMA DE GARANTIA DE CALIDAD
Control de Equipos
Informatica
Protección Personal
Protección Paciente
Protección P. en General
PROCEDIMIENTOS
Radiofisica
Radioprotección
Informe
ARCHIVO
Realización de la exploración
Registro
Procedimientos
Confirmación
Decisión de la Exploración
Terapia y Procedimientos
Solicitud y Recepción
Exploraciones
Personal M, Nuclear
Responsabilidad Jerarquica
Responsable Asistencial
Recepción Material
Almacenamiento - Preparación
C.Calidad - Dosificación
PROCEDIMIENTOS
Radiofarmacia
RESPONSABLES CONTROL CALIDAD
GERENCIA
Responsable P. Calidad
del Hospital
EVALUACION
PERIODICA
Incidencias
(Reacciones adversas)
- Incidencias:
(sobreexposición, contaminación.....
- Estimación dosis terapeúticas
Sea cual sea el sistema elegido, lo importante es que funcione y sirva para la mejora
continua.
La actuación de la Autoridad Competente no es fácil en esta primera fase, ya que se tiene que
encontrar el equilibrio entre el papel positivo que una auditoría debe representar en el apoyo a
la calidad y la inevitable propuesta de sanciones, en caso de no cumplimiento, que pueden
llevar al auditado a concentrarse más en el “papel” y el mínimo registro- con la posibilidad de
ocultar o maquillar datos, que en perseguir la auténtica mejora continua.
Finalmente, concluiremos este apartado reseñando la necesidad y por otra parte la facilidad de
actualizar los anexos del decreto, especialmente el que se refiere a control de calidad de la
instrumentación, dados los constantes avances tecnológicos.
2. El protocolo nacional de control de calidad en la instrumentación
La existencia de un documento nacional de referencia [2], avalado por las sociedades
científicas implicadas al respecto y elaborado por un grupo de trabajo mixto, con
representantes de cada una de éstas, es una buena opción no sólo a nivel científico sino
humano e interprofesional.
No obstante hay que tener claro que, en ningún caso, debe ser un documento estático, dada la
velocidad con que avanza la tecnología, como se dijo anteriormente. El documento actual
requiere aplicación y crítica basada en la primera, así como la pronta creación de un nuevo
grupo de trabajo mixto, para actualización y ampliación.

IAEA-CN-85-183
371
Escalada y col (1) opinan que la primera aproximación a las pruebas detalladas en el
Protocolo Nacional, es difícil. R. Puchal, en su conferencia del VIII Congreso Nacional de
Protección Radiológica concluye que el Protocolo es útil. Ambas visiones deben ser
consideradas. El documento ha de ser analizado, pero es indiscutible que ha servido
claramente de apoyo, desde la publicación del primer borrador, al desarrollo de la
sistematización del control de calidad de la instrumentación.
3. Protección del paciente en diagnostico
Se basa en:
Procedimientos detallados que tengan en cuenta la justificación y la optimización de las
exploraciones (3).
Detalles tan simples como qué hay que hacer antes de empezar un estudio (4) –prescripción
correcta, adecuadamente redactada y legible; paciente, radiofármaco y actividad
correspondiente, no portador de atenuadores de radiación ni de actividad o contaminación en
lugares no deseados (bolsa de orina, incontinencias u otros); información sobre posibles
embarazos y lactancias (5) etc.
Instrumentación en estado correcto. El personal encargado de cada gammacámara o equipo de
pruebas “in vivo” ha de ser protagonista de las pruebas diarias (no olvidar centrado de
fotopico entre otras), o muy frecuentes, de constancia así como un colaborador imprescindible
del radiofísico en general.
En lo que atañe a pruebas de control de calidad en SPECT, se incluyen dos referencias
bibliográficas recientes (6) y (7) , que se estiman de interés.
Con respecto a pruebas de aceptación de nuevos equipos, hay que destacar la importancia del
papel del radiofísico en aumentar la cultura para la realización de dichas pruebas y la
profundidad de las mismas, a través de una buena sincronización con el suministrador.
El trabajo que se viene realizando con equipos recientemente instalados, implica una cada vez
mayor aproximación por parte del radiofísico y del suministrador, en la verificación del
cumplimiento de las especificaciones de compra y en establecer un nivel de referencia inicial
del equipo. Se incluye en la bibliografía el trabajo de R. Barquero y R. Puchal (8) relativo al
tema en cuestión.
4. Terapia
Es obvio destacar aquí la importancia de la justificación y la optimización así como la
dosimetría del paciente y la información del mismo y de las personas del público próximas, (
voluntarios colaboradores, familiares etc), durante la hospitalización y el tiempo posterior al
alta en el que deben seguirse normas especiales.
Asegurar que no existen errores en la administración de la dosis prescrita es vital. J. C. Ruiz y
col (9) han observado desviaciones frente al valor nominal, al medir las cápsulas de I-131 y
concluyen en la necesidad de una verificación sistemática. Más importante aún, a nuestro
entender, es la administración de una dosis individualizada tras un estudio de la captación.

IAEA-CN-85-183
372
En lo que se refiere al alta del paciente también debe individualizarse tanto en lo que se refiere
al fin de la hospitalización como al periodo de restricciones (10 y 11).
En nuestro caso, se realiza una encuesta para conocer las condiciones de entorno del paciente
una vez dada el alta. Dicha encuesta , así como la entrega y explicación verbal de las normas a
seguir en lo que atañe a protección radiológica, es llevado a cabo por el radiofísico, del Sº de
Radiofísica y Radioprotección, destinado a Medicina Nuclear, según lo acordado con el Jefe
de Medicina Nuclear.
En reseña publicada por Foro Nuclear: “Flash de Isótopos y Protección Radiológica”, con
fuente : Nuclear News, junio 2000, se indica que la NRC autorizó, en mayo del 2000, la no
hospitalización de pacientes, siempre que los miembros de su familia no superen el límite de
dosis establecido para el público, autorización que muchos especialistas no ponen en marcha.
En la misma fuente se indica que un estudio publicado en el Journal of Medical Association,
sobre dosis de familiares de 30 pacientes a los que se había administrado una dosis de 4,3
GBq de I-131, recibieron una dosis media de 0,24 mSv, siendo el valor máximo de 1.09. Los
pacientes tenían instrucciones especiales sobre mantenimiento de distancia, beber líquidos en
abundancia y ducharse varias veces al día.
Caldwell y col (12), llegan a la conclusión de que, en determinadas circunstancias, el
tratamiento de pacientes con dosis elevadas, puede hacerse sin hospitalización.
En nuestro criterio, parece razonable por diversas razones (recogida de orina entre ellas),
ingresar a los pacientes un periodo de tiempo de acuerdo con sus condiciones individuales.
5. Información al paciente
En diagnóstico y mucho más en terapia, es preciso mantener un diálogo con el paciente
(riesgos, normas etc). En cualquier caso la información debe ser fácilmente entendible; p. ej si
s sobre riesgos en diagnóstico acudir a riesgos comparado con los habituales de la vida diaria
o tiempo para recibir la misma dosis por radiación natural (13). Las normas escritas, deben
ser, además, atractivas y directas, tal como se indica en “Protección radiológica 97 Euratom”.
(CE).
Informe quien informe, debe haber unidad de criterio y una forma convenida para informar.
Si se trata de enfermos ingresados el personal de enfermería debe estar preparado para
informar, si se requiere. En cualquier caso el personal facultativo debe responsabilizarse de la
información al paciente.
6. Conclusion
Como conclusión general se destaca la importancia del programa de Calidad en el que debe
entramarse, de forma natural, la protección radiológica del paciente. Todos los implicados en
el mismo, deben comunicarse fácilmente entre sí y deben tener formación actualizada. Es
importancia que se efectúen auditorias internas con la debida frecuencia.

IAEA-CN-85-183
373
Referencia
[1] Experiencia en la implantación de un programa de control de calidad en la
instrumentación de Medicina Nuclear.- C. Escalada, R del Real, I. Martín, X. Pifarré,
M.C. Paredes.- Radioprotección , revista de la SEPR, nº extraordinario, sep. 2000
[2] Protocolo Nacional en la Instrumentación en M. Nuclear.- R. Barquero, A Blanes,J.M.
Delgado, N. Ferrer; J. Mª martí, R. Puchal. M.L. Ramírez, J.Luis.Simón, M. Téllez de
Cepeda (Coordinadora).- SEFM, SEMN y SEPR 1999
[3] Protección del Paciente en medicina Nuclear y radioterapia. P. Ortiz, Protección
Radiológica 2000, VIII Congreso de la SEPR
[4] Nuclear Medicine Procedure Manual. Wm. C. Klingensmith III, D. Eshima & John
Goddard. Revisión del 2000.
[5] Guía para la protección del feto y los niños pequeños irradiados debido a la
exposición médica de sus progenitores. Protección radiológica 100. CE (1999)
[6] National electric Manufacturers Association Recommendations for Implementating
SPECT Instrumentation Quality Control. The Journal of Nuclear Medicine. Vol 41. nº 2
Feb. 2000.
[7] Recommendations for implementing Spect Instrumentation Quality Control, N.
Medicine Section (NEMA). European Journal of N Medicine, Vol 26, nº 5, May 1999.
[8] Nuevas Gammacámaras, nuevas pruebas. R. Barquero, R Puchal. Revista de Física
Médica 2000; 1(0).
[9] Primeros resultados de la implantación de un protocolo de verificación de cápsulas
terapéuticas de I-131. J. C. Ruiz, J. F. Mart.i, I. Hervás, F. Sánchez. Radioprotección,
revista de la SEPR, nº extraordinario. Septiembre 2000.
[10] Protección radiológica después de una terapia con Yodo-131, Protección radiológica 97
(C.E.)
[11] Personalización de las restricciones y recomendaciones que debe seguir el paciente
tratado con I-131. P. Ruiz, M.A. Rivas, A. Hernández, A. García, F. Lozano.
Radioprotección, Rev de la SEPR nº extraordinario. Sep 2000.
[12] Outpatients treatment of thyroid cancer using high dodes of Iodine I-131. Caldwell
Ehrlichc.Can Assoc Radiol J 1999 Oct,50 (5) 331-6
[13] Are the X-rays safe?. MPW vol 15 (2) december 1999.

IAEA-CN-85-192
374
PATIENT DOSE ASSESSMENT IN DIFFERENT DIAGNOSTIC PROCEDURES
IN NUCLEAR MEDICINE
E. De Sena2, M.J. Béjar
2, R. Ruano
1, R. Berenguer
2, P. Tamayo
1
1Servicio de Medicina Nuclear, Hospital Universitario de Salamanca, Spain
2Servicio de Radiofísica y Protección Radiológica, Salamanca, Spain
Abstract
Effective doses have been estimated for 314 patients under diagnostic procedures in a Nuclear Medicine
Department using data reported in ICRP-80 and RIDIC (Radiation Internal Dose Information Center). Data on
administered activity, radiopharmaceutical and administration route, age and sex of the patients have been
collected. Doses in the most exposed critical organ for every protocol, doses in uterus, dosis in fetus versus the
stage of pregnancy (in case the female patient was pregnant) and doses for nursing infants have been also
estimated. Ga-67 studies give the highest effective doses per protocol followed by cardiac spect procedures
using Tl-201 chloride. Ga-67 studies also give the highest absorbed doses in uterus. Due to not administering
different activities depending on height and weight of adults, women receive doses about 20% higher than men.
This would be a practice to modify in the future in order to optimise doses.
1. Introducción
Tanto la Directiva Europea relativa a la protección de la salud frente a los riesgos derivados de
las radiaciones ionizantes en exposiciones médicas�1� como el Real Decreto de control de
calidad en medicina nuclear �2� establecen la obligatoriedad de implantar un programa de
garantía de calidad que incluya las medidas de control de calidad y, en particular, las
actividades administradas y las estimaciones de las dosis al paciente con objeto de asegurar
que la exposición de los mismos a la radiación sea la mínima compatible con el diagnóstico.
Especial consideración requieren las mujeres embarazadas o con capacidad de procrear, así
como las mujeres que están amamantando [1-8].
La determinación de la actividad óptima de un radiofármaco para una prueba diagnóstica dada
es compleja pues depende del tipo de equipamiento utilizado, de la talla y peso del paciente,
de sus características metabólicas y de su condición clínica. Su estimación va muy unida al
establecimiento de unos criterios de evaluación de las imágenes y estudios realizados por
parte del médico especialista. Este punto formará parte del objetivo de un futuro trabajo.
La incertidumbre asociada a la evaluación de las dosis es alta y proviene más de factores
fisiológicos que físicos. Los modelos biocinéticos�9-10�
que se utilizan son aproximaciones en
las que se considera un número limitado de compartimentos con velocidades definidas de
captación y eliminación del radiofármaco considerado.
2. Objetivos
1. Calcular una dosis efectiva promedio asociada a cada estudio.
2. Determinar la dosis en determinados órganos de riesgo o grupos de riesgo como pueden
ser el útero, el feto o el lactante.
3. Material y métodos
El estudio se ha realizado sobre una muestra de 314 pacientes sometidos a pruebas
diagnósticas de medicina nuclear. Se han recogido datos sobre tipo y número de los estudios
llevados a cabo en este servicio, edad y sexo de los pacientes, radiofármacos utilizados y vía

IAEA-CN-85-192
375
de administración de los mismos y actividad administrada a cada paciente como resta entre la
actividad antes de la inyección o inhalación y la actividad residual (después de la inyección o
inhalación). Las actividades han sido medidas en los activímetros Capintec CRC-30 y PTW-
Curiementor 2.
Las dosis absorbidas en útero y en el órgano crítico así como las dosis efectivas se obtuvieron
a partir de factores publicados en ICRP-80 �11�. Para aquellos radiofármacos que no
aparecían registrados en las tablas de ICRP-80 se utilizaron los factores dados por RIDIC�12�
basados en el programa MIRDOSE �10�. La estimación de dosis efectiva para hombres,
mujeres, feto en distintas etapas de gestación y para el lactante se ha realizado a partir de
distintas publicaciones de RIDIC �6-8�.
4. Resultados
En la tabla 1 se muestran las actividades medias administradas, intervalo correspondiente y
número de pacientes por radiofármaco y tipo de estudio. Siempre que no se especifique lo
contrario el radiofármaco ha sido marcado con Tc-99m y la vía de administración ha sido la
intravenosa.
Aproximadamente el 53% de las gammagrafías óseas se realizaron a personas mayores de 64
años y mucho menos frecuentemente (2%) a personas menores de 30 años. La distribución de
edades en los estudios de ventilación/perfusión pulmonar fue bastante semejante. En los
estudios de tiroides hubo un mayor reparto entre los distintos grupos de edad aunque también
se constató un predominio del grupo de mayores de 64 años. Por el contrario el 100% de los
estudios de reflujo gastroesofágico se realizaron a personas menores de 15 años y éste fue
también el grupo de edad predominante en las gammagrafías renales y renogramas.
Tabla 1. Radiofármaco, actividad administrada y número de pacientes para cada protocolo diagnóstico. (Las actividades del reflujo gastroesofágico (RGE) se refieren a niños)
Aadminist adultos (MBq)
Radiofármaco Protocolo hombres mujeres niños Intervalo Media HMDP G. Osea 60 122 4 520.5-866.3 717.8
Pertecnectato G. Tiroidea 7 46 2 121.1-258.6 181.0
DTPA (aerosol) Ventilación
pulm.
7 10 1 564.8-1097.8 763.27
MAA Perfusión pulm. 7 10 1 167.2-297.4 218.3
Eritrocitos Ventriculografía 7 6 0 642.7-814.0 735.8
Citrato de Ga-67 Rastreo 5 5 1 239.6-267.6 260.0
DMSA G. Renal 1 2 5 147.9-226.3 177.3
Sulfuro coloidal (oral) RGE 0 0 7 5.9-30.0 15.1
DTPA Renograma 2 0 2 254.3-269.8 262.0
HMPAO Spect Cerebral 1 3 0 838.4-883.2 864.4
Tetrofosmín (reposo) Spect cardíaco 1 2 0 673.4-779.9 744.3
Tetrofosmín (esfuerzo) Spect cardíaco 1 2 0 293.4-338.1 311.4
Cloruro de Tl-201 Spect cardíaco 2 0 0 66.3-70.0 68.2
Las gammagrafías óseas constituyeron el 60% de los estudios con una dosis efectiva promedio
en adultos de 5.6 mSv (tabla 2) seguidos por los estudios de tiroides con un 18% y una dosis
efectiva de 2.3 mSv y los estudios de ventilación/perfusión pulmonar con un 6% y una dosis

IAEA-CN-85-192
376
efectiva de 8.5 mSv. La dosis efectiva más alta por estudio se encontró en los rastreos con
Ga-67 con un promedio de 26 mSv seguido de los estudios de spect cardíaco con 15.0 mSv y
los estudios de ventilación/perfusión pulmonar con 8.5 mSv.
La mayor dosis a un órgano crítico (aquel órgano que recibe más dosis por unidad de actividad
administrada) se registró para el citrato de Ga-67 con 163.8 mGy en la superficie de huesos
seguido del HMDP con 62.2 mGy en el mismo órgano, como puede verse en la tabla
En la tabla 3 se observa que para el mismo tipo de estudio las dosis efectivas son casi siempre
mayores en mujeres que en hombres (a excepción de las gammagrafías renales) en un
porcentaje que va del 16% al 29%. Esto es explicable por su menor masa corporal y por la
posición de las gónadas dentro del cuerpo y cerca de órganos fuente en dosimetría interna,
como vejiga, hígado, riñones o intestinos.
Tabla 2. Dosis en el órgano crítico, dosis en útero y dosis efectiva en adultos (excepto para el sulfuro coloidal que se refieren a niños) para cada radiofármaco
Radiofármaco Órgano Crítico (OC) DosisOC (mGy) Dosisútero (mGy) E (mSv) HMDP Superficie de hueso 62.2 2.4 5.6
Pertecnectato int. Grueso sup. 10.3 1.5 2.3
DTPA (aerosol) pared de vejiga 38.2 3.4 6.1
MAA Pulmones 14.4 0.5 2.4
Eritrocitos Corazón 16.9 2.9 5.1
Citrato de Ga-67 Superficie de hueso 163.8 19.8 26.0
DMSA Riñones 31.9 0.8 1.6
Sulfuro coloidal (oral) pared int. grueso 0.4 0.4 0.4
DTPA Vejiga 16.2 2.1 1.3
HMPAO Riñones 29.4 5.7 8.0
Tetrofosmín (reposo) Vesícula biliar 26.8 5.4 5.7
Tetrofosmín (esfuerzo) Vesícula biliar 8.4 2.4 2.2
Cloruro de Tl-201 Ovarios 49.8 - 15.0
Tabla 3: Dosis efectiva para niños y adultos en función del sexo para cada radiofármaco (no hay datos disponibles para HMDP ni para
tetrofosmín). Dosis efectiva (mSv)
Radiofármaco Hombres Mujeres Niños Pertecnectato 2.1 2.5 2.2
DTPA (aerosol) 4.2 5.9 3.4
MAA 2.6 3.4 2.2
Eritrocitos 4.3 5.7 -
Citrato de Ga-67 25.9 31.3 21.6
DMSA 2.1 1.6 1.3
Sulfuro coloidal - - 1.8
DTPA 1.9 - 1.0
HMPAO 9.3 11.2 -
Cloruro de Tl-201 18.7 - -

IAEA-CN-85-192
377
Los datos de esta tabla se han obtenido a partir de factores de dosis (mSv/MBq) publicados en
ICRP-80 para todos los radiofármacos excepto para el HMDP, DTPA (aerosol) y sulfuro
coloidal, para los cuales se han tomado datos publicados por RIDIC. En estos casos no está
disponible la dosis en útero sino en ovario.
Las dosis efectivas son de un 4% a un 33% menores en niños con respecto a los adultos debido
a que las actividades administradas son menores.
El porcentaje de mujeres en edad de procrear (suponiendo ésta entre 15 y 45 años) fue del
16%. La dosis absorbida mayor en útero y por tanto el mayor riesgo para el niño no nacido,
con las actividades utilizadas en nuestro Servicio, se alcanzó con citrato de Ga-67, con 19.8
mGy, seguido del HMPAO con 5.7 mGy (tabla 2). Se han estimado las dosis al feto en el caso
de que las mujeres hubieran estado embarazadas (tabla 4). La absorción en función del estadio
del embarazo resultó variable según el radiofármaco considerado pero, en general, ésta resultó
mayor en los tres primeros meses que en las etapas posteriores. A medida que el feto crece la
fracción de energía absorbida por el mismo a partir de órganos maternos aumenta pero, a su vez,
el aumento de la masa del feto compensa este efecto.
No existen datos para HMDP ni para tetrofosmín. No se han incluido datos para DTPA,
sulfuro coloidal ni Tl-201 puesto que no se dispone de datos de mujeres sometidas a este tipo
de estudios.
Tabla 4. Dosis absorbida en el feto en función de la etapa del embarazo
Dosis absorbida (mGy) Radiofármaco 1ª etapa 3 meses 6 meses 9 meses Pertecnectato 2.0 4.0 2.5 1.7
DTPA (aerosol) 4.5 3.4 1.8 2.3
MAA 0.6 0.9 1.1 0.9
Eritrocitos 4.8 3.2 2.5 2.0
Citrato de Ga-67 24.3 52.2 47.0 33.9
DMSA 0.8 0.7 0.6 0.5
HMPAO 7.5 5.8 4.2 3.1
Se estimaron también las dosis al lactante. Por ejemplo, para unas actividades administradas
de 181 y 260 MBq de pertecnectato y citrato de Ga-67 respectivamente, tomando como límite
de dosis efectiva 1 mSv, y suponiendo los valores más conservadores de concentración en
leche y eliminación estaría indicada una interrupción de la lactancia durante 4 días para las
pacientes a las que se suministró citrato de Ga-67 y no sería necesaria interrupción para las
pacientes a las que se suministró pertecnectato.
Los datos dosimétricos para los fármacos recogidos en este trabajo provienen de ICRP-80 y
RIDIC. Las diferencias en dosis efectiva por unidad de actividad administrada a adultos dada
en estas dos fuentes así como en ICRP-53 y su apéndice I pueden alcanzar el 82% para
algunos radiofármacos. Estas diferencias provienen fundamentalmente de los distintos
factores de ponderación para tejidos (a partir del apéndice I de ICRP-53 comienzan a
utilizarse los nuevos factores de ponderación publicados en ICRP-60), así como de los
distintos modelos biocinéticos utilizados.

IAEA-CN-85-192
378
4. Conclusiones
1. La dosis efectiva más alta por estudio se encontró en los rastreos con Ga-67 con un
promedio de 26 mSv seguido de los estudios de spect cardíaco con 15.0 mSv y los
estudios de ventilación/perfusión pulmonar con 8.5 mSv. Las pruebas de mayor riesgo
para el feto en el caso de que la paciente se hallara embarazada son el rastreo con Ga-67 y
el spect cerebral con HMPAO.
2. El caso de las mujeres merece especial consideración en la evaluación de la dosis en medicina
nuclear. Debido a su menor masa corporal y a la posición de las gónadas dentro del cuerpo y
cerca de órganos fuente en dosimetría interna como vejiga, hígado, riñones o intestinos, las
mujeres tienen una carga de radiación de un 16% a un 29% más alta que los hombres para la
misma actividad suministrada por estudio. Si la actividad se administrara en función de la
masa corporal individual se eliminarían o reducirían estas diferencias, al menos en dosis
efectiva. Esto no se hace de forma rutinaria en nuestro servicio para adultos, aunque sí se
varía la actividad que se administra a los niños.
3. En un futuro está proyectado continuar con evaluaciones dosimétricas de este tipo, establecer
niveles locales de referencia por prueba diagnóstica y decidir sobre modos de actuación que
conduzcan a una optimización de las dosis. En este sentido la administración de actividades
personalizadas en función de la talla y peso del paciente sería una buena práctica a llevar a
cabo en el futuro.
Referencias
[1] Directiva 97/43/Euratom del Consejo de 30/6/97. Diario Oficial de las C.E. de 9/6/97.
[2] Real Decreto 1841/1997. B.O.E.nº303, 19-12-97.
[3] Radiation Dose to Patients from Radiopharmaceuticals, ICRP 53 (1987).
[4] ZANZONICO, “Internal Radionuclide Radiation Dosimetry: A Review of Basic
Concepts and Recent Developments” J.N.M., Vol 41, Nº 2 (2000).
[5] TOOHEY, STABIN, WATSON, “Internal Radiation Dosimetry: Principles and
Applications”, AAPM / RSNA (1999)
[6] MICHAEL G. STABIN, “Health Concerns Related to Radiation Exposure of the
Female Nuclear Medicine Patient”, Radiation Internal Dose Information Center
(1999).
[7] Tables of Radiation Absorbed Dose to the Embryo/Fetus from Radiofarmaceuticals”,
RIDIC, (1998).
[8] “Guidelines for Breastfeeding Mothers in Nuclear Medicine”, RIDIC (1996).
[9] JOHNSON, MC. CLURE, MC. COURT, “Mabdose I: Characterization of a General
Purpose Dose Estimation Code”, Medical Physics 26 (7), July (1999).
[10] STABIN, M, “MIRDOSE – The Personal Computer Software for Use in Internal Dose
Assessment in Nuclear Medicine”, J.N.M., Nº 37, (1996).
[11] “Radiation Dose to Patients from Radiopharmaceuticals”, ICRP-80, (1997).
[12] “Radiation Dose Estimates to Adults and Children from Various
Radiopharmaceuticals”, RIDIC (1996).
[13] “Radiation Dose Estimates for Radiopharmaceuticals”, RIDIC (1996).
[14] 14� Radiation Dose to Patients from Radiopharmaceuticals. ICRP 53 Addendum 1
(1991).
[15] 15� Recommendations of the International Commission on Radiological Protection,
ICRP 60 (1991).

IAEA-CN-85-202
379
RADIATION PROTECTION OF THYROID CANCER PATIENTS RECEIVING
I-131 THERAPY: SOME CONSIDERATIONS
S. Kottou1, D. Papadimitriou
1, M. Molfetas
2, A.Samartzis
2,
P. Mavrokephalos2, A. Perris
1, C.C. Alevizaki
2
1 Athens University Medical School, Athens, Greece
2 Department of Medical Physics, “Evangelismos” Medical Centre, Athens, Greece
Abstract
As a preliminary step to investigating the potential usefulness of external Thermoluminescence dosimetry (TLD)
in estimating parameters of radiation dose to the bladder and the gastric mucosa, 27 inpatients treated with Iodine
131 (60-200 mCi or 2.22-7.4 GBq) for differentiated thyroid carcinoma (19 receiving the iodine in a capsule and
8 in solution form) were studied. Doses and ages were similar in both group as was fluid intake (ad lib but
carefully recorded for each case). The TLDs were placed over the urinary bladder and in standard positions in the
epigastrium (xiphoid and left subcostal area) and total doses for 22 hours (bladder) as well as total doses and
dose rates (epigastrium) at various times from 5 to 90 minutes were recorded.
Both bladder dose and integral dose for 90 minutes over the stomach showed statistically significant positive
linear correlation with the administered I-131 activity . No correlation with the amount of fluid intake was
found. The 90 minute integral dose at the epigastrium per mCi administered was found to be higher in the
capsule group by 70%. Six out of 27 patients reported some discomfort (6/19 and 0/8 for capsule and liquid
group respectively, p=0.13). The possible significance of these findings is discussed.
1. Introduction
Iodine 131 is a well established and effective treatment , supplementing surgery, in
differentiated thyroid carcinoma. As iodide is also selectively concentrated in salivary glands
and gastric mucosa, treatment can result in considerable doses to these organs (as well as to
the urinary bladder), which good management should aim to minimize . Furthermore,
generalized use of the capsule form for administering I-131 has generated some concern over
the high (even if localized) radiation dose to the gastric mucosa. Information concerning these
matters is scarce in the literature. [1-3]The aim of this preliminary study was to investigate
what information could be obtained by simple external measurements with TLD in easily
identifiable anatomical positions on the body surface of patients treated with high doses of I-
131. In a second stage there will be an attempt to correlate these findings to actual
physiological parameters and absorbed doses, by means of parallel tracer studies.
2. Material and methods
27 patients treated with I-131 for differentiated thyroid carcinoma were studied. The standard
procedure in this hospital is by capsule so 19 of the patients were given the iodine in capsule
form, while the remaining 8 were given iodine in water solution. All patients were fasting
(except for fluids) overnight and for 2 hours after administration of the dose and were
encouraged to drink fluids on the first day. Fluid intake was ad lib but was noted for each
patient. Any symptoms the patients reported relating to the iodine administration were
recorded. TLD dose meters were placed on the xiphoid and on the left subcostal margin (LS)
and over the urinary bladder. All patients were hospitalized for 2-3 days till the residual
thyroid activity reached levels below those permitted for outpatients. Remaining I-131 activity
on the day of discharge was measured with a calibrated G-M monitor. Total dose for 22 hrs
over the bladder and dose rates as well as integral dose over the gastric area were measured
with TLD dose meters at 5, 10, 20, 30, 45, 60 and 90 min after the dose administration.
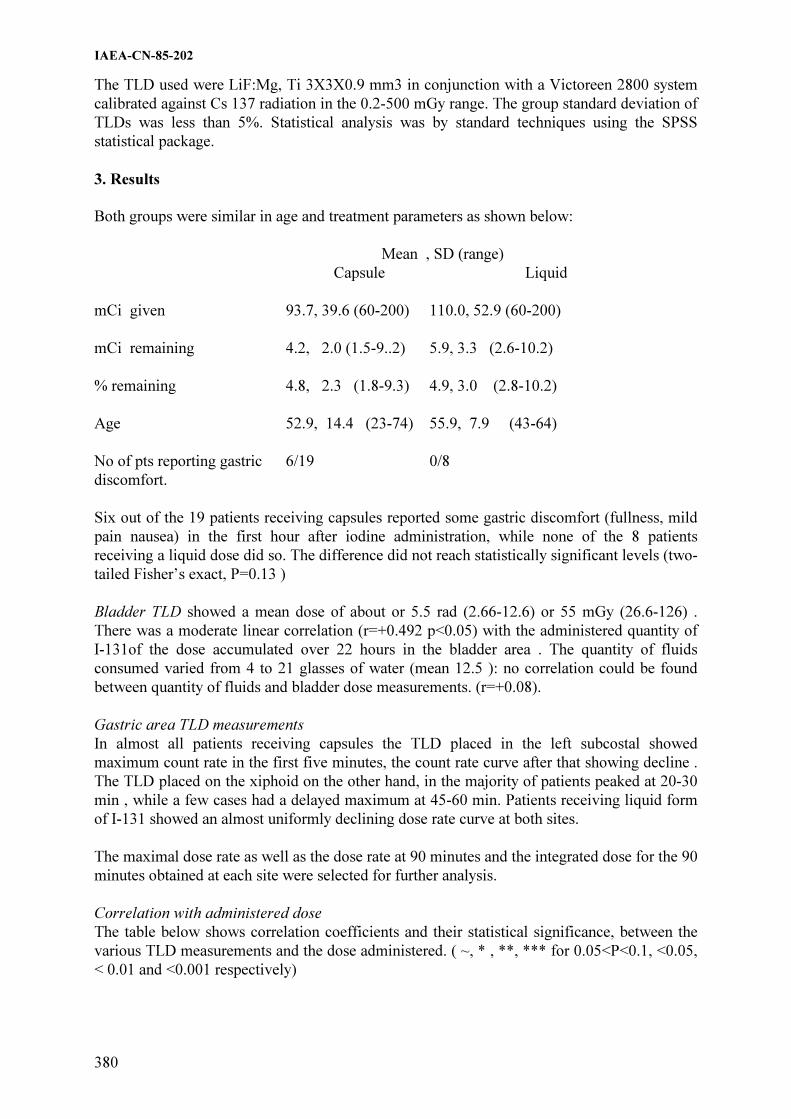
IAEA-CN-85-202
380
The TLD used were LiF:Mg, Ti 3X3X0.9 mm3 in conjunction with a Victoreen 2800 system
calibrated against Cs 137 radiation in the 0.2-500 mGy range. The group standard deviation of
TLDs was less than 5%. Statistical analysis was by standard techniques using the SPSS
statistical package.
3. Results
Both groups were similar in age and treatment parameters as shown below:
Mean , SD (range)
Capsule Liquid
mCi given 93.7, 39.6 (60-200) 110.0, 52.9 (60-200)
mCi remaining 4.2, 2.0 (1.5-9..2) 5.9, 3.3 (2.6-10.2)
% remaining 4.8, 2.3 (1.8-9.3) 4.9, 3.0 (2.8-10.2)
Age 52.9, 14.4 (23-74) 55.9, 7.9 (43-64)
No of pts reporting gastric 6/19 0/8
discomfort.
Six out of the 19 patients receiving capsules reported some gastric discomfort (fullness, mild
pain nausea) in the first hour after iodine administration, while none of the 8 patients
receiving a liquid dose did so. The difference did not reach statistically significant levels (two-
tailed Fisher’s exact, P=0.13 )
Bladder TLD showed a mean dose of about or 5.5 rad (2.66-12.6) or 55 mGy (26.6-126) .
There was a moderate linear correlation (r=+0.492 p<0.05) with the administered quantity of
I-131of the dose accumulated over 22 hours in the bladder area . The quantity of fluids
consumed varied from 4 to 21 glasses of water (mean 12.5 ): no correlation could be found
between quantity of fluids and bladder dose measurements. (r=+0.08).
Gastric area TLD measurements
In almost all patients receiving capsules the TLD placed in the left subcostal showed
maximum count rate in the first five minutes, the count rate curve after that showing decline .
The TLD placed on the xiphoid on the other hand, in the majority of patients peaked at 20-30
min , while a few cases had a delayed maximum at 45-60 min. Patients receiving liquid form
of I-131 showed an almost uniformly declining dose rate curve at both sites.
The maximal dose rate as well as the dose rate at 90 minutes and the integrated dose for the 90
minutes obtained at each site were selected for further analysis.
Correlation with administered dose
The table below shows correlation coefficients and their statistical significance, between the
various TLD measurements and the dose administered. ( ~, * , **, *** for 0.05<P<0.1, <0.05,
< 0.01 and <0.001 respectively)

IAEA-CN-85-202
381
Capsule Liquid
LS 90 min dose rate +0.53* +0.88**
“Maximum dose rate +0.87*** +0.74*
“Integral dose at 90’ +0.51*** +0.77*
Xiphoid. 90 min dose rate +0.24 - +0.75*
“Maximum dose rate +0. 27 - +0.69 ~
“Integral dose +0.73*** +0.61 ~
FIG. 1. Regression line in capsule patients and individual values in both groups for 90 min
integral TLD dose at the epigastrium versus quantity of I-131 administered to the patient
As shown in the table , the integral epigastric doses, the maximum observed and the 90
minute dose rates showed a positive linear correlation with the Iodine 131 activity
administered to the patient, statistically significant in most cases. .Integral doses plotted
against total I-131 administered can also be seen in figure 1 along with the regression line for
the capsule group. As it can be seen doses measured in patients receiving the liquid form were
well below the regression line for capsules in both locations measured.
As a consequence to the correlation findings, both the observed doses and dose rates were first
normalized for administered mCi in all comparisons.
The table below shows comparison of the mean indices between the capsule and liquid
groups.
Capsule Liquid
“LS 90 min dose rate index (mrad / mCi . min) “ 0.11 � 0.043 0.069 � 0.032* P=0.02
“Maximum dose rate (mrad / mCi . min) “ 0.242 � 0.071 0.223 � 0.049 P=0.11
“Integral dose at 90 (mrad / mCi) “ 15 � 6 9.7 � 3** P=0.007
“Xiph.. 90 min dose rate (mrad / mCi . min) “ 0.123 � 0.077 0.067 � 0.025* P=0.016
“Maximum dose rate (mrad / mCi . min) “ 0.316 � 0.18 0.219 � 0.1 P>0.30
“Integral dose (mrad / mCi) “ 12.5 � 3.2 9.2 � 3.5* P=0.05
LS
R2 = 0,2636
0,00
5,00
10,00
15,00
20,00
25,00
0 50 100 150 200 250
mCi
x1
00
mR
ad
Capsule
Liquid
Xiphoid
R2 = 0,5365
0,00
5,00
10,00
15,00
20,00
25,00
30,00
0 50 100 150 200 250
mCi
x100 m
Rad

IAEA-CN-85-202
382
4. Discussion
Good management of patients receiving Iodine 131 treatment should attempt to maximize
thyroiod uptake and minimize dose to salivary glands urinary bladder and intestinal tract. Of
these thyroid and salivary glands involve mainly patient preparation but dose to bladder and
gastric mucosa are influenced by manner of dose administration and management during the
first 24 hours post-treatment. Thus adequate fluid intake will reduce dose to the bladder. In
the present study where same quantification of bladder dose was attempted by direct external
measurement, no correlation was found between this dose measurement and fluid intake.
However, it is probable that this reflects the fact that water intake was already higher than a
(probable) plateau point for adequate bladder turnover: as it was not considered ethical to
have a control group with restricted fluid intake water intake was ad lib and the study was
done during the warm season.
Concerning mode of administration there has been some concern over the dose in the stomach
wall when a capsule is administered. There are a few attempts to directly assess the effect of
the capsule form on the speed of gastric transit of I-131, [1-3] but none of them in
hypothyroid patients , as those receiving I-131 treatment for thyroid carcinoma. In the present
study all external measurements in the stomach area showed a dose by nearly 100% higher
with capsule administration. In absence of parallel tracer studies (to be carried out in a 2nd
stage of the study) one should not attempt to directly relate these results to actual absorbed
doses. However, although the difference was not statistically significant (probably because of
the small number of patients in the liquid group) it is of interest to note that all six patients
who experienced some gastric discomfort following the I-131 dose belonged to the capsule
group.
To conclude, should further studies show that this type of external measurement can identify
patients likely to have a delayed capsule transit during the pretreatment patient evaluation (eg
during a whole body I-131 scan ) then it might be worth including measurements in the
pretreatment evaluation of patients, so that additional measures can be taken (such as
administering multiple capsules and/or digestive preparations) to ensure acceptable doses to
the gastric mucosa of these patients.
References
[1] VON SCHUTHESS G.K., SEELENTAG W.W. PFEIFFER G., BLAEUENSTEIN P
AND BEKIER A: I-131 capsules in thyroid therapy: an individually controlled study of
their upatake kinetics as compared to liquid I-131 iodine. Eur J.Nucl Med , 10 :(1985)
25-28.
[2] GARCIA-PENA E., CARAVALHO J, WATKINS J.W., LEIFER ES Esophageal
passage of iodine-131 capsules. J.Nucl Med Technol 25 (1997):55-58.
[3] RINI JN, VALLABHAJOSULA S, ZANZONICO P, HURLEY J.R, BECKER DV,
GOLDSMITH SJ . Thyroid uptake of liquid versus capsule I-131 tracers in patients
treated with liquid I-131. Thyroid 9(1999):347-352.

IAEA-CN-85-219
383
CURRENT TRENDS ON INTERNAL DOSIMETRY FOR PATIENT PROTECTION
IN NUCLEAR MEDICINE
A.M. Rojo, P.A. Gisone, J.J. Kunst
Autoridad Regulatoria Nuclear, Buenos Aires, Argentina
Abstract
The associated risk-benefit analyses in nuclear medicine implicitly performed by the clinician have been
straightforward. Relatively low administered activity activities yield important diagnostic information, the benefit
of which far outweigh any potential risk associated with the attendant normal tissue radiation doses.
Such small risk-to benefit ratios have been very forgiving of possible inaccuracies in dose estimates. With the
ongoing development of new radiopharmaceutical and the increasing therapeutic application of internal
radionuclides, radiation dosimetry in nuclear medicine continues to evolve from population- and organ-average
to patient-specific dose estimation. Patient-specific dosimetry refers to the estimation of radiation dose to tissues
of a specific-patients based on theirs individual body and measured biokinetics rather than an average
antropomorphic model and hypothetic kinetic. The importance of dosimetry specific-patient considers to avoid
the risk of an unsuitable treatment and/or with probability of damage to the patient. This is illustrated by the
dosimetric approaches to radioiodine treatment of hyperthyroidism. The most common prescription algorithm to
fix the activity administered to a hyperthyroid patient does not consider individual parameters that are highly
variable (thyroid uptake, biological half-life, thyroid mass). It arbitrary approach doesn’t permit individually
optimized therapy and it may be inappropriate and even hazardous.
1. Introduccion
Se plantea la importancia de dosimetría especifica del paciente para evitar el riesgo de un
tratamiento inapropiado y/o con probabilidad de daño al paciente. [1] El objetivo es presentar
la tendencia y los desafíos actuales en el campo de la dosimetría interna en medicina nuclear,
dado que la exactitud en el cálculo de la dosis absorbida en los diferentes tejidos y órganos es
la clave para asegurar el beneficio neto en el paciente en especial en la terapia, donde las dosis
en órganos que no constituyen el blanco pueden ser significativas. El algoritmo más común
para la prescripción de la actividad administrada de I 131
a un paciente hipertiroideo no tiene
en cuenta parámetros individuales que son altamente variables (captación tiroidea, período
biológico de semidesintegración, masa de la tiroides). Este protocolo de tratamiento no
permite identificar a aquellos pacientes para quienes la terapia con iodo no es la apropiada y
puede ser dañina.
2. Dosimetría especifica del paciente
La terapia con radionucleídos basada en la dosimetría específica del paciente apunta a
optimizar la dosis. La determinación de la biocinética del radiofármaco en el individuo a partir
de mediciones permite calcular la dosis en el órgano blanco o en el tumor para cada paciente.
[2]
De esta manera la actividad administrada será la apropiada para alcanzar la dosis terapéutica
deseada en el órgano blanco evaluando con mayor exactitud cual es la mayor dosis que puede
alcanzarse en el órgano blanco sin pasar el umbral para evitar efectos biológicos en los tejidos
sanos.
La utilización de actividades diagnósticas del radiofármaco elegido para la terapia
(trazadores), en la etapa previa al tratamiento permite identificar a aquellos pacientes para
quienes el tratamiento será más efectivo y a otros para quienes no será efectivo llegando

IAEA-CN-85-219
384
inclusive a estar contraindicado, por lo tanto en esto último, el esquema de tratamiento con
radiofármacos no es el apropiado. Esto es así especialmente en los casos que presentan una
relación de uptake baja para blanco /no blanco.
El uso de un protocolo estandarizado para la adquisición de datos farmacocinéticos del
paciente para la dosimetría específica permite establecer una correlación entre la dosis
estimada y los efectos clínicos observados.
Los objetivos de la planificación del tratamiento utilizando la dosimetría específica del
paciente son:
1. Adquir datos cuantitativos secuenciados en el tiempo utilizando actividades bajas o
diagnósticas del radiofármaco (o un análogo) para obtener la biodistribución. Con
este propósito se utilizan imágenes provenientes de gamma cámara o de sistemas
tomográficos tales como SPECT (single photon emission computed tomography) o
PET (positron emission tomography).
2. Estimar la dosis en el tumor y otros órganos blanco por unidad de actividad
administrada empleando datos biocinéticos específicos del paciente.
SPECT y PET, aportan datos en tres dimensiones (3D), que podrían usarse
directamente con Monte Carlo u otros algoritmos para obtener un mapeo de dosis
absorbida en 3D. En estos casos puede ser útil el empleo de tomografía computada
con Rx (XCT) o MRI (resonance magnetic imaging) que aportan métodos de
corrección por atenuación y las bases anatómicas para el mapeo de la dosis
absorbida en 3D.
3. Predecir la dosis entregada en la terapia al paciente por extrapolación a partir de los
resultados obtenidos con dosis diagnósticas en función de la actividad
administrada. Sin embargo debe reconocerse que la biocinética con actividades
diagnósticas no suelen ser idénticas con las utilizadas en terapia. Esto puede
suceder cuando al aumentar la actividad administrada se produce el efecto
“STUNNING” o de uptake decreciente.
Este efecto se ha observado en cáncer de tiroides cuando se utilizan actividades
diagnósticas altas.
4. Monitorear la biocinética del radiofármaco durante la terapia para comparar las
predicciones diagnósticas con los resultados observados que permitirá la
verificación de las dosis terapéuticas y la correlación las mismas.
5. Evaluación de la efectividad del tratamiento en la terapia para predecir y en algún
caso evitar posibles futuras complicaciones.
Se consideran histogramas dosis-volumen, probabilidad del control del tumor
(TCP) y probabilidad de complicaciones en tejidos normales (NTCP)
2.1. Cálculo de la dosis absorbida
2.1.1. Factores S. El uso de los valores de S del MIRD basados en individuo estándar puede
introducir errores en el cálculo aún si se corrigieron usando la masa del órgano específica del
paciente. Cuando la distribución de la actividad en los órganos es homogénea, el cálculo de
IAEA-CN-85-219
385
dosis en diagnóstico y terapia es aceptable. Pero la presencia de inhomogeneidades, cuando
los radionucleídos son emisores de baja energía como el Tc99m
, [3] puede llevar a errores
significativos. Los factores S pueden derivarse de fantomas voxelizados obtenidos a través de
tomografías computadas resultando mas realistas que los utilizados por MIRD.[4]
2.1.2. Simulación con Monte Carlo. El método de transporte Monte Carlo es el más exacto,
permitiendo modelar la interacción de fotones y electrones con los datos de distribución de
actividad específicos del paciente con el mapa de atenuaciones.
3. La dosimetría específica del paciente en la terapia del cáncer tiroideo con I 131
Este es un caso donde se pone de manifiesto la relevancia de la dosimetría especifica del
paciente para evitar el riesgo de un tratamiento inapropiado y/o con probabilidad de daño al
paciente.
El algoritmo general para fijar la actividad administrada de I 131
a un paciente hipertiroideo no
tiene en cuenta parámetros individuales que son altamente variables (captación tiroidea,
período biológico de semidesintegración, masa de la tiroides).
Sobre la base de este esquema de tratamiento el 85 % de los pacientes se curan evolucionando
a eutiroidismo o a hipotiroidismo, con una sola administración. El 100 % de los pacientes se
curan pero con repetidas administraciones.
Este protocolo de tratamiento no permite identificar a aquellos pacientes denominados “small
pool” para quienes la terapia con yodo no es la apropiada y puede ser dañina. Estos pacientes
(+/-15 %) presentan un período biológico de semi-desintegración de entre 5 y 10 días (en
contraste con el 85 % con valores de 20 a 25 días) esto resulta en una dosis en tiroides inferior
a la teórica calculada y mayor dosis en sangre por lo tanto si se aumenta la actividad
administrada para lograr el efecto sobre la tiroides se dan 28 mCi en lugar de 3.2 mCi
típicamente administrados. Esto determina una dosis de 1.5 Gy en sangre que resulta
inadmisible para el tratamiento de una enfermedad benigna.
4. Conclusiones
En medicina nuclear son ampliamente utilizados modelos que determinan la dosis promedio
en un órgano pero el apartamiento en cuanto a la biocinética y la anatomía en casos
particulares determina una inexactitud importante. El incremento de los usos terapéuticos de
los radiofármacos junto a la necesidad de cálculos más exactos marcan la tendencia de una
medicina nuclear evolucionando desde el cálculo en un paciente promedio a la estimación de
la dosis específica de cada paciente. El desarrollo de CT, MRI, SPECT Y PET constituyen
herramientas que proporcionan detalles de la anatomía y funcionamiento fisiológico que
informan acerca de la distribución de la retención y excreción de los radiofármacos.
constituyendo un prometedor avance en la exactitud de la dosimetría interna.
La potencialidad de extender la aplicación de las técnicas de Monte Carlo en la dosimetría
interna reemplazando la utilización de modelos matemáticos que limitarían su utilidad a la
protección radiológica en el control ocupacional donde es posible aceptar el margen de error
que tienen asociado fundamentalmente por los valores de dosis involucrados en ese campo,
órdenes de magnitud inferiores respecto de la medicina nuclear.

IAEA-CN-85-219
386
Referencias
[1] ZANZONICO, Pat B., Internal Radionuclide Radiation Dosimetry: A Review of Basic
Concepts and Recent Developments, J Nuc Med 2000; 41:297-308.
[2] STABIN, M.G., Radiation Dosimetry in Nuclear Medicine, Applied Radiation and
Isotopes 50 (1999) 73-87.
[3] MOUNTFORD, P.J.; Risk assessment of the nuclear medicine patient, The British
Journal of Radiology, review article, July 1997.
[4] PHIPS, A., Radiological Protection Bulletin No 215 Septiembre de 1999.

IAEA-CN-85-254
387
INTERNAL RADIATION DOSIMETRY, PHARMACOKINETICS AND
BIODISTRIBUTION OF THE 99mTC LABELED IOR egf/r3
MONOCLONAL ANTIBODY
L.A. Torres, A. Perera, M. Ramos, A. Hernández,
N. Iznaga, M.E. Solano, I. Alvarez, J.L. Rodríguez.
Center for Clinical Research, Havana, Cuba
Abstract
The aim of this work was to assess the internal radiation dosimetry, human pharmacokinetics and biodistribution
of the 99mTc-labeled murine monoclonal antibody (MAb) ior egf/r3, used for diagnosis of epithelial tumors.
Five patients were included in this study. Multiple blood and urine samples were collected and sequential anterior
and posterior whole-body scintigraphies up to 24 hr post-injection were acquired from all patients. The internal
radiation dosimetry was estimated using the methods developed by the Medical Internal Radiation Dosimetry
(MIRD) committee. Raw data were computed from operations between scintigraphic images and regions of
interest (ROI). The residence times of the activity on the source organs were computed to assess the absorbed
dose by 24 target organs. The dosimetric results showed that liver, gallbladder and spleen received the higher
absorbed dose. The computed mean values were 0.69 mGy/MBq, 0.19mGy/MBq and 0.37 mGy/MBq,
respectively. The mean value of effective dose was 1,2E-01 mSv/MBq and the effective equivalent dose was
9,2E-02 mSv/MBq. The Pharmacokinetics and Biodistribution results showed that this compound have a
biexponential plasmatic and blood clearance with a rapid biodistribution phase and a slower elimination phase.
This compound was excreted by the urinary and hepatobiliary systems. Liver was the principal target organ of
this product showing a great retention of the MAb. These dosimetrics results have allowed to use the ior egf/r3
kit in a safe and controlled way.
1. Introduction
Nowadays the cancer of epithelial origin constitutes one of the first causes of death all around
the world. That kind of tumors, like cancer of lung, digestive track, breast and others, have a
10-30-fold expression of the epidermal growth factor receptor (EGFr). On the basis of these
findings, monoclonal antibodies (MAbs) able to recognize the EGFr and to block its kinase
activation, have been developed for the therapy and diagnosis of that kind of tumors [1]. The
99mTc labeled MAb ior egf/r3 developed in the Center of Molecular Immunology have
showed potentiality for the diagnosis of tumors from epithelial origin.
To estimate the value of the antibody it is important to consider not only the detection of the
tumor but also the radiation exposure of the patients. Methods developed by the Medical
Internal Radiation Dose (MIRD) Committee (Loevinger et al, 1988) were used to calculate
mean doses to models representing various organs and tissues in order to allow the evaluation
of the risks associated to the administration of radiopharmaceuticals for diagnostic purposes.
The main aim of this study was to assess the human radiation dosimetry, pharmocokinetics and
biodistribution of the 99mTc- MAb ior egf/r3.
2. Materials and methods
2.1. Patients
The 99mTc-ior egf/r3 was administered to five patients (4 females and 1 male), aged from 58
to 69 years (mean age 63.0±4.2 years). The weight and height mean values were 71.6±14.1 Kg
and 161±66cm, respectively. All patients gave informed consent. Three of them had primary
tumor without treatment and two were suspected of having recurrences after surgery. All

IAEA-CN-85-254
388
lesions were confirmed by biopsy (4 adenocarcinomas of rectum and one carcinoma of annal
canal).
2.2. Monoclonal Antibody Kit and Radiolabeling
The ior-egf/r3 MAb kit contains a highly specific murine IgG2a isotype antibody, which
recognizes human epidermal growth factor receptor (h-EGFr). It was produced in the Center
of Molecular Immunology (Havana, Cuba) by standard hybridoma techniques as previously
described Fernandez et al., 1989 [1]. The freeze dried, sterile and pyrogen free kit was
obtained according to the Schwarz’s method [2,3]. Each vial contained 3mg of MAb. Kits
were labeled with 1.66 GBq of pertechnetate from the 99mMo/99mTc generator (Amertec II,
Amersham, UK) and activity was measured in a dose calibrator (Comp-U-Cal II, Victoreen
Inc, USA.)
2.3. Quality Control and Radiopharmaceutical administration
The labeling efficiency was assessed by ascending chromatography. The samples were applied
on Whatman 3MM 1x10 strips and immediately placed in development tanks. After that, the
strips were dried and the distribution of activity was determined using a ratemeter (SR8,
Nuclear Enterprises, UK). The radiopharmaceutical was injected intravenously through an
antecubital vein. The administrated dose was 1485.1 ± 86.3 MBq (mean ± SD).
2.4. Pharmacokinetics and excretion analysis
Following intravenous injection, 3-4 ml of blood samples were collected from an antecubital
vein opposite to the injection side at different time intervals. A bi-compartmental model was
applied in order to perform the pharmacokinetics analysis. Complete urine samples were also
collected up to 24 hrs post injection [4]. The radioactivity in blood, plasma and urine (0.3 ml)
samples in duplicate was determined using a ratemeter (SR8, Nuclear Enterprises, UK) and
expressed as a percentage of administered activity. Appropriate corrections were made for
decay with time of injection as reference time.
2.5. Imaging
Whole body images were performed using a Sophy Gamma Camera (Sopha Medical inc.,
Canada) fitted with a low-energy high-resolution, diverging parallel-hole collimator to increase
the lateral viewing aspect. Anterior and posterior whole-body images were acquired using a
20% window centered on the 140 keV emission from 99mTc at 10 min, 1, 3, 5 and 24 hr post-
injection using a gantry speed of 20 cm/min. All whole-body images were stored on the
computer in 2048x512 word mode matrix.
2.6. Biodistribution and dosimetry
All images were processed in a SOPHY-20P system. The geometric mean of anterior and
posterior images was obtained. Regions of interest (ROI) were drawn over heart, liver, spleen,
bladder, upper large intestine (ULI) and low large intestine (LLI), which were considered as
the source organs and total counts were computed. Whole body and source organs activity was
expressed as percent of the total administered activity remaining in each one at selected time
intervals. The MIRD Committee method for determining absorbed dose was used [5,6]. The
time-activity curves for each source organ and the remainder of the body tissues were
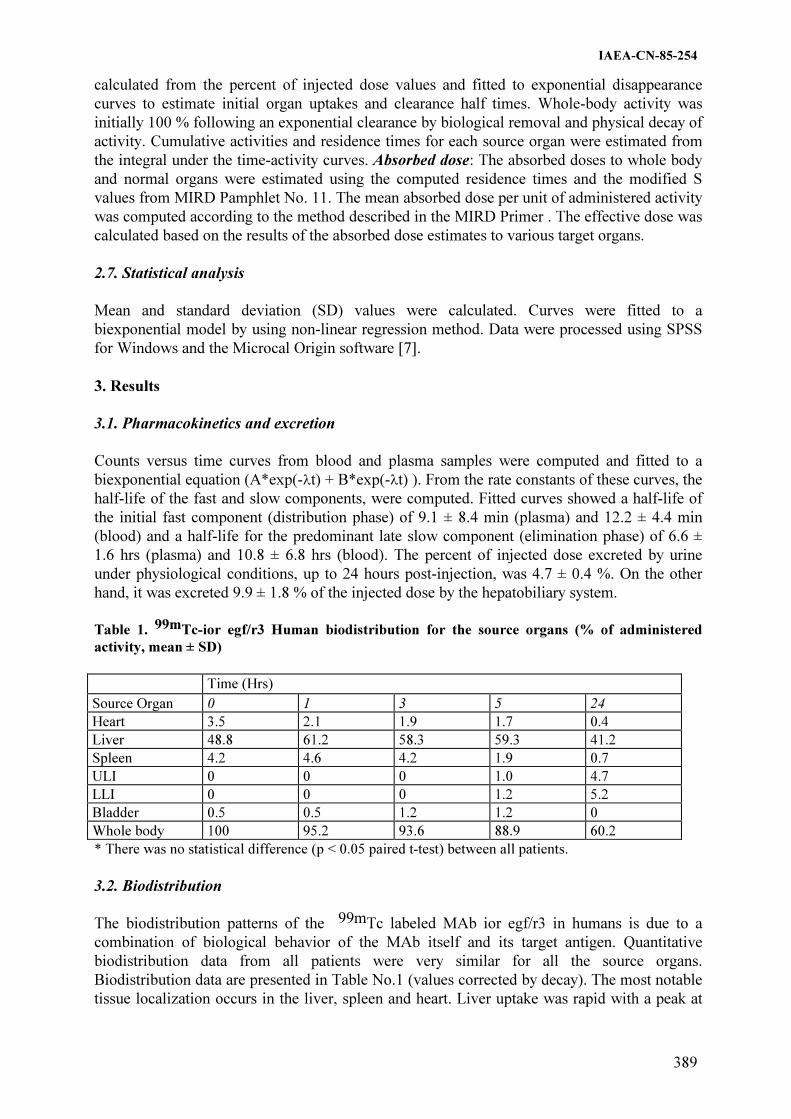
IAEA-CN-85-254
389
calculated from the percent of injected dose values and fitted to exponential disappearance
curves to estimate initial organ uptakes and clearance half times. Whole-body activity was
initially 100 % following an exponential clearance by biological removal and physical decay of
activity. Cumulative activities and residence times for each source organ were estimated from
the integral under the time-activity curves. Absorbed dose: The absorbed doses to whole body
and normal organs were estimated using the computed residence times and the modified S
values from MIRD Pamphlet No. 11. The mean absorbed dose per unit of administered activity
was computed according to the method described in the MIRD Primer . The effective dose was
calculated based on the results of the absorbed dose estimates to various target organs.
2.7. Statistical analysis
Mean and standard deviation (SD) values were calculated. Curves were fitted to a
biexponential model by using non-linear regression method. Data were processed using SPSS
for Windows and the Microcal Origin software [7].
3. Results
3.1. Pharmacokinetics and excretion
Counts versus time curves from blood and plasma samples were computed and fitted to a
biexponential equation (A*exp(-�t) + B*exp(-�t) ). From the rate constants of these curves, the
half-life of the fast and slow components, were computed. Fitted curves showed a half-life of
the initial fast component (distribution phase) of 9.1 ± 8.4 min (plasma) and 12.2 ± 4.4 min
(blood) and a half-life for the predominant late slow component (elimination phase) of 6.6 ±
1.6 hrs (plasma) and 10.8 ± 6.8 hrs (blood). The percent of injected dose excreted by urine
under physiological conditions, up to 24 hours post-injection, was 4.7 ± 0.4 %. On the other
hand, it was excreted 9.9 ± 1.8 % of the injected dose by the hepatobiliary system.
Table 1. 99mTc-ior egf/r3 Human biodistribution for the source organs (% of administered
activity, mean ± SD)
Time (Hrs)
Source Organ 0 1 3 5 24
Heart 3.5 2.1 1.9 1.7 0.4
Liver 48.8 61.2 58.3 59.3 41.2
Spleen 4.2 4.6 4.2 1.9 0.7
ULI 0 0 0 1.0 4.7
LLI 0 0 0 1.2 5.2
Bladder 0.5 0.5 1.2 1.2 0
Whole body 100 95.2 93.6 88.9 60.2
* There was no statistical difference (p < 0.05 paired t-test) between all patients.
3.2. Biodistribution
The biodistribution patterns of the 99mTc labeled MAb ior egf/r3 in humans is due to a
combination of biological behavior of the MAb itself and its target antigen. Quantitative
biodistribution data from all patients were very similar for all the source organs.
Biodistribution data are presented in Table No.1 (values corrected by decay). The most notable
tissue localization occurs in the liver, spleen and heart. Liver uptake was rapid with a peak at

IAEA-CN-85-254
390
1h post-injection (61.2%) and a great retention (T½ eff = 5.3 hr, T½ Biol.= 45.0 hr) because of
the high number of human epidermal growth factor receptors (hEGFr) present in it. The ULI
and LlI were found as source organs due to the hepatobiliary system is the most important
excretion way of this compound. Approximately 60.2% of the injected MAb remain in the total
body at 24 hr postinjection, showing an effective and biological half-life of 5.61 and 84.8 hrs
respectively.
3.3. Internal Radiation Dosimetry
The radiation dosimetry calculations were made using the residence times obtained from the
biodistribution data. The assessed absorbed dose of 24 target organs and the effective dose
after the injection of the Labeled MAb ior egf/r3 are presented in Table 2. The liver (0.69
mGy/MBq), the gallbladder wall (0.19mGy/MBq) and the spleen (0.37 mGy/MBq) received
the highest absorbed doses. The effective dose and the equivalent effective dose were of 0.12
and 0.092 mSv/MBq respectively. Liver was the principal contributor organs to the absorbed
dose per organ.
Table 2. Normal organ dosimetry for the labeled mAb
99mTc-ior egf/r3 (mGy/MBq)
TARGET ORGANS Patient 1 Patient 2 Patient 3 Patient 4 Patient 5 Average
Adrenals 0,0959 0,1220 0,1230 0,1290 0,0758 0,1100
Gallbladder Wall 0,1780 0,2120 0,1970 0,2380 0,1350 0,1900
LLI Wall 0,1270 0,0475 0,1330 0,0999 0,0452 0,0910
Small Intestine 0,0481 0,0537 0,0751 0,0554 0,0304 0,0530
ULI Wall 0,0967 0,0753 0,2240 0,1040 0,0432 0,1100
Heart Wall 0,0836 0,0964 0,0981 0,0935 0,0739 0,0890
Kidneys 0,0683 0,0897 0,1030 0,0923 0,0556 0,0820
Liver 0,6630 0,7680 0,6550 0,9020 0,4690 0,6900
Red Marrow 0,0270 0,0382 0,0363 0,0328 0,0218 0,0310
Spleen 0,1050 0,2230 1,1100 0,2500 0,1840 0,3700
Urine Bladder Wall 0,0581 0,0883 0,0945 0,0996 0,0516 0,0780
Total Body 0,0434 0,0577 0,0560 0,0560 0,0333 0,0490
EFF DOSE EQ. 0,0943 0,1170 0,1730 0,1270 0,0731 0,1200
EFF DOSE 0,0848 0,0907 0,1280 0,1030 0,0554 0,0920
4. Conclusions
The pharmacokinetics and biodistribution of 99mTc-labeled Monoclonal Antibody ior egf/r3
have shown that this compound has a biexponential blood and plasmatic clearance with a
rapid biodistribution phase and a slower elimination phase. Liver is the target organ of this
product and presented an uptake peak at 1hr post-injection with a high retention. The
dosimetric results showed that liver, gallbladder and spleen received the higher absorbed
doses and it were also reported these values for 24 target organs. These results allow to use
this radiopharmaceutical in a safe and controlled way.

IAEA-CN-85-254
391
References
[1] Fernández, A.; Pérez, R.; Macias, A.; Velandia, A.; Alvarez I., Ramos, M. and Veloso,
A. (1989).
[2] Generación y caracterización primaria de anticuerpos monoclonales contra el receptor
del factor de crecimiento epidérmico. Interferón y Biotecnología, 6(3), 289.
[3] Mather, S. J. and Ellison, D. (1990). Reduction-mediated ttechnetium-99m labeling of
monoclonal antibodies. J. Nucl. Med. 31, 692.
[4] Schwarz, A. and Steinstrasser, A. (1987). A novel approach to Tc-99m-labeled
monoclonal antibodies. J. Nucl. Med. 28, 721 (abstract).
[5] Yamaoka, K.; Nakagawa, T.; Uno, T. et al. (1978). A nonlinear multiple regression
program, MULT(2)(Bayes), based on a Baye(s) algorithm for microcomputers. J
Pharmacobio Dyn 8: 246-256.
[6] Snyder, WS.; Ford, MR. et al. (1975). "S" absorbed dose units cumulated activity for
selected radionuclides and organs. MIRD pamphlet no. 11. New York: Society of
Nuclear Medicine.
[7] Loevinger, RL.; Budinger, TF; Watson EE.(1988). Eds. MIRD primer for absorbed dose
calculations. New York: Society of Nuclear Medicine.
[8] Yamaoka, K.; Nakagawa, T.; Uno, T. (1978). Statistical moments in pharmacokinetics.
J Pharmacokin Biopharmaceutics 6: 547-558.
IAEA-CN-85-267
392
A PROTOCOL TO DETERMINATE THE SITUATION OF NUCLEAR MEDICINE
IN VENEZUELA, 1999–2000
L. Carrizales, G. Leandro
Laboratorio Secundario de Calibración Dosimétrica, Unidad de Tecnología Nuclear,
Instituto Venezolano de Investigaciones Científicas,
Caracas, Venezuela
Abstract
This paper present preliminaries results and the methodology followed for the implementation of a Protocol that
included -Radiological Protection and -Quality Control at SPECT Systems in two important public hospitals at
República Bolivariana de Venezuela. We found in these inspections that the main problems were the lack of
medical physicist capacity in nuclear medicine that implemented programs of quality assurance as well as
radiation protection in these departments.
1. Introducción La República Bolivariana de Venezuela recientemente adoptó como Norma el Informe de Colección de Seguridad 115 del OIEA, el cual recomienda que cada país implante Programas de Garantía de Calidad a fin de optimizar la Práctica de la imaginología en general. Dado lo ambicioso, extenso y costoso de esta empresa y que, por otro lado, Venezuela carece de Físicos Médicos especializados en el área de la Medicina Nuclear que impulsen Programas de Control de Calidad para verificar el funcionamiento de los sistemas de imagen, así como también, de la optimización de los procesos de Protección Radiológica en la manipulación de fuentes radiactivas abiertas. Nos hemos dado a la tarea de desarrollar un protocolo de inspección de Seguridad Radiológica y un Protocolo de Control de Calidad de las unidades de medicina nuclear, basados en protocolos y recomendaciones internacionales pero adaptados a nuestra realidad, para poder estimar mediante su aplicación y análisis de los resultados obtenidos, la situación actual de dichas instalaciones en nuestra Nación. Como primera etapa de este proyecto hemos aplicado dichos protocolos a dos importantes instituciones públicas, como comienzo para que los titulares responsables de las mismas tomen conciencia de la abrumadora necesidad de implantar Programas de Garantía de Calidad en dichos servicios en un futuro inmediato el cual incluya aspectos tales como una capacitación más profunda y rigurosa en lo que a la Práctica con fuentes radiactivas abiertas de actividades bajas y medias se refiere.
2. Metodología Durante aproximadamente cinco meses se llevó a cabo una exhaustiva revisión bibliográfica la cual involucró la selección de las pruebas que consideramos determinantes para verificar la situación desde el punto de vista de protección radiológica así como para determinar el funcionamiento de las unidades SPECT. Previa la implantación de dichos protocolos se realizaron múltiples ensayos para verificar la exactitud y objetividad de los mismos.

IAEA-CN-85-267
393
3. Resultados
Tabla I. Aplicación del Protocolo para la Inspección de Seguridad Radiológica. [1-10]
PROTOCOLO DE SEGURIDAD RADIOLÓGICA
Prueba INSTITUCIÓN A INSTITUCIÓN B
Existencia de
detectores de
radiación
No cuentan con detectores de contaminación
superficial, ni con monitores de radiación. (CI)
No cuentan con detectores de contaminación
superficial, monitores de radiación, ni activímetro.
(CI).
Activímetro Aceptable, aún cuando NO se pudo realizar la
prueba de linealidad ya que parte del personal del
servicio argumentó que el control de calidad no
podía ser oneroso.
NA
Sala de espera No hay un baño exclusivo para los pacientes
inyectados con radiofármacos. Utilizan el baño
común de la sala de espera (CI)
Todos los pacientes y familiares permanecen
juntos en la sala de espera, período que puede
extenderse hasta dos horas. (CI)
No hay un baño exclusivo para los pacientes
inyectados con radiofármacos. Utilizan el baño
común de la sala de espera (CI)
Todos los pacientes y familiares permanecen juntos
en la sala de espera, período que puede extenderse
hasta dos horas. (CI)
Radiofármacos
Utilizados
99MTc (10 MBq, administración oral e intravenosa. 131I (20 MBq, administración intravenosa y 200
MBq, por vía oral), 67Ga, 153Sm.
Están debidamente identificados y su
almacenamiento se realiza en el cuarto caliente
pero no hay bitácora de recepción. (CI)
99MTc (10 MBq, administración oral e intravenosa. 131I (20 MBq, administración intravenosa y 200
MBq, por vía oral), 67Ga, 153Sm.
Están debidamente identificados y su
almacenamiento se realiza en el cuarto caliente pero
no hay bitácora de recepción. (CI)
Inspección general
Se informa al paciente sobre su tratamiento pero los
cuidados que debe tener en casa no se le
suministran por escrito. (CI))
Llevan registro de las actividades de los
radiofármacos utilizados. (C)
Están delimitadas y señalizadas las zonas de
permanencia para el POE y pacientes. (C)
No se admiten embarazadas en el servicio. (C)
No hay cuarto habilitado para descontaminación del
POE. (CI)
No hay lámparas de emergencia, ni extintores de
incendio(. (CI)
No hay procedimientos de emergencia para
contaminación, ni para siniestros (incendios,
inundaciones, o terremotos, etc. (CI)
No llevan un registro de desechos. Sin embargo, los
mismos se almacenan en el cuarto caliente, bajo la
campana extractora, clasificándolos según el tipo de
radiofármaco, y esperan hasta siete vidas ½ antes de
su disposición en la basura común. (A)
No se pudo comprobar la integridad de los filtros de
la campana.
En las áreas de manipulación de material radiactivo
no se ingieren alimentos, líquidos, ni se fuma. (C)
La Institución no cuenta con tanques de triple
decantación para los desechos líquidos producidos
en el servicio, ni para las excretas de los pacientes
hospitalizados por administración de radiofármacos.
(CI)
Se informa al paciente sobre su tratamiento pero los
cuidados que debe tener en casa no se le suministran
por escrito. (CI))
El registro de las actividades de los radiofármacos
utilizados comenzó en Agosto del 2000. (C).
Están delimitadas y señalizadas las zonas de
permanencia para el POE y pacientes. (C)
No se admiten embarazadas en el servicio. (C)
No hay cuarto habilitado para descontaminación del
POE. (CI)
No hay lámparas de emergencia, extintores de
incendio, extractor, ni campanas. (CI)
No hay procedimientos de emergencia para
contaminación, ni para siniestros (incendios,
inundaciones, o terremotos, etc. (CI)
No llevan un registro de desechos. Tampoco tienen
una gestión para los mismos, ya que son dispuestos
directamente a la basura común después de cada
jornada de trabajo. (CI)
En las áreas de manipulación de material radiactivo
se ingieren alimentos y líquidos. Se constató la
presencia de frutas en el refrigerador del cuarto
caliente donde también se almacena 131I. (C)
La Institución no cuenta con tanques de triple
decantación para los desechos líquidos producidos en
el servicio, ni para las excretas de los pacientes
hospitalizados por administración de radiofármacos.
(CI)

IAEA-CN-85-267
394
Cuarto caliente Iluminación aceptable. No tienen lámpara de
emergencia. (CI)
Paredes pintadas con pintura soluble en agua. (CI)
Piso de linóleo, pero sin bordes redondeados, ni
sumideros. (CI)
Techos de cielo raso. (CI). Sin extractor, pero con
campana. (C)
Puertas de madera. (CI)
Mesón de fórmica, sin bordes redondeados, en su
superficie está el generador en uso, y la L plomada
de 50 mm de espesor, a menos de medio metro de
distancia de éste se encuentra el Activímetro. (CI)
Tienen lavamanos de seguridad. (C)
Durante la Práctica no siempre usan papel
absorbente para cubrir las superficies del mesón y
L plomada. (CI)
No trabajan con jeringas plomadas ni pipetas
automáticas. (CI)
Además de la campana extractora tienen una caja
de guantes para manipulación de radioisótopos.
(C)
No hay refrigeradores, ni otros implementos ajenos
a la Práctica. (C)
No usan jabón de PH neutro. Pero usan sustancias
para descontaminar, aunque para el momento de la
inspección el personal no estaba al tanto. (CI)
Iluminación aceptable. No tienen lámpara de
emergencia. (CI)
Paredes pintadas con pintura soluble en agua. (CI)
Piso de granito, sin bordes redondeados, ni
sumideros. (CI)
Techos de cielo raso y sin extractor. (CI)
Puertas de madera. (CI)
Mesón de cerámica, sin bordes redondeados, en su
superficie está el radiofármaco utilizado dentro del
castillete plomado, y la L plomada de 50 mm de
espesor. (CI)
El lavamanos no es de seguridad. (C)
Durante la Práctica usan papel absorbente para cubrir
las superficies del mesón y L plomada. (CI)
Usan jeringas plomadas, algunas estaban
contaminadas para el momento de la inspección. No
usan pipetas automáticas (CI).
Hay múltiples utensilios ajenos a la Práctica tal como
una cafetera, la cual se sacó de inmediato de dicho
recinto. (CI)
Hay un refrigerador dentro del cual se encontraron
alimentos, y se almacenaba 131I. (CI)
No usan jabón de PH neutro, ni sustancias para
descontaminar. (CI)
Metodología de
descontaminación
de áreas
No tienen ningún manual de procedimientos en caso
de contaminación. Para el momento de la
inspección se le derramó a una paciente 131I y la
única medida que se tomó fue colocar un papel
absorbente sobre la contaminación.
No tienen ningún manual de procedimientos en caso
de contaminación. Para el momento de la inspección
se le derramó a un paciente 131I que contaminó la bata
del Dr. Que realizó la administración, y en los frotis
tomados en áreas de 10 cm2, se encontró por ejemplo
una contaminación removible de 75875 Bq.
Pacientes
hospitalizados
Cuarto señalizado y visitas prohibidas. (A)
No hay monitoreo de ropa de cama ni la del
paciente, no hay procedimientos de manipulación
de excretas. (CI)
Dependiendo de la actividad administrada se le da
de alta, p ejem si se le administra 200 MBq
permanece de 4 a 7 días. (C)
Cuarto señalizado y visitas prohibidas. (A)
No hay monitoreo de ropa de cama ni la del
paciente, no hay procedimientos de manipulación de
excretas. (CI)
Dependiendo de la actividad administrada se le da de
alta, p ejem. si se le administra 200 MBq permanece
de 4 a 7 días. (C)
Personal
Ocupacionalmente
expuesto
No cuentan con dosimetría personal. (CI)
No todos usan guantes durante la manipulación del
material radiactivo pues hay alérgicos, y no todos
usan batas. (CI)
No cuentan con dosimetría personal. (CI)
Todos usan guantes y batas durante la manipulación
del material radiactivo. (C)
Control de
contaminación
radiactiva
Se realizaron múltiples frotis de 10 cm2 de área
con papel de filtro en diversas áreas del cuarto
caliente y del Servicio en general, así como
también en la ropa del POE. Dichos frotis se
analizaron con un espectrómetro de (Na-Tl) al cual
se le estableció un límite de detección de 5 Bq, se
encontró contaminación radiactiva removible en: -
Interior de la L plomada (41 Bq), -Manos y lentes
de la Dra (5,8 Bq), -Superficie del mesón (7 Bq).
Vale la pena resaltar que estos frotis no fueron
tomados el día que ocurrió el derrame de 131I.
El día que ocurrió la contaminación de 131I, se
realizaron múltiples frotis de 10 cm2 de área con
papel de filtro en diversas áreas del cuarto caliente y
del Servicio en general, así como también en la ropa
del POE. Dichos frotis se analizaron con un
espectrómetro de (Na-Tl) al cual se le estableció un
límite de detección de 5 Bq, se encontró
contaminación radiactiva removible en: -Bata del Dr
(541 Bq), -Piso y puerta del cuarto caliente (75875
Bq y 6 Bq) respectivamente, -L plomada (31905 Bq),
-Navaja (316 Bq), -Asa del refrigerador (11 Bq), -
Zapatos del personal que estuvo involucrado (6 y 42
Bq)
Leyenda: (A) Aceptable; (C) Correcto; (CI) Condición Insegura; (POE) Personal Ocupacionalmente Expuesto; (NA) No
Aplica

IAEA-CN-85-267
395
Tabla II. Aplicación del Protocolo para la Inspección de Control de Calidad. [1-10]
PROTOCOLO PARA LA INSPECCIÓN DE CONTROL DE CALIDAD EN DOS SISTEMAS SPECT
Prueba SISTEMA SPECT A SISTEMA SPECT B
Inspección mecánica La salida del aire acondicionado está ubicado sobre la
gammacámara. (CI)
La salida del aire acondicionado está ubicado sobre la
gammacámara. (CI)
El Gantry está desnivelado desde el momento de la
instalación. (CI)
Inspección eléctrica Correcto El sistema de rotación de la Gammacámara tiene un micro
interruptor invertido que paraliza la máquina en el sentido anti-
horario. (CI)
Inspección
colimadores
Desde su instalación la empresa de mantenimiento tiene en
su poder el dispositivo que permite operar la máquina sin
colimadores, sin ello no se pueden realizar las pruebas
intrínsecas del sistema. (CI)
Correcto
Inspección software Aleatoriamente las imágenes adquiridas presentan líneas en
los ejes X y Y
Correcto
Sistema de rotación Valor medio de las desviaciones del centro de rotación:
1,1 cm. (CI)
Desviación del centro de rotación estimada en el centro y
en el borde del campo de visión: 1,3 cm. (CI)
Se corrigió durante la inspección por software
Levemente fuera de tolerancia debido al desnivel de la base de
la gammacámara.
Tolerancia El valor medio de las desviaciones del centro de rotación deben ser menores de 2 mm
La desviación del centro de rotación estimada en el centro y en los bordes del campo de visión no deben diferir entre sí en
más de 2 mm
Uniformidad
intrínseca
CTVU CCVU CTVU CCVU
27.69 % (FT) 9,31 % (FT) 7,55 % (C) 5,57 % (FT)
21.54 % (FT) 7, 31 % (FT) 4,41 % (C) 2,87 % (C)
Tolerancia Las uniformidades para el CTVU no deben exceder el 20 % y para el CCVU el 5% intrínseca no debe superar el 5%
Uniformidad
extrínseca
CTVU CCVU CTVU CCVU
9.96 % (C) 9,83 % NR NR
8.07 % (C) 8,07 % NR NR
Tolerancia La uniformidad extrínseca no debe superar el 5 %
Tasa Máxima de
Conteo
35 kCuentas/s
No existen valores de referencia
225 kCuentas/s
No existen valores de referencia
Tolerancia No permitir una variación máxima de un 10 % respecto a los valores de referencia
Resolución
Temporal
Correcto
No existen valores de referencia
Correcto
No existen valores de referencia
Tolerancia No permitir una variación máxima de un 10 % respecto a los valores de referencia
Resolución Espacial Para el momento de la inspección no se pudo acceder al
software para el análisis de la imagen obtenida
Correcto
No existen valores de referencia
Tolerancia Iniciar acciones correctivas cuando el valor de FWMH sea mayor de 20% o más, respecto al valor de referencia
Linealidad Espacial Se realizó la prueba y se obtuvieron valores que sugieren
comportamientos aceptables pero No existen valores de
referencia para hacer la comparación
Se realizó la prueba y se obtuvieron valores que sugieren
comportamientos aceptables pero No existen valores de
referencia para hacer la comparación
Tolerancia Analizar visualmente la imagen obtenida, las mismas deben comparase con las de referencia para determinar si existen
desviaciones importantes en las direcciones X y Y.
Prueba de
funcionamiento del
SPECT con maniquí
JACKSACK
En general en las imágenes obtenidas se observó una buena
resolución en los bordes de las esferas. Además, se
visualizó claramente la falta de uniformidad del sistema.
No existen valores de referencia para hacer la comparación
En las imágenes obtenidas se observó el efecto del desnivel de
la base de la Gammacámara que no permite resolver
apropiadamente los bordes de las esferas. Por otra parte fue
imposible visualizar los objetos pequeños.
No existen valores de referencia para hacer la comparación
Tolerancia Analizar artefactos circulares que indique problemas de uniformidad, si el sistema presenta problemas de centrado o
problemas con la ventana de energía. Las imágenes obtenidas rutinariamente deben compararse con los valores de
referencia.
Leyenda: (A) Aceptable; (C) Correcto; (FT) Fuera de Tolerancia. (NR) No realizado
4. Conclusiones Si bien hasta los momentos solo se han realizado dos inspecciones completas de las seis que nos tenemos planteadas, los resultados obtenidos de la aplicación de los mencionados Protocolos, en las instituciones inspeccionadas demuestran de una manera clara y contundente

IAEA-CN-85-267
396
la necesidad de establecer Programas rutinarios de control de calidad tanto en el aspecto de protección radiológica como del equipamiento empleado en los Departamentos de medicina nuclear. Además, demuestran que los mismos representan una fase primordial dentro de un Programa de Garantía de calidad tanto para el paciente como para el personal ocupacionalmente expuesto y permitirán demostrar a las autoridades competentes la urgente necesidad de implantar dichos Programas en el ámbito nacional. Agradecimientos
.- Hospital Dr. Domingo Luciani en especial a la Dra. Yadelis Aguilar por la importancia que le dio a éste difícil proyecto, por su paciencia y compañía durante la aplicación de los protocolos. Así como por prestarnos los maniquíes para realizar el Protocolo de Control de Calidad en otras Instituciones.
.- Hospital Universitario de Caracas en especial a la Dra. Aixa Manzo y a la TSU Corina Herrera por su invaluable colaboración.
.- Lic. Juan Díaz, Lic. Orlando Cabrera y Lic. Miguel Rodríguez por su asesoría, y por sus valiosos y continuos comentarios para llevar a acabo esta investigación.
.- Dr. Federico Gutt por su apoyo en la logística para poder solventar tantos inconvenientes.
.- Servicio de Radiofísica Sanitaria del IVIC por el prestarnos el detector portátil para contaminación superficial y permitirnos usar el detector de (NaI-Tl) para el análisis de los frotis.
.- Ing. Gustavo Rodríguez de la empresa MEDITRON por su asesoría en la operación de la máquina.
A Todos mil gracias por creer en nosotros y ayudarnos en colocar este granito de arena que poco a poco irá transformando en realidad el sueño que tanto añoramos: “La optimización de
nuestros servicios de imaginología mediante Programas de Garantía de Calidad”.
Referencias
[1] BAIRI B, SINGH B, RATHOD N, NARURKAR P. Handbook of Nuclear Medical Instruments Tata McGraw-Hill Publishing Co. Ltd, 1994.
[2] BORRAS C. Organización, Desarrollo, Garantía de Calidad y Radioprotección en los Servicios de Radiología, Imaginología y Radioterapia. Washington; OPS/OMS, (1997).
[3] BUSEMAN E. Quality Assurance in Nuclear Medicine Imaging: Hardware and Software Aspects. Amsterdam, (1992).
[4] CABREJAS, M. et., al., Tomografía en Medicina Nuclear. Comité de Instrumentación y Garantía de Calidad del ALASBIMN. (1999).
[5] Control de Calidad de los Instrumentos de Medicina Nuclear, IAEA. TECDOC-602/S. 1991 .Ed en español , (1996).
[6] KING M ZIMMERMAN R, LINKS J. Imaging Hardware and Software for Nuclear Medicine. AAPM Proceedings No 6. (1998).
[7] PALMER E, SCOFF J, STRAUSS H. Practical Nuclear Medicine. W. B. Saunders Co., Philadelphia, (1992)
[8] Performance Measurements of Scintillation Cameras. NEMA Standards Publication NU 1-1994.
[9]. RAABE, O. Internal Radiation Dosimetry. Health Physics Society. Medical Physics Publishing, Madison, Wiscosin, (1994).
[10] TÉLLEZ. M. et., al., Protocolo Nacional de Control de calidad en la Instrumentación en Medicina Nuclear. SEFM. (1999).

IAEA-CN-85-164
397
PARAMETER ESTIMATION AND COMPARTMENTAL
MODELLING FOR INDIVIDUALIZATION OF THERAPEUTIC
DOSAGE OF RADIOPHARMACEUTICALS
A. Giussani, C. Cantone
Universita' degli Studi di Milano, Dipartimento di Fisica, Sezione di Fisica Medica,
Milan, Italy
Abstract
A successful application of radiopharmaceuticals for therapy requires a patient-specific optimization of the
administration activity. Intention of this contribution is to show how this is possible with a relatively limited
effort, by combining an optimized experimental schedule for the collection of the anatomic and physiological
data of interest and a rigorous mathematical analysis. The benefits of such an optimization will concern not only
the success of the therapy, but also the radiological protection of the patients and could even be translated in a
more cost-effective usage of the radiopharmaceutical available.
1. Introduction
The therapeutic use of radiopharmaceuticals requires generally the administration of relatively
large activities. A realistic dosimetric evaluation is therefore desirable in the effort to optimize
the dose to the target organ while sparing the healthy tissues.
The determination of internal dose is however a rather complicated process, which requires
the knowledge of several pieces of information: the anatomical features of the irradiated
regions, the fractional uptake of the administered substance into these tissues with the
characteristic retention times, as well as the kinetics of the excretion process, in order to be
able to estimate the dose burden to the organs of the gastroinestinal and of the urinary tracts.
Since the anatomical and biokinetic parameters may differ remarkably between subjects, the
evaluation of the correct treatment strategy should be performed on an individual basis.
However, the performance of preliminary measurements aimed at the determination of the
physiological parameters for each individual undergoing therapy could be a significant
complication for the daily routine of an ordinary Nuclear Medicine Service.
It is therefore desirable to devise easy methods for the individualization of the radiometabolic
treatment.
2. Patient-specific dose: a case study
Let's consider patients with autonomous thyroid nodule (ATN) being treated with 131
I. In these
subjects, the uptake of the radiopharmaceutical in extranodular tissue might be relevant, and it
is in fact considered responsible of the relatively high prevalence of hypothyroidism occurring
after treatment [1]. In this specific case, a correct knowledge of the anatomy of the regions
involved, of the fractional uptake into the nodule and into the healthy lobe and of the
elimination from these tissues may provide a reliable estimate of the dose received by each of
them. On this basis, the activity to administer to each ATN patient may be determined, and the
corresponding dose to the extranodular tissue evaluated, thus providing the clinician a patient-
specific picture for the evaluation of the possible consequences of the therapy.

IAEA-CN-85-164
398
Matheoud et al. [2] have studied sixteen patients with ATN, estimating thyroid morphological
parameters and iodine kinetics from images of the neck taken at 6 different times between 2
and 120 hours after injection of a tracer activity of 123
I. Thyroid uptake in the nodule and in
the lobe respectively were obtained by fitting the uptake function
� �tt
ineff
in0 effin eeU
)t(U����
����
�� (1)
to the corresponding data set in order to obtain the values of unknown parameters U0 (the
fraction of administered iodine transferred to the nodule and the lobe respectively), �in (rate of
uptake) and �eff (effective decay constant, which is the sum of the rates of biological decay
and of radioactive decay).
Recalling that the dose to the nodule and to the lobe can be estimated using the MIRD formula
[3]:
��
����
0 eff
00
0
SUAdt)t(UASSA
~D (2)
being S the mean absorbed dose per unity cumulated activity A~
, it was possible from (2) to
determine the activity A0 to be administered in order to release in the nodule the desired dose
D . Consequently, the corresponding radiation dose to the healthy extranodular tissue were
evaluated. The parameters, and therefore the optimum dosages required by each subject,
showed a great variability, and this fact stresses the importance of tools which enable to
individualize the treatment planning.
The possibility of reducing the number of image acquisitions to only 3 was also investigated,
in order to make the procedure more easily applicable in the routine. The estimates for the
optimum dosage calculated with the 3-point technique deviate in all cases but one less than
5% from those obtained from the 6-point-technique. The deviations of the dose to the lobe are
slightly higher, however they never exceed 15%. The ordinary method with only one uptake
measurement at 24 hours with a supposedly known dismission rate provides on the contrary
estimates differing up to 70% from the more correct ones obtained with the 6-point-method.
The data collected as described above can also be analyzed according to a simple
compartment model, like the one shown in Figure 1.
The model tries to give a comprehensive description of the processes involved: the injected
activity is distributed between the nodule, the lobe and the rest of the body, and then it is
eliminated through the renal pathway. The exchange of material between compartments is
considered to be regulated by a first-order kinetics. Under this assumption, this system
provides for the compartments nodule and lobe equations which are mathematically
equivalent to (1), where now the �'s are combinations of the model parameters kij. For
example, �in = k21+k31+k41 for lobe and nodule (and also for compartment 4), that is �in
assumes the same numerical value. Indeed, for each patient, the �in found with the single fit
procedure turned out to assume values which can be considered equivalent within the
uncertainties.

IAEA-CN-85-164
399
The analysis of data with compartmental models is no more complicated than single curve
fits. PC-based easy-to-use software packages are available on the market (i.e. SAAM�,
Modelmaker§). They enable to define a model, to associate the experimental data (e.g., the
uptake measurements in the nodule and in the lobe) to the corresponding model prediction, to
find the best values of the characteristic parameters by means of a least-square fitting
procedure of the whole set of data simultaneously, and also to perform calculations (e.g., the
cumulated activity) without the need to derive the analytical mathematical expression (which
for complex models can be quite difficult to derive). The advantage to use a model is that it
provides a physiologically more realistic picture of the distribution of the drug in the organs,
and it may enable a more correct evaluation of the dose to other organs which are not directly
involved in the therapy.
FIG. 1. Model for the kinetics of 131
I in ATN patients
For example, the data of the nodule and lobe uptake will enable to derive for each patient the
values of the parameters k21, k31, k52 and k53. By assuming for the parameter k54 (elimination
from the compartment "rest of the body") a value of 0.087 h-1
, as suggested by ICRP [4], and
by taking the process of radioactive decay into consideration, it is then possible to calculate,
for each patient, the activity cumulated in the urinary bladder, and thus obtain a more realistic
estimate of the dose to this organ and to the sorrounding ones. Even more, as often the urine
excreted by the patients in the first hours or day is collected in the hospital for safety reason, it
is possible to perform measurements of the amount of drug excreted and use these additional
data for the model fitting. Although the dose to the bladder and the sorrounding organs is
usually not relevant for the justification and optimization of the therapy, its determination can
be in any case of use and also be recorded for any follow-up of the patients.
� SAAM Institute Inc., Seattle, USA § Cherwell Scientific, Oxford, UK
k21 k41
1
blood
2
nodule
3
lobe
4
rest of the body
5
urinary bladder
k53
k05
k52 k54

IAEA-CN-85-164
400
3. Conclusions
As this simple example shows, the improvement and individualization of a treatment planning
may be obtained with a relatively limited effort combining an optimized experimental
schedule and a rigorous although simple mathematical analysis. The advantages of such effort
will be reflected not only in the success of the therapy, but also in the radiological protection
of the patients and even in a more rational and cost-effective use of the resources (i.e., of the
radioactive material) available in a Nuclear Medicine Department.
Acknowledgements
We are grateful to C.Canzi, R.Matheoud and E.Reschini of the Department of Nuclear
Medicine of Ospedale Maggiore IRCCS Policlinico, Milano (Italy) for interesting and useful
discussions.
References
[1] RESCHINI E., MATHEOUD R., CANZI C., CASTELLANI M., GALELLI M. et al.,
Dosimetry study in patients with autonomous thyroid nodule who are candidates for
radiotherapy, J. Nucl. Med. 40 (1999), 1928-1934.
[2] MATHEOUD R. et al.: Patient specific dosimetry for radioiodine therapy of the
autonomous thyroid nodule, to be submitted.
[3] LOEVINGER R., BUDINGER T.F., WATSON E.E., MIRD Primer for absorbed dose
calculations, The Society of Nuclear Medicine Inc., New York, 1991
[4] Radiation Dose to Patient from Radiopharmaceuticals, ICRP Publication 53, Pergamon
Press, Oxford, 1988.

Topical Session 5
DEVELOPING AND USING DOSE GUIDANCE
(REFERENCE) LEVELS IN RADIOLOGY AND
NUCLEAR MEDICINE EXAMINATIONS
.

IAEA-CN-83-53
403
PRACTICAL IMPLEMENTATION OF THE MEDICAL EXPOSURE DIRECTIVE
(97/43) IN LUXEMBOURG WITH SPECIAL REFERENCE TO DIAGNOSTIC
REFERENCE LEVELS
A. Schreiner-Karoussou, C. Back, N. Harpes, F. Shannoun
Division de la Radioprotection, Direction de la Santé, Ministére de la Santé, Villa Louvigny, AllÈe Marconi, Luxembourg Abstract
The Council Directive 97/43 EURATOM of June 30th 1997 requires Member States to promote the
establishment and use of diagnostic reference levels for radiodiagnostic examinations. In response to this
requirement Luxembourg decided to launch a dose measurement campaign for all hospitals and clinics and to
compare the results with the diagnostic reference levels recommended by the European commission. Entrance
surface dose measurements were carried out for three common examinations (chest, pelvis and lumbar spine) in
five hospitals, using thermoluminescent dosimeters. The results showed that for the examinations of the chest and
lumbar spine the European reference dose levels were consistently exceeded in four out of the five hospitals. This
was due to: the use of continuous mode fluoroscopy for positioning the patient, the use of film-screen speed
classes below the recommended 400 and the use of a kVp lower than that recommended by the European
commission. An optimisation process was carried out in one hospital and entrance surface dose measurements
were repeated. It was found that the optimisation process led to a dose reduction of 70%.
1. Introduction
The aim of the Council Directive 97/43 EURATOM of June 30th 1997 [1] on health protection of individuals against the dangers of ionising radiation in relation to medical exposure is to harmonise the existing legislation in this field within the member states in order to provide a high level of protection to the patient. Article 4, paragraph 2 of the Directive states that Member States shall promote the establishment and use of diagnostic reference levels for radiodiagnostic examinations, and the availability of guidance for this purpose having regard to European diagnostic reference levels where available. Luxembourg decided to adopt these European diagnostic levels [2] in its legislation and to start a dose measurement campaign in every hospital and clinic. This paper presents the first results obtained from this dose measurement campaign. 2. Method
Quality control tests were carried out on the radiological equipment used for conventional radiological examinations in five hospitals. This was done in order to ensure that the equipment functioned correctly and most importantly that the dose delivered by the equipment was within acceptable limits [3]. Entrance surface dose measurements were carried out using thermoluminescent dosimeters (TLDs) which were fixed on the patients skin. The measurements were done for three standard examinations : Thorax, pelvis and lumbar spine, for 25 patients per examination with an average weight of 70 Kg. The method used was based on a document published by the European comission [4]. For each examination the following paremeters were registered:
1.Patient parameters: age, sex, height, weight 2.Technical parameters: sensitivity of intensifying screens, kVp used, mAs, film size,
use of automatic exposure control, film to focus distance (FFD), existence of written

IAEA-CN-83-53
404
protocols, positioning of the patient: use of fluoroscopy instead of light beam diaphragm, number of projections, clinical examination by the practitioner before exposure,
The data obtained was evaluated and compared with the diagnostic reference levels and technical parameters described in the relative European commission document ìEuropean Guidelines on Quality Criteria for Diagnostic Radiographic Imagesî (EUR96) [2].
3. Results
Properly written protocols for each type of examination did not exist in any hospital. Proposed written technical parameters existed but were rarely consulted. Fluroscopy was used in every hospital for the positioning of the patient for the examinations of the pelvis and lumbar spine. For the examination of the thorax only one hospital did not use fluoroscopy for the positioning of the patient and this was due to the fact that the equipment used was a wall stand bucky with no possibility of fluoroscopy. The number of projections demanded for the examination of the lumbar spine was excessive in one hospital i.e. eight projections. In all hospitals no clinical examination was carried out prior to the exposure by the practitioner and in only two out the five hospitals the practitioner saw the patient after the exposure. Figures 1 to 5 show the results obtained from the entrance surface dose measurements. In four out of the five hospitals the European reference levels were exceeded. The reasons for this are the following: - systematic use of continuous mode fluoroscopy for the positioning of the patient - use of a kVp which was too low compared with that recommended [2] - use of intensifying screens of a lower sensitivity compared to that recommended [2]. Only one hospital had entrance surface dose levels below the recommended European diagnostic reference levels [2] and this was due to two reasons: - its radiological equipment had the option of pulsed fluoroscopy and this option was used for positioning the patient - it was equipped with intensifying screens of a much higher sensitivity than that recommended [2].
C h e s t P o s te rio r A n te rio r
0
0 .2
0 .4
0 .6
0 .8
1
1 .2
A B C D E
H o s p ita l
En
tra
nc
e S
urf
ac
e D
os
e
mG
y
A
B
C
D
E
E u ro p e a n R e fe re n c e d o s e
le v e l: 0 .3 m G y
Figure 1

IAEA-CN-83-53
405
P e lv is P o s t e r io r A n t e r io r
0
2
4
6
8
1 0
1 2
1 4
1 6
A B C D E
H o s p i t a l
En
tra
nc
e S
urf
ac
e D
os
e
mG
yA
B
C
D
E
E u r o p e a n R e f e r e n c e
d o s e l e v e l : 1 0 m G y
Figure 2
L u m b a r S p in e A n te r io r P o s te r io r
0
5
1 0
1 5
2 0
2 5
3 0
A B C D E
H o sp i ta l
En
tran
ce S
urf
ace D
ose
mG
y
A
B
C
D
E
E u r o p e a n
r e fe r e n c e
d o se l e v e l : 1 0
m G y
Figure 3
C h e s t L a te ra l
0
0 . 5
1
1 . 5
2
2 . 5
3
3 . 5
4
A B C D E
H o sp i ta l
En
tran
ce S
urf
ace D
ose
mG
y
A
B
C
D
E
E u r o p e a n R e fe r e n c e
d o se l e v e l :1 . 5 m G y
Figure 4

IAEA-CN-83-53
406
L u m b a r S p in e L a t e r a l
0
1 0
2 0
3 0
4 0
5 0
6 0
7 0
A B C D E
H o s p i t a l
En
tra
nc
e S
urf
ac
e D
os
e
mG
y
A
B
C
D
E
E u r o p e a n R e f e r e n c e
d o s e l e v e l : 3 0 m G y
Figure 5
In hospital A (fig. 1-5) the technical parameters were optimised, the use of fluoroscopy for positioning the patient was stopped and written protocols were implemented. The entrance surface dose measurements were repeated and it was found that the entrance surface doses were reduced by 70%.
4. Conclusion
The measurement of entrance surface doses in order to establish diagnostic reference levels is an excellent tool for researching the actual situation in hospitals as far as radiological examinations are concerned. It is perfect as a tool for optimisation purposes i.e. achieve entrance surface doses as low as reasonably possible and for training the personnel involved in the radiology departments. The use of fluoroscopy for positioning purposes should be put on the European Agenda,
as this practice isn’t limited to Luxembourg.
References
[1] Counsil Directive 97/43/EURATOM of 30 June 1997 on health protection of
individuals against dangers of ionising radiation in relation to medical exposure, Official Journal of the European Commmission, No L 180.
[2] European Guidelines on Quality Criteria for Diagnostic Radiographic Images, European Commission, EUR 16260 EN, June 1996.
[3] Radioprotection 91- Critères d’acceptabilité des installations de radiologie (y compris de radiothérapie) et de médecine nucléaire, Comission européenne, 1997.
[4] Radioprotection 109- Conseils sur la mise en oeuvre de niveaux de référence diagnostiques pour les expositions médicales, Commission européenne, 1999.

IAEA-CN-85-189
407
A PROPOSAL TO PROVE COMPLIANCE OF ESD WITH EU-GUIDELINES
M. Tschurlovits
Atominstitut der österreichischen Universitäten, Vienna, Austria
Abstract
The question of compliance with the diagnostic reference levels issued as European Guidelines is discussed
based upon measurements of entrance surface dose in four selected projections. The projections were chosen
either for the higher dose associated with the investigation or the high frequency of the investigation. The results
for the high dose projections lumbar spine and iv pyelography were found to be well below the guidelines. The
results for the low dose projections chest pa and chest lat show a mean at about the guidance level. The
parameters of the measurements are shown and possible reasons for the scattering of data are discussed. The
parameters of the measurements are compared with the proposal of the EU. The main conclusion were a) that
even when not all parameters are consistent with EU-guides, the dose is frequently much lower than required. In
addition, the ranking in ESD was different for different techniques and different radiologists. Because an
approved method to indicate compliance is not yet available, a proposal is given in order to make the guidelines
executable.
1. Introduction
"Guidance levels " for entrance surface dose per radiograph in air with backscatter are
presented in [1]. Similar data are available in the corresponding EU-guidelines [2]. [1] states:
guidance levels: A level of a specified quantity above which appropriate actions should be
considered. In some circumstances, actions might needed to be considered when the specified
quantity is substantially below the guidance level.
The EU- directive [3] gives no numbers, but defines in short (Article 2, definitions)
Diagnostic Reference Levels: dose levels in medical radiodiagnostic practices or, in the case
of radiopharmaceuticals, levels of activity, for typical examinations for groups of standard-
sized patients or standard phantoms for broadly defined types of equipment. These levels are
expected not to be exceeded for standard procedures when good and normal practice
regarding diagnostic and technical performance is applied.
Disregarding the different terminology, the meaning of the term is that a higher dose per
radiograph is not necessarily a non-compliance with the directive, but rather a reason for
further investigationThe figures set by [1] and [2] are based upon investigations carried out
directly at patients. For this reason, the scattering of the data is directed by:
�� equipment characteristics
�� patient characteristic
2. Measurements
The purpose of the program was:
a) checking compliance with EU- directive for some Austrian radiologists and departments
b) development of a simple procedure to assess ESD without patient dose
c) assessment of input data for estimation of patient dose
The technique to be applied was designed to in order to prove
a) no exposure of the patient

IAEA-CN-85-189
408
b) simple procedure
c) traceable to standards
d) indicate equipment properties only
Dosimeters: standardized thermoluminescent dosimeters (System Panasonic) as used for
individual dosimetry in routine reading were used. The number of exposed dosimeters was
between one and five, dependent on the expected dose. The uncertainties of the procedure are
reported below.
Assessment of standard exposure conditions: in order to select a phantom corresponding to
the conditions ( kV, mAs ) set by automatic exposure control, data on the variation of the
conditions for different patients were recorded for a number of patients.
Phantom: The phantom was a standard acrylic-glass phantom filled with water, as used for
assessment of scattered radiation (250 x 250x 150 mm, 10 mm wall thickness). Eventually,
the phantom was modified by additional layers of acrylic-glass to prove that the automatic
exposure control is adjusted to the mean value as assessed above
Procedure: The measurements were made with dosimeters subject of standardization and the
results converted to kerma in air.
Scope: measurements were carried out in 17 wards and radiologists ordinations in Vienna.
Four projektions were subject of the investigation, where two low-dose, but frequently applied
were chosen as well two medium-dose, but less frequently applied.
The tables shown below present the results of the measurement for some projections, other
data can be found in [4]
3. Discussion of the technical parameters and relation to EU-guidelines:
In the following tables, the parameters as required by [3] are shown as applied by the different
investigators (indicated by code numbers). Antiscatter grid was always in use.
Table 1. Chest pa
Code Nr ESD
[mGy]
Bias
[kV]
mAs filtration
mm Al
FFD
[cm]
speed
8 0,61�0,03 133 14 1,3 150 100
5 0,57 125 53 2,5 158 200
1 0,44 90 37 2,5 170 335
16 0,42 115 * 2,0 140 250
2 0,38 125 * 2,0 200 200
17 0,38 125 8,8 2,6 195 300
10 0,39 90 14 2,6 155 280
EU 0,3 125 -- ���� 3 180++
400
4 0,28 125 15 2,0 200 250
3 0,26 133 12 2,5 200 300
14 0,23 96 9 2,5 150 280
13 0,22 125 8 2,0 200 (150)*
15 0,20 125 6 2,8 205 400
6 0,18 120 6 3,5 200 250
9 0,18 125 6 2,7 200 400
11 0,18�0,01 121 11 2,5 150 300
bold: EUR 16260 Guideline * unknown ** not confirmed

IAEA-CN-85-189
409
Table 2. Intravenous Pyelographie
Code Nr ESD
[mGy]
bias
[kV]
mAs filtration
mm Al
FFD
[cm]
Speed
EU 10 75 - 90 -- ���� 3 115++
400
3 5,67 60 103 2,5 100 400
7 3,76 70 39 4,0 110 280
5 2,94 73 77 2,5 100 200
11 2,55 70 49 2,5 115 280
9 2,24 70 25 2,7 105 400
4 2,21 70 40 2,0 115 210
2 2,17 66 38 2,0 110 400
16 2,12 70 55 2,0 120 250
10 2,08 68 28 2,6 112 250
13 2,04 73 31 2,0 115 200
6 1,50 82 22 4,0 115 250
15 1,49 77 10 2,8 105 400
1 1,29 70 18 2,5 115 600
8 1,02 72 14 1,3 115 400
14 1,01 70 16 2,5 115 400**
bold: EUR 16260 Guideline * unknown ** not confirmed
4. Conclusions
The results include only scattering of data associated with the equipment because of phantom
measurements. Phantoms are selected to obtain automatically controlled parameters as
potential [kV] and mAs conditions as of an average patient. Regarding projections associated
with a higher guidance level as iv Pyelography, the results are well below the guidance level.
Projections which require a low ESD lead to results scattered around the guidance level.
Figures exceeding the guidance level were partly explained by radiologists by better image
quality.
Regarding the relation of the ESD to the guidance level, the different radiologist are in
different dose ranking for the different techniques. This implies that a radiologist can be well
below the guidance level in one technique and exceeding the guidance level in another
technique. Therefore the question arise how to prove compliance with the guideline without
measuring all possible projections. The guideline give guidance levels for some projections
[2], and to check all even all these projections seems neither practicable nor justified.
Therefore, the guideline seems unexecutable at present and very little information how to
prove compliance is available at present.
5. Proposal to prove compliance
It is therefore suggested to select a very few representative projections (e.g. those chosen in
this project) and to derive an index by the mean of the relation of the ESD in a given
projection to the guidance level of this projection fulfilling the condition
��n g
m
ESD
ESD
n
11
This might be demonstrated by the following example, where the data are plotted for arbitrary
chosen radiologist with code numbers 8,14,11,13.

IAEA-CN-85-189
410
0
0,5
1
1,5
2
8 14 11 13
Thorax pa
Thorax lat
iv Pyelography
LWS ap
Mean
vertical: Ratio of ESD/ guidance level
horizontal: department code
The black area indicates the mean, and all are below 1 and hence in compliance with the
guidance level. Although some projections are above the guidance level, the mean is below
unity.
This approach seems justified for the following reasons:
�� It is not reasonable to check (at least in the present phase where no guidance is available
how to prove compliance) in each department each technique for which guidance levels
are available for compliance of ESD with the guidelines
�� The present approach takes into account high dose and low dose projection and seems
representative
�� It can be expected that other projection will not depart substantially from these results
�� The method seems applicable to routine checks
�� The measurements are done without patients because it can not be the purpose of a check
of equipment by measuring ESD to determine the BMI
Obviously, when the mean of unity is approached, investigations on the reason are justified.
Cases exceeding one have to be investigated.
References
[1] FAO/I/AEA/ILO/NEA/PAHO/WHO International Basic Safety Standards for Protection
against ionizing Radiation and for the Safety of Radiation Sources, IAEA 1996.
[2] European Commission European Guidelines on Quality Criteria for Diagnostic Radiographic
Images, EUR 16260 EN Brüssel - Luxemburg, 1996.
[3] European Commission, Council directive 97/43/ Euratom 30.6.97 on health protection of
individuals against ionizing radiation in medical exposure.
[4] Tschurlovits, M. “Assessment of ESD in selected projections” (in german)
Strahlenschutz in Forschung und Praxis (2001) Vol. 43, in press.

IAEA-CN-85-176
411
DIAGNOSTIC RADIOGRAPHY DOSE AND GUIDANCE LEVELS
M. Cuadros, A. Augusto
Instituto Boliviano de Ciencia y Tecnología Nuclear, La Paz, Bolivia
Abstract
This work shows a study done on conventional radiodiagnostic equipment. The evaluation was implemented
throughout different areas of Bolivia, covering not only single equipment radiographs used in the cities, but also
the ones used in rural areas. There have been more than 90 equipment pieces evaluated of which the dose
received by a patient for a given exam, has been considered an essential element. For this purpose two types of
examinations have been selected, being considered the more frequent. Not only the dose aspect was taken into
consideration but the technique used as well. These elements that, that support very important information, have
been related to orientative levels..
1. Introduccion
El uso masivo de las radiaciones producidas por los equipos de radiodiagnóstico en el área de
salud hace necesario establecer ciertos marcos que vayan a delimitar el trabajo de toma de
placas radiográficas. Uno de los elementos que ayudan a establecer estos criterios es la dosis,
y lo que representan los niveles orientativos, que es necesario considerarlos pero teniendo
presente siempre que ligados a la dosis se encuentran otros elementos tan importantes. Entre
estos elementos podemos citar, la técnica empleada para un examen dado, la calidad de la
imagen que redundara en un interpretación acertada o no, el equipo radiográfico mismo con
una serie de parámetros que deben ser considerados, sistema de revelado, etc. Si tomamos en
cuenta todos los aspectos que involucran la obtención de la imagen radiográfica observaremos
que la combinación de todos los factores hacen muy difícil establecer metodologías
estándares, que permitan obtener una buena calidad radiográfica con dosis bajas.
Por lo anterior en el presente trabajo se ha buscado relacionar dos elementos, como ser la
técnica usada y la dosis, y compararlos con los niveles orientativos.
2. Materiales
Para el trabajo se utilizaron los siguientes materiales:
- Medidor de tensión, no invasivo, con el propósito de establecer el valor real del
kilovoltaje aplicado en el examen.
- Medidor de tiempo, para establecer el tiempo real de irradiación.
- Cristales de Fli
- Lector de cristales termoluminiscente
3. Metodología
Se han recogido información de 96 equipos de radiodiagnóstico tomando dato s de la técnica
empleada, asimismo evaluando los parámetros principales señalados, además de otros como
por ejemplo capa hemirreductora, coincidencias de campo y haz luminoso, precisión del
medidor de distancia, sistema de revelado, tipo de placas, estado de los chasis, etc.
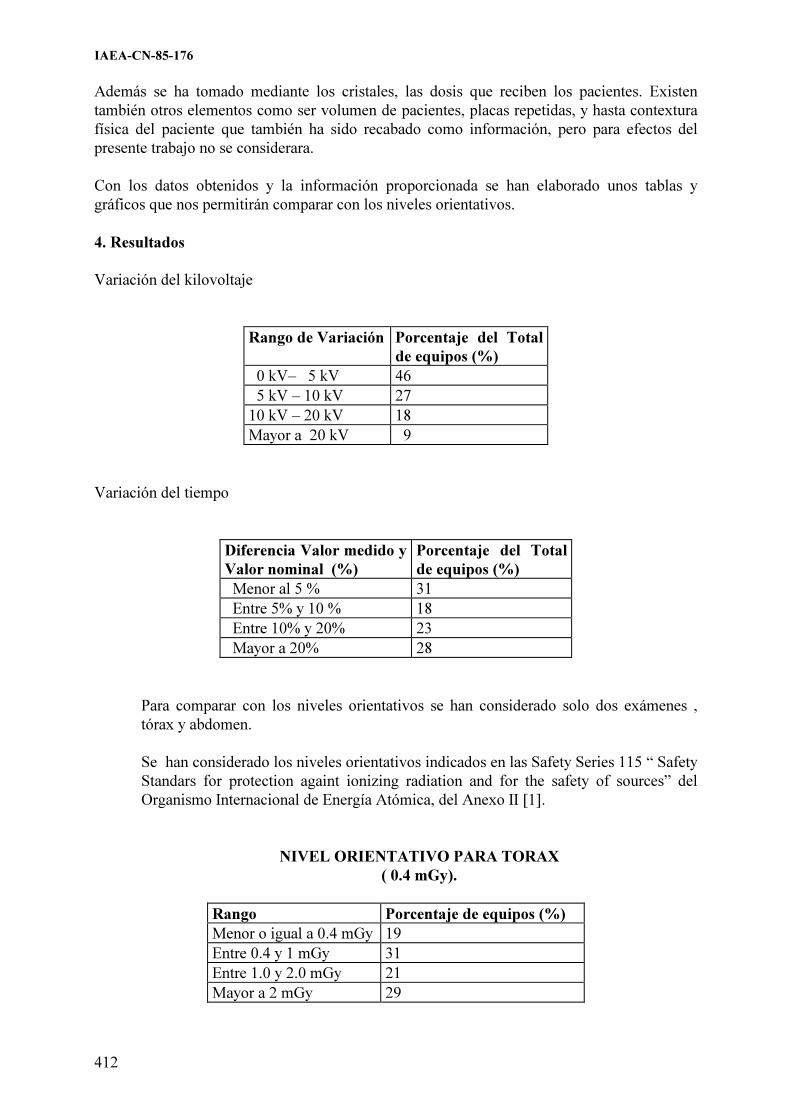
IAEA-CN-85-176
412
Además se ha tomado mediante los cristales, las dosis que reciben los pacientes. Existen
también otros elementos como ser volumen de pacientes, placas repetidas, y hasta contextura
física del paciente que también ha sido recabado como información, pero para efectos del
presente trabajo no se considerara.
Con los datos obtenidos y la información proporcionada se han elaborado unos tablas y
gráficos que nos permitirán comparar con los niveles orientativos.
4. Resultados
Variación del kilovoltaje
Rango de Variación Porcentaje del Total
de equipos (%)
0 kV– 5 kV 46
5 kV – 10 kV 27
10 kV – 20 kV 18
Mayor a 20 kV 9
Variación del tiempo
Diferencia Valor medido y
Valor nominal (%)
Porcentaje del Total
de equipos (%)
Menor al 5 % 31
Entre 5% y 10 % 18
Entre 10% y 20% 23
Mayor a 20% 28
Para comparar con los niveles orientativos se han considerado solo dos exámenes ,
tórax y abdomen.
Se han considerado los niveles orientativos indicados en las Safety Series 115 “ Safety
Standars for protection againt ionizing radiation and for the safety of sources” del
Organismo Internacional de Energía Atómica, del Anexo II [1].
NIVEL ORIENTATIVO PARA TORAX
( 0.4 mGy).
Rango Porcentaje de equipos (%)
Menor o igual a 0.4 mGy 19
Entre 0.4 y 1 mGy 31
Entre 1.0 y 2.0 mGy 21
Mayor a 2 mGy 29

IAEA-CN-85-176
413
NIVEL ORIENTATIVO PARA ABDOMEN
(10.0 mGy).
Rango Porcentaje de equipos (%)
Menor o igual a 10.0 mGy 78
Entre 10.0 y 20.0 mGy 13
Mayor a 20.0 mGy 9
5. Conclusiones
- En el estudio solo se han considerado las variables kilovoltaje y tiempo, y no se ha
considerado la intensidad de corriente, que es otro elemento que determina la dosis
recibida por el paciente en el exámenes. radiográfico.
- Solo considerando el factor tensión tendremos que menos de la mitad de los
equipos evaluados se encuentran en buenas condiciones, ya que el kilovoltaje que
proporcionan los equipos es similar al que indican el panel.
- En lo que respecta al tiempo, también podemos indicar que casi la mitad de los
equipos radiográficos evaluados pueden considerarse en condiciones adecuadas.
- Efectuando la relación de estos parámetros con los niveles orientativos implicaría
que la mitad de los equipos dan niveles de radiación similares a los niveles
orientativos.
- La anterior conclusión no es cierta ya que con valores muy por debajo de los
niveles orientativos, no encontramos con placas subexpuestas, que desde el punto
de calidad de imagen, no será el requerido.
- Para efectuar una análisis completo no solo es necesario tener en cuenta la dosis,
será preciso considerar como el elemento mas importante la calidad de la imagen.
- Será importante relacionar los parámetros de funcionamiento del equipo, sistema
de revelado, técnica usada, con la calidad de imagen y dosis, para así contar con
una valoración mas completa.
Referencia
NORMAS BASICAS INTERNACIONALES DE SEGURIDAD PARA LA PROTECCION
CONTRA LA RADIACION IONIZANTE Y PARA LA SEGURIDAD DE LAS FUENTES
DE RADIACION. Coleccion Seguridad No. 115. OIEA, AEN/OCDE, FAO, OIT, OMS, OPS.
Anexo II. 1997

IAEA-CN-85-281
414
RESULTS OF THE STUDY OF ENTRANCE SURFACE DOSE FROM
CONVENTIONAL EXAMINATIONS IN DIAGNOSTIC RADIOLOGY
A. Martínez1, L. Jova
1, R. de la Mora
2, C. Guevara
2, I. Fleitas
2, J. Carrazana
1, E. Díaz
1
1Centro de Protección e Higiene de la Radiaciones, Havana, Cuba
2Centro de Control Estatal de Equipos Médicos, Havana, Cuba
Abstracts
The wide diffusion of the X rays diagnostic together to the quick development and expansion that has come
experiencing the technology in this practice, have motivated the emission of recommendations, in the Basic
Safety Standards of the IAEA, for the establishment of guidance levels for different radiological examinations in
each country that allow the optimization of the medical exposure. Considering the above-mentioned and the
existence in Cuba of a great number of conventional X ray equipment, with an average over 10 years of use
which influences directly on the patient dose, in 1999 began in the country an investigation on the patient
exposure in this practice. This work shows the first results of measurements carried out in 9 major hospitals of
several provinces of the country. The doses were evaluated in the examinations of lumbar spine AP, lumbar spine
LAT, thorax PA, skull AP and skull LAT. The determination of the doses in these examinations was carried out
by "in-vivo" measurements on the patients, placing in the center of the irradiation field TLD of LiF. The
distributions obtained in the studies are compared with the guidance levels that is shown in the Basic Safety
Standards of the IAEA.
1. Introducción
La radiología diagnóstica es la mayor contribuyente a la dosis colectiva de la población
mundial entre todas las aplicaciones de las radiaciones ionizantes que el hombre utiliza [1].
Las variaciones en la exposición médica observadas en esta práctica, no solo entre países sino
dentro de un mismo país; han motivado la emisión de recomendaciones internacionales,
acerca del establecimiento de niveles orientativos de dosis para diferentes exámenes
radiológicos, que permitan la optimización de la exposición médica.
Cuba cuenta en la actualidad con más de 1000 equipos de radiografía convencional instalados
en el país y una tasa promedio de exámenes de radiodiagnóstico por habitantes comparables
con la de los países desarrollados. Sin embargo la tecnología y los años de explotación de este
equipamiento sobrepasan los 15 años, lo cual unido a dificultades en la formación en materia
de protección radiológica del personal vinculado a esta práctica, hace que revista especial
interés el conocimiento de los niveles de exposición recibidos por nuestra población en los
exámenes de rayos X convencionales de mayor frecuencia.
El presente trabajo muestra los primeros resultados de un estudio llevado a cabo en el país
para evaluar las dosis de entrada en paciente en hospitales cabeceras de diferentes provincias y
la comparación de éstos con otros resultados obtenidos y/o recomendados por organizaciones
internacionales.
2. Materiales y métodos
Los resultados que se presentan en este trabajo se obtuvieron de las mediciones realizadas en
9 hospitales cabeceras de 3 provincias del país y los equipos en los que se llevaron a cabo las
mismas son representativos del 75 % del total de los instalados a nivel nacional. Las
evaluaciones fueron realizadas para los estudios de tórax PA, columna lumbar LAT, columna
lumbar AP, cráneo LAT y cráneo PA teniendo en cuenta la alta frecuencia de ejecución de los
mismos en los servicios radiológicos nacionales. La metodología experimental adoptada, fue

IAEA-CN-85-281
415
la medición “in vivo” de las Dosis de Entrada (DE), utilizando dosímetros termoluminiscentes
(TLD) de fluoruro de Litio (JR1152C) de fabricación china, cuyo tratamiento y calibración se
hicieron de acuerdo con lo descrito en la literatura [2]. Los dosímetros se ubicaron dentro de
pequeñas bolsas de nylon para facilitar su manipulación y en grupos de tres a fin de obtener
una lectura media de las exposiciones. De esta forma fueron colocados sobre la piel del
paciente en el centro del campo de radiación. Para cada equipo medido fue seleccionado un
mínimo de 10 pacientes por estudio (altura y peso promedio de 1,65 m y 68 kg
respectivamente), registrándose en cada caso los datos personales y aquellos relacionados con
la exposición radiográfica. A los valores obtenidos de dosis, por estudio, se les realizó
tratamiento estadístico para determinar el tercer cuartil y compararlo con los niveles
recomendados por las Organizaciones Internacionales.
0.00
10.00
20.00
30.00
40.00
50.00
D osis
(m Gy)
1
Equipos
C olu mna Lum bar LAT
0.00
5.00
10.00
15.00
20.00
25.00
D osis
(mGy)
1
Equipos
C olum na Lum bar AP
0.00
2.00
4.00
6.00
8.00
10.00
12.00
D osis
(m Gy)
1
Equipos
C ráne o LAT
0.00
0.50
1.00
1.50
2.00
2.50
3.00
D osis
(mGy)
1
Equipos
Tórax PA
0.00
5.00
10.00
15.00
D osis
(m Gy)
1
Equipos
C ráne o AP
Figura 1. Valores de dosis por equipo para cada estudio

IAEA-CN-85-281
416
3. Resultados y discusión
Los resultados obtenidos de dosis por estudio para cada equipo, se reflejan en la Figura 1. Las
variaciones observadas entre los equipos son debidas a las inconsistencias en la selección de
los parámetros de exposición para similares dimensiones de pacientes. Estas inconsistencias
pueden estar relacionadas con el nivel de entrenamiento de los técnicos conjuntamente con las
condiciones del equipamiento disponible y el procesamiento, que hacen necesaria la selección
de parámetros disímiles para lograr una calidad de imagen aceptable.
La Tabla I muestra los valores de dosis obtenidos durante este trabajo conjuntamente con los
publicados internacionalmente. Se puede apreciar que en el caso de los estudios de columna
lumbar AP y columna lumbar LAT no existen grandes diferencias entre el tercer cuartil
obtenido en el presente trabajo con los valores recomendados por las Normas Básicas de
Seguridad y los publicados por la Comisión Europea. Sin embargo no ocurre lo mismo con los
restantes estudios donde las diferencias son notables. Estas discrepancias pueden estar
relacionadas, con las características propias del equipamiento de nuestro país (tecnología y
años de explotación superiores a 15 años) y en el caso específico de los exámenes de tórax
con la utilización, como promedio, de voltajes inferiores a 90 kV.
Tabla I. Comparación de las dosis obtenidas para cada examen con otros resultados
internacionales
* Leyenda:
NBS: Normas Básicas de Seguridad del OIEA
CE: Comisión Europea
EU: Estados Unidos * (1) Estos valores representan dosis promedios o límites y no incluyen la retrodispersión
Los valores de DE correspondientes al tercer cuartil pueden ser analizados para su utilización
en nuestro país como niveles orientativos. A su vez estos resultados demuestran que se
requiere una investigación para precisar las causas de los valores de DE superiores a los
recomendados internacionalmente en los estudios de tórax y cráneo. En todos los casos se
aprecia la necesidad de aplicar técnicas de optimización entre ellas: el control de calidad
periódico del equipamiento y elevar la preparación del personal que realiza los exámenes.
Una representación gráfica de la tabla anterior se muestra en la Figura 2.
Examen 1er cuartil Media 3er cuartil NBS CE EU(1)
Tórax PA 0.5 1 1 0.4 0.3 0.2
CLS LAT 14 25 36 40 40 -
CLS AP 4 9 10 10 10 5
Cráneo AP 4 7 11 5 5 1.5
Cráneo LAT 3 6 9 3 - -
Dosis de entrada (mGy)

IAEA-CN-85-281
417
Figura 2. Comparación de las dosis obtenidas para cada examen con otros resultados
internacionales
4. Conclusiones
1. Los resultados muestran que en los estudios de columna lumbar las DE que reciben los
pacientes se encuentran en correspondencia con las recomendadas internacionalmente.
2. En los estudios de tórax y cráneo se aprecian diferencias con los valores recomendados
internacionalmente por lo que se impone la necesidad de establecer niveles de referencia
nacionales que se adapten a las condiciones actuales del equipamiento y preparación del
personal.
3. El análisis de los valores obtenidos demuestra la existencia de una considerable reserva
para la reducción de las dosis que reciben los pacientes mediante la selección apropiada de
los factores técnicos (kVp) y del adecuado procesamiento radiográfico.
4. Las variaciones de las dosis observadas entre equipos puso de manifiesto la necesidad de
implantar programas nacionales de control de calidad en la práctica de radiodiagnóstico y
la importancia de llevar a cabo mediciones periódicas de DE en cada institución.
5. Teniendo en cuenta los resultados se concluye además que es necesario elevar la
preparación en protección radiológica del personal involucrado en la práctica, con especial
énfasis en el personal técnico que realiza las exploraciones, como eslabón importante en
la optimización de la exposición médica.

IAEA-CN-85-281
418
Referencias
[1] United Nations Scientific Committee on the Effects of Atomic Radiation, Report to the
General Assembly with Scientific Annexes, UNSCEAR, United Nations, New York,
1993.
[2] Dosimetry Working Party of the Institute of Physical Sciences in Medicine, National
protocol for patient dose measurements in diagnostic radiology, National Radiological
Protection Board, England, 1992.

IAEA-CN-85-95
419
A TRIAL TO ESTABLISH DIAGNOSTIC REFERENCE LEVELS
FOR RADIOLOGICAL EXAMINATIONS IN GREECE
E. Papageorgiou1, P. Dimitriou
1,2,
E. Vardalaki3, C.J. Hourdakis
1, L. Vlahos
2
1 Greek Atomic Energy Commission, Paraskevi, Greece
2 University of Athens, Radiology Dept., “Aretaieion” Hospital, Athens, Greece
3 University of Athens, Physics Dept., Athens, Greece
Abstract
A research for the estimation of doses received by patients undergoing radiological examinations in order to
establish diagnostic reference levels (DRLs) was conducted in Greece. A total of 7 big hospitals in Athens were
selected and 450 patients consisted the sample. The Entrance Surface Doses (ESDs) to patients undertaking 5
common X-ray examinations (chest, cervical spine, lumbar spine AP & LAT, pelvis) were estimated using both
thermoluminescent dosemeters (TLDs) attached to the patient’s skin and ionisation chamber for air kerma
measurements. Patient’s data and exposure settings were recorded. The results from both methods coincided
perfectly. The lumbar spine AP & LAT and the pelvis examinations proved to demonstrate lower DRLs than the
ones recommended by the E.U. For the cervical spine examination, where there is no E.U. recommendation, the
value of 1.0 mGy was established as the national DRL. In the case of the chest examinations the DRL was found
to be 0.7 mGy, more than twice the recommended value. Discrepancies in the patient doses and techniques used
for the examinations studied were found among the different hospitals. Results concerning the kilovoltage and
Focus-to-Film-Distance (FFD) were also analysed and compared to those recommended by the E.U. Correlation
between the kilovoltage and milliampere-second product (mAs) settings was found only in the cases where the
Automatic Exposure Control was operated.
1. Introduction
Previous studies on radiation exposures during common medical diagnostic procedures have
demonstrated that doses may have a range of up to two orders of magnitude, making clear that
there is considerable need for dose reduction [1]. The Diagnostic Reference Levels (DRLs),
which were set down by the European Community, are dose levels in medical radiodiagnostic
practices for typical examinations for groups of standard-sized patients for broadly defined
types of equipment. These levels are not expected to exceed for standard procedures when
good and normal practice regarding diagnostic and technical performance is applied [2]. This
work is a continuation of a previous survey [3] on the estimation of doses received by patients
in Greek hospitals.
2. Materials and methods
The following routine examinations were studied: chest PA, cervical spine, lumbar spine AP
& LAT and pelvis. Seven big radiology departments belonging to hospitals located in Athens
participated. According to the E.U. recommendation [4], the dose measurements should be
performed on standard-sized patient with an average weight of 70 � 3 kg. In this survey the
NRPB protocol [5] was followed which has suggested that at least 10 patients for each
examination from every X-ray unit should be taken into account for the estimation of ESD,
having weights 70 � 20 Kg.
ESD is defined as the absorbed dose to air at the intersection point of the X-ray beam axis
with the entrance surface of the patient, including backscatter radiation and can be determined
by two types of dosemeters: TLDs and ionisation chambers [1].
ESD was directly measured using 3 TLDs placed on the patient’s skin. The calibration
procedure of the TLDs used in this survey (LiF TLD-100) showed: TLDs’ batch homogeneity

IAEA-CN-85-95
420
20%, reproducibility 3%, minimum detectable dose 30µGy [6], energy response curve �18%
for 50-150 kVp, linearity 1%.
Indirect estimation of ESD was obtained by measuring the primary beam air kerma from the
X-ray tube. For each X-ray unit a quality control test was performed in respect to kilovoltage
& timer accuracy and consistency, tube output measurement (at 75 cm and 20 mA.s), tube
linearity and filtration. The tube output measurements were then corrected using the inverse
square law, kVp & mA.s values for each patient’s examination and appropriate backscatter
factors to estimate the ESD using the formula:
where Kair is the air kerma measured, (µ/ρ) is the ratio of mass absorption coefficient to
density (the ratio of µ/ρ for muscle to that for air can be taken as 1.06 for all typical diagnostic
X-ray qualities) [7], FSD is the Focus-to-Skin-Distance (in cm) and BSF is the backscatter
factor. The BSFs values depend on beam quality, field size and FSD and were determined
from literature [8-11].
The measurements with the TLDs and the calculations with the ionisation chamber for
estimating the ESD showed a very high correlation (R=0.97).
For each patient the following data were recorded: hospital, X-ray tube, examination, sex, age,
weight, height, kVp and mA.s settings, Automatic Exposure Control (AEC), Focus-to-Film-
Distance (FFD), film size and sensitivity of intensifying screen-film.
Table 1: Exposure parameters and ESD values
Examination Kilovoltage FFD (cm) ESD (mGy)
Chest PA 94 (39) 177 (27) 0.7 (0.3)
Cervical spine 75 (43) 144 (23) 1.0 (0.6)
Lumbar spine AP 83 (40) 108 (8) 9 (3)
Lumbar spine LAT 89 (9) 111 (11) 16 (8)
Pelvis 76 (7) 107 (8) 7 (3)
The values in parenthesis represent 1SD value
3. Results
A total number of 450 patients from 7 hospitals and 13 different X-ray units were monitored
in this survey. The examination types selected (chest PA, cervical spine, lumbar spine AP &
LAT and pelvis) are either the commonest or represent techniques with the highest absorbed
dose to the patient. The exposure parameters and the ESD values for each type of examination
are presented in Table 1. It should be noted that the ESD values are given as the 3rd
quartile of
the estimated value, according to the European Commission suggestions [2]. For each type of
radiograph included in the CEC Working Document [12] there is “an example of good
radiographic technique” in which values are recommended for various parameters, such as
kilovoltage and Focus-Film-Distance, which should enable the dose criteria to be met. Table 2
presents the suggested exposure parameters and the percentage of the examinations meeting
them. The formula for the ESD values shows the inverse relation between kVp and mA.s.
Table 4 presents the findings for such relation for all the X-ray units.
xBSFFSD
xmAs
xxKESDair
muscle
air
2
75
20)/(
)/(��
���
��
��
��

IAEA-CN-85-95
421
Table 2. Recommended exposure parameters and coincidence in this study
Examination E.U. kVp
Coincidence (%)
E.U. FFD (cm)
Coincidence (%)
E.U. DRLs (mGy)
Coincidence (%)
Chest PA 125
6%
140-200
90%
0.3
50%
Cervical Spine 60-80**
80%
140-180**
63%
1.0**
75%
Lumbar spine AP 75-90
61%
100-150
100%
10
85%
Lumbar spine LAT 80-95
59%
100-150
100%
30
100%
Pelvis 75-90
46%
100-150
100%
10
100%
*The recommended kVp are taken as 120-130
** These values are considered to be the recommended ones
Table 3. Maximum-to-minimum ratios for ESD values
Examination Max/Min of ESDs
for all patients
Max/Min of mean ESDs between all
X-ray units
Chest PA 57 5
Cervical Spine 31 7
Lumbar spine AP 20 6
Lumbar spine LAT 26 8
Pelvis 17 9
Table 4. The kVp-mA.s correlation
X-ray unit AEC mA.s v kVp
TUR D703, Siemens Tridoros 5S No mAs � kVpn
Philips Optimus, Siemens Opti 150,
Siemens Opti 150
Yes mAs � kVp-n
Siemens Gigantos 1012E,
Siemens Polyphos 50, CGR Triplunix T
No mAs constant
CGR Dualix a, CGR Dualix 825,
Siemens Tridoros 150,Siemens Tridoros 5S,
Siemens Tridoros 5S
No No correlation
4. Discussion
Table 2 shows that in the case of the chest examinations 90% of them had FFD in the range of
140-200 cm but in less than 10% the 125-kVp setting was used. The ESD value was found to
be 0.7 mGy, which is more than twice the recommended value of 0.3 mGy. The non-
compliance of the ESD with the E.U. guideline is quite surprising since the latest has been set
rather high so as not to discourage users. It is obvious that the “hard setting” technique
recommended by the E.U. is not adopted by the radiology labs. 50% of the cases had ESD
values exceeding the recommended one. Considering the cases where at least one of the
recommended E.U. settings (either kVp or FFD) was followed, the ESD for the chest

IAEA-CN-85-95
422
examination reaches the value of 0.5 mGy. Only when both the FFD and the kVp
recommendations are fulfilled (the kilovoltage taken in the range 120-130) the ESD falls to
0.2 mGy.
As far as the cervical spine examinations is concerned there are no E.U. recommendations.
The survey showed that, considering the ESD value of 1.0 mGy as acceptable, the optimal
kilovoltage and FFD ranges would be 60-80 kVp and 140-180 cm respectively.
It can be seen that the lumbar spine AP & LAT and the pelvis examinations fulfilled by 100%
the recommendations for the 100-150 cm FFD range.
As far as the kilovoltage setting is concerned, the lumbar spine AP & LAT examinations
followed by approximately 60% the recommendation for 75-90 kVp and 80-95 kVp range
respectively while the pelvis examinations followed by less than 50% the range of 75-90 kVp.
Almost 100% of the estimated ESD values for the lumbar spine LAT and pelvis examinations
and more that 80% for the lumbar spine AP were below the E.U. DRLs.
Table 3 shows the maximum-to-minimum ratio of ESD values for individual patients and
between hospitals. It can be seen that the ESDs for chest examination vary up to 57 times
individually but only 5 times between the various hospitals. While each hospital has a wide
range of ESD values due to the different radiographic techniques used, the mean ESD for each
projection does not vary as greatly from hospital to hospital.
It is obvious from Table 4 that only in the cases where the Automatic Exposure Control was
used, the choice of mA.s was inversely proportional to the kVp setting. The findings,
surprising enough, make the need for revision of the radiographic techniques used urgent.
It is clear that in the case of the chest examinations immediate measures have to been taken in
order to minimise the ESD value. In the other examinations the ESD values proved to be quite
satisfactory and below the European guidance dose levels. Differences from the results
presented in a previous paper [3] may be attributed to different sample sizes.
5. Conclusion
This study clearly showed that there is a need to harmonise the practices followed by the
technologists in order to meet the European criteria for radiographic images and to this
direction the establishment of examination protocols provided by the new radiation protection
regulations will be of great importance. Additionally, efforts to update the equipment installed
in the radiology departments should be made. DRLs can encourage changes in working
procedures and equipment by showing what is possible and achieved in other departments.
References
[1] R.L.Mini, Dosimetric Methods for the Establishment of Reference Dose Levels in Conventional
and Computed Radiography. Radiat. Prot. Dosim. 80, Nos. 1-3, 221-224 (1998)
[2] European Commission, Guidance on Diagnostic Reference Levels (DRLs) for Medical
Exposures. Radiation Protection 109 (1999)
[3] E.Papageorgiou, E.Vardalaki, C.Hourdakis, P.Dimitriou, Estimation of Doses Received by
Patients Undergoing Radiological Examinations in Greece. Rad. Prot. Dosim. (to be published)
[4] CEC, European Guidelines on Quality Criteria for Diagnostic Radiographic Images. EUR
16260 (1996)

IAEA-CN-85-95
423
[5] NRPB, Doses to Patients from Medical X-ray Examinations in the UK-1995 Review. NRPB-
R289 (1996)
[6] D.Bonamini, Low Dose Measurements in a Routine Personal Dosimetry Service. Rad. Prot.
Dosim. 85, Nos. 1-4, 117-120 (1999)
[7] IPSM, Patient Dosimetry Techniques in Diagnostic Radiology. Institute of Physical Sciences in
Medicine, Report 53 (1988)
[8] B.Grosswendt, Dependence of the Photon Backscatter Factor for Water on Source-to-phantom
Distance and Irradiation Field Size. Phys. Med. Biol., 35, No.9, 1233-1245 (1990)
[9] IAEA, Absorbed Dose Determination in Photon and Electron Beams. IAEA Technical Support
Series No. 277 (1987)
[10] B.Grosswendt, Backscatter Factors for X-rays Generated at Voltages between 10 and 100 kV.
Phys. Med. Biol., 29, No.5, 579-591 (1984)
[11] NRPB, Organ Doses from Medical X-ray Examinations Calculated Using Monte Carlo
Technique. NRPB-R186 (1985)
[12] CEC, Quality Criteria for Diagnostic Radiographic Images 2nd Edition,Working Document
XII/252/87 (1990)

IAEA-CN-85-21
424
PATIENT EXPOSURES FROM DIAGNOSTIC RADIOLOGICAL PROCEDURES
IN INDIA
J.B. Sasane, S.G. Sawant, V.K. Shirva, P.K. Dash Sharma, K. Chhokra, V. Jayalakshmi
K.N. Govindarajan, R.N. Kulkarni*, K.S. Parthasarathy* , A.S. Pradhan, B.C. Bhatt
Bhabha Atomic Research Centre, Radiological Physics & Advisory Division,
CT& CRS Building, Anushaktinagar, Mumbai, India
* Atomic Energy Regulatory Board, Anushaktinagar, Mumbai, India
Abstract
It is very well recognised that the ratio of diagnostic information / patient dose must be optimised in diagnostic
radiology for each type of examination. Regulatory authorities in various countries are now engaged in developing
dose constraint values for various X-ray examinations. In a co-ordinated research project, Atomic Energy
Regulatory Board (AERB) and Bhabha Atomic Research Centre (BARC), India, conducted a nationwide survey
to assess the impact of diagnostic radiological practices on population dose in the country. Forms were designed
to collect data on :-(i) X-ray examinations, (ii) details of X-ray machines, (iii) type of work and workload in
different hospitals, and (iv) X-ray examination techniques and associated technical parameters. Entrance skin
doses were estimated by using specially designed and calibrated TLD postal packs. The entrance skin dose was
estimated for a particular examination in a hospital on the basis of TL reading of disc under perspex filter, taking
into account the focus-to-skin distance, back-scatter factor, the mass energy absorption coefficient and the mAs
actually used for the examination. The analysis of entrance skin doses estimated for 12 common X-ray procedures
in these 40 hospitals showed that for the most part these doses fall within the reference levels specified in the
Basic Safety Standards (BSS).
1. Introduction
In diagnostic radiology, it is prudent to optimise the ratio of diagnostic information/ patient
dose for each type of examination. Since the radiation safety standards are not optimised in all
the hospitals, there is a wide variation in this ratio. Many countries have introduced
comprehensive Quality Assurance programmes for diagnostic procedures, which has led to the
gradual reduction in the patient doses, over the years, for the same acceptable quality of the
diagnostic images. The dose reductions have now been optimised at levels, which can be,
considered minimum for the diagnostic information expected with good quality images. For
optimising protection for medical exposures these reference doses should be followed as
guidance levels for different procedures. Since the medical procedures are justified because
they directly benefit the patients, less attention has been given to the optimisation of protection
for medical exposures than for most other applications of radiation sources. As a result, there
is considerable scope for dose reduction in diagnostic radiology (ICRP-60). Regulatory
authorities in various countries are now engaged in developing dose constraint values for
various X-ray examinations.
In a co-ordinated research project, Atomic Energy Regulatory Board (AERB) and Bhabha
Atomic Research Centre (BARC), India conducted a nationwide survey to assess the impact of
diagnostic radiological practices on population dose in the country. For this purpose, support
of Radiological Safety Officers (RSOs), attached to different Radiotherapy centres, in 10
different regions of the country was sought. These RSOs were designated as chief investigators
for collection of the data. Forms were designed and were utilised to collect data on :-(i) X-ray
examinations including age and sex of patients and projection, (ii) Details of X-ray machines,
e.g., Type, make & model, kVp (max), mA (max), total filtration, beam collimation method,
lead equivalence of the Pb glass backing of fluoroscopic screen, focus-to-table top distance,
availability of radiation safety accessories, etc., (iii) type of work and workload in different

IAEA-CN-85-21
425
hospitals, and (iv) X-ray examination techniques and associated technical parameters. The data
collected from various hospitals were used to estimate the frequency of X-ray examinations as
well as the age and sex wise distribution of the patients in the country. The data also helped in
assessing radiation safety status of radiology departments and in finding inadequacies in
radiation protection features of X-ray units in the country. This data was collated and analysed
at BARC. As a part of the project, entrance skin doses for most common X-ray examinations
were measured in 40 different hospitals using TLD postal pack developed in the Division [1].
Entrance skin doses were estimated by using TLD postal packs in different hospitals
distributed in different regions of the country. RSOs at the participating centres assisted in
irradiation of TLD postal packs used for estimation of entrance skin doses during different
diagnostic radiological procedures in different hospitals.
2. TLD postal pack
The TLD postal pack consists of CaSO4: Dy teflon TLD discs (0.8 mm x 7 mm �), arranged in
4 rows with 4 TLD discs in each row, covering each row of TLD discs with 4 different filters
on front side viz. 0.5 mm perspex, 0.3 mm Cu, 0.5 mm Sn + 0.3 mm Cu and 1.0 mm Cu and a
2.0 mm copper backing plate. The size of the pack is only 6 cm x 6 cm x 0.4 cm. CaSO4: Dy
Teflon TLD discs were used because of high sensitivity of CaSO4: Dy phosphor and its nearly
flat energy response (within � 10%) in diagnostic X-ray range of 40 kVp - 125 kVp. The TLD
postal pack facilitates simultaneous measurement of output, tube potential (kVp), HVT and
total filtration. The output of the X-ray tube is measured by TL readouts of discs under 0.5-mm
thick perspex filter. The HVT is estimated by using the ratio of TL readouts under 1 mm thick
copper filter to that under 0.5 mm perspex. For the estimation of tube potential � 75 kVp, the
ratio of TL readouts under combined 0.5 mm tin + 0.3 mm copper filter to that under 0.3 mm
copper filter is used and for tube potentials � 75 kVp, the ratio of TL readouts under 1 mm
thick copper filter to that under 0.3 mm copper filter is used. The ratio under 1 mm of copper
to that under 0.3 mm copper increases linearly with tube potential up to 80 kVp, beyond which
it becomes sub-linear, whereas the ratio under combined 0.5 mm tin + 0.3 mm copper to that
under 0.3 mm copper increases linearly up to 125 kVp. For estimation of kVp and HVT from
the ratios of TL outputs under various filters, as mentioned above, the ratios given in Table-I
are used.
Table I. Ratio of TL outputs under various filters for different Tube Potentials (kVp) and Half
Value Thickness (HVT in mm Al) for TLD Postal Pack
Tube Potential
(kVp)
HVT
(mm Al)
Ratio of TL Outputs
1Cu / 0.3 Cu (0.5 Sn +0.3 Cu) / 0.3 Cu 1 Cu / 0.5 Perspex
60 2.325 0.1161 0.02684 0.01738
70 2.600 0.1743 0.02714 0.03267
81 3.040 0.2202 0.04501 0.04781
90 3.400 0.2497 0.06123 0.06413
102 3.950 0.3011 0.08622 0.08030
117 4.375 0.3114 0.10410 0.09194
125 4.956 0.3532 0.12013 0.11041

IAEA-CN-85-21
426
The TLD postal pack was found to measure tube potential with an accuracy of � 5 kVp, in the
range of 40 kVp to 130 kVp; the air-kerma output was within � 5%; and total filtration was
within � 0.5 mm Al equivalence, for X-ray beams with a filtration above 2 mm Al equivalent.
3. Estimation of entrance skin dose
For estimation of entrance skin doses of patients undergoing various radiological examinations
following procedure is adopted: - Irradiation of TLD postal packs (without patient) were made
at focus-to-TLD pack distance of 50 cm. A range of kVp most commonly used in the hospital
was used for irradiation. The mAs used corresponded to the kVp. (Table-II). Appropriate
calibrations of TLD packs had been first made. The entrance skin dose was then estimated for
a particular examination in a hospital on the basis of TL reading of disc under perspex filter,
taking into account the focus-to-skin distance, backscatter factor, the mass energy absorption
coefficient and the mAs actually used for the examination. Thus,
ESDE=(Air Kerma / mAs)50, kVp(E) .(50/ FSDE)2. (mAs)E.(BSF)HVT (E).(����en /����)
muscle
air
Where,
ESDE is Entrance skin dose for examination (E),
(Air Kerma / mAs)50, kVp (E) is the measured Output of X-ray tube per mAs on the central axis
of the beam at 50 cm from focus, and tube potential kVp, used for the examination, obtained
from TLD postal pack,
(50/ FSDE)2 is inverse law correction for the focus-to-skin distance (cm) actually used for the
examination (E),
(mAs)E : mAs used for the examination (E),
(BSF)HVT (E) : Backscatter factor for quality of beam used for the examination (E),
(� en /�)muscle
: Ratio of mass energy absorption coefficient for energy used for the examination.
Air
Table II. Exposure Chart for TLD postal pack/ (for 20 x 20 cm2 field at focus-to-
pack distance: 50 cm)
X-ray Tube Potential (kVp) Exposure
(mAs)
40 1000
50 250
60 180
70 120
80 100
90 80
100 60
120 40
On the basis of number of X-ray examinations per 1000 population estimated during a
previous survey [2] and increase in the consumption of X-ray films and the population since

IAEA-CN-85-21
427
then, the number of X-ray examination per 1000 population has been estimated as 150. The
number of examinations has been estimated as 140 million per year. Age, sex and examination
wise distribution of patients was obtained from the data collected in this survey. The data on
details of X-ray equipment provided the status of radiation safety in diagnostic radiology.
Table III reports on analysis of the entrance skin doses during some common X-ray
examinations. The mean, standard deviation, median, the first and third quartiles are shown in
Table-III.
Table. III: An analysis of skin entrance doses during different examinations, as measured in 40
hospitals during the Co-ordinated research project on patient organ dose measurements during
diagnostic radiology
Examination
Skin Entrance Dose (mSv)
Mean SD Median First
Quartile
Third
Quartile
BSS
guidance
level
No. of values
below BSS
guidance
level
Chest (PA) 0.23 0.10 0.21 0.16 0.29 0.4 37
LS (AP) 7.34 3.41 7.5 4.4 9.4 10 31
LS (LAT) 19.85 8.98 19.2 14.5 22.8 30 34
Pelvis/Hip(AP) 8.31 2.61 7.9 6.7 9.4 10 31
Abdomen (AP) 6.56 2.44 6.2 4.9 7.6 10 36
Skull (AP) 4.56 2.33 4.0 3.0 5.5 5 26
Skull (LAT) 4.37 1.53 4.2 3.1 5.2 3 8
CS(AP/LAT) 1.37 0.74 1.3 0.7 1.8 - -
Urography 5.81 2.57 5.5 3.7 7.1 10 37
Extremities 0.35 0.25 0.29 0.19 0.39 - -
TS (AP) 5.14 2.32 4.6 3.2 6.1 7 32
TS (LAT) 12.59 6.34 11.4 5.9 17 20 35
4. Results and discussions
The BSS guidance levels and the number of values below the guidance levels, in the
investigated diagnostic examinations, in the 40 Indian hospitals in the present survey, are
listed in Table-III. It is obvious from this Table that there is a large variation in entrance skin
doses for any particular examination from machine to machine, which is a common
observation, in other countries as well. The analysis of entrance skin doses estimated for 12
common X-ray procedures in these 40 hospitals shows that, for the most part, these doses fall
within the reference levels specified in the Basic Safety Standards (BSS). Guidance levels for
different diagnostic X-ray examinations can be prepared following the method outlined above
and these data can be used to obtain diagnostic information commensurate with clinical
requirements without undue radiation doses to the patient.

IAEA-CN-85-21
428
References
[1] A TLD Method for Evaluation of Radiation Quality and Measurement of Entrance Skin
Doses from Diagnostic X-ray Practices: A.S.Pradhan, J.B. Sasane, A.K.Gopalakrishnan,
V.K.Shirva and P.S.Iyer. Radiation Protection Dosimetry, 40 (1992) 49-52.
[2] Estimation and Significance of Patient Doses from Diagnostic X-ray Practices in India:
S.J.Supe, P.S. Iyer, J.B. Sasane, S.G.Sawant and V.K.Shirva. Radiation Protection
Dosimetry, 43 (1992) 209-211.

IAEA-CN-85-15
429
NEED FOR HARMONISATION IN THE ESTABLISHMENT AND USE OF REFERENCE DOSE LEVELS IN RADIOLOGY
J. Zoetelief Interfaculty Reactor Institute, Delft University of Technology, Delft, Netherlands
Abstract
Surveys of patient dose in diagnostic radiology revealed a wide variation in doses to patients for the same types of
x-ray examination. The large dose variations found in the surveys focused the attention to possibilities for dose
reduction in diagnostic radiology. Reference doses were proposed to foster the elimination of doses at the high
end of the distributions. Different proposals concerning the establishment and use of reference dose levels (RDLs)
have been made by international organisations involved in radiological protection. In practice the diversity of
approaches concerning RDLs is even larger. It is concluded that there is need for harmonisation.
1. Introduction
Surveys of patient dose in diagnostic radiology in the 1950s in the UK [1], in the 1970s in the USA [2], in the 1980s in English hospitals [3] and in 1991 in Europe [4] revealed a wide variation in doses to patients for the same types of x-ray examination. The large dose variations found in the surveys focused the attention to possibilities for dose reduction in diagnostic radiology. Reference doses [4,5] were proposed to foster the elimination of doses at the high end of the distributions. The International Commission on Radiological Protection (ICRP) [6] recommends the use of diagnostic reference levels (DRLs). For diagnostic radiology, the ICRP states that these levels, which are a form of investigation level, apply to an easily measured quantity, usually the absorbed dose in air or in a tissue-equivalent material at the surface of a simple standard phantom or a representative patient. In practice, DRLs can initially be selected as a percentile point on the observed distribution of doses to patients. Finally, the ICRP [6] recommends that the values should be selected by professional medical bodies, be reviewed at suitable intervals and be specific to a country or region. The International Atomic Energy Agency (IAEA) [7] introduced the term guidance level as a level of a specified quantity above which appropriate actions should be considered. The guidance levels are intended to be a reasonable indication of doses for average sized patients. They are to be established by relevant professional bodies in consultation with the regulatory authority following the guidance levels given by the IAEA [7]. The levels are intended to provide guidance on what is achievable with current good practice rather than on what should be considered optimum performance. The guidance levels are to be applied with flexibility to allow higher exposures if these are indicated by sound clinical judgement and to be revised as technology and techniques improve. In the Medical Exposure Directive (MED) [8] it is stated that Member States of the European Union shall promote the establishment and use of DRLs for radiodiagnostic examinations, and the availability of guidance for this purpose having regard to European DRLs where available. In the present contribution the various approaches followed for the establishment and use of reference dose levels are discussed
2. Dose surveys and the establishment of diagnostic reference levels Based on the national survey of doses to patients undergoing a selection of routine X-ray examinations in English hospitals [3], national reference dose levels have been established in the UK [5] for standard adult patients. They are obtained as rounded third quartile values of the mean hospital dose distribution, in terms of entrance surface air kerma (including backscatter). Similarly, reference values were established for more complex examinations in terms of air kerma-area product.

IAEA-CN-85-15
430
In European Guidelines [4,9] reference levels were obtained from European dose surveys for adult and paediatric patients, as rounded third quartile values. Reference dose values for mammography using a 4.5 cm thick polymethylmethacrylate (PMMA) phantom are presented in Ref. [10] as a function of optical density on the mammogram. For CT [11] reference levels are proposed for routine examinations in terms of weighted CT dose index [11] and in terms of dose length product [11]. The reference values again correspond to rounded third quartile values from dose surveys using standard head and body CT dosimetry phantoms. As the MED [8] has to be implemented in the national legislation of the EU Member States and in practice, various proposals for reference dose levels have been published, (to be) based on dose surveys. A summary of proposals presented during a workshop entitled “Reference Doses and Quality in Medical Imaging” held in Luxembourg in 1997 is given in Table I. In addition, proposals for local reference dose levels were presented during this workshop.
TABLE I. SUMMARY OF PROPOSALS FOR REFERENCE DOSE LEVELS PRESENTED
DURING A WORKSHOP HELD IN LUXEMBOURG IN 1997
___________________________________________________________________________
Country Reference Quantitiesa Concept
___________________________________________________________________________
Germany [12]
Ka,e, Ka,i, KAP, DLP Various including, 3rd quartile
Germany [13]
Ka,i, Ka,A,, EFluor 3rd quartile
Netherlands [14]
Ka,e rate (fluoroscopy) 3rd quartile
Netherlands [15]
E, Ka,i, KAP 3rd quartile
Sweden [16]
DG Reference (target) levels
Nordic [17]
Ka,e, KAP Guidance levels
___________________________________________________________________________
a Ka,e is entrance surface air kerma (including backscatter), Ka,i incident air kerma (not
including backscatter), KAP air kerma-area product, EFluor effective dose due to fluoroscopy, E effective dose and DG mean glandular dose.
2.2. Discussion of various aspects related to reference dose levels It should be noted that RDLs are not applicable to individual patients due to possible differences in procedures (Section 3.4) and patient dimensions (Section 3.5). 2.3. Dosimetric quantities The dosimetric quantities indicated in Table I are not all easily measurable, as proposed by the ICRP. In Refs. [13, 15] RDLs are expressed (also) in terms of effective dose and in Ref. [16] target doses for mammography are given in terms of mean glandular dose. Therefore, in this paper the term reference dose level (RDL) is used instead of DRL. The dosimetric quantities for specification RDLs are usually Ka,i Ka,e or KAP. The use of these quantities has as a restriction that they are relevant for patient dose only when the techniques (x-ray spectrum, field size etc.) and patient dimensions are approximately constant. Otherwise the use of effective dose will be more appropriate, or RDLs should be established in dependence on the techniques applied and patient dimensions.

IAEA-CN-85-15
431
2.4. Selection of reference dose level from results of dose surveys Not all the proposals are following the concept of using third quartile values of widespread surveys as the basis for selection of a reference dose level. The concepts used are not always apparent but some proposals appear to be redefining the purpose of RDLs into a guide to optimum performance or minimum achievable doses compatible with the diagnostic need (guidance levels or target levels in Table I).
2.5. Status of the proposals According to the ICRP [6] professional medical bodies should select DRLs. According to the IAEA [7] guidance levels are to be established by relevant professional bodies in consultation with the regulatory authority following the guidance levels given by the IAEA. In the MED [8], Member States shall promote the establishment and the use of DRLs, and the availability of guidance for this purpose having regard to European DRLs where available. In the UK national RDLs are established by relevant professional bodies [5], but not in (formal) consultation with the regulatory authority. The status of the recommendations of the recent proposals (Table I) is less clear and also differ from recommendations in Refs. [6-8]. The German proposal in Ref. [12] has been made by the Federal Office for Radiation Protection in consultation with an expert group of physicians and medical physicists. The recommendations presented in Refs. {13-15} are of scientific value but do not have any official status. The target dose levels for mammography [16] and the Nordic guidance levels [17] are published by national radiation protection authorities. In practice, it might be preferable to establish national RDLs by professional bodies (national societies of radiologists, medical physics experts and radiographers) jointly with regulatory authorities. Regional or local professionals might establish regional or local RDLs, at lower values than the national levels, if available.
2.6. Differences in procedures When RDLs are exceeded, it should be noted that the complexity of the procedure might be different from that for which the RDL was established. RDLs could also be exceeded for particularly large patients, unless patient size is taken into account in the RDL. For complex procedures, e.g. in interventional radiology it might be difficult to establish RDLs unless some classification of the complexity of the procedure is provided. Furthermore, it should be stressed that RDLs are aimed at patient dose reduction but the required diagnostic information is also of major importance. This means that in individual cases, the exceeding of RDLs will be justified when the required diagnostic information is essential for patient treatment.
2.7. Measurements with patients or phantoms The ICRP [6] indicates that a simple standard phantom or a representative patient can be applied to establish or use a DRL. When a phantom is used it should be made sure that it is representative for the average patient. The use of a phantom does not provide information on the influence of variations in patient dimensions on patient dose. The advantage of the use of a phantom is that the number of measurements is smaller than that in the case of measurements with patients. Measurements with patients have as advantages that the influence of variations in patient dimensions on patient dose are obtained and that there is no need to design and construct representative phantoms. Sometimes only a selection of patients is used for establishing RDLs. This is an approximation of the representative patient mentioned by the ICRP [6]. However, in this way the dose variations will be underestimated. When measurements are made with patients the selection criteria, e.g. size and sex should be specified.
IAEA-CN-85-15
432
2.8. Corrective actions The corrective actions to be undertaken when a RDL is systematically exceeded should be specified, including procedures of continuing use under special circumstances.
2.9. Benefits achieved by using national RDLs Periodic monitoring of patient doses employing the UK national protocol [5] has become widespread in the UK. A review of 1995 [18] showed that by then only about 10 percent of the hospitals exceeded the reference doses for common conventional x-ray examinations. The mean and third quartile values of the dose distributions had dropped by about 30 percent since the national survey in the 1980s [3]. 3. Conclusion RDLs are a valuable tool to achieve patient dose reduction. However, the different approaches met in practice clearly indicate a need for harmonisation. References [1] ADRIAN COMMITTEE, Radiological Hazards to Patients, HMSO, London (1960). [2] BURKHARDT, R., Nationwide Evaluation of X-Ray Trends (NEXT): Eight Years of
Data (1974-1981), National Technical Information Service, Springfield, VA (1984). [3] SHRIMPTON, P.C., WALL, B.F., JONES, D.G., FISHER, E.S., HILLIER, M.C.,
KENDALL, G.M. HARRISON, R.M., A National Survey of Doses to Patients Undergoing a Selection of Routine X-ray Examinations in English Hospitals, NRPB-R200, HMSO, London (1986).
[4] European Guidelines on Quality Criteria for Diagnostic Radiographic Images, Report EUR 16260, European Commission, Luxembourg (1996).
[5] Institute of Physical Sciences in Medicine, National Radiological Protection Board and Royal College of Radiographers, National Protocol for Patient Dose Measurements in Diagnostic Radiology, NRPB, Chilton (1992).
[6] Radiological Protection and Safety in Medicine, ICRP Publication 73, Annals of the ICRP 26, No. 2, Pergamon Press, Oxford (1996).
[7] International Basic Safety Standards for Protection against Ionizing Radiation and for the Safety of Radiation Sources, IAEA Safety Series 115, IAEA, Vienna (1996).
[8] Council directive of June 30, 1997 (97/43/Euratom) on health protection of
individuals against the dangers of ionizing radiation in relation to medical exposure,
Official J. Eur. Communities No. L180/22 (1997). [9] European Guidelines on Quality Criteria for Diagnostic Radiographic Images in
Paediatrics, Report EUR 16261, European Commission, Luxembourg (1996). [10] European Protocol on Dosimetry in Mammography, Report EUR 16263, European
Commission, Luxembourg (1996). [11] European Guidelines on Quality Criteria for Computed Tomography, Report EUR
16262, European Commission, Luxembourg (2000). [12] VEIT, R., BAUER, B., BERNHARDT, H-J., LECHEL, U., Proposed procedure for
the establishment of diagnostic reference levels in Germany, Radiat. Prot. Dosim. 80 (1998) 117-120.
[13] GFIRTNER, H., GIESSE, E., SCHMIDT, Th., Dosimetric methods for and influence of exposure parameters on the establishment of reference dose for examinations using fluoroscopy, Radiat. Prot. Dosim. 80 (1998) 121-128.
[14] GELEIJNS, J., BROERSE, J.J., HUMMEL, W.A., SCHALIJ, M.J., SCHULTZE KOOL, L.J., TEEUWISSE, W., ZOETELIEF J., Reference dose rates for fluoroscopy guided interventions, Radiat. Prot. Dosim. 80 (1998) 135-138.
[15] ZOETELIEF, J., GELEIJNS, J., KICKEN, P.J.H., THIJSSEN, M.A.O., VAN UNNIK, J.G., Diagnostic reference levels derived from recent surveys on patient dose for various types of radiological examination in the Netherlands, Radiat. Prot. Dosim. 80 (1998) 109-114.
IAEA-CN-85-15
433
[16] LEITZ, W., Reference (target) levels for mammography in Sweden, Radiat. Prot. Dosim. 80 (1998) 181-182.
[17] SAXEBOL, G., OLERUD, H.M., HJARDEMAAL, O., LEITZ, W., SERVOMAA, A., WALDERHAUG, T., Nordic guidance levels for patient doses in diagnostic radiology, Radiat.Prot. Dosim. 80 (1998) 99-101.
[18] HART, D., HILLIER, M.C., WALL, B.F., SHRIMPTON, P., BUNGAY, D., Doses
to Patients from Medical X-ray Examinations in the UK 1995, Report NRPB-R289,
HMSO, London (1996).

IAEA-CN-85-248
434
PATIENT DOSE SURVEYS AND THE USE OF LOCAL AND
NATIONAL DIAGNOSTIC REFERENCE LEVELS
M.L. Ramsdale, D. Peet, P. Hollaway, A. Rust
Regional Radiation Protection Service, Royal Surrey County Hospital,
Guildford, Surrey, United Kingdom
Abstract
Patient doses have been assessed routinely as part of quality assurance programmes in a group of National Health
Service and private hospitals in a southern English health region. Surveys of patient dose have been conducted in
plain film radiography, fluoroscopy, computed tomography, mammography and dental radiography. In keeping
with national guidance, dose parameters used were entrance skin dose for radiography, dose area product for
fluoroscopy, effective dose and dose length product for computed tomography (CT), mean glandular dose for
mammography and air kerma and dose width product for dental intra-oral and orthopantomography (OPG)
respectively. Comparison of results against recommended standards showed that in plain film radiography and
fluoroscopy, doses were well below national reference levels and corresponding local reference levels were
adopted at about 75% of the national figures. Elsewhere in CT, mammography and dental radiography, doses
were generally in line with national trends. Overall, as an integral part of the QA programme, the dose surveys
have contributed greatly to the users understanding of patient dose and in several instances has led to real
optimisation.
1. Introduction
As part of the provision of a radiation protection and diagnostic radiology physics service to
around 50 hospitals, 30 mammography units and 130 dental practices in the South East of
England, sampling of the doses received by patients during common X-ray examinations is
undertaken. Results are compared to relevant Diagnostic Reference Levels (DRLs) as an aid
to optimisation and in compliance with the EC Directive [1] and UK legislation [2] on the
protection of the patient.
2. Methods
Patient dose surveys for plain film radiography and fluoroscopy have been undertaken
periodically in accordance with the national dose protocol which recommends that such
surveys are carried out at least once every 3 years [3]. Surveys of patient dose have also taken
place in computed tomography, mammography and dental X-ray.
For plain film radiography, the patient dosimetry programme started in 1993 and two cycles
were completed covering 64 and 77 X-ray departments respectively. In accordance with the
recommended protocol, thermoluminescent dosemeters (TLDs) were used to measure
entrance skin doses for 5 common examinations; chest, skull, lumbar spine AP, lateral lumbar
spine and pelvis. Only standard size patients (60 to 80 kg) were used in the study with
generally 10 patients per examination.
Dose area product (DAP) is the recommended dose parameter for complex examinations
including fluoroscopy. Since 1995 DAP data have been collected for barium studies,
angiography and interventional procedures covering 37 screening rooms in 23 hospitals
involving about 10,000 patients.
In CT the effective dose for common examinations has been assessed from knowledge of
exposure protocols and measured computed tomography dose index (CTDI) values utilising
published CT scanner data [4]. An initial patient dose survey of 8 CT scanners was

IAEA-CN-85-248
435
undertaken in 1996 and subsequently repeated in 1999/2000 for 7 of the original units plus 3
new scanners. In keeping with the European protocol [5], doses are now also compared to the
parameter dose length product (DLP).
The Service undertakes routine performance measurements on 30 mammography units locally
including 12 in the national breast screening programme and 18 located in the symptomatic
mammography sector. In accordance with the recommended protocol [6] assessment of mean
glandular dose is undertaken routinely every 6 months for the ‘standard breast’ model.
Calculation of mean glandular dose using exposure and breast thickness data from samples of
patients undergoing mammography is also carried out periodically.
Radiation protection and performance measurements are undertaken on all dental X-ray on a
3-yearly cycle. Since 1997 doses have been assessed on 357 intra-oral and 70 OPG X-ray
units using measurements of radiation output. In keeping with national guidance [7] dose
parameters used were skin entrance dose for intra-oral and dose width product for OPG.
3. Results
The results of two rounds of patient dose surveys for plain film radiographic examinations
carried out over 1992-1995 and 1996-1999 respectively is summarised in table I. The mean
values presented across all hospitals for the common examinations studied are compared to
the national reference doses published in 1992. The local doses were well below national
levels and local reference doses, also shown, were derived from the first round of local dose
measurements.
Table 1. Skin entrance dose for plain film radiography
No of
pts
Mean dose
(mGy)
% National
Reference Dose
Local ref
dose
(mGy)
92-95 96-99 92-95 96-99
Abdo AP 682 5.1 4.8 51 48 7
Chest PA 1601 0.14 0.12 50 40 0.2
L spine AP 866 5.9 5.2 59 52 7
L spine Lat 876 15.3 13.2 51 44 20
Pelvis 638 5.2 4.0 52 40 7
The results of DAP measurements for more than 7500 patients are summarised in table II,
highlighting the mean DAP for barium enemas and meals across 30 screening rooms. In the
1992 dose protocol these were the only examinations commonly undertaken in local screening
rooms where reference doses were provided. Again, local doses were generally well within
national figures and consequently local reference doses based on these values were adopted.
The relative impact of local and national reference doses for barium enemas is illustrated in
the distribution of doses in Figure 1.

IAEA-CN-85-248
436
Table 2. Dose area product values for fluoroscopy examinations
Examination Nos of
patients
Mean DAP
Gy cm2
% National Ref
Level
Local Ref Dose
Gy cm2
Ba Enema 3242 31.8 53 40
Ba Meal 1032 11.7 47 15
Ba Swallow 540 7.5 - 10
Ba FT 184 13.7 - 20
Femoral Arteriogram 676 54.6 - 80
Coronary Angiogram 372 35.9 - 50
Coronary Angioplasty 88 34.8 - 35
Venogram 558 4.4 - 5
ERCP 399 11.1 - 12
HSG 216 5.9 - 8
Nephrostomy 92 11.9 - 16
Fibroid embolisation 255 84.0 - 105
Figure 1. Dose area product for barium enemas
Table 3. Effective and dose length product for computed tomography examinations
Examination Dose
(mSv)
Dose-length Product (mGy
cm)
Mean NRPB
Mean
Minimu
m
Maximu
m
Mean EC Ref
Brain 2.08 1.78 316 2196 870 600
Neck 2.35 - 143 1107 552 -
Pelvis 6.93 7.12 216 655 423 600
Abdomen 7.01 7.58 469 989 414 800
Chest (normal) 9.04 7.80 162 790 409 650
Liver 6.00 7.17 151 723 364 -
IAM 0.63 0.35 100 641 298 -
L-spine 4.64 3.33 56 450 292 -
Chest (high
resolution)
1.34 - 30 104 92 -
0
10
20
30
40
50
60
70
80
Hospital
1992 National Reference level
Local reference level
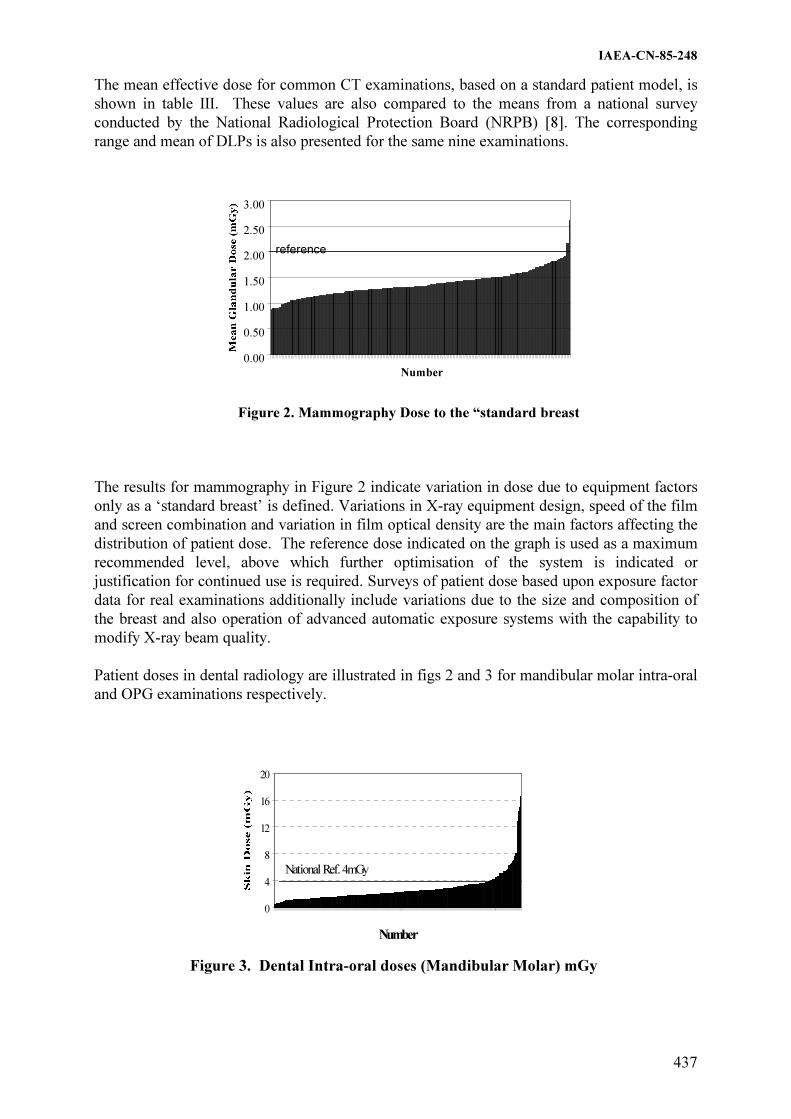
IAEA-CN-85-248
437
The mean effective dose for common CT examinations, based on a standard patient model, is
shown in table III. These values are also compared to the means from a national survey
conducted by the National Radiological Protection Board (NRPB) [8]. The corresponding
range and mean of DLPs is also presented for the same nine examinations.
Figure 2. Mammography Dose to the “standard breast
The results for mammography in Figure 2 indicate variation in dose due to equipment factors
only as a ‘standard breast’ is defined. Variations in X-ray equipment design, speed of the film
and screen combination and variation in film optical density are the main factors affecting the
distribution of patient dose. The reference dose indicated on the graph is used as a maximum
recommended level, above which further optimisation of the system is indicated or
justification for continued use is required. Surveys of patient dose based upon exposure factor
data for real examinations additionally include variations due to the size and composition of
the breast and also operation of advanced automatic exposure systems with the capability to
modify X-ray beam quality.
Patient doses in dental radiology are illustrated in figs 2 and 3 for mandibular molar intra-oral
and OPG examinations respectively.
Figure 3. Dental Intra-oral doses (Mandibular Molar) mGy
0.00
0.50
1.00
1.50
2.00
2.50
3.00
Number
reference
0
4
8
12
16
20
Number
National Ref. 4mGy

IAEA-CN-85-248
438
0
20
40
60
80
100
120
140
Number
National Ref. 65 mGy mm
Figure 4. Dental Panoramic doses (mGy mm)
4. Discussion and conclusions
In the UK reference doses for radiography and fluoroscopy, based on dose measurements in
the late 1980’s and very early 1990’s, were published in 1992 as part of the national dose
protocol [3] and have remained unchanged. The first round of local dose measurements for
radiography confirmed, not unexpectedly regarding the increase in film speed and other dose
reduction features introduced since the 1980’s, that examinations at all hospitals were
generally well within national reference doses. Typically the mean doses for each
examination were about 50% of the reference dose. Since the national reference dose no
longer impacted on the optimisation process, local reference doses, based on the 75th
percentile of the dose distribution from the first round of measurements, were adopted. As
shown in table I, the second round of measurements showed slight reductions in mean doses
for most examinations.
A similar picture emerges for the fluoroscopy dose surveys where the measured dose area
products for barium enemas and meals were again at about 50% of the national reference
dose. Local reference doses were adopted in the same manner for these and ten other
examinations.
In CT no formal reference doses have been published in the UK and instead the doses for
examinations have been compared to mean dose values published by the NRPB [8] following
a survey of CT practice. In a number of cases, by demonstrating that doses at some hospitals
exceeded national means, radiologists were persuaded to review examination protocols and
optimise exposure factors and technique.
In mammography, the use of a reference dose based on a ‘standard breast’ has enabled
identification of systems where patient dose has not been optimised, or imaging materials and
X-ray equipment have been poorly matched. Also, identification of incorrectly adjusted film
processors or AEC systems has been possible.
In dental radiography, reference doses have only recently been recommended [7]. As
illustrated in figures 2 and 3, small but significant numbers of clinics exceeded the reference
doses. Dose reduction strategies were then targeted at these clinics.
Overall, the use of reference doses in all areas of radiology is demonstrated to be beneficial to
the optimisation process and even where no formal national figures exist comparison can be

IAEA-CN-85-248
439
drawn with relevant local dose measurements. Small but significant dose reductions have
occurred and the use of local reference dose levels, where the user relates naturally to other
local hospitals, has been found to be of particular merit.
References
[1] Council Directive on Health Protection of Individuals against dangers of Ionising
Radiation in relation to Medical Exposures. 97/43/EURATOM L180 Vol 40 (1997).
[2] Her Majesty’s Stationary Office (HMSO) The Ionising Radiation (Medical Exposure)
Regulations 2000, Statutory Instrument 2000 No.1059, (HMSO, London) (2000).
[3] IPSM, NRPB AND COLLEGE OF RADIOGRAPHERS, National Protocol for Patient
Dose Measurements in Diagnostic Radiology (NRPB, Chilton) (1992).
[4] JONES DG and SHRIMPTON PC Survey of CT Practice in the UK, Part3: Normalised
organ doses for X-ray CT calculated using Monte Carlo techniques. NRPB SR250
(NRPB, Chilton) (1991).
[5] European guidelines on Quality Criteria for CT EUR 16262 (Luxembourg) (2000).
[6] INSTITUTE OF PHYSICAL SCIENCES IN MEDICINE The Commissioning and
Routine Testing of Mammographic X-ray Systems Report No.59 2nd
ed (IPEM York)
(1994).
[7] ADVISORY GROUP ON IONISING RADIATION Guidelines on patient dose to
promote the optimisation of protection for diagnostic exposures Documents of the
NRPB Vol10 No 1 (Chilton NRPB) (1999)
[8] SHRIMPTON PC et al. Survey of CT Practice in the UK Part 2: Dosimetric Aspects.
NRPB SR249 (NRPB, Chilton) (1991)

IAEA-CN-85-77
440
AN APPROACH TO LOCAL DIAGNOSTIC REFERENCE LEVELS (DRL’s) IN THE
CONTEXT OF NATIONAL AND INTERNATIONAL DRL’s
A.T. Rogers
Medical Physics Department, Nottingham City Hospital NHS Trust,
Nottingham, United Kingdom
Abstract
In recent years there has been a greater focus on the management of patient doses. This effort has been driven by
the realisation of both the increasing magnitude of patient doses and their variation both intra- and inter-
nationally. Legislators and guidance-issuing bodies have developed the idea of ‘Diagnostic Reference Levels’
(DRL’s). In particular, the European Union, in their Council Directive 97/43/Euratom, required Member States
to develop DRL’s. The UK Government, when consolidating this EU Directive into UK legislation, extended the
concept of DRL’s from a national to an employer level. However, the methodologies used for development of
national and international DRL’s do not translate to a local level and hence a new approach is required. This
paper describes one particular approach made by a UK hospital to introduce ‘Local DRL’s’ in such a manner as
to aid the optimisation process. This approach utilises a dose index, based on the local patient population, which
is monitored for trends. Any trend in patient dose triggers an investigation linked to the clinical audit system
within the Clinical Radiology Department. It is the audit cycle that ensures a continuing move towards an
optimised situation. Additional triggers may be employed such as large patient dose variations.
1. Introduction
In recent years there has been a greater focus on the management of patient doses. This effort
has been driven by the realisation of both the increasing magnitude of patient doses [1,2] and
their variation both intra- and inter-nationally [3,4]. Legislating and guidance issuing bodies
have been active in this area and have developed the idea of ‘Diagnostic Reference Levels
(DRL’s) [5-8]. In the context of the international and national situation the idea of DRL’s is
reasonably understandable. However, a recent EU directive [5] has led, in the UK, to the
introduction of legislation [9] introducing the concept of Local DRL’s. The concept has been
legislated for without clear guidance to local hospital staff of how it would operate at that
level. This paper describes an attempt to bridge the gap of international and national DRL’s
being set by national authorities and the concept of Local DRL’s.
2. International & National Diagnostic Reference Levels
Many bodies have been active in the area of DRL’s, including the IAEA [6], European Union
[5,8] and various national bodies [eg 7]. When the origin of these DRL’s are investigated one
discovers similarities in that often a large survey of individual institutions within the
geographical boundaries of the authority issuing the DRL’s. At each institution mean patient
doses for a range of common examinations are determined. These institution mean doses are
gathered together into a distribution of means and then an arbitrary level within the
distribution is taken as the DRL. This level is typically the 75th
percentile. The philosophy of
this approach is to provide the 25% of institutions with mean doses above the DRL to work
towards dose reduction in that particular examination. The DRL on its own, however, is no
incentive to the other 75% of institutions that achieved mean doses below the DRL.
3. Local DRL’s in the United Kingdom
Following the EU Council Directive 97/43/Euratom, the UK Government introduced the
concept of Local DRL’s in legislation promulgated in May 2000 [9]. The definition of DRL’s

IAEA-CN-85-77
441
in the UK legislation is, ‘dose levels in radiodiagnostic practices ….. for typical examinations
for groups of standard-sized patients or standard phantoms for broadly defined types of
equipment’. This definition of DRL’s is similar to that described in the EU Medical
Exposures Directive. However, in the UK legislation, it is the local employer, not national
authorities that must establish such DRL’s. Furthermore, the employer ‘must undertake
appropriate reviews whenever DRL’s are consistently exceeded and ensure that corrective
action is taken…’ From the employer’s perspective they can either implement DRL’s using
existing national or international guidance or else formulate their own approach. In adopting
the former approach of using existing DRL’s, the probability is that local dose levels will be
lower than published DRL’s which suffer from being at the higher end of practice when the
relevant survey was undertaken. Therefore there is no downward pressure being exerted by the
concept of Local DRL’s on locally delivered patient doses. The problem of developing a local
approach is that no consensus exists in the UK as to the methodology needed to develop Local
DRL’s, despite it being a legal requirement. At a local level, the dose distribution in question
is one of individual patient doses and is mainly due to patient size variations rather than a
distribution of institution mean doses which is the origin of national and international DRL’s.
4. The Nottingham approach
The driving force behind the tool of DRL’s, whether they be international, national or local, is
the concept of optimisation. Therefore, in Nottingham, we looked for ways to link our existing
patient dosimetry efforts to a system of quality improvement. Furthermore we required a
system that triggered an investigation if ‘DRL’s are consistently exceeded.’ We were aided in
this aim by the development at Nottingham of a networked, dose-area product based, patient
dose logging system which enables the collection of large numbers of patient doses (> 2000
examination doses per month) [10]. However, the methodology developed does not depend on
this patient dose collection system and so is transferable to other institutions.
At Nottingham City Hospital the median dose by examination type is collected from our dose
data each month. In our case we can be sure that our median dose reflects the dose to our
average patient due to the large number of patient doses measured. Other centres, however, by
judicial selection of patients, could achieve the same end. This dose index is then plotted on a
control chart that essentially plots the index’s time course. During the steady state ie when no
changes to practice or equipment occurred, it is possible to calculate a meaningful average
median monthly dose. This average median dose (taken over a period of six months in
Nottingham) was deemed to be our Local DRL. It was also our target dose in that it was the
expected median dose from our local patient population. Any deviations in median dose
indicated a sub-optimal radiographic process compared to our baseline practice.
The link to optimisation is achieved by the triggering of a dose and image quality
investigation whenever certain criteria are met. These triggers are locally set to reflect local
optimisation strategies. In Nottingham our triggers are currently either a downward or upward
trend in monthly median dose or else a large standard deviation in the monthly median dose
distribution. The number of concurrent investigations and the speed of their completion are
entirely resource limited. Resource limitations notwithstanding, the comparison of monthly
median dose levels with our Local DRL’s linked to an image quality/dose investigation when
triggered by preset criteria defines our route from the imposed concept of Local DRL’s to that
of optimisation. For each examination that is investigated, the outcome ought to be optimised
practice within the constraints of current equipment, current good practice guidance and local
radiologist preference. Such investigations can also highlight the need for equipment

IAEA-CN-85-77
442
replacement and produce useful arguments for capital expenditure. Each investigation, if
properly disseminated within the organisation, can act as a powerful training resource and
often leads to a more harmonised approach, reducing staff-dependent dose variations.
In summary therefore, the methodology described above links the concept of Local DRL’s (a
legal requirement in the UK) with the process of optimisation. It is the process of optimisation
that is the important end point. As stated by the International Commission on Radiological
Protection [11], ‘The optimisation of protection is the most powerful of the components of the
system of radiological protection. It should pervade all stages of the use of radiation in
medicine, from the design of premises, equipment, and procedures through to day-to-day
applications.’ This methodology also fits with the recently proposed National Radiological
Protection Board (UK) concept of ‘achievable dose’ [12]. An achievable dose is one obtained
by applying best practice to the radiographic process in terms of, for example, radiographic
factors, views required and sensitivity of detector. The outcome of our dose monitoring –
audit cycle process, if all best practice guidance is implemented, would be a local achievable
dose. This methodology is not the only way to implement Local DRL’s but, in Nottingham,
we have found it to be a useful mechanism for a planned move towards an optimised practice.
References
[1] NATIONAL RADIOLOGICAL PROTECTION BOARD, Survey of CT Practice in the
UK, Part 2: Dosimetric Aspects – NRPB Report R249, NRPB, Chilton, UK (1991)
[2] NATIONAL RADIOLOGICAL PROTECTION BOARD, Radiation Exposure of the
UK Population, 1993 Review – NRPB Report R263, NRPB, Chilton, UK (1993)
[3] EUROPEAN COMMISSION, European Guidelines on Quality Criteria for Diagnostic
Radiographic Images - Report EU16260 EN, Office for Official Publications of the
European Communities, Luxembourg (1996)
[4] UNSCEAR 1993 Report to the General Assembly, Sources and Effects of Ionizing
Radiation, United Nations, New York (1993)
[5] EUROPEAN COMMISSION, Council Directive 97/43/Euratom of 30 June 1997 on
health protection of individuals against the dangers of ionising radiation in relation to
medical exposures – Official Journal of the European Communities L170, Office for
Official Publications of the European Communities, Luxembourg (1997)
[6] INTERNATIONAL ATOMIC ENERGY AUTHORITY, International Basic Safety
Standards for Protection against Ionizing Radiation and for the Safety of Radiation
Sources – Safety Series 115, IAEA, Vienna (1994)
[7] NATIONAL RADIOLOGICAL PROTECTION BOARD, Doses to Patients from
Medical X-ray Examinations in the UK, 1995 Review – NRPB Report R289, NRPB,
Chilton, UK (1996)
[8] EUROPEAN COMMISSION, Guidance on diagnostic reference levels (DRLs) for
medical exposures – Radiation Protection 109, Office for Official Publications of the
European Communities, Luxembourg (1999)

IAEA-CN-85-77
443
[9] UNITED KINGDOM GOVERNMENT, The Ionising Radiation (Medical Exposure)
Regulations 2000 – Statutory Instrument 2000 No.1059, HMSO, London (2000)
[10] ROGERS AT, POVEDA J, HOLLOWAY M, HAYNES R, FROST K. The Use of a
Dose-Area Product Network to Facilitate the Establishment of Dose Reference Levels.
Radiation Protection Dosimetry, in press (2000)
[11] INTERNATIONAL COMMISSION ON RADIOLOGICAL PROTECTION,
Radiological Protection and Safety in Medicine – ICRP Publication 73, Pergamon
Press, Oxford, UK (1996)
[12] NATIONAL RADIOLOGICAL PROTECTION BOARD, Guidelines on Patient Dose
to Promote the Optimisation of Protection for Diagnostic Medical Exposures –
Documents of the NRPB, Volume 10 No.1, NRPB, Chilton, UK (1999)

IAEA-CN-85-194
444
DIMOND: A EUROPEAN APPROACH TO ESTABLISH AND USE REFERENCE
LEVELS IN FLUOROSCOPY GUIDED PROCEDURES
E. Vano1, K. Faulkner
2, R. Padovani
3, J. Zoetelief
4, M. Toivonen
5, V. Neofotistou
6
1Medical Physics, San Carlos University Hospital, and Complutense University,
Madrid, Spain 2Quality Assurance Reference Centre, Newcastle upon Tyne, United Kingdom
3Ospedale "Santa Maria della Misericordia", Udine, Italy
4Interfaculty Reactor Institute, Delft University of Technology, Delft, Netherlands
5SUTK Radiation and Nuclear Safety Authority, Helsinki, Finland
6Medical Physics Department, Athens General Hospital, Athens, Greece
Abstract
The purpose of this paper is to present a European approach to the establishment of reference levels in
fluoroscopy guided procedures agreed between the members of the European DIMOND research consortium.
The approach based on determination of dose area product (DAP), fluoroscopy time and number of acquired
images is recommended. Three approaches to patient dosimetry have been proposed (from the simplest level to
the more complicated). At the first level the fluoroscopy time and number of images are assessed. This
information could be upgraded with data on entrance dose rate at the surface of a phantom, supplemented by
dose/image for cine or digital imaging, and the irradiated patient area. Additional measurements of DAP and
entrance skin dose would complete the third level. Using this information it is possible to optimise procedures
and to decide if some corrective action is necessary for the x-ray system or for the technical or clinical protocol.
If the number of images or the fluoroscopy time is consistently higher than that corresponding to the reference
level, a revision of the clinical protocol should be made. If DAP (or maximum skin dose, if estimated or
measured) is consistently higher than the reference DAP level (or maximum skin dose), a revision of the x-ray
system (dose rate and dose/image) and the clinical or technical protocol (collimation, magnification, x ray beam
orientation, etc) should be made.
1. Introduction
The follow-up of any patient dosimetry programme in diagnostic radiology requires the
implicit use of reference levels (RL), to assess the possible application of corrective action.
Council Directive 97/43/EURATOM [1] introduces the concept of Diagnostic Reference
Levels (DRL). The European Guideline “Radiation Protection 109” [2] states that ‘In
principle, DRL are applicable for standard procedures in all areas of diagnostic radiology.
They are, however, particularly useful in those areas where a considerable reduction in
individual or collective doses may be achieved or where a reduction in absorbed dose means a
relatively high reduction in risk’. The document quotes, in particular Interventional Radiology
(IR). The International Atomic Energy Agency (IAEA) [3] and the Food and Drug
Administration (FDA) in the USA [4] have published reference values for dose rate at the
entrance of the patient in fluoroscopy: 25 and 100 mGy/min (in air, including backscatter) for
normal and high contrast modes in the IAEA document, and 10 and 20 R/min in the FDA
regulation. However no guidance has been given on dose per image or any dosimetric quantity
for the full fluoroscopy procedure. Furthermore, the measurement protocol has not been
specified.
Cases of skin doses of several Gy, resulting in injuries such as radio-dermatitis and necrosis
have been reported in literature [5-7]. Some national bodies have given specific
recommendations for conducting these procedures [8]. Also, several international
organisations (World Health Organisation, International Commission on Radiological

IAEA-CN-85-194
445
Protection and the IAEA) are preparing specific documents related with radiation protection
(RP) and safety in IR [9, 10].
The purpose of this paper is to present a European approach to RL in fluoroscopy guided
procedures agreed among the members of the European research consortium on Digital
Imaging: Measures for Optimising Radiological Information Content and Dose (DIMOND).
2. The need for reference levels in fluoroscopy guided procedures
The European document “European Guidelines on Quality Criteria for Diagnostic
Radiographic Images” document [11] focuses attention on three aspects of conventional
radiographic techniques, namely, diagnostic quality of the radiographic image, radiation dose
to the patient and choice of the radiographic technique, as a means to audit the process of
diagnostic imaging. The adoption of this approach is also feasible in fluoroscopy and IR,
though image quality and patient dose show a strong relationship in fluoroscopy and digital
imaging modes. In fluoroscopy guided procedures all aspects of diagnostic information should
be considered. This information is obtained both from fluoroscopy and several series of
images. Patient doses will be related with the performance of the x-ray system used and the
clinical and technical protocol. Thus, RL should be set in relation to both the x-ray system and
the procedure protocol.
Concerning the x-ray equipment, there are some features influencing patient dose and image
quality:
a) Dose rate in fluoroscopy.
This depends sometimes of the default setting adjusted by the service engineer. Modern
systems usually have three fluoroscopy modes: low, medium and high, and sometimes, for
these three modes, there is an extra alternative of standard or high contrast modes. These
represent a total of 6 options and the clinician does not always know sufficiently the
differences in dose and image quality between them. The application specialist of the x-
ray system could recommend some default option but this may not be optimised for the
different procedures and personal preferences of the clinicians. Differences in entrance
dose rate for a standard patient can range from 15 mGy/min to more than 60 mGy/min.
Here some orientation on reference dose rates for some typical procedures can be very
useful both for the clinician and for the application specialist. For example, in cardiology
procedures, working with image intensifier format of 18-22 cm, and for a standard patient
size with AP projection and for a standard size patient, the reference dose rate could be 30
mGy/min. At this dose rate, satisfactory image quality should be obtained.
b) Dose per image (or dose per frame in cine).
This also depends on the default selected by the service engineer and the x-ray application
specialist. Some systems have different image quality (and dose) modes. Modern General
Electric systems, for example, offer four modes: A, B, C and D, with better image quality
for the option D and dose per image increasing in a factor of approximately 2.2 from one
mode to another. Typical entrance dose (in air, including backscatter) for a standard
patient and image intensifier format of 22 cm, from 50 µGy/frame until 500 µGy/frame in
cine for cardiology, and values from 1 mGy/image until 10 mGy/image for subtraction
techniques are usual. Also the clinician must be educated in its use. What criteria should
be used to select the level of image quality and what should be the patient dose?. Here,
information on reference dose for typical procedures can be useful for the clinician.

IAEA-CN-85-194
446
c) Other factors such as:
�� Image intensifier format (32, 22, 16 or 11 cm) used to improve the resolution also
affects (in different way for the different systems) the entrance dose. The change
from 22 to 16 cm could imply an increase of a factor of 2 in skin dose for some
systems operating under automatic control.
�� The use of semitransparent filters may improve image quality and reduce skin dose
substantially in some irradiated areas and consequently, reduce DAP.
�� Collimation.
�� Use of last image hold.
�� Experience of the interventionalist using a reasonable fluoroscopy time to perform
the procedure.
�� Experience of interventionalist to avoid acquiring an excessive number of images.
�� An optimised clinical protocol. A good example in cardiology could be the use of
cine rates of 25 or 30 frames/s which has been abandoned in a lot of centres
working now at 12.5 f/s, thus reducing cine doses by 50%.
All these factors have an important influence on patient dose. To have some reference records
of the typical fluoroscopy time, number of images and DAP (and sometimes the skin dose
distribution) for the different procedures can be a useful help in the optimisation process. It is
permitting to compare the practice in a centre with the "state of the practice" (reference levels)
in other centres.
An important aspect to be taken into account is the size of the patient (height and weight)
because an increase of 4-5 cm in the thickness of the examined region can mean an increase of
a factor of 2 in dose rate or dose/image. The other crucial factor is the complexity of the
procedure or the complications during the procedure [12]. The future research on RL for IR
should include the standardisation of some levels of complexity justifying the increase in
patient dose.
The more practical and useful approach to stablish RL in fluoroscopy guided procedures
would be to measure typical values of DAP, fluoroscopy time and number of acquired images.
Skin dose distribution with maximum skin dose values should also be sometimes obtained
[13]. This is particularly important in procedures using several beam orientations such as in
cardiology. It must be noted that a low value of DAP does not guarantee a low skin dose if the
entrance radiation fields of different projections overlap significantly. Non optimised
protocols will produce DAP readings, fluoroscopy time or image number higher than the
reference values.
For fluoroscopy guided procedures, patient dosimetry could be approached from three levels
of information [14]:
1) The first level (the most simple but also with the poorest information) would consist only
of fluoroscopy time and number of images. These parameters are closely related to the clinical
protocol.
2) The second level consists of the data of level one upgraded with information on entrance
dose rate at the surface of a phantom, dose/image for cine or digital imaging, and the
irradiated patient area. These values are more related to the performance of the x-ray system.
3) Finally, the third level includes measurements of DAP and entrance skin dose in addition to
the data of level two. With this information, an orientation about deterministc and stochastic
IAEA-CN-85-194
447
risks is obtained. This orientation is important because the procedures are complicated and
patient doses may be high.
3. Conclusions
For interventional radiology and in general for fluoroscopy guided procedures, reference
levels are particularly relevant and can be applied successfully to optimise procedures and to
improve patient protection.
Dose area product together with fluoroscopy time and number of images are the preferred
quantities to be reported in order to establish and use reference levels for these procedures.
These three parameters permit an effective optimisation. Maximum skin dose should be
estimated (or measured) for complex or repeated procedures for the same patient.
The level of complexity of the procedures and patient size should be taken into account in
order to assign a degree of “tolerance” to the reference levels.
References
[1] EUROPEAN COMMISSION. On health protection of individuals against the dangers of
ionising radiation in relation to medical exposure. Council Directive 97/43/Euratom.
Official J Eur Commun. No L 180:22-27 (1997).
[2] EUROPEAN COMMISSION. Guidance on diagnostic reference levels for medical
exposures. Radiation Protection 109. Office for Official Publications of the European
Communities. Luxembourg (1999)
[3] INTERNATIONAL ATOMIC ENERGY AGENCY. International Basic Safety
Standards for protection against ionising radiation and for the safety of radiation
sources, IAEA Safety Series No. 115-I, Vienna (1994).
[4] UNITED STATES DEPARTMENT OF HEALTH AND HUMAN SERVICES. 21 CFR
Part 1020. Federal Performance Standard for Diagnosis X-Ray Systems and their major
Components. Final Rule (1994).
[5] VANO E, ARRANZ L, SASTRE JM, MORO C, LEDO A, GARATE MT AND
MINGUEZ I. Dosimetric and Radiation Protection considerations based on same cases
of patient skin injuries in Interventional Cardiology. Br J Radiol 1998; 71:510-516.
[6] SHOPE TB. Radiation-induced Skin Injuries from Fluoroscopy. Radiographics 1996:16:
1195-1199.
[7] WAGNER LK, MACNEESE MD, MARX MV, SIEGEL, EL. Severe skin reactions
from interventional fluoroscopy: case report and review of literature. Radiology 1999;
213:773-776.
[8] UNITED STATES FOOD AND DRUG ADMINISTRATION. Avoidance of serious x-
ray induced skin injuries to patients during fluoroscopically guided procedures. Medical
Bulletin 1994; 24: 7-17.
[9] Joint WHO/ISH Workshop on Efficacy and Radiation Safety in Interventional
Radiology, October 1995, Munich-Neuherberg, Germany. Bundesamt für
Starhlenschutz. BfS-ISH-178/97, Germany (1997).
[10] ICRP. Avoidance of radiation injuries from interventional procedures. Draft Report
available in www.icrp.org (2000).
[11] EUROPEAN COMMISSION. European guidelines on quality criteria for diagnostic
radiographic images. Office for Official Publications of the European Communities
(Luxembourg), Report EUR-16260 (1996).

IAEA-CN-85-194
448
[12] BERNARDI G, PADOVANI R, MOROCUTTI G, VANO E, MALISAN MR,
RINUNCINI M, SPEDICATO L, FIORETTI PM. Clinical and technical determinants of
the complexity of PTCA procedures. Analysis in relation to radiation exposure
parameters. Cathet Cardiovasc Interv, 2000;51:1-9.
[13] VANO E.; GUIBELALDE, E.; FERNANDEZ, J.M.; GONZALEZ, L. AND TEN, J.I.
Patient dosimetry in interventional radiology using slow film systems. Br J Radiol 1997;
70:195-200.
[14] VANO E AND GONZALEZ L. Patient Dosimetry and Reference Doses: Practical
considerations. Rad Protec Dosim 2000; 90(1-2):85-88.

IAEA-CN-85-57
449
REFERENCE DOSIMETRY FOR CT IN THE UK
P.C. Shrimpton, B.F. Wall
National Radiological Protection Board, Chilton, Didcot, United Kingdom 1. Abstract
Computed tomography is firmly established as a major source of population exposure from diagnostic x-ray
examinations and thus a particular focus for radiological protection initiatives. The concept of reference doses is
widely recognised as a useful and practical tool for promoting improvements in the optimisation of protection for
patients undergoing radiological examinations. National diagnostic reference levels (DRLs) have already been
successfully applied in the UK for some conventional x-ray examinations within a framework for advice on
patient protection. This approach is being extended to include CT, utilising the robust methodology for reference
dosimetry that has been developed by the European Commission (EC) for the particular conditions of exposure in
CT. This is based on the dosimetric concepts of weighted computed tomography dose index (CTDIw) per slice in
serial scanning or per rotation in helical scanning, and dose-length product (DLP) per complete examination.
Notwithstanding some initial values proposed by the EC, specific national DRLs for CT practice in the UK will
be established on the basis of widescale national survey data.
1. Introduction
Computed tomography is firmly established as an important tool in diagnostic radiology that
provides high quality cross-sectional x-ray images of the body, although the doses to patients
are relatively large. Increasing application of this modality has made a substantial impact on
both patient care and also population exposure. In developed countries, CT procedures
typically represent about 6% of the total number of all medical x-ray examinations, yet
provide about 41% of the resultant collective effective dose [1]. Surveys of clinical practice
have also demonstrated wide variations in patient dose for a given type of procedure and
potential scope for improvement in the optimisation of protection for patients undergoing CT
[2].
Whereas it is inappropriate to impose strict limits on the doses received by patients for
medical purposes, the concept of reference doses is recognised increasingly as a useful and
practical way of promoting the fundamental requirement for optimisation of patient
protection, whereby doses are always as low as reasonably practicable in order to meet
specific clinical objectives [3, 4]. In essence, reference dosimetry seeks to characterise clinical
practice in terms of reference dose quantities that allow simple, yet meaningful comparisons
of technique for a given type of procedure. Such dose measurements are intended to facilitate,
where needed, improvements in patient protection during the regular process of critical review
of equipment and techniques. In particular, diagnostic reference levels can be set for different
types of examination on the basis of wide-scale survey data to help identify potentially
inadequate performance [5]. This approach has proved effective for reducing unnecessary
exposures from conventional x-ray examinations in the UK [6]. A robust methodology for the
specific reference dosimetry necessary for CT has already been developed by the European
Commission as an integral part of quality criteria for such examinations [7].
2. Reference dose quantities
The principal dosimetric quantity used in CT is the computed tomography dose index (CTDI).
This is defined as the integral along a line parallel to the axis of rotation (z) of the dose profile
(D(z)) for a single rotation and a fixed table position, divided by the nominal thickness of the
x-ray beam. CTDI can be conveniently assessed using a pencil ionisation chamber with an

IAEA-CN-85-57
450
active length of 100 mm, so as to provide a measurement of CTDI100, expressed in terms of
absorbed dose to air [8]:
��
�
�
50
50
100)(
1dzzD
nTCTDI (mGy) (1)
where n is the number of tomographic sections, each of nominal thickness T, from a single
rotation.
Reference dosimetry for CT is based on such measurements made within standard CT
dosimetry phantoms; these presently comprise homogeneous cylinders of
polymethylmethacrylate (PMMA), with diameters of 16 cm (head) and 32 cm (body),
although phantoms of water-equivalent plastic and with elliptical cross-sections are under
development. The combination of measurements made at the centre (c) and 10 mm below the
surface (p) of a phantom leads to the following two reference dose quantities [7]:
(a) Weighted CTDI in the standard head or body phantom for a single rotation
corresponding to the exposure settings used in clinical practice
pcwCTDICTDICTDI ,100,100
3
2
3
1�� (mGy) (2)
where CTDI100,p represents an average of measurements at four different locations around the
periphery of the phantom.
(b) Dose-length product for a complete examination
CNTCTDIDLPW
i
n����� (mGy cm) (3)
where i is the number of scan sequences in the examination, each with N rotations of
collimation T cm and exposure C mAs; nCTDIw is the normalised weighted CTDI (mGy mA-
1s-1
) appropriate for the applied potential and nominal beam collimation (number and width of
slices per rotation).
These quantities can be applied to serial or spiral scanning, for both single- or multi-slice
geometry scanners. The dose quantities relate to measurements in the standard head or body
dosimetry phantoms, as appropriate to the type of examination, for the exposure conditions
used in clinical practice. The concept was initially developed in relation to examinations on
adult patients [7], although it has subsequently been extended for application to paediatric CT
[9]. Monitoring of CTDIw per rotation takes account of the exposure settings selected, such as
tube current and tube voltage. Monitoring of DLP for a complete examination takes account
also of the volume of irradiation, as determined, for example, by the number of slices in serial
scanning or the acquisition time in spiral scanning, and the number of such scan sequences
conducted during the examination. Such dose data provide useful indications of relative
patient exposure for a given type of procedure. Values of DLP may also be used to derive
broad estimates of effective dose for CT procedures using region-specific coefficients [7, 9].
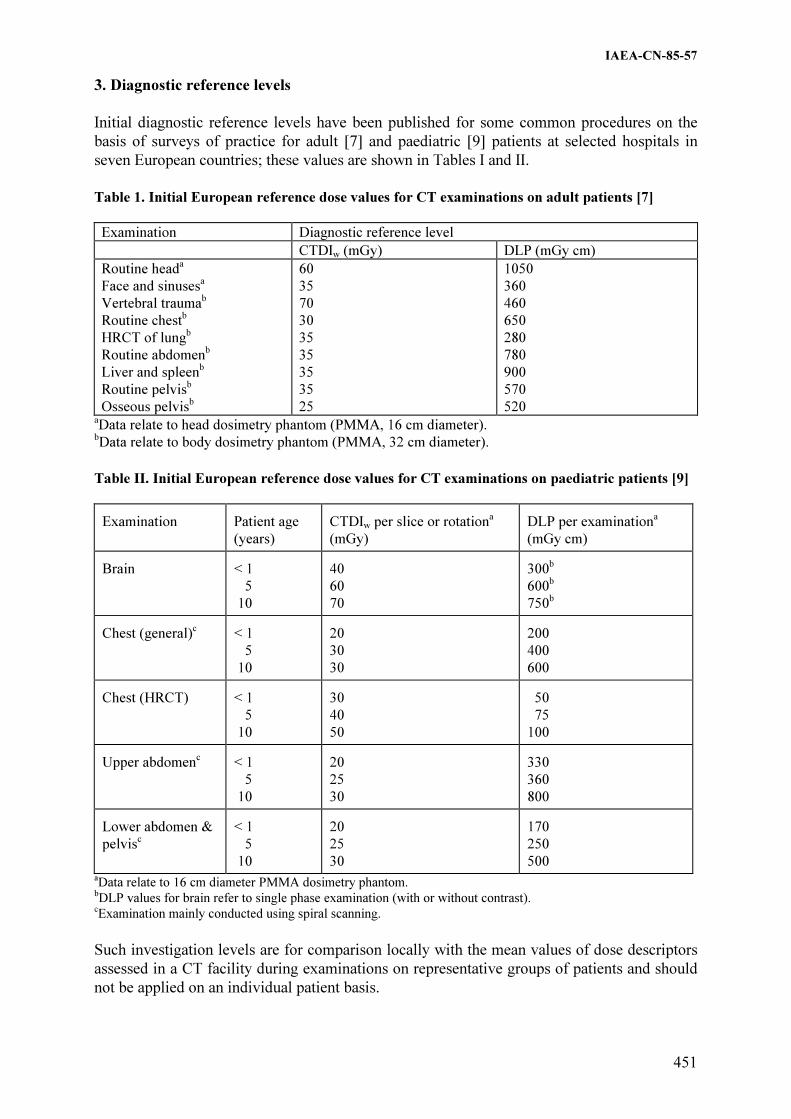
IAEA-CN-85-57
451
3. Diagnostic reference levels
Initial diagnostic reference levels have been published for some common procedures on the
basis of surveys of practice for adult [7] and paediatric [9] patients at selected hospitals in
seven European countries; these values are shown in Tables I and II.
Table 1. Initial European reference dose values for CT examinations on adult patients [7]
Examination Diagnostic reference level
CTDIw (mGy) DLP (mGy cm)
Routine heada
Face and sinusesa
Vertebral traumab
Routine chestb
HRCT of lungb
Routine abdomenb
Liver and spleenb
Routine pelvisb
Osseous pelvisb
60
35
70
30
35
35
35
35
25
1050
360
460
650
280
780
900
570
520 aData relate to head dosimetry phantom (PMMA, 16 cm diameter).
bData relate to body dosimetry phantom (PMMA, 32 cm diameter).
Table II. Initial European reference dose values for CT examinations on paediatric patients [9]
Examination
Patient age
(years)
CTDIw per slice or rotation
a
(mGy)
DLP per examination
a
(mGy cm) Brain
< 1
5
10
40
60
70
300
b
600b
750b
Chest (general)
c
< 1
5
10
20
30
30
200
400
600 Chest (HRCT)
< 1
5
10
30
40
50
50
75
100 Upper abdomen
c
< 1
5
10
20
25
30
330
360
800 Lower abdomen &
pelvisc
< 1
5
10
20
25
30
170
250
500 aData relate to 16 cm diameter PMMA dosimetry phantom. bDLP values for brain refer to single phase examination (with or without contrast). cExamination mainly conducted using spiral scanning.
Such investigation levels are for comparison locally with the mean values of dose descriptors
assessed in a CT facility during examinations on representative groups of patients and should
not be applied on an individual patient basis.

IAEA-CN-85-57
452
Specific national DRLs for CT practice in the UK will be established on the basis of
widescale national survey data. The present National Patient Dose Database that is used for
setting and reviewing national DRLs for conventional x-ray examinations [6] will be extended
to include CT.
Acknowledgement
The initial European reference dose values for CT on adult and paediatric patients were
developed as part of EC Contract Nos F14P-CT96-0050 and F14P CT950002, respectively.
References
[1] UNITED NATIONS SCIENTIFIC COMMITTEE ON THE EFFECTS OF ATOMIC
RADIATION, Sources and Effects of Ionizing Radiation, UNSCEAR 2000 Report to
the General Assembly, with Scientific Annexes, UN Sales Publication E.00.IX.3,
United Nations, New York (2000).
[2] SHRIMPTON, P.C., JESSEN, K.A., GELEIJNS, J., PANZER, W., TOSI, G.,
Reference doses in computed tomography, Radiat. Prot. Dosim. 80 1-3 (1998) 55-59.
[3] INTERNATIONAL COMMISSION ON RADIOLOGICAL PROTECTION,
Radiological protection and safety in medicine, ICRP Publication 73, Annals of the
ICRP 26 2, Pergamon Press, Oxford (1996).
[4] EUROPEAN COMMISSION, Council Directive 97/43/EURATOM of 30 June 1997
on Health Protection of Individuals Against the Dangers of Ionising Radiation in
Relation to Medical Exposure, Off. J. Eur. Commun., L180 (1997) 22-27.
[5] WALL, B.F., SHRIMPTON, P.C., The historical development of reference doses in
diagnostic radiology, Radiat. Prot. Dosim. 80 1-3 (1998) 15-20.
[6] HART, D., HILLIER, M.C., Wall, B.F, SHRIMPTON, P.C., BUNGAY, D., Doses to
Patients from Medical X-ray Examinations in the UK - 1995 Review, NRPB-R289,
NRPB, Chilton (1996).
[7] EUROPEAN COMMISSION, Quality Criteria for Computed Tomography, EUR
16262, EC, Luxembourg (1999).
[8] INTERNATIONAL ELECTOTECHNICAL COMMISSION, Medical Electrical
Equipment – Part 2: Particular Requirements for the Safety of X-ray Equipment for
Computed Tomography, IEC Standard 60601-2-44, IEC, Geneva (1999).
[9] SHRIMPTON, P.C., WALL, B.F., Reference doses for paediatric computed
tomography, Radiat. Prot. Dosim. 90 1-2 (2000) 249-252.

IAEA-CN-85-59
453
THE ESTABLISHMENT AND USE OF DOSE REFERENCE LEVELS
IN GENERAL PAEDIATRIC RADIOLOGY
P.J. Marsden*, J. Hardwick, C. Mencik, C. McLaren, C. Young, P. Mashford
Department of Radiology, Great Ormond Street Hospital for Children NHS Trust,
London, United Kingdom
*Department of Medical Physics and Bioengineering, UCL Hospitals NHS Trust,
London, United Kingdom Abstract
Diagnostic reference levels for general paediatric radiology have been established in terms of delivered exposure
parameters rather than skin dose or dose-area product. With supporting measurements from equipment quality
assurance and assumptions of standard patient sizes it was possible to derive reference levels in terms of entrance
surface dose. This allowed comparison to be made with other published data. The reference levels for common
examinations are presented for different age bands. There is a notable variation with patient age for some
examinations which is not apparent in other published data.
1. Introduction
The Medical Exposure Directive of the European Union [1] and the resultant Ionising
Radiation (Medical Exposure) Regulations [2] in Great Britain, call for the establishment of
diagnostic reference levels for radiodiagnostic practices for typical examinations for groups of
standard-sized patients. These reference levels should be interpreted as an expected upper
bound on the radiation dose delivered to an exposed individual under normal circumstances.
Such a level is not to be taken as a limit, though investigations should be carried out if the
levels are consistently exceeded.
In a specialist paediatric hospital, one is faced with the immediate difficulty of not having a
standard sized patient, which leads to multiple diagnostic reference levels for each
examination. A further problem arises with the selection of dose quantity for the reference
level. For some modalities one can use the same quantities as would apply to adults (dose-area
product for fluoroscopy, CTDI or total mAs for computed tomography and administered
activity for nuclear medicine). However, difficulties arise in general radiography, where for a
number of examinations the preferred dose quantity, dose-area product, can not be used as
currently available meters are too insensitive. An alternative approach was therefore adopted
for all general radiographic examinations, basing the diagnostic reference levels on exposure
parameters and using standard protocols and quality assurance results to link these to more
universally recognisable dose indicators.
2. Method
It was decided to adopt five commonly used age bands for paediatric dosimetry, namely <1
year, 1 to 5 years, 5 to 10 years, 10 to 15 years and 15+ years. Once reference levels have been
determined for each age group and dose data surveyed, it may be possible to refine these age
bands and reduce the number of different levels set.
The standard operating protocols for general radiography [3] include guidance on typical
exposure parameters to set for the age bands given above. Variation in patient size and clinical
requirement calls for flexibility within each band, and so a range of exposure parameters is
usually quoted. Table I gives an example of the exposure guidance in the standard operating
protocol for routine chests.

IAEA-CN-85-59
454
Table I. Sample Exposure Chart for PA Chest X-Rays
Age Band kV mAs
<1 60 – 65 2.0 – 2.5
1 – 5 65 – 70 2.0 – 3.2
5 – 10 70 – 75 2.5 – 3.2
10 - 15 70 – 75 3.0 – 6.0
The exposure parameters were selected following prolonged assessment of image quality on a
recently installed computed radiology imaging system. This assessment is ongoing, and may
result in further changes being made in the future.
As a starting point, the diagnostic reference level (DRL) for each examination was set to the
maximum kV/mAs combination recommended for each age band. For example, the DRL for a
PA Chest on a 7 year old child would be 75kV and 3.2mAs.
There is a requirement in the Directive, and in the national legislation, to have regard to
European diagnostic reference levels where available. Such data as there is on paediatric doses
tends to quote dose levels (and hence DRLs) as entrance surface dose (ESD). In order to make
comparison with this data, and to contribute to the pool of available dose levels, it was
therefore necessary to convert from kV/mAs to entrance surface dose. This was achieved
using quality assurance measurement to determine the dose in air at the distance equivalent to
the entrance surface and to make tissue:air and backscatter corrections in order to arrive at a
skin dose at that point [4]. The equation used for this calculation is:
BSFFSD
L
)/(
)/(DD
2
airen
muscleen
airsurface ��
���
���
��
where L is the output measurement distance, FSD is the focus skin distance, BSF is the
backscatter factor and �en/� is the mass energy absorption coefficient for the given medium.
Routine quality assurance on the general radiology equipment included radiation output
measurements at 10kV intervals across the diagnostic range, and at fixed kV for a range of
mAs values. The total filtration of the beam is also assessed routinely. Given that the
relationship between kV and output is of the form [5] nkVmAs/Gy ��
the value of n was determined from the gradient of a logarithmic plot and the radiation output
calculated for any intermediate kV value.
The standard operating protocol for each examination specifies a focus to image receptor
distance. The focus to entrance surface distance was determined from this by subtracting the
patient thickness. Direct measurement of this would place a significant burden on the
operator, so standard thickness values were taken from published data [6]. Radiation output at
this distance was then calculated using an inverse square correction from the standard output
measurement distance.
To correct for dose to tissue, the ratio of mass energy absorption coefficients for tissue and air
was included. A value of 1.06 was assumed to be valid across the diagnostic energy range [4].

IAEA-CN-85-59
455
Table II. Calculated Diagnostic Reference Level (DRL) as Entrance Surface Dose (ESD)
Examination Age Band DRL
kV
DRL
mAs
ESD
(����Gy)
E
(����Gy)
ESD (����Gy)
Ref [8]
ESD (����Gy)
Ref [6]
Skull AP <1 65 4 266 5.1 800
1 to 5 65 8 546 6.2 1500 1100
5 to 10 67 10 728 5.6 1100
10 to 15 70 13 1051 8.7 1100
Skull LAT <1 65 3.2 193 4.7 500
1 to 5 65 7 440 6.0 1000 800
5 to 10 67 8 532 6.5 800
10 to 15 70 10 738 7.7 800
Chest PA/AP <1 65 5 83 8.1 50
1 to 5 70 3.2 64 6.9 100 70
5 to 10 75 3.2 77 8.6 120
10 to 15 75 6 148 10.8
Chest LAT <1 65 4 69 7.3
1 to 5 75 5 123 11.7 200
5 to 10 80 7 209 18.5
10 to 15 80 8 256 15.4
Abdomen AP <1 63 2 121 21.6 400
1 to 5 65 4 273 46.9 1000 500
5 to 10 65 12 868 132.0 800
10 to 15 75 16 1649 196.2 1200
Pelvis AP <1 63 2.5 149 18.6 200 500
1 to 5 65 4 271 37.4 900 600
5 to 10 65 12 864 76.9 700
10 to 15 75 16 1646 158.8 2000
C-spine AP <1
1 to 5
5 to 10 65 5 323 14.1
10 to 15 65 6 442 18.0
C-spine LAT <1
1 to 5
5 to 10 70 8 171 3.9
10 to 15 75 12 331 6.9
T-spine AP <1
1 to 5
5 to 10 75 10 913 102.2
10 to 15 80 16 1792 401.4
T-spine LAT <1
1 to 5
5 to 10 85 16 2254 209.6
10 to 15 85 20 3193 196.4
L-spine AP <1
1 to 5
5 to 10 75 16 1536 146.2
10 to 15 70 20 1748 111.7
L-spine LAT <1
1 to 5
5 to 10 75 25 2806 102.7
10 to 15 85 25 4102 111.6

IAEA-CN-85-59
456
The backscatter factor depends on X-ray beam quality and field and patient size. Backscatter
fraction data have been published by the National Radiological Protection Board (NRPB) for
typical examinations for children of different ages [7]. Their data is tabulated for different kV
and beam filtration values. Values corresponding to the kV and filtration used were derived
from this data set by linear interpolation.
Table II presents the results of the calculations based on the current diagnostic reference levels
in use at the hospital. The 5th
column gives the calculated entrance surface dose. The 7th
and
8th
columns make comparison with published data from the European Commission [8] and
Hart et. al. [6] respectively. In each case the authors quote values for a specific age, rather
than age range. To assist with comparison, their quoted values are tabulated to correspond
with our upper age range. For example, a DRL for a 5 year old is placed alongside our 1 – 5
year old data. The 6th
column presents estimates of effective dose using Monte-Carlo factors
published by the NRPB [7].
Cases where DRLs have been exceeded are recorded separately and investigations triggered if
the proportion of cases exceeds 25% of the total number performed within the audit period.
3. Conclusions
The diagnostic reference levels established at Great Ormond Street Hospital for general
paediatric radiography are easy to use as they are in units which correspond to the exposure
chart in each room and do not vary according to the examination. As more sensitive DAP
meters become available the hospital may move towards using this quantity for the DRL, but
it is unlikely that routine skin doses would be measured.
One of the potential drawbacks to using a kV/mAs combination for a DRL is that it is possible
to exceed the DRL whilst giving a lower dose to the patient. For example, giving an exposure
of 76kV and 2.5mAs for a PA Chest on a 7 year old child would exceed the DRL (75kV and
3.2mAs) but would result in a lower skin dose. The impact of this will be assessed as cases of
DRLs being exceeded are audited in the future.
With regard to age bands, there is scope for reducing the number of bands in examinations
where the skin dose derivation of the DRLs varies little. There is, however, clear indication
that some examinations have a steep rise in dose with patient age. The European Commission
guidelines [8] only quote data for 5 year old children in most circumstances, stating that
entrance surface dose values they collated varied little between infants and 5 and 10 year old
children. The data from Hart et. al. [6] shows little variation in reference level with age for
some examinations (e.g. skull), but quite marked variation in others (in particular for the
pelvis). It should also be noted that there are some marked differences in values reported in
the two references (e.g. for a 5 year old abdomen).
If the results presented here are of interest to other paediatric centres, it should be emphasised
that the exposure parameters are being adapted to a computed radiology (CR) system, which
has required considerable changes. In particular, the move to reduce patient dose by increasing
kV and reducing mAs leads to poor image quality in paediatric CR as the mAs falls too low to
avoid quantum noise. The lower absorption edge of the CR plates compared to intensifying
screens in cassettes suggests that image quality is optimised at lower kVs and a new balance
must therefore be found between dose and image quality. The parameters quoted here
represent the current status in the optimisation process.
IAEA-CN-85-59
457
References
[1] Council Directive 97/43/Euratom of 30 June 1997 on health protection of individuals
against the dangers of ionizing radiation in relation to medical exposure, and repealing
Directive 84/466/EURATOM. (OJ L-180 of 09/07/97).
[2] The Ionising Radiation (Medical Exposure) Regulations 2000. Statutory Instrument
2000 No. 1059, Her Majesty’s Stationery Office, London (2000).
[3] HARDWICK J., et al,. IAEA-CN-67/17, these Proceedings.
[4] WALL B.F., et al., Patient Dosimetry Techniques in Diagnostic Radiology. Rep. 53,
IPSM, York (1988).
[5] CRANLEY K., Measurement of the Performance Characteristics of Diagnostic X-Ray
Systems Used in Medicine. Rep. 32 Part I (2nd
Edition), IPEMB, York (1995).
[6] HART D., et al., “The Establishment of Reference Doses in Paediatric Radiology as a
Function of Patient Size”. Medical X Ray Imaging: Potential Impact of the New EC
Directive (Proc. Workshop Malmo, 1999), Rad. Prot. Dosim. 90 1-2 (2000) 235-238.
[7] HART D., et al., Normalised Organ Doses for Paediatric X-Ray Examinations
Calculated using Monte-Carlo Techniques. Rep. NRPB-SR279. Didcot (1996).
[8] European Guidelines on Quality Criteria for Diagnostic Radiographic Images in
Paediatrics. EUR 16261, European Commission (1996).

IAEA-CN-85-139
458
INTRODUCTION OF GUIDANCE DOSE LEVELS IN PAEDIATRICS CT
F.R. Verdun1
, M. Bernasconi2
, P. Schnyder2
, J.F. Valley1
, F. Gudinchet2
1University Institute for Applied Radiophysics,Lausanne, Switzerland
2University Hospital Centre (CHUV),Department of Diagnostic and Interventional Radiology, Switzerland
Abstract
The purpose of this work is to present a methodology in order to define reference levels for chest or abdominal CT examinations performed on children. For children aged from 0 to 6 the CTDIw measured in the head test
object (i.e. ø 16 cm) should be used as a dose indicator. For children older than 12 years old the CTDIw
measured in the body test object (i.e. 32 cm) should be used as a dose indicator. For children aged between 6 to 12 we propose to use an intermediate CTDIw in order to avoid an over or underestimation of the dose delivered
in the slices. Finally a set of dose length products (DLP) measured in our centre for standard abdominal acquisitions will be given.
1. Introduction
In conventional radiology the use of a screen film system as a detector assures, if the films are
correctly processed, that the dose delivered to the patient is within a predictable limit. As a
matter of fact, the latitude of exposure available on a screen film system is relatively limited
(typically one order of magnitude) and a constant exposure is required to produce a
satisfactory film density. On the contrary, digital detectors are characterised by a wide
latitude of exposure (typically 3 to 4 orders of magnitude). This property eliminates the
typical relationship between the radiation exposure and the image optical density. With digital
detectors the only parameter which will be linked to the dose is the image noise. Thus,
radiation protection of the patient have to be emphasized with the use of digital detector
CT examinations represent about 5 % of all the radiological examinations performed on
adults. However, its contribution to the effective dose delivered in radiology is within 27 to
35 % [1-2]. To avoid an uncontrolled increase of the CT contribution on the effective dose
delivered by medical applications a recommendation has been published by the CEC [3]. This
recommendation indicates together with a reference dose some image quality requirements for
the most common examinations. Manufacturers are now offering on their units the possibility
to get a dose indicator corresponding to the examination performed on each patient (i.e.
indication of the CTDIw and the DLP). Thus, it seems now relatively easy for the
radiological community to assess the dose delivered to the patient for CT examinations.
Those can be compared to the reference levels in order to begin an optimization process.
The use of CT in pediatrics is more limited than for adults and at the present time there is no
recommendation to verify if the radiological constants used (kV, mA, pitch …) are adequate.
Very often, the mA reduction (if any) performed by radiographers to scan children has no
strong scientific background.
For adults, two CTDIw has been defined : one to be applied for head of neck examinations
(CTDIw head measured with a test object of 16 cm in diameter) and one to be applied to chest
or abdominal examinations (CTDIw body measured with a test object of 32 cm in diameter).
In paediatrics it seems that these two quantities are not sufficient to introduce reference levels.

IAEA-CN-85-139
459
In this paper we will propose an intermediate CTDIw, which can be derived from the standard
CTDIw used for adults. This CTDIw will be based on the variation of an equivalent abdomen
diameter with age. This concept will be used to present the doses delivered for abdominal
examinations in our centre. These results will be given for a single-slice CT (SSCT) and a
multi-slice CT (MSCT).
2. Material and method
The SSCT used in this study is the HiSpeed CT/i system (GE Medical Systems, Milwaukee,
Wis) and the MSCT used in this study is the LightSpeed QX/i (GE Medical Systems,
Milwaukee, Wis) which allows the sampling of four slices per tube rotation. The CT units
involved in this study calculates and displays the Dose-Length Product (DLP) corresponding
to the acquisition protocol used. The indicated CTDIw and DLP values were verified.
Equivalent abdominal diameters have been estimated by using weight and height tables
corresponding to the paediatric population of Switzerland. To begin with, a PA abdominal
thickness has been estimated by means of the relationship established for fluoroscopy
examination by Leug et al. [4] : PA thickness = 2 [Weight /(1000 x p x Height)]. Since the
abdomen section is closer to an ellipse than a circle an equivalent CT diameter has been
proposed by simply multiplying the PA thickness described previously by 1.5. Using these
data an intermediate CTDIw has been calculated for children aged between 6 to 12 years.
3. Results and discussion
Figure 1 presents the variation of the proposed equivalent CT diameter in function of age.
These data are based on the 3 percentile of the weights and heights distributions mentioned
previously. It appears that the use of the CTDIw measured with the head test object as a dose
indicator is adequate for very young children (i.e. 0 to 6 years old). One can notice that a
diameter of 32 cm is obtained for the age of 18. Thus, the CTDIw measured with the body
test object appears to be a rather good dose indicator for that particular age. In order to
simplify the approach we propose to use this dose indicator for patient older than 12. For
children aged between 6 to 12 the use of a CTDIw measured in a body test object will
underestimate the dose delivered in a slice, whereas the use of a CTDIw measured in a head
test object will overestimate that dose. In order to find a compromise we propose to use a
mean CTDIw : average of the head and body CTDIw.
The head and body CTDIw's have been measured and two CT units at different kilovolts.
Using these data a mean CTDIw have been calculated for both units. The results are
summarised in Table 1.
Using the data presented in Table 1 and the acquisition protocols used in our centre the doses
delivered per slice (i.e. CTDIw divided by the pitch value) have been calculated. For each
category of ages an average scan length has been estimated allowing the DLP calculation.
These data are summarised in Table 2.
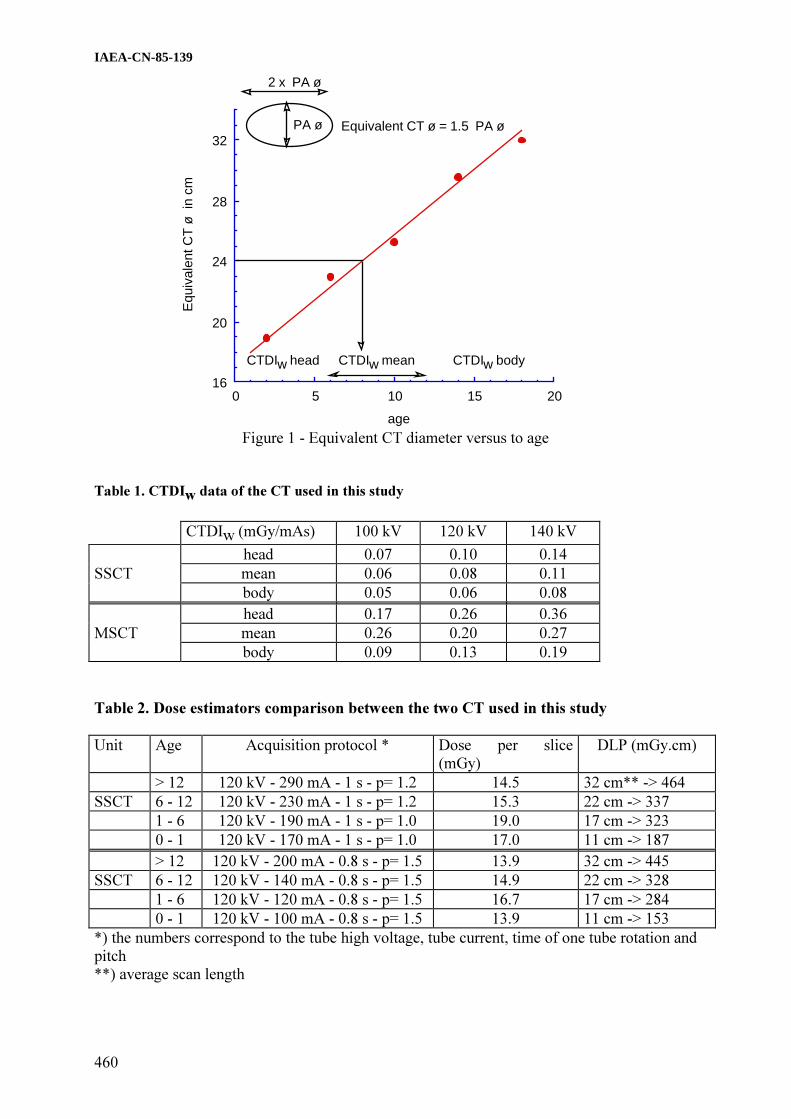
IAEA-CN-85-139
460
16
20
24
28
32
0 5 10 15 20
age
PA ø
2 x PA ø
Equivalent CT ø = 1.5 PA ø
CTDIw bodyCTDIw head CTDIw mean
Equ
ival
entC
Tø
incm
Figure 1 - Equivalent CT diameter versus to age
Table 1. CTDIw data of the CT used in this study
CTDIw (mGy/mAs) 100 kV 120 kV 140 kV
head 0.07 0.10 0.14
SSCT mean 0.06 0.08 0.11
body 0.05 0.06 0.08
head 0.17 0.26 0.36
MSCT mean 0.26 0.20 0.27
body 0.09 0.13 0.19
Table 2. Dose estimators comparison between the two CT used in this study
Unit Age Acquisition protocol * Dose per slice
(mGy)
DLP (mGy.cm)
> 12 120 kV - 290 mA - 1 s - p= 1.2 14.5 32 cm** -> 464
SSCT 6 - 12 120 kV - 230 mA - 1 s - p= 1.2 15.3 22 cm -> 337
1 - 6 120 kV - 190 mA - 1 s - p= 1.0 19.0 17 cm -> 323
0 - 1 120 kV - 170 mA - 1 s - p= 1.0 17.0 11 cm -> 187
> 12 120 kV - 200 mA - 0.8 s - p= 1.5 13.9 32 cm -> 445
SSCT 6 - 12 120 kV - 140 mA - 0.8 s - p= 1.5 14.9 22 cm -> 328
1 - 6 120 kV - 120 mA - 0.8 s - p= 1.5 16.7 17 cm -> 284
0 - 1 120 kV - 100 mA - 0.8 s - p= 1.5 13.9 11 cm -> 153
*) the numbers correspond to the tube high voltage, tube current, time of one tube rotation and
pitch
**) average scan length

IAEA-CN-85-139
461
The data presented in this study show that for the standard abdominal acquisition presented
here the dose per slice as defined remains almost constant with the age of the patient (i.e. 15
mGy). From our data it appears that the following DLP reference values could be applied : [0
- < 1 year] : 170 mGy.cm ; [1 - < 6 years] : 300 mGy.cm; [6 - < 12 years] : 350 mGy.cm ; and
[12 - <18 years] : 450 mGy.cm.
The same methodology was applied to the examinations of the chest. The results show that a
significant lower dose delivered in the slice could be used (i.e. 7 mGy). This particular
situation is due to the lower X-ray absorption of the tissue.
4. Conclusion
DLP's have been proposed for the standard abdominal examinations in pediatrics CT. The
acquisition protocols presented here are considered optimized by our radiographer, since a
dose reduction would lead to a drastic image quality reduction. Using these data, the image
quality obtained is accepted by our radiologists. It is interesting to notice that the dose per
slice remains almost constant for a wide variation of CT equivalent diameter. This result
should now be integrated in a simulation in order to verify if a better solution could be
reached.
References
[1] Aroua A., Vader J.P., Burnand B., Valley J.-F. Swiss nationwide survey on radiation
dose in diagnostic radiology. 10th Intl. Congress IRPA, May 14-19 Hiroshima.
[2] Stahlenexposition in der CT, Nagel et al. Editor Nagel, Hamburg, 1999
[3] Commission of the European Communities. Quality criteria for computed tomography,
EUR 16262 (1999).
[4] Leug K.C., Martin C.J. Effective doses for coronary angiography. Br. J. Radiol 69
(1996) 426-431.

IAEA-CN-85-55
462
IMPLEMENTATION OF DIAGNOSTIC REFERENCE LEVELS
FOR X-RAY EXAMINATIONS IN THE UK
B.F. Wall
National Radiological Protection Board, Chilton, Didcot, United Kingdom
Abstract
Since 1992 NRPB has maintained a computer database of the results sent in from x-ray departments throughout
the UK that are following the National Protocol for Patient Dose Measurements in Diagnostic Radiology.
Reviews of the database take place every five years, the first occurring in 1995 and the second due at the end of
2000. As well as providing useful information on trends in patient doses in the UK, the reviews will also be used
as the basis for deriving and updating national diagnostic reference levels (DRLs). The new regulations
implementing the EC Medical Exposure Directive in the UK require that DRLs and procedures for their use be
established in every radiology department. Guidance issued by the Department of Health indicates that DRLs can
be based on local dose records, if available, but that national reference levels may be adopted in the first instance.
Strict justification will be required for setting locally-derived DRLs which exceed any corresponding national
levels. The national DRLs will be of considerable value to the smaller x-ray departments that do not have
sufficient resources or patient throughput to establish their own.
1. Introduction
Periodic monitoring of patient doses from diagnostic x-ray examinations following a national
protocol [1] is widespread throughout the UK, with hospital physicists sending the results of
their local surveys to NRPB for national collation. By the end of 1995 the national patient
dose database contained the results of over 50,000 patient dose measurements made at 375
hospitals. A review of these data by NRPB [2] revealed that, by then, only about 10% of
hospitals were exceeding the reference doses listed in the protocol for 8 common types of x-
ray examination, which had been based on a national patient dose survey in the mid 1980s.
The 1995 review revealed that the mean and third quartile values of the dose distributions had
dropped by about 30% since the earlier national survey. However, although the distributions
of typical doses had shifted downwards, the variability between hospitals remained as high as
before, indicating a continuing need for reference doses to help identify and bring more into
line those hospitals at the top end of the dose range. By 1997, when the new EC Medical
Exposure Directive (MED) [3] was published, many UK X-ray departments were already
using the 1995 review data [2] to set lower reference doses for local use. Regulations to
implement the MED in the UK came into force in May 2000 [4] and include the requirement
for all hospitals, clinics and surgeries engaging in diagnostic medical exposures to establish
Diagnostic Reference Levels (DRLs) and to produce (and adhere to) written procedures for
their use. A Working Party was consequently set up by the Department of Health in January
2000, with representatives from all the professional bodies involved in diagnostic medical
exposures in the UK, to provide formal guidance on the establishment and use of DRLs.
2. DRLs at the national level
It was recognised by the Working Party that an urgent first step was to revise the reference
doses recommended in the 1992 national protocol [1] to be more representative of current UK
practice. Consequently, new national DRLs based on the 1995 review of NRPB’s national
patient dose database [2] were formally adopted, with the recommendation that they be
reviewed every five years. The new set of national DRLs is shown in Table I. It is derived
from rounded 3rd
quartile values of the distributions of the mean dose on a representative

IAEA-CN-85-55
463
sample of patients at each hospital in the database, for each of 12 types of radiograph and 3
types of complete examination. In accordance with the national protocol, DRLs are expressed
in terms of the entrance surface dose per radiograph (including backscatter from the patient)
and the dose–area product per complete examination.
Table I. New national DRLs for some common x-ray examinations
Radiograph/Examination
Diagnostic reference level
Entrance surface dose
(mGy)
Dose-area product
(Gy cm2)
Skull AP/PA 4 -
Skull LAT 2 -
Chest PA 0.2 -
Chest LAT 0.7 -
Thoracic spine AP 5 -
Thoracic spine LAT 16 -
Lumbar spine AP 7 -
Lumbar spine LAT 19 -
Lumbar spine LSJ 36 -
Abdomen AP 7 -
Pelvis AP 5 -
IVU - 23
Barium meal - 17
Barium enema - 32
Although it is not expected that DRLs will be established for every type of x-ray examination,
there is a need to extend the list beyond the few common procedures shown in Table I. There
is a requirement in the MED to pay special attention to medical exposures of children and to
procedures involving high doses. Priority is consequently being given to developing a method
for establishing reference doses for common x-ray examinations on children and to extending
the national database to cover some of the increasingly practised high-dose procedures using
computed tomography (CT) and extensive fluoroscopy (for example in interventional
radiology).
A method for establishing reference doses in paediatric radiology which are directly related to
the size of the patient is discussed in NRPB-R318 [5] and in a paper by Hart and Wall in these
proceedings [6]. Computed tomography (CT) examinations are estimated to be responsible for
about 40% of the collective dose from all medical x-ray examinations in the UK, so it is
essential that the more common types of CT examination are also included in the national
database. A framework for establishing CT DRLs has been developed in European
Guidelines on Quality Criteria for Computed Tomography [7], based on the dose quantities,
weighted CT dose index (CTDIW) and dose-length product (DLP). This approach to CT
dosimetry and its potential use for establishing DRLs at the national level for common CT
examinations in the UK, is discussed in a paper by Shrimpton in these proceedings [8].
To extend the range of examinations for which national DRLs can be established, contributors
to the national patient dose database have been encouraged to supply data for most of those

IAEA-CN-85-55
464
procedures which are among the top 25 contributors to the collective dose from all medical x-
ray examinations in the UK. In addition, to give special attention to children and high-dose
procedures, data is encouraged for six common types of paediatric examination and for some
of the more common and standardised types of interventional procedure. Consideration is also
being given to deriving national DRLs for mammography and dental radiography from the
data available in recent extensive patient dose surveys in the UK. It is hoped that the next
review of the database in 2001 will form the basis for a substantially revised and extended list
of DRLs for consideration by the Department of Health Working Party.
3. DRLs at the local level
The new medical exposure regulations in the UK [3] require all hospitals to have procedures
in place for establishing DRLs, for the regular assessment of patient doses and for checking
compliance with DRLs. Periodic measurements for the purpose of assessing representative
patient doses are also required by other legislation dealing with quality assurance of medical
imaging equipment [9].
There are basically three options available to hospitals for establishing DRLs locally. They
can either adopt the national DRLs, use regional patient dose data to derive essentially
regional DRLs and adopt them for local use, or use their own hospital dose data to derive
reference levels that are specific to their own practice. If sufficient regional dose data are
available from enough hospitals on representative groups of patients, regional DRLs can be
established in the same way as the national DRLs. They can have the advantage of being more
up to date and more relevant to local practice than the national DRLs, but to be as effective in
identifying bad practice, they should be no higher than any corresponding national DRLs.
A hospital may specialise in a medical imaging procedure for which no national or regional
DRL is available. In this case, dose data from just the one hospital could be used to establish a
typical dose to a representative group of patients for that procedure. This could be used as a
“reference dose” against which to assess trends in time at that hospital or to compare different
sets of imaging equipment or the procedures used by different “operators”. When derived in
this way from ‘very local data’, the reference levels are useful tools for local quality assurance
and clinical audit programmes, but do not necessarily provide a guide to generally accepted
good practice.
Local patient dose monitoring is required to establish whether DRLs are being consistently
exceeded and whether corrective action is required. The DH Working Party recognised that
practical guidance was needed on effective methods for carrying out this monitoring while
also complying with the equipment quality assurance requirements of other regulations [9].
The Institute of Physics and Engineering in Medicine (IPEM) consequently convened a
Working Party in October 2000 to provide such guidance. It will essentially be an extension of
the 1992 national protocol for patient dose measurements [1] giving practical advice on how
to comply with all the new requirements of the recent regulations for patient dose monitoring
in diagnostic radiology. An IPEM report containing this guidance is planned to be published at
around the time of this conference.

IAEA-CN-85-55
465
References
[1] DOSIMETRY WORKING PARTY OF THE INSTITUTE OF PHYSICAL SCIENCES
IN MEDICINE, National Protocol for Patient Dose Measurements in Diagnostic
Radiology, NRPB, Chilton (1992)
[2] HART, D., WALL, B. F., SHRIMPTON, P. C., BUNGAY, D., Doses to Patients from
Medical X-ray Examinations in the UK – 1995 Review, NRPB-R289, NRPB, Chilton
(1996).
[3] EUROPEAN COMMISSION, Council Directive 97/43/Euratom of 30 June 1997 on
health protection of individuals against the dangers of ionising radiation in relation to
medical exposure, Off. J. Eur. Commun., L180 (1997).
[4] GB SECRETARY OF STATE, The Ionising Radiation (Medical Exposure) Regulations
2000, Statutory Instruments 2000 No. 1059, The Stationery Office, London (2000).
[5] HART, D., WALL, B. F., SHRIMPTON, P. C., BUNGAY, D., DANCE D.R.,
Reference Doses and Patient Size in Paediatric Radiology. NRPB-R318. NRPB, Chilton
(2000).
[6] HART, D., WALL, B. F., Development of Diagnostic Reference Levels in Paediatric
Radiology, IAEA-CN-70/17, these Proceedings.
[7] EUROPEAN COMMISSION, European Guidelines on Quality Criteria for Computed
Tomography, EUR 16262, EC, Luxembourg (1999).
[8] SHRIMPTON, P. C., WALL, B. F., Reference Dosimetry for CT in the UK, IAEA-CN-
70/17, these Proceedings.
[9] GB SECRETARY OF STATE, The Ionising Radiation Regulations 1999, Statutory
Instruments 1999 No. 3232, The Stationery Office, London (2000).
IAEA-CN-85-259
466
DIAGNOSTIC REFERENCE ACTIVITIES FOR NUCLEAR MEDICINE
IN AUSTRALIA AND NEW ZEALAND
J.E. Towson1, R.C. Smart
2
1Department of PET and Nuclear Medicine, Royal Prince Alfred Hospital, Camperdown,
Australia 2Department of Nuclear Medicine, St. George Hospital, Kogarah, Australia
Abstract
Nuclear medicine centres in Australia and New Zealand were surveyed in 1998 on behalf of the Australian and
New Zealand Society of Nuclear Medicine (ANZSNM) and the Australasian Radiation Protection Society
(ARPS) in order to establish diagnostic reference levels. A survey form was mailed to all centres, requesting
information on the usual radiopharmaceutical activity administered to a standard adult patient and how the
activity is calculated for children. The overall response rate was 89.5%. Data was obtained for 80 imaging
procedures and 17 non-imaging tracer studies. For the 68 procedures for which data was available from 10 or
more centres, the Most Common Activity and the Reference Activity were found from the mode and 75th
percentile of the distribution of activities. A follow-up survey of the 8 hospital centres specialising in pediatric
nuclear medicine in Australia was conducted in 1999-2000. Data on the maximum and minimum administered
activities (Amax and Amin) was obtained for 43 pediatric imaging procedures. Amax values were significantly less
than the Reference Activities determined for adults. The median values of Amax and Amin are recommended as
Pediatric Reference Activities. The effective dose from the Reference Activities was calculated for adults (male
and female) and children. The survey results are available on the ANZSNM and ARPS websites at
http://www.anzsnm.org.au and http://www.arps.org.au .
1. Introduction
The ICRP introduced the term diagnostic reference levels (also known as guidance levels) in
1996. In the case of nuclear medicine the quantity of reference is generally taken to be the
radiopharmaceutical activity administered to “a typical adult patient”. Reference levels are
usually set at the 75th percentile (3rd quartile) or within a specified range of the median (2nd
quartile) of the values used in routine clinical practice, parameters which are independent of
the shape of the distribution of values or the presence of outlying values. The ICRP
recommends that reference levels should be established by the appropriate professional
organisations.
ANZSNM and ARPS convened a Working Party to survey the radiopharmaceutical activities
used routinely in Australia and New Zealand, and to derive diagnostic reference levels from
the survey. [1] The initiative was supported by the Australian and New Zealand Association of
Physicians in Nuclear Medicine and the Australasian College of Physical Scientists and
Engineers in Medicine.
2. Methods
In 1998 a survey form was sent to all nuclear medicine departments and private practices in
Australia and New Zealand known to the Working Party, 172 in all. The survey form did not
identify the centre (other than whether it was in Australia or New Zealand, and if in a capital
city or a regional centre). Information was sought as to whether the centre was a public
hospital, private hospital or private practice, and the proportions of inpatients and pediatric
patients.
The survey form listed 70 different imaging procedures and 8 non-imaging procedures, with
space for the centre to add any further studies. Myocardial perfusion imaging required eight

IAEA-CN-85-259
467
entries on the form in order to cover all procedural variations (eg 2 day stress/rest with 99m
Tc
agent, 1 day rest/stress, 1 day stress/rest, etc). For each procedure that it performed, the centre
was asked to state the radiopharmaceutical form and activity that it would administer to a
standard adult patient for both planar and SPECT studies. The centre was also asked how it
determines the activity administered for a lung ventilation study, whether it uses less activity
when imaging with a multi-detector system, how it calculates the activity to administer to a
pediatric patient and what would be the minimum activity administered to an infant.
Due to the poor quality data for pediatric procedures obtained in this survey, a follow-up
survey of the eight specialist pediatric nuclear medicine centres in Australian hospitals was
conducted in 1999-2000 to obtain better guidance for pediatric procedures. Each centre stated
how it calculates the activity to administer to a pediatric patient, the usual activity it would
administer to an adult-sized patient (Amax) and the minimum activity (Amin) it would
administer to an infant.
3. Results
A total of 96 completed survey forms were received from the original survey. It is common
for private practices in Australia to be part of a multi-centre group. The 96 returned forms
represented a total of 154 centres, an overall response rate of 89.5%. Two-thirds of the
responses were from capital cities with the remaining one-third being from regional areas.
Fifty seven percent of the responses were from private practices, 29% from public hospitals
and the remaining 14% from private hospitals. The high proportion of private practices was
also reflected in the proportion of outpatients studied - most centres performing at least 70%
of their procedures on outpatients. Paediatric patients most commonly represented 10% or less
of the practice workload. Centres do not reduce the administered activities for planar studies
compared to SPECT or when using multi-head detectors.
An additional ten imaging procedures and nine non-imaging procedures were identified from
the responses, giving a total of 80 imaging procedures and 17 non-imaging procedures. Bone
scans are the most common nuclear medicine procedure in Australia and New Zealand, being
performed in all centres who responded to the survey. There were wide variations in
administered activities, eg. 99m
Tc phosphonates for bone scans ranged from 600 MBq to 1500
MBq, 99m
Tc-MAG3 for renal scans ranged from 100 MBq to 800 MBq. Five myocardial
perfusion protocols were in common use: 201
Tl was used by 44% of centres; 99m
Tc agents,
primarily sestamibi, were used by the remaining 56%. The one-day rest/stress 99m
Tc protocol
was most commonly used, although it was far from universal. A few centres used a combined 201
Tl rest/ 99m
Tc stress protocol. Only two centres used 133
Xe gas in preference to 99m
Tc
aerosol or 99m
Tc-Technegas. External monitoring of the count rate over the patient’s chest
during the inhalation procedure was the most common means of estimating when the activity
in the patient’s lungs was adequate for diagnostic imaging.
For each procedure a frequency distribution of the administered activity was generated. For
those procedures with ten or more responses, 68 in all, the mode and the 75th
percentile of the
distribution were determined as the Most Common Activity (MCA) and the Reference
Activity respectively. For lung ventilation scans, the 75th percentile of the count rate
distribution was 2000 c/s, which was assumed to correspond to 40 MBq of 99m
Tc
administered.
IAEA-CN-85-259
468
Not all of the imaging procedures in the original survey are applicable to pediatric nuclear
medicine. In the follow-up survey of the eight pediatric centres, there were 43 imaging
procedures for which information was provided by at least two of the centres. The most
commonly performed pediatric procedures were said to be bone, renal (99m
Tc-MAG3, 99m
Tc-
DTPA and 99m
Tc-DMSA) and tumor (67
Ga citrate, 201
Tl chloride and 123
I-mIBG), followed by
hepatobiliary (99m
Tc-IDA derivatives). Data was provided for two pediatric myocardial
perfusion protocols: six centres reported 201
Tl chloride stress and rest activities, four of the
same centres also reported a 1-day rest/stress protocol using 99m
Tc-sestamibi. All centres used 99m
Tc -Technegas or 99m
Tc-DTPA aerosol for lung scans.
The median values of Amax and Amin were determined for each procedure with two or more
responses, being considered a more useful guide than the mode or 75th
percentile given the
very small sample sizes and obvious ‘outlier’ values. The pediatric Amax median values are
similar to the corresponding MCAs and significantly less than the Reference Activities for
adults. The variability in Amin was less than in the original survey, even though it was more
than 5-fold for 8 of the 43 procedures. The median values of Amax and Amin are recommended
as Pediatric Reference Activities, with Amax capped by the adult Reference Activity.
Three of the pediatric centres calculate the activity to be administered to an individual patient
by scaling Amax by the ratio of the patient’s body weight to 70kg. The other five centres use
scaling factors which represent surface area as a function of body weight, obtained from look-
up tables or the ‘Gilday Chart’ which has surface area scaling factors transposed to the x-axis
and weight on the y-axis.[2] The surface area factors used are identical to those recommended
by the EANM.[3]
The effective doses from the Most Common Activity and the Reference Activity were
calculated for each procedure, using ‘standard man’ dose coefficients preferably from ICRP
80 [4]. Effective dose values for females were calculated by scaling the ‘standard man’ value
by the ratio of effective doses (female/male) given by Stabin. [5] For any radiopharmaceutical
not listed by Stabin a ratio of 1.25 was used, being the average of all the ratios determined by
Stabin.
Similarly, the effective dose for the 43 pediatric imaging procedures was calculated for the
Pediatric Reference Activities and both scaling methods using effective dose coefficients,
preferably from ICRP 80, for children aged 0, 1, 5, 10 and 15 years. [4] Scaling factors were
applied for ‘standard child’ weights for these ages. The larger of the Amin Reference Activity
and the scaled activity was used in the dose calculations. The survey provides a realistic
picture of pediatric exposures from nuclear medicine in Australia. Procedures fall into three
broad categories:
�� high dose, of the order of tens of mSv, for 201
Tl-chloride and 67
Ga-citrate
�� moderate dose, about 10 mSv, for 99m
Tc labelled HMPAO, red cells and sestamibi
�� low dose, less than 5 mSv, for the remainder.

IAEA-CN-85-259
469
Table 1. Comparison of survey Reference Activities (MBq) with recommendations from EANM
[3] and IAEA Basic Safety Standards (BSS) Schedule 3, Table III-V (*indicates SPECT value)
Procedure R’pharm adults children
survey
Ref.Act
BSS survey
Amax
EANM
Amax
survey
Amin
EANM
Amin
blood pool 99m
Tc rbc 1000 - 770 800 90 80
bone 99m
Tc MDP 900 800 750 500 70 40
bone marrow 99m
Tc n.colloid 400 400 400 300 80 20
brain 99m
Tc HMPAO 800 500 740 740 100 100
cardiac GHPS 99m
Tc rbc 1000 800 800 - 80 -
gastric reflux,
GIT motility
99mTc colloid 40 12 40 40 25 10
hepatobiliary 99m
Tc HIDA 200 150 170 150 25 20
infection 99m
Tc wbc 740 400 400 500 100 40
infection 67
Ga citrate 200 - 150 80 20 10
liver/spleen 99m
Tc colloid 200 200 * 150 80 20 15
lung perfusion 99m
Tc MAA 200 200 * 150 80 20 10
myocard perf 99m
Tc mibi
1 d rest+stress
400
+1100
- 300
+1000
- 40
+110
-
myocard perf 201
Tl chloride 120 80 100 - 25 -
renal scan 99m
Tc DMSA 185 160 130 100 35 15
renal scan 99m
Tc DTPA 500 350 370 200 50 20
renal scan 99m
Tc MAG3 350 100 180 70 30 15
thyroid 99m
Tc pertech 200 80 120 80 20 10
tumor 123
I mIBG 370 400 250 200 70 70
tumor 131
I mIBG 40 20 40 80 20 35
tumor 201
Tl chloride 160 - 120 - 20 -
tumor 67
Ga citrate 400 300 300 80 30 10
tumor 99m
Tc mibi
800 - 720 - 100 -
met.Ca thyroid 131
I iodide 200 400 - - - -
Data for all procedures, including the effective dose estimates for adults and children, are
available on http://www.anzsnm.org.au and http://www.arps.org.au .
4. Discussion
Little attention has been directed towards establishing reference levels for nuclear medicine.
[6] The IAEA gives no indication as to how the values in the BSS were derived. Currently
there are no reference activities recommended by regulatory bodies in Australia. New Zealand
has published reference activities, however these were not derived from a survey of current
practice. [7]
The Reference Activities from the survey are between a factor of 1.0 and 1.3 higher than those
in New Zealand, and up to two times higher than the IAEA values in the BSS. The factor of 2
for the BSS comparison is for a perfusion lung scan, for which the BSS recommends 100
MBq for planar imaging. This activity would be appropriate following a ventilation scan
using a gas such as 133
Xe or 81m
Kr. Following a ventilation scan using 99m
Tc-aerosol or
Technegas, the larger perfusion activities found in this survey are necessary to mask the
ventilation activity.

IAEA-CN-85-259
470
The effective dose estimates for the Reference Activities and Most Common Activities are for
a ‘standard’ 70 kg man and 57 kg woman. In Australia, the average weights for males and
females over 45 years of age are substantially higher. In heavy patients the administered
activity is often increased so that the diagnostic information is not compromised. It is not
usual practice to administer less activity to lighter adult patients to maintain a constant
radiation exposure.
The practical difficulties of achieving adequate image quality in pediatric nuclear medicine are
well known. The risk of a non-diagnostic image from too few counts or patient movement,
paticularly with dynamic studies and SPECT, has to be weighed against the radiation
exposure. The activities administered to adults have generally risen over time which would
have a flow-on effect on exposure if used to calculate the activities administered to children.
The pediatric centres adopt a conservative approach, eg. the 67
Ga-citrate Amax medians for
infection and tumor imaging are 75% of the MCAs in adults, resulting in a worthwhile
reduction in radiation dose.
Surface area scaling boosts the administered activity and hence the information density of
images. It results in a fairly uniform variation of effective dose with body size. However the
amount of activity administered to infants under 10 kg using surface area scaling is
approximately double that with body weight scaling. Similarly, Amin values were introduced
to compensate for low counts in infants. An unintended consequence of high Amin values and
surface area scaling is a substantial increase in the effective dose to an infant, eg. brain
imaging with 99m
Tc-HMPAO, infection imaging with 99m
Tc-white cells, lung perfusion
imaging with 99m
Tc-MAA and renal imaging with 99m
Tc-DMSA. Caution is indicated for an
Amin value exceeding 10% of the corresponding Amax, eg. the Amin for tumor imaging with 123
I-mIBG is considered to be justified.
201
Tl-chloride and 67
Ga-citrate are associated with a high radiation dose, particularly in the
very young. In the context of an infant or child with malignancy who is to receive
chemotherapy and possibly radiotherapy, it is justifiable to image with these agents as the
information obtained may influence treatment. Of greater concern is the use of 201
Tl or 67
Ga
in infants and children with non-malignant disease, which should only be considered when the
radiation dose is justified on very strong clinical grounds. Alternative investigations should
be considered.
References
[1] SMART R. C, TOWSON J. E., Diagnostic reference activities for nuclear medicine
procedures in Australia and New Zealand, Rad. Prot. Aust. 17 (2000) 2-14.
[2] NEW ZEALAND MINISTRY OF HEALTH, National Radiation Laboratory, Code of safe
practice for the use of unsealed radioactive materials in medical diagnosis, therapy and
research. Rep. NRL-C3 (1994).
[3] GOETZ W. A., HENDEE W. R., GILDAY D. L., In vivo diagnostic nuclear medicine: pediatric
experience, Clin. Nucl. Med. 8 (1983) 434-439.
[4] EUROPEAN ASSOCIATION OF NUCLEAR MEDICINE Paediatric Task Group,
Radiopharmaceuticals schedule for imaging in pediatrics, Eur. J. Nucl. Med. 17 (1990)
127-129.
[5] INTERNATIONAL COMMISSION ON RADIOLOGICAL PROTECTION, ICRP Publication 80:
Addendum to Publication 53 - Radiation dose to patients from radiopharmaceuticals.
Ann. ICRP 28 3 (1998).

IAEA-CN-85-259
471
[6] STABIN M. G., Health concerns related to radiation exposure of the female nuclear
medicine patient. Environ. Health Perspect. 105 Supplement 6 (1997) 1403-1409.
[7] MATTSSON S., JACOBSON L., VESTERGREN E., The basic principles in assessment and
selection of reference doses: considerations in nuclear medicine. Rad. Prot. Dosim. 80
(1998) 23-27.

IAEA-CN-85-28
472
NUCLEAR MEDICINE AND ITS RADIOLOGICAL PROTECTION IN CHINA
J. Wu
Department of Nuclear Medicine,
China Nuclear Industry General Hospital,
Second Hospital Affiliated to Suzhou University,
Suzhou, China
Abstract The China Society of Nuclear Medicine was established in 27 May, 1980. Since then, nuclear medicine in clinical
diagnosis and therapy has been developed rapidly in China. So far there are more than 4000 members of the
Society, and more than 350 sets of SPECT and 12 sets of PET have been installed and are busily running in clinic
nowadays and about 1 million patients with different types of diseases have obtained nuclear medicine imaging
examinations per year. Concerning the nuclear medicine therapy, a lot of patients with many types of diseases
obtained benefit from radioisotope therapy. Accordingly, several Policies and Regulations have been enacted by
the Government for the radiological protection. Furthermore, a special book titled as "Standardization in
Diagnostic and Therapeutic Nuclear Medicine" has been promulgated in June, 1997 by the Health Administration
of People's Republic of China,and this book is distributed to almost every nuclear medicine physician and
technician in China for their reference in routine nuclear medicine work or research. In this book three parts of
contents are covered: Policies and Regulations for the radiological protection, basic knowledge and clinical
nuclear medicine applications.
1. Nuclear medicine imaging
Radionuclide scintigraphy is a diagnostic method that provides high sensitive and specific
images of the distribution of radionuclides in the human body. The radiolabeled compounds
used include substrates, ligands, drugs, antibodies, neurotransmitters and other biomolecules
that are tracers for specific biological processes. Thus the resulting images can be considered
images of these biochemical or physiological processes(often called "functional images").
Accordingly, this imaging technique has been widely used in clinic, especially used in
oncology, cardiology, neurology. The China Society of Nuclear Medicine was established in
27 May, 1980. Since then, nuclear medicine has been developed rapidly in China. There are
more than 4000 members of the Society so far, and more than 350 sets of SPECT, 12 sets of
PET(includes 8 PET centers) up to now are busily running and about 1 million patients per
year have received nuclear medicine imaging examinations in China.
2. Radioisotope therapy
Radioisotope therapy, an innovative and promising approach, based on lesion-targeting
radiopharmaceuticals, which can potentially be used as powerful carriers of large amounts of
radiation for treatment of many types of diseases, such as hyperthyroidism, metastases or
recurrence of thyroid cancer, and many other types of cancer. Therefore, this therapeutic
methodology nowadays has been widely utilized in clinic in China.
3. Policies and regulations
In the purpose of radiological protection in safe medical application of radioisotope in nuclear
medicine, several Policies and Regulations have been enacted by the Government, including:
�� Drug Management Policy of People's Republic of China;
�� Execution Method of Drug Management Policy of People's Republic of China
�� Management Regulation of Radiopharmaceuticals;

IAEA-CN-85-28
473
�� Radiological Protection Byelaw on Radioisotope and Radio-facility;
�� Radiological Protection Standards in Clinical Nuclear Medicine;
�� Standards on Radiological Protection of Patients in Clinical Nuclear Medicine.
Furthermore, a special book titled as "Standardization in Diagnostic and Therapeutic Nuclear
Medicine" has been promulgated in June, 1997 by the Health Administration of People's
Republic of China and distributed to almost every nuclear medicine physician and
Table 1. Guidance dose in diagnostic nuclear medicine
Examined
organ
Radio-nuclide Radio-pharmaceutical Reference dose
bone Tc-99m MDP 555-740MBq(15-20mCi)
kidney I-131 OIH 11.1-18.5MBq(0.3-
0.5mCi)
Tc-99m DTPA 370-740MBq(10-20mCi)
Tc-99m EC 370-740MBq(10-20mCi)
Tc-99m DMSA 185-370MBq(5-10mCi)
Tc-99m MAG3 370-740MBq(10-20mCi)
thyroid Tc-99m TcO4 74-185MBq(2-5mCi)
I-131 NaI-131 1.85-3.7MBq(50-100µCi)
Thyroid
cancer
metastases
I-131 NaI-131 74-185MBq(2-5mCi)
brain Tc-99m ECD 740-1110MBq(20-30mCi)
Tc-99m HMPAO 740-1110MBq(20-30mCi)
F-18 FDG 185-300MBq(5-8mCi)
Lung perfusion Tc-99m MAA 111-185MBq(3-5mCi)
Lung
ventilation
Tc-99m DTPA 1110-1480MBq(30-40mCi)
Lung tumor Tc-99m MIBI 740-925MBq(20-25mCi)
Lung tumor Tl-201 TlCl3 101-185MBq(3-5mCi)
Heart function Tc-99m RBC 740-925MBq(20-25mCi)
Cardiac
perfusion
Tc-99m MIBI 555-740MBq(15-20mCi)
Cardiac
persfusion
Tl-201 TlCl3 74-111MBq(2-3mCi)
infection Tc-99m WBC 370MBq(10mCi)
infection Tc-99m HigG 370-740MBq(10-20mCi)
infection Ga-67 Ga-67 Citrate 74-185MBq(2-5mCi)
liver Tc-99m Colloid 148-296MBq(4-8mCi)
liver Tc-99m EHIDA 185-370MBq(5-10mCi)
Liver blood
flow/pool
Tc-99m RBC 740MBq(20mCi)
lymph Tc-99m dextron 74-222MBq(2-6mCi)
Bone marrow Tc-99m colloid 555-740MBq(15-20mCi)
tumor F-18 FDG 259-370MBq(7-10mCi)
tumor Ga-67 Ga-67 Citrate 74-185MBq(2-5mCi)
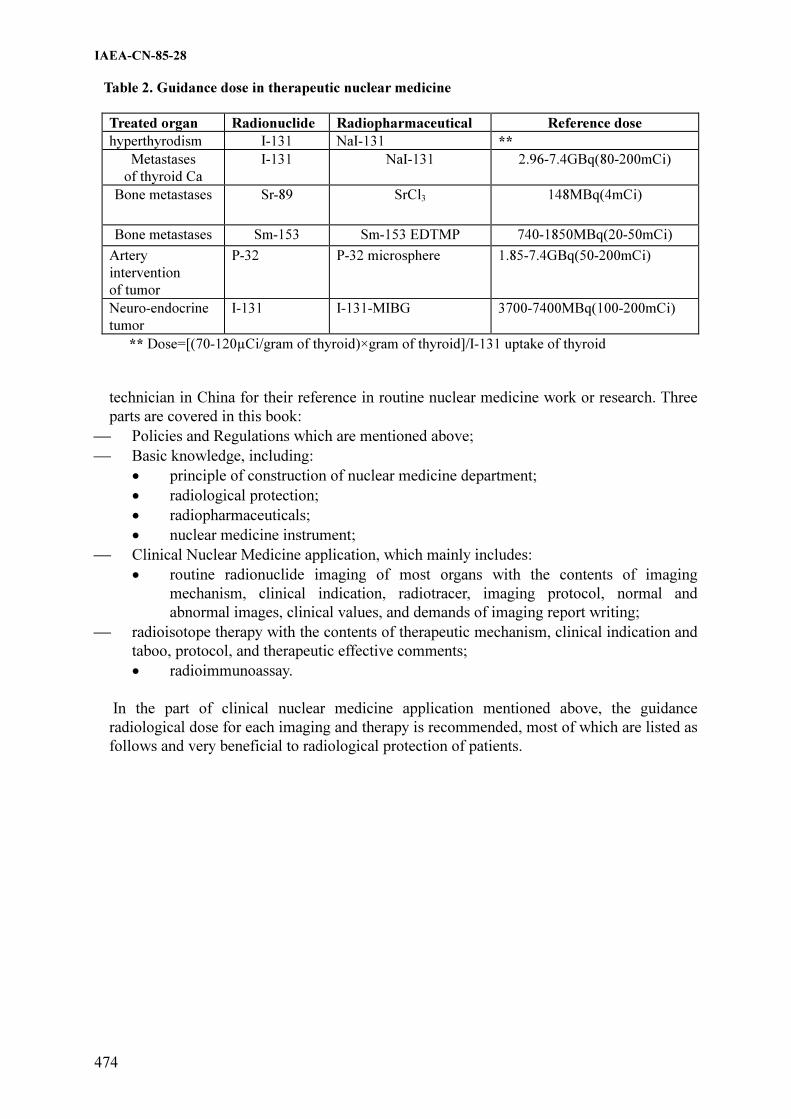
IAEA-CN-85-28
474
Table 2. Guidance dose in therapeutic nuclear medicine
Treated organ Radionuclide Radiopharmaceutical Reference dose
hyperthyrodism I-131 NaI-131 **
Metastases
of thyroid Ca
I-131 NaI-131 2.96-7.4GBq(80-200mCi)
Bone metastases Sr-89 SrCl3 148MBq(4mCi)
Bone metastases Sm-153 Sm-153 EDTMP 740-1850MBq(20-50mCi)
Artery
intervention
of tumor
P-32 P-32 microsphere 1.85-7.4GBq(50-200mCi)
Neuro-endocrine
tumor
I-131 I-131-MIBG 3700-7400MBq(100-200mCi)
** Dose=[(70-120µCi/gram of thyroid)×gram of thyroid]/I-131 uptake of thyroid
technician in China for their reference in routine nuclear medicine work or research. Three
parts are covered in this book:
�� Policies and Regulations which are mentioned above;
�� Basic knowledge, including:
�� principle of construction of nuclear medicine department;
�� radiological protection;
�� radiopharmaceuticals;
�� nuclear medicine instrument;
�� Clinical Nuclear Medicine application, which mainly includes:
�� routine radionuclide imaging of most organs with the contents of imaging
mechanism, clinical indication, radiotracer, imaging protocol, normal and
abnormal images, clinical values, and demands of imaging report writing;
�� radioisotope therapy with the contents of therapeutic mechanism, clinical indication and
taboo, protocol, and therapeutic effective comments;
�� radioimmunoassay.
In the part of clinical nuclear medicine application mentioned above, the guidance
radiological dose for each imaging and therapy is recommended, most of which are listed as
follows and very beneficial to radiological protection of patients.
IAEA-CN-85-280
475
PRELIMINARY RESULTS OF THE ANALYSIS OF THE ADMINISTERED
ACTIVITIES IN DIAGNOSTIC STUDIES OF NUCLEAR MEDICINE
G. López Bejerano, L.J. Sed
Centro de Protección e Higiene de las Radiaciones, Havana, Cuba
Abstract
The world wide use of the Nuclear Medicine diagnostic procedures and the tendency to its increment, infers an
important exposure of the population to ionising radiation, it has motivated that the IAEA in the International
Basic Safety Standards (BSS), emits recommendations for the establishment of guidance levels of activities
administered to the patients in diagnostic procedures. Taking in account the above-mentioned and that in Cuba
exist 20 departments of Nuclear Medicine, that possess in their majority equipment with more than 20 years of
operation, that influences directly in the medical exposure, a survey was designed and applied in 10 of these
departments. The survey evaluates the compliance with the BSS requirements, and in specific, the activities
administered to the patients in Nuclear Medicine diagnostic procedures are analysed. In the present work are
presented the obtained preliminary results of the statistical analysis carried out to the activity values used in
Nuclear Medicine departments, and the comparison among them, making a proposal of guidance levels for the
national practice, and they are compared with those recommended internationally.
1. Introducción
Cada día se hace más amplio a nivel mundial el uso diagnóstico de las fuentes no selladas en
diferentes ramas de la medicina, unido a un creciente desarrollo del equipamiento y los
radiofármacos utilizados, infiriendo a la población una importante dosis de radiación y un
potencial impacto medioambiental. Existen indicios de que la exposición de la población por
esta vía seguirá incrementándose [1], lo que impone prestar atención a las recomendaciones de
Protección Radiológicas emitidas por Organizaciones Internacionales, como es el caso del
establecimiento de niveles orientativos para las actividades administradas a los pacientes en
estudios diagnósticos de medicina nuclear [2], que sugieren el desarrollo de buenas prácticas y
su empleo como herramienta de optimización de la Protección Radiológica a los pacientes.
En la actualidad Cuba cuenta, con unos 20 departamentos de Medicina Nuclear, donde se
realiza un elevado número de estudios diagnósticos con el empleo, en su mayoría, de
equipamiento con más de 20 años de explotación: captadores de iodo, renógrafos y
gammatopógrafos, los cuales han sido desplazados en el mundo, por equipos más modernos y
con los que se obtiene una mejor calidad de la imagen: Cámara Gamma, SPECT.
A pesar de que en el país están establecidos los procedimientos para la realización de los
estudios, recomendando la actividad a emplear [3], se observa variaciones entre los diferentes
departamentos, por lo que en el presente trabajo se hace un análisis de las actividades
empleadas por estudio, a partir de las cuales se puede elaborar una propuesta de niveles
orientativos, comparándolos con los establecidos internacionalmente.
2. Materiales y métodos
Para conocer las actividades administradas a los pacientes en los principales estudios
diagnósticos que se realizan en el país, se aplicó una encuesta en la que participaron 10
departamentos de Medicina Nuclear, de 6 provincias. Para lograr la representatividad de la
muestra se seleccionaron los módulos de forma que se incluyera en el estudio todo los tipos de
equipos con que se cuenta en el país.

IAEA-CN-85-280
476
Se tomó la actividad máxima empleada en cada módulo por examen, la que es representativa
para estudios en pacientes adultos estándar. Para establecer la propuesta de los niveles
orientativos, se realizó el tratamiento estadístico de estos valores, tomando el correspondiente
al tercer cuartil [4].
3. Resultados y discusión
Fueron evaluadas las actividades empleadas para los estudios más frecuentes y que en mayor
número de entidades se realizan, observándose variaciones entre los valores reportados por
éstas para un grupo de estudios. Dichas variaciones se muestran en la Figura 1.
0
200
400
600
800
1000
1200
Ac
tiv
ida
d (
MB
q)
E-1 E-2 E-3 E-4 E-5 E-7 E-9 E-
10
Entidade s
GG ce r e br al con Tc-99m DTPA
0
200
400
600
800
1000
1200
Ac
tiv
ida
d (
MB
q)
E-1
E-3
E-5
E-7
E-9
Entidade s
GG os e a Tc-99m M DP
0
50
100
150
200
Ac
tiv
ida
d (
MB
q)
E-1 E-2 E-3 E-4 E-5 E-6 E-7 E-8
Entidade s
GGRM (Tc-99m -DM SA)
0
50
100
150
200
Ac
tiv
ida
d (
MB
q)
E-1 E-2 E-3 E-4 E-5 E-6 E-7 E-8
Entidade s
GGRD (Tc-99m -DTPA)
0
50
100
150
200
Ac
tiv
ida
d (
MB
q)
E-6 E-7 E-8
Entidade s
GGRD (Tc-99m -M AG3)
0
0.2
0.4
0.6
0.8
1
1.2
Ac
tiv
ida
d (
MB
q)
E-1 E-2 E-3 E-4 E-5 E-9 E-10
Entidade s
C aptación T ir o ide a I-131
0
2
4
6
8
10
Ac
tiv
ida
d (
MB
q)
E-1 E-4 E-5 E-10
Entidade s
GG Tiroidea con I-131
0
200
400
600
800
1000
1200
Ac
tiv
ida
d (
MB
q)
E-5 E-6 E-7 E-8
Entidade s
Venticulografía de reposo con
Tc-99m -Pirofosfato
Figura 1. Valores de actividad por estudio en diferentes entidades
En otros estudios como: GG Hepática con Fitato de Sodio, GG Tiroidea con Tc-99m y con I-
131 para pacientes operados y en renogramas con Hipurán, no existen diferencias en la
actividad suministrada, en cada departamento, a los pacientes, excepto en una de ellas.

IAEA-CN-85-280
477
Las variaciones observadas en las actividades empleadas por las entidades están dadas por
diferentes causas, entre las que pueden ser señaladas, las condiciones técnicas del
equipamiento empleado, las diferentes tecnologías (desde detectores unidimensionales hasta
SPECT), la capacitación, grado de asimilación y compromiso del personal, que interviene en
la práctica, con las recomendaciones en materia de Protección Radiológica al paciente.
En la Tabla I se muestra un análisis estadístico de los valores de actividad empleada por
estudio, en las diferentes entidades del país, observándose que en la mayoría de los casos el
valor correspondiente a la media está próximo al del tercer cuartil. Esto puede ser debido a
que los departamentos trabajan por protocolos nacionales establecidos donde se recomiendan
los valores de actividad a administrar por exámen. Existen tres casos en los que la media
supera el valor correspondiente al tercer cuartil, lo cual se debe a que una entidad emplea
actividades altas en comparación con el resto, por lo que deben ser determinadas las causas
específicas que provocan esta desviación, con relación a las recomendadas en protocolos
nacionales.
Tabla 1. Evaluación de los resultados de la encuesta
Nombre del estudio Organo de
estudio
Radio-
núclido
Fármaco Análisis estadístico de los valores
de actividad empleados en los
estudios (MBq)
min 1er
Cuartil
Media 3er
Cuartil
max
GG cerebral Cerebro Tc-99m DTPA 555 740 763 740 1110
GG osea Huesos Tc-99m MDP 370 601 703 740 1110
GG Hepática Hígado Tc-99m Fitato de Sodio 148 185 179 185 185
GG Hepática Hígado Tc-99m Coloides 185 185 185 185 185
GG Renal Morfológica Riñones Tc-99m DMSA 74 130 145 185 185
GG Renal Dinámica Riñones Tc-99m DTPA 74 111 148 185 185
GG Renal Dinámica Riñones Tc-99m MAG3 74 111 136 167 185
Renograma Riñón I-131 Hipurán 0.74 0.74 0.79 0.79 0.93
GG Tiroidea Tiroides I-131 NaI 3.7 4.6 6.15 7.38 9.25
GG Tiroidea Tiroides Tc-99m Pertecnectato 74 74 86 74 148
GG de cuello Cuello I-131 NaI 74 74 96 74 185
Captación Tiroidea Tiroides I-131 NaI 0.37 0.74 0.82 0.93 1.11
GG de paratiroides Paratiroides Tc-99m MIBI 740 786 832 879 925
GG de mama Mama Tc-99m MIBI 700 756 813 869 925
Venticulografía de reposo Corazón Tc-99m Pirofosfato 555 694 833 971 1110
Los valores de actividad correspondientes al tercer cuartil, los cuales pueden ser propuestos
como niveles orientativos en estudios diagnósticos de Medicina Nuclear, han sido comparados
con los publicados internacionalmente, obteniéndose que en general los valores propuestos
están por debajo de los recomendados. En los casos en que se superan, debe tenerse en cuenta
el equipamiento con que son realizados los estudios y la posibilidad de obtener una imagen
con calidad diagnóstica a niveles más bajos. No obstante en los estudios GGO(Tc-99m-MDP)
y GGH(Tc-99m-Coloides) se deben investigar las causas específicas por las que se sobrepasan
estos niveles.

IAEA-CN-85-280
478
4. Conclusiones
Los valores de actividad propuestos como niveles orientativos para los diferentes estudios
diagnósticos que se realizan en el país, están en el rango de los reportados internacionalmente.
Se requiere a partir de estos resultados, realizar un análisis en cada entidad, que posibilite su
implementación.
Las variaciones de la actividad administrada por estudios, en las entidades encuestadas, es un
reflejo de las condiciones técnicas y diferencias tecnológicas del equipamiento empleado y la
necesidad de lograr elevar la preparación de todo el personal involucrado en los estudios en
aspectos relativos a la Protección Radiológica.
Referencias
[1] UNSCEAR, Sources and Effects of Ionizing Radiation. United Nation Scientific
Commitee on the Effects of Atomic Radiation (1993)
[2] International Atomic Energy Agency, International Basic Safety Standards for
Protection Against Ionizing Radiation and for the Safety of Radiation Sources, jointly
sponsoud by FAO,IAEA,ILO,OECD/NEA, PAHO, WHO, Safety Series No. 115, IAEA,
Vienna (1996).
[3] Manual de Normas y Procedimientos. Editado por el Grupo Nacional de Oncología del
Ministerio de Salud Pública, 1989.
[4] Dosimetry Working Party of the Institute of Physical Sciences in Medicine. National
protocol for patient dose measurements in diagnostic radiology, National Radiological
Protection Board, England, 1992.

IAEA-CN-85-65
479
ADMINISTERED ACTIVITY AND ESTIMATED RADIATION DOSES
FROM NUCLEAR MEDICINE DIAGNOSTIC PROCEDURES
TO THE ISRAELI POPULATION
J. Weininger, A.B. Shlomo, J.K.Y. Shamai, T. Schlesinger
Radiation Safety Division, Soreq NRC, Yavac, Israel
Abstract
The current levels of administered activity of radiopharmaceuticals in several common nuclear medicine
diagnostic procedures and their contribution to the radiation doses to the Israeli population in 1998-2000 were
analyzed. Diagnostic reference levels and the concept of effective dose per capita are discussed as relevant
parameters to optimize patient protection.
1. Introduction
In connection with an IAEA supported project aimed at developing a national program for
radiation protection of the patient in diagnostic investigations, we previously reported
radiation doses resulting from nuclear medicine imaging in Israel, in 1998 [1]. The
contribution of nuclear medicine diagnostic investigations to the radiation doses to the
population in Israel was estimated by using the effective dose and effective dose per capita
concepts [2]. About 3% of the approximately 6,000,000 Israeli population underwent nuclear
medicine diagnostic procedures in 1998, resulting in a contribution of about 1,800 person-Sv
to the collective effective dose. Consequently, the effective dose per capita, due to nuclear
medicine procedures, was estimated to be 0.3 mSv [1].
As in nuclear medicine procedures the radiation dose to the patient is a function of the
amount of the administered radiopharmaceutical and its body distribution, in order to
determine the sources for the relatively high effective dose per capita to the Israeli population,
and to suggest possible ways to lower it, we analyzed the current levels of administered
activity in several common diagnostic procedures.
2. Materials and methods
Thirteen out of more than thirty functioning nuclear medicine and/or nuclear cardiology
clinics supplied us with information about the radiopharmaceuticals used, the administered
activity (AA) per procedure and the relative number of examinations performed in the period
1998-2000. When relevant, data available about single doses of radiopharmaceuticals
purchased in one of the functioning central radiopharmacies, were also analyzed. The
distribution of AA per procedure in the clinics surveyed was recorded and averaged, and the
resulting effective doses were calculated based on the conversion tables presented in ICRP
Publication 80 [2]. Our results were obtained by averaging and extrapolating these data.
3. Results
The eight radiopharmaceuticals we studied cover >90% of all nuclear medicine diagnostic
imaging procedures performed in Israel between the years 1998–2000.
Table 1 summarizes the current AA of radiopharmaceuticals per procedure (average,
minimum and maximum) in Israeli clinics. In addition it shows the guidance levels (BSS)
[3]
and the UNSCEAR 2000 [4] data for Health care level I, plus the deviations, in percentages,

Tab
le 1
: C
urren
t A
dm
inis
tered
Acti
vit
y i
n C
om
mon
Nu
cle
ar M
ed
icin
e D
iagn
ost
ic P
roced
ures
an
d t
he R
esu
ltin
g E
ffecti
ve D
ose
s p
er
Proced
ure i
n I
sra
eli
Cli
nic
s (1
99
8-2
000)
Com
pared
wit
h t
he C
orresp
on
din
g B
SS
Gu
idan
ce L
ev
els
[3
] a
nd
to
th
e U
NS
CE
AR
20
00
Da
ta
for H
ealt
h C
are L
ev
el
I (1
99
1-1
99
6)
[4]
R
adio
pharm
aceutical
Avera
ge
Adm
inis
tere
d A
ctivity
(m
Ci)
per
pro
cedure
D
evia
tion
of
the
norm
aliz
ed
avera
ge
from
B
SS
D
evia
tion
of
the
norm
aliz
ed
avera
ge
from
U
NS
CE
AR
Eff
ective d
ose
(mS
v)
per
pro
cedure
2
Is
rael
(min
– m
ax)
B
SS
UN
SC
EA
R
Isra
el
(min
– m
ax)
BS
S
U
NS
CE
AR
Tc-9
9m
MD
P
(Bone)
22.9
(2
0-2
5)
21.6
19.4
+ 6
%
+13%
4.8
(4
.2-5
.3)
4.6
4.5
Tc-9
9m
CaN
aP
hyta
te
(liv
er
& s
ple
en)
4.6
(3
-5.5
) 4.5
3.8
-
14.2
%
+23.8
%
2.4
(1
.6-2
.9)
2.3
1.7
Tc-9
9m
RB
C
( b
lood p
ool)
22.5
(1
5-2
7.5
) 21.6
6.8
– 2
9.8
+
4%
5.8
(3
.9-7
.1)
5.6
2.9
– 8
.0
Tc-9
9m
MA
A
(lu
ngs)
4.0
(2
.5-6
) 5.4
3.2
-
17.4
%
+20.3
%
1.6
(1
.0-2
.4)
2.2
1.5
Tc-9
9m
DT
PA
(k
idneys)
7.6
(2
-11.5
) 9.5
4.9
-
10.5
%
+43%
1.4
(0
.4-2
.1)
1.7
1.5
Tc-9
9m
Sesta
mib
i (m
yocard
ium
) 21.3
(1
0-3
9)
16.2
16.8
+
31.5
%
+32.8
%
6.7
(3
.2-9
.4)
5.1
7.6
– 1
0.0
Tl-201 c
hlo
ride
(myocard
ium
) 3.0
(2
-4)
2.7
2.7
+
11%
+
16.8
%
24.4
(1
6.3
-32.6
)22.0
6.9
– 2
0.3
Ga-6
7 c
itra
te
(tum
or
and
inflam
mation)
7.0
(3
.5-1
0)
8.1
-13.6
%
31.1
(1
5.6
-44.4
)36.0
IAEA-CN-85-65
480

IAEA-CN-85-65
481
of the normalized average Israeli data from these values and the resulting calculated
effective doses (mSv/procedure).
An uncertainty of up to 25% of all our estimates should be taken into account.
As shown in Table 1, the range of the resulting absorbed doses per procedure in Israel
is relatively wide: from less than 1 mSv for some procedures using Tc-99m to more
than 30mSv for those using Ga-67 and Tl-201, nevertheless in good agreement with
both BSS and UNSCEAR data.
4. Discussion
We compared the results, obtained by us, for nuclear medicine diagnostic imaging
procedures performed in Israel between the years 1998–2000 with the guidance levels,
i.e. maximum usual activities in nuclear medicine investigations for a typical adult
patient, published in the Basic Safety Standards (BSS) [3] in 1996 and also with the
most recent data published by UNSCEAR 2000 [4 ], i.e. the average values for
countries of Health care level I (1991-1996).
The Israeli data were rather high: in good agreement with the BSS guidance levels,
(the upper limits), however higher than UNSCEAR average values (Table 1).
The average effective dose per capita reported in the UNSCEAR 2000 for countries of
health care Level I, was 0.08 mSv. The dose we calculated for the Israeli population
for 1998 was 0.3 mSv per capita1. In order to determine the sources of the difference
between these two values, beside the fact that they do refer to relatively distant
periods, we analyzed the contribution of the different diagnostic procedures to the
average effective dose per capita.
Bone and cardiovascular imaging were in 1998 the main contributors to the collective
radiation dose to the Israeli population from diagnostic nuclear medicine procedures:
19.6 and 62.0 %.
The annual number of Tc-99m MDP and Tl-201 chloride procedures per 1,000
population in Israel significatively exceeded the values reported in UNSCEAR 2000:
12.42 vs. 5.85 for Tc-99m bone imaging and 6.75 vs. 0.007-1.88 for Tl-201
myocardial imaging.
The above mentioned data, in addition to the administered activities which slightly
exceeded the UNSCEAR 2000 values (Table 1), make up for the difference in the
average effective dose per capita between Israel in 1998 and UNSCEAR 2000, for
1991-1996. As we compared data from relatively distant periods, the significance of
the difference we found must be considered with precaution and reconsidered when up
dated UNSCEAR values are published.
Aiming to improve the radiation protection of the patient whilst myocardial imaging is
the replacement of a procedure requiring administration of 4 mCi Tl-201 chloride,
with two studies (one at rest and one under stress) using a total of 30-50 mCi Tc-99m
Sestamibi. For a wide range of pathologies, clinical studies proved that these two
procedures generally provide similar diagnostic information. The above mentioned
administered activities result in an effective dose of 34.1 mSv for Tl-201 and of 9.6-

IAEA-CN-85-65
482
16 mSv for the Tc-99m Sestamibi procedures. Consequently, by replacing Tl-201 by
Tc-99m imaging, the radiation dose to the patient per procedure could drop to 28-
47%. The lower effective dose to the patient is also one of the several reasons why
more and more myocardial studies using Tc-99m are reported in the literature. In the
analyzed frame, i.e. Israel 1998, if all Tl-201 examinations would have been replaced
by Tc-99m Sestamibi, the annual collective dose to the population, could have been
decreased by at least 730 person-Sv, resulting in an average effective dose per capita
of 0.18mSv.
5. Conclusions
- The current level of activity of radiopharmaceuticals administered to the patient
per nuclear medicine diagnostic procedure in Israel is in good agreement with the
BSS reference levels.
- The average administered activities per nuclear medicine diagnostic procedure in
Israel, in 1998-2000, exceed the corresponding values as published in the
UNSCEAR 2000 for countries of Health care level I (1991-1996), by 13–43%.
- The effective dose per capita to the Israeli population resulting from nuclear
medicine and cardiology diagnostic procedures in 1998 was relatively high,
mainly because of the frequent use of high activity Tl-201 procedures.
- By replacing, when possible, myocardial imaging with Tl-201 by Tc-99m agents,
the radiation dose per procedure can be significantly reduced.
- The guidance level of activity administered per procedure alone cannot assure the
optimization of the radiation dose to a certain population.
- For a comprehensive evaluation of the radiation protection for diagnostic nuclear
medicine investigations of a certain population, the effective dose per capita
should be considered in addition to the guidance levels of administered activity of
radiopharmaceuticals.
References
[1] Weininger, A. Ben-Shlomo, T. Schlesinger, Y. Shamai: Estimated Radiation
Doses to the Israeli Population from Nuclear Medicine Procedures, The 20th
Conference of the Nuclear Societies in Israel, Dec.20-21, 1999.
[2] Radiation Dose to the Patients from Radiopharmaceuticals, ICRP Publication 80
(1999)
[3] IAEA Safety Series No. 115; International Basic Safety Standards for Protection
against Ionizing Radiation and for the Safety of Radiation Sources, IAEA,
Vienna (1996).
[4] Sources and Effects of Ionizing Radiation, UNSCEAR 2000 Report to the
General Assembly, with Scientific Annexes, Volume I: Sources, pg. 427
[5] International Commission on Radiological Protection, Radiological Protection
and Safety in Medicine, ICRP Publication 73, Ann. ICRP 26 (2) (Oxford;
Elsevier) (1996).
[6] Council of the European Union. Council Directive 97/43/EURATOM of 30
June 1997 on Health Protection of Individuals against the Dangers of Ionizing
Radiation in Relation with Medical Exposure, and repealing Directive
84/466/EURATOM. Official Journal of the European Communities, No L
180/22(1997).

IAEA-CN-85-56
483
DEVELOPMENT OF DIAGNOSTIC REFERENCE LEVELS IN PAEDIATRIC RADIOLOGY D. Hart, B.F. Wall National Radiological Protection Board, Chilton, Didcot, United Kingdom
Abstract With a very wide range in patient size from a newborn baby to a 15 year old adolescent, reference doses for paediatric radiology can sensibly be established only for specific sizes of children. Five standard sizes have been chosen representing newborn, 1, 5, 10 and 15 years. A method is described for normalising the dose measured on a child of any size and age to the corresponding dose to the nearest standard sized patient. Normalisation factors for entrance surface dose and dose-area product measurements were calculated based on HIIHFWLYH�OLQHDU�DWWHQXDWLRQ�FRHIILFLHQWV�� ��PHDVXUHG�LQ�SKDQtoms and calculated by Monte Carlo techniques for the typical x-ray spectra and field sizes used in paediatric radiology. These normalisation factors were applied to European paediatric dose survey data to derive some preliminary size/age specific reference doses for some common radiographic projections and for micturating cystourethrography (MCU), the most common fluoroscopic examination performed on children. 1. Introduction Patient size is an important determinant of the level of dose received by individuals from diagnostic x-ray examinations and is a confounding factor when assessing and comparing radiation doses to patients in x-ray departments. Variations in size are large between paediatric patients (covering the age range from newborn to 15 years) and the use of a single reference size is impractical. Accordingly, it has been common practice to group children by age in order to facilitate meaningful comparison of dose using age-bands such as: 0–1 month, 1–12 months, 1–5 years, 5–10 years and 10–15 years. However, children within the same age band can still be of considerably different sizes, resulting in up to a factor of three difference between the entrance surface doses to obtain the same exit dose and hence the same dose to the image receptor. This paper discusses methods for deriving factors for normalising doses measured on actual patients to those relating to patients of the nearest standard size representing 0, 1, 5, 10 and 15 year old patients. This procedure will enable the results of local dose surveys to be compared with reference doses for the same standard–sized paediatric patients. The establishment and use of reference doses as a practical way of promoting optimisation of patient protection is required by the EC Medical Exposure Directive [1], where they are referred to as diagnostic reference levels. This approach has also been adopted in the dose criteria for radiographic examinations of adult and paediatric patients in European Guidelines [2, 3]. However, in the paediatric guidelines [3], a European–wide paediatric patient dose survey for common types of radiograph, in which the patients were simply divided into a few narrow age bands, failed to demonstrate any clear trends in dose with age. It was possible to provide only tentative reference doses, mainly for five year old patients, in those guidelines. In this paper, the same European survey data have been re–analysed by normalising the measured doses to those for the nearest standard–sized patient and, where there are sufficient data, new reference doses have been derived for each standard size. As patient thickness had not been measured in the European survey, a method was developed for estimating thickness for the various radiographic projections from the available information on patient height and weight.
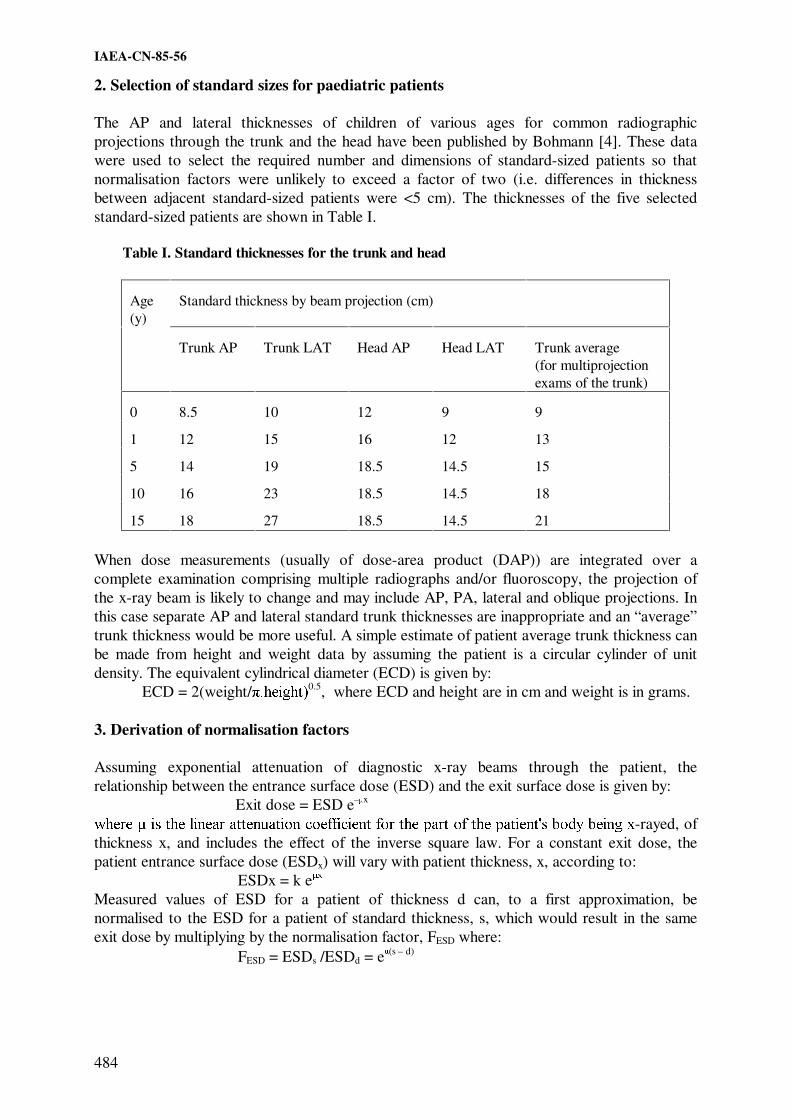
IAEA-CN-85-56
484
2. Selection of standard sizes for paediatric patients
The AP and lateral thicknesses of children of various ages for common radiographic projections through the trunk and the head have been published by Bohmann [4]. These data were used to select the required number and dimensions of standard-sized patients so that normalisation factors were unlikely to exceed a factor of two (i.e. differences in thickness between adjacent standard-sized patients were <5 cm). The thicknesses of the five selected standard-sized patients are shown in Table I.
Table I. Standard thicknesses for the trunk and head
Age (y)
Standard thickness by beam projection (cm)
Trunk AP
Trunk LAT
Head AP
Head LAT
Trunk average (for multiprojection exams of the trunk)
0
8.5
10
12
9
9
1
12
15
16
12
13
5
14
19
18.5
14.5
15
10
16
23
18.5
14.5
18
15
18
27
18.5
14.5
21
When dose measurements (usually of dose-area product (DAP)) are integrated over a complete examination comprising multiple radiographs and/or fluoroscopy, the projection of the x-ray beam is likely to change and may include AP, PA, lateral and oblique projections. In this case separate AP and lateral standard trunk thicknesses are inappropriate and an “average” trunk thickness would be more useful. A simple estimate of patient average trunk thickness can be made from height and weight data by assuming the patient is a circular cylinder of unit density. The equivalent cylindrical diameter (ECD) is given by: ECD = 2(weight/ �KHLJKW�0.5, where ECD and height are in cm and weight is in grams. 3. Derivation of normalisation factors Assuming exponential attenuation of diagnostic x-ray beams through the patient, the relationship between the entrance surface dose (ESD) and the exit surface dose is given by:
Exit dose = ESD e–mx ZKHUH� �LV�WKH�OLQHDU�DWWHQXDWLRQ�FRHIILFLHQW�IRU�WKH�SDUW�RI�WKH�SDWLHQWV�ERG\�EHLQJ�[-rayed, of thickness x, and includes the effect of the inverse square law. For a constant exit dose, the patient entrance surface dose (ESDx) will vary with patient thickness, x, according to: ESDx = k e [ Measured values of ESD for a patient of thickness d can, to a first approximation, be normalised to the ESD for a patient of standard thickness, s, which would result in the same exit dose by multiplying by the normalisation factor, FESD where:
FESD = ESDs /ESDd = em(s – d)

IAEA-CN-85-56
485
The factor, FDAP, for normalising DAP measurements for complete examinations involving multiple projections, measured on a patient of known thickness to the nearest standard thickness, is given by: FDAP = e� �V�- d) . s2/d2 where there is an additional term to account for the fact that the area component of DAP will increase with patient size roughly as s2/d2 (assuming the dimensions of the patient in a plane perpendicular to the axis of the x-ray beam are proportional to the thickness of the patient along the axis of the beam). $SSURSULDWH� YDOXHV� RI� � IRU� WKH� H[SRVXUH� FRQGLWLRQV� SUHYDLOLQJ� LQ� SDHGLDWUic radiology were obtained from measurements of entrance and exit doses on a soft tissue equivalent phantom (WT1 material) representing paediatric patients of 5, 10, 15, and 20 cm thickness with a number of typical diagnostic x-ray spectra and field sizes. A lung equivalent material phantom (using the lung sections of an Alderson Rando phantom) was also used to simulate chest radiography. Exit doses were measured in front of and behind an antiscatter grid (grid ratio 12:1, 36 lines per cm) since the ratio of primary to scattered radiation in the exiting beam is also a function of patient thickness. As the grid removes most of the scattered radiation, the attenuation coefficient derived from the through-grid exit dose was higher than that measured without a grid. Values of �ZHUH�REWDLQHG� IURP�WKH�VORSHV�RI�JUDSKV�RI�OQ�(6'�SHU�XQLW�H[LW�dose against phantom thickness. The phantom measurements were verified and extended to a wider range of exposure conditions by Monte Carlo simulation. Remarkably close agreement was achieved (to within ���ZLWKRXW� D� JULG�� DQG� ���ZLWK� D� JULG�� EHWZHHQ� WKH�0RQWH�&DUOR� FDOFXODWHG� � YDOXHV� DQG�those measured in the soft-tissue equivalent phantom. For the lung equivalent phantom the agreement was not so close, but the discrepancy can be quantitatively explained by small soft-tissue components in the lung sections of the Alderson phantom which were not simulated in the Monte Carlo calculations. :LWKRXW�D�JULG��YDOXHV�RI� �IRU�VRIW�WLVVXH��:7���UDQJH�IURP������WR������FP-1 for the range of x-ray qualities and beam areas likely to be met in paediatric radiology and with a grid from about 0.25 to 0.30 cm-1. They are more dependent on kV than field size over the ranges VWXGLHG�� 7KH�PHDVXUHG� YDOXHV� RI� � IRU� OXQJ� DUH� FRQVLGHrably lower than the values for soft tissue and range from 0.11 to 0.13 cm-1. 8VLQJ�WKH�DSSURSULDWH�YDOXHV�IRU� �DQG�WKH�WKLFNQHVVHV�RI�VWDQGDUG�SDWLHQWV�DV�GLVFXVVHG�DERYH��values of the normalisation factors were calculated for a range of patient thicknesses in 0.5 cm increments from that for a small baby to a large 15 year old. The results are tabulated in NRPB-R318 [6]. All FESD values were no larger than a factor of two up or down, as were FDAP values apart from some of those for very small babies or very large 15 year olds. 4. Derivation of size/age specific reference doses
The wide-ranging survey data collected for the European paediatric radiology trial [3] were re-analysed to develop size/age specific reference doses for common radiographs. Firstly, to eliminate some unacceptable practices, the data were restricted to those from hospitals that were using the tube voltage, film-screen speed and antiscatter grid technique factors recommended in the European Guidelines [3]. Data for patients of any size were included and the ESDs normalised to those for the nearest standard-sized patient using the FESD
normalisation factors discussed above. The thickness of the radiographed section through the

IAEA-CN-85-56
486
patient was derived from patient height and weight data using a method developed by the authors [5]. The distribution of the size-normalised doses from the European trial has been used to derive reference doses for standard-sized paediatric patients based on the rounded third quartile values, as shown in Table II. European reference doses for adult patients [2] are also shown for comparison. By normalising for patient size and rejecting unacceptable practices, the paediatric reference doses now show a reasonable trend with patient age, which was not evident in the original data [3]. The values, even for a 15 year old child, are substantially lower than those shown for an adult, which reflects the expected additional care taken when children are radiographed and the improvements made in patient protection since the adult reference doses were derived over 10 years ago.
DAP data have been collected for micturating cystourethrogram (MCU) examinations at a sample of 12 European hospitals [5]. Between 10 and 30 paediatric patients were included from each hospital with ages ranging between neonate and 15 years old. However, the majority of patients were under 5 years old as is usual for MCU examinations. Information on weight, height and trunk thickness was collected for each patient. The DAP for each patient was normalised to that for the nearest standard trunk thickness for multiprojection examinations as shown in Table I, using appropriate values of FDAP. The rounded third quartiles of the distributions of the mean normalised DAP values were used to derive the provisional reference doses shown in the last row of Table II. Table II. Size/age specific paediatric radiology reference dose values
Reference Dose Value
Neonate
1 year
5 year
10 year
15 year
Adult
Radiograph Entrance surface dose, mGy Chest AP/PA
0.05
0.05
0.07
0.12
-
0.3
Abdomen AP/PA
-
0.4
0.5
0.8
1.2
10
Pelvis AP
-
0.5
0.6
0.7
2
10
Skull AP/PA
-
0.8
1.1
1.1
1.1
5
Skull LAT
-
0.5
0.8
0.8
0.8
3
Examination Dose-area product, Gy cm2 MCU 0.6 0.9 1.2 2.4 - 40a
a Reference dose for IVU examination on adults Acknowledgements
This project was partly-funded by the European Commission through contract number F14P CT95-0002.

IAEA-CN-85-56
487
References
[1] EUROPEAN COMMISSION, Council Directive 97/43/Euratom of 30 June 1997 on health protection of individuals against the dangers of ionising radiation in relation to medical exposure, Off. J. Eur. Commun., L180 (1997).
[2] CARMICHAEL, J.H.E., MACCIA, C., MOORES, B.M., OESTMANN, J.W., SCHIBILLA, H., TEUNEN, D., VAN TIGGELEN, R., WALL, B., European Guidelines on Quality Criteria for Diagnostic Radiographic Images, EUR 16260 (Office for Official Publications of the European Communities, Luxembourg) (1996).
[3] KOHN, M.M., MOORES, B.M., SCHIBILLA, H., SCHNEIDER, K., STENDER, H–ST., STIEVE, F.E., TEUNEN, D., WALL, B., European Guidelines on Quality Criteria for Diagnostic Radiographic Images in Paediatric, EUR 16261 (Office for Official Publications of the European Communities, Luxembourg) (1996).
[4] BOHMANN, I., Ermittlung der Durchstrahlungsdurchmesser bei Säuglingen, Kindern und Jugendlichen zur Aufstellung von Belichtungswerten in der Röntgendiagnostik und Abschätzung der Organdosiswerte bei typischen Röntgenuntersuchungen,. GSF 16/90, Gesellschaft für Strahlen und Umweltforschung, Munich, (1990).
[5] HART, D., WALL, B.F., SHRIMPTON, P.C., BUNGAY, D., DANCE D.R., Reference Doses and Patient Size in Paediatric Radiology, NRPB-R318, NRPB, Chilton (2000).

������

Topical Session 6
RADIOLOGICAL PROTECTION OF THE
EMBRYO AND FOETUS IN PREGNANT PATIENTS


IAEA-CN-85-66
491
TEN YEARS INVESTIGATION ON RADIOLOGICAL EXPOSURES TO THE
EMBRYO AND FETUS IN PREGNANT WOMEN OF IRAN
A. Arbabi
Department of Radiation Protection, Atomic Energy Organization of Iran
Department of Radiation Oncology, Shaheed Beheshti University of Medical Sciences
Tehran, Islamic Republic of Iran
Abstract
Over 1340 Iranian pregnant patients, exposed to diagnostic x-rays during 1984 to 1994, referred to me for
investigation and estimation of the absorbed dose to their embryo or fetus. They were almost all the patients
exposed to x-rays in the whole country in 10 years. Two sets of questioner filed for each patient and all the
exposing condition and setting information obtained from the radiology centers concerned. The absorbed dose to
embryo or fetus accurately calculated and in some cases measured in a phantom for each patient. The youngest
patient at the time of irradiation was 15 and the oldest was 51 with an average of 28.624+5.961 years old. The
AP and lateral thickness of patient's abdomen on average were 18.078+0.162 cm and 24.630+8.365 cm
respectively. The average weight of patients was 59.285+12.945 kg. ranging from 30 kg to 122 kg. The marriage
age of the patients on average was 19.398+4.107 years ranging from 9 to 42 years old. The average age of fetus
when exposed to x-rays was 31.22+18.76 days. About %20 of the patients had exposures in 2 to 4 more sessions.
The average fetal dose was 0.68+ 0.381 cGy with over %37 from 1 to 9 cGy.
1. Introduction
There have been great concern and anxiety amongst many pregnant patients exposed to
ionizing radiation on the fate of their fetus over the last century. The sensitivity of the human
embryo and fetus to ionizing radiation is an important topic in radiation protection.
Observations on patients exposed to ionizing radiation during pregnancy as well as extensive
experimental investigations on mammals have greatly increased our understanding of the
effects induced when the mammalian embryo and fetus are irradiated. It is evident, in
consequence, that ionizing radiation must be considered to be a teratogenetic agent [1, 2, 3, 4
& 5]. The sensitivity of the embryo to ionizing radiation depends on the day of gestation on
which it has been exposed [6]. Epidemiological studies have indicated that exposure of
pregnant women to diagnostic x-rays can increase the risk of induction of the late effects
(cancer) in the children [7]. Besides, exposure of embryo or fetus to moderate doses of
ionizing radiation can cause death, malformation, growth retardation and functional
impairment. Information from Hiroshima indicates that measurable damage can be produced
by doses of 10-19 cGy. [8] . Here I present only a part of a considerable amount of data
obtained and filed over a period of 10 years (1984-1994). These data related to almost all
pregnant patients in Iran. They were exposed to diagnostic x-rays and referred to me for
investigation, measurement and calculation of the absorbed dose to their embryo or fetus. The
results reported to the authorities and the referring physician. In very rare cases, when the
amount of absorbed dose was considerably high, therapeutic abortion recommended.

IAEA-CN-85-66
492
2. Materials and methods
During the 10 years the information was obtained from cases exposed in pregnancy:
1. Name, age, education, occupation, address and the telephone number of the patient.
2. Date of the last menstrual period (LMP), pregnancy test, weight and the thickness of the
irradiated part of the patient's body.
3. The name of radiology center, the exact date of irradiation and the age of embryo or
fetus at the time of irradiation.
4. The date of marriage, blood group, addictions (if any), contraceptives used and other
family relation with the spouse.
5. Number of previous pregnancies, number and age of present children, history of any
previous abortion and early delivery of any child.
6. History of other previous illnesses of the patient, the spouse and their first grade
relatives.
7. Previous treatments and the drugs taken by the patient and her spouse.
8. Age, education, occupation, addiction (if any) and the blood group of the patient's
spouse.
9. The total dose absorbed (in cGy) by the embryo or fetus during the radiological
procedures.
All the information obtained stored in a database using Fox Pro2 and the statistical analysis of
each variable performed by SPSS/PC + vers. 3.0 software.
3. Results
Some of the results, which seems to be useful and relevant to this conference presented as
following and the rest to be published in another paper:
Patients Age: Figure 1 shows the age distribution of the pregnant patients at the time of
irradiation. The average age is 28.624+5.961. The age of the youngest patient was 15 and the
oldest was 51 years.
Fig. 1. Distribution of woman exposed and the age at irradiation

IAEA-CN-85-66
493
Fig.2. Gestational age in weeks and the corresponding number of exposed fetuses
Embryo or fetus absorbed dose: As shown in Figure 3, the highest occurrence (%37.8) of
absorbed dose to fetus is from 1 to 9 cGy and for absorbed dose from 0.1 to 1 cGy is %31.54.
The mean fetal absorbed dose was 0.68+0.381 cGy.
Fig. 3. The absorbed dose by embryo and fetus during the radiological procedures (N =1341).
4. Discussion and conclusions
The main reasons for the patients to undergo radiological examinations were:
1. Non malignant gastrointestinal problems (%32.75), where in most of the cases
radiological examinations were not necessary and the cause illness had been the
pregnancy itself.
2. Non malignant urologic problems (%19.44). 3) Back pains (%14.31).
3. Orthopedic problems (%11.83). 5) Accidents (%8.07).
4. Non malignant glandular problems except diabetes (%6.97).
The problem of lack of modern radiological systems in developing countries could also lead to
higher doses in the patient's investigation.
The majority of the patients were not aware of their pregnancy before undergoing radiological
examinations and the most of the radiologists did not consider it seriously. Otherwise in many

IAEA-CN-85-66
494
of the above cases the radiological examinations could have ruled out or postponed to after the
childbirth.
The health effects, if any to be expected from the low levels of exposure prevalent in
diagnostic radiology will not be identifiable. Knowing the radiation effects, a great anxiety
was observed amongst the majority of the patients and their families for the fate of the child.
Many of them decided to commit illegal abortion privately, even if the fetus absorbed dose
was negligible.
These facts and the above figures show that we needed and could eliminate or reduce the
patients dose and consequently the absorbed dose to the embryo or fetus considerably.
References
[1] RUSSELL, L.B., Radiation Biology, McGraw-Hill, New York (1954) 861-918 pp.
[2] STREFFER, C., PATRICK, G., (Eds.), Commission of European Communities - Effects
of Prenatal Irradiation with Special Emphasis on Late Effects, Brussels (1984)
[3] UNITED NATIONS SCIENTIFIC COMMITTEE ON THE EFFECTS OF ATOMIC
RADIATION, Report on the Developmental Effects of Irradiation in Utero., United
Nation, New York (1977), 655-725pp.
[4] RUGH, R., Vertebrate radiobiology (embryology), Ann. Rev. Nucl. Sci. 9 (1959) 493-
522.
[5] KRIEGEL, H., SCHMAHL, W., KISTNER, G., STIEVE, F.E., (Eds), Developmental
Effects of Prenatal Irradiation, Fischer, Stuttgart (1982).
[6] COBB, CHARLS, E., Jr., Living with Radiation, National Geographic, (April 1989)
403-437pp.
[7] THAYALAN, K., et al., A Study of Occupational Exposures of Radiation Workers,
AMPI Med. Phys. Bull. 14 4(1989) 172-173.
[8] FULLERTON, G., D., et al., (Eds.), Biological Risks of Medical Irradiations, AAPM
Med. Phys. Monograph No. 5, American Institute of Physics, New York (1980) 33pp.

IAEA-CN-85-1
495
DIAGNOSTIC RADIATION OF POTENTIALLY REPRODUCTIVE FEMALES
M.E. Abd El-Bagi, M.S. Al-Mutairi, M.A. Al-Thagafi, N.M. Al-Masri, O. Al-Sasi
Department of Radiology and Imaging, Armed Forces Hospital, Riyadh, Saudi Arabia
Abstract
Objectives: To find out how consistent or variable is the understanding and practice of radiation protection
procedures for women in the childbearing age at a multispecialty tertiary hospital. Setting: Riyadh Military
Hospital Study. Design: Non-clustered population survey. Methods: A questionnaire was distributed during
grand rounds, mid-day clinics and a radiology conference. Questions included which radiation protection rule
does the respondent use for females, whether he or she is familiar with those rules and what is his or her source of
reference. Further questions were about the radiation dangers to the fetus. Results: Response was 95 (100%).
Fifty-seven (60%) were males and 38 (40%) were females. The majority 50 (53%) were Saudis, 16 (17%)
Western and 29 (30%) were other nationals. Sixty-two (65%) followed the old rule “10-day rule”; 17 (18%)
followed the new “28-day rule” and 16 (17%) didn’t know which rule to follow. None of those who followed the
“28-day rule” indicated hospital policy as their reference. Conclusions: The understanding and practice of
radiation protection guidelines for females is inconsistent. There is significant unfamiliarity with the radiation
protection rules among our hospital practitioners.
1. Introduction
There has been significant changes in the guidelines concerning the exposure of women in the
child bearing age to diagnostic radiation [1,2,3]. The 10-day rule states that all radiologic
examinations of the lower abdomen and pelvis of women of reproductive capacity, that are
not of importance in connection with the immediate illness of the patient, be limited in time to
the period when pregnancy is improbable, i.e. the 10-day interval following the onset of
menstruation. This was replaced by the 28-day rule, which states that the risk of irradiating a
fetus is too small in the first month following the start of menstruation and no limitation is
necessary unless a period is missed. Lately there has been a recommendation of limited return
to the 10-day rule3 for procedures delivering high radiation dose to the female pelvis, namely
pelvic computerized tomography (CT) and barium enemas.
From our own observation, many questions on safety and timing do arise when performing or
deciding appointments for radiological procedures in females. The objective of this study is to
find out how consistent or variable is the understanding and practice of diagnostic radiation
for potentially reproductive females among our hospital practitioners.
2. Methods
A non-clustered population survey. A questionnaire was distributed during grand surgical and
medical rounds, a radiology conference and mid-day primary care/dental clinics. Some of the
meetings were attended by personnel from other institutions in Riyadh. These were excluded
from this study. Demographic information was collected. Respondents were asked whether
they followed the 10-day rule or the 28-day rule and whether they were familiar with either of
them. They were also asked about their source of information regarding these rules whether it
was from the hospital policy, a book, a lecture, course or their own guess. Further questions
covered what the respondent would consider is the most dangerous period for fetal exposure
to diagnostic radiation and what are the specific dangers. The questionnaire was initially pilot
tested. In a study in Britain [4] 20% of hospitals followed the old guidelines. This was used as
an acceptable risk with an allowance up to 35% for maximum tolerable prevalence to
calculate the sample size for a statistical power of 99.9%. Results were manually checked for

IAEA-CN-85-1
496
completeness and were subsequently entered on a data base file. Epistat statistical package
was used for analysis and chi-square test for cross tabulation.
Residents 37
38%
Consultants 36
38%
Health Education
2
2%
Nurses 10
11%
Technologists 10
11%
Figure 1a – Actual jobs of respondents
Primary Care 15
23%
Radiology 15
23%
Surgery 27
41%
Paed 1
1%
Dental
12%
Figure 1b – Departments of respondents 1
3. Results
There were 95 respondents (100% of this cohort. Fifty-seven (60% were males and 38 (40%)
were females. The majority 50 (53%) were Saudis, 16 (17%) were Western and 29 (30%)
were other nationalities. The actual jobs and departments are shown in Figures 1(a) and 1(b).
Sixty-two (65%) indicated that they follow the 10-day rules; 17 (18%) followed the 28-day
rule while 16 (17%) didn’t know which rule to follow. Of those who followed the 28-day rule
12 (70%) were Saudis, 2 (12%) were Western and 3 (18%) were other nationals. Thirty-seven
(39%) respondents said they were not familiar with the 10-day rule and 66 (69%) were not
familiar with the 28-day rule.
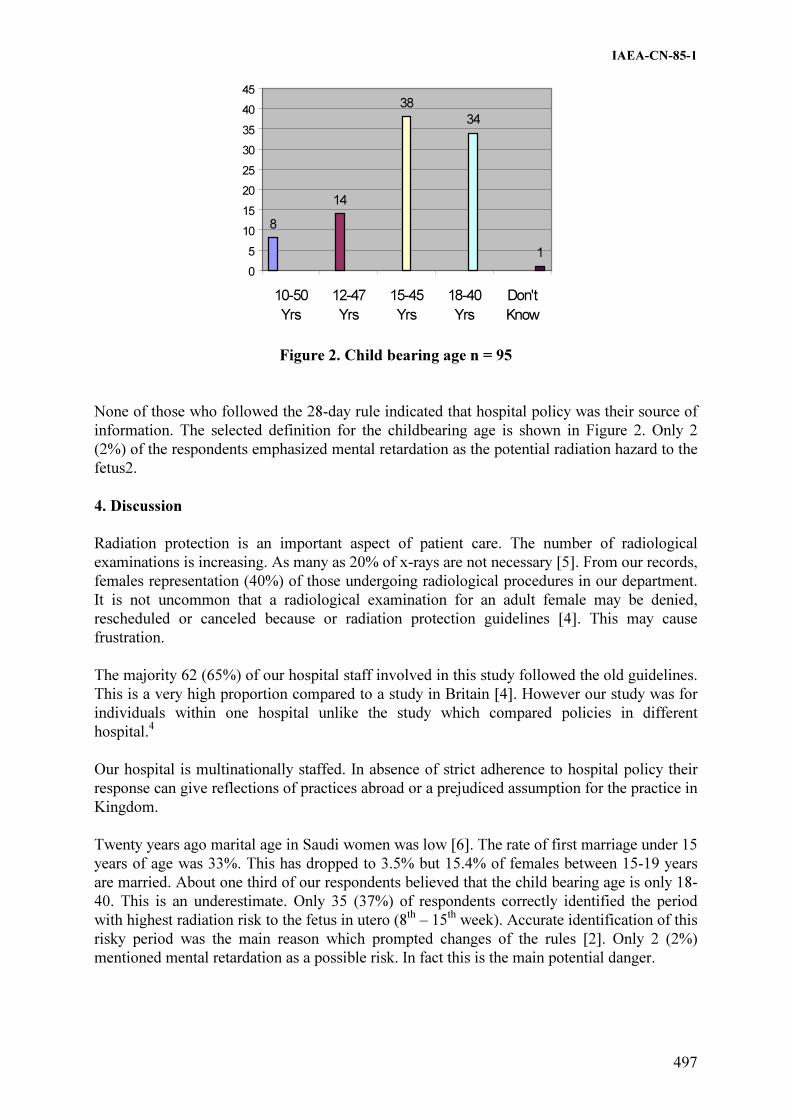
IAEA-CN-85-1
497
8
14
38
34
1
0
5
10
15
20
25
30
35
40
45
10-50
Yrs
12-47
Yrs
15-45
Yrs
18-40
Yrs
Don't
Know
Figure 2. Child bearing age n = 95
None of those who followed the 28-day rule indicated that hospital policy was their source of
information. The selected definition for the childbearing age is shown in Figure 2. Only 2
(2%) of the respondents emphasized mental retardation as the potential radiation hazard to the
fetus2.
4. Discussion
Radiation protection is an important aspect of patient care. The number of radiological
examinations is increasing. As many as 20% of x-rays are not necessary [5]. From our records,
females representation (40%) of those undergoing radiological procedures in our department.
It is not uncommon that a radiological examination for an adult female may be denied,
rescheduled or canceled because or radiation protection guidelines [4]. This may cause
frustration.
The majority 62 (65%) of our hospital staff involved in this study followed the old guidelines.
This is a very high proportion compared to a study in Britain [4]. However our study was for
individuals within one hospital unlike the study which compared policies in different
hospital.4
Our hospital is multinationally staffed. In absence of strict adherence to hospital policy their
response can give reflections of practices abroad or a prejudiced assumption for the practice in
Kingdom.
Twenty years ago marital age in Saudi women was low [6]. The rate of first marriage under 15
years of age was 33%. This has dropped to 3.5% but 15.4% of females between 15-19 years
are married. About one third of our respondents believed that the child bearing age is only 18-
40. This is an underestimate. Only 35 (37%) of respondents correctly identified the period
with highest radiation risk to the fetus in utero (8th
– 15th
week). Accurate identification of this
risky period was the main reason which prompted changes of the rules [2]. Only 2 (2%)
mentioned mental retardation as a possible risk. In fact this is the main potential danger.

IAEA-CN-85-1
498
5. Conclusion
The understanding and practice of radiation protection guidelines for women in childbearing
age is inconsistent among our practitioners. There is unfamiliarity with the guidelines.
Training and education of personnel is necessary. Review and/or circulation of hospital
policies is recommended.
References
[1] Russell JGB. The rise and fall of the 10-day rule. BJR 1986; 59: 3-6.
[2] Pearson R. Radiography in women of child bearing ability. Br Med J 1989, 299: 175-
176.
[3] Bury A. Hufton, Adams J. Radiation and women of child bearing potential. Br Med J
1995; 310: 1022-1023.
[4] Wise DI, Cherry RJ. Regional variations in policy on exposing women of childbearing
age to ionizing radiation. Br Med J 1989; 299: 1206.
[5] Royal College of Radiologists Working Party. Influence of the Royal College of
Radiologists guidelines on hospital practice: a multi center study. Br Med J 1992; 304:
740-743
[6] Al-Mazrou Y, Farid SM, Khan MU. Changing marriage and consanguineous marriage
in Saudi females. Ann of Saudi Med 1995; 15: 481-485.

IAEA-CN-85-182
499
PROGRAMME FOR REDUCING THE RISK FACTORS DUE TO
PRENATAL EXPOSURE
L. Arranz, N. Ferrer, J.M. Sastre
Hospital Ramón y Cajal, Madrid, Spain
Abstract
When a patient is not aware of her pregnancy, the foetus/embryo may be inadvertently irradiated during a
diagnostic exploration or therapeutic intervention. The radiosensitivity of the foetus/embryo changes during the
different periods of gestation. For this reason there are different risk factors for each moment at which the patient
may suffer irradiation. In the past 7 years, the department of Radiophysics and Radiation Protection has been
consulted 75 times for this reason, to evaluate the dose received in the uterus. Since the establishment of a
programme to avoid inadvertent irradiation of the foetus/embryo, these consultations have been reduced. This
programme is based on informing the patients and on training the medical staff.
1. Introduction
The radiosensitivity of the foetus/embryo changes throughout the various stages of gestation.
It is unlikely that exposure of the embryo in the first three weeks after conception would cause
deterministic or stochastic effects in the born infant. In this period practically the only risk is
radioinduced death (all or nothing law). The risk factor is 1 per Gray (1‰ per mGy).
For the remainder of the organogenesis period, conventionally considered after the third week
(until the 8th), malformations may occur in the organ which is developing at the moment of
exposure. These effects are of a deterministic nature and a threshold of 100 mSv has been
estimated with an associated risk of approximately 0.5 per Gy.
In the period between three weeks after conception and the end of gestation, it is likely that
exposure to radiation could cause stochastic effects resulting in an increased probability of
cancer in the live born infant. The risk factor is 0.02 per Gy, implying a risk between 2 and 3
times greater than for the general population.
The risk of serious metal retardation or loss in IQ is high between weeks 8 and 15 (0.45 per
Gy) and low between weeks 16 and 25 (0.1 per Gy). For purposes of comparison, the ratio of
serious mental retardation in born children is 1 in 200. [1 to 3].
2. Estimate of the risk in radiologic and nuclear medicine
In our hospital 75 consultations have been received in the past 7 years to perform a in-uterus
dosimetric study to evaluate foetal risk. Of these, 75% correspond to radiological studies and
25% to Nuclear Medicine (68% correspond to diagnostic explorations and 32% to therapeutic
treatments with I-131). Patient ages vary from 18 to 42 years and declared gestation weeks
vary from 1 to 14 (average of 4 weeks).
The “Effdose” program of the National Institute of Radiation Hygiene of Denmark, the
in-uterus dose documentation of NRPB and ICRP-53 and the MIRD method were used for
dosimetric studies.
A dose of 10 mGy on the foetus, which may be standard for certain types of abdominal
radioexplorations and radionucleide explorations (bone and brain gammagraphs, microcardial

IAEA-CN-85-182
500
perfusion gammagraphs with Tl 201, with Tc-99m MIBI and with Tc-99m TTF, etc.), will
imply an increase in the risk of mental retardation of 4 0/00 when irradiation takes place
between weeks 8 and 15 (the period of highest radiosensitivity), which when compared to the
natural rate (5 0/00) could be considered as acceptable if the benefits of the exploration are
important.
Foetal doses between 10 and 100 mGy or more may occur during complex or simple
radioexplorations performed with poorly optimised equipment and protocols, as well as in
certain explorations and treatments in nuclear medicine (gammagraphs with Ga-67 or
Selenium-75, and therapeutic treatments using I-131, etc.). [3 to 7].
3. Programme for preventing inadvertent irradiation of the foetus/embryo
In view of the results obtained and of interviews performed with several affected patients, it
was decided to carry out a program meant to reduce prenatal risks due to irradiation based on:
3.1. Patient information
The prescribing physician should ask the patient if she is pregnant or if she has missed a
menstruation. If there are doubts regarding the possibility of a pregnancy, the woman will be
considered to be pregnant.
Posters were created with the cooperation of the Ministry of Health and Consumption and the
Scientific Societies of Radiological Protection (SEPR), Nuclear Medicine (SEMN) and
Radiology (SERAM), with a striking and simple design, encouraging the patient to inform the
physician of her situation. These posters were placed next to the appointment windows and in
all waiting rooms, in order to inform the patients in both situations: when requesting an
appointment and prior to the exploration or treatment. The design of the Nuclear Medicine
poster included a request to inform the physician of a lactation situation in order to prevent
risk to the lactant.
Additionally, nurses were asked to inquire all women in fertile ages on behalf of the physician
responsible for the exploration regarding the possibility of a pregnancy before carrying out the
exploration or treatment. In the event of a positive reply the physician was immediately
informed.
3.2. Physician training
All prescribing physicians and specialist physicians in radiology and nuclear medicine shall
receive information on the justification and optimisation criteria proposed by the ICRP and
gathered in our legislation and in Directive 97/43/Euratom. [1,2,8,9].
The criteria indicated are as follows:
�� Only when a diagnostic exploration is well justified do the benefits overcome the risks.
It should also be kept in mind that the risk of not performing a necessary radiological
study may be much greater than the risk caused by the radiation.
�� If a pregnancy cannot be ruled out and the radiological study involves the abdominal or
pelvis region, particular care shall be paid to the justification, and particularly to the
urgency of said study. The ICRP and the EC recommend that diagnostic methods which

IAEA-CN-85-182
501
involve exposure of the abdomen in possibly pregnant women should be avoided unless
there are important clinical indications.
�� Once the exploration is justified, the doses shall be kept as low as reasonably possible,
in accordance with the diagnostic information required.
�� Experience shows that for the same exploration there are great intervals of doses to the
uterus depending on the equipment and protocol of exploration used, so that significant
dose reductions can be obtained without affecting the quality of the diagnostic image.
If the patient declares a possible pregnant state, the following alternatives are suggested,
which shall always be followed under the criteria of the physician responsible for the
exploration or treatment:
�� Cancel the exploration, considering other available methods (ultrasound or MR) which
have the same objective but do not imply exposure to ionising radiation. The patient
may also be asked about any similar studies which she has undergone recently.
�� Postpone for a later date, if it is not urgent, if the patient is uncertain about her state of
pregnancy, until being certain of said state or until after the child is born if the
pregnancy is confirmed.
�� Modify the exploration, (for radiology) to reduce exposure to radiation, reducing the
number of images, selection of projections, reduced radioscopy time and collimation of
the radiation beam.
�� Carry out the full exploration, in all cases ensuring that technical conditions are optimal,
using the minimum mAs, maximum possible collimation in radiology, as well as the
available protection means for adjacent areas which do not affect the image, and for
Nuclear Medicine performing a careful choice of radio-pharmacology and radionuclides
and with the minimum compatible dose administered in order to minimise the dose to
the foetus.
In any case, the decision should always be explained to the patient and her consent requested
(the patient has a right to know the possible risks). In the case of radiotherapy, before making
a decision regarding treatment of the future mother the dose to the foetus shall be carefully
calculated. It will normally be high, but treatment of the mother must in general prevail over
said dose to the foetus. In discussion and decision regarding treatment the mother’s decision
will be considered.
4. Conclusion
With the execution of this program the number of cases consulted per year due to inadvertent
irradiation of the foetus has been to less than 10%. The cooperation of the medical personnel
has been crucial for the success of this experience, so that inclusion of these measures in the
continuous training programs has proved its usefulness and effectiveness.
References
[1] INTERNATIONAL COMMISSION OF RADIOLOGICAL PROTECTION. 1990
Recomendations of the International Commission on Radiological Protection, ICRP.
Publication 60. Ann ICRP, 1991.
IAEA-CN-85-182
502
[2] EUROPEAN COMMISSION; Guía para la protección del feto y los niños pequeños
irradiados debido a la exposición médica de sus progenitores. Protección radiológica
100, OPOCE Luxemburg. 1999.
[3] NATIONAL RADIOLOGICAL PROTECTION BOARD. Diagnostic Medical
Exposures: Advice on Exposure to Ionising Radiation during Pregnanty. Doc NRPB.
1998.
[4] EUROPEAN COMMISSION; Protección radiológica después de la terapia con Yodo-
131 (exposiciones debidas al contacto con pacientes ambulatorios o dados de alta).
Protección radiológica 97, OPOCE Luxemburg. 1998
[5] COHEN B.L. Catalog of risk extended and updated. Health Phys. 61: 317-335, 1991.
[6] UNITED NATIONS. Sources and Effects of Ionizing Radiation.United Nations
Scientific Committee on the Effects of Ionizing Radiation, 1993. Report to the General
Assembly, with annexes.United Nations sales publication E.94.IX.2. United Nations,
New York, 1993.
[7] MOUNTFORD P.J. Evaluación del riesgo del paciente de medicina nuclear. Br J Radiol
70: 671-684. 1997.
[8] INTERNATIONAL COMMISSION OF RADIOLOGICAL PROTECTION.
Radiological Protection and Safety in Medicine, ICRP Publication 73.Ann ICRP, 1996.
[9] EUROPEAN COMMUNITY. Council Directive 97/43/Eurotom of June 30 1997, on
health protection of individuals against the dangers of ionising radiation in relation to
medical exposures. Official J Eur Commun 1997; N.L 180/22.

IAEA-CN-85-121
503
UNJUSTIFIED PRENATAL RADIATION EXPOSURE IN MEDICAL
APPLICATIONS
J. Cárdenas Herrera1, G. López Bejerano
2, A.I. Lamadrid
1, O. García Lima
1,
E. Díaz Bernal1, V. Freixas
1, R. Sánchez
3
1 Centro de Protección e Higiene de las Radiaciones, Havana, Cuba
2 Hospital Clínico-Quirúrgico Miguel Enrique, Havana, Cuba
3 Hospital Obstétrico Ramón González Coro, Havana, Cuba
Abstract
The exposure to the radiation ionising of pregnant women , frequently constitutes motive of preoccupation for the
expectant mother and the medical professionals taken the responsibility with its attention. The protection of the
embryo-fetus against the ionising radiation is of singular importance due to its special vulnerability, to this agent.
On the other hand the diagnosis or treatment with radiations ionising beneficial for the expectant mother, are only
indirectly it for the embryo-fetus that is exposed to a hazard without perceiving anything. The present paper
presents the experience obtained in the clinical and dosimetric evaluation from twenty-one patient subjected
gestantes to diverse radiodiagnostic procedures or nuclear medicine, during the years 1999 - 2000. The obtained
results evidence that 24% of the patients was subjected to procedures of nuclear medicine with diagnostic
purposes. While the period of pregnancy of the patients ranged between 4 and 12 weeks. It could be concluded
that in all the cases the doses received by the patients in the whole body did not exceed 2 mSv. When conjugating
the period of pregnancy of the patients with the doses received there is no have any evidences of significant risks
for the embryo-fetus. Paradoxically the physicians of assistance suggested their patients in all the cases to carry
out the interruption of the pregnancy., demonstrating with this decision ignorance on the biological effects of the
ionizing radiations during the prenatal exposures.
1. Introducción
En los últimos años se ha suscitado en la Comunidad Científica Internacional justificadas
preocupaciones por la contribución de las aplicaciones médicas, a la exposición de las
radiaciones ionizantes en la población mundial. En tal sentido organizaciones nacionales e
internacionales encargadas de la regulación y control en materia de protección radiológica,
han adoptado medidas para minimizar los riesgos derivados de las exposiciones médicas,
tanto para los pacientes, como para el público en general. [1, 2, 3]. Sin embargo en estas
regulaciones no siempre queda claro la especial protección que requiere el embrión-feto y el
recién nacido durante los períodos de gestación y lactancia respectivamente.
El embrión-feto y los recién nacidos son muy vulnerables a los riesgos de las radiaciones
ionizantes, que pueden llegar a producirles múltiples efectos de severidad variable y por otra
parte estos no reciben beneficios directos de la exposición de su progenitora para fines de
diagnóstico y tratamiento médico. Estas razones nos motivaron a llamar la atención sobre el
comportamiento de las exposiciones médicas, con mujeres gestantes en instituciones
hospitalarias.
El trabajo expone los resultados obtenidos en la evaluación clínico-dosimétrica de veintiuna
pacientes sometidas a procedimientos médicos de medicina nuclear o radiodiagnóstico,
realizados en instituciones hospitalarias de la Ciudad de la Habana, Cuba.

IAEA-CN-85-121
504
2. Materiales y métodos
Para realizar la evaluación clínico-dosimétrica, a las pacientes que forman parte de esta
investigación, estas son sometidas a un interrogatorio detallado, con el objetivo de conocer y
precisar las causas y circunstancias de la exposición a que fueron sometidas. Con
posterioridad se les realizan exámenes clínicos y de laboratorio y se determina la magnitud de
la exposición a las radiaciones ionizantes mediante diversas técnicas de evaluación
dosimétrica.
Finalmente, en todos los casos se prestó especial atención a brindarle consejos genéticos a las
pacientes con el propósito de reducir su estrés y de facilitar la comprensión real del riesgo al
que fueron sometidas.
3. Resultados y discusión
En el interrogatorio a las pacientes gestantes se trató de identificar y precisar los estudios que
le fueron practicados y las dosis recibidas o actividades administradas en ellos, edad
gestacional en el momento que estos se realizaron; así como factores de riesgos adicionales a
esta exposición, como los relacionados con la edad y número de embarazos anteriores. En el
gráfico 1 se presenta la distribución de las gestantes incluidas en este trabajo, según su edad y
número de embarazos, comprobándose que el 62% de ellas en el momento en que se les
realizó el estudio, se encontraban en edad gestacional con bajo riesgo y sólo el 10% se
encontraba en edad de mayor riesgo.
0
0.5
1
1.5
2
2.5
3
3.5
4
Cantida
dde
gestantes
G1 G2 G3 G4
No. de embarazos
Distribución del número de gestantes, por grupos de
edades y No. de embarazos
> 20 años
20 – 25 años
26 – 30 años
< 30 años
Figure 1. Distribución de las gestantes según edad y número de embarazo
Nota: La G en este gráfico significa el número de embarazos. La distribución de las gestantes
según el procedimiento médico y dosis de exposición a que fueron sometidas, se presenta en
la tabla No.1. Como se muestra el 76% de las gestantes estuvieron sometidas a
procedimientos de radiodiagnóstico, que incluyen desde estudios convencionales hasta
estudios de tomografía computarizada, en dos casos. Los procedimientos de medicina nuclear
se asociaban a estudios funcionales, especialmente de la glándula tiroidea.

IAEA-CN-85-121
505
Tabla 1. Distribución de las gestantes según procedimiento médico y dosis de exposición
Procedimientos Dosis de exposición (mSv)
> 1 1-2 hasta 3
Radiodiagnóstico 11 (52%) 5 (24%) -
Medicina Nuclear 2 (10%) 2 (10%) 1 (5%)
Tanto en los procedimientos de radiodiagnóstico como de medicina nuclear las dosis recibidas
por los pacientes en órganos o localizadas, no sobrepasaron los 3 mSv, exponiéndose el 62%
de las pacientes a dosis inferiores a 1 mSv.
Aspecto a destacar es, que del interrogatorio realizado a las pacientes, se puso de manifiesto
que en una buena parte de los casos, los prescriptores o ejecutores de los procedimientos no
adoptaron las medidas elementales para determinar si las pacientes se encontraban
embarazadas, violando de tal forma principios establecidos en materia de protección
radiológica al paciente. Sólo el 39% de las pacientes fueron interrogadas al respecto, las
cuales negaron la posibilidad de encontrarse en la condición antes citada, evidenciando de tal
forma el desconocimiento que poseen de que el riesgo de embrión-feto durante la exposición
prenatal a las radiaciones ionizantes se encuentra condicionado a la dosis de exposición y a la
edad gestacional a la que esta se produce [1, 4, 5].
La tabla No.2 muestra que el 57% de las gestantes estudiadas se expusieron a dosis muy bajas,
inferiores a los 3 mSv y en una etapa temprana del embarazo, factores estos, que determinaron
la inexistencia de efectos determinísticos y la disminución de los estocásticos [1,4].
Tabla 2. Distribución de las gestantes según edad gestacional y dosis de exposición
Edad gestacional Dosis de exposición (mSv)
> 1 1-2 hasta 3
> 8 semanas 7 (33%) 5 (24%) -
8-12 semanas 6 (29%) 2 (10) 1(5%)
Sin embargo inexplicablemente los médicos de asistencia de las gestantes indicaron a sus
pacientes la interrupción del embarazo. Situación que somete a los pacientes a un riesgo
adicional mayor al esperado por las radiaciones y por otra parte manifiesta falta de
conocimiento sobre los efectos de las radiaciones ionizantes.
4. Conclusiones
El estudio permitió conocer como con frecuencia, en las instituciones hospitalarias se violan
procedimientos usuales y reconocidos en materia de protección radiológica al paciente.
Demostrando además, la conveniencia de continuar desarrollando programas de capacitación
en esta materia, dirigido esencialmente a los profesionales de la salud encargados de proteger
y orientar a sus pacientes. La limitación fundamental del trabajo, es la imposibilidad de darle
un sistemático seguimiento epidemiológico a las pacientes expuestas, aspecto para el cual
debe trazarse una estrategia.

IAEA-CN-85-121
506
Referencias
[1] Recomendaciones de la comisión Internacional de Protección Radiológica ICRP 60
1990.
[2] Protección Radiológica y Seguridad en Medicina, Publicación 73 ICRP.
[3] Implementacion of the Medical Exposure directive 97/43/ Euraton Radiatión Protección
102.
[4] Genetic and Somatic, Effects of ionizing Radiation United Nations Scientific
Committec and the efects of Atomic radiation 1996 repolt to the general Asembly,
Biologica effects of prenatal irradiacion.
[5] Comisión Europea Madrid 1998. Guía para la Protección del Feto y los niños pequeños
irradiados debido a la exposición médica de sus progenitores. Protección Radiologico
100 Comisión Europea.

IAEA-CN-85-75
507
RADIATION DURING PREGNANCY
K. Faulkner
Quality Assurance Reference Centre, Newcastle General Hospital,
Newcastle upon Tyne, United Kingdom
J.F. Malone
Trinity College, Dublin, Ireland, United Kingdom
R.H. Corbett
Radiology Department, Hairmyers Hospital, East Kilbride, United Kingdom
P. Craven
Barrister at Law, Dublin, Ireland, United Kingdom
E.K. Osei
Medical Physics Department, Princess Margaret Hospital, Toronto, Canada
Abstract
The risks of radiation during pregnancy are well established. There is a risk of somatic effects, genetic effects
occurring in subsequent generations and mental retardation if the fetus is irradiated in the critical 8-15 week
period when organogenesis occurs. It is imperative that the unintended irradiation of the fetus is avoided. Whilst
fetal risks have been appreciated for some time, the International Commission on Radiological Protection has
never issued practical guidance. However, many national bodies have developed such guidance. In many centres
the 10-day and 28-day rules have been variously applied. The purpose of this paper is to review various sources
of advice and to highlight three practical implementation issues. These are:
1. Referral could mean more than one examination is performed.
2. The application of the concept of justification to elective procedures.
3. Practical implementation issues.
1. Introduction
The risks of radiation during pregnancy are well established. The main risks are the possibility
of inducing cancer (mainly leukaemia), genetic effects occurring in subsequent generations (as
the fetus may be considered as a potential parent), and mental retardation, if the fetus is
irradiated during the critical 8-15 week period when organogenesis occurs [1]. It is as a
consequence of these potential effects of ionising radiation that operational rules are applied
for the diagnostic exposures of women who are or may be pregnant, so that these risks are
minimised or are avoided. Over a number of years various advice on avoiding the unintended
irradiation of the fetus during pregnancy has been issued by the National Radiological
Protection Board (NRPB). This has resulted in what are known as the 10-day and the 28-day
rules [2]. As a result of advice from the NRPB [2] the 28-day rule replaced the earlier 10-day
rule. At the time it was felt that the risks of radiation to the fetus in the initial period following
conception were so low as not to warrant the rescheduling of the mother’s examination. This
decision arose from a reappraisal of the risks during the first weeks post conception and
compares those risks with those of the mother not having the examination. Fundamentally, the
basis for the advice on avoiding radiology during pregnancy is a judgement on the risks of
performing an examination compared with those of not performing the examination. It is
interesting to note that neither the International Commission on Radiological Protection or the
International Atomic Energy Agency has issued advice on any rule applying to medical
exposure of women who are or may be pregnant. The purpose of this paper is to review the
work of international organisations in this area and highlight three practical aspects associated
with the implementation of these rules.

IAEA-CN-85-75
508
1. Referral for a radiological opinion could mean more than one examination is performed.
2. The application of the concept of justification to elective procedures.
3. The implications for practical implementation within a radiology department.
2. National and international advice
Recently two documents have been published which influence the advice on radiation during
pregnancy. First is the Medical Exposures Directive of the Commission of the European
Communities [3], which places statutory duties on member states. It represents a legal
obligation rather than advice on good practice. Article ten of the Directive covers special
protection during pregnancy and breast-feeding. This article requires those responsible (i.e. the
doctor prescribing the examination and the practitioner performing it) to ask whether a female
of child bearing age is or maybe pregnant. If pregnancy cannot be excluded, special attention
shall be given to the ‘justification’ of the procedure. The article requires that the procedures
performed on pregnant women are optimised and that the exposure of both the expectant
mother and unborn child are considered. In this context the risk/benefit consideration for
radiological examinations of women who are pregnant or who may be pregnant is quite
demanding and complicated. The risk involves a consideration of the effects of the
examination on both the patient and the unborn child. Included in the assessment is the effect
of postponing the examination on the mother. The mother mainly derives the benefit of the
examination and the embryo/fetus may only benefit indirectly.
The second document is the joint guidance from the National Radiological Protection Board,
College of Radiographers and Royal College of Radiologists on exposure to ionising radiation
during pregnancy [1]. The objective of the joint advice is to prevent the unnecessary exposure
of the fetus during radiological procedures in pregnancy. The advice suggests that when a
female of reproductive age is to have an examination in which the pelvis is likely to be
irradiated by the main beam emitted by the X-ray set, or during nuclear medicine
investigations, she should be asked if she is, or might be pregnant. If there is no possibility of
pregnancy then the examination may proceed. If the patient is definitely or probably pregnant
then the justification for the examination must be reviewed. In these circumstances, if a
procedure is undertaken it is essential that the examination be optimised so that the fetal dose
is minimised, consistent with the diagnostic objectives of the examination. If pregnancy
cannot be excluded and the radiation dose involved with the examination is considered to be
low then the joint advice is to proceed with the examination, provided that the period is not
overdue. On the other hand, for ‘high dose’ procedures, which are considered to be
examinations resulting in fetal doses of some tens of mGy, it is suggested that one of the
following two courses of action should be adopted.
1. Apply the 10-day rule, in which females of childbearing age are booked for a
radiological examination in the first 10 days following the onset of menstruation, or
2. Re-book patients who attend for such examinations and are identified to be in the
second half of their cycle and in whom pregnancy cannot be excluded.
3. Practical Implications
There are a number of issues that arise from applying this advice in a practical situation in the
context of the operational procedures of a radiological department. Firstly this depends on the
definition of a high dose procedure, as a few tens of mGy is an imprecise end point for
practical purposes. It could be interpreted usually as applying to all examinations where the

IAEA-CN-85-75
509
fetal dose could be 20 mGy or more. The joint guidance ignores the issue that women are
referred for a radiological opinion. In many instances the radiologist may decide to perform a
series of radiological investigations to achieve a diagnosis. Consequently, this could involve
the woman having a number of radiological examinations that individually would result in
doses below 20 mGy but cumulatively could mean that the fetus receives a dose in excess of
20 mGy. Whilst most departments would be aware that more than one examination may be
performed and would be aware that the cumulative dose would be over 20 mGy, some may
not recognise that underlying issue. Applying the advice of the NRPB, COR and RCR would
not preclude this eventuality. For example, a woman referred for an investigation for lower
back pain could have a conventional radiographic examination of the lumbar spine, and
intravenous pyelogram followed by a computerised tomography scan of the lumbar spine.
Independently, these examinations would each have fetal doses below the 20-mGy value, but
collectively the fetal dose would be above this level. This hypothetical example is illustrative
of two further issues. Firstly, lower back pain is not considered an emergency or needing
urgent investigation. Secondly, conservative treatment, without the need for radiological
examinations is usually advocated.
Thus when a request for a radiological opinion is received for lower back pain, or other
conditions that could precipitate a series of conventional radiographs of the lower abdomen,
then it is recommended that the department develop an operational policy to deal with this
situation. It is suggested that the fetal dose is estimated to discover whether the cumulative
fetal dose from these examinations is above 20 mGy. It is important to stress the need to
estimate the dose to the individual woman, as there is scientific evidence that suggests that
women who have x-rays who subsequently discover that they are pregnant would receive a
fetal dose higher than that suggested by using the average from a large-scale survey.
In elective investigations, the situation of the embryo/fetus with regard to radiation risks must
be respected. Elective in this context means an examination that could be performed straight
away or deferred for a period of time without adversely affecting the mother. In many
respects, this situation is similar to that of the occupational exposure of a woman who is
known to be pregnant as the latter is in effect an elective exposure. For occupational
exposures of staff, the fetus is considered to be a member of the public [4]. By implication if
one considers occupational exposures to be elective then advice should be consistent in
relation to fetal exposure. However, the dose threshold for elective examinations (i.e. a few
tens of mGy) is much larger than the dose limit for occupational exposures, which in most
circumstances would be regarded as elective exposures. For an elective medical exposure, the
benefit of the exposure to the mother and hence the child must be taken into account. In
particular, for elective procedures the concept of justification should be adapted to take into
account that it may be possible to reschedule the examination and avoid the fetal radiation risk
entirely.
Secondly the Medical Exposures Directive is written in terms of the unborn child. In a court
of law this could be interpreted as including both the pre- and post-implantation phases of
pregnancy. The advice on the development of the 10 and 28-day rules should be viewed in the
context. Application of both rules must obviously be adjusted to take account of individual
variations of the duration of the menstrual cycle. The impact of changes in the menstrual cycle
on the 10 and 28-day rules is explained clearly in the NRPB document [1]. If the woman had a
shorter cycle than the normal 28 days, fertilisation could occur before 10 days. For example, a
lady with a cycle of 21 days, there would be a possibility of fertilisation occurring at any time
after 7 days of the menstrual cycle. Consequently the application of a 10-day rule without
IAEA-CN-85-75
510
considering the menstrual cycle of the individual concerned could result in the unintended
irradiation of the unborn child. This is particularly relevant as many departments use a form
that records the date of the last menstrual period and not whether the patient has been asked if
she is pregnant.
Applying the 28-day rule also has difficulties. The purpose of asking female patients of
childbearing age the date of their last menstrual period is to establish whether the patient is
pregnant. This is an inappropriate question if it is the only one that is posed as it has an
implicit assumption that the patient has a 28-day menstrual cycle. Thus in a practical situation,
it is a waste of time, as is recording the date of the last menstrual period on the request form.
Asking the question ‘Have you missed a period?’ or ‘Are you or could you be pregnant?’ are
to be preferred. For women who state that they have missed a period it is necessary to
establish whether they could be pregnant, because not all women in this group will be
pregnant. Developing an operational procedure to ask a series of diplomatic and appropriate
questions in the light of the above is beset with difficulties.
A fundamental question in formulating advice on irradiation during pregnancy is upon what
level of risk should the guidance be based. Implicit in the joint advice is that at 20 mGy the
risk is considered not to require the rescheduling of radiological examinations. It is stated in
the joint guidance [1] that this level equated to a probability of inducing fatal cancer to age 15
of 1 in 1,650. This compares with a fatal cancer risk to age 15 in the general population of 1 in
1,300. Thus extrapolating from joint advice, 25 mGy doubles the fatal cancer risk to age 15.
The choice of a few tens of mGy must be the subject on informed debate and not appear to be
a somewhat arbitrary figure. In addition, there is a risk of hereditary effects from fetal
irradiation, which at a fetal dose 20 mGy equates to a risk of 1 in 52,000 (extrapolating from
reference 1). This is somewhat less than the natural risk of hereditary disease at birth in the
human population of 6%, which depends on what is considered to constitute heritable disease.
Moreover, there is the unknown risk of the loss of an embryo prior to implantation. One may
suspect that many members of the general public would choose, with strictly elective
procedures, not to undergo these risks and reschedule their appointments to a time when they
are definitely not pregnant.
In addition, most operational procedures for radiological examination of women of
childbearing potential will have to be developed at a local level. There is an opportunity for
there to be confusion over who has day to day operational responsibility. Is it the referring
physician/surgeon, the radiologist identifying the procedures to be performed or the
radiographer performing them? This issue has clear medico legal consequences and should be
addressed in the implements of the Medical Exposures Directive [3].
In summary, there are a number of practical issues surrounding the implementation of the joint
advice in the context of the Medical Exposures Directive of the European Union. These issues
have a much wider relevance. We wish to raise these issues in order to stimulate a scientific
debate on a basis for the formulation of this advice and how this should be transposed into
practical guidelines.

IAEA-CN-85-75
511
References
[1] Diagnostic Medical Exposures – Advice on Exposure to Ionising Radiation During
Pregnancy, Joint guidance from the National Radiological Protection Board, College of
Radiographers, Royal College of Radiologists. 1998 (NRPB Chilton Didcot) ISBN
085951420X.
[2] Royal College of Radiologists/College of Radiographers Guidance for the
Implementation of ASP8. Exposure to Ionising Radiation of Pregnant Women. Advice
on the diagnostic exposure who are or who may be pregnant. (RCR, London) 1980.
[3] Council Directive 97/43 Euratom 30 June 1997 On Health Protection of Individual
against the dangers of ionising radiation in relation to medical exposure and repealing
directive 84/466 Euratom. European Union, Brussels 1997.
[4] International Commission on Radiological Protection. 1990 Recommendations of the
ICRP. Publication 60 (Pergammon Press, Oxford) 1991.

IAEA-CN-85-236
512
EXPERIMENTAL DETERMINATION OF FOETAL DOSES RECEIVED
DURING CONVENTIONAL X RAYS EXPLORATIONS OF
TRONCUS. INFLUENCE OF THE LEAD APRON
X. Pifarré, L. Brualla, J. Ruiz, C. Escalada, D. Planes, M.C. Paredes
Scio. de Radiofísica, Hospital Universitario Clínica Puerta de Hierro, Madrid, Spain
Abstract
The aim of this paper is to assess the real doses received by pregnant women during some X rays conventional
explorations of torax and abdomen. The procedure that has been used is the measurement of doses by the use of
thermoluminiscent dosimeters located on the uterus position of a Random phantom, and simulating different
conventional X rays explorations. The results of such measurements are compared with other data published in
ICRP 34, which were our reference. We have obtained smaller doses with the measurements than those derived
from ICRP 34. The causes of these differences are analysed. The influence of the use of lead apron to protect
abdomen during thorax examination, is also analysed, computing the real value of this protection. We conclude
that it seems interesting to obtain measurements of theses doses with our own equipment and techniques, because
it offers a more realistic approximation to real doses received by patients.
1. Introducción
En los Servicios de Diagnóstico por imagen es frecuente la irradiación de embarazadas como
consecuencia de exploraciones de RX a las que se someten, conociendo o no, su estado de
gestación. En estos casos es muy importante poder estimar con la mayor precisión posible la
dosis de radiación que puede recibir el feto. Como se sabe, los tejidos del feto resultan
especialmente radiosensibles, y es fundamental poder ofrecer a la madre los datos mas
próximos a la realidad que le ayuden a valorar su situación y a veces a calmar la ansiedad que
estas exposiciones pueden producir.
Medir la dosis directamente en útero mediante el uso de un maniquí antropomórfico,
pensamos que proporcionaría datos más próximos a la realidad.
2. Objetivos
En este trabajo se pretende hacer una estimación experimental de las dosis recibidas en el
útero en las exploraciones radiológicas de tronco más comunes: tórax (PA y lateral), columna
dorsal (AP y lateral), columna lumbar (AP y lateral), coxis, sacroilíacas, abdomen y caderas.
Esta dosis se considera como la que recibiría el feto en el caso de tratarse de una paciente
embarazada. Los resultados obtenidos se comparan con los datos obtenidos a partir de la
I.C.R.P. 34 �1�, que nos han servido de referencia hasta ahora.
En los estudios de tórax y columna dorsal el útero no se encuentra dentro del haz de rayos y en
esos casos se valora la influencia de un delantal de plomo que protege el abdomen durante la
exploración.
Las proyecciones de columna dorsal (AP y lateral) y columna lumbar (AP y lateral) han sido
efectuadas con técnicas de alto y bajo kilovoltaje con el fin de registrar de qué forma afecta la
técnica de exploración a la dosis en útero.

IAEA-CN-85-236
513
3. Material
Sala convencional de exploraciones radiológicas con un tubo de rayos X MSN 742-240/180 y
un generador MPG50 de General Electric. La filtración total del tubo de rayos X es de 3.42
mm de Al.
Sistema de medida basado en dosímetros de termuluminiscencia TLD-100 de dimensiones
3x3x1 mm3 y un lector Harshaw modelo 4000. Los dosímetros estaban calibrados
individualmente frente a una cámara Radcal modelo 20X5-60.
Maniquí antropomórfico Rando formado por 35 discos (34 de 2.5 cm de altura y uno de 10
cm)
4. Metodología
Para la realización de las medidas se reprodujeron las condiciones propias de cada una de las
exploraciones radiológicas objeto de estudio usando como paciente al maniqui Rando. En
cada medida se colocaron dos dosímetros en el interior del maniquí en la ubicación del útero
(parte superior del disco 31, en el 4º orificio de la columna central desde la superficie anterior
del maniquí).
En cada estudio se efectuó una serie prolongada de disparos para que la dosis registrada por
los dosímetros fuera apreciable. El kilovoltaje seleccionado fué el característico de la
exploración; las proyecciones de Columna Dorsal y Lumbar se repitieron para dos valores de
kV distintos que se han considerado como los extremos de un intervalo dentro del cual se
trabaja habitualmente.
Las exploraciones se simularon con la configuración y la técnica que se indican en la tabla 1.
Tabla 1: Configuración utilizada para la simulación de cada proyección
Exploración Campo longitudinal Campo
transversal
Placa dFPelíc.
(en cm)
kV
Tórax PA
centro entre discos
15 y 16; límite inferior
entre discos 23 y 24
35 cm
35x43 long.
180
120
Tórax lateral
centro mitad disco 15
límite inf. mitad 22
35 cm
35x43 long.
180
120
C. dorsal AP discos 10 a 20 14 cm 30x40 long. 100 65-80 *
C. dorsal lat. discos 10 a 20 mitad posterior 30x40 long. 100 65-75 *
C. lumbar AP discos 21 a 31 14 cm 30x40 long. 100 65-77 *
C. lumbar lat. discos 21 a 31 rebasa en 1 cm 30x40 long. 100 74-85 *
Abdomen discos 20 a 32 rebasa en 1 cm 35x43 long. 100 70
Coxis AP discos 30 a 34 14 cm 24x30 long. 100 70
Coxis lateral discos 29 a 35 mitad posterior 24x30 long. 100 78
Sacroilíacas discos 26 a 31 17.5 cm 24x30 trans. 100 70
Pelvis discos 26 a 35 rebasa en 1 cm 35x43 trans. 100 75
* Exploraciones efectuadas con dos kilovoltajes distintos

IAEA-CN-85-236
514
En todos los casos la angulación del tubo es de 0º menos para el coxis AP (15º caudal) y las
sacroilícas (10º cefálico). En el caso de las imágenes de tórax y columna dorsal las medidas se
efectuaron con y sin delantal para determinar el efecto del mismo.
La reproducibilidad de este sistema se ha puesto a prueba mediante la repetición de las
medidas de simulación de tórax en tres ocasiones, obteniéndose una desviación standard
media para los 8 dosímetros utilizados del 10% respecto a los valores medios medidos.
5. Resultados
Los resultados de las medidas se muestran en la Tabla 2 y vienen expresados como dosis
absorbida en útero por mAs.
Tabla 2. Resultados de dosis absorbida en útero expresados en mGy/mAs
Exploraciones Kilovoltaje mGy/mAs
Tórax PA 120 0.30
Tórax lateral 120 0.15
C. dorsal AP 80 <0.06
C. dorsal AP 65 <0.06
C. dorsal lateral 75 <0.06
C. dorsal lateral 65 <0.06
C. lumbar AP 77 7.11
C. lumbar AP 65 4.01
C. lumbar lat. 85 2.56
C. lumbar lat. 74 1.28
Abdomen 70 6.46
Coxis AP 70 10.77
Coxis lateral 78 6.32
Sacroilíacas 70 11.88
Pelvis 75 22.52
NOTA: Las medidas de Columna Dorsal son inferiores al umbral de
sensibilidad del sistema de medida TLD-100 utilizado.
Como los dosímetros están calibrados para proporcionar valores de exposición, las dosis
absorbidas en útero han sido calculadas a partir de
Dmedio= fmedio·X· A donde fmedio= 0.876·( / )
( / )
� �
� �
en medio
en aire
,
X es la exposición y A es la relación entre la fluencia de energía en el medio y en el aire. Para
el rango de energías considerado el valor de A es 1 y el valor de fmed se toma como 0.920 �2�
y �3�.
Para los tórax con delantal se han obtenido los resultados de la Tabla 3. Para las proyecciones
de Columna Dorsal no se ha podido establecer la eficacia del delantal por cuanto todas las
medidas obtenidas están por debajo del umbral de sensibilidad del sistema de medida de TLD.

IAEA-CN-85-236
515
Tabla 3. Dosis en útero medidas en exploración de Tórax, con y sin delantal
Exploraciones Delantal mGy/mAs
Tórax PA NO 0.30
Tórax PA SI 0.28
Tórax Lateral NO 0.15
Tórax Lateral SI 0.13
6. Conclusiones
En la tabla 4 se comparan los resultados obtenidos con los que se obtienen a partir de la
I.C.R.P. 34.
Tabla 4. Comparación entre las dosis en útero medidas y las calculadas con la ICRP-34
Exploraciones HVL (mm Al)-kV I.C.R.P. 34
(mGy/mAs)
Valor medido
(mGy/mAs)
Tórax PA 4.9 - 120 0.41 0.30
Tórax lateral 4.9 - 120 0.20 0.15
C. dorsal AP 3.2 - 80 0.11 <0.06
C. dorsal AP 2.6 - 65 0.04 <0.06
C. dorsal lateral 3.0 - 75 0.05 <0.06
C. dorsal lateral 2.6 - 65 0.03 <0.06
C. lumbar AP 3.1 - 77 33.11 7.11
C. lumbar AP 2.6 - 65 18.93 4.01
C. lumbar lat. 3.4 - 85 7.93 2.56
C. lumbar lat. 2.9 - 74 4.46 1.28
Abdomen 2.8 - 70 25.75 6.46
Pelvis 3.0 - 75 38.90 22.52
Se observa cómo en todos los casos presentados los resultados obtenidos son menores que los
calculados a partir de la I.C.R.P 34. Este hecho puede ser debido a factores tales como una
mayor colimación de los campos, empleo de un generador de alta frecuencia, capa
hemirreductora ligeramente menor. Estos resultados aconsejan la medida directa en maniquies
o simuladores siempre que sea posible, porque en general puede ofrecer una mejor
aproximación a la realidad. Se ha observado que el uso del delantal reduce sólo la dosis en
útero entre un 7% y un 13% en las proyecciones de Tórax; esto demuestra que la mayor parte
de la radiación que alcanza al feto es transmitida dentro del propio organismo y sólo una
pequeña parte procede de dispersión generada en el exterior (colimadores, etc.). No obstante,
el hecho de estar considerando efectos estocásticos de las radiaciones nos conduce a
recomendar su empleo.
Referencias
[1] ICRP Publication 34. Protection of the Patient in Diagnostic Radiology
[2] Wyckoff HO. (Communication.) Med Phys 1983:715
[3] The Physics of Radiation Therapy. Faiz M. Khan, Ph.D.

IAEA-CN-85-9
516
THE SOFTWARE PROGRAM PERIDOSE TO CALCULATE THE FETAL DOSE
OR DOSE TO OTHER CRITICAL STRUCTURES OUTSIDE THE TARGET AREA
IN RADIATION THERAPY
P.H. van der Giessen
Dr. Bernard Verbeeten Institute, Tilburg, Netherlands
Abstract
An accurate estimate of the dose outside the target area is of utmost importance when pregnant patients have to
undergo radiotherapy, something that occurs in every radiotherapy department once in a while. Such peripheral
doses (PD) are also of interest for late effects risk estimations for doses to specific organs as well as estimations
of dose to pacemakers. A software program Peridose is described to allow easy calculation of this peripheral
dose. The calculation is based on data from many publications on peripheral dose measurements, including those
by the author. Clinical measurements have shown that by using data averaged over many measurements and
different machine types PDs can be estimated with an accuracy of � 60% (2 standard deviatons). The program
allows easy and fairly accurate estimates of peripheral doses in patients. Further development to overcome some
of the constraints and limitations is desirable. The use of average data is to be preferred if general applicability is
to be maintained.
1. Background and purpose
The incidence of cancer increases with age and as a consequence most patients entering a
radiotherapy department are elderly. Nevertheless, this does not exclude the possibility of
cancer occurring in younger people, at an age where they still have the prospect of
establishing a family and having children. If young patients are treated with radiation it is
essential that the dose to the gonads is kept as low as possible to keep the risks to the
offspring at an acceptable level. Should pregnant patients be presented for radiation therapy
and this therapy can not be postponed, keeping the dose to the fetus as low as possible is of
utmost importance. Furthermore, there are times that conception occurs just prior to or during
treatment. Knowledge of this dose at distances larger than a few centimeters outside the
primary beam, which is called the peripheral dose (PD), is therefore essential in those cases.
Computerised planning systems can accurately calculate the dose inside and at the edges of
the primary beams; however, accurate dose calculations are usually limited to a few
centimeters outside of the beam edges. Determination of the peripheral dose has been the
subject of extensive investigation, the results of which we have published previously [1-3]. In
these papers data were presented for photon energies from cobalt-60 gamma radiation to 6, 10,
and 23 MV x-rays. These values were derived from measurements of the contributions to the
PD from radiation scattered in the patient, leakage radiation, and radiation scattered from the
collimator. Our own data were combined with other published data [4] and were used to
generate a generalized method to estimate the peripheral dose for any arbitrary field size or
shape at different depths. In patients an accuracy of ± 60% (2 standard deviations) could be
obtained [5]. In view of the uncertainty of known risk factors, we consider this accuracy
acceptable.
On the basis of this generalized method we decided to develop a software program to perform
these calculations automatically and to make this program available to the radiotherapy
community.

IAEA-CN-85-9
517
2. Structure of the program
The software is written in Delphi. Minimum system requirements are 4 MB RAM, and
requires a 4 MB hard disk. It runs under Windows, version 3.11 and higher.
The data of our paper on a general applicable calculation method [4] form the basis for the
calculation algorithm.
All graphical data from that paper are transformed into tabular data and intermediate values
are determined by linear interpolation.
In figure 1 the input screen for one beam is presented showing also which input data are
required. The maximum number of beams that can be calculated in one run is eight.
Figure 1. Input screen for beam 1 of two-beam calculation. At the top the total results are shown,
at the bottom the results for beam 1
2.1. Orthogonal beams
In the first step the peripheral dose is calculated per beam as a percentage of the dose at depth
of maximum dose (dmax) at a reference depth of 10 cm for a reference thickness of the patient
of 20 cm. The equivalent square field size is used. A distinction is made between cobalt-60
gamma radiation and 4 to 25 MV photons.
The small variation of the PD for photon energies between 4 and 25 MV is accounted for by
applying a correction factor in the second step.
Patient thickness is corrected for in the third step. When the primary beam travels through
more tissue the contribution from patient scatter to the PD increases. The effect is greatest for

IAEA-CN-85-9
518
small distances. Variation of the PD with depth is accounted for in the fourth calculation step.
There are two opposite effects involved. Close to the beam the patient scatter contribution
increases with depth as a result of the forward directed Compton scattering. On the other hand
the contribution of leakage radiation and scattered radiation from the collimator, referred to as
collimator related radiation (CRR), decreases with depth because of attenuation. This decrease
roughly follows the percentage depth dose distribution of the primary photon energy. Far away
from the beam the CRR is the sole source of radiation so the correction factor follows the
primary beam attenuation.
In step five a correction is made to the PD if the CRR is intercepted by the couch. This might
be the case for posterior-anterior beams for target volumes further away from the PD point,
for instance when treating targets in the thorax or head and neck, with the PD point in the
pelvic area. The CRR will then be attenuated by the couch.
In our calculation model, distance is defined as the distance of the PD point to the beam
central ray, as opposed to some authors who use the distance to the beam edge. Consequently
in our model field elongation can have a considerable influence. The PD point is much closer
to the edge of an elongated fields with the long axis in the direction of the distance vector than
with the long axis perpendicular to that vector. Especially at small distances this can make a
considerable difference, again due to foreward directed Compton scattering. This correction is
step six of the program.
Wedges in the beam have a large effect on the PD by the added amount of scattered radiation
emanating from the wedge. This effect is largest for externally mounted wedges and smaller
for internally mounted ones. Only few publications [6-8] deal with this issue and based on a
combination of our own measurements and the published data, a global correction factor of 4
is used for external wedges and 1.5 for internal wedges in step seven.
In step eight the fraction of the PD contributed by the CRR is calculated. Again two sets of
data are used, one for cobalt-60 gamma radiation and one for 4 to 25 MV photons, giving the
fraction of the CRR as function of the field size and distance. Although this will vary between
different collimator designs, it has been shown that this variation is not large [9].
For wedged fields the patient scatter contribution does not change so the increase of the PD is
caused entirely by the increase of the scattered radiation from the wedge. This is also
accounted for in this calculation step by including this scatter in the CRR fraction.
In step nine the influence of blocks is addressed. Published data [2-3,8] have shown that the
PD does not change significantly when shielding is introduced in the beam. This can be
explained by assuming that the reduction of the patient scatter contribution due to partly
shielding the incident beam is counterbalanced by the increased scattered radiation from the
shielding blocks and tray.
In the tenth step the CRR is corrected for attenuation at other depths, as described in the
explanation of step four.
2.2. Tangential beams
The program also offers the option to calculate the PD for tangential (breast) treatment
techniques.
IAEA-CN-85-9
519
In this case the breast is the scattering volume and measurements were made for three breast
sizes, which are called small, medium and large with field sizes to match. Interpolation by the
program is based on the actual field size as stated by the user.
The program follows the same steps as for orthogonal fields with one exception. Since the
patient scatter is determined by the breast size, there is no need for a correction for patient
thickness. Furthermore, the depth of the PD point is defined differently. Since PD calculations
in patients treated for breast cancer will often concern determination of the fetal dose, depth is
now defined as the depth of the PD point (i.e., the fetus) in anterior-posterior direction
3. Results
The results of the calculations are presented in a simple way (Fig. 1). At the bottom of the
screen the results per beam are shown, subdivided in the PD and the CRR contribution both in
cGy. At the top the combined results for all beams are shown.
The data and results can be saved as a file with default extension .pdd and a hard copy of the
results can be printed.
3.1. Constraints and limitations
Certain constraints have to be considered. An assumption is that the PD point is located more
or less centrally and symmetrically in the body. Differences in the PD for deviations of the
central position perpendicular to the plane through the beam axis and the distance vector of up
to 5 cm are negligible; variations in distance and depth are accounted for.
The program cannot be used for other treatment modalities than photon beams. For electrons
the scarce published data [10] and our own measurements indicate that the PD is roughly a
factor of 4 lower, because there is hardly any scatter inside the patient and the CRR is much
lower than for photons.
The program was not developed for use in intensity modulated radiation therapy (IMRT).
During IMRT the number of monitor units delivered for a given target dose is much greater
than in standard techniques. Consequently the contribution of CRR will be much greater but
we are not aware of measurements on the exact magnitude of this contribution.
The program does not account for neutron production at higher photon energies. For 25 MV
photons this can increase the PD by a factor 2.
3.2. Accuracy
We compared the calculations with clinical measurements and found a mean ratio of
measured versus calculated PD of 0.92 with a standard deviation (SD) of 35% for all
treatment techiques [5]. For tangential techniques only this was 1.12 and 26% respectively.
We find it plausible that the program will be used most frequently for calculations in pregnant
patients so the starting point of the program is an SD of 30%. The accuracy of the calculation
is given as two SDs. The accuracy of the calculation is largest for open beams with limited
shielding. In case of the use of wedges the program uses some average correction factors for
internal and external wedges. The accuracy of these factors, however, is estimated to be of the
order of ± 30%. When the PD-point is located further away from the central axis of the beam,

IAEA-CN-85-9
520
it is possible that the collimator-related radiation is intercepted by the treatment couch. In that
case an attenuation factor is applied, based on our own measurements for our treatment couch.
Data on the attenuation by couches from other manufacturers are not available.
The contribution of collimator-related radiation of linear accelerators to the PD is based on
average data. However, some accelerators show higher collimator-related radiation values
than others and there is also some dependence on collimator angle. The maximum difference
is by a factor 2 [9]. For PD calculations at large distances, where the contribution is
predominantly from collimator-related radiation, this can make some difference.
4. Discussion
A software program has been developed which allows the easy calculation of the peripheral
dose in patients who are treated with megavoltage photon radiation. Within its constraints and
limitations it allows a fairly accurate estimate of the dose at any point in the body outside the
treatment area. Knowledge of the peripheral dose can help radiation oncologists in making
important decisions in the treatment of cancer patients. Sometimes radiation therapy is the
only viable treatment option when pregnant patients have to be treated and then it is of utmost
importance to be able to estimate the risk to the fetus and compare this with the risk to the
mother of postponing the treatment. Decisions on whether or not abortion should be
considered may also depend on this information.
Another area where an estimate of the peripheral dose is of importance is in patients with
pacemakers. Damage to pacemakers has been observed above 500 cGy [11] which is only a
few percent of common clinical tumor doses. Assessment of doses to specific organs such as
the thyroid may also be of interest to determine the possible risk of late effects such as
carcinogenesis.
We feel that our program can be of great value for the professionals working in radiotherapy.
We also feel that general applicability is desirable and therefore prefer the use of average data
to the use of machine specific data, even at the cost of a small loss of accuracy. Situations
where the PD has to be estimated are rare and usually occur unexpectedly. A calculation
model should then be readily available since there is no time to perform extensive
measurements on leakage radiation and collimator scatter.
Note: The program can be obtained from the author, preferably by e-mail request.
References
[1] Van der Giessen, P.H., Hurkmans, C.W., Calculation and Measurement of the Dose in
Points Outside the Primary Beam for Co-60 Gamma Radiation. Int. J. Radiat. Oncol.
Biol. Phys. 27 (1993) 717-724.
[2] Van der Giessen, P.H., Calculation and measurement of the dose at points outside the
primary beam for photon energies of 6, 10, and 23 MV. Int. J. Radiat. Oncol. Biol. Phys.
30 (1994) 1239-1246.
[3] Van der Giessen, P.H., Measurement of the peripheral dose for the tangential breast
treatment technique with Co-60 gamma radiation and high energy x-rays. Radiother.
Oncol. 42 (1997) 257-264.

IAEA-CN-85-9
521
[4] Van der Giessen, P.H., A simple and generally applicable method to estimate the
peripheral dose in radiation teletherapy with high energy x-rays or gamma radiation. Int. J.
Radiat. Oncol. Biol. Phys. 35 (1996) 1059-1068.
[5] Van der Giessen, P.H., Comparison of measured and calculated peripheral doses in
patients undergoing radiation therapy. Radiother. Oncol. 42 (1997) 265-270.
[6] McParland, B.J., Peripheral doses of two linear accelerators employing universal wedges.
Br. J. Radiol. 63 (1990) 295-298.
[7] Scrimger, J., Kolitsi, Z., Scattered radiation from beam modifiers used with megavoltage
therapy units. Radiology 130 (1979) 233-236.
[8] Sherazi, B.S., Kase, K.R., Measurements of Dose from Secondary Radiation Outside a
Treatment Field: Effects of Wedges and Blocks. Int. J. Radiat. Oncol. Biol. Phys. 11
(1985) 2171-2176.
[9] Van der Giessen, P.H., Collimator related radiation for different cobalt machines and
linear accelerators. Int. J. Radiat. Oncol. Biol. Phys. 35 (1996) 399-405.
[10] Antolak, J.A., Strom, E.A., Fetal dose estimates for electron-beam treatment to the chest
wall of a pregnant patient. Med. Phys. 25 (1998) 2388-2391.
[11] Marbach, J.R., Sontag, M.K., Van Dyk, J., Wolbarst, A.B., Management of Radiation On-
cology Patients With Implanted Cardiac Pacemakers: Report of AAPM Task Group 34.
Med. Phys. 21 (1994) 85-90.

IAEA-CN-85-232
522
DOSE TO THE UTERUS FROM RADIOTHERAPY PROCEDURES FOR
BREAST CARCINOMA
C. Martín Rincón, I. Jerez Sainz, I. Modolell Farré, M.L. España López,
P. López Franco
Servicio de Protección Radiológica, Hospital Universitario de la Princesa,
Madrid, Spain
Abstract
In the early period of the pregnancy, the radiological protection of the unborn child is of particular concern. In
several reports dose thresholds for deterministics effects as well as dose values that increase the probability of
stocastics effects have been established. The aim of this article was to estimate the peripheral dose (PD) in order
to evaluate the absorbed dose in utero for breast carcinoma treatment related to the radiotherapy procedures
established in our hospital. The treatment was simulated using an antropomorphic phantom Alderson – Rando,
and two similar treatment planning with and without wedges were performed, taken into account the average field
parameters used in 300 treatment planning patients. The PD values were determined with a NE 2571 ionization
chamber in a General Electric linac, for the treatments considered. Experimental measures provided dose in utero
values slightly higher than 5 cGy, dose threshold established in some articles for radioinduced effects in the fetus.
The planning system underestimated the PD values and no significant influence with the use of wedges was
found.
1. Introducción
La protección radiológica del ser en desarrollo en el caso de mujeres gestantes sometidas a
procedimientos de radioterapia externa, es especialmente crítica ya que en muchos casos no se
puede posponer el tratamiento hasta el final del embarazo, y es necesario estimar la dosis que
va a recibir el embrión o feto, para poder informar a la madre de los riesgos de una forma lo
mas relista posible. Diversos estudios establecen los efectos radioinducidos en el ser en
desarrollo, a partir de la dosis equivalente en útero como indicador de la dosis recibida por el
embrión en los primeros estadios del embarazo. En el primer período de embarazo, dosis del
orden de 10 cGy pueden inducir efectos letales en el embrión, mientras que en el periodo que
va desde la 3ª a la 8ª semana de embarazo se sugieren umbrales de dosis a partir de 25 cGy
para la aparición de malformaciones y otros efectos en el desarrollo [1-3], aunque en algún
estudio este umbral disminuye a valores de 5 cGy [4]. Para los posibles efectos estocásticos,
no existe un umbral de dosis, pero se estima que a partir de una dosis en útero de 2.5 cGy el
riesgo natural de cáncer fatal a la edad de 15 años se duplica, mientras que para el caso de
enfermedades genéticas no existe una relación clara con dosis en útero del orden de cGy [1-4].
Es por tanto imprescindible disponer de datos de la dosis periférica (DP), como indicador de
la dosis recibida en puntos fuera del campo de tratamiento, particularizados para cada tipo de
planificación y equipo de terapia implicado. En uno de los tratamientos más frecuentes en el
caso de mujeres en edad de procrear, el relativo al carcinoma de mama, los resultados
obtenidos en estudios de DP hablan de valores de dosis en útero del orden de unos pocos cGy
[5-6]. El objetivo del presente trabajo es estimar la DP, y en particular la dosis absorbida en
útero en un tratamiento estándar de mama de radioterapia externa, tal y como se desarrollan en
nuestro hospital. Así mismo se valora la influencia de las cuñas en la DP realizando dos
planificaciones similares, una con cuñas y otra sin cuñas.

IAEA-CN-85-232
523
2. Material y metodos
Para la realización de todas las medidas se ha utilizado un maniquí antropomórfico Alderson –
Rando.
2.1. Planificación del tratamiento
El paso previo para la planificación del tratamiento fue la realización de un scanner secuencial
al maniquí, tal y como se realiza en la práctica clínica. Se tuvo especial cuidado en la correcta
alineación del maniquí y en la unión de las secciones que lo componen, para evitar la
existencia de aire entre ellas. Se realizó una adquisición a lo largo del maniquí, con espesores
de corte y distancia entre cortes de 5 mm. Tras esto se envío vía red local al planificador
Focus 3.0 de Computer Medical Systems para su posterior planificación.
Para la elaboración del plan de tratamiento se realizaron dos planificaciones estándar de mama
(arbitrariamente se escogió la mama derecha) con dos campos tangenciales de fotones de
6MV, en una de ellas incluyendo cuñas y en la otra sin cuñas. Se estimó un promedio de los
parámetros de los campos utilizados en más de 300 planificaciones de mama realizadas en la
práctica clínica, que cumplían los requisitos establecidos para nuestro estudio. Los campos así
definidos se ajustaron a la anatomía del maniquí de modo que la zona a tratar quedara cubierta
con una dosis del 95% respecto a la dosis prescrita del tratamiento (50 Gy), y no se superase
en pulmones el límite de dosis tolerable para estos órganos críticos. Los parámetros de los
campos escogidos se presentan en la tabla I.
Se tomaron los valores de dosis suministrados por el planificador para puntos colocados en la
línea central a lo largo del maniquí, desde el corte del isocentro hasta el corte donde se estimo
anatómicamente la posición del útero (distancia entre ambos cortes = 29.75 cm) y a
profundidades de 10 cm y 15 cm desde la superficie, para la posterior comparación con las
medidas realizadas con cámara de ionización.
Tabla I. Parámetros de los campos escogidos en la planificación de mama.
CAMPOS ANCHURA (cm)
ALTURA (cm)
ÁNGULO BRAZO
ÁNGULO COLIMADO
R
DISTANCIA FOCO-PIEL
(cm)
ÁNGULO CUÑA
Planificación sin cuñas Tangencial
externo
17.5 10.0 228º 99º 93.3 -
Tangencial
interno
17.5 10.0 54º 260º 92.7 -
Planificación con cuñas Tangencial
externo
17.5 10.0 228º 99º 93.3 15º
Tangencial
interno
17.5 10.0 54º 260º 92.7 15º
2.2. Medidas dosimétricas
Las medidas dosimétricas se realizaron con una cámara de ionización cilíndrica NE 2571 de
0.6 cc acoplada a un electrómetro Farmer 2570/1 con un voltaje de polarización de –250 V y
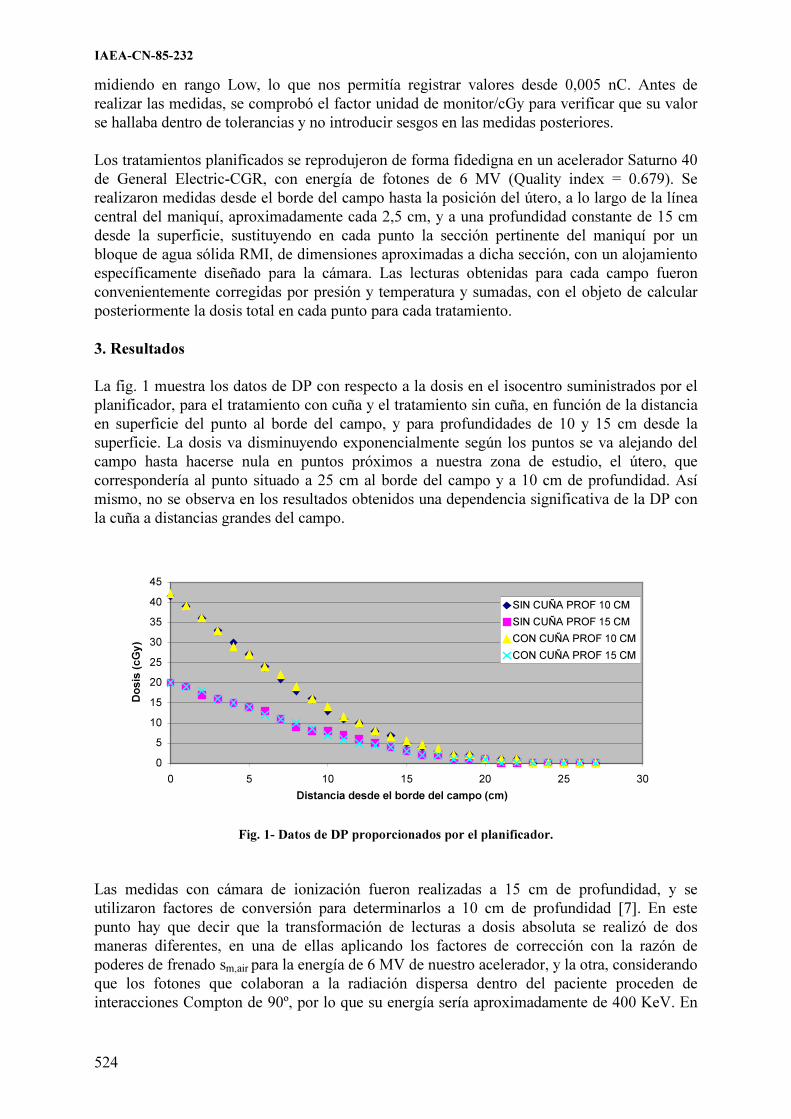
IAEA-CN-85-232
524
midiendo en rango Low, lo que nos permitía registrar valores desde 0,005 nC. Antes de
realizar las medidas, se comprobó el factor unidad de monitor/cGy para verificar que su valor
se hallaba dentro de tolerancias y no introducir sesgos en las medidas posteriores.
Los tratamientos planificados se reprodujeron de forma fidedigna en un acelerador Saturno 40
de General Electric-CGR, con energía de fotones de 6 MV (Quality index = 0.679). Se
realizaron medidas desde el borde del campo hasta la posición del útero, a lo largo de la línea
central del maniquí, aproximadamente cada 2,5 cm, y a una profundidad constante de 15 cm
desde la superficie, sustituyendo en cada punto la sección pertinente del maniquí por un
bloque de agua sólida RMI, de dimensiones aproximadas a dicha sección, con un alojamiento
específicamente diseñado para la cámara. Las lecturas obtenidas para cada campo fueron
convenientemente corregidas por presión y temperatura y sumadas, con el objeto de calcular
posteriormente la dosis total en cada punto para cada tratamiento.
3. Resultados
La fig. 1 muestra los datos de DP con respecto a la dosis en el isocentro suministrados por el
planificador, para el tratamiento con cuña y el tratamiento sin cuña, en función de la distancia
en superficie del punto al borde del campo, y para profundidades de 10 y 15 cm desde la
superficie. La dosis va disminuyendo exponencialmente según los puntos se va alejando del
campo hasta hacerse nula en puntos próximos a nuestra zona de estudio, el útero, que
correspondería al punto situado a 25 cm al borde del campo y a 10 cm de profundidad. Así
mismo, no se observa en los resultados obtenidos una dependencia significativa de la DP con
la cuña a distancias grandes del campo.
0
5
10
15
20
25
30
35
40
45
0 5 10 15 20 25 30
Distancia desde el borde del campo (cm)
Do
sis
(c
Gy
)
SIN CUÑA PROF 10 CM
SIN CUÑA PROF 15 CM
CON CUÑA PROF 10 CM
CON CUÑA PROF 15 CM
Fig. 1- Datos de DP proporcionados por el planificador.
Las medidas con cámara de ionización fueron realizadas a 15 cm de profundidad, y se
utilizaron factores de conversión para determinarlos a 10 cm de profundidad [7]. En este
punto hay que decir que la transformación de lecturas a dosis absoluta se realizó de dos
maneras diferentes, en una de ellas aplicando los factores de corrección con la razón de
poderes de frenado sm,air para la energía de 6 MV de nuestro acelerador, y la otra, considerando
que los fotones que colaboran a la radiación dispersa dentro del paciente proceden de
interacciones Compton de 90º, por lo que su energía sería aproximadamente de 400 KeV. En

IAEA-CN-85-232
525
este caso, tal y como publican Andreo y Brahme [8], la razón de poderes de frenado sm,air sería
algo mayor, obteniéndose un incremento en la dosis de aproximadamente un 1.5%. Ambos
casos se representan en la fig. 2, para una dosis en el isocentro de 50 Gy. Existe una dosis
significativa en el útero, de 5.5 cGy para la planificación sin cuña y de 5.4 cGy en la
planificación con cuña. Del mismo modo que antes, no se observa una diferencia relevante en
el caso de la utilización de cuñas, siendo incluso la dosis un 1.8% mayor en el caso de la
planificación sin cuñas.
0,00
20,00
40,00
60,00
80,00
100,00
120,00
140,00
0 5 10 15 20 25
Distancia desde el borde del campo (cm)
Do
sis
(cG
y)
SIN CUÑA PROF 10 CM 6MV
SIN CUÑA PROF 10 CM 400 KeV
CON CUÑA PROF 10 CM 6 MV
CON CUÑA PROF 10 CM 400 KeV
Fig.2- DP medida con cámara de ionización
4. Conclusiones
Los resultados experimentales muestran valores de dosis en útero ligeramente superiores a los
umbrales de riesgo de 5 cGy. Considerando las incertidumbres en las medidas (del orden del
10% en conjunto para todo el procedimiento) estos valores pueden ser mayores en la realidad,
con lo que es posible que se supere hasta en un 20% el valor umbral establecido por algunos
autores, y por tanto es recomendable hacer un estudio particularizado para cada tipo de
planificación y unidad de tratamiento en el caso de procedimientos terapéuticos del carcinoma
de mama.
El planificador subestima de forma apreciable la dosis en puntos fuera del haz directo de
radiación. Esto se debe tanto a las propias limitaciones del algoritmo de cálculo, que no estima
de forma precisa la dosis en puntos muy alejados del campo de radiación, así como a que el
planificador no contempla la radiación de fuga, que es la contribución más importante a la DP
a distancias alejadas del campo. Por tanto, es recomendable que se comprueben de forma
experimental los valores de DP aportados por el planificador para estimar la dosis en útero de
pacientes embarazadas.
Con respecto a la utilización de cuñas, en nuestras medidas no se ha podido apreciar una
diferencia sustancial referente al uso de las mismas en el tratamiento, en contra de lo
publicado por algunos autores, que aseguran un aumento de la DP en un factor de 2 o superior
[9-10]. Además en la planificación sin cuña se obtienen valores de dosis superiores a los que
resultan en la planificación con cuña.
Parece más realista considerar en el cálculo de dosis absorbida los valores de sm,air para
fotones procedentes de una dispersión Compton de 90º, pues son estos los que van a
contribuir a la DP. Aunque los valores tabulados para energías del orden de cientos de kev no

IAEA-CN-85-232
526
proceden de espectros continuos, como sería en este caso, sino de fotones monoenergéticos, se
puede hacer una estimación con estos valores para no correr el riesgo de hacer un cálculo de la
dosis por defecto.
Referencias
[1] ICRP 60 Recomendaciones 1990. Comisión Internacional de Protección Radiológica
(traducción al español). Sociedad Española de Protección Radiológica (1995)
[2] NRPB. Board statement on diagnostic medical exposures to ionising radiation during
pregnancy. Estimates of late radiation risks to the UK population. National Radiological
Protection Board. Chilton, Vol 4 (1993)
[3] UNSCEAR. Generic and somatic effects of ionising radiation. Report to the general
assembly. Anexo A: genetic effects of radiation. Anexo C: biological effects of prenatal
irradiation. New York: United Nations.(1986)
[4] STOVALL, M., BLACKWELL, C.R. ET AL. Fetal dose from radiotherapy with photon
beams: Report of AAPM Radiation Therapy Committee Task Group Nº 36. Med. Phys.
22 (1) (1995). 63 a 82.
[5] ANTYPAS, C., SANDILOS, P. ET AL. Fetal dose evaluation during breast cancer
radiotherapy. Int. J. Radiat. Oncol. Biol. Phys. 40 (4); (1998) 995-9.
[6] DIALLO, I., LAMON, A. ET AL. Estimation of the radiation dose delivered to any
point outside the target volume per patient treated with external beam radiotherapy.
Radiother. Oncol. 38 (3); (1996) 269-71.
[7] VAN DER GIESSEN, P. A simple and generally applicable method to estimate the
peripheral dose in radiation teletherapy with high energy x-rays or gamma radiation. Int.
J. Radiat. Oncol. Biol. Phys., 35 (5); (1996) 1059-68.
[8] ANDREO, P., BRAHME, A. Stopping power data for high-energy photon beams. Phys.
Med. Biol., 31 (8) (1986) 839-58.
[9] McPARLAND, B.J., Peripheral doses of two linear accelerators employing universal
wedges. Br. J. Radiol. 63 (1990) 295-98.
[10] SHERAZI, S., KASE, K.R., Measurements of dose from secondary radiation outside a
treatment field: effects of wedges and blocks. Int. J. Radiat. Oncol. Biol. Phys. 11
(1985) 2171-76.
IAEA-CN-85-26
527
PATIENT AND FETAL DOSE IN DIAGNOSTIC X-RAYS AND RADIOTHERAPY
IN BANGKOK, THAILAND
J. Pataramontree, S. Wangsuphachart
Department of Radiology, Chulalongkorn University, Bangkok, Thailand
J. Apaiphonlacharn
Department of Radiology, Ramathibodi Hospital, Mahidol University, Bangkok, Thailand
P. Chaichan
Department of Radiology, Siriraj Hospital, Mahidol University, Bangkok, Thailand
S. Sompradit
Section of Radiology, Nakornpathom Central Hospital, Nakornpathom Province, Thailand
K. Suteerakul
Section of Radiology, Somdej Praborom Rajathevee Na Siraja, Chonburi Province, Thailand
W. Thamwerawong
Division of Radiation and Medical Devices, Department of Medical Sciences,
Ministry of Public Health, Nontaburi Province, Thailand
Abstract
In 1999 the multicenter study of the patient surface dose has been conducted at Department of Radiology of
Chulalongkorn Hospital, another two university hospitals and a hospital in the suburb. Adult female patients were
selected to measure the entrance skin dose and accumulated dose by using the thermoluminescent dosimeters and
the kerma area product meter respectively. The fetal doses were calculated by Monte Carlo method using the
computer program written by Le Heron J.C. The average fetal doses were studied for each diagnostic
radiographic procedure. The fetus got 0.29, 0.35, 2.63 mGy when their mothers had radiography of pelvis,
lumbosacral spine, excretory urography respectively. The estimated fetal doses for barium meal, barium enema
and renal angiography were 1.47, 33.5 and 3.68 mGy respectively. The fetal dose varies so much about 2-3 times
of the average fetal dose due to equipments and techniques. The study of lower abdomen by computed
tomography gave 48.4 mGy in average to a fetus. The scattered dose level outside radiotherapeutic x-rays at fetal
position in Rhando phantom depends on the primary beam area rather than the energy of radiation. If the
threshold dose for fetal malformation is 0.1 Gy, the minimum safety distance for him is 22 cm from beam edges
for the tumor dose of 60 Gy .
1. Introduction
After three young workmen died within three months after the exposure of the unshielded Co-
60 source (560 Ci) at the outskirt of Bangkok, in February 2000. Most Thai people became
alert of radiation hazard and protection. The medical physicist was asked to evaluate the
conceptus dose more often than before. This report presents data of current levels of radiation
dose to patients and fetuses. Most Departments of Radiology in Thailand performed the
radiation protection for the patients as follows:
1. Set quality control of the x-ray machines in diagnostic studies, including teletherapeutic
machine, the brachytherapy units and those instruments in nuclear medicine. Radiation
survey is performed around each machine, under conditions that yield maximum
exposure rate.
2. Technologists use proper procedures of radiological technique for small amount of the
patients’ radiation exposure.
3. Provide the lead apron or gonad protector for the conceptus outside of x-ray beam. An 8
cm of Cerrobend is used to minimize the fetal dose for the pregnant woman during the
treatment of tumors.[1]

IAEA-CN-85-26
528
4. Warning signs of radiation protection for the child bearing age patients are put on the
door of entrance as shown in fig.1.
5. Guidelines on safe practice for female patients (~ 12-50 y) who have abdominal or
pelvic radiographs, special procedure of lower abdomen and nuclear studies are
recommended as followings.
(a) A brief menstrual history includes age of menarche, regularity or duration of
menstrual cycles, the date and duration of the last normal menstrual period.
(b) When patient data is unclear, the radiologist should question the patient about
possible pregnancy. The symptom suggestion of pregnancy should be followed
with a urine pregnancy test. The pelvic examination can confirm pregnancy
around 8-10 weeks.
6. Dose assessments in diagnostic radiology are listed and conceptus doses are calculated
in order to understand the potential detriment of various exposures. Expression of
malformation in a conceptus depends on the proportion of differentiating cells and the
rate at which cellular injury, while the radiation effects depends on the dose and dose
rate of exposure. The ICRP [2] assessed the risk of radiogenic mental deficiency at
0.4%/Gy during the age of 8-15 weeks while the NEA [3,4] stated the proportionality
coefficient of 7-13 IQ points decrease per Gray.
Fig.1. Notices in Thai and English for the
child bearing age patients before having
radiological examination and treatment
3. Aims and objectives
A. To access the current levels of patient surface dose in different diagnostic
roentgenological procedures and calculate the fetal dose using Monte Carlo method.
B. To monitor dose outside therapeutic beam at fetus position and normalize to the infield
dose for calculation of fetal safety distance.
4. Materials and methods
1. Dose assessment for patients and the conceptus:
1.1. Adult female patients of 50-75 kg in weight, who underwent diagnostic
roentgenological examinations in the outpatient department of four hospitals were studied for
radiation dose measurement. The study was performed at three university hospitals in
Bangkok and one general hospital in suburb. Patient doses were monitored for the
examination of lumbosacral spine, pelvis, intravenous urography, barium meal, barium
enema, renal angiography, chest and abdominal computed tomography. The accumulated
doses were measured using the plane-parallel plate ion chamber and the Diamentor E. The

IAEA-CN-85-26
529
TLD-100 chips were used for measuring the computed tomography dose index (CTDI) [5].
A.2 Fetal doses were calculated by using the program named XDOSE and CT DOSE which
written by Dr. J. Heron, National Radiation laboratory, New Zealand. These programs were a
part of a software report NRPB-SR250 and NRPB-SR262, the calculation of organ doses by
Monte Carlo calculation. These programs were distributed by the IAEA for the research
project on the diagnostic x-rays in Asia.[6]
A.3. Dose measurement outside the 6 and 10 MV x-ray beam were done in Rhando phantom
at fetal position using TLD-100 chips and a TLD reader, Harshaw model 5500. [7,8]
5. Results and observations
5.1. Diagnostic x-rays
The primary study of adult female patient surface doses for various types of radiological
examination are shown in Table 1 to 3. The number of sample for renal angiography was low
because there were few cases/year. The doses depend on the equipment used, the size of
patients and the methods used by radiologists in performing the study. The average fetal dose
is calculated for x-rays 80 kVp, 3.0 mm.Al HVL. The results show fetal doses from lower
abdominal CT and fluoroscopic studies are high. No reference doses for patients in South-East
Asia to be compared.
Table 1. Patient surface doses of female adults from four conventional radiological types in
Thailand, 1999
X-ray No
Obser
v.
Tube
voltag
e
Min 1st
quartil
e
Media
n
Mean 3rd
quartil
e
Max av.
fetal
dose
Exam. (kV) Absorbed dose (mGy) (mGy)
LS AP 23 60–85 0.42 0.76 1.35 1.41 1.83 3.46 0.35
LS R. LAT 27 70–90 1.34 1.76 2.85 4.47 6.03 16.1 0.09
Pelvis AP 22 60–85 0.37 0.54 0.72 1.01 1.18 2.16 0.29
IVU 24 63–73 4.42 6.63 8.97 10.4 13.0 19.7 2.63
Table 2. Patient entrance doses of female adults from fluoroscopic examination
X-ray No
Obs.
Tube
voltag
e
Min 1st
quartil
e
Media
n
Mean 3rd
quartil
e
Max av.
fetal
dose
Exam. (kV) Absorbed dose (mGy) (mGy)
Barium meal* 20 80–
100
9.34 38.02 53.87 59.83 82.72 128.5 1.47
Barium enema* 24 80–
100
18.74 40.7 79.43 77.42 91.71 196.0 33.5
Renal angio** 6 80–
100
38.54 – 130.7 140.4 – 279.9 3.68
* Using Toshiba KXO/80N, Siemens Sireskop,
** Using Siemen Neurostar Plus operated in digital pulsed mode.

IAEA-CN-85-26
530
Table 3. Patient doses of adults from CT examinations* in Thailand, 1999
CT No.
Observ.
Tube mAs slice width No. of
slice
av. fetal dose
Exam. (kV) (mm) (mGy)
Chest 15 120 234–340 10 28–57 0.09+0.04
Whole abdomen 15 120 234–340 10 29–103 48.4+16.4
�� Using GE Sytec 4000, GE 9800Q, Philips Tomoscan CX/Q
5.2. Radiotherapy
The data presented in Table 4 is the dose outside a beam from Varian Clinac 1800 S/N 237 in
the pelvic wall of female Rhando phantom. This data is similar to the total absorbed dose in
phantom at 10 cm depth reported by the AAPM [9] in 1995. The safety distance for fetus
developing malformation was calculated. If a fetus is too close to a beam edge, the shielding is
required. For megavoltage x-rays, the scattered doses depend on the area of primary beam
rather than photon energy [7].
Table 4. The average scattered dose to fetus in Rhando phantom normalized to the peak dose at
central axis using TLD
Energy (Machine) Field size Distance from beam edge Safety distance for
(cm) 2.7 5 10 (cm) malformation*
6–10 MV Clinac 1800 10×10 10% 2% 0.6% more than 22 cm
20×20 20% 5% 1.2% more than 28cm
* The tumor dose is 6000 cGy and the threshold dose for malformation is 10 cGy.[10]
6. Discussion and conclusion
Fetal doses are high in both barium enema study and the whole abdominal CT but it is less
than the threshold dose for malformation in the first trimester period. The maximum fetal dose
may be 2-3 times of the average fetal dose. The reference doses for patients in South East Asia
should be set up. For radiotherapy, scattered doses are similar to those reports by other
investigators.[11,12,13]
References
[1] PODGORSAK, M.B., MEILER, R.J., KOWAL, H., KISHEL, S., POMER, JB., et al.,
Technical management of a pregnant patient undergoing radiation therapy to the head
and neck. Med Dosim, 24 2 (1999) 121-8.
[2] ICRP, 1986. Developmental effects of irradiation on the brain of the embryo and fetus.
Annals of the ICRP 16(4), Pergamon Press, Oxford.
[3] The biological basis for the control of prenatal irradiation. Organization for Economic
Co-operation and Development, NEA Paris (1988)
[4] RUSSELL, J.G.B., Diagnostic radiation, pregnancy and termination, Br.J. Radiol. 62
733 (1989) 92-3
[5] LEITZ, W., AXIESSON, B., SZENDRO, G., Computed tomography dose assessment –
a practical approach. Nuclear Tecnology 37 1-4 1993) 377-80

IAEA-CN-85-26
531
[6] ORESEGUN, M., LE HERON, J., MACCIA, C., PADOVANI, R., et.al., Radiation
protection and quality assurance in diagnostic radiology - an IAEA coordinated research
project in Asia and eastern Europe. Appl. Radiat. Isot. 50 1 (1999) 271-6
[7] PATARAMONTREE, J., METHAPIRAK, W., TOIN, N., The fetal dose outside
therspeutic radiation beam: Safety distance. Chul. Med. J. 43 (3) (1999)159-68
[8] MEIGOONI, A.S., MISHRA, V., PANTH, H., Instrumentation and dosimeter-size
artifacts in quantitative thermoluminescent dosimetry of low-dose fields, Med.Phys. 22
1 (1995) 555-561.
[9] STOVALL, M., BLACKWELL, C.R., CUNDIFF, J., et al., Fetal dose from radiotherapy
with photon beams: Report of AAPM Radiation therapy Committee Task Group No.36,
Med. Phys. 22 1 (1995) 63-82.
[10] ICRP, 1990. Publication 60. Radiation Protection. Recommendation of the International
Commission of Radiological Protection 1990:103
[11] FRASS, BA., VAN DE GEIJN, J., Peripheral dose from megavoltage beams. Med.
Phys. 10 6 (1983) 809-18
[12] NAIR, RP., NAIR, TKM., EL-AKKARD, S., Evaluation of fetal dose from megavoltage
irradiation of the knee and neonate fallow up. Med. Phys. 10 6 (1983) 862-5
[13] GREENE, D., CHU, GL., THOMAS, DW., Dose levels outside radiotherapy beams. Br.
J. Radiol. 56 668 (1983) 543-50


Topical Session 7
RADIOLOGICAL PROTECTION OF
PAEDIATRIC PATIENTS

.

IAEA-CN-85-58
535
THE DEVELOPMENT OF STANDARD OPERATING PROTOCOLS
FOR PAEDIATRIC RADIOLOGY
J. Hardwick, C. Mencik, C. McLaren, C. Young, S. Scadden,
P. Mashford, K. McHugh, M. Beckett, M Calvert
Department of Radiology, Great Ormond Street Hospital for Children NHS Trust,
London, United Kingdom
P J. Marsden
Department of Medical Physics and Bioengineering, UCL Hospitals NHS Trust,
London, United Kingdom
Abstract
This paper describes how the requirement for operating protocols for standard radiological practice was
expanded to provide a comprehensive aide to the operator conducting a medical exposure. The protocols adopted
now include justification criteria, patient preparation, radiographic technique, standard exposure charts,
diagnostic reference levels and image quality criteria. In total, the protocols have been welcomed as a tool for
ensuring that medical exposures are properly optimised.
1. Introduction
Great Ormond Street is a specialist children’s hospital in the centre of London. The patients,
both inpatient and outpatient, attend from a wide area which includes the whole of the United
Kingdom and overseas. Almost 7% of patients come from abroad. The services that are
provided by the hospital fall into five broad categories: Medical/Urology, Cardiorespiratory
and Critical Care, Host Defence, Surgery, and Neurosciences. Between 40% and 50% of the
children treated within the hospital are under the age of 2 years. There is a continuing trend to
provide increasingly specialist and complex forms of care.
In order to support the work of the hospital the Radiology Department has found itself at the
cutting edge of paediatric radiological practice. The department has a team of radiologists,
radiographers and nurses working in a dedicated child-friendly environment. Many of the
radiological examinations are performed on patients from one of the Intensive Care Units of
which there are five. These examinations include complex interventional procedures such as
bronchial stent insertions.
The total annual workload for 1999/2000 was 50,000 + examinations of which 28,000+ were
general radiography. The department consists of 2 general x-ray rooms, 1 CT scanner, 2 MRI
suites, 1 fluoroscopy unit, 3 angiography suites, 3 nuclear medicine cameras, surface
topography, 1 bone densitometer, 1 orthopantomograph(OPT) and 4+ ultrasound machines.
Much of the general x-ray work is mobile and is undertaken on one of the large intensive care
units. There are also 2 mobile image intensifier which are used for per-operative procedures.
The department, with the exception of the OPT, is completely digital and a PACS system is to
be installed during 2001. There are 30+ whole time equivalent radiographers.
The European Directive 97/43/Euratom [1] stated aim is “laying down measures for the health
protection of individuals against the dangers of radiation”. During 1999/2000 standard
operating protocols were developed within the Radiology Department at Great Ormond Street
Hospital in response to the Ionising Radiation (Medical Exposure) Regulations 2000
(IR(ME)R) [2], the UK implementation of the Directive. The regulations place responsibilities
upon employers and employees with regard to the radiation protection of patients, with
particular reference to special practices such as the medical exposure of children. Included in

IAEA-CN-85-58
536
the regulations is the requirement for standard operating protocols for all examinations using
ionising radiation. This has been implemented in all sections of the Radiology Department.
2. Method
Developing new protocols at Great Ormond Street Hospital presented an opportunity to
review current practices and improve clinical systems and procedures, thereby enhancing the
quality of care to patients. This is in line with the requirements for Clinical Governance,
which was introduced to ensure that all National Health Service (NHS) organisations have in
place proper processes for continuously monitoring and improving quality. One of the key
points of Clinical Governance is that all clinicians must understand their individual and
collective responsibilities for assuring accountability for the quality of patient care.
All sections of the department had some established protocols but these were disjointed and in
many different formats. Most included only basic procedures and detailed the required ‘views’
that were needed for specific examinations. None incorporated diagnostic reference levels or
referral guidelines. The general protocols did attempt to set down quality criteria taken from
the European Guidelines on Quality Criteria for Diagnostic Radiographic Images in
Paediatrics [3], but this was only for basic examinations such as chest, abdomen, skull and
spine. It was decided that a department-wide format had to be adopted for new protocols. This
would simplify the use of the protocols for radiographers as many worked in most sections of
the department.
The new protocols were to represent a handbook for each examination room in the
department. Contained in the protocol files were details of everything required for each
radiological exposure that might take place in that room. This included referral guidelines,
patient preparation, radiographic technique, exposure factors, diagnostic reference levels,
image quality criteria, additional projections and common pathologies. In each section of the
department a radiographer was nominated to co-ordinate writing protocols for that section.
Most radiographers were involved to some degree in the production of the latest versions of
the Great Ormond Street protocols.
The final versions of the protocols were specific to:
�� General radiography
�� Mobile and theatre radiography
�� CT
�� Nuclear Medicine (1 for each camera)
�� Cardiac and Neuro angiography
�� Interventional procedures
�� Fluoroscopy
�� Bone densitometry
�� Dental and maxillo-facial radiography
Identical formats were used throughout. Each had a section preceding the main body of the
protocols containing procedures that were common to all areas in which a medical exposure
might be made. These were:
�� Working in radiation areas including:
�� Local rules
�� Methods of reducing dose

IAEA-CN-85-58
537
�� The ALARP Principle
�� Names and contact numbers for Radiation Protection Supervisors and the
Radiation Protection Adviser
�� Methods of ensuring quality control
�� Administration, including:
�� Examination requesting
�� Reporting of images
�� Updating of details onto databases and film packet, if appropriate
�� Procedures specific to mobile and theatre radiography
The relevance of including these in the protocols was to minimise the number of unnecessary
examinations resulting from administrative error, to ensure that the dose was always as low as
reasonably practicable for the patient and that staff doses were kept to an absolute minimum.
Following the common section the protocols were written for specific area within the
department and each contained:
�� Valid reasons for the examination, or justification guidelines. IR(ME)R stated that all
medical exposures to ionising radiation must be justified prior to exposure to ensure
optimisation of the exposure. Justification of a medical exposure is carried out in most
circumstances by the Practitioner, which is usually the radiologist. However there are
times when an exposure may be authorised by an Operator (the radiographer), with
remote justification by the Practitioner [4]. At such times the radiographer uses his/her
training and experience to authorise the exposure, but also has the guidelines written in
the protocols to aid the authorisation process. Also included are comments which may
help the radiographer when explaining how they have arrived at the justification.
�� Patient preparation. This section details steps that should be taken before the exposure is
made. Included are:
�� procedures such as patient identification
�� removal of objects that might obscure the image
�� preparation of a carer or person who might be required to assist with holding the
patient
These are all procedures that must be carried out in order to ensure optimisation of the
exposure and that patients and carers are not irradiated unnecessarily
�� Radiographic technique for standard projections including
�� Positioning of the patient and X-ray tube, together with immobilisation techniques
that might be used for avoid having to repeat the exposure
�� Radiographic equipment that should be used, or be available to minimise the
exposure
�� Recommended focal spot size
�� Recommended use/absence of an anti-scatter grid
�� Recommended imaging modality e.g. Computed Radiography
�� Recommendations as to whether automatic exposure chambers should be used
�� Radiation protection, including accurate collimation, gonad protection, lead masking
and protection for holders hands
�� Correct Focal Film Distance
�� Exposure factors for different age/weight ranges. The ranges were chosen as a guide to
assist with selection of the relevant exposure factors. The age ranges are 0-1 year, 1-5

IAEA-CN-85-58
538
years, 5-10 years, and 10-15 years. The ages/weights were then included in tables that
easily showed the radiographic exposure factors. An example of the exposure factors
used is given in Table I.
Table I. Exposure Factors for an AP/PA Chest beyond the neonatal period
Age kV mAs
1 - 5 years 70 - 75 3.2 - 5
5 - 10 years 75 - 80 5 - 7
10 - 15 years 75 - 80 4 - 8
�� Image quality criteria. These ensure that operators are aware of the standards expected.
Audit of images could then be carried out by comparison with the standard criteria. All
images were expected to have correct identification, sidemarkers and correct window
levels and shuttering. These assist the radiologist when viewing optimal images to
ensure diagnosis .
�� Diagnostic reference levels [5]. If these are exceeded they are recorded separately for
audit purposes. An example of the diagnostic reference levels used is given in Table II.
Table II. Diagnostic Reference Levels for Chest X-Rays
Age KV mAs
1 - 5 years 70 3.2
5 - 10 years 75 3.2
10 - 15 years 75 6
�� Additional projections to assist the radiographer in their choice of imaging.
�� A list of more common pathologies which might be shown by the selected imaging
protocol.
3. Conclusions
The introduction of the new standard operating protocols has been very well received by all
members of the radiographic staff working at the hospital. They are of particular value when
new staff or agency radiographers are working in the department and also when radiographers
work in many different areas. As many of the staff were involved in the production of the
protocols the radiographers have ownership of them and are keen to see that they are regularly
updated. There is therefore a willingness to contribute to the protocol audit programme. Most
importantly they are a guide to best practice and are valuable in the optimisation of all medical
exposures.
References
[1] Council Directive 97/43/Euratom of 30 June 1997 on health protection of individuals against
the dangers of ionising radiation in relation to medical exposure, and repealing Directive
84/466/EURATOM. (OJ L-180 of 09/07/97).
[2] The Ionising Radiation (Medical Exposure) Regulations 2000. Statutory Instrument 2000 No.
1059, Her Majesty’s Stationery Office, London (2000).
[3] European Guidelines on Quality Criteria for Diagnostic Radiographic Images in Paediatrics.
EUR 16261, European Commission (1996).
[4] MARSDEN, P. J., HARDWICK J. and McHUGH K., IAEA-CN-67/17, these Proceedings.
[5] MARSDEN, P. J., HARDWICK J., et al,. IAEA-CN-67/17, these Proceedings.

IAEA-CN-85-52
539
RADIATION DOSES TO NEONATES AND ISSUES OF
RADIATION PROTECTION IN A SPECIAL CARE BABY UNIT
C.I. Armpilia, I.A.J. Fife, P.L. Croasdale
Medical Physics Department, Royal Free Hospital, London, United Kingdom
Abstract
Radiographs are most commonly taken in the neonatal period to assist in the diagnosis and management of respiratory
difficulties. Frequent accurate radiographic assessment is required and a knowledge of the radiation dose is necessary to make
the justification of such exposures. A survey of radiation doses to neonates from diagnostic X-ray examinations (chest and
abdomen) has been carried out in the special care baby unit (SCBU) of the Royal Free Hospital. Entrance surface dose (ESD)
was calculated from Quality Control measurements on the X-ray set itself. Direct measurement of radiation doses was also
performed using highly sensitive thermoluminescence dosimeters (LiF:Mg,Cu,P), calibrated and tested for consistency in
sensitivity. The mean ESD per radiograph was calculated to be ���Gy (with a standard deviation of 6�Gy), averaged over 95 X-
ray examinations. The ESD’s as derived from the TLD crystals, ranged from 18�Gy to 60�Gy. The mean energy imparted (EI)
and the mean whole body dose per radiograph were estimated to be 14�J and 10�Gy respectively. Assuming that neonates and
foetuses are equally susceptible to carcinogenic effects of radiation (it involves an overestimation of risk), the radiation risk of
childhood cancer from a single radiograph was estimated to be of the order (0.3-1.3)�10-6. Radiation doses compared
favourably with the reference value of 80�Gy ESD published by CEC in 1996.
1. Introduction
Diagnostic radiology plays an important role in the assessment and treatment of neonates
requiring intensive care. It is often necessary to perform a large number of X-ray examinations
depending upon the infant’s birthweight, gestational age and respiratory problems. X-ray
examination of children, especially neonates, attracts particular interest because of the
increased opportunity for expression of delayed radiogenic cancers as a consequence of
relative longer life expectancy. Also, the small sizes of the newborn infants brings all organs
within or closer to the useful beam resulting in a relatively higher overall exposure per
radiograph than may be the case with adults. It is therefore important to ensure that radiation
doses from radiographic examinations carried out in neo-natal units are kept to a minimum
while maintaining the quality of radiographic images.
Wide variations have been found in techniques, equipment performance and radiation dose in
different hospitals in a European survey of paediatric radiology [1]. The results have
highlighted the need to develop dose standards for paediatric and neonatal examinations. The
requirement towards dose optimisation, led to the European Commission recommending a
standard radiological technique for neonates with the aim of at least achieving a “reference
entrance skin dose” of 80�Gy [2].
This paper describes a prospective study of radiation dosimetry performed in the SCBU at the
Royal Free Hospital. A variety of dosimetric quantities: ESD, EI and whole body dose have
been measured and recorded. Finally, an attempt has been made to evaluate the applicability
of TLD LiF: Mg,Cu,P as a reliable dosimetry method used in a SCBU.
2. Materials and methods
All radiographic examinations were performed with a capacitor discharge mobile X-ray unit
type 38S(GEC) with a single phase generator, total filtration 3.6mm aluminium equivalent
thickness, and an X-ray tube target angle of 17o, using Kodak Lanex Regular Screen
combination with a 400 relative film-screen combination speed. In most cases the examination
was carried out with the baby in the incubator and placed directly on the top of the cassette
with the focus-to-film distance (FFD) set at 100cm. Pieces of lead rubber were placed on the
perspex top of the incubator in order to reduce the size of the X-ray beam to the area of
IAEA-CN-85-52
540
interest. More detailed description about the way that the pieces of lead may be placed on the
perspex top of incubator can be found in [3].
2.1. Indirect method of measurements
Measurements of tube output were made using a 15cc ionisation chamber with calibration
traceable to a national standard. ESD was estimated for each patient and for each exposure
from knowledge of the technique factors, X-ray tube output and backscatter factors (BSF), in
accordance with the following formula: Entrance surface dose (�Gy) = output (�Gy mAs-1
)�
mAs�BSF�ISL� L
F(�en/�)tis/(�en/�)airV
TA BSF of 1.1�5% was employed, determined by [4] for
a neonate with body thickness of 5cm with tube potentials in the range 50-70kVp for a field
size of 70-300cm2
using Monte Carlo techniques. The ISL factor is an inverse square law
correction from the chamber calibration distance (100cm from the focus) to the focus-to-skin
distance (FSD). The FSD was not measured directly, but approximated by the difference
between the known FFD and the neonate equivalent diameter. Because of difficulties in
obtaining an accurate measurement of the length or trunk diameter, we used an average
equivalent patient diameter of 7.5�1.4cm [5].
The mass energy absorption coefficient ratio averaged over the X-ray energy spectrum was
evaluated for muscle as defined by the International Commission on Radiation Units and
Measurements (ICRU) and is equal to 1.05 for the range of 50-58kVp used in this study, with
an uncertainty of no more than �1% [6].
The uncertainty in ESD was calculated as the quadrature sum of the estimated uncertainties in
output measurement (�3.2%), the use of patient diameter in the ISL correction (�5%) and the
BSF evaluation (�5%) to give a value of �8%.
The EI to the neonate is derived from the ESD integrated over the irradiated area (dose-area
product, DAP). The irradiated body area from each radiograph was deduced from
measurements made on the film. This area varied widely, owing to different patient sizes but
mainly to the varying degrees of collimation employed. The DAP can be approximated by the
product of the ESD and the film area demagnified from the FFD to the FSD. This
approximation results in a DAP evaluation including backscatter, since the ESD has been
calculated after applying the BSF’s. The EI is calculated from the estimated DAP using
conversion factors for neonates exposed to X-rays with energies between 50 and 70kVp
determined by [4] for a single-phase generator, an anode angle of 17o and a net filtration of
2.5 mm aluminium equivalent. Estimates of radiation risk can be made from EI, by assuming
that all radiosensitive organs are considered uniformly distributed through the irradiated
portion of the body [4]. A whole body dose is determined by dividing the imparted energy by
the weight of the neonate.
2.2. Direct method of measurements
In this study TLD LiF:Mg,Cu,P (Harshaw TLD-100H) is employed. Only a few reports [7]
have studied the performance of LiF:Mg,Cu,P in neonatal X-ray dosimetry. Annealing and
read-out of the TLD chips were performed according to the instructions of Qados company
[8].
A dedicated calibration employing a perspex jig and tissue substitute phantom, was performed
using the X-ray unit on the SCBU. The jig held the TLD chips and calibrated 15cc ionisation
chamber. The TLD were individually calibrated and sensitivities established over the exposure
range that they would be measuring. The phantom supported the jig and consisted of 1cm
slabs of solid water (WT1) which when stacked represented different patient thicknesses.

IAEA-CN-85-52
541
To ensure that the TLD chips would not actually show up on the films and would not obscure
the anatomical and pathological details, the packaged chips were placed on different
thicknesses of solid water and irradiated with the X-ray mobile unit. The image quality test
showed that the chips are seen in the radiographic image when 4 and 5cm of solid water was
used. Consequently, the most appropriate place to put them was considered to be in the X-ray
beam, on the shoulder of the baby, if a chest X-ray and on the hip of the baby, if an abdomen
X-ray is being performed.
3. Results and Discussion
3.1. Indirect patient dose measurements
A total of 30 neonates were included in this study. The mean number of radiographs received
by one neonate was 3.2, which compares with values of 3.8 [9], 5.3 [4] and 4.7 [5] in other
studies. Approximately one half of neonates received only one radiograph, but the frequency
distribution shows a long tail, with a maximum of 17 radiographs for one neonate. The main
influence on the estimated typical total body dose is the number of radiographs taken, which is
related to the clinical problems of the neonates. The neonates having a great number of
radiographs (above 35 was reported in the studies of [4] and [9]) are of particular concern
since they may have an increased probability of further radiography in early childhood.
Dosimetry and protection measures will have special benefit for these children.
ESD’s ranged from 28�Gy to 58�Gy. The mean ESD per radiograph was calculated to be
36.3�Gy, averaged over the total of 95 X-rays included in the study. The results of our study
show that infants did not receive what might be considered ‘excessive’ radiation from
diagnostic modalities. ESD’s were found below the EC reference dose for mobile chest X-rays
of 80�Gy [2]. Although this is encouraging it should not lead to complacency, as being below
the reference dose is not an indication of optimum efficiency.
A more significant measure of risk is the EI to the neonate; only a few studies [4,5,9] have
considered this quantity in SCBU radiology. The mean EI and the mean whole body dose per
radiograph were found to be 14�J and 10�Gy respectively. The mean EI per radiograph is
found to be higher (���J) for chest and abdomen examinations than for chest X-ray
examinations (13�J). This shows that the total EI depends strongly on the radiation field area
and this is the reason why X-ray beam collimation is important in radiographic examinations.
Estimates of radiation risk can be made from EI, by assuming that all radiosensitive organs are
considered uniformly distributed through the irradiated portion of the body [4]. The problem
is what factor is the most appropriate risk factor for the neonates. The alternatives are whether
to correlate our data with the studies on foetuses in utero, or to assume that the sensitivity to
ionising radiation for the newborn babies is more similar to that ascribed to young children. In
practice of radiation protection, since the majority of neonates were pre-term the appropriate
risk factor was felt to be that for fetal irradiation. According to the ICRP report 60 [10] the
risk of fatal childhood cancer due to prenatal exposure has been estimated to vary from 2.8�
10-2
Sv-1
to 13�10-2
Sv-1
. The authors stress that the risk in the first trimester appears to be
larger than that found in the 2nd
and 3rd
trimester, but this is not established. If we accept that
the cancer risk, meaning leukaemia, is the same for the 2nd
and 3rd
trimester it should be fairly
close for X-rays taken shortly after birth. Therefore, using these factors, the risk of childhood
cancer from a single radiograph would be of the order (0.3-1.3) �10-6
. However, the
assumption that the newborn and foetus are equally susceptible to carcinogenic effects of
radiation involves an overestimation of risk. Firstly, irradiation in utero involves whole body
exposure of the foetus, whereas the neonatal radiography involves only partial exposure.
IAEA-CN-85-52
542
Secondly, it is not known whether babies in a higher oxygen tension than foetuses run a
greater risk of carcinogenesis from radiation [11].
The results show the risk from neonatal radiation to be fairly low, and it is considered to be
substantially outweighed by the clinical benefit of the radiograph in assessing the progress of a
sick baby. This is probably even more marked in the tiny prematures. However, the risk versus
benefit of each radiograph is important and must be weighed carefully, especially because
radiation effects are cumulative.
3.2. Direct patient dose measurements
Table 1 gives the results from TLD measurements for each examination and gives a
comparison between ESD’s measured with TLD and ESD’s calculated from technique factors.
Table 1: Comparison between ESD measured with TLD and ESD derived from the technique factors
Number of
radiographs
Mean ESD measured with
TLD (����Gy)
Mean ESD calculated from
technique factors (����Gy)
30 28.9�0.4 31.8�2.5
Comparison between the two measurement techniques shows that dose levels are similar for
both techniques. These results indicate that TLD LiF:Mg,Cu,P can be applied as a reliable
dosimetry method for effective monitoring of dose levels within a special care baby unit.
Uncertainties in the measurement of doses involve the fact that the TLD chips were not placed
on the centre of the radiation beam during the X-ray examination, so as not to affect image
quality. Since they were placed on the edge of the beam (shoulder/hip), they measured
somewhat lower dose. In fact, a difference of the order of 7% in dose was found. Furthermore,
uncertainties in the calculation of ESD’s from technique factors involve statistical
uncertainties in patient’s weight, in equivalent patient diameter and in measurements of kV,
mAs and FFD.
3.3. Comparison with previously published results and assessment of dose reduction
techniques in a SCBU
Our results may be compared with previously published data to attempt to delineate
mechanisms for dose reductions. The mean ESD per radiograph, regarding chest X-rays,
found in this study (36�Gy), can be compared with the values of 36�Gy [9], 44�Gy [12],
20�Gy [5] and 53�Gy [13] given by other studies. The mean ESD per radiograph as far as
chest and abdomen examinations are concerned, is found to be 35�Gy in this study, whereas
values of 70�Gy and 58�Gy have been reported by [11] and [14] respectively. The
comparison shows a range of doses resulting from variations in radiographic techniques used
and from differences between irradiated populations included in each site. The use of rare-
earth screens enables a great dose reduction and should be a major consideration in sites that
still use conventional (fast calcium tungstate) screens. In spite of the recommended high
voltage techniques, lower radiographic voltage is still often used in most of the sites. It must
be remembered that the effective radiographic voltage depends on the type and age of the
generator. Not all the generators allow short exposure times that are required for higher kV
technique.
The range of ESD’s encountered between different studies demonstrates that the ‘as low as
reasonably achievable’ (ALARA) principle is not being applied. Therefore, investigation into
further reduction should be made but without compromising diagnostic information. Probably
the most significant factor in radiological technique, regarding radiation protection for both
infant and staff, is the careful collimation of the field to the area of interest. Therefore, the risk

IAEA-CN-85-52
543
of radiation to the newborn is minimized by making sure that only essential radiographs are
taken, that careful collimation confines radiation to the relevant part of the infant, that
radiation shields over the lower abdomen are used unless this area is to be included on the
radiograph. Finally, adequately trained staff perform the radiographs so that the number of
repeat radiographs is reduced to the absolute minimum and that the highest standards of
radiation protection are achieved.
4. Conclusions
Although the radiation risk of X-ray examinations is found to be low considering the benefit
for the infant, radiography of newborns should be performed with full knowledge of the
possible harmful effects, considering that infants are particularly susceptible to radiation
induced cancer and that prematures may require a large number of X-ray examinations during
the early weeks of life.
Comparison between different studies resulting in a large range of doses found in a SCBU
shows a continuing need for assessment of radiation dose on neonates together with regular
review, and implementation, of dose reduction procedures.
References
[1] Schneider, K., Fendel, H., Bakowski, C., Stein, E., Kohn, M., Kellner, M., Schweighofer, K.,
Cartagena, G., Padovani, R., Panzer, W., Scheurer, C., Wall B., Results of a dosimetry study in
the European Community on frequent X-ray examinations in infants, Radiat. Prot. Dosim. 43
(1992) 31-36.
[2] European Guidelines on Quality Criteria for Diagnostic Radiographic Images in
Paediatrics, Report EUR 16261 EN: 13 (1996).
[1] Appleton, M.B., Stephen, C.R., Radiation protection in a neonatal intensive care unit: a
practical approach, Radiography 50 (1984) 137-141.
[2] Chapple, C.L., Faulkner, K., Hunter, E.W., Energy imparted to neonates during X-ray
examinations in a special care baby unit, Br. J. Radiol. 67 (1994) 366-370.
[3] McParland, B.J., Gorka, W., Lee, R., Lewall, D.B., Omojola, M.F., Radiology in the neonatal
intensive care unit: dose reduction and image quality, Br. J. Radiol. 69 (1996) 929-937.
[4] Wall, B.F., Harrison, R.M., Spiers, F.W., Patient dosimetry techniques in diagnostic radiology,
Institute of physical sciences in medicine, Report No.53 (1988).
[5] Duggan, L., Sathiakumar, C., Warren-Forward, H., Symonds, M., McConnel, P., Smith, T.,
Kron, T., Suitability of LiF: Mg,Cu,P and Al2O3C for low dose measurements in medical
imaging, Radiat. Prot. Dosim. 85 (1999) 425-428.
[6] Qados company information packet, Qados Ltd, Sandhurst, Berkshire, GU47 9DU.
[7] Wraith, C.M., Martin, C.J., Stockdale, J.N., McDonald, S., Farquhar, B., An investigation into
techniques for reducing doses from neo-natal radiographic examinations, Br. J. Radiol. 68
(1995) 1074-1082.
[8] ICRP 1990 Recommendations of the International Commission on Radiological Protection,
ICRP Publication 60 (Oxford: Pergamon).
[9] Fletcher, E.W.L., Bum, J.D., Draper, G., The risk of diagnostic radiation of the newborn, Br. J.
Radiol. 59 (1986) 165-170.
[10] Smith, W.L., Gresham, E., Berg, R., Hobson, L., Franken, E.A., Smith, J.A., A practical method
for monitoring diagnostic radiation dosage in the newborn nursery, Radiology 132 (1979) 189-
191.
[11] Robinson, A., Dellagrammaticas, H.D., Radiation doses to neonates requiring intensive care,
Br. J. Radiol. 56 (1983) 397-400.
[12] Faulkner. K., Barry, J.L., Smalley, P., Radiation dose to neonates on a Special Care Baby Unit,
Br. J. Radiol. 62 (1989) 230-233.

IAEA-CN-85-41
544
EVALUATION OF THE RADIATION DOSE IN A
PAEDIATRIC X-RAY DEPARTMENT
P.A. Kaplanis, S. Christofides, G. Christodoulides
Medical Physics Department, Nicosia General Hospital, Nicosia, Cyprus
K. Aristidou
Radiology Department, Makarios III Hospital, Nicosia, Cyprus
Abstract
This is an ongoing study that is conducted for the first time in Cyprus, whose objective is to compare radiation
doses received by children during radiological examinations from a dedicated paediatric X-ray unit, with those
from other departments around the world and reduce them if needed. Radiation doses were measured
simultaneously for comparison purposes, with extremity thermoluminescent dosimeters (TLD) type TLD-100
Lithium Fluoride and with a dose area product meter, (DAP), Gammex-RMI Inc, Model 841-S. Data recorded for
each radiological examination are age, sex, weight, height, focal size used (small/large), source image distance,
(SID), technique used (manual/automatic), kVp and mAs. The radiation doses received by children, undergoing
chest examinations are presented and compared.
1. Introduction
It is generally accepted today, that although dose limits do not apply for patients, dose
reference levels should be followed as a guide and an aid to the optimisation of radiation
protection in medical exposures. The imaging process must be optimised, once the diagnostic
examination has been justified and this involves three aspects :
�� the choice of radiographic technique
�� the diagnostic quality of the radiographic image
�� radiation dose to the patient [1]
If the patient is a child the risk of detrimental effects from ionising radiation, is greater than
that of adult patients [2].
Therefore, it is of the utmost importance, that radiation doses, especially paediatric, are kept at
a minimum level, without significant deterioration of the image quality and of the diagnostic
value of the examination. These are the first results of an ongoing study in which the doses are
measured with two methods, TLD dosimeters and DAP meter.
2. Materials and methods
This study is carried out at the Radiology Department of the Makarios III Hospital in Nicosia,
Cyprus. This is a Mother-and-Child Hospital with a dedicated paediatric department. The X-
ray system used is a paediatric unit, which allows the possibility of beam filtration changes to
be done easily, is a high frequency Philips Super 80 CP, with a SRO 33 100 type tube and
total filtration 3.3 mm Al. The processor is a Kodak PRX X-OMAT, model M6B set to give a
ã of 3.29 and a G of 2.12. The cassettes used are Okamoto type, High Speed 250.
The DAP meter used is the Gammex-RMI Ltd, model 841-S. This is a full field Ion Chamber
with a sensitivity of 130 pC/mGycm2. The dose area product rates are 1 mGycm
2s
-1 to
400.000 mGycm2s
-1. The DAP meter with a transparency of greater than 75% was attached to
the collimator of the X-ray tube.

IAEA-CN-85-41
545
Table 1. Comparison between our examination parameters and patient set-up, with those of the
European Guidelines on quality criteria for pediatric chest examinations, for the 5-10 years old,
age group
Radiographic Technique E.C. Guidelines This Study
Patient position upright, supine position possible upright
Radiographic device table or vertical, depending on
age
vertical
Nominal focal spot value 0.6 (less or equal to 1.3) small focus 0.6
large focus 1.3
Additional filtration up to 1mm Al +0.1 or 0.2 mm
Cu (or equivalent)
2mm Al
Antiscatter grid: r=8; 40/cm only in special indications and
in adolescents
fixed oscillating grid : r=12;
36/cm
Screen film system nominal speed class 400-800,
FFD 100-150 cm
nominal speed class 250, FFD
150cm
Radiographic voltage 100-150 kVp with grid 96-109 kVp with grid
Automatic exposure control chamber selected-lateral chamber selected-lateral
Exposure time < 10 ms < 10 ms
Protective shielding lead rubber coverage of the
abdomen in immediate
proximity of the beam edge
no added protective shielding
The TLD's used are Chipstrate Dosimeters from Harshaw/Bicron. They consist of a 1/8x
1/8
inch TLD chip hermetically bonded to a polymide substrate, to which an ID bar code strip is
attached. The TLD material is TLD-100 LiF natural, nearly tissue equivalent with a
TLD Chip Figure 1. Diagram of TLD placement for
Chest PA examinations.

IAEA-CN-85-41
546
measurement range 10µGy to 1 Gy. These are placed on the patient as shown in figure 1,
according to the European Commission guidelines [1].
The measuring instrument used for the quality control inspections is the Keithley Model
35080A kVp divider, which is compared and calibrated against the secondary standard, at the
Nicosia SSDL, which is situated at the Nicosia General Hospital.
The parameters recorded for each examination are : Type of examination, sex, weight, height,
age, kVp, mAs and focal size (small or large) used.
The initial examination parameters and patient set-up used, are compared with those
recommended by the European Guidelines on Quality Criteria for Diagnostic Radiographic
Images in Paediatrics of the European Commission, as shown in Table 1, for the 5-10 years
age group for chest examinations.
Our initial Chest Technique set up deviate from the European Guidelines in three parameters :
· Additional Filtration
· Screen Film Combination
· Protective Shielding
The intention of the study was first to measure the doses with the existing set up and then
make modifications to the technique in steps. At each modification step to measure the doses,
in order to compare the effect of each modification.
3. Results
The results obtained so far are shown in Table 2, which give the mean dose results obtained
by the TLD and DAP dosimeters. The results presented are in terms of Entrance Surface Dose
ESDTLD and ESDDAP. ESD TLD is expressed in terms of absorbed dose to air which is
equivalent to entrance air kerma at diagnostic x-ray energies. The associated uncertainties for
chest examinations are 20% and 31% respectively. These results are compared with those of
similar studies carried out elsewhere.
The orthochromatic cassettes used in the first modification step are the KB69050-F PTM
Kodak, Lanex X-OMATIC with a speed of 400.
The beam filtration used in the second modification step was increased to 0,1 mm Cu + 1,0
mm Al.
4. Discussion of results
The results obtained with the initial set up, show that the radiation doses delivered to children
appear to be higher than those in other studies. Nevertheless all our TLD results are however
less than the maximum value reported by the National Council on Radiation Protection and
Measurements report No 68 [3], which for a 10 year old child, was 0.5 mGy for the same type
of examination. The results obtained after the first modification, are substantially improved
with the DAP measurements falling within the range of values of the Irish study. The TLD
measurements are still higher than the other studies and twice the values of the Irish study.

IAEA-CN-85-41
547
Table 2. Comparison of doses for chest X-ray examination, between three different studies, for
the 5-10 years old age group, in terms of ESDTLD and ESDDAP. Figures in parenthesis give the
range of values
Study Sample Size Mean ESDTLD
(mGy)
Mean ESDDAP
(mGy) Comments
UK (N/A) 0,06 (N/A) 34 (N/A)
Ireland 30 0,046 (0,032 – 0,087) 23 (10 – 65)
Cyprus 13 0,14 (0,09 – 0,23) 80 (40 – 218) Original Set Up
Cyprus 24 0,089 (0,070 – 0,147) 24 (18 – 48) With Orthochromatic
Cassettes
Cyprus 13 0,079 (0,058 – 0,119) 20 (10 – 58) With Orthochromatic
Cassettes and increased
beam filtration (0,1 mm
Cu+1,0 mm Al)
The results obtained thus far after the second modification are even better with the DAP
measurement being below those of the Irish study and the range of the TLD measurements so
far are within the range of the Irish study but the average value is still higher than that of the
Irish study. The above modification had no visible effect whatsoever on the quality of the
radiograph produced, which has been verified by the Radiologist in charge.
5. Conclusion
The practice as used initially in this study is improved by reducing the radiation dose to be
within the European Commission Guidelines. This was achieved by using ultra high speed
cassettes and by hardening the radiation beam with increase of the filtration. The doses can
further be reduced by using higher kVp techniques and by removing the oscillating grid during
paediatric use of the unit, as it is recommended in the European Guidelines.
Acknowledgements
This study is supported by the Biomedical Research Foundation, Nicosia Cyprus. The support
and assistance of the personnel of the Radiology Department of the Makarios III Hospital is
acknowledged and specially to Radiographers, Vathoulla Ioannou, Stella Komodromou,
Stavroulla Karapataki, Eleni Evangelou and Dark Room Technician Nicos Loizou.
References
[1] Commission of the European Communities. European Guidelines on quality criteria for
Diagnostic Radiographic images in Paediatrics, EUR 16261 EN. Luxembourg: office for
official publications o the European Communities 1996.
[2] R Mooney, P.S. Thomas. Dose reduction in a paediatric X-ray department following
optimisation of radiographic technique. British Journal of Radiology 1998; 71: 852-
860.
[3] National Council on Radiation Protection and Measurements. Radiation Protection in
Paediatric Radiology, NCRP Report No 68, 1981.

IAEA-CN-85-207
548
RADIATION EXPOSURE OF CHILDREN DURING RADIODIAGNOSTIC
EXAMINATIONS OF CHEST IN SLOVAKIA
M. Horváthová
Faculty of Health and Social Care, Trnava University, Trnava, Slovakia
D. Nikodemová
Institute of Preventive and Clinical Medicine, Bratislava, Slovakia
Abstract
Higher individual somatic radiation risk in the younger age groups has been until now inadequately considered in
radiation protection. It is therefore essential to develope appropriate radiation protection measures also in the
field of diagnostic radiology for paediatric patients. The European Communities elaborated Guidelines on quality
criteria for radiodiagnostic radiographic images in paediatrics. Reference dose values for selected types of
examinations and for 5 year old child were proposed. In our contribution we have tried to estimate the radiation
load of children to 15 years, which undergone chest radiodiagnostic examinations during 1996 in a Slovak
district. Our data of entrance surface doses were collected using measurements with TLD for 149 patients divided
in 5 age categories at nine radiodiagnostic departments. The calculations of the total absorbed dose were
performed using the measured ESD values integrated over the X-ray beam area, the conversion factors between
the imparted energy and the dose-area product and the known irradiation parameters (kV, HVL, mass, etc.).
The analysis of the obtained absorbed doses as a function of age for chest PA radiodiagnostic examinations has
shown, that the investigated Slovak radiodiagnostic centres use rather lower voltage techniques and the entrance
surface doses are much higher than the proposed value of EC.
1. Introduction
Risks to pediatric patients from radiation exposure are aknowledged to be greater than for
adults. It is supported by the fact that for certain detrimental effects has the radiation exposure
in the first ten years of life, 3 to 4 times greater attributable lifetime risk than exposures
between ages of 30 to 40 years, and 5 to 7 time greater when compared to exposures after the
age of 50 years. It is therefore essential to develope appropriate radiation protection measures
also in the field of diagnostic radiology for paediatric patients. Available data on paediatric
doses are limited and comparisons are complicated by range of patient size.
Commision of the European Communities (EC) contributed to this problem giving special
attention to the control measures, analysis of patient doses and quality criteria for
radiodiagnostic procedures of children.[1] In 1996 EC adopted Guidelines on quality criteria
for radiodiagnostic images in paediatrics [2] contain reference entrance surface doses for
various diagnostic examinations and for 5 years old children. The patient doses obtained on
individual radiodiagnostic departments can be compared with this given standards.
In our paper we surveyed the entrance surface doses, measured during chest examinations of
149 patients (with ages to 15 years) and results of measurements of dose area product for
assessment of absorbed doses. The calculations of absorbed doses were performed using the
conversion factors between the energy imparted and the dose area product at the known
irradiation parameters (kV, HVL, mass of the patients, etc.)
The analysis of the obtained data and their comparison with reference values of EC
demonstrate that the entrance surface doses (mainly due to the lower used voltages) are
several times higher than recommended.
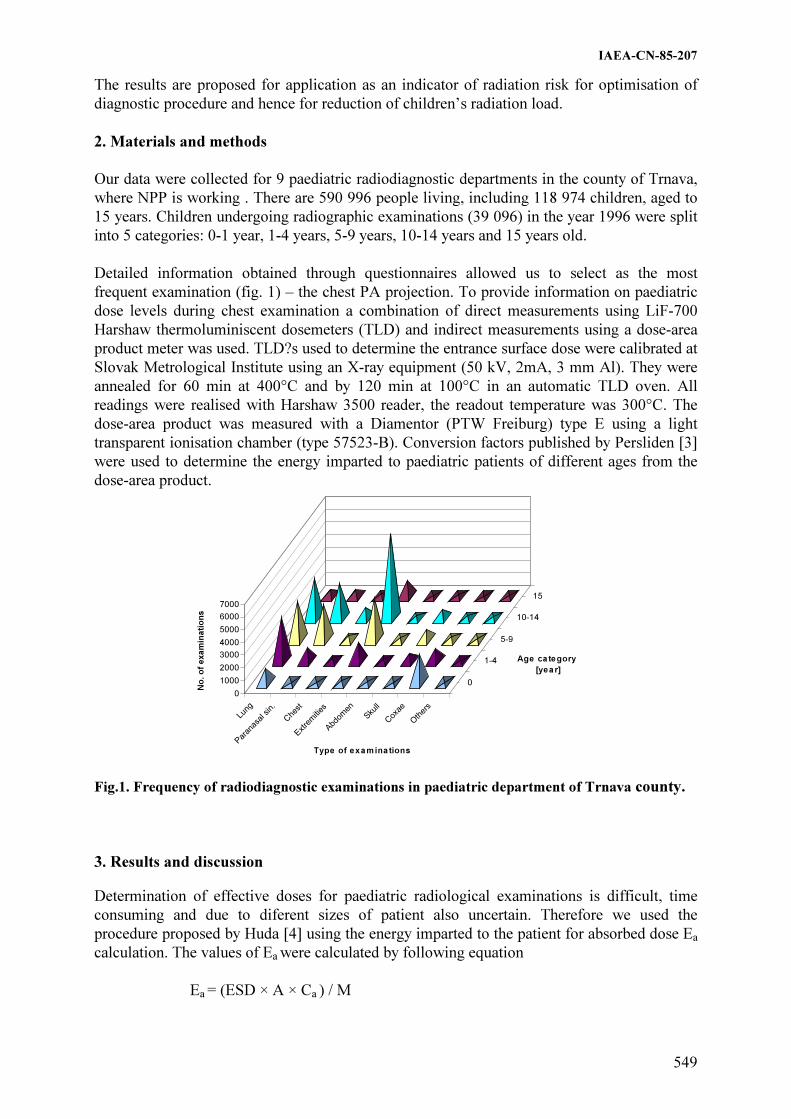
IAEA-CN-85-207
549
The results are proposed for application as an indicator of radiation risk for optimisation of
diagnostic procedure and hence for reduction of children’s radiation load.
2. Materials and methods
Our data were collected for 9 paediatric radiodiagnostic departments in the county of Trnava,
where NPP is working . There are 590 996 people living, including 118 974 children, aged to
15 years. Children undergoing radiographic examinations (39 096) in the year 1996 were split
into 5 categories: 0-1 year, 1-4 years, 5-9 years, 10-14 years and 15 years old.
Detailed information obtained through questionnaires allowed us to select as the most
frequent examination (fig. 1) – the chest PA projection. To provide information on paediatric
dose levels during chest examination a combination of direct measurements using LiF-700
Harshaw thermoluminiscent dosemeters (TLD) and indirect measurements using a dose-area
product meter was used. TLD?s used to determine the entrance surface dose were calibrated at
Slovak Metrological Institute using an X-ray equipment (50 kV, 2mA, 3 mm Al). They were
annealed for 60 min at 400°C and by 120 min at 100°C in an automatic TLD oven. All
readings were realised with Harshaw 3500 reader, the readout temperature was 300°C. The
dose-area product was measured with a Diamentor (PTW Freiburg) type E using a light
transparent ionisation chamber (type 57523-B). Conversion factors published by Persliden [3]
were used to determine the energy imparted to paediatric patients of different ages from the
dose-area product.
0
1000
2000
3000
4000
5000
6000
7000
No
. o
f exam
inati
on
s
Lung
Par
anas
al sin.
Che
st
Extre
mities
Abd
omen
Skull
Cox
ae
Oth
ers
0
1-4
5-9
10-14
15
Type of examinations
Age category
[year]
Fig.1. Frequency of radiodiagnostic examinations in paediatric department of Trnava county.
3. Results and discussion
Determination of effective doses for paediatric radiological examinations is difficult, time
consuming and due to diferent sizes of patient also uncertain. Therefore we used the
procedure proposed by Huda [4] using the energy imparted to the patient for absorbed dose Ea
calculation. The values of Ea were calculated by following equation
Ea = (ESD × A × Ca ) / M

IAEA-CN-85-207
550
A = the irradiation beam area in m2
ESD = the measured entrance surface dose in mGy
Ca = the conversion factor (kg/m2) of the imparted energy and dose area product [3]
M = the mass of patient in kg
Conversion factors Ca were calculated taking into account the age of patient and the total
filtration (HVL in mm of Al), applicated during the examination.
0,15
0,20
0,25
0,30
0 5 10 15
Age [Years]
Ab
so
rbe
d d
os
e [
mG
y]
Fig.2. shows the relationship between Ea and the age of patient.
In the table 1 technical parameters and adequate ESD for chest examinations of children are
shown.
Table 1. Technical parameters and entrance surface doses for X-ray examinations
of chest (children 5-9 ages)
Hospital Used
equipment Technical parameters FSD HVL ESD
kV mA.s cm mmAl �Gy
1 chiralux 2 38-46 24-42 100-150 3 586
2 chiralux 2 50-53 18 100-150 2,8 562
3 MP 15-chirana 55-60 4-6 150 2,8 403
4 chiralux 2 50 18 150-200 2,2 431
5 chiralux 2 50 13-18 150 2,85 443
6 durolux 71-73 5-12 150-200 2,6 432
7 chiralux 2 40-44 24 150 2,8 305
8 chirodur 125C 45-47 8-13 150 2,8 488
9 chiralux 2 42-46 18 110-150 2,8 326
Total filtration 3 mmAl
Comparison of our results with reference values published in EC document indicate that in the
case of chest PA of 5-9 years old children, the reference value for ESD of 0,1 mGy was
defined for “high kV technique” and therefore for penetration of the X-ray beam. As it is
shown in the table the radiological departements, investigated in our study, used fot chest
examinations rather “low kV technique” leading to several time higher ESD.

IAEA-CN-85-207
551
Table 2. Entrance surface dose of 5-9 year old children for the chest PA/AP examination
ESD[µGy]
min-max median ratio of min:max
departments of Trnava county 253-708 414 1:3
European hospitals 19-1347 67 1:71
The requirements of good radiographic technics given in the EC Guidelines are fulfilled only
in 10% of chest examinations. We are following this study in all counties of Slovakia, which
should be the basis for establishing reference values of chest examinations in paediatric
radiology and implementation of QA programme for children dose reduction.
References
[1] Directive 84/466 EURATOM: Basic measures for the radiation protection of persons
undergoing medical examination or treatment, September 1984
[2] EUR 16261- European guidelines on quality criteria for diagnostic radiographic images
in pediatric, Luxemburg, 1996-IX, 61
[3] Persliden, J., Sandborg, M.: Conversion factors between energy imparted to the patient
and air collision kerma integrated over beam area in paediatric radiology, Acta
Radiologica 1993; 34: 92-98
[4] Huda, W., Gkanatsisos, N.A.: Effective dose and energy imparted in diagnostic
radiology, Med. Phys. 1997; 24: 1311-1316
[5] Nikodemová, D., Horváthová, M., Vladár, M.: Radiation load connected with some
radiodiagnostic examinations in paediatrics; Book of abstracts, IRPA regional congress
on radiation protection in central Europe, Budapest, August 22-27 1999

IAEA-CN-85-172
552
RADIATION DETRIMENT ASCRIBABLE TO INFANTS AND CHILDREN
UNDERGOING MICTURATING CYSTOURETHROGRAMS — A REVIEW OF
STUDIES IN SPAIN, BRITAIN, NEW ZEALAND AND VENEZUELA
D.L. Evans, M.C. Canete
ALERT Medical Research, Christchurch, New Zealand & IVIC, Caracas, Venezuela
Abstract
The detriment, due to ionizing irradiation, ascribable to infants and children may be as high as three times that to
adults. Recent interest in dose reduction, in part associated with the advent of the Diamentor dose-area product
meter has led to several studies reporting average dose-area products at a number of centres for micturating
cystourethrograms (MCUGS) and other radiological examinations. In this review the data has been further
processed to yield the ICRP 60 Equivalent Doses and a detriment factor applied to yield the numbers of infants
and children likely to suffer detriment in future life as a result of having undergone the procedure at the
centres reviewed.
1. Introduction
The ICRP Publication 60 [1] recognizes that the detriment which people might incur from
irradiation needs to be in line with the other risks in life that people are willing to accept.
Partly as a result of this and better knowledge concerning the detriment imposed by irradiation
the ICRP reduced its recommended limits for exposure to radiation. Amongst other things it
re-defines various quantities so as to make predictions of the outcomes of irradiation easier to
quantify and understand. An initiative of the Commission of European Communities [2]
inspired an interest in the assembling of data on paediatric radiology, there being a paucity of
that in the literature.
The use of Monte Carlo methods for studying radiation transport and energy deposition when
coupled with mathematical models of the human anatomy has enabled the calculation of
tables of organ doses normalized to Entrance Surface Doses and separately to Dose-area
Products for a set of standard radiographic projections. Such tables have been published by
Hart, Jones & Wall at the NRPB [3] for adult radiology, computed tomography and paediatric
radiology. Computer software (CHILDOSE) has been published by J Le Heron ar the NRL [4]
which utilizes these tables and specific input parameters such as the filtration, kVp and either
entrance surface-dose or dose-area product to make dose calculations. It enables the user to
choose the standard examination required and calculates the doses to all organs (of both
genders) and the Equivalent Dose (E D) to the child as a whole. In certain instances the actual
examination may only be able to be approximated by one of the standard projections or may
be somewhere between two of them. When fluoroscopy is involved covering several organs
such as the genito-urinary tract practical experience shows that up to three of the standard
examinations may have to be calculated to give a good indication of the contributions to the
Effective Dose.
The detriment, a human being may suffer as a result of irradiation, may be no harm, the
induction of a non fatal cancer, the induction of a fatal cancer and/or gonadal damage
resulting in genetically deficient offspring. The susceptibility of adults to suffering such
detriment (including the loss of lifestyle effected by cancers and genetic defects) may be
broadly desribed by detriment factors of 5%/Sv of dose for fatal cancers, 1%/Sv of dose for
non fatal cancers and 1.3%/Sv of dose for genetic effects in offspring. (ICRP 60 Sect 97 [1]).

IAEA-CN-85-172
553
The susceptibility of children to suffering the detrimental effects of radiation is considerably
greater than that for adults, but decreases exponentially into adult-hood. For those aged under
10 years of age the 'multiplicative' model of susceptibility suggests that the susceptibility of
children receiving low doses of radiation leading to fatal cancers later in life is approximately
3 times that of adults - that is about 15%/Sv. (ICRP 60 [1] Fig. C-5 Annex C.7). Assuming
that the same factor of 3 may be applied to the other two much smaller contributions to
detriment the factors would be 15%/Sv of dose, 3%/Sv of dose and 4%/Sv of dose for fatal,
non-fatal and hereditary effects respectively - a total of 22%/Sv of dose. This assumption is
probably the most reasonable that can be made at this time as not sufficient time has elapsed
for the 'under 10 years of age' Japanese atomic bomb survivors to have completed their life
span for the relevant statistics to have been compiled. Those such survivors presently alive
would be between 55 and 65 years of age.
The detriment (D) is calculated by firstly calculating the Effective Dose (ED) and then
multiplying that by the detriment factor (f) which may be styled
D = ED.f
The figure of 22%/Sv of dose would seem to be a reasonable upper bound in this instance. The
'multiplicative' model is much more conservative than the 'additive' model - predicting higher
susceptibilities to radiation detriment for children than the additive model.
2. Method
Review papers from the period 1994 - 1996 were chosen where there was suitable data on
micturating cystourethrograms presented. Additional data has been collected in Venezuela
during 2000.
The tables of NRPB SR279 and the software published by the New Zealand National
Radiation Laboratory (NRL) were used to make a series of calculations of the average
Equivalent Doses using the average dose information and radiological settings from the
selected studies.
CHILDOSE has options to calculate doses for a child at birth, 1 year, 5, 10 and 15 years of
age. As the data reported in the selected literature is given as an average for the periods 0 - 12
months, calculations of the Effective Dose at birth and 1 year may be calculated along with
the values of their arithmetic mean (denoted by - 6 m (months)). The filtration in one of the
reported studies is 3.1 mm Al. whereas the remainder do not report the filtration used. In such
instances 2.5 mm Al is used in the calculations for this report.
An MCUG examination of an individual patient generally comprises two parts - a
fluoroscopic part and an X-ray part where 3 - 6 exposures are taken. Quite a variety of
diagnostic regimens are followed leading to a range of results varying by an order of
magnitude. Generally the kVp is around 65 but in some instances it is around 90. The average
dose-area products are generally reported, in the papers, separately for the fluorography and
the films (and these may have been made at different kVp's) so the calculations of dose are
done separately and the results summed.

Tab
le 1
. E
ffecti
ve D
ose
s a
nd
Detr
imen
t C
alc
ula
ted
for a
Ran
ge o
f R
ep
orte
d S
urveys
of
Ra
dio
log
ica
l P
ra
cti
ce,
rela
tin
g t
o
Ab
dom
ina
l a
nd
Pelv
ic P
ro
jecti
on
s T
yp
ical
of
those
for P
aed
iatr
ic M
CU
G E
xam
inati
on
s
Yea
r
of
Publ.
Auth
or
Abbre
v
Fil
tn
kV
p
kV
p
ES
D
ES
D
Dia
m.
Dia
m.
AP
vie
w
CH
ILD
OS
E C
alcu
lati
on
Eff
ecti
ve
Dose
in m
Sv
Det
rim
ent
0.2
2/S
v
mm
Al
Flu
. F
ilm
F
lu
mG
y
Fil
m
mG
y
Flu
cGycm
2
Fil
m
cGycm
2
0-1
yrs
2-5
yea
rs
6-1
0 y
ears
11 -
15 y
ears
of
age
1993
DL
E
3.1
60
60
0.7
7
1.4
1
MC
UG
0.5
0.1
3
1per
10,0
00
1994
MF
SM
3.0
70
70
17
3.6
A
bdom
en
0.4
1per
10,0
00
Aber
dee
n, S
cotl
and
0.1
2
1
Abdom
en
0.8
1
0.1
2
1
0.1
3
1per
10,0
00
Aber
dee
n, S
cotl
and
Pel
vis
0.0
7
1
0.0
8
1
0.0
9
1per
10,0
00
New
cast
le, E
ngla
nd
Abdom
en
0.1
4
1
-
- 0.1
3
1per
10,0
00
New
cast
le, E
ngla
nd
Pel
vis
0.1
1
1
0.1
7
1per
10,0
00
Mad
rid I
A
bdom
en
0.2
1
1
0.2
9
1
0.2
3
1per
10,0
00
Mad
rid I
P
elvis
0.3
1
0.2
6
1
0.2
9
1per
10,0
00
Mad
rid I
I
A
bdom
en
0.4
3
1
0.4
7
2
0.3
7
1per
10,0
00
IAEA-CN-85-172
554

Tab
le 1
. (c
on
t.)
Mad
rid I
I
P
elvis
0.1
88
1
0.3
4
1
-
-
1995
GV
R
3.1
85
55
20
238
Abdom
en
3.7
9per
10,0
00
Cen
tre
I M
adri
d C
om
m. H
osp
ital
P
elvis
4.1
9per
10,0
00
M
CU
G
2.7
7
3.5
8
4
Cen
tre
II M
adri
d P
aedia
tric
Hosp
ital
10per
10,0
00
1996
RV
FG
3.1
60
65
116
10
Abdom
en
1.9
4per
10,0
00
P
elvis
2.1
4per
10,0
00
Cen
tre
I -
Mad
rid C
om
munit
y H
osp
ital
M
CU
G
1.4
4
1.9
5
5
2.7
4
7per
10,0
00
Cen
tre
II
3.1
80
100
117
165
Abdom
en
5.4
4.4
10
4.6
12´p
er10,0
00
P
elvis
5.9
14per
10,0
00
Cen
tre
II –
Mad
rid P
aedia
tric
Hosp
ital
M
CU
G
6.8
16
4.4
10
4.6
11per
10,0
00
Cen
tre
III
3.1
65
70
57
57
Abdom
en
1.9
5per
10,0
00
Cen
tre
III
– M
adri
d G
ener
al H
osp
ital
P
elvis
2.0
5per
10,0
00
Cen
tre
III
– M
adri
d G
ener
al H
osp
ital
M
CU
G
1.2
3
2.1
5
1.9
5per
10,0
00
2000 J
M d
e lo
s R
ios
Pae
dia
tric
Hosp
ital
Car
acas
M
CU
G
1.3
3 p
er10,0
00
2000 J
M d
e lo
s R
ios
Pae
dia
tric
Hosp
ital
Car
acas
M
CU
G
0.7
2
0.8
2
0.9
2 p
er 1
0,0
00
*F
ilm
an
d f
luo
rogra
ph
ic v
alu
es a
re n
ot
giv
en s
epar
atel
y,
just
the
tota
l is
giv
en a
nd t
hat
is
the
val
ue
in t
he
Flu
co
lum
n.
Note
s to
ass
ist
in i
nte
rpre
tin
g T
ab
le 1
Colu
mn
s h
ead
ed D
et. C
on
tain
th
e sa
me
info
rmat
ion a
s th
e ri
ght0
most
colm
n o
f th
e ta
ble
(th
e val
ues
are
rat
es p
er 1
0,0
00
).
For
0-1
yea
rs o
f ag
e th
e C
HIL
DO
SE
cal
cula
tions
hav
e bee
n d
one
for
both
abdom
inal
and p
elvic
pro
ject
ion
s. C
on
stra
ints
on
th
e p
aper
len
gth
pre
ven
t
incl
usi
on
of
the
kV
p, E
SD
an
d/o
r D
ose
Are
a pro
duct
s fo
r th
e A
ge
ranges
2 -
5,
6 –
10 a
nd 1
1 –
15
.
IAEA-CN-85-172
555

IAEA-CN-85-172
556
3. Results and discussion
The radiological parameters and results of the calculations are presented in Table 1. They have
been arranged in order of publication.
The Author Abbreviations refer to the publications as follows - DLE- Evans [5], MFSM –
Martin, Farquhar, Stockdale & MacDonald [6], GVR – Gonzalez, Vano & Ruiz [7], KFCPB –
Kyriou, Fitzgerald, Pettett, Cook & Pablot [8]. RVGF – Ruiz, Vano, Gonzalez & Fernandez
[9]. The meanings of the Centre’s I, II, and III C1, C2, G3 and G4 are as defined in the papers
to which they apply.
The standard radiological examinations dealt with by CHILDOSE do not include the MCUG
so calculations have been made of the organs doses for the two projections Abdomen and
Pelvis. The Abdomen does not include the testes whereas the Pelvis does. Which is the most
realistic representation is hard to decide but the results do not differ greatly. Readers must
pass their own judgement on this matter.
The values of the Effective Dose (E D) are those calculated by CHILDOSE using the NPRB
tables. Method 1 [4].
The detriment D is calculated as 22%/Sv.ED where for the purposes of these calculations 1
mSv = 1 mGy and is expressed in the form n per 10,000. This means that n infants of every
10,000 undergoing this diagnostic procedure at the relevant institution at the time to which the
survey data pertains or having an examination using the same or similar radiological
parameters would incur a radiological induced detriment. For 15/22 of those incurring the
(non-zero) detriment the detriment would be a fatal cancer some time later in life, for 3/22 of
them the detriment would be a non-fatal cancer later in life and for 4/22 of them the detriment
would be inheritance of a genetic defect by their offspring.
Examination of Table 1 shows that there are widely varying practices with accompanying
disparate detriment.
5. Conclusions
There is significant variation in the detriment being suffered by infants and children having
MCUG examinations at different centres around the world. The average Effective Doses
calculated corresponding to the average parameters used in the calculations range from 0.5 -
7.1 mSv. The range of actual Effective Doses will of course be even wider. If the method were
to be compared with some other modality the diagnostic information yield obtainable from
each modality would have to be carefully compared particularly in relation to specificity and
efficacy. The availability of detriment information certainly makes it easier to quantify the
relative risks of various procedures in order to make informed decisions about them.
References
[1] International Commission on Radiological Protection. 1990. Recommendations of the
International Commission on Radiological Protection. Publication 60. Ann. ICRP, 21,
1-3 (Pergamon Press, Oxford) (1991).

IAEA-CN-85-172
557
[2] Commission of the European Communities Draft working Document (Lake Starnberg
Group). Quality Criteria for Diagnostic Radiographic Images in Paediatrics (ECE
Brussels)(1992).
[3] Hart, D. Jones, D G. & Wall, B F. Normalised organ doses for paediatric X-ray
examination calculated using Monte Carlo Techniques (NRPB Chilton) pp 23-25
(1996).
[4] Le Heron, J. CHILDOSE: A user’s guide (NRL). (NRL Christchurch) pp 1-13 (1997).
[5] Evans, David L. Method for calculation of paediatric diagnostic radiological doses.
Medical Physics and Bioengineering Christchurch Hospital. Report. Pp 1-5 (1993).
[6] Martin, C J. Farquhar, B. Stockdale, E and Macdonald S. A study of the relationship
between patient dose and size in paediatric radiology. Br.J. Radiol., 67, 864-
971(1994).
[7] Gonzalez, L. Vano, E and Ruiz, M J. Radiation doses to paediatric patients undergoing
micturating cystourethrography examinations and potential reduction by radiation
protection optimization. Br.J.Radiol. 68, 291-295 (1995).
[8] Kyriou, J C. Fitzgerald, M. Petterr, A. Cook, J V. And Pablot, S M. A comparison of
doses and techniques between specialist and non-specialist centres in the diagnostic X-
ray imaging of children. Br.J.Radiol., 69, 437-450 (1996).
[9] Ruiz, M.J. Vano, E. Gonzalez, L and Fernandez, A. Dose-area product values in
frequently performed paediatric radiology examinations. Br.J.Radiol. 69 160-164
(1996).

.
Topical Session 8a
RADIOLOGICAL PROTECTION OF PATIENTS IN
RADIOTHERAPY: EXTERNAL BEAM


IAEA-CN-85-153
561
RADIOLOGICAL PROTECTION OF THE RADIOTHERAPY PATIENT?
M.P.R. Waligórski1,2
, J. Lesiak1
1 Centre of Oncology, Krakow Division, Krakow, Poland
2 Institute of Nuclear Physics, Krakow, Poland
Abstract
We propose that the system and concepts of radiation protection should not be used with reference to
radiotherapy patients. We justify this on conceptual grounds. The patient undergoing radiotherapy procedures, as
prescribed by the medical practicioner, is protected by the quality assurance system legally required for medical
exposures.
1. Introduction
The medical exposure of a patient for purposes of radiotherapy is unique in that radiation
itself is the healing agent, applied at a dose rate and dose range over three orders of magnitude
higher than that occurring naturally. Moreover, unlike at natural dose levels, much is known
quantitatively about the dose-effect relationship, both for the curing effect and for the post-
irradiation complications, which inevitably accompany radiotherapy. Figuratively speaking,
radiation protection is concerned with avoiding the generation of cancer by avoiding exposure,
while radiotherapy, in contrast, relies on delivering a dose as high as possible to eradicate the
cancer which has already developed. Whether to apply principles of radiation protection to
the radiotherapy patient, is a question worth considering. It is the topic of this Conference.
We propose that the system and concepts of radiation protection should not be used with
reference to radiotherapy patients. We will justify our view on conceptual grounds, in the
context of relevant regulations and recommendations.
2. Radiotherapy
Radiotherapy, for curative or palliative intent, is a well-described sequence of procedures [1-
3], the general aim of which is to achieve cytotoxic levels of irradiation to well-defined target
volumes of the patient, while as far as possible sparing the exposure of surrounding healthy
tissues. Radiotherapy seeks to provide an optimal uniform distribution of dose to the target
volume relative to normal tissue, the point of optimisation being to deliver a dose as high as
possible within the available “therapeutic window”. This “window” arises as a range of dose
applied to the target volume where the probability of cure exceeds the probability of
complications, both probabilities increasing with dose (up to saturation) in a non-linear
manner. According to present radiobiological models, the dose-effect relationships used to
describe the probability of cure and the probability of complications are mathematical
expressions involving exponential or power dependence on dose [4]. A total dose of the order
of 60 Gy, or so, to the target volume, delivered in up to about 30 daily fractions of about 2 Gy,
is typically applied. It is well recognised that the biological effect is not additive with dose,
and depends on the radiosensitivity of the tissue and on the timing of the fractionation
scheme. Through careful planning and beam shaping techniques (most frequently, external
beams of megavoltage photons and electrons, gamma-rays from sealed sources placed
internally, or beta- or gamma- rays from radiopharmacological agents, are used) the dose to
the target volume is maximised while sparing the neighbouring healthy tissue or so-called
critical volumes. Modern radiotherapy is a complex procedure involving advanced

IAEA-CN-85-153
562
technology and close co-operation between qualified specialists trained in the areas of
medicine, radiation physics and technology. A detailed quality assurance system in
radiotherapy is presently required by national and international recommendations [5].
3. Conceptual
Clearly, the governing principles of radiation protection: justification of a practice, dose
limitation and optimisation of protection and safety, as stated in the Basic Safety Standards
[5], do not apply in the case of radiotherapy. In this context, one may also take issue with the
statement concerning the control of medical exposures in the 1990 ICRP Recommendations
(S36, p. 74): “...If the practice is justified and the protection optimised, the dose in the patient
will be as low as is compatible with the medical purposes.” Indeed, radiotherapists insist on
delivering a dose to the tumour as high as is compatible with the probability of occurrence of
complications. Radiotherapy is unique in this aspect, unlike, e.g., medical diagnostics. The
dose to which the tissue surrounding the target volume is exposed to, as well as the limits of
dose applied to critical targets, are governed strictly by medical and not by radiation protection
considerations. Healthy neighbouring tissues are likely to acquire doses well above levels
considered to be of relevance to radiation protection. Disregarding the dispute as to the
linearity of dose-effect relationships at low doses, there is unanimous acceptance of the non-
linearity of this relationship at dose levels used in radiotherapy. Application of multiplicative
dose factors such as those used in defining equivalent dose or effective dose [5,6] is thus
inappropriate, even if values of these factors were known at such high dose levels. Therefore,
the usage of the Sievert as unit of effective dose equivalent or effective dose, and of collective
dose (in units of man Sv), cannot be justified in the case of radiotherapy.
4. Discussion
A case in point is the study of Beentjes [7], quoted in Annex C of UNSCEAR 1993 Report
[8]. Here, the collective effective dose from radiotherapy in the Netherlands for 1971 (male
and female) radiotherapy patients has been calculated at 18630 man Sv, yielding an average of
9.67 Sv per patient (!). Additional calculations were made using cancer fatality coefficients
taken from ICRP-60 [6], presumably valid at low-dose, or the “stochastic” level of radiation
hazard. It is difficult to imagine how could meaningful evaluations be made over a wide
range of doses, presumably from 60 Gy in the target area to a value orders of magnitude
smaller, from scattered radiation, considering, e.g. exponential dose-effect relationships
known to be valid at the higher dose levels. The meaning of the collective effective dose, let
alone the Sv under such non-uniform irradiation conditions and at such high doses is difficult
to understand. In our view, this example illustrates the futility of applying concepts and units
of radiation protection in radiotherapy.
5. Quality assurance in radiotherapy
The quality assurance systems in radiotherapy, presently recommended at national and
international levels [5], usually pertain to the complete procedure, including calibration of
sources, clinical dosimetry, computerised radiotherapy planning systems and recording and
reporting all the procedures [9]. Detailed quality assurance tests have been implemented for
all radiotherapy equipment, by national and international authorities. It is through strict
adherence to such quality assurance systems that patient safety is assured and the possibility
of, e.g., accidental overexposure of the patient avoided. Possible stray or scattered radiation
related to radiotherapy is of no consequence to the patient’s radiation protection, as it is

IAEA-CN-85-153
563
usually a contribution several orders of magnitude smaller than that relevant to the curative
does applied. Thus, in our view, the ultimate safety of the radiotherapy patient results from
the correct procedure of applying the medical exposure within the appropriate quality
assurance system, and not from protecting him against exposure to radiation. Information,
such as that provided in the last UNSCEAR report [10] on, e.g., total dose applied to target
volumes in a given number of patients for given types of malignancies is of interest to the
specialist but no information concerning population exposure patterns can, or should be
derived from such data. Whether any dose-response relationships over a wider range of doses
could be extracted from this data in conjunction with additional information on the generation
of secondary radiogenic cancers in radiotherapy patients, is a matter for further consideration.
References
[1] ICRU Report 62, Prescribing, Recording and Reporting Photon Beam Therapy
(Supplement to ICRU Report 50), International Commission on Radiation Units and
Measurements, Bethesda, Maryland 1999
[2] ICRU Report 50, Prescribing, Recording and Reporting Photon Beam Therapy,
International Commission on Radiation Units and Measurements, Bethesda, Maryland
1993
[3] ICRU Report 38 Dose and Volume Specification for Reporting Intracavitary
Radiotherapy in Gynaecology, International Commission on Radiation Units and
Measurements, Bethesda, Maryland 1985
[4] BIR Report 19, The Scientific Basis of Modern Radiotherapy, British Institute of
Radiology, London, 1989
[5] International Basic Safety Standards for Protection against Ionizing Radiation and for
the Safety of Radiation Sources, International Atomic Energy Agency, Vienna, 1994
[6] ICRP Publication 60, 1990 Recommendations of the International Commission on
Radiological Protection, Annals of the ICRP, Pergamon Press, Oxford, 1991
[7] Beentjes, L.B. The risks, expressed in collective doses, from radiotherapy in the
Netherlands, Klin. Fysica 3, 116-121 (1987)
[8] UNSCEAR 1993 Report to the General Assembly, Sources and Effects of Ionizing
Radiation, United Nations Scientific Committee on the Effects of Atomic Radiation,
United Nations, New York, 1993
[9] Thwaites, D.I. et al. Quality assurance in radiotherapy, ESTRO Advisory Report to the
CEU for the ‘Europe Against Cancer” Programme, Radiotherapy and Oncology, 35 61-
73 (1995)
[10] UNSCEAR 2000 Report to the General Assembly, Sources and Effects of Ionizing
Radiation, United Nations Scientific Committee on the Effects of Atomic Radiation,
United Nations, New York, 2000

IAEA-CN-85-17
564
HIGH DOSE AND LOW DOSE RADIATION EXPOSURE IN THE
INDUCTION OF BREAST CANCER
E. Fernandez-Vicioso
Radiation Oncology, Aventura Comprehensive Cancer Center,
Aventura Florida, United States of America
R. Ruiz-Cruces, José M. Pastor Vega
Research Group of Radiation Protection, University of Malaga, School of Medicine,
Malaga, Spain
Abstract
In today’s modern practice of Radiation Oncology it is becoming increasingly common to follow many patients
with breast cancer. There is a proven association between prior radiation and the development of breast cancer,
although in many instances the available sources of data are confusing. Characteristic features of radiation
induced breast cancer are the importance of age at first exposure to radiation and the long latency period. The
risk of breast cancer is highest in women exposed in the first decade of life and lessens progressively with
increased age at exposure. The latency period is typically 10 years or more; a time in which other age dependent
factors may influence the expression of the malignant phenotype. Genetic factors may also (in theory) increase a
particular patient’s susceptibility.
1. Introduction and status of the art
1.1. Low dose radiation and breast cancer
There are many reports in the literature addressing the potential role of mantle irradiation and
the development of breast cancer. It has been well established that ionizing radiation can be a
carcinogen for breast cancer. The available data demonstrate that this risk decreases with
increasing age at exposure. There are several sources of data, but the results of these studies
are sometimes contradictory.
1.2. Data on atomic bomb survivors
The sensitivity of the breast tissue to ionizing radiation has been amply demonstrated by
epidemiological studies in Japanese Atomic Bomb survivors[1,2]. There are several reports in
the literature like the Life Span Study sample demonstrating an increased incidence of breast
cancer in this population. There is a strong linear radiation dose response, with the highest
dose-specific excess of relative risk among survivors under 20 years at the time of the blast,
and much higher for patients exposed during infancy. The cancer excess appears to be
confined mainly to the group of women exposed before 40 years of age. A marginally
significant trend was seen among women exposed at 40 years or older.
There is a much weaker association between dose and the prevalence of non-proliferative and
proliferative breast disease. There are some interesting autopsy studies in survivors of the
Atomic Explosions. These studies have been reported by Tokunaga [3] on 225 patients who
received low dose radiation (0.2 Gy kerma), and 88 who achieved high dose radiation (1 Gy
kerma or more). 81% of the Low dose breasts and 74% of the High dose breasts has one or
more non-proliferative lesions, with an statistically significant relationship with dose.
Proliferative disease, and atypical hyperplasia in particular, was also elevated in both groups,
(16% Vs 11%), also with a statistically significant relationship with dose.
Evidence for non-proliferative and in particular proliferative disease is strongest for the group
of ages 40-49 at the time of the explosion.
IAEA-CN-85-17
565
1.3. Occupational exposure to ionizing radiation
The risk of breast cancer among female radiological technologists has been studied, in a
population of 105,000 female radiation workers between 1926-90, including Radiation
therapy technologists, dental X Ray Technologists, fluoroscopy, routine X rays, etc. [4]. The
authors used the American Registry of Radiological Technologists, designing a case control
study. Breast cancer was not significantly increased with occupational exposure in any of
these procedures. there was also no relationship between risk and number of years worked [5-
7]. Studies in Denmark yield comparable results [8].
1.4. Diagnostic exposure to ionizing radiation
There is a controversy about the role of mammograms and radiation induced breast cancer. It
is important to know that an average woman who is screened with mammograms each year for
30 years, beginning at age 40 will have her breast exposed to a total dose of less than 0.1 Gy.
The incidence of breast cancer in female patient with tuberculosis examined with fluoroscopy
after therapeutic pneumothorax in Massachusetts among 5000 women between 1925 and 1954
[9]. Average number of examinations was 88. Increased rates of breast cancer were not
apparent until about 10-15 years after the initial fluoroscopy examination. The excess risk
then remained high trough all intervals of follow up, up to 50 yr. after the first exposure. Age
at exposure strongly influenced the risk, with young women, below 40 at highest risk. (RR
1.06), particularly those between 15-24 yr. The estimated mean radiation to the breast was
79 cGy. There was a strong linear relationship between dose and risk of breast cancer. Danish
researchers found similar results in a case-control fluoroscopy study [10].
A scientific publication in 1995 described a family with a cluster of breast cancer cases
occurring in a generation, and their relationship with repeated fluoroscopic examination
during early childhood and adolescence [11]. The development of breast cancer was correlated
with DNA repair proficiency and history of radiation exposure. The authors conclude that the
findings suggest that there is a susceptibility factor (deficient repair of radiation-induced DNA
damage during G2 phase, like in the cancer prone genetic syndromes) that may interact with
exposures to low-levels of ionizing to increase the risk of developing breast cancer.
1.5. Therapeutic exposure of breast tissue to low dose radiation
The best data available come from Sweden, from patients treated with ionizing radiation for
benign breast disease, between 1924 and 1954. The results of the study have been published in
1993 and 1995 [12]. The cohort consists in 1216 women treated with radiation therapy (mean
dose 5.8 Gy, range 0.003-50.14 Gy), and 1874 patients unexposed to irradiation, who had
benign breast disease. Ages at the time of exposure between 8-74 (median 40 yr.). The total
number of breast cancer observed was 278, of which 95 were in the unexposed cohort. In the
analyses of the dose response relationship, for doses less than 5 Gy there was a clear dose-
response linear relationship, with no threshold. This may support the working hypothesis of
the mechanisms of carcinogenesis that is that it is a single cell origin [13].
At doses higher than 5 Gy there is an increase also, but with a leveling off in the increase of
relative risk, because the cell killing became obvious. This also has been observed in the New
York mastitis study for doses greater than 3 Gy, but in many other studies, this trend has not
been found, but the information that these studies provide on high doses very limited.

IAEA-CN-85-17
566
1.6. Scattered irradiation of contralateral breast tissue in radiotherapy for breast cancer
This issue has also been extensively studied. Boice reported data form the Connecticut tumor
registry, on 41000 women in a typical case control study [5, 14]. The conclusion was that
radiotherapy for breast cancer contributed little to the already high risk for contralateral breast
cancer. In their experience less than 3% of second breast cancer in the cohort can be attributed
to pervious ionizing radiation treatment. The risk however is significant in women who
underwent radiation at a relatively young age (<45 yr.) (RR 1.59). Exposure after the age of 45
entitles a minimal risk of radiation induced breast cancer. Other authors [15,16] have found
similar conclusions. In a attempt to reduce the scatter dose to the contralateral site, Macklis
has developed a breast shield [17].
2. Results
2.1. Therapeutic doses of radiation and breast cancer
Several studies of patients treated for Hodgkin’s disease have shown an increased risk of
second breast cancers [18,19]. Problems with these studies include small patient numbers,
short follow-up time (less than 15 years), incomplete treatment information and an emphasis
in hematological malignancies. Patients treated for Hodgkin’s disease (as opposed to other
malignancies) are at particular high risk of breast cancer because: a) Excellent prognosis for
irradiated patients. b) Young age at exposure that increases the time at risk. c) Exposure at a
physiologically vulnerable puberty period. d)-Large amount of breast tissue that receives
primary or scatter radiation. Several large retrospective reviews of patients treated for
Hodgkin’s disease is now available and provides risk estimates for subsequent breast cancer
and give suggested follow up guidelines.
One of the first reviews was published by Kaldor [20]. He reported the incidence of second
malignancies following treatment of several types of cancer using 11 population-based
registries including over 133,000 patients. No information was available on treatment given or
other risk factors. Overall, the risk of second cancer at least 5 yr. after treatment for Hodgkin’s
disease was 90% greater than expected (415 vs. 218). Breast cancers were increased (62
observed vs. 44 expected. RR=1.4). The incidence peaked between 10-15 yr. of follow up.
The data from the British National Lymphoma Investigation on 2846 patients treated for
Hodgkin’s disease between 1970-1987 was reviewed by Swerdlow [21]. Mean follow up
differed by treatment category causing XRT treated patients to have longer follow up.
113 second primaries were recorded for a RR=2.7. Most of these were hematological (only
6 breast primaries: RR=1.2). Patients treated with radiotherapy alone did not have a increased
leukemia risk. Yahalom [22], form Memorial Sloan Kettering Cancer Center found similar
findings and recommended mastectomy as the treatment of choice for these patients, and
suggest screening mammography 8 years following radiation. Radiation induced breast
cancers did not differ significantly, form the pathological point of view with a cohort of
patients with breast cancers not induced by radiation.
Hancock from Stanford Reviewed records of 885 women treated for HD between 1961-1993
(with a mean follow up of 10 years) [23]. 25 patients developed breast cancer (RR 4.1)
�� Age at time of radiation influenced risk. The biggest RR was for patients younger than
15 years (136), versus 19 for patients ages 15–24, 7 for those between 24–29, and 0.7
for those older than 30.

IAEA-CN-85-17
567
�� Length of Follow up also turned out to be an important factor. If less than 15 years, R=
2.0, versus 13.6 for patients with more than 17 years of follow up.
Chemotherapy increased the risk of breast cancer22/26 cancers arose within or at the margin
of the radiation field. Majority also arose in full dose area (4 Gy).
Leeuwen has reported several analysis on patients treated for Hodgkin’s disease in the
Netherlands [18,24], including a 20yr. follow up study of 1939 between 1966-1986. Overall,
the RR for second cancer was 3.5. The overall risk of breast cancer was not increased
(RR=1.1), but when analyzed by age at irradiation, those with 15 years of follow-up had a
RR=4.1 if treated at age 20-29, compared with RR=41.8 for those treated at age less than 20.
Detailed dosimetrical analysis, including 3-D differential dose volume histogram have been
developed [19,25,26] to determine doses to various parts of the breast in order to develop a
linear model for carcinogenesis. This model attempts to take into account the bimodal dose
distribution within the breast and come up with an integral dose to predict for secondary
breast cancer.
3. Conclusions
1. The RR for developing breast cancer after irradiation for Hodgkin’s disease is somewhere
between 4 and 40 depending on age of exposure and length of follow-up.
2. It is unknown whether the increased incidence represents true disease induction or is a
mere shift in the age curve
3. Chemotherapy might have an additive role, although lack of chemo only treated patients
makes this difficult to assess
4. Vigilant screening is necessary but probably not until 8-10 years following irradiation.
5. There is evidence for non-proliferative and proliferative disease induced by radiation of
the breast parenchyma. The correlation is strongest for the group of ages 40-49 at the time
of the exposure.
6. The excess of breast cancers appears to be confined mainly to the group of women
exposed before 40 years of age.
7. The increased rates of breast cancer are not apparent until about 10-15 years after the
initial exposure.
8. Breast cancer is not significantly increased with occupational exposure to ionizing
radiation
9. For exposures to doses less than 5 Gy there is a clear dose-response linear relationship,
with no threshold
10. At doses higher than 5 Gy there is an increase also, but with a leveling off in the increase
of relative risk, because the cell killing is obvious.
References
[1] Tokunaga, M., et al., Incidence of female breast cancer among atomic bomb survivors,
Hiroshima and Nagasaki, 1950-1980. Radiat Res, 1987. 112(2): p. 243-72.
[2] Tokunaga, M., et al., Incidence of female breast cancer among atomic bomb survivors,
1950- 1985. Radiat Res, 1994. 138(2): p. 209-23.

IAEA-CN-85-17
568
[3] Tokunaga, M., et al., Proliferative and nonproliferative breast disease in atomic bomb
survivors. Results of a histopathologic review of autopsy breast tissue. Cancer, 1993.
72(5): p. 1657-65.
[4] Doody, M.M., et al., Risks of non-Hodgkin's lymphoma, multiple myeloma, and
leukemia associated with common medications. Epidemiology, 1996. 7(2): p. 131-9.
[5] Boice, J.D., Jr., J.S. Mandel, and M.M. Doody, Breast cancer among radiologic
technologists. Jama, 1995. 274(5): p. 394-401.
[6] Geterud, K., A. Larsson, and S. Mattsson, Radiation dose to patients and personnel
during fluoroscopy at percutaneous renal stone extraction. Acta Radiol, 1989. 30(2): p.
201-5.
[7] Doody, M.M., J.S. Mandel, and J.D. Boice, Jr., Employment practices and breast cancer
among radiologic technologists. J Occup Environ Med, 1995. 37(3): p. 321-7.
[8] Andersson, M., et al., Cancer risk among staff at two radiotherapy departments in
Denmark. Br J Radiol, 1991. 64(761): p. 455-60.
[9] Boice, J.D., Jr., et al., Frequent chest X-ray fluoroscopy and breast cancer incidence
among tuberculosis patients in Massachusetts. Radiat Res, 1991. 125(2): p. 214-22.
[10] Storm, H.H., E. Iversen, and J.D. Boice, Jr., Breast cancer following multiple chest
fluoroscopies among tuberculosis patients. A case-control study in Denmark. Acta
Radiol Oncol, 1986. 25(4-6): p. 233-8.
[11] Helzlsouer, K.J., et al., Familial clustering of breast cancer: possible interaction between
DNA repair proficiency and radiation exposure in the development of breast cancer. Int
J Cancer, 1995. 64(1): p. 14-7.
[12] Mattsson, A., et al., Radiation-induced breast cancer: long-term follow-up of radiation
therapy for benign breast disease. J Natl Cancer Inst, 1993. 85(20): p. 1679-85.
[13] UNSCEAR, Sources, effects and risks of ionizing radiation, . 1993, United Nations:
New York. p. 1-992.
[14] Boice, J.D., Jr., et al., Cancer in the contralateral breast after radiotherapy for breast
cancer. N Engl J Med, 1992. 326(12): p. 781-5.
[15] Storm, H.H. and O.M. Jensen, Risk of contralateral breast cancer in Denmark 1943-80.
Br J Cancer, 1986. 54(3): p. 483-92.
[16] Storm, H.H., et al., Adjuvant radiotherapy and risk of contralateral breast cancer. J Natl
Cancer Inst, 1992. 84(16): p. 1245-50.
[17] Macklis, R.M., et al., Reducing scatter radiation to the contralateral breast with a
mobile, conformal shield during breast cancer radiotherapy. Am J Clin Oncol, 1999.
22(4): p. 419-25.
[18] van Leeuwen, F.E., et al., Long-term risk of second malignancy in survivors of
Hodgkin's disease treated during adolescence or young adulthood. J Clin Oncol, 2000.
18(3): p. 487-97.
[19] Janjan, N.A. and D.L. Zellmer, Calculated risk of breast cancer following mantle
irradiation determined by measured dose. Cancer Detect Prev, 1992. 16(5-6): p. 273-82.
[20] Kaldor, J.M., et al., Second malignancies following testicular cancer, ovarian cancer and
Hodgkin's disease: an international collaborative study among cancer registries. Int J
Cancer, 1987. 39(5): p. 571-85.
[21] Swerdlow, A.J., et al., Risk of second primary cancers after Hodgkin's disease by type of
treatment: analysis of 2846 patients in the British National Lymphoma Investigation.
Bmj, 1992. 304(6835): p. 1137-43.
[22] Yahalom, J., et al., Breast cancer in patients irradiated for Hodgkin's disease: a clinical
and pathologic analysis of 45 events in 37 patients [see comments]. J Clin Oncol, 1992.
10(11): p. 1674-81.

IAEA-CN-85-17
569
[23] Hancock, S.L., M.A. Tucker, and R.T. Hoppe, Breast cancer after treatment of
Hodgkin's disease. J Natl Cancer Inst, 1993. 85(1): p. 25-31.
[24] Van Leeuwen, F.E., et al., Second cancer risk following Hodgkin's disease: a 20-year
follow-up study. J Clin Oncol, 1994. 12(2): p. 312-25.
[25] Zellmer, D.L., J.F. Wilson, and N.A. Janjan, Dosimetry of the breast for determining
carcinogenic risk in mantle irradiation. Int J Radiat Oncol Biol Phys, 1991. 21(5): p.
1343-51.
[26] Broeks, A., et al., Increased risk of breast cancer following irradiation for Hodgkin's
disease is not a result of ATM germline mutations. Int J Radiat Biol, 2000. 76(5): p.
693-8.

IAEA-CN-85-181
570
A COMPUTER TOOL FOR DAILY APPLICATION OF THE
LINEAR QUADRATIC MODEL
J. Macías Jaén, P. Galán Montenegro, C. Bodineau Gil
Servicio de Física y Protección Radiológica, Complejo Hospitalario “Carlos Haya” de Málaga, Spain A. Wals Zurita, A.M. Serradilla Gil
Servicio de Oncología Radioterápica, Complejo Hospitalario “Carlos Haya” de Málaga, Spain Abstract
Summary The aim of this paper is to indicate the relevance of the criteria A.S.A.R.A. (As Short As Reasonably
Achievable) in the optimization of a fractionated radiotherapy schedule and the presentation of a Windows�
computer programm as an easy tool in order to:
�� Evaluate the Biological Equivalent Dose (BED) in a fractionated schedule.
�� Make comparison between different treatments.
�� Compensate a treatment when a delay has been happened.
with a version of the Linear Quadratic model that has into account the factor of accelerated repopulation.
Conclusions Delays in the normal radiotherapy schedule is a item that it has to be controlled as possible because
is able to be very important parameter in order to release a good application of treatment, principally when the
tumour is fast growing. It is necessary evaluate them. ASARA criteria is useful to indicate the relevance of this
aspect. Also computer tools like this one, it could help us in order to make this.
1. Introducción
Según ICRU50 el objetivo de cualquier tratamiento en radioterapia es impartir una determinada dosis en el volumen de planificación para que el volumen tumoral clínico quede englobado por la isodosis del 100%, salvando siempre en la medida de lo posible los tejidos sanos adyacentes al volumen tratado. Este criterio que está directamente relacionado con la calidad de tratamiento en radioterapia, proporciona de forma implícita la adecuada protección radiológica al paciente. A parte de consideraciones tales como la verificación del tratamiento diario para minimizar los errores de las distintas fases que intervienen, así como la elección de un fraccionamiento adecuado. Hay una serie de factores que radiobiológicamente tienen gran trascendencia y que por dificultades propias de la carga de trabajo de un servicio pueden no considerarse como es la tardanza en iniciar un tratamiento, paradas durante el mismo por motivos varios como pueden ser averías, empeoramiento clínico del paciente, etc. En este trabajo se presenta una discusión sobre la importancia de considerar este punto. Esto nos ha llevado al desarrollo de una herramienta informática en entorno Windows� basado en el modelo lineal cuadrático que permite evaluar equivalencias radiobiológicas entre tratamientos y calcular la compensación por paradas. El proceso completo (pruebas clínicas y diagnóstico, simulación del tratamiento, dosimetrías clínicas y puesta en tratamiento) para un paciente, se realiza habitualmente con una demora de tiempo entre las distintas fases de que consta. Esto es real y además admisible en muchos casos. No obstante hay situaciones, también reales, no admisibles en las que existe una modificación importante entre los datos tomados en la simulación y los datos reales a la hora de la puesta en tratamiento (adelgazamiento, crecimiento tumoral,...) debido a demoras prolongadas. Este es un aspecto que está al mismo nivel que la elección de dosis y fraccionamiento a la hora de evaluar la optimización del tratamiento. Existen trabajos que abordan el problema de la tardanza inicial y que hablan de efectos deterministas y no

IAEA-CN-85-181
571
deterministas. Se ha propuesto el criterio A.S.A.R.A. (As Short As Reasonably Achievable) [1]. Los efectos no deterministas se pueden producir por una disminución en la probabilidad del control local de la enfermedad así como desarrollo de metástasis. No presentaría umbral mínimo en la tardanza, la probabilidad de ocurrencia aumenta con el aumento del retraso temporal, aunque no su severidad. Los efectos deterministas como la ansiedad y empeoramiento general aumenta con el retraso temporal y quizás podríamos hablar de un umbral mínimo de tiempo, aunque esto último es muy discutible y sobre todo cuando hablamos de efectos psicológicos. El modelo más usado en la actualidad es el modelo lineal cuadrático, que como todos sabemos, tiene una serie de limitaciones que le son inherentes como la incertidumbre de los parámetros radiobiológicos que utiliza, la tasa de radiación, etc. A continuación se expone una de sus versiones donde se define la Dosis Equivalente Radiobiológicamente (D.E.B.) como [2]:
� �K
TTkd
dnDEB ������
�
�
���
�
�
��
��
1 [1]
siendo: n � Número de fracciones totales. d � la dosis por fracción en (Gy). �/� � el cociente de los parámetros lineal y cuadrático del modelo en (Gy). k � factor de corrección debido al crecimiento tumoral (Gy/día). T � Tiempo total del tratamiento en días, (incluyendo festivos).
Tk � Intervalo de tiempo en días a partir del cual se considera repoblación acelerada. Se asume que la repoblación es despreciable antes de Tk, es decir, k=0 para T < Tk.
Esta versión del modelo radiobiológico no tiene en cuenta el factor de reparación incompleta introducido por Thames y Hendry [3]. Esto tiene principalmente relevancia en tratamientos hiperfraccionados en los que el tiempo de reparación celular sea sensiblemente mayor al espaciado temporal entre fracciones del tratamiento. En este modelo los tratamientos hiperfraccionados sólo son modelados en cuanto a la estimación del tiempo total del tratamiento. Se ha elaborado un programa para entornos Windows� que permite de forma cómoda y rápida evaluar el factor D.E.B. de un tratamiento radioterápico, evaluar la equivalencia entre dos esquemas distintos de tratamiento y compensar un tratamiento afecto de determinadas interrupciones. En cualquiera de estas tres vertientes optamos por evaluar la Dosis Equivalente Biológica sobre otros conceptos ampliamente usados como la Dosis Estándar Equivalente (DS) propuesto por Yaes y col [4] ya que DS es un caso particular de equivalencias entre tratamientos a partir de la D.E.B. para el caso estándar del fraccionamiento diario de 2 Gy y para tejidos donde la proliferación tumoral durante el tratamiento sea despreciable. En el caso de tejidos de respuesta aguda sólo se podría aplicar para tratamientos de igual duración. Es por ello que parece mucho más versátil el uso de la DEB. Cuando calcula la equivalencia entre tratamientos respetando la dosis por fracción y

IAEA-CN-85-181
572
calculando un nuevo número de sesiones, usa un método de iteración que implica una incertidumbre en la D.E.B. de 0.01 sesiones. Cuando corrige la dosis por fracción debido a un aumento en el tiempo total del tratamiento, el programa estima un factor de penalización en la DBE que resulta de multiplicar el nº de días de parada por el factor de crecimiento tumoral, indicando siempre esta penalización en porcentaje.
La mejor elección de un tratamiento será aquella que logra una mayor DEB en el tumor y al mismo tiempo una DEB menor en el órgano crítico. Hay evidencias en la literatura [5,6,7] de que la probabilidad de control tumoral disminuye con las interrupciones o retrasos en el tratamiento. Esto llega a suponer alrededor de 1.1 % de detrimento en la DEB por día perdido (mejor estudiado en tumores de cabeza y cuello). La aplicación informática que presentamos nos ayuda, apoyándonos en los métodos de compensación de gap descritos por Hendry et Al [8], a intentar mantener la DEB en el tumor, equilibrándolo con la DEB en los órganos críticos (ventana terapeútica). Estos métodos son:
MÉTODO VENTAJAS INCONVENIENTES Mantener el tiempo total de
tratamiento y la dosis por fracción:
1. Tratar los fines de semana.
2. Administrar dos sesiones al día hasta
ponerse al día.
Se mantiene el tiempo total , el
tamaño de la fracción y el
intervalo de 24h entre fracciones.
Se mantiene el tiempo total, el
tamaño de la fracción.
Aumento de los costes, problemas de
ámbito laboral e imposibilidad de
realizarlo cuando el gap se produce
cerca de la finalización de
tratamiento.
Pérdida potencial de tolerancia en
tejidos de respuesta tardía para
intervalos de 6-8h entre fracciones,
frente a los de 24h. Problemas de
horarios.
Mantener el tiempo total de
tratamiento incrementando la
dosis por fracción: 1. Aumentar el tamaño de la fracción
en tantos días como días de
interrupción ha habido:
Mantener el isoefecto en el tumor.
Mantener el isoefecto en los órganos de
riesgo.
2. Aumentar el tamaño de la fracción
(todas las fracciones con igual dosis)
en los días restantes de tratamiento.
Se mantiene el tiempo total de
tratamiento, se administra una
fracción al día.
Se mantiene el tiempo total de
tratamiento.
Imposibilidad de realización en
esquemas cortos que usen dosis por
fracción elevadas.
Mantener el control tumoral se
traduce en un aumento de las
reacciones tardías.
Mantener el control de las reacciones
tardías se traduce en una
infradosificación del tumor.
Aceptar la prolongación del
tratamiento, administrando una (o más)
fracción extra hasta compensar el gap.
Se mantiene el control local
esperado.
Aumento de las reacciones tardías.

IAEA-CN-85-181
573
Fuera del rango de dosis/fracción comprendido entre 1 y 4 Gy la utilización del modelo lineal cuadrático puede, de acuerdo con las ideas actuales, conducir a resultados erróneos. Por esta razón, su empleo debe quedar circunscrito a los niveles de dosis descritos. El programa puede ser bajado de la red en la dirección http://www.carloshaya.net/servs/fisica/fypri.html. 2. Conclusiones
Normalmente las interrupciones en un tratamiento de radioterapia no es un factor mencionado a la hora de aplicar el tratamiento de la forma más óptima posible. El criterio ASARA recoge este aspecto y, en la medida de lo posible debería ser seguido. Es fundamentalmente útil en el caso de tumores de crecimiento rápido. Podemos hablar de un 1% de detrimento en la D.E.B. por día perdido, por lo que la aplicación de modelos radiobiológicos para optimizar más los tratamientos aplicados es muy importante. En aras de conseguir mejores modelos es necesario también un mayor esfuerzo en el conocimiento de los parámetros que éstos manejan. Referencias [1] Mackillop W.J., Bates J.H.T., O’Sullivan B., Withers H.R., The effect of delay in
treatment on local control by radiotherapy. Int. J. Radiation Oncology Biol. Phys. 34:243-250, 1996.
[2] Colin G. Orton. “Fractionation: Radiobiological Principles and Clinical Practice”, “Treatment Planing Radiation Oncology”. Faiz M. Khan, Roger A. Potish (Willians & Wilkins 1998) Pág. 295-318.
[3] Thames HD, Hendry JH: Fractionation in radiotherapy. Taylor Francis, London, 1987. [4] Yaes R.J., Patel P. Maruyama Y., “On using the linear-quadratic model in daily clinical
practice”. Int. J. Radiation Oncology Biol. Phys. 20:1353-1362;1991. [5] Sinclair J.A., Oates J.P., Dale R.G. “Bed-time charts and their application to the
problems of interruptions in external beam radiotherapy treatments”. Int. J. Radiation Oncology Biol. Phys. 44, 2:381-389; 1999
[6] Krzysztof Skladowski, Rafal Tarnawski, Boguslaw Maciejewski et al. “Clinical Radiobiology of Glottic T1 Squamous Cell Carcinoma”. Int. J. Radiation Oncology Biol. Phys. 43, 1:101-106; 1999
[7] Abdelkarim S. Allal, Chistian de Pree, Pavel Dulguerov et al. “Avoidance of Treatment interruption: An Unrecognizzzed Benefit of Accelerated Radiotherapy in Oropharyngeal Carcinomas”. Int. J. Radiation Oncology Biol. Phys. 45, 1:41-45; 1999
[8] Hendry J.H., Bentzen S.M., Dale R.G., Fowler J.F. et al. “A modelled comparison of the effects of using differents ways to compensate for missed treatment days in radiotherapy”. Clinical Oncology 8:297-307 (1996).

IAEA-CN-85-197
574
TOLERANCE OF THE DIFFERENT STRUCTURES OF THE EYE TO
THERAPEUTIC IONIZING RADIATION
E. Fernandez-Vicioso1, R. Ruiz-Cruces
2 , K. Faulkner
3
1 Radiation Oncology, Aventura Comprehensive Cancer Center,
Aventura, Florida, United States of America 2 Research Group of Radiation Protection, Radiology Department,
University of Malaga, Malaga, Spain 3
Quality Assurance Reference Centre, Newcastle General Hospital,
Newcastle upon Tyne, United Kingdom
Abstract
Primary tumours of the visual apparatus are rare, although radiation therapy of tumours near the eye is becoming
increasingly more common in daily practice. These tumours often incur the incidental irradiation of eye
structures, even when the latter are not clinically involved with the tumour. Depending on the dose and irradiated
volume some damage to the different structures of the visual apparatus may occur. In addition, the time to
expression and severity of injury are dose-dependent. This review analyses the most recent literature and
proposes daily practice guidelines.
1. Eyelashes
The eyelashes serve as end organs of touch; their contact with tiny particles initiates a blink
that protects the eye. Irradiation epilates the lash, and thus abolishes this protective reflex.
This may led to an increased irritation of the conjunctiva and corneal surfaces. Doses of 28
Gy/2 wk with Ortovoltage (100 kVp) may produce permanent depilation. The eyelash may be
spared with megavoltage beams, so the eyelash may be at least partially intact even after 50-
60 Gy prescribed to a point deep to the lid. But doses in excess of 50 Gy to the eyelids may
produce permanent depilation [1].
Like the hair elsewhere, an epilated lash may regrow a different colour, and the new hair may
be sparse and short.
2. Eyelids
The eyelids are the thinnest skin of the body, to allow effortless and rapid motion of the lid.
Any inflammatory or fibrosing process will decrease the flexibility of the eyelid.
Radiation induced eyelid changes commonly consist of skin erythema, progressing to pallor
and teleangiectasia. Chronic structural changes include ectropion, entropion with trichiasis
and closure of the eyelid punctae. It must be remembered that deformity of the eyelid margin
may lead to corneal irritation, which over time may produce severe damage. Changes in the
upper lid are more serious because of the tarsus.
With regard to dosage, permanent alterations are very rare with doses less than 45-50 Gy with
conventional fractionation. In Helium therapy 70% of the tumour dose is given to the eyelid
(35-56 Gy) and almost always produces the acute changes [2].
3. Lacrimal Apparatus
Tears are composed of secretions from the following glands: Major lachrymal gland, close to
the ocular globe, in the upper outer quadrant of the orbit; Accessory lachrymal glands of

IAEA-CN-85-197
575
Krause: conjunctival fornices (superior mainly); Accessory lachrymal glands of Wolfring:
superior aspect of the tarsal plate; Sebaceous Meibomio glands: in both eyelids, mainly in the
superior; Accessory sebaceous glands of Moll and Zeiss, near the eyelid margin, and Goblet
Cells mucinous; scattered throughout the conjunctiva.
The tear film consist of three layers: Superficial lipid: from Meibomio and Zeiss; It helps to
retard evaporation; Middle aqueous: From the accessory (Wolfring and Krause), and major,
and Deep mucinous: to wet the relatively hydrophobic corneal and conjunctival epithelia.
Deficiency of any of the three components leads to a loss of the tear film stability and
potentially may lead to the Dry Eye Syndrome. In this syndrome, patients develop a red
scratchy eye, with foreign body sensation and photophobia. The situation may progress to
corneal epithelial breakdown, ulceration with bacterial infection, neovascularization,
opacification or perforation. Occasionally, phthisis bulbi (Shrinking of the globe) and
symblepharon may be observed.
Most of the patients who develop severe dry eye syndrome, become severely symptomatic
within 1 month after completion of irradiation, and corneal neovascularization and
opacification are often pronounced within 9-10 months after the completion of the X-ray
therapy. In the early stages visual acuity is only slightly impaired. If severe dry-eye syndrome
develops, the vision deteriorates rapidly, and the entire eye becomes vulnerable to bacterial
infection. The lachrymal gland and tissue have a radiation tolerance very similar to that of the
salivary gland tissue. If the fractionated dose to the lachrymal glands and eye is in the range of
32-45 Gy slow changes occur over 4-8 yr, with 25% of patients loosing the eye [3]. Since
most of the basal secretion of tears comes from the accessory lachrymal glands, which are
most plentiful in the upper lid, efforts should be made to shield some of the upper lid, in
addition to the major lachrymal gland (eye retractors).
Although additional information is needed, most patients appear to tolerate doses in the range
of 30-40 Gy. Parsons recently did a review of the literature [4,5] and plotted the numbers with
his own data form University of Florida, shaping a dose response curve: 0% doses <30 Gy;
20% to 40 Gy. Above 40 Gy there is a very steep shape in the curve (50% to 50 Gy; 100% to
57 Gy). There seems to be a lower incidence of these complications when twice a day
fractionation (1.2 Gy twice daily) is used. This phenomenon also decreases side effects in
salivary glands [6].
4. Nasolacrimal draining system
Doses in excess of 50 Gy to the nasal portion of the eyelids can, in theory, result in blockage
of the nasolacrimal system resulting in epiphora, as a result of desquamation of the epithelium
of the ducts, with the subsequent inflammation that may lead to fibrosis and stenosis. The
literature is very scanty but some authors [7] have not seen any problems of that sort with
doses below 60 Gy. This relative ability to preserve the ductal function is an argument in
favour of X-ray therapy for patients with malignant lesions near or involving the tissues
around the nasolacrimal duct and sac. It is important to remember that in some of these
patients prior surgery may have altered the integrity of the nasolacrimal draining system.

IAEA-CN-85-197
576
4. Cornea
The cornea is the main refractive element of the eye; a decrease in the corneal clarity, in
particular when it involves the central axis, results in diminished vision. Radiation induced
changes (excluding those caused by a dry eye) do not depend on vascular damage, but only on
disruption of the mitotic activity in the epithelial and connective tissue layers. There are five
layers in the cornea: epithelium, Bowman’s membrane, corneal storm, Descemet’s membrane
and endothelium. The anterior epithelium thins with X-ray therapy and may develop tiny
ulcers (punctuate keratitis), after a dose of 30-50 Gy. Keratitis may happen by the end of
treatment of right after, and lasts 4-6 weeks; patients do have anterior segment triad (increased
blinking, lacrimation and photophobia). With appropriate ophthalmologic care usually the tiny
ulcers do not coalesce, but it may happen, developing a corneal ulcer. With doses of 60 Gy the
risk of corneal ulceration is 15-20%, but this number is increased when chemotherapy is
added. Edema of the corneal stroma may appear after dose of 30-50 Gy, but it is transient, and
subsides within a month, but with high doses 80 Gy, it may be permanent
A recent work present a clinicopathological correlation between corneal perforation and late
radiation therapy-induced corneal necrosis in a male adolescent treated for orbital
rhabdomyosarcoma[8].
5. Sclera
The sclera is relatively radioresistant. The main effects of X-ray therapy are related to
episcleral plaques used for the treatment of coroidal melanoma. The effects are loss of
episcleral vessels, scleral thinning and perforation. Treatment of the scleral thinning is aimed
to restore or preserve the integrity of the globe. Loss of 50% of the scleral thickness may
require a conjunctival graft to cover the defect [1].
6. Uvea
Irradiation of the iris and uveal structures to cancerous doses may lead to vascular changes
such as neovascularization, rubeosis iridis and iridociclitis, resulting in an imbalance between
aqueous production and absorption ending in glaucoma. Neovascular glaucoma may result in
a rapid loss of vision; sever pain (nailing) and headache. It may progress to blindness.
7. Lens
The lens is a biconvex refractive structure located behind the pupil, 1-1.5 mm anterior to the
fleshy cantus. Normal lens epithelial cell lie beneath the anterior capsule and equator only.
The germinal layer is located at the equator and is the most sensitive layer to radiation,
because these are the cells that have active proliferation, as opposed to the anterior epithelial
cells that seldom divide). Radiation damage to the germinative zone of the lens epithelial cell
DNA is probably responsible for most post-treatment cataracts. In addition to DNA damage,
direct cytoplasmic effects, such as disruption of membrane channels protein cross-linking, and
ion pump abnormalities are also important in the post radiation cataract progression.
Abnormal epithelial cells, termed Wedl cells, migrate posteriorly and form a posterior
subcapsular opacity (due to retaining their nuclear detrie). Older patients may develop
cataracts sooner because possible pre-existing DNA damage. The proportion of cell damage
necessary to cause a cataract is unknown. In Helium treated patients, exposure of less than
25% of the lens in the field can cause cataract.

IAEA-CN-85-197
577
In general the latency and frequency of lens opacities are a function of radiation dose. In most
human studies, fractionated doses less than 5 Gy have not produced visually significant lens
opacities. Does of 3 Gy/1 fraction may cause cataract. With fractionated X-ray therapy (1.5-
2.0 Gy/fraction) to a dose of 12-14 Gy (fractionated total body irradiation) the risk is 10%.
Due to the technical difficulties associated with electron attenuation, some authors have
postulated the use of ortovoltage instead of electrons for patients with cutaneous tumours near
of the ocular zone. Although paradoxically, there are very recent works that describe
preservation techniques of the crystalline lens in patients with retinobastoma, based on
electrons treatment [9].
Cataracts in young children may cause significant ambyopia before surgery can be performed.
There is a second mechanism for cataracts but it is usually not in the therapeutic range. It is
related to metabolic damage secondary to X-ray therapy-induced to the anterior epithelium
(where all the lens nutrients pass throughout).
8. Retina
The neurosensorial retina consists of an extensive network of neural glial and vascular
elements.
Radiation induced retinopathy presents a clinical picture similar to that seen in diabetic
retinopathy. Retinal injury after high-dose radiation usually is not expressed clinically for 1.5-
3.0 years after irradiation during which time visual acuity often remains normal. Some
patients with radiation retinopathy develop vasoproliferation of the anterior surface of the iris,
and into the angle of the eye (rubeosis iridis). Anterior segment neovascularization is
postulated to have the same cause as posterior segment neovascularization, namely, a
vasoproliferative factor [5]. Retinal ischemia and hypoxia result in the development of a
diffusible vasoproliferative factor, which is presumed to lead to retinal and optic nerve head
neovascularization. The findings in fundoscopic exam are: retinal ischemia, edema,
microaneurysm formation, capillary dilatation, haemorrhage, cotton-wool spots,
teleangiectasis and retinal or optic nerve head neovascularization.
Acute ultrastructural changes have been studied in Rats irradiated and whose eyes were
enucleated 1h to 1 month following X-ray therapy (2-20 Gy X-rays, single dose). Acutely, rod
photoreceptors (not Rod Givens) were the most sensitive retinal cells. The outer segments
developed small membranous whorls 1 h after receiving 2 Gy. These membrane changes were
dose dependent. Photoreceptor death occurred at doses over 10 Gy/1fraction. Retinal pigment
epithelium cell damage, manifested by mitochondrial swelling, became apparent after doses
over 5 Gy/1fraction. Retinal pigment epithelial cell death did not occur following doses of less
than 20 Gy/1fraction. In contrast, the inner retinal neurons and vascular cells showed no
ultrastructural changes within the time and doses tested. Repair (evidenced by a decrease in
the number of whorls), was noted 1 week following XRT with small doses such as 2 Gy.
The University of Florida recently reported their experience on 64 patients (68 retinas)
exposed to therapeutic irradiation by techniques that did not produce severe dry-eye
complications. Radiation retinopathy was not seen at doses below 45 Gy but increased
steadily in incidence at doses of 45 Gy and above, being very steep above 50 Gy. Between 45
and 55 Gy there was a strong dependency on the dose per fraction (>1.9 Gy) and patients who
received chemotherapy. The lowest dose associated with retinopathy was 45 Gy in a diabetic

IAEA-CN-85-197
578
patient. Fraction sizes of 2.25 Gy or more may lead to earlier and more severe changes (at
45 Gy) [5].
Nakissa et al, reported data on patients who received different doses of X-ray therapy to the
retina: All patients who received over 45 Gy to the posterior pole had recognizable changes,
but most of these did not affect vision. Decreased visual acuity occurred only in patients
receiving over 65 Gy. At 60 Gy 50% of the patients displayed some visual changes, and at 80
Gy 85-90% did [10].
Despite the use of 1.8-2.0 Gy/fractions, dose inhomogeneities can be considerable in orbital
treatments (up to 20-25%). This can potentially lead to portions of the retina/globe receiving
>2.4 Gy/day) despite the fact that much of the treatment volume receives <2 Gy/day) [11].
Panretinal laser photocoagulation is used to treat severely ischemia, irradiated eyes in an
attempt to control neovascular glaucoma, although the precise indications and efficacy of this
treatment are uncertain. The identification of a vasoproliferative factor may lead to
pharmacological interventions
9. Optic Nerve
Radiation optic neuropathy is mainly a vascular ischemic phenomenon, caused by vascular
occlusive disease. Patients with pre-existing small vessel disease are at increased risk for this
complication. It presents as painless monocular loss of vision that is usually sudden, although
it may follow transient episodes of blurring.
The dose per fraction is a very important determinant in the development of optic neuropathy.
In stereotactic radiosurgery it has been proven that the tolerance of the optic nerve is unusually
lower than that of the other cranial nerves [12]. A single dose of 7 Gy may lead to blindness.
Nevertheless, the dose quoted by Cassady and Loeffler for tolerance of the optic nerve and
chiasm is 8 Gy [13].
Several institutions have reported their experience in the case of fractionated radiotherapy;
With doses below 50 Gy the only optic neuropathies reported are in patients with pituitary
tumours (and probably some pre-existing damage to the optic tract), who have received dose
per fraction of 2.25 Gy or higher, or chemotherapy. With doses above 60 Gy there is a steep
increase in the incidence of optic neuropathy (at least 15-20% and upwards) [4,14].
10. Orbit
The orbit forms a bony cavity in the skull that houses the globe, extraocular muscles,
intraorbital portion of the optic nerve and the orbital fat. Late effects of X-ray therapy on the
bony orbit are seen primarily when external beam is applied to the growing facial bones of
children, as in the treatment of retinoblastoma or rhabdomyosarcoma. Radiation arrests the
bone growth of the orbit, leading to bony hypoplasia and atrophic soft tissue changes. The
degree of hypoplasia appears to be inversely related to the patient age at the time of the
treatment.
In a typical setting, the mid section of the face and involved orbit are hypoplastic. This is
manifest by decreased vertical and horizontal orbital diameters, hypoplasia of the nasal bridge
zeugmatic bone, and temporal fossa.

IAEA-CN-85-197
579
The tip of the nose and nasal alae grow normally, despite the flattened nasal bridge, leading to
an increased nasal angle. The frontal bone also grows normally and it appears to be
disproportionately prominent. Children older than 3 yr are less severely affected. Midfacial
hypoplasia is slightly less common following megavoltage as compared with ortovoltage
irradiation.
Fat atrophy and fibrosis may result in enophthalmos. Mucous membrane contracture may lead
to forthshortening of the fornices and symblepharon formation. (30% after 60 Gy megavoltage
irradiation). In cases of enucleation followed by irradiation, the anophthalmic socket is
exacerbated; X-ray therapy induced atrophy and contraction of the soft tissues lead to further
volume loss, poor prosthetic fitting, and in some cases complete obliteration of the fornices.
Secondary neoplasms
Children with heritable retinoblastoma secondary to a germline cell mutation, have cancer
predisposition due the loss of retinoblastoma tumour suppressor gene in every cell in the
body.
Tucker did a dose effect study for second tumours. The relative risk was 1.3 with less than 10
Gy; 12.7 between 10-40 Gy, and 19.4 after doses of more than 40 Gy [1]. These investigators
did not found a difference in second tumour development when Ortovoltage or megavoltage
were used, and chemotherapy (Cyclophosphamide) exerts an additive effect. New papers exist
in the fact that patient with retinoblastoma that they received radiotherapy they didn't develop
a second tumour [15,16].
References
[1] Gordon KB, Char DH, Sagerman RH: Late effects of radiation on the eye and ocular
adnexa. Int J Radiat Oncol Biol Phys 1995; 31(5): 1123-39.
[2] Schlienger P, Brunin F, Desjardins L, Laurent M, Haye C, Vilcoq JR: External
radiotherapy for carcinoma of the eyelid: report of 850 cases treated [see comments]. Int
J Radiat Oncol Biol Phys 1996; 34(2): 277-87.
[3] Martinez-Morillo M, Pastor JM, Fernandez-Vicioso E, Ruiz-Cruces R: Radioterapia de
cara y cuello. In: Mosby/Doyma, ed. Radiología Clínica. Barcelona, 1994; 545-566.
[4] Parsons JT, Bova FJ, Fitzgerald CR, Mendenhall WM, Million RR: Radiation optic
neuropathy after megavoltage external-beam irradiation: analysis of time-dose factors.
Int J Radiat Oncol Biol Phys 1994; 30(4): 755-63.
[5] Parsons JT, Bova FJ, Mendenhall WM, Million RR, Fitzgerald CR: Response of the
normal eye to high dose radiotherapy [see comments]. Oncology (Huntingt) 1996;
10(6): 837-47; discussion 847-8, 851-2.
[6] Leslie MD, Dische S: The early changes in salivary gland function during and after
radiotherapy given for head and neck cancer. Radiother Oncol 1994; 30(1): 26-32.
[7] Sagerman RH, Fariss AK, Chung CT, King GA, Yuo HS, Fries PD: Radiotherapy for
nasolacrimal tract epithelial cancer. Int J Radiat Oncol Biol Phys 1994; 29(1): 177-81.
[8] Chaques VM, Saornil MA, Herreras JM: Corneal perforation due to late radiation
therapy-induced corneal necrosis--clinicopathological correlation. Ocul Immunol
Inflamm 2000; 8(1): 67-71.
[9] Steenbakkers RJ, Altschuler MD, GJ DA, Goldwein JW, Kassaee A: Optimized lens-
sparing treatment of retinoblastoma with electron beams. Int J Radiat Oncol Biol Phys
1997; 39(3): 589-94.
IAEA-CN-85-197
580
[10] Nakissa N, Rubin P, Strohl R, Keys H: Ocular and orbital complications following
radiation therapy of paranasal sinus malignancies and review of literature. Cancer 1983;
51(6): 980-6.
[11] Messmer EP, Fritze H, Mohr C, et al.: Long-term treatment effects in patients with
bilateral retinoblastoma: ocular and mid-facial findings. Graefes Arch Clin Exp
Ophthalmol 1991; 229(4): 309-14.
[12] Bellmann C, Fuss M, Holz FG, et al.: Stereotactic radiation therapy for malignant
choroidal tumors: preliminary, short-term results. Ophthalmology 2000; 107(2): 358-65.
[13] Fernandez-Vicioso E, Suh JH, Kupelian PA, Sohn JW, Barnett GH: Analysis of
prognostic factors for patients with single brain metastasis treated with stereotactic
radiosurgery. Radiat Oncol Investig 1997; 5: 31-7.
[14] Tao ML, Barnes PD, Billett AL, et al.: Childhood optic chiasm gliomas: radiographic
response following radiotherapy and long-term clinical outcome. Int J Radiat Oncol Biol
Phys 1997; 39(3): 579-87.
[15] Pradhan DG, Sandridge AL, Mullaney P, et al.: Radiation therapy for retinoblastoma: a
retrospective review of 120 patients. Int J Radiat Oncol Biol Phys 1997; 39(1): 3-13.
[16] Kao LY, Tsang NM: Advanced bilateral retinoblastoma treated conservatively with lens
sparing external beam radiation therapy: report of three cases. Chang Keng I Hsueh Tsa
Chih 1999; 22(1): 100-5.

IAEA-CN-85-18
581
INFLUENCE OF DOSE PER FRACTION ON 7 DAYS PER WEEK
FRACTIONATION IN RADIOTHERAPY
M. Vilches, D. Guirado
Servicio de Radiofísica, Hospital Clínico “San Cecilio”, Granada, Spain Abstract
To evaluate the effect of the dose per fraction in a radiotherapy schedule of 7 fractions per week, and compare it
with a conventional one of 5fr/w, 2Gy/fr, we use computer simulations methods taking into account the tumor
proliferation. We have a significant increase of TCP with regard to te conventional schedule for 7 days per week
programmes in which the dose per fraction is =1.7 Gy.
1. Introduction
In the radiotherapy of some tumors, like head and neck cancers, it is a fact that the overall
treatment time has a great influence on the local control. Therefore, an increase in the
prescribed treatment time produces a significant fall of the tumor control probability. The
reason of this is to find in the malignant clonogens proliferation, which can be, in certain
cases, very important in the final phase of the treatment, in which the doubling time reaches
values of a few days [1,2]. Consequently, it is reasonable to conclude that a shortening of the
duration of schedules can increase the effectiveness of the radiotherapy. This is the accelerated
fractionation, which, in its pure version, consists in a shortening of the overall treatment time
without reducing the fraction size or the total dose. This can be acomplished by delivering
more than one daily fraction five days per week or one daily fraction six or seven days per
week. However, the concept of accelerated fractionation has been extended to include other
fractionated schedules like the continuous hyperfractionated accelerated radiotherapy
(CHART), split-courses, concomitant boost and those in which the total dose delivered per
week is progressively increased during the course of treatment [3].
The results of randomized clinical trials have been published for complex schedules [4,5],
however, we do not have clinical results of more simple ones, like those in which the dose per
week is progressively increased. Although the examinated schedules in references [4] and [5]
show that the tumor clonogen proliferation is determinant in the therapy effectiveness, these
schedules produce a high toxicity, what suggests the need of analyzing other ways of
shortening the overall treatment time.
One of the most simple accelerated schedules which can be designed consists in a daily
irradiation every day of the week. Using daily fraction of 2 Gy, the high incidence of severe
acute reactions and consequential late effects suggests that this schedule gives an unacceptable
toxicity [6]. Nevertheless, it is possible to shorten the treatment time decreasing the dose per
fraction and maintaing the total dose and the seven days per week programme, for example,
reducing from 2 to 1.8 Gy the dose per fraction, although results of this kind of schedule are
not available yet [7].
The aim of this study is to evaluate the influence of dose per fraction in 7 days per week
fractionated schedules. For that, we will use computer simulation methods based on Monte
Carlo techniques.

IAEA-CN-85-18
582
2. Material and methods
To obtain realist results we will use, there where necessary, the data for multicellular tumor
spheroids of the MCF-7 breast cancer which our group has studied for the last years [8].
We make the computer simulation of a fractionated treatment similar to the actual situation in
which, after surgery of the tumor, the malignant clonogens cluster in microscopical aggregates
before the treatment. Two thousand virtual tumors which contain between 5000 and 50000
clonogens are produced according to a uniform distribution, this implies tumors diameters
between 0.5 and 1 mm. This sort of distribution is the best one to reproduce the experimental
data obtained for the sizes of the MCF-7 spheroids. This number of tumors guarantees a
correct statistical behaviour. The growth is introduced by the exponential model for different
values of doubling time (TD). For each dose per fraction we calculate the mean surviving
fraction (SF) by the linear-quadratic model. Possible differences in the response of the tumor
clonogens to the radiation for each tumor of the sample have to be considered. These
differences can be due to the distinct locations, components and hypoxia in a true situation. In
order to take into account this fact, we assign a value of SF to each one of the sample tumors
normally distributed around the mean value, and with a standard deviation that implies
maximum differences of 10% in relation to the mean. The irradiation programme is simulated
by considering that the cell proliferation and cell death are described by binomial statistics.
The probability of tumor cure is determined by counting the proportion of tumors containing
no surviving clonogens at the end of treatment. In order to make the final analysis of the
control data which the simulation provides, and to compare the different fractionated
schedules, we will use the logistic model which, although it does not have biological base, fits
well the data.
3. Results
Following the described method, we have analyzed a conventional schedule, 2 Gy daily
irradiation from Monday to Friday, and 7 fractions per week with a daily irradiation between
1-2 Gy.
In all the simulations the parameters values used for the linear-quadratic model are the ones
obtained through clonogenic assay for monolayer culture of the MCF-7 cell line, á = 0.32 Gy-1
and â = 0.023 Gy-2
[9].
The TCP results have been fitted by means of the logistic model. The smallest obtained value
for the goodness of these fits is r2=0.9996. In Figure 1 we can see some cases of the
simulation results and their fits by the logistic model for a conventional and accelerated
schedule, for TD = 4 d and TD = 15 d. The dose per fraction is 2 Gy in the four cases.
By using the fit results for given values of TD an dose per fraction, we have calculated the
TCP for an accelerated programme in which the total dose is the same to the one which
produces a TCP = 0.5 according to a conventional schedule of 5 fraction per week of 2 Gy.
Figure 2 shows the results of this calculation for several doubling time values and doses per
fraction that are between 1 and 2 Gy. Here we represent the level of TCP = 0.5, in order that
we can see immediately whether a given schedule of 7 fraction per week is more effective
than the corresponding one to the same doubling time for conventional fractionation.

IAEA-CN-85-18
583
For doubling times between 4 to 30 days, and for the conditions in which the simulation has
been carried out, we have a significant increase of TCP with regard to the conventional
schedule for schedules of 7 days per week in which the dose per fraction is =1.7 Gy. For a
dose per fraction of 1.7 Gy, the TCP increase in relation to TCP = 0.5 of the conventional
programme is 2.94% for TD = 15 d and 22.4% for TD = 4 d; for a dose per fraction of 2 Gy the
increase is 14.36% for TD = 15 d and 53.48% for TD = 4 d.
4. Discussion
In the simple case studied in this work, two factors contribute to the loss of tumor control
when the dose per fraction is reduced: the first one is the increase of the overall treatment time
and, as a result, it is related to the tumoral proliferation; the second one is a value of the â
parameter in the linear-quadratic model greater than 0. This second factor produces that the
TCP decreases in the 7 fractions per week, in relation to the conventional schedule, for a dose
per fraction which in the first one gives rise to an overall treatment time equal to the second
one. Thus, the total dose which produces a TCP = 0.5 for the conventional schedule is aprox.
40 Gy (we always suppose that the treatment starts on Mondays); to deliver this same dose in
an identic time according to the 7 fractions per week schedule, we have to use a dose per
fraction of 1.54 Gy which, if â is equal to 0, would also produce a TCP = 0.5, however, with
the á and â values used in this work, the result for TCP is 0.46 (see Figure 2). In conclusion, a
â parameter value greater than 0 produces a decrease of the effectiveness of the shortening in
the overall treatment time in an accelerated schedule in which the dose per fraction is smaller
than 2 Gy.
15 20 25 30 35 40 45 50 55 60
0.00
0.25
0.50
0.75
1.00
TD=4 d, 5 fr/w
TD=15 d, 5 fr/w
TD=4 d, 7 fr/w
TD=15 d, 7 fr/w
Total dose (Gy)
Tum
or
contr
ol pro
babili
ty
Figure 1: Comparison of TCP's obtained in seven and five fractions per week schedules for TD equal to 4 and
15 days, such as indicated in the graph. The curves fits the data according to logistic model.
We wonder whether a model like the Poisson model is able to reproduce these results or, more
generally, whether we have the need of employing simulation methods in order to estimate the
effect of a therapeutic programme. In the case mentioned above, where TCP is 0.34, the
predicted value by the Poisson model is 0.30. This result is not surprising because the Poisson
model underestimates the cure capacity when proliferation occurs (see Tucker et al.[10]). As
we see, the TCP variation is of 13%, but this is not the only limitation of Poisson model. The
simulation methods, based on Monte Carlo thechniques, let us reproduce true situations where
a great statistical variability of the more outstanding parameters is frequent, what cannot be
done by means of simple analytical models.

IAEA-CN-85-18
584
1.0 1.2 1.4 1.6 1.8 2.0
0.0
0.2
0.4
0.6
0.8
TD=4 d
TD=6 d
TD=15 d
TD=30 d
Dose per fraction (Gy)
Tum
or
contr
ol pro
babili
ty
Figure 2: For a given value of TD, each point represents the TCP of an accelerated programme with a
given dose per fraction if it is reached the same total dose which produces TCP = 0.5 for a conventional
schedule, 5fr/w 2Gy/fr. The curves are obtained fitting a polynomial funtion of degree 4. Uncertainties
correspond to one standard deviation and are smaller than the symbols which represent points.
In summary, it is possible to obtain a therapeutical gain using accelerated schedules of 7
fractions per week with dose per fraction under 2 Gy, this can produce a reduction of the
complications. Thus, making randomized clinical trials can be considered in order to compare
these schedules to the conventional ones. On the other hand, and if we take into account the
accelerated repopulation in some tumors like head and neck cancers, it is possible that the use
of 7 fractions per week schedule only for the last weeks of treatment increases the tumor
control rate. At the moment we are studying this with similar methods to the ones used in this
preliminary work.
Acknowledgements
The valuable assistance of Mrs Carmen de Haro in preparation of the manuscript is gratefully
acknowledged.
References
[1] Withers JM, Taylor JMG, Maciejewski B. The hazard of accelerated tumor clonogen
repopulation during radiotherapy. Acta Oncol 1988; 27: 131-146.
[2] Fowler JF, Lindstrom MJ. Loss of local control with prolongation in radiotherapy. Int J
Radiat Oncol Biol Phys 1992; 23: 457-467.
[3] Ang KK. Accelerated fractionation: what is the price for speeding? Radiother Oncol
1997; 44: 97-99.
[4] Dische S, Saunders M, Barrett A, Harvey AS, Gibson D, Parman M. A randomized multi-
centre trail of chart vs conventional radiotherapy in head and neck cancer. Radiother Oncol
1997; 44: 123-136.
[5] Horiot JC, Bontemps P, van den Bogaert V, et al. Accelerated fractionation (AF)
compared to conventional fractionation (CF) improved head and neck cancers: results of the
EORTC 22851 randomized trial. Radiother Oncol 1997; 44: 111-121.
[6] Maciejewski B, Skladowski K, Pilecki B, et al. Randomized clinical trial on accelerated 7
days per week fractionation in radiotherapy for head and neck cancer. Preliminary report on
acute toxicity. Radiother Oncol 1996; 40: 137-145.

IAEA-CN-85-18
585
[7] Kaanders JHAM, van der Kogel AJ, Ang KK. Altered fractionation: limited by mucosal
reactions? Radiother Oncol 1999; 50: 247-260.
[8] Villalobos M, Aranda M, Núñez MI, et al. Interaction between ionizing radiation,
estrogens and antiestrogens in the modification of tumor microenvironment in estrogen
dependent multicellular spheroids. Acta Oncol 1995, 34: 413-417.
[9] Núñez MI, Villalobos M, Olea N, et al. Radiation-induced DNA double-strand break
rejoining in human tumor cells. Br J Cancer 1995; 71: 311-316.
[10] Tucker SL, Thames HD, Taylor JM. How well is the probability of tumor cure after
fractionated irradiation described by Poisson statistics? Radiat Res 1990; 124: 273-282.

IAEA-CN-85-46
586
PALLIATIVE RADIATION THERAPY FOR OVERLOADING RADIOTHERAPY
CENTRE, ESPECIALLY FOR DEVELOPING COUNTRY
M. Myo
Yangon General Hospital, Myanmar
Susworo
International Atomic Energy Agency, Vienna
T. San
Radiotherapy Department, Yangon General Hospital, Myanmar
Abstract
In developing country, most of the cancer cases are diagnosed in the advanced stages. So, the palliative radiation
therapy is the only choice of therapy for these inoperable cases where the chemotherapy is not effective or
affordable. In conventional radiation therapy, daily dose of 200 cGy for total 4000 cGy in more than 20 fractions
(sometimes, up to 6000 cGy) is used. By using Linear-quadratic model theory of cell killing by radiation, it can
be calculated early and late effects by using alpha and beta ratio. This theory is still the best for radiation cell
killing until the new detail one is discovered. These data are obtained by experimental as well as clinical results.
The effective radiation dose can be calculated by using the data to different organs which if involved in the
radiation fields. This can change the daily dose to palliative cases in which the late effect is unnecessary. The
daily doses can be 300, 400, 500, and sometimes 1000 cGy per single fraction. These modalities are well
documented. It is recommend to change the short term high-dose palliative radiation therapy instead of using
conventional palliative radiation therapy in overloading radiotherapy centre, especially for developing country.
The reasons are mainly radiation protection aspect, not only for the patients and those who involved with the
radiation therapy but also to reduce the unnecessary radiation exposure to the environment.
1. Introduction
Ideally, a teletherapy machine can usually treat about 40 patients a day, each patient taking
about 15 minutes [1]. In the developing countries, very few teletherapy machines have to treat
a large number of patients. For example, Myanmar has three radiotherapy centres and the
largest is Yangon General Hospital (YGH). YGH has two functioning teletherapy machines,
both cobalt 60 machines. Each machine must treat 120±20 patients a day, each patient taking
less than 11 minutes. As principle, radiotherapy treatments are curative and palliative.
Curative radiation treatment is 200 cGy per day for 6000 to 6600 cGy, conventionally.
Sometimes, 7000 to 8000 cGy depends on the radiation field size and anatomical location [2].
Palliative radiation treatment is conventionally 200 cGy per day for 4000 cGy. The short term
treatment, for example, contains 300 cGy for 10 fractions, 400 cGy for 5 fractions, 500 cGy
for 4 fractions or sometime with preradiation medication 1000 cGy for single fraction
especially in the pelvic area [3].
By using Linear-quadratic model theory of cell killing by radiation, it can be calculated early
and late effects by using alpha and beta ratio [4]. This theory is still the best for radiation cell
killing until the new detail one is discovered. These data are obtained by experimental as well
as clinical results [5]. The effective radiation dose can be calculated by using the data to
different organs which if involved in the radiation fields. This can change the daily dose to
palliative cases in which the late effect is unnecessary.
2. Method
Linear-quadratic model theory of radiation cell killing composes surviving fraction radiation
dose are related linearly and quadratically [4].
IAEA-CN-85-46
587
S = e (-aD -bD2)
In this equation, S is the fraction of cells surviving a dose D, and a and b are constants.
aD = bD2, or D = a/b
There are two components of cell killing: one is proportional to dose (aD), while the other is
proportional to the square of the dose (bD2). The dose at which the linear and quadratic
components are equal is the ratio a/b.
The deriving formula is biological effective dose (BED).
BED = D (1+d/(�/b)) dose in Gy.
D is total dose and number of fractions(n) multiples to daily dose (d).
D = nd
Alpha-beta ratio is roughly 10 for acute reaction tissue and tumour tissue, 3 for late
responding tissue. The detail data varies with different experiments, different organs and
clinical observations. By using this formula, BED is calculated for short term palliation for
pelvic diseases. The results are as follow.
3. Results
By using BED formula and alpha-beta ration the following doses obtained,
BED = 40 (1+2/10) = 48 Gy
BED = 30 (1+3/10) = 39 Gy
BED = 20 (1+4/10) = 28 Gy
BED = 20 (1+5/10) = 30 Gy
BED = 10 (1+10/10) = 20 Gy
If 40 Gy with 2 Gy per fraction the BED = 48 Gy is normalised, the total fractions for 3 Gy
per fraction with BED 48 Gy can be calculated as following;
D =BED/ (1+d/10) = 48/(1+3/10) = 36.9 Gy, approximately 12 fractions
For 4 Gy per fraction;
D =BED/ (1+d/10) = 48/(1+4/10) = 34.2 Gy, approximately 8 fractions
For 5 Gy per fraction;
D =BED/ (1+d/10) = 48/(1+5/10) = 32 Gy, approximately 6 fractions
For 10 Gy per fraction;,
D =BED/ (1+d/10) = 48/(1+10/10) = 24 Gy, approximately 2 fractions
4. Discussions
By using the linear-quadratic model and BED equation, the total fractions are higher than the
conventional fractions. To get the effective palliative to the patients by daily high dose
fractionation, it should give more fractions than the conventional fractions with same dose per
fraction. On the other hand, the field size, the field site and organs at risk, and interval
IAEA-CN-85-46
588
between fractions are very important factors to be considered for short term palliative
radiation. To give short term high-dose palliative radiation therapy, radiation oncologist
should consider not only biological effective dose based on linear-quadratic model but also his
cleaver clinical judgement.
5. Conclusion
It is recommend to change the short term high-dose palliative radiation therapy instead of
using conventional palliative radiation therapy in overloading radiotherapy centre, especially
for developing country. The reasons are mainly radiation protection aspect, not only for the
patients and those who involved with the radiation therapy but also to reduce the unnecessary
radiation exposure to the environment.
References
[1] Manual on high energy teletherapy; International atomic energy agency, March
[2] PEREZ, C. A., BRADY, L. W., Principles and practice of Radiation Oncology,
J.B.Lippincott, Philadelphia (1992) 208 pp.
[3] PEREZ, C. A., BRADY, L. W., Principles and practice of Radiation Oncology,
J.B.Lippincott, Philadelphia (1992) 1495 pp.
[4] ELKIND, M. M., The initial part of the survival curves: does it predict the outcome of
fractionated radiotherapy? Radiat Res 144 (1988) 425.
[5] FOWELER, J. F., The linear-quadratic formula and progress in fractionated
[6] radiotherapy. Br J Raiol 62 (1989) 679-694.

IAEA-CN-85-36
589
DOSE DISTRIBUTION OVER THE RADIATION FIELD AND ORGANS OF THE
BODY DURING RADIOTHERAPY PROCEDURES
S. Roy1, A.S.M.Ambia
2, S. Akhter
2, H. Banu
2 M. Begum
1
1 Health Physics and Radiation Monitoring Laboratory,
Bangladesh Atomic Energy Commission, Atomic Energy Centre campus,
Dhaka, Bangladesh 2 Department of Physics, Chittagong University, Chittagong, Bangladesh
Abstract
Beam profile of the 60Co teletherapy unit for 10 cm X 10 cm along central axis was measured to study the
symmetry of the gamma beam and found that the average dose was 98.44+1.40 mGy. Output dose versus field
size was also measured and values were found reasonable. Dose prescription to delivery was measured by placing
TLD onto the treatment field for lung and cervix cancer patient which was found to be 39.16+2.98 Gy and
50.48+ 3.68 Gy respectively which are within 2 % and 0.17 % of the prescribed dose as 40.00 and 50.40 Gy
respectively, reveals good agreement with the treatment planning. Six typical types of patients both male and
female with cancers in lung, larynx, breast, cervix, oesophagus and brain treated with 60Co teletherapy were
particularly considered for dose assessment at different critical organs of interest. It was observed that the doses
to the lens of eye with a maximum value of 460.35+78.87 mGy for a larynx cancer patient to a minimum value of
30.80+4.00 mGy of a cervix cancer patient. Doses to the gonad vary with a maximum value of 3810.80+389.76
mGy for a cervix cancer patient to a minimum value of 8.20+1.00 mGy for a brain cancer patient.
1. Introduction
Ionizing radiation is being used worldwide as essential tools for protecting and improving
human health. It is estimated that medical applications of radiation account for about 95% of
the exposure to radiation from man-made sources (as reported by UNSEAR). The objective of
radiotherapy is to ensure that the target tissue is given the prescribed dose keeping minimum
dose to surrounding health tissue. The success or failure of radiotherapy depends upon the
accuracy of radiation dose to tumour volume. Radiation dose requires dose optimization to the
tumour, as it should not vary within 5% of the prescribed dose. The significant variation in
dose, dose distribution or dose fractionation, serious consequences can arise. Applying the
well-designed quality assurance programme are necessary in order to ensure the protection of
patients. About 60% of all cancer patients will require radiation therapy during some phases
of their cancer care. Dose uniformity within the tumour volume and sparing of risk organs are
important considerations in judging a treatment plan. The undue radiation to the organs may
be one of the reasons for secondary metastasis for long-lived survivors [1].
In this paper, some parameters of quality assurance programme were carried out and radiation
dose to the critical organs during the radiotherapy procedures was measured by
thermoluminescent dosimeter (TLD). An ALCYON II cobalt-60 teletherapy unit (CGR, MeV,
France) of activity 223.6 TBq (09 June 1994) has been installed at the Delta Medical Centre
Limited, Dhaka, Bangladesh in August 1994.
2. Material and methods
A phantom made of plexiglass having the dimension of 30 cm × 30 cm × 30 cm have been
fabricated by using 0.5 cm thick plexiglass sheet. Beam profile was measured along the axis
of the field size 10 cm x cm. Field size, SSD, isocentre were checked before each
measurement. Out put dose for different field size were also studied. Lithium Fluoride crystal

IAEA-CN-85-36
590
in the form of chips (TLD-100) were used as TL dosimeters in this study and those were made
grouping and ready for experiment by using TLDSHELL software.
3. Results and discussion
Dose distribution i.e. beam profile of 10 cm X 10 cm field size were measured along the axis
of the field at dmax and dose data are presented in the Table 1 with the value of 98.44+1.40
mGy. Dose dependence on field size was measured for 5 X 5 ... and shown in Table 2. An
equation obtained by using Excel 97 and the equation is Y = 27.377ln(X) + 100.58 with R2 =
0.8452.
Table 1. Beam Profile along the axis of radiation filed of 10 cm × 10 cm
Distance in cm Dose (mGy)
-10 1.78
-8 3.38
-6 39.59
-4 96.41
-2 99.52
0 99.19
2 98.63
4 68.35
6 37.82
8 3.17
10 1.11
Table 2. Dose variation with field size
Field Size (cm X cm) Dose (mGy)
5 X 5 151.57+19.91
10 X 10 154.77+7.61
15 X 15 168.30+8.131
20 X 20 183.63+10.98
25 X 25 196.00+4.44
Organ dose was determined under typical treatment procedures and the dose data are shown in
Table 3. It is observed from the Table 3 that the prescribed dose for lung and cervix cancer
were 40.00 Gy and 50.40 Gy respectively and the dose measured onto the treatment field area
were 39.16+2.98 Gy and 50.48+ 3.68 Gy respectively which are within 2 % and 0.17 % of the
prescribed dose. These indicate that the study reveals an excellent agreement with the “dose
prescription to delivery”.
For laryngeal cancer treatment, the lens of eye receives 0.46+0.079 Gy which is comparable
with the dose received by the lens of eye are 639+8, 568+8 and 533+7 mGy as reported by F.
K. Miah et al. [2] For the typical brain cancer radiotherapy, gonadal dose found to be 8.2+1.0
mGy considering 45 Gy tumour dose to the brain. M. Mazonakis et. al, [3] determined the
conceptus dose during radiotherapy using anthropomorphic phantom delivering 65 Gy to the
tumour without using shielding equipment to the conceptus region and dose found to be 17.0,
21.7 and 28.3 mGy at 4, 12, 24 weeks of gestation respectively. It is, therefore, essential to put

IAEA-CN-85-36
591
necessary shielding to the critical organs, especially gonad during radiotherapy to reduce the
potential risk due to the scattered photon.
Table 3. Dose distribution (Gy) over various organs of the patients during typical treatment
procedures with the 60
Co teletherapy
Cancer
site &
Sex
Lens of
Eye
Neck Chest Abdomen Right Arm Left Arm Right
Leg
Left
Leg
Gonad
Lung
(Male)
0.14
+
0.03
1.04
+
0.13
39.16
+
2.98
0.13
+
0.004
0.20
+
0.014
0.16
+
0.03
0.005
+
0.0005
0.005
+
0.0002
0.022
+
0.002
Larynx
(Male)
0.46
+
0.08
3.99
+
1.28
0.19
+
0.013
0.043
+
0.003
0.074
+
0.005
0.083
+
0.012
0.011
+
0.0007
0.012
+
0.0007
0.023
+
0.002
Breast
(Femal
e)
0.21
+
0.03
1.99
+
0.32
6.30
+
1.70
0.28
+
0.05
0.15
+
0.021
0.61
+
0.02
0.02
+
0.002
0.016
+
0.001
0.10
+
0.008
Cervix
(Femal
e)
0.031
+
0.004
0.088
+
0.006
0.26
+
0.024
50.48
+
3.68
0.44
+
0.03
0.44
+
0.041
0.10
+
0.004
0.15
+
0.018
3.82
+
0.39
Oesop
hagus
(Femal
e)
0.02
+
0.035
2.55
+
0.72
35.54
+
2.15
0.52
+
0.027
0.27
+
0.035
0.15
+
0.014
0.007
+
0.0004
0.008
+
0.0008
0.009
+
0.0008
Brain
(Male)
0.44
+
0.06
0.23
+
0.021
0.04
+
0.004
0.02
+
0.0002
0.018
+
0.0016
0.013
+
0.001
0.005
+
0.0004
0.0046
+
0.0002
0.008
+
0.0001
References
[1] National Academy of sciences, Committee on the Biological Effects of Ionizing
radiation (BEIR): The effects on population of exposure to low levels of ionizing
radiation, 1980. In: K. Kase, G. Svensson, A. Wolbrast and M. Marks, “ Measurements
of dose from secondary radiation outside a treatment field”, Int. J. Radiat. Oncol. Biol.
Vol. 9(8), 1177-1183 (1983).
[2] F. K. Miah, M. F. Ahmed, Z. Begum, B. Alam and Q. Chowdhury: Dose distribution
over different parts of cancer patients during radiotherapy. Radiation Protection
Dosimetry, Vol. 77(3), pp 199-203 (1998), Nuclear Technology Publishing.
[3] M. Mazonakis, J Damilakis and others: Brain radiotherapy during pregnancy: an
analysis of conceptus dose using anthropomorphic phantoms. BJR Vol. 72, 274-278,
(1999).

IAEA-CN-85-97
592
PERIPHERAL DOSE IN PHOTON BEAMS FROM A
LINEAR ACCELERATOR WITH A MULTILEAF COLLIMATOR
R. Lope Lope1, F. Lozano Flores
1, J. Gracia Sorrosal
1,
J.A. Font Gómez1, A. Hernández Vitoria
1,2
1Servicio de Física y Protección Radiológica,
Hospital Clínico Universitario Lozano Blesa de Zaragoza, Zaragoza, Spain 2Area de Radiología y Medicina Física, Facultad de Medicina de Zaragoza, Zaragoza, Spain
Abstract
Radiation doses outside the radiotherapy treatment field are of radiation protection interest when anatomical
structures with very low dose tolerances might be involved. One of the major sources of peripheral dose, scatter
from secondary collimators, depends on the configuration of the collimator. In this study, peripheral dose was
measured at two depths for 6 and 18 MV photons from a linac Primus (Siemens) with a multileaf collimator
(MLC). Comparative measurements were made both with leaves and with the upper jaw positioned at the field
edge near to the detector. Configuring the MLC leaves at the field edge yielded a reduction in peripheral dose.
1. Introducción
Al realizar un tratamiento radioterápico con haces de fotones, a veces se plantea la necesidad
de estimar la dosis que puede llegar a los órganos críticos del cuerpo no contenidos dentro del
haz directo. La dosis en zonas fuera del haz primario, conocida como dosis periférica, se debe
principalmente a la radiación de fuga, la dispersada por el colimador y modificadores del haz
y a la dispersada por el propio paciente. Las dos primeras dependen de cada unidad de
radioterapia mientras que la última se puede estimar de modo general en función de la energía
de los fotones [1].
Con el fin de reducir la dosis periférica en órganos críticos con una determinada unidad se
puede intentar modificar la técnica de tratamiento o bien tratando al paciente de modo que sea
el colimador inferior el que defina el borde del campo más cercano al órgano crítico [2].
En este estudio, se presentan los resultados de las estimaciones de la dosis periférica originada
en un acelerador lineal con un colimador multiláminas, para dos energías de haces de RX.
2. Material y método
Las medidas de dosis periférica se han hecho con un acelerador Mevatron Primus (Siemens)
dotado de un colimador multiláminas (MLC). En este colimador, cuando el ángulo de giro del
mismo es de 0ª, la dimensión X del campo viene definida por las láminas y la dimensión Y
por dos mandíbulas situadas por encima de las láminas. El acelerador dispone de energías de
RX de 6 y 18 MV.
Las medidas relativas de dosis se hicieron con un conjunto de 12 diodos Isorad, situados en un
maniquí de agua sólida, y conectados a un electrómetro Multidos (PTW). Para colocarlos
dentro del maniquí de agua sólida, previamente se colocaron en sandwich dentro de unas
capas de Geliperm (Geistlich).
Los diodos se colocaron a distintas distancias del eje central, que correspondían a distancias
desde el borde del haz comprendidas entre 2 y 40 cm. Las medidas se realizaron para cada

IAEA-CN-85-97
593
energía, para tres tamaños de campo (5 x 5,15 x 15 y 25 x 25 cm2) y a profundidades de 5 y 10
cm. La distancia fuente –plano de colocación de los diodos fue de 100 cm.
Las medidas se hicieron en primer lugar con el colimador a 0º y luego, sin mover los diodos,
se repitieron con el colimador a 90º, con el fin de determinar la dosis periférica cuando eran
las multiláminas las que definían el borde del campo situado más próximo al punto de medida
y cuando este borde era definido por una de las mandíbulas superiores.
Posteriormente, las dosis periféricas se estimaron como porcentaje respecto a la dosis en el eje
central, teniendo en cuenta el factor de calibración de cada diodo.
3. Resultados y discusión
En las figuras 1 a 4 se muestran los resultados de dosis periféricas calculados a partir de las
medidas de los diodos, con el colimador a 0º, es decir, con el borde del haz más cercano a los
diodos definido por las multiláminas. Se observa que la dosis periférica:
�� Aumenta con el tamaño de campo, como era de prever.
�� A distancias pequeñas del borde del haz disminuye al crecer la energía a las profundidades
seleccionadas. La diferencia encontrada entre las dos energías fue siempre inferior a un 3
% respecto a la dosis en el eje del haz.
�� Para cada energía, es mayor a profundidad 10 cm que a 5 cm., siendo este aumento mayor
en el caso del haz de 6 MV . La diferencia mayor encontrada entre las dos profundidades
fue del orden de 2 % respecto a la dosis en el eje del haz.
Este comportamiento general concuerda con los obtenidos por otros autores [3]. A distancias
pequeñas del borde del campo, la mayor contribución a la dosis periférica se debe a la
radiación dispersada por el maniquí. Esta contribución aumenta al crecer la profundidad.
Lo mismo ocurre con la dosis periférica medida con el colimador girado 90ª, es decir, con el
borde del haz más cercano a los diodos definido por una de las mandíbulas superiores.
Comparando los resultados obtenidos en los casos estudiados de colimador a 0º y 90º, hemos
observado que, en todos ellos, la dosis periférica es mayor con el colimador a 90º, siendo esto
más notable en el caso del haz de 18 MV. La diferencia obtenida es pequeña en ambos casos
(siempre inferior a 1 % respecto a la dosis en el eje del haz). Así pues, la radiación dispersa
que llega a los diodos procedente del colimador es siempre menor en el caso del colimador a
0º.
Como ejemplo, en las figuras 5 y 6 se muestran, para cada una de las energías y el mayor
tamaño de campo estudiado, los resultados obtenidos con el colimador en cada una de las
posiciones y para la profundidad de 10 cm.
Un estudio similar realizado para un haz de 6 MV en un acelerador Mevatron KD2 (Siemens)
dotado de un colimador con cuatro mandíbulas, muestra diferencias inferiores entre las dosis
periféricas para las dos orientaciones del colimador que las determinadas en el acelerador
estudiado en este trabajo[4].
Las dosis periféricas medidas con el acelerador estudiado son inferiores a las publicadas por
otros autores [3] para otro acelerador dotado de un colimador multiláminas pero con
mandíbulas en las direcciones X e Y.

IAEA-CN-85-97
594
6 MV Prof: 5 cm
0,00
1,00
2,00
3,00
4,00
5,00
6,00
7,00
8,00
0 5 10 15 20 25 30 35 40 45 50 55
Distancia al eje (cm)
%
Campo 5 x 5
campo 15 x 15
Campo 25 x 25
6 MV Prof: 10 cm
0,00
1,00
2,00
3,00
4,00
5,00
6,00
7,00
8,00
9,00
10,00
0 5 10 15 20 25 30 35 40 45 50 55
Distancia al eje (cm)
%
Campo 5 x 5
campo 15 x 15
Campo 25 x 25
6 MV Prof. 10 cm
0,00
2,00
4,00
6,00
8,00
10,00
12,00
0 5 10 15 20 25 30 35 40 45 50 55 60
Distancia al eje (cm)
% Col. 0º
Col. 90º
18 MV Prof: 5 cm.
0,00
1,00
2,00
3,00
4,00
5,00
6,00
0 5 10 15 20 25 30 35 40 45 50 55
Distancia al eje (cm)
%
Campo 5 x 5
Campo 15 x 15
Campo 25 x 25
18 MV Prof: 10 cm.
0,00
1,00
2,00
3,00
4,00
5,00
6,00
7,00
0 5 10 15 20 25 30 35 40 45 50 55
Distancia al eje (cm)
%
Campo 5 x 5
Campo 15 x 15
Campo 25 x 25
Figura 1
Dosis periférica (% respecto a dosis en el eje del haz).
Haz de 6 MV. Profundidad 5 cm.
Borde del haz más próximo a los diodos definido por las
láminas.
Figura 2
Dosis periférica (% respecto a dosis en el eje del haz). Haz
de 6 MV. Profundidad 10 cm.
Borde del haz más próximo a los diodos definido por las
láminas.
Figura 3
Dosis periférica (% respecto a dosis en el eje del haz).
Haz de 18 MV. Profundidad 5 cm.
Borde del haz más próximo a los diodos definido por las
láminas.
Figura 4
Dosis periférica (% respecto a dosis en el eje del haz). Haz
de 18 MV. Profundidad 10 cm.
Borde del haz más próximo a los diodos definido por las
láminas.
Figura 5
Dosis periférica. Haz de 6 MV. Campo 25x25 cm2.
Profundidad 10 cm. Borde del haz más próximo a los
diodos definido por las multiláminas (Col.0º) y por la
mandíbula superior (Col.90º).
18 MV Prof. 10 cm
0,00
1,00
2,00
3,00
4,00
5,00
6,00
7,00
8,00
0 5 10 15 20 25 30 35 40 45 50 55 60
Distancia al eje (cm)
% Col. 0º
Col. 90º
Figura 6
Dosis periférica. Haz de 18 MV. Campo 25x25 cm2.
Profundidad 10 cm. Borde del haz más próximo a los
diodos definido por las multiláminas (Col.0º) y por la
mandíbula superior (Col.90º).

IAEA-CN-85-97
595
Como aplicación de los resultados obtenidos, en el supuesto de un tratamiento efectuado con
un haz de RX de 18 MV y un tamaño de campo de 25 x 25 cm2, con una dosis de 50 Gy en el
eje del haz y a 10 cm de profundidad, la dosis en un órgano situado a la misma profundidad y
a 2 cm de distancia del borde del haz sería de un 6 % (borde del campo definido por las
multiláminas) frente a un 6.7 % (borde del campo definido por la mordaza superior en función
del giro del colimador (0º/90º). Esto supondría una diferencia de dosis de 0.7 %, es decir 35
cGy.
4. Conclusión
En el acelerador estudiado, para disminuir la dosis periférica en aquellos órganos en que la
dosis pueda ser clínicamente significativa, es preferible colocar el ángulo del colimador de
modo que sean las multiláminas las que definan el borde del haz más cercano al órgano
crítico.
Referencias
[1] VAN DER GIESSEN P.H. “A simple and generally applicable method to estimate the
peripheral dose in radiation teletherapy with high energy X-Rays or gamma radiation”.
Int.J.Radiat.Oncol.Biol. Phys. 35:1059-1068, 1996.
[2] STOVALL M. y otros. “Fetal dose from radiotherapy with photon beams: Report of
AAPM Radiation Therapy Committee Task Group No.36”. Med. Phys. 22:63-82,1995.
[3] STERN R.L. “Peripheral dose from a linear accelerator equipped with multileaf
collimation”. Med. Phys. 26:559-563, 1999.
[4] LOPE R. “Dosis periférica en un acelerador lineal en función de la orientación del
colimador” (Comunicación privada).

IAEA-CN-85-251
596
PATIENT DOSE FROM PHOTONEUTRONS IN A 18 MV LINAC
R. Barquero1, R. Méndez
2, M.P. Iñiguez
2
1 Servicio de Radiofísica y Protección Radiológica,
Hospital Universitario Río Hortega de Valladolid, Spain 2 Departamento de Física Teórica y Atómica Molecular y Nuclear,
Universidad de Valladolid, Spain Abstract
We have estimated by measurements and Monte Carlo simulations, the photoneutron dose equivalent to patients
in a Siemens KD-S radiotherapy accelerator operating at 18 MV. The beam was collimated to 40 cm x 40 cm and
angles of 0º and 180º for the rotating gantry where considered. The measurements were made with pairs of
TLD600-TLD700 thermoluminescent dosemeter chips inside a 25 cm diameter moderating sphere. The
calibration of the instrument was performed in a bare Am-Be neutron source. On the other hand the Monte Carlo
simulations of the fluence and energy spectra were made by using a simplified model for the neutron source and
taking into account neutron scattering from the concrete walls surrounding the room. The agreement between the
two approximations was good with a resulting dose to patient of 0.6 mSv per treatment Gy that fits well to
reported values in the literature.
1. Introduction
In electron linear accelerators operating at high energies neutrons are produced as a
consequence of photonuclear reactions in the target, field-flattening filters and beam
collimators. These neutrons deliver an unwanted extra dose to patients, a fact constituting a
very active research topic from the 1970’s [1,2] which is of special relevance in the case of
pregnant patients [3]. Experimental techniques to quantify the neutron dose to patients are
limited by many reasons. For example pulse counters are discarded because dead time and pile
up effects in the very intense and pulsed radiation field of a linac. On the other hand the high
gamma intensity of the therapy beam makes it difficult to extract the relatively small neutron
component if detectors sensitive to both radiations are used. Passive neutron activation [4],
thermoluminescent TLD [5,6] and superheated drop detectors [7], which have not the pulse
counters disadvantages, have been used to measure quantities wich are more or less closely
related to the relevant dose equivalent depending on the particular technique.
Monte Carlo simulations can alternatively evaluate the transport of neutrons in the different
components of the accelerator and through the room. What has to be calculated is a
formidable task with an enormous neutron producing gamma and inversely gamma producing
neutrons reactions all of them necesary in principle to correctly describe the resulting mixed
neutron-gamma field. However it is much more frecuent to make some simplifications on the
neutron source in addition to approximations of the detailed geometry and to neglect nuclear
reactions that contribute less to the dose equivalent. In the simulations one obtains the neutron
fluence and energy spectra and after that by using the appropriate conversion factor the
neutron dose equivalent is estimated.
Some authors [5,6] have obtained the dose equivalent around linacs from the neutron
spectrum measured by means of a Bonner spectrometer with TLD´s [8,9]. This system
consists of a bare detector and six polyethylene moderating spheres with diameters varying
between 5 and 30 cm. Differently, in this work we report on results of TLD dosemeters but
only inside a special sized sphere 25 cm diameter whose response versus neutron energy fits
the quality factor behaviour [8,9] for the energy range of interest. The results of the
IAEA-CN-85-251
597
measurements are compared with MonteCarlo calculations in which the source is assumed to
be punctual and surrounded by a shielding sphere.
2. Materials and methods
Thermoluminescent LiF:Mg,Ti chips of 3x3x1 mm are located in the paraffine sphere center
inside a methacrylate cylindrical box that contains four TLD600 and four TLD700. The
responses of the TLD600 are associated to gamma and neutron radiations whereas the
corresponding to TLD700 only have gamma contribution. An identical gamma response of
TLD600 and TLD700 will be assumed so the neutron contribution follows as a simple
sustraction between the responses of the two types of dosemeters. The readout apparatus was a
Victoreen 2800M model, and the lectures were obtained in a two steps way, a heating during
ten seconds at 160 ºC followed by another ten seconds at 300ºC and taking the intensity
emitted in the second time interval. The neutron contribution to the TLD600 reading is
converted to dose equivalent by means of a calibration in an Am-Be isotopic neutron source.
For this task we proceed to measure the neutron dose equivalent at different distances from
the 3Ci bare source (50, 60, 70, 80 and 100 cm) with a scintillation pulse counter LiI (Eu)
inside a 30 cm diameter poliethylene sphere [8]. At the same points our TLD-sphere system is
irradiated and the neutron contribution of TLD600 is correlated to the LiI (Eu) remmeter
response [9]. Then the correlation factor obtained in this way is assumed to be valid for the
neutron field existing around the linac. For the irradiations in the accelerator two positions of
the rotating gantry where chosen at angles 0º (anteroposterior AP) and 180º (posteroanterior
PA) with a field size of 40 * 40 cm delivering 12.5 Gy at the isocenter ic.
The version 4B of the MCNP [10] code was used for the Montecarlo simulations. As the input
we have considered an isotropic punctual neutron source with a maxwellian evaporation
spectrum
�������������������� )exp(*)(2
T
E
T
EEp �� ���������������������������������������������������������������������������
and a temperature T = 0.5 MeV corresponding to photoneutron production in the tungsten
material of the target. This source is surrounded by a shielding tungsten sphere 10 cm radius
as if collimators where closed. The room walls are described as paralelepipedic concrete 2.3
g/cm3 density with a mass percent composition of 17% hidrogen, 56% oxigen, 20% silicon
and smaller proportions of Al, Ca, Mg, K, Fe and C. A number of 50000 neutrons in 12
energy groups, from [0, 4E-7] to [5, 7] MeV are transported up to ring detectors at the
experimental positions or up to a punctual detector for the point in the beam. Prompt gamma
rays produced in capture reactions were neglected. Since MCNP calculated fluence is
normalized per neutron source, it is the neutron yield Q in the accelerator head that is
required. We obtain Q in a semiempirical way, by assuming that the thermal fluence � th is
uniform and proportional to the source strength [11]. The proportionality constant is obtained
from the MCNP normalized thermal fluence. Then by an independent measure of the thermal
fluence � th in the room (with bare and Cadmium shielded TLD) a neutron yield of 2.6 **
1011
neutrons per treatment Gy is obtained, the value of � th being 8.1 ** 10 5 n/cm
2 Gy.
The dose equivalent h results multiplying the group fluences �i by the conversion factors
FCONVi in ref. [12] as follows
i
i
iFCONVh ���
�
*
12
1
. (2)

IAEA-CN-85-251
598
3. Results
The investigated region near the beam is shown in Fig.1, where for completeness a sketch of
the accelerator room is also given. The points labelled A, B, C and D are in the patient plane
at respectively 30, 25, 25 and 80 cm from the isocenter ic and correspond to AP gantry
position. In the measurements the center of the sphere is at those distances whereas in the
calculations ring detectors around ic are used. Those same points in the patient plane are
calculated for PA gantry position. The point ic is just in the beam center and the points
labelled from E to J are in the electron gun plane at distances from ic appearing in Table I
bellow. In the last case ring detectors around the source where used to calculate neutron
fluence. The point K located at 125 cm from ic is where the thermal fluence �th was measured
to obtain Q as indicated above.
Fig.1 Sketch of the acelerator room with the studied points
The Table below shows the experimental and calculated results in miliSievert per treatment
Gray. The calculated values for the points A to D corresponding to patient PA coincide with
the values for patient AP and are not given in that Table. This is not extraneous because the
room is rather symmetrical and the variation of distances to ceiling and floor does not affect at
all. The point ic in the beam is calculated but it is not measured because the strong gamma
content of our TLD dosemeters that makes it impossible to induce any value for neutron dose.
The mean average among the points located out of the beam is 0.55 mSv/Gy with standard
deviations of 40% and 20% for respectively the measured and calculated values.
Our resulting dose equivalent is inside the range of values reported in the literature [4,7]
although some differences exist among different accelerator models. The thermal neutron dose
represents only a small contribution two orders of magnitude smaller than the total dose. The
experimental method we have used here has limitations to measure neutron doses very near to
the beam and then as we have shown the Monte Carlo simulations could help in evaluation of
doses for those points of interest. Finally we want to note that neutron dose reduction studies
by adequate shields for fetus protection, whose importance has been stressed in refs. [3,7] can
be accomplished with the methods used in this work.
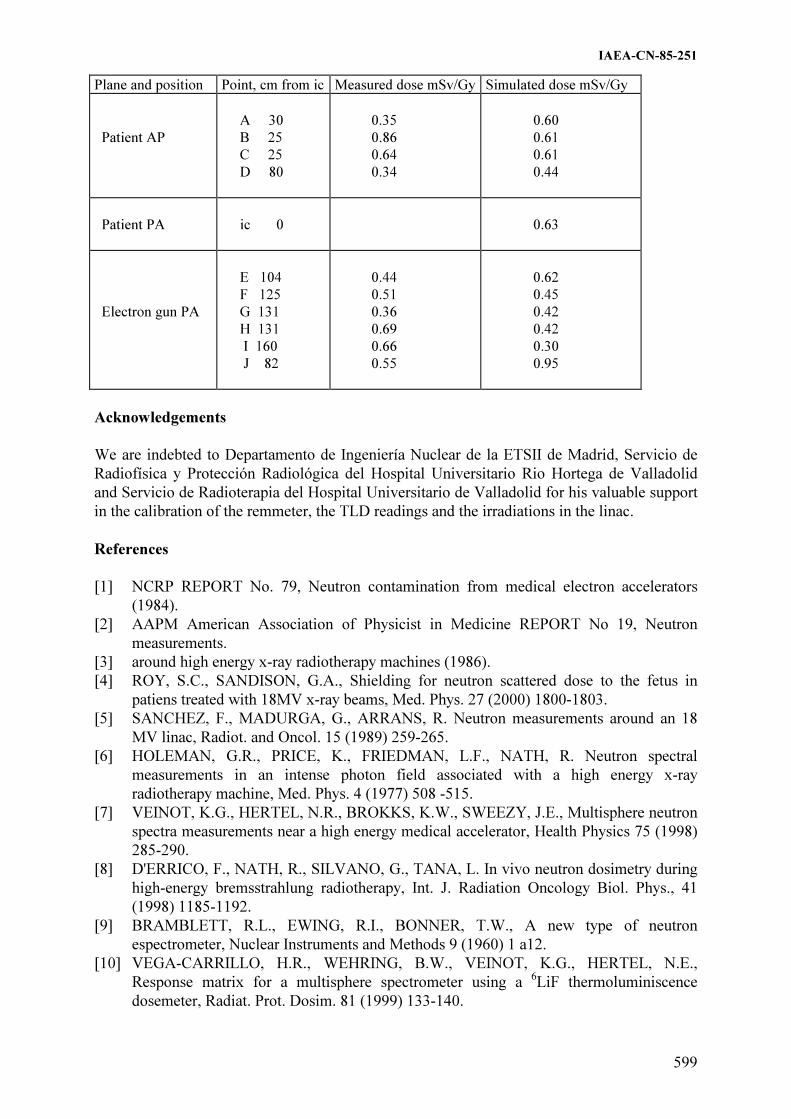
IAEA-CN-85-251
599
Plane and position Point, cm from ic Measured dose mSv/Gy Simulated dose mSv/Gy
Patient AP
A 30
B 25
C 25
D 80
0.35
0.86
0.64
0.34
0.60
0.61
0.61
0.44
Patient PA
ic 0
0.63
Electron gun PA
E 104
F 125
G 131
H 131
I 160
J 82
0.44
0.51
0.36
0.69
0.66
0.55
0.62
0.45
0.42
0.42
0.30
0.95
Acknowledgements
We are indebted to Departamento de Ingeniería Nuclear de la ETSII de Madrid, Servicio de
Radiofísica y Protección Radiológica del Hospital Universitario Rio Hortega de Valladolid
and Servicio de Radioterapia del Hospital Universitario de Valladolid for his valuable support
in the calibration of the remmeter, the TLD readings and the irradiations in the linac.
References
[1] NCRP REPORT No. 79, Neutron contamination from medical electron accelerators
(1984).
[2] AAPM American Association of Physicist in Medicine REPORT No 19, Neutron
measurements.
[3] around high energy x-ray radiotherapy machines (1986).
[4] ROY, S.C., SANDISON, G.A., Shielding for neutron scattered dose to the fetus in
patiens treated with 18MV x-ray beams, Med. Phys. 27 (2000) 1800-1803.
[5] SANCHEZ, F., MADURGA, G., ARRANS, R. Neutron measurements around an 18
MV linac, Radiot. and Oncol. 15 (1989) 259-265.
[6] HOLEMAN, G.R., PRICE, K., FRIEDMAN, L.F., NATH, R. Neutron spectral
measurements in an intense photon field associated with a high energy x-ray
radiotherapy machine, Med. Phys. 4 (1977) 508 -515.
[7] VEINOT, K.G., HERTEL, N.R., BROKKS, K.W., SWEEZY, J.E., Multisphere neutron
spectra measurements near a high energy medical accelerator, Health Physics 75 (1998)
285-290.
[8] D'ERRICO, F., NATH, R., SILVANO, G., TANA, L. In vivo neutron dosimetry during
high-energy bremsstrahlung radiotherapy, Int. J. Radiation Oncology Biol. Phys., 41
(1998) 1185-1192.
[9] BRAMBLETT, R.L., EWING, R.I., BONNER, T.W., A new type of neutron
espectrometer, Nuclear Instruments and Methods 9 (1960) 1 a12.
[10] VEGA-CARRILLO, H.R., WEHRING, B.W., VEINOT, K.G., HERTEL, N.E.,
Response matrix for a multisphere spectrometer using a 6LiF thermoluminiscence
dosemeter, Radiat. Prot. Dosim. 81 (1999) 133-140.

IAEA-CN-85-251
600
[11] MCNP A General Monte Carlo N-Particle Transport Code, Version 4B, LA 12625,
(1997), Judith F. Briesmeister, Editor.
[12] Mc CALL, R.C., Neutron yield of medical electron accelerators, Stanford Linear
Accelerator Center Report No SLAC-PUB-4480 (1987).
[13] SIEBERT, B.R.L., SCHUHMACHER, H., Quality factors, ambient and personal dose
equivalent for neutrons, based on the new ICRU stopping power data for protons and
alpha particles, Radiation Protection Dosimetry 58, No.3 (1995) 177 a 183.

IAEA-CN-85-70
601
SHIELDING FOR RADIATION SCATTERED DOSE DISTRIBUTION TO THE
OUTSIDE FIELDS IN PATIENTS TREATED WITH
HIGH ENERGY RADIOTHERAPY BEAMS
Sung Sil Chu
Department of radiation Oncology, Yonsei Cancer Center, Yonsei University,
Seoul, Republic of Korea
Abstract
Scattered dose of therapeutic high energy radiation beams are contributed significan t unwanted dose to the
patient. Measurement of radiation scattered dose outside fields and critical organs, like fetus position and testicle
region, from chest or pelvic irradiation by large field of high energy radiation beam was performed using an
ionization chamber and film dosimetry. The scattered doses outside field were measured 5 - 10% of maximum
doses in fields and exponentially decrease from field margins. The scattered photon dose received the uterus from
thorax field irradiation was measured about 1mGy/Gy of photon treatment dose Shielding construction to reduce
this scattered dose was investigated using lead sheet and blocks About 6 cm lead block shield reduced the scatter
photon dose under 10mGy for 60Gy on abdomen field and reduced almost electron contamination.
1. Introduction
High energy photon beams from medical linear accelerators produce large scattered radiation
by various components of the treatment head, collimator and walls or objects in the treatment
room including the patient. These scattered radiation do not provide therapeutic dose and are
considered a hazard from the radiation safety perspective. The scattered photon dose received
the fetus from thorax field irradiation was measured about 1mGy/Gy of photon treatment dose
and typical therapeutic doses of photon radiation lie in the range 40 -70Gy. Thus, without
additional shielding, the scattered photon dose received by the fetus might be several hundred
mGy. Under conditions of occupational radiation exposure of pregnant women, the NCRP
advises that the fetus be regarded as a separate entity distinct from the woman bearing it and
that the total dose equivalent limit for the fetus be 5 mSv and no greater than 0.5 mSv in any
given month. Similarly the ICRP recommends a dose equivalent limit of 2 mSv once the
pregnancy is known. These advisory bodies emphasize that medical exposures are excluded
from these occupational exposure dose limits. In addressing medical exposures of benefit to
the mother, ICRP take the position that irradiation of the pregnant woman is to be avoided.
However it does recognize that there may be exception circumstances in the treatment of a life
threatening malignancy of the mother in which therapeutic irradiation is the method of
treatment that carries the lowest detrimental risk to the patient and fetus. In such cases it is
emphasized by the ICRP that treatment should be planned in a way that minimizes the dose to
the fetus by use of all relevant measures including shielding.
There are no internationally recognized guidelines for limiting the dose to the fetus during
radiation treatment of the mother for malignancy. However it is known that a dose of 500mGy
may cause abortion at any stage of pregnancy and that radiation detriment to the fetus includes
risk of mental retardation with a possible threshold in the dose response relationship around
100 mGy for the gestational period of maximum vulnerability
Hammer Jacobson made the controversial recommendation that an abortion be performed
whenever an embryo has received a dose above 100mGy during the first 6 weeks following
conception to avoid the risk of producing an anomalous child. Irradiation of a fetus also
carries the increased risk of childhood cancer and fatal cancer and fatal cancer later in life.

IAEA-CN-85-70
602
Risk estimates for childhood cancer induction vary but may be as high as 10-3
per mSv to the
fetus.
The ICRP principle of as low as reasonably achievable (ALARA) was recommended for
protection of occupation upon the linear no-threshold dose response hypothesis for cancer
induction. We suggest this ALARA principle be applied to the fetus in therapeutic treatment of
the mother. Applications of the principle will in many instances reduce the total dose
equivalent to the fetus below dose thresholds for nonstochastic radiation effects. Thus
effective shielding of the fetus must be introduced when ever possible. In the specific instance
considered in this article of a therapeutic high energy photon beam treatment of the mother
shielding should be designed to reduce the scattered photon to the normal organs. Radiation
dose outside a photon treatment filed is mostly due to scattered photons.
This scattered dose is a function of the distance from the beam edge, treatment geometry,
primary photon energy and depth in the patient.
The need for effective shielding of the fetus is reinforced when one considers many pregnant
women are treated with external beam radiation therapy every year and then shielding
designed to reduce the scattered photon dose to normal organs have to considered.
2. Materials and methods
Irradiation was performed at a gantry angle of 0 degree in phantom using high energy photon
beams produced by a Varian 2100C/D medical linear accelerator (Varian Oncology Systems,
Palo Alto, CA) located at the Yonsei Cancer Center. The composite phantom used was
comprised pf a commercially available anthropomorphic Rando phantom (Phantom
Laboratory Inc., Salem, YN) and a rectangular solid polystyrene phantom of dimensions
30 cm x 30 cm x 20 cm. the anthropomorphic Rando phantom represents an average man
made from tissue equivalent materials that is transected into transverse slices of 2.5 cm
thickness. When assembled the 36 slices, numbered 0-35, Provide a head and torso with
skeleton, lungs, and air passages. Slices 20-28 correspond to the abdomen and were removed
and replaced by the polystyrene phantom.
Photon dose was measured using a Capintec PR-06C ionization chamber coupled to a
Capintec 192 electrometer(Capintec Inc., Ramsey, NJ) and this system had a calibration factor
traceable to a standards laboratory and the photon scattered doses were measured by inserting
the appropriate dosimeter in the milled a space located in one of the slice of the polystyrene
phantom.
In case of fetus, the dosimeter was placed at a depth of 10 cm in this phantom at 100 cm
source to axis distance and located centrally 15 cm from the inferior edge of the 30 cm x 30
cm x-ray beam irradiating the Rando phantom chest wall. A fraction of a typical patient
treatment dose was delivered during scattered dose measurement.
Of note is that a depth of 10 cm has been previously accepted as the standard depth of a fetus.
In our geometric setup the measurement location chosen as representative of the position of
the fetus corresponds approximately to an anatomical location that is 10 cm below the
umbilicus of the mother, According to the AAPM task group 36 report the mother's umbilicus
will be the height of the fundus at 20-22 weeks gestation. Obviously, the fetus occupies a

IAEA-CN-85-70
603
volume that increases with the period of gestation and the depth of the midline of the fetus
will also vary with its position the size of the mother, and other factors.
A wooden bridge of size 40 cm x 40 cm and a clear space of about 21 cm was fabricated and
placed on top of the rectangular polystyrene phantom representing the abdomen of the patient.
The idea was to simulate the bridge being as close as possible to the patient's body
whileensuring the weighty of the bridge and shield rested on the legs of the bridge. Shielding
material comprised of 30 cm x 30 cm lead sheets of total thickness 6 cm was placed on the top
of the wooden bridge that covered the abdomen.
The scattered photon with and without shielding were measured at the representative position
of the fetus. The scattered photon dose was usually made for a 10 Gy primary photon beam
treatment, however to obtain good statistics
3. Results
Scattered photon doses of critical organs from various region by 10MV photon beam was
measured and presented in table 1.
The scattered photon dose for uterus and testicle can be reduced under 10 mSv when the lead
shield was used while the tumor region was irradiation by high energy photon beam and
presented in table 2.
Table 1. Scattered photon dose measured at critical organs from 10MV x-ray beam
irradiating various regions
unit : mGy/Gy F: in field Region
Organs
Thorax
12 x12 cm Abdomen14 x14 cm
Pelvis14 x14 cm
Brain
Lens
Thyroid
Lung
Pancreas
Kidney
Uterus
Testicle
1.8
2.2
48.3
F
4.8
2.5
0.9
0.7
0.2
0.3
1.9
20.2
F
F
6.2
4.2
0.1
0.2
0.8
1.5
3.7
39.8
F
58.2
Table 2. Requirement lead thickness to be reduce under 10mGy for 60Gy irradiated on
field with 10MV x-ray unit: cm F: in field
Regio
Organ
Thorax Abdomen Pelvis
Uterus
Testicular
4.5
1.2
7.0
2.0
F
6.5
The results indicate that it is possible to improve shielding to reduce scattered photon and side
at the position of a fetus when a pregnant women is treated with a high energy photon beam.
The AAPM task group report 36 concentrated on shielding of the fetus from scattered photons
and recommended that the lead shielding be draped over the edge of the bridge to provide
extra shielding of the fetus against collimator scatter. This report also stated that it is prudent
to treat with photon beams generated by electrons less than 10 MeV if this modality is
adequate to treat the tumor.

IAEA-CN-85-70
604
References
[1] NCRP report 91. "Recommendations on limits for exposure to ionizing radiation",
National Council on Radiation Protection and Measurements, Bethesda,MD 20814,1987
[2] ICRP report 60. 1990 Recommendations of the International Commission on
Radiological Protection (Pergamon, Oxford, 1991)
[3] ICRP report 44. Protection of the Patient in Radiation Therapy(Pergamon, Oxford,
1991)
[4] ICRP report 49. Developmental Effects of Irradiation on the Brain of the Embryo and
Fetus (Pergamon, Oxford, 1986)
[5] ICRP report 26. "Recommendations of the International Commission on Radiological
Protection (Pergamon, Oxford, 1977)
[6] Hall E.J. Radiobiology for the Radiologist, 5th ed. (J.B. Lippincott, New York, 2000)
[7] Ing H., Nelson W.R and Shore R.A. " Unwanted photon and neutron radiation resulting
from collimated photon beams interacting with the body of radiotherapy patients." Med.
Phys. 9,27-33(1982)
[8] Antolak J.A. and Strom E.A. " Fetal dose estimates for electron beam treatment to the
chest wall of a pregnant woman." Med. Phys. 25,2388-2391(1998)
[9] Mazonakis M., Damilakis J, Theohaveris N and Gourtsoyiannis N, " Brain radiotherapy
during pregnancy : An analysis of conceptus dose using anthropomorphic phantoms."Br.
J. Radiol.72,274-278(1999)
[10] Roy S.C. and Sandison G.A." Shielding for neutron scattered dose to the fetus in patients
teated with 18 MV x-ray beams." Med. PHys. 27,1800-1803 (2000)
[11] Neta R. " The promise of molecular epidemilolgy in defining the association between
radiation and cancer." Health Physics, 79,77-84(2000)
[12] LuckeyT.D. "Radiation hormesis overview" Radiation Protection Management,22-
34,July/August,1999

IAEA-CN-85-8
605
NEUTRON DOSE TO PATIENTS TREATED WITH
HIGH-ENERGY MEDICAL ACCELERATORS
P.H. McGinley
Emory University School of Medicine, Department of Radiation Oncology,
Atlanta, Georgia, United States of America
Abstract
The neutron dose equivalent received by patients treated with high energy x-ray beams was measured in this
research. A total of 13 different medical accelerators were evaluated in terms of the neutron dose equivalent in
the patient plane and at the beam center. The neutron dose equivalent at the beam center was found to ranged
from 0.02 to 9.4 mSv per Sv of x-ray dose and values from 0.029 to 2.58 mSv per Sv of x-ray were measured in
the patient plane. It was concluded that the neutron levels meet the International Electrotechnical Commission
standard for the patient plane. It was also concluded that when intensity modulated radiation treatment is
conducted the neutron dose equivalent received by the patient will increase by a factor of 2 to 10.
1. Introduction
Medical accelerators are used routinely to produce high energy x-ray and electron beams for
use in the treatment of cancer patients. The radiation beams generated by medical accelerators
operated above 8 MeV are contaminated with neutrons as a result of photon reaction with the
materials used to fabricate the accelerator structure. The dose equivalent produced by
photoneutrons is of importance in assessing the risk to the patient due to stray radiation. In
this work the dose equivalent in the patient plane and at the beam center was measured for a
number of modern medical accelerators.
2. Materials and methods
Table I list the various accelerators investigated, the beam megavoltage as given by the
American Association of Physicist Task Group-21 Protocol [1] and the stated energy indicated
by the manufacturer. Moderated activation detectors were used to determine the neutrons in
the main beam and at points outside the x-ray beams. A 15.2 cm diameter paraffin moderator
equipped with an indium foil at it’s center was used to measure the fast neutron fluence at the
beam center per unit dose of x-rays. at the isocenter. This dosimeter was utilized due to the
relatively small size, which allowed it to be placed within a 20 x 20 cm2 x-ray beam. The
detector also has the desirable feature of having a small sensitivity to photons. The activity of
the indium foil after an irradiation has been shown to be directly proportional to the neutron
fluence per unit dose of x-ray [2]. Since the detector has a flat energy response in the fast
neutron energy region the energy spectrum of the neutrons does not have to be accurately
known to determine the fast neutron fluence [2]. The moderator was encased in a cadmium
thermal neutron shield to eliminate any response produced by thermal neutrons. The
measurements were made at the center of beams of cross sectional area of 20 x 20 cm2 at 1 m
from the target. A 252
Cf neutron source was used to calibrate the moderated activation system.
Factors [3] to account for neutrons produced in the cadmium thermal neutron shield by
photons were applied to the measurements. The foil count rate was evaluated by use of a gas-
flow proportional counter. Corrections of the count rate were made for lack of saturation and
decay before and during counting. The neutron fluence established by use of the paraffin
sphere was converted to neutron dose equivalent based on information given in NCRP Report
No. 79 [4].

IAEA-CN-85-8
606
TABLE I. Accelerators investigated, accelerator parameters, and the fast
neutron equivalent per unit dose of x-rays at the beam center.
Accelerator Stated
energy
(MeV)
TG-21
Megavoltage
Neutron dose equivalent
per unit dose of x-ray
at the isocenter
(mSv/Gy x-ray)
1. Siemens KD
2. Siemens Primus
3. Siemens MD
4. Phillips SL25
5. Phillips SL20
6. GE Saturne 43
7. GE Saturne 43
8. GE Saturne 41
9. GE Saturne 41
10. Varian 2300
11. Varian 2300
12. Varian 2300
13. Varian Clinac 18
20
18
15
25
20
25
18
15
12
20
18
15
10
17.0
15.3
13.2
22.0
17.0
18.5
14.0
12.5
11.2
18.5
17.5
13.1
9.2
4.2
3.1
1.4
8.0
2.3
8.5
5.1
1.7
0.8
9.4
8.3
4.0
0.02
Table II. Neutron dose equivalent(mSv) in the patient plane per unit dose (Gy) of x-
ray at the isocenter.
Distance from
beam center 30 cm 100 cm
Accelerator
Number
-G G Lf Rt -G G Lf Rt
1 1.40 1.40 1.60 1.40 1.00 1.10 1.20 1.00
2 0.49 0.47 0.50 0.45 0.45 0.44 0.49 0.44
3 0.31 0.22 0.24 0.25 0.20 0.19 0.21 0.18
4 2.36 2.10 2.40 2.05 1.98 1.97 2.02 2.00
5 0.56 0.53 0.58 0.50 0.41 0.42 0.47 0.47
6 1.83 2.30 2.41 2.58 1.27 1.60 1.29 1.35
7 - - - - 0.59 0.55 0.54 0.51
8 0.46 0.51 0.45 0.41 0.29 0.32 0.31 0.32
9 0.17 0.14 0.16 0.18 0.10 0.08 0.10 0.09
10 1.76 1.81 1.70 1.59 1.22 1.43 1.20 1.15
11 1.67 1.45 1.67 1.57 1.15 1.17 1.17 1.13
12 0.79 0.67 0.72 0.65 0.43 0.45 0.49 0.52
13 0.03 0.08 0.05 0.05 0.03 0.04 0.03 0.05
The neutron dose equivalent outside the beam was determined by use of a 25.4 cm diameter
Bonner sphere with an indium foil placed at the center of the sphere. The Bonner sphere was
used for these measurements because the neutron energy spectrum was not known for points
outside of the beam and the response of 25.4 cm sphere is proportional to the neutron dose
equivalent independent of the energy of the neutron field. A second reason the Bonner sphere
dosimeter was chosen for measurements in the patient plane was that detailed knowledge of
the accelerator head shielding was not required to establish the neutron dose equivalent. On
the other hand, if the paraffin moderator had been used for the determination of the dose
equivalent the thickness and type of materials in the accelerator head would have been
required. The Bonner sphere system was calibrated with the same neutron source used to
calibrate the paraffin sphere.

IAEA-CN-85-8
607
Neutron measurements were made in the patient plane, which is defined as the area formed by
a one meter radius circle located one meter from the x-ray target at a right angle to the central
axis of the beam. The sphere was positioned at 30 and 100 cm from the central axis of the x-
ray beam in order to determine the dose equivalent received by the patient. The collimator of
the accelerator was closed to the minimum size when measurements were made in the patient
plane in order to maximum neutron production. The location of the points of measurement in
the patient plane are indicated by G (toward the gantry), -G (away from the gantry, and left
(Lf) and right (Rt) as viewed from the foot of the treatment table looking toward the gantry.
3. Results
Table I summarizes the values found for the fast neutron dose equivalent per unit dose of x-
rays at the center of each 20 x 20 cm2 beam. The values range from 0.024 to 9.4 mSv Gy
-1
depending on the energy and manufacturer of the accelerator. It should be noted that the
neutron contamination at the beam center of the Siemens and Philip accelerators is lower by a
factor of at least two as compared to the Varian and GE accelerators with similar Task Group-
21 megavoltage values for x-ray beam. In Table II are shown the values of neutron dose
equivalent measured in the patient planer per unit dose of x-ray at the isocenter. The Varian
and GE patient plane values are a factor of two or more greater than the Siemens and Philips
values except for the Siemens KD accelerator which had neutron leakage in the patient plane
similar to the Varian 17.5 MV x-ray beam. This comparison of the neutron dose equivalent in
the patient plane was based on similar Task Group-21 megavoltage. The overall uncertainty
associated with these measurements is of the order of ±20%.
4. Discussion and conclusions
In this work the neutron dose equivalent has been determined at the central axis of the x-ray
beam and outside the beam in the patient plane for 13 different medical accelerators. The
number of neutrons generated in the paraffin moderator due to photon interactions has been
shown to be small [5] and corrections were not made to account for this effect. As a result of
the low photon fluence in the patient plane corrections to account for photoneutron produced
in the Bonner sphere moderator were not required.
The International Electrotechnical Commission (IEC) has proposed a maximum neutron dose
limit in the patient plane of 0.5 mGy of neutrons per Gy of x-ray. This dose limit can be
converted to dose equivalent by use of the quality factor for neutrons. The quality factor for
neutrons varies from 2 to 10 depending on the neutron energy. Using a quality factor of 10 for
fast neutrons yields a value of 5 mSv of neutrons per Gy of x-ray. As can be seen from Table
II none of the accelerators exceed the IETC requirement for neutrons.
The neutron dose equivalent received by a 20 cm thick patient treated with parallel opposed
20 x 20 cm2 beams to a dose of 50 Gy at mid-depth was estimated by use of the depth dose for
a fission spectrum, the maximum beam central axis dose and depth dose values for the x-ray
beam. A value of 0.30 Sv neutron dose equivalent was found for the GE 25 MeV accelerator
based on this technique. Carrying out the calculation using the maximum patient plane dose
30 cm off the central axis one finds a dose equivalent of 0.090 Sv for the GE 25 MeV
accelerator.
These dose equivalent levels do not seem excessive. However, there is at present a major
interest in using intensity modulated radiation therapy (IMRT). When IMRT is conducted the

IAEA-CN-85-8
608
dose equivalent outside the beam will be increased by a factor of 2 to 10 depending on the
treatment system used. The probability of inducing new cancers when this modality is
employed needs to be evaluated. Some possible solutions to this problem would be to add
neutron shielding to the accelerator head and the use of lower energy x-ray beams (10-
15 MV).
References
[1] AERICAN ASSOCIATION OF PHYSICISTS IN MEDICINE, A protocol for the
determination of absorbed dose from high energy photon and electron beams, Med.
Phys. 10(1983) 741-771.
[2] STEPHEN, L.D., SMITH A.R., Fast neutron surveys using indium foil activation,
[3] US AEC Report No. UCRL 84181, Berkley, CA, USA (1958).
[4] MCGINLEY, P.H., KELLY, C.J., “Photoneutron production in the cadmium thermal
shield of a neutron detector”, (Proceedings of the Health Physics Society Midyear
Topical Symposium, Reno, Nevada, 1987), Pergamon Press , New York (1987)244-249.
[5] NATIONAL COUNCIL ON RADIATION PROTETION AND MEASUREMENTS,
Neutron Contamination from Medical Accelerators, Rep. 79, Bethesda, MD (1984).
[6] MCGINLEY, P.H., The photon sensitivity of a moderated neutron detector, Med. Phys.
13 (1986) 700-702.

IAEA-CN-85-298
609
RADIOLOGICAL PROTECTION CONSIDERATIONS DURING THE TREATMENT
OF GLIOBLASTOMA PATIENTS BY BORON NEUTRON CAPTURE THERAPY
AT THE HIGH FLUX REACTOR IN PETTEN, THE NETHERLANDS
R.L. Moss1, J.Rassow
2, E. Finke
2, F.Stecher-Rasmussen
3, W. Sauerwein
2 1 HFR Unit, Joint Research Centre, European Commission, Petten, Netherlands
2 Universitätsklinikum, Essen, Germany
3 Nuclear Research and consultancy Group, NRG Petten, Netherlands
Abstract
A clinical trial of Boron Neutron Capture Therapy (BNCT) for glioblastoma patients has been in progress at the
High Flux Reactor (HFR) at Petten since October 1997. The JRC (as licence holder of the HFR) must ensure that
radiological protection measures are provided. The BNCT trial is a truly European trial, whereby the treatment
takes place at a facility in the Netherlands under the responsibility of clinicians from Germany and patients are
treated from several European countries. Consequently, radiological protection measures satisfy both German
and Dutch laws. To respect both laws, a BNCT radioprotection committee was formed under the chairmanship of
an independent radioprotection expert, with members representing all disciplines in the trial. A special nuance of
BNCT is that the radiation is provided by a mixed neutron/gamma beam. The radiation dose to the patient is thus
a complex mix due to neutrons, gammas and neutron capture in boron, nitrogen and hydrogen, which, amongst
others, need to be correctly calculated in non-commercial and validated treatment planning codes. Furthermore,
due to neutron activation, measurements on the patient are taken regularly after treatment. Further investigations
along these lines, include, dose determination using TLDs and boron distribution measurements using on-line
gamma ray spectroscopy.
1. Introduction
The European clinical trial (EORTC 11961) of BNCT for glioblastoma patients started at
Petten in October 1997 [1]. The treatment of a patient and the potential exposure of personnel
to ionising radiation require by the national Nuclear Energy Law that the JRC (as licence
holder of the HFR) must ensure that radiological protection and monitoring of all personnel,
including external staff, is provided and that the correct radiation protection measures are
taken and followed.
Due to the structure of the European trial, where the treatment takes place at a facility in the
Netherlands under the responsibility of clinicians from Germany, it had to be demonstrated
that measures taken satisfy both German and Dutch radioprotection laws. To respect both
laws, a BNCT radioprotection committee was formed under the chairmanship of an
independent radioprotection expert, with members representing all disciplines in the trial. A
contractual agreement had to be signed between the German institute (University of Essen)
and JRC Petten to guarantee that procedures to be followed complied with German
radioprotection regulations (Strahlenschutzordnung §20). During BNCT, both the patient and
the supporting treatment tools, such as mask and therapy table, become radioactive. As such,
measurements of the patient and surrounds are taken at regular intervals after treatment,
checked and an appropriate form completed and reported to the BNCT Radioprotection
Committee.
As at the HFR, BNCT worldwide is performed using mixed neutron/gamma beams at nuclear
research reactors. The mixed beam must be thoroughly and regularly characterised, using
dosimetry techniques in addition to those of conventional radiotherapy. Furthermore, the
complex beam and subsequent dose distribution in the patient are modelled using treatment
planning codes based on programs developed for nuclear applications, e.g. MCNP [2].

IAEA-CN-85-298
610
To improve radiological protection of the patient and staff, investigations are continuously in
progress to fully characterise the beam (using activation foils, ionisation chambers, TLDs) and
to determine the boron distribution in the patient using on-line prompt gamma ray
spectroscopy.
2. Radioprotection committee
To conform with the Dutch regulations on radio-protection, a Radio-Protection Committee for
BNCT has been formed. The committee has the prime task to review and advise, on a half-
yearly basis, the radio-protection methods used for BNCT. If need be, this advice is
transmitted to any external authority. The Committee consists of members from each
discipline in the BNCT group, and is chaired by an independent expert in radio-protection.
Due to the fact that German staff from Essen University Hospital need to work at Petten,
German regulations on radio-protection, especially application of the radio-protection decree:
§20 StrSchV (Strahlenschutzverordnung), which regulates the activities of German staff in
foreign institutions, had to be contractually agreed. The decree defines regulations on
supervision of the staff, personal dosimetry, rules of behaviour, etc.
Radio-protection includes the issuing of personal dosimeters (type: universal dosimeter) to all
staff, finger or ring dosimeters to the radiotherapists, and pen dosimeters to participants
classified as visitors, eg. nurse(s) and relatives of the patient, [3]. Furthermore it is necessary
to measure and record all material in and out of the reactor and perform activation
measurements on all material used in patient treatment. The patient is an exceptional case, of
course, and it is not required that a personal dosimeter is issued to the patient. However,
following treatment, the patient is monitored for radioactivity. So far, the reported radiation
doses received by the staff are well below the allowable limits.
3. Treatment planning for BNCT
For BNCT it is necessary to perform a full 3D calculation to predict the dose distributions in
the patient’s head. Calculations at Petten are performed with the INEEL treatment planning
program ‘bnct_rtpe/rtt_MC’ [4]. This program is based on a Monte Carlo simulation of the
particle tracks in a full 3D reconstruction of the head. As part of the overall treatment
planning procedure, a quality assurance (QA) system is provided. As part of the QA system, a
quality control procedure for the program involves calculations on two standard test cases, i.e.
a standard patient and standard phantom, which are calculated to check for possible non-
conformance. The cases are chosen in such a way that all the essential parts of the program are
used. A control procedure is followed and performed each time a new version of the program
is installed.
For the patient plans, each treatment plan is calculated in Petten and presented, discussed and
agreed at the radiotherapy department of Essen University during their daily audit on
treatment planning.
4. Patients activation measurements
Standard measurements [3]
BNCT of the patient results in neutron activation of a number of naturally occurring elements
in the irradiated volume, i.e. the head. As a result, activation measurements of the patient's

IAEA-CN-85-298
611
head are taken on 3 separate occasions using a standard portable dose ratemeter (Type: NE-
PDR1). The first measurement is some 1-2 minutes directly following treatment, the second
when the patient leaves the reactor building (5-10 minutes post-BNCT) and lastly, just prior to
the patient leaving Petten to return to the hospital in Amsterdam (30-45 minutes post-BNCT).
Measurements are taken both at contact and at 30cm distance from the head. The results have
been compiled for all patients.
In summary, peak levels, i.e. at contact and directly after radiation, are of the order of 40-50
�Sv/h, falling to less than 10 �Sv/h some 30-50 minutes after treatment. The remaining
activity is predominately due to 24
Na only (half-life = 15 h). Activity due to other elements
have much shorter half-lives, hence do not contribute or are not additive to the final levels.
Measurements, taken at 30cm from the patient’s head are an order of magnitude lower. Hence,
the dose received by medical staff and relative(s) accompanying the patient is well below
recommended limits. Activation measurements using a portable gamma analyser [3]
As one of the many research topics associated with BNCT, gamma-ray spectrometry
measurements have been performed on 2 patients. The equipment or counting chain consists
of an EG&G HPGe detector (relative efficiency and FWHM at 1.33 MeV of Co-60: 12.7%
and 1.71 keV, type : 26N-1602C), an EG&G 459 high voltage power supply, an EG&G 572
amplifier, an ECN portable power supply and a Canberra Accuspec interface, mounted in a
Toshiba 3200 SX laptop computer.
Shortly after the treatment, a patient was placed on a chair in the BNCT-Wing, where the
portable spectrometer had been set-up. Prior to the arrival of the patient, background
measurements were taken. The resulting spectra, with and without the patient, were analysed.
The predominate isotopes were, as expected, identified as 38
Cl, 49
Ca and 24
Na. However, in
one patient, the isotopes 198
Au and 116m
In, were also present. It was concluded that the former
isotope was due to (this) patient's gold filling and the latter isotope, assumably, due to the
content of one of the drugs taken by the patient. It should be noted that only those
radioisotopes which are gamma emitters have been measured.
5. Beam Characterization
Dosimetry guidelines, as followed in conventional treatment centres, apply to photon, electron
or fast neutron facilities. For BNCT facilities, where an epithermal neutron beam is used, the
beam (in air) includes fast neutrons (>10keV) and gamma rays. The latter comes from both
the beam itself (reactor gammas) and from activation of the in-beam material. In human
tissue, containing boron-10 compounds, the beam produces effectively four main dose
components, all with different biological effectiveness: the boron neutron capture absorbed
dose, the nitrogen neutron capture absorbed dose, the fast neutron absorbed dose and the
gamma ray absorbed dose.
Furthermore, the neutron beam emanates from a reactor, which in the case of the HFR, has a
strict operating schedule, running 24 hours per day for eleven cycles of 4 weeks each, per
year. Hence due to burn-up of the reactor fuel, the intensity of the beam over the scheduled 4
weeks cycle reduces by some 4-5%. Also, the intensity of the beam at the start of each cycle
may vary by some ±4% per cycle, due to experimental loading changes in the reactor. Hence,
quality assurance of the beam during treatment must follow a strictly controlled procedure,
which includes the following steps:

IAEA-CN-85-298
612
�� free beam measurements on a monthly basis, using a multi-foil packet consisting of 12
activation foils,
�� on the first day of the treatment week (each patient receives a fraction of radiation on four
consecutive days), reference phantom measurements are performed using activation foils,
twinned ionisation chambers and a pn-diode,
�� the measurements are used to calibrate the on-line monitors (see next section),
�� on succeeding days of treatment, the reference phantom measurements are repeated using
the pn-diode, twinned ionisation chambers and the in-beam monitors, which are all
normalised to the first day's measurements.
Following the QA system, as well as Good Clinical Practice (GCP) [5,6], all measurements
are written down, controlled and countersigned by the responsible person, documented and
later archived. Despite the complexity associated with BNCT dosimetry, QA procedures
applied for BNCT infer less radiation and operational procedures than for conventional
radiotherapy. Furthermore, reproducibility in BNCT is equivalent with medical accelerators,
whilst all safety requirements and equipment functions, including against stray radiation are
equivalent. The above philosophy is being developed, along with other European groups, to
formulate a European Code of Practice on Dosimetry for BNCT [7].
Additional investigations are underway using thermoluminescence dosimeters (TLDs) which
have become the current dosimetric tool in photon, electron and neutron radiation beams for
dose determination in "in-vivo" dosimetry, as well as in phantoms simulating patients
treatments. The epithermal neutron beam used in BNCT, has gamma and neutron components,
which have different relative biological effectiveness (RBE). Hence, knowledge of the
separate dose components is required for a safe patient treatment. For reliable and accurate TL
dosimetry in BNCT, a study is in progress looking at the detector response to the mixed field
in order to determine the sensitivity to each component [8]. The work investigates:-
�� Comparative examinations for the selection of TLD's for further application
�� Examination of surface properties of TLD 300
�� Calibration of the TLD 300
As part of the study, in-vivo measurements have been performed on 4 BNCT patients using
TLD 300s. Initial results are related alone to treatment parameters without any patient
influence. Simultaneously, measurements were done inside the patient mask at the centre
point of the beams on the patient entrance and exit surface for both beams. These results are
dependent on treatment parameters of the BNCT facility as well as the patient related
parameters.
6. Prompt gamma ray spectroscopy
Application of prompt gamma spectroscopy (PGS) may improve the safety and efficacy of
BNCT [9]. PGS holds the potential of in-vivo boron concentration determination at the time
of the treatment through the detection of gamma rays promptly emitted in the 10
B(n,α)7Li and
1H(n,γ)
2D reactions. A series of phantom measurements have been performed, where a tumour
within a homogeneously boronated head phantom was simulated [10]. The results indicate
that it is possible to determine a boron concentration of 5 µg/g with an accuracy of ± 3 % in a
homogeneous boron distribution. Subsequent measurements have been recently performed on
patients. The results are pending. Nevertheless, the technique looks very promising and work
continues.

IAEA-CN-85-298
613
Acknowledgements
The clinical trials at Petten are financially supported by the European Commission's
“Biomedicine and Health Research” (BIOMED II) Programme, contract no. BMH4-CT96-
0325 and the “Quality of Life and Management of Living Resources” Programme, contract no.
QLK3-CT-1999-01067
References
[1] Hideghéty K., Sauerwein W., De Vries M., Grochulla F., Goetz C., Haselsberger K., et
al., “Post-operative Treatment of Glioblastoma with Boron Neutron Capture Therapy at
the European High Flux Reactor Petten (EORTC protocol 11961)”, Ann Oncol 9 (suppl
2) (1998): 129.
[2] Briesmeister, J.F., “MCNP - A General Monte Carlo N-Particle Transport Code”,
Version 4B, LA-12625- M, Los Alamos National Laboratory, 1997.
[3] Moss,R.L., Stecher-Rasmussen,F., Keverling-Buisman,A., Rassow,J., Sauerwein,W.,
“Radioprotection for patients and staff during BNCT at the HFR Petten”, Proc. 8th
International Symposium on Neutron Capture Therapy for Cancer, La Jolla California,
September 1998, Plenum Press
[4] Nigg,D.W., "Methods for radiation dose distribution analysis and treatment planning in
boron neutron capture therapy", Int.J.Radiat. Oncol. Biol. Phys. 28; 1121-1134, 1994
[5] Bohaychuk,W., Ball,G., "Good Clinical Research Practices, An indexed reference to
international guidelines and regulations, with practical interpretation", GCRP
Publications, January 1994
[6] Good Clinical Practice for Trials on Medicinal Products in the European Community,
Committee for Proprietary Medicinal Products [CPMP] EEC 111/3976/88-EN, July
1990
[7] Stecher-Rasmussen,F., "Code of Practice for BNCT Dosimetry", IAEA Joint Technical
Committee Meeting on "Current Issues Relating to Neutron Capture Therapy (F1-TCM-
1095)", IAEA Headquarter Vienna, 14-18 June 1999
[8] Finke, E., Hidegéty K., Kessler,C., Morrissey,J., Moss,R., Rassow,J., Sauerwein,W.,
“In-vivo measurements with TLD detectors for BNCT of glioblastoma patients at the
High-Flux Research Petten/NL”, Proc. 9th International Symposium on Neutron
Capture Therapy for Cancer, Osaka, Japan, October 2000
[9] Verbakel, W. and Stecher-Rasmussen, F., “γ-ray telescope for on-line measurements of
low boron concentrations in a head phantom for BNCT," Nucl. lnstr. Meth. A 394,163-
172 (1997).
[10] Munck af Rosenschöld,P., Verbakel,W., Ceberg,C., Stecher-Rasmussen,F., Perrson,B.,
“Towards clinical application of prompt gamma spectroscopy for in-vivo monitoring of
boron uptake in BNCT:, Proc. 9th International Symposium on Neutron Capture
Therapy for Cancer, Osaka, Japan, October 2000
IAEA-CN-85-255
614
QUALITY CONTROL IN RADIOTHERAPY TREATMENT:
RADIATION INDUCED MYELOPATHY
E. Fernández-Vicioso1, R. Ruiz-Cruces
2
1 Radiation Oncology, Adventure Comprehensive Cancer Center,
Adventure, Florida, United States of America 2 Radiology Department, School of Medicine, University of Malaga, Spain
Abstract.
Direct injury of the spinal cord has been reported many times, particularly in cases of overexposures with
radiotherapy of neoplasm that occurred outside the Central Nervous System. Permanent damage to the spinal
cord is the most feared complication of radiation therapy treatments and one of the relatively common causes of
litigation for medical malpractice in the context of cancer treatment. We have learned from clinical experience;
data from randomized trials and animal experimentation the dose tolerance as well as the interfraction interval for
hyperfractionation regimes. We are still lacking precious clinical information, in particular the dose tolerance in
combined modality treatments that represent the vast majority of modern treatments.
1. Clinical presentation
The overall functional repercussion of myelopathy depends on the segments of the spinal cord
affected. In general, radiation-induced lesions of the spine have a shorter latent period to the
clinical manifestation than do similar brain lesions [1]. The spinal cord often is unable to
tolerate the absorbed dose levels necessary to eradicate malignant tumors. In many cases, there
is a delayed myelitis. The most radiosensitive portion of the CNS appears to be upper thoracic
segments and the lower lumbar and sacral segments [2].
Radiation myelopathy presents initially as a subtle unilateral or bilateral sensory deficit,
diminished temperature sensation and proprioception, as well as discrete paresis. Pain is not a
prominent feature. These signs and symptoms may progress gradually, to overt sensory deficit,
paralysis, spasticity and incontinence, or may stabilize at any level of partial neurological
deficit. Hyperreflexia, and Babinski, are often found on neurological exam. Often, signs of
Brown-Sequard can be found (ipsilateral paralysis and loss of discriminatory and joint
sensation, and contralateral loss of pain and temperature sensation).
The diagnosis is generally made by exclusion. First, it is essential to rule out other causes of
spinal cord injury like spinal cord compression. Second, the features of neurologic deficit
must correlate with the segment of spinal cord irradiated. Finally, time to expression of injury,
and the dose received must be consistent with the scientific available data. It is important to
keep in mind that there are some predisposing factors that may decrease the latent period and
/or increase the incidence of radiation myelopathy. Such factors are previous CNS damage,
vascular diseases and concurrent chemotherapy. Diagnostic workup usually yields nonspecific
results. MRI may show cord swelling, decrease intensity in T1 and increased in T2, indicative
of edema. The CSF is normal, or it has slightly elevated total protein, elevated myelin basic
protein, and lymphocytes. The prognosis depends primarily upon the degree and level where
the cord is transected. The actuarial mortality from radiation myelopathy at 18 months is 55%
for cervical lesions, and 25% for thoracic lesions. Those patients are usually treated with
steroids to reduce edema, with some improvement. Supportive care and rehabilitation are also
cornerstones.

IAEA-CN-85-255
615
2. Pathology
Radiation injury to the spinal cord is limited to the white matter. The dominant features,
although not pathognomonic are demylination and malacia that are accompanied by a variable
degree of gliosis and vascular anomaly. Using morphologic features, the cases of radiation
myelopathy can be divided in 3 categories:
�� Type I, with predominant white matter demylination and malacia.
�� Type II with mainly vascular changes.
�� Type III, where there is a combination of both components.
In general latent periods of 17-18 months are associated with Type I or III lesions. Vascular
changes encounter in Type III lesions are endothelial alterations, teleangiectasia, hyalinosis,
and fibrinoid necrosis. In contrast, longer latencies tend to be associated with the Type II,
where the vascular abnormalities are vascular thrombosis, necrosis and hemorrhage. Type III
is the most frequent in humans. In addition to architectural changes, there are modifications in
the cellular composition within the white matter. Atrocities and microglia are increased in the
irradiated segment, instead of the normal nerve fibers surrounded by myelin.
3. Dose-incidence relationship and physical factors
The dose-response relationship is now well established. Schultheiss and Stephens in 1992 [3]
reviewed the literature, indicating that a total dose of 45 Gy in 22-25 fractions, results in a
myelopathy incidence of 0.3% or less. A realistic estimate of the Estimated Dose to produce
myelitis in 5% of the patients treated with radiation therapy delivered in fractions of 2 Gy is
between 57 and 61Gy (ED 5).
Moreover, there is a 25-50% incidence of thoracic cord myelopathy at dose levels of 60 Gy
with 2 Gy fractions, 40 Gy with 3 Gy fractions and 35 Gy with 4 Gy fractions [1]. In the Costa
Rica radiotherapy accident, there were 3 patients who developed spinal cord complications (2
became quadriplegic and one became paraplegic). These patients had received 50 to 57 Gy in
15 to 17 fractions. Also, the major cause of fatality was the myelitis (5 patients) in the
Zaragoza radiotherapy accident (Spain) [1].
There are no firm clinical data to support the general belief that the radiation tolerance of the
spinal cord of children is much lower than that of adults. However, the few cases of myelitis
that have been observed and reported happened in doses of about 40 Gy in fractions of less
than 2 Gy. It is reasonable to assume a lower tolerance in clinical practice, so the dose should
be reduced by 5-10% in children.
The quality control of the radiotherapy treatment is very important in assessing the risk of
myelopathy. If a radiation field is very long, this risk is greater, particularly when adjacent
field radiotherapy is performed with overlap in the treatment field.
4. Dose fractionation and interfractionation interval
In the linear quadratic model, the endpoint of delayed white matter necrosis has an �/� ratio
of 2 Gy. This is typical of a late reacting tissue; it means a strong dependency of radiation
IAEA-CN-85-255
616
tolerance on fraction size. This fact suggests that hyperfractionation (reduction in the fraction
size) would, in theory, reduce the risk of myelopathy [4].
The importance of intervals between fractions is a recent hot issue, since the high incidence of
radiation myelopathy in CHART, a regime with three daily doses of radiation, where the time
between fractions was kept to a minimum of 6 hr. This was based on the initial results on a
rodent study showing a half time of repair of 1.5 hr. There is a study by Ang at al [5] showing
that cellular repair of sublethal damage proceeds at slower rate of up to 3.8 hr. so the high
incidence of radiation myelopathy in CHART can be attributed to incomplete repair between
fractions. To minimize the risk of myelopathy it is prudent to allow an interval of at least 6
hours, preferably 8, when the schedule is two times a day. In treatments delivered three times
a day, due to compounding incomplete repair, the dose to the spinal cord must be reduced in
10-15%.
There are some studies in rodents carried out by Van der Kogel [5-7], evaluating the
contribution of the overall treatment time in determining the radiation tolerance of the spinal
cord. These data suggest that protracted radiation courses do not appreciably increase the
tolerance of the spinal cord
5. Volume effects
It has been accepted that the dose to the spinal cord should be reduced when the volume
(number of cord segments) is large. This tradition evolved based on the belief that radiation
volume is a strong determinant of cord tolerance. Clinical data are scarce and inconclusive,
but now we have data form large animals (pig, dog, and monkey). Doubling the treatment
volume leads to a reduction of 4% of isoeffective dose at a 1-55 incidence level. This means
that in treatment settings, where the probability of myelopathy is less than 1% (the rule),
changes in treatment volumes have minimal impact on cord tolerance.
Kramer et al have indicated the maximum acceptable dose to the cervical and lumbar spinal
cord to be 50 Gy in 25 fractions over 5 weeks and, to the thoracic cord 45 Gy delivered over
4½ to 5 weeks [8]. Other works reported tolerance doses range between 35 Gy in 4 weeks and
50 Gy in 5 weeks [9-10]. If these doses are exceeded, transient radiation myelopathy and,
perhaps, paralysis may result.
Fitzgerald et al. indicated that 13% of patients who received 40 Gy in an accelerated
fractionation scheme and survived 11 months developed progressive myelitis [11].
Diche et al. [12] have examined 754 cases of radiation myelitis post-radiotherapy for lung
cancer. They have shown a threshold dose for thoracic radiation myelitis in fractionated
radiotherapy of 33.5 Gy. Georgiou et al. indicated [13] a dose to the lumbosacral plexus of 73
Gy and only 4 patients developed plexopathy in this anatomical zone.
6. Reirradiation (recovery form occult radiation injury)
This is an important issue in head and neck patients, who once they are cured, have a chance
of 25% of developing a second primary. At the present time most radiation oncologist are
reluctant to treat such patients, because of the misconception that previously irradiated tissues
cannot be re-treated, particularly the spinal cord. There is experience on retreatment of
recurrent brain tumors and nasopharyngeal tumors suggesting the existence of long-term

IAEA-CN-85-255
617
recovery in the CNS. But in order to developed a rational strategy, and based on previous
rodent model by Van der Kogel [5], Ang [6] developed a monkey model, irradiating monkeys
at 44 Gy in 20 fractions, with re-irradiation 2 yr. later, with cumulative doses of 83.6, 92.4,
101.2, and 110.0 Gy. Only 2/16 animals developed myelopathy. Asymptomatic animals were
observed for at least 2 yr. after the re-treatment. These data indicate that the majority of occult
injuries induced by the initial treatment have recovered within 2 years
7. Relation with chemotherapy
There are clinical data indicating that the risk of myelopathy in children is increased when
intensive chemotherapy (IV and IT MTX and Ara-C) is administered concurrently with XRT.
Quantitative assessment in a rodent model, carried out by Van der Kogel [5], showed that IT
Ara-C reduces the radiation tolerance of the spinal cord by about 20%
References
[1] Mettler, F. Medical Management of Radiation Accidents. 2001.
[2] Mettler FAJ. Emergency management of radiation accidents. Jacep. 7(8):302-5. 1978.
[3] Schultheiss and Stephens, Invited review: Permanent radiation myelopathy, Br. J.
Radiol. 65:737. 1992.
[4] Lo Y, Taylor JM, McBride WH, Withers HR. The effect of fractionated doses of
radiation on mouse spinal cord. Int. J. of Radiat Oncol. Biol. Phys. 27(2):309-17. 1993.
[5] Ang, KK. Van der Kogel, AJ. Effects of therapy on CNS functions in children. In
Cassady, R, “Radiation Therapy in Pediatric Oncology, Springer-Verlag, 133-149. 1995.
[6] Ang, KK, et al. The tolerance of the primate spinal cord to re-irradiation. Int. J. of
Radiat. Oncol. Biol. Phys. 25. 459. 1993.
[7] Ang, KK et al. Prevention and management of radiation myelopathy. Oncology, 8(11):
71-76. 1994.
[8] Kramer S, Lee KF. Complications of radiation therapy: the central nervous system.
Seminars in Roentgenology 9(1):75-83. 1974.
[9] Pallis CA, Lowis S and Morgan RL. Radiation myelopathy. Brain 84:460-478. 1961.
[10] Philips TL and Bushke F. Radiation tolerance of the spinal cord. Am. J. Roentgenol.
105:659-664, 1969.
[11] Fitzgerald RH, Marks RD and Wallace KM. Chronic radiation myelitis. Radiology.
144:609-612, 1982.
[12] Diche S, Warburton M and Saunders M. Radiation myelitis and survival in the
radiotherapy of lung cancer. Int. J. of Radiat. Oncol. Biol. Phys. 15:75-81. 1988.
[13] Georgiou A, Grigsby P Perez C. radiation-induced lumbo-sacral plexopathy in
gynecologic tumors: clinical findings and dosimetric analysis. Int. J. of Radiat. Oncol.
Biol. Phys. 26:479-482. 1993.

IAEA-CN-85-223
618
QUALITY ASSURANCE IN RADIOTHERAPY
S. Groth, A. Meghzifene, H. Tatsuzaki, V. Levin, J. Izewska
Division of Human Heath, International Atomic Energy Agency, Vienna
Abstract
Quality assurance in the management of a patient receiving radiation therapy and the role of the radiation
oncologist and medical physicist in this process is described. The constraints on available personnel is recognised
and the need for further education resources and IAEA activities in education for both groups described. IAEA
activities in the clinical and dosimetric aspects and the resultant publications and education have contributed to a
culture of quality assurance.
1. Introduction
Radiotherapy involves the use of ionizing radiation in the treatment of cancer patients. It is a
multi-disciplinary speciality involving the use of complex equipment and procedures. It
includes many phases, from diagnosis to clinical decision to undertake treatment, treatment
delivery and follow-up. A systematic and comprehensive approach to quality assurance (QA),
covering all these phases, is of vital importance to ensure optimum treatment of patients. Such
QA programmes have been recommended by many professional bodies such as ESTRO [1]
and AAPM [2], and should follow the guidelines given in the Basic Safety Standards (BSS)
[3] and by WHO [4]
The main rationale and justification for quality assurance in radiotherapy is to ensure that not
only does the patient receive good quality treatment but is also protected from accidents and
errors (random and systematic). QA aims at minimizing the occurrence of random errors and
at eliminating large systematic errors, contributing to the minimization of the morbidity rate
and maximization of the cure rate of radiotherapy patients. This concept is emphasized in the
BSS [3]. Patient safety is therefore integrated within the overall QA programme of
radiotherapy [5].
At the national level, the establishment of a QA programmes should take into account
international recommendations and existing national guidelines. To ensure that radiation
therapy centres have a common basis for developing and implementing their quality assurance
programmes, professional bodies representing radiation oncologists, medical physicists and
medical radiation technologists should develop national guidelines or standards for radiation
therapy quality assurance and set out a uniform quality assurance program to be adopted by all
radiation therapy centres, taking into account the level of practice in the country. Several
major issues should be considered before the establishment of a national quality assurance
program for radiation therapy, including the licensing and regulation of radiotherapy
equipment, the accreditation process, if it exists, the problems with the review process and
compliance, the cost-benefit analysis of setting up an independent external quality assurance
programme, the need to maintain confidentiality of patient records and the need to respect
professional standards.
The IAEA assists its Member States to establish and implement national QA programmes
through its programmatic activities and Technical Cooperation projects. The IAEA assistance
is directed to national regulatory bodies for the establishment of a regulatory framework,
which complies with the BSS, to standards laboratories for metrological traceability, and to
end users at hospitals for the development and implementation of QA programmes.
Traceability of radiation measurements for radiotherapy dosimetry and quality audit services,
run jointly with WHO, such as the IAEA/WHO postal TLD service for the verification of the

IAEA-CN-85-223
619
clinical beam output, are also offered by the IAEA to the Member States. To coordinate its
activities in QA in radiotherapy, close cooperation is maintained with other international
organizations and professional bodies such as WHO, ICRU, ESTRO and IOMP.
2. Requirements for QA
QA in radiotherapy encompasses all procedures which aim to ensure a consistent and a safe
fulfilment of dose prescription to the target volume while minimizing the dose to normal
tissue, minimal exposure to personnel and the public. It involves all clinical, physical and
technical, and safety procedures. The QA programme should be established by professionals
working in the field of radiotherapy, taking into account the level of practice in the country
and following international recommendations and guidelines. Either voluntary quality
assurance guidelines or mandatory regulations could be used to achieve national uniformity.
In both cases, however, a peer review program to audit the compliance with the national
standards, if they exist, or international guidelines, should be established. If necessary,
compliance with the national standards can be made as a condition of the licensing process.
The IAEA has established guidelines, taking into account clinical, medical physics, radiation
protection and safety considerations, for designing and implementing radiotherapy
programmes at the national level [5].
3. Staff requirements
The clinical use of ionizing radiation is a complex process, involving highly trained personnel.
It is important that all staff dealing with patients, radiation sources and equipment have the
necessary education background, adequate training and recognition of their status. The main
categories of staff required and their responsibilities and training requirements are given
elsewhere [2, 6, 7].
The shortage of professionals in the field of medical physics in developing countries is fully
recognized. In the northern part of Africa, the number of medical physicists in radiotherapy
per million population, is less than 0.3 whereas it fluctuates from 2 to 15 in Europe (according
to data published by the European Federation of Organizations of Medical Physicists in
Europe (EFOMP) [21]). In addition, the competency and qualifications of medical physicists
in Europe are wellcontrolled through national regulations and the European Directive [22].
This is not the case in many developing countries where in reality the number of “qualified
medical physicists” may be even lower. Consequently, the development and implementation
of QA programmes in radiotherapy in many developing countries can be severely hampered
by the lack of professionals in the field of medical physics.
A similar situation exists in the clinical field where, in some developing countries, a radiation
oncologist may be responsible for upwards of 500 new patients per year in contast to 250 in
developed countries.
4. Radiation protection and safety aspects
The general requirements include the review and approval by the regulatory authority aiming
at ensuring radiation protection and safety of sources. These requirements cover all aspects
described in the BSS and regulatory guidance [19]. In addition to administrative requirements,
the control of exposure (occupational, medical and environmental), the safety of sealed
radiation sources and equipment, including accessories, require conformity with ISO [10, 11,
12] and IEC standards [8, 9], respectively.

IAEA-CN-85-223
620
National regulatory bodies should apply the requirements of the BSS, together with national
regulations, to review radiotherapy practice.
Radiotherapy centres can use the guidance provided in the BSS or propose alternative
measures with an equivalent level of protection and safety [19].
5. Clinical aspects
This process commences with patient registration. Besides the domiciliary and medical
records, the pathological diagnosis should be part of a national and institutional cancer
registry. Pre-treatment evaluation with combined clinical assessment has a vital role in
selecting the optimal management strategy within the limitations of resources. The patients’
rights through informed consent must be respected. Psychosocial problems need to be
addressed during and after treatment, both for the patients’ benefit and to assure their
compliance. Treatment planning and daily treatment need to be accurate and to be recorded.
During the treatment period, the patient must be examined periodically and the treatment plan
modified if required. Finally, an established patient follow-up procedure is required to pre-
empt or manage complications and as a long-term assessment of the efficacy of management.
The two major tools to assist in achieving this clinical quality assurance are: firstly an
institutional protocol manual clearly identifying the clinical management practice for the
institution in all its multidisciplinary aspects, respecting the constraints within an institution,
and secondly a departmental procedure manual, covering both clinical (immobilisation,
simulation) and physical procedures.
6. Physical and technical aspects
The physical and technical aspects of the QA programme are usually performed under the
responsibility of the medical physicist and cover the following areas: quality control of
equipment including acceptance testing and commissioning; beam dosimetry including
traceability of measurements and use of a code of practice; treatment planning and patient
treatment including final verification of the accuracy of the delivered dose. The details of such
QA programmes are described extensively by IAEA [5], AAPM [2] and ESTRO [1].
7. Organizational relationship and responsibility for quality
At the institutional level, the organizational structure of a radiotherapy centre should be well
defined. An essential element is the establishment of an organizational chart, which should
clearly show all hierarchical, functional and operational relationships. All responsibilities,
tasks and competencies of each staff member must be clearly defined. For each task, a
responsible person must be designated. In particular, the organizational structure should
indicate who could stop radiotherapy treatments. It is a general practice to have the medical
practitioner (radiation oncologist) be the responsible person for the medical exposure [20],
including the protection of the patient. It is also usual practice for the medical practitioner to
delegate parts of this responsibility to qualified persons. The medical physicist usually takes
responsibility for the physical and technical aspects of QA [2, 5, 7].
At the multi-institutional level, there is a need to coordinate activities related to the external
QA programme. It is well established that metrology institutions, such as Secondary Standards
Dosimetry Laboratories (SSDLs), are usually competent to check the beam calibrations.

IAEA-CN-85-223
621
External QA groups which include experts from the metrology institution and radiotherapy
centres should be set up at the national level. The IAEA has helped 12 countries to establish
External Audit Groups (EAGs) through a Research Coordinated Project [23].
8. IAEA activities in support of QA in radiotherapy
The IAEA activities in support of QA in radiotherapy cover a large spectrum. In particular, the
IAEA Division of Human Health provides:
- services to Member States for metrological traceability and external quality audits to
radiotherapy centres, in collaboration with the IAEA Laboratories in Seibersdorf,
- research and development to foster exchange of information and help in the transfer of
know-how in the field of QA in radiotherapy, covering clinical, physical and technical
aspects, and
- support to technical cooperation projects in the field of radiotherapy and medical
radiation physics, including training and education of staff.
Through its research and development activities in the clinical aspects of QA, both potentially
optimal treatments and resources-sparing treatments are investigated. In the physical and
technical aspects of QA, the IAEA Division of Human Health promotes standardization and
harmonization of codes of practices and procedures used in QA, in close cooperation with
other international organizations and professional bodies.
Education is the foundation for all quality assurance. To this end, the IAEA is in the process
of developing a distance-learning programme to assist in the training of the basic sciences of
radiation oncology intended primarily for radiation oncologists and therapy technicians.
9. Traceability and quality audit services
In the framework of the international measurement system the IAEA, in collaboration with the
Bureau International des Poids et Mesures (BIPM), provides the metrological link through its
IAEA/WHO network of Secondary Standard Dosimetry Laboratories (SSDLs) for traceable
calibrations needed in radiotherapy. The IAEA's support is accomplished with the
transmission of calibration factors for national measurement standards from the BIPM or
Primary Standards Dosimetry Laboratories (PSDL) linked to the international measurement
system. Each year, the IAEA provides traceability for radiotherapy dosimetry to about
20 Member States, mainly to those countries who are not members of the “meter convention”
and do not have access to a PSDL. As a second step, dose quality audits and follow-up
programmes are implemented to help the Member States ensure that the standards transmitted
to hospitals are kept within the levels required by the international measurement system [14].
These programmes include intercomparisons of ion chamber calibrations made by SSDLs and
dose quality audits using mailed Thermo Luminescent Dosimeters (TLDs). The
intercomparison programme is available to the member laboratories of the IAEA/WHO SSDL
Network, while dose quality audits are provided to radiotherapy centres through the
IAEA/WHO TLD postal dose service. Both programmes are essential for assuring high
accuracy in clinical dosimetry.
Ionization chambers are used in the intercomparison programme to assess the ability of the
SSDLs to calibrate their own as well as hospital’s dosimeters. About 40 SSDLs participated in
this programme with 90% of the results within the acceptance level of �1.5%. The TLD
programme for SSDLs annually checks about 80 beam calibrations by 60 laboratories with
95% of the results within the acceptance level of �3.5%. The TLD programme for hospitals

IAEA-CN-85-223
622
aims at ensuring proper calibration of radiotherapy beams. The IAEA is responsible for the
technical aspects of the service and WHO (or PAHO) takes care of the mailing and
distribution of the TLD capsules to radiotherapy hospitals. This service checks approximately
400 clinical beams per year and has checked a total of more than 3500 radiotherapy beams in
approximately 1000 centres. At present, about 80% of the results are within the acceptance
level of �5%, compared to 65% in the past. Subsequent follow-up actions in centres with poor
results have helped the radiotherapy centres resolve the discrepancies, thus preventing further
mistreatment of patients.
10. Codes of Practice
The IAEA has maintained an interest in standardization and development of Codes of Practice
(CoP) for radiotherapy dosimetry going as far back as the seventies, resulting in several
publications in the field. The IAEA has published the first CoP in 1970 [15], followed by
“Absorbed Dose Determination in Photon and Electron Beams” (TRS-277) in 1987 and
updated in 1997 [16]. Another Code of Practice (TRS-381) for radiotherapy dosimetry on “the
Use of Plane-Parallel Ionization Chambers in High-Energy Electron and Photon Beams” was
published in 1997 to update TRS-277 and complement it in the field of parallel-plate
ionization chambers [17]. Following the world trend in radiation dosimetry, the IAEA had
developed a new Code of Practice, based on absorbed dose to water standards, under the
framework of a Co-ordinated Research Project. This CoP has been endorsed by WHO, PAHO,
and ESTRO and will be published soon by the IAEA on behalf of these organizations as TRS-
398 [18].
The Codes of Practice developed by the IAEA on absorbed dose determination in radiotherapy
beams [TRS-277, TRS-381] are presently used by many physicists involved with dosimetry in
radiation therapy, and have been adopted by several countries as their national dosimetry
protocol.
11. Technical co-operation projects
The IAEA's Technical Co-operation Programme is based on an assessment of the
development priorities and conditions in each specific country or region. The programme also
includes regional and interregional projects that are developed to improve the efficiency of
implementation or to utilize better the collective experience and resources of multiple
Member States. During 2000, the IAEA Division of Human Health provided technical
assistance to 64 national projects to support the establishment of radiotherapy services or to
improve QA of the operational radiotherapy centres in the Member States. In addition, 10
regional projects, aiming at solving common problems in the geographical region mainly
through training courses or workshops were also supported. Twelve IAEA Regional Training
Courses, covering clinical, physical and technical aspects of QA in radiotherapy, were
organized during 2000.
Taking into account the shortage of medical physicists in developing countries, support for the
development of university degrees in medical radiation physics has become an important goal.
This has been implemented with success, under a technical cooperation project in the Latin
American Region and may be extended to East Asia and Africa. In addition, training courses
and workshops, covering all aspects of QA, are organized each year by the IAEA. These
training courses are directed towards radiotherapy staff, i.e. radiation oncologists, medical
radiation physicists, maintenance engineers, and radiographers, including technicians. In
addition, attendance at training courses provided by ESTRO is supported by the IAEA.

IAEA-CN-85-223
623
Through training courses on clinical topics, the IAEA promotes an awareness of the best
evidence-based standards of management of clinical problems and encourages subsequent
development of the relevant protocol and procedure manual entries. Concerning the physical
and technical aspects, the training courses and workshops provide a unique opportunity to
physicists to harmonize procedures and for continuous upkeep of knowledge and exchange of
experience in QA.
12. Conclusion
There are many indicators that the IAEA through its different activities is assisting the
Member Sates in the development and implementation of QA programmes in radiotherapy.
These activities also help disseminate not only the technical knowledge but also the basic
ingredient of the QA culture. The IAEA maintains close contacts and cooperation with other
international organizations and QA networks to coordinate its activities and avoid duplication
of efforts.
References
[1] European Society for Therapeutic Radiology and Oncology, Quality Assurance in
Radiotherapy, Report to the European Union for the “Europe Against Cancer
Programme”, (1994)
[2] American Association of Physicists in Medicine, Comprehensive QA programme for
radiation oncology: Report of AAPM Radiation Therapy Committee Task Group-40,
Med.Phys. 21 (1994) 581-618
[3] International Atomic Energy Agency, International Basic Safety Standards for
Protection against Ionizing Radiation and for the Safety of Radiation Sources, Safety
Series No. 115, IAEA, Vienna (1996).
[4] World Health Organisation (1988) Quality assurance in radiotherapy. WHO, Geneva
[5] International Atomic Energy Agency, Design and Implementation of a Radiotherapy
Programme: clinical, medical physics, radiation protection and safety aspects, (IAEA-
TECDOC-1040). IAEA, Vienna (1998)
[6] Inter-Society Council for radiation oncology in integrated cancer management (blue
book), report of the ISCRO, 1991.
[7] Belletti & al, “QA in radiotherapy; the importance of medical staffing level”,
Recommendations from an ESTRO, EFOMP joint task group, Radiotherapy &.
Oncology. 41 89-94, (1996).
[8] International Electrotechnical Commission, Medical Electrical Equipment. Part 1:
General requirements for safety, Pub. IEC-601-1, IEC, Geneva, (1988).
[9] International Electrotechnical Commission, Medical Electrical Equipment. Part 2:
Particular requirements for the safety of radiotherapy simulators, Pub. IEC-60601-2-29,
IEC, Geneva, (1993).
[10] International Organization for Standardization, Sealed radioactive sources-General,
ISO-1677-1977, ISO, Geneva, (1977)
[11] International Organization for Standardization, Sealed radioactive sources-Leakage test
methods, ISO/TR 4826, ISO, Geneva, (1979)
[12] International Organization for Standardization, Sealed radioactive sources-
Classification, ISO-2919-1980, ISO, Geneva, (1980)
[13] Quality Assurance in radiotherapy, Rad Onc 35, 61-73, 1995 (10)
[14] Andreo & al, IAEA Dosimetry Programme: Report on Activities in 197-1998, CCRI (1),
1999

IAEA-CN-85-223
624
[15] International Atomic Energy Agency, Manual of Dosimetry in Radiotherapy, (TRS-
110), IAEA, Vienna, 1970
[16] International Atomic Energy Agency Absorbed dose determination in photon and
electron beams: An international Code of Practice, 2nd
edn. (TRS 277). (1997), IAEA,
Vienna
[17] International Atomic Energy Agency The use of plane parallel ionization chambers in
high energy electron and photon beams (TRS 381). (1997), IAEA, Vienna
[18] International Atomic Energy Agency, Absorbed Dose Determination in External Beam
Radiotherapy: an International Code of Practice for Dosimetry based on Standards of
Absorbed Dose to Water, (TRS-398), IAEA, Vienna in press.
[19] International Atomic Energy Agency, Regulatory Guidance: Radiation Protection and
Safety in Radiotherapy, to be submitted for publication as Interim Report for
Comments, IAEA, Vienna
[20] European Commission, Implementation of the “Medical exposure directive” (97/43
Euratom), Proceedings of an International Workshop, Madrid, 27 April 1998.
[21] K.A Jessen, the role of EFOMP in the European structures, for implementation and
harmonization of QA programmes in radiotherapy, Proceedings of an IAEA-ISRO joint
meeting, 8-9 May 1995, IAEA TECDOC-989, (1997), IAEA, Vienna
[22] European Communities Council. Directive 84/466/Euratom, 3 September 1984. Off. J.
Eur. Commun. 5 October 1984, 27, L 265/1.
[23] Report of the first Research Coordination Meeting for the Coordinated Research Project
on Development of a Quality Assurance Programme for Radiation Therapy Dosimetry
in Developing Countries, SSDL Newsletter No. 39, (July 1998), IAEA, Vienna.

IAEA-CN-85-48
625
THE ESTRO-EQUAL RESULTS FOR PHOTON AND
ELECTRON BEAMS CHECKS IN EUROPEAN RADIOTHERAPY BEAMS����
H. Ferreira, A. Dutreix, A. Bridier, D. Marre, J. Chavaudra, H. Svensson
ESTRO-EQUAL Measuring Laboratory,
Service de Physique, Institut Gustave-Roussy,
Villejuif, France
Abstract
Background and purpose: European Society for Therapeutic Radiology and Oncology (ESTRO) has set up a
Quality Assurance network for radiotherapy (EQUAL) carrying out dosimetry audit. Some of the work is done in
cooperation with the IAEA. The network deals with measurements performed with mailed TLD irradiated in
reference and non-reference conditions, for on-axis points in photons and electrons beams.
Material and methods: The LiF DTL937 (Philitech, France) was used and read with the PCL3 automatic reader
(FIMEL-PTW). The participating centres irradiate the TLD capsules to an absorbed dose of 2 Gy determined
with the Treatment Planning System used in clinical routine.
Results: Statistical data from the participating centres on their radiotherapy structure such as number of machines
and beams qualities available, dosimetry protocols and equipment in use were analysed. 23 European and 2
Mediterranean Basin countries participated.
Photons beam audit: 282 centres and 757 beams have been checked; 11% 60Co beams and 89 % of X-ray beams.
Compared to the EQUAL reference dosimetry 1.4 % of the reference beam output dose values and 3% of the
percentage depth doses are outside the tolerance level (deviation >�5%). The standard deviation for the
reference beam output is 1.8 %. Five percent of the rectangular field dose checks and 4 % the wedge transmission
factors had deviations >�5%. The analysis of the global results shows deviations >�5% in at least 1 point for 133
out of the 757 beams, mainly for large and rectangular fields and for wedged beams. At least 45 of these centres
had one “real dosimetric” problem in one or more parameters, which corresponds to 7% of the checked beams.
Electron beam audit: 97 centres and 277 beams have been checked. 1.0 % of the reference beam output values
(field size 10 cm x 10 cm) and about 2 % of the beam output for the others field sizes (15 cm x 20 cm, and 7 cm
x 7 cm) are outside tolerance level (deviation >�5%). The standard deviation for the reference beam output is
2.1% and for other field sizes about 2.4%. There are about three times more deviations outside the optimal level
(> 3%) with electron beams than with photon beams. This indicates that improvements on the electron beam
calibration and on the TPS algorithms for the electron beams are needed.
Conclusions: The EQUAL programme shows good results for the reference beam output for photon and electron
beams, which facilitate exchange of experiences between centres. The largest deviations are for non-reference
geometries, which might result in some dose variations between patients in a centre treated with the same
prescribed dose but with different set-ups.
Keywords: Radiotherapy, Quality Assurance network, Dosimetry intercomparison, TLD
Introduction
ESTRO (European Society for Therapeutic Radiology and Oncology) has a Quality Assurance
network (EQUAL) to check the dose on axis in reference and non-reference conditions for
external radiotherapy for photon and electron beams. The external audits covered by the
network are based on measurements made with mailed thermoluminescent dosimeters (TLD).
The radiation-induced morbidity is related to the quality of radiotherapy treatment delivered.
The EQUAL programme is therefore one of the tasks of the MORQA project funded by a EU
contract (Reduction of Radiation Morbidity Through Q.A. of Dosimetry and Evaluation of
Morbidity). The goal is to improve the radiotherapy in the EU countries and in particular
���� Supported by the Europe Against Cancer Programme of the European Union.

IAEA-CN-85-48
626
reduce unnecessary radiation induced complications. The present paper reports the third year's
experience on photon and electron dosimetry checks
Material and methods
From 1998, the EQUAL Network provided dosimetry checks of Co-60 and X-ray beams
(Ferreira et al, 2000, Marre et al, 2000) and from December 1999 also of electron beams.
Results
The figure 1 shows the number of participating centres (checked, and scheduled to be
checked) and the total number of centres per country. About 50% of the eight hundred
European centres have applied showing the great interest for external dosimetry audit. There
are in some countries national or international programmes (IAEA/WHO) on dosimetry audit
which is the reason for some of the low numbers (Thwaites et al 1992, Nisbet and Thwaites
1997).
0%
10%
20%
30%
40%
50%
60%
70%
80%
90%
100%
Au
stria
Belg
ium
Den
mark
Fin
lan
d
Fran
ce
Germ
an
y
Gree
ce
Icel
an
d
Irel
an
d
Italy
Malt
a
Norw
ay
Portu
gal
Sp
ain
Sw
eden
Sw
itze
rlan
d
Th
e N
eth
.
UK
Cro
ati
a
CZ
Hu
ngary
Pola
nd
Rom
an
ia
Alg
eri
a
Isra
el
Countries
Perc
enta
ge
of
cen
tres
Checks part in
Cooperation
With IAEA 88
1010
33
88
5959
8686
1414
11
22
7474
11
33
99
4040
99
77
1515
2121
55
33
33
77
11
33
55
Nb of centres
having applied
Scheduled and others (148)
Checked (250)
Scheduled and others (148)
Checked (250)
Figure 1: Percentage of centres per country that have applied to participate in EQUAL
programme (data in October 2000), compared to the total number of radiotherapy centres in
each country.
Dosimetric results and observed deviations: Photon beams
The ratios between the measured dose value Qm and that stated by the participating centre Qs
were calculated for all checked parameters: reference beam output (RBO), percentage depth
doses (PDD), beam output variation (BOV open and BOV Wedged) and wedge transmission
factor (WTF). Definitions are given by Ferreira et al (2000).
The global results for the photon beam checks are shown in the Table 1. The number of beams
with deviations in each of the intervals used in the EQUAL protocol (£3%, >3 to £ 5%, >5%
to £10% and >10%) are reported for RBO, PDD, BOV and the WTF. A total of 6700
parameters have been checked. The values in standard characters contain all checked beams,
including the beams with deviations due to a possible set-up error during the TLD irradiation.
The values in bold-italic characters are the results of checked beams in an interval minus the
beams with possible set-up errors in the 1st check. Set-up errors are assumed when the MU
(monitor units) has not been modified between the 1st and the 2nd check but the deviation of
the recheck measurement is inside the tolerance level (<�5 %).
The global result analysis shows deviations >�5 % in at least 1 point for 133 out of the
757 beams. In these 133 rechecked beams, 88 beams had some deviations >�5 % due to set-up
errors and 45 beams had “real dosimetric” problems. The set-up errors are considered as being

IAEA-CN-85-48
627
due to the incorrect SSD or SDD, an error on the irradiation depth, the wedge orientation or
other obvious mistake during the TLD irradiation.
For the reference conditions (RBO), 95 % of the results are in the optimal level of deviations
(Qm/Qs � ± 3 %), 4 % are in the level between ± 3 % and ± 5 %, and only 1.4% are outside
the tolerance level (Qm/Qs >± 5 %). For the percentage depth doses 90% of the checked
beams are in the optimal level, 7 % have deviations between ± 3 % and ± 5 %, and 3% of the
checked beams are outside the tolerance level (table 1).
For the beam output variation using open beams 84%, and using wedged beams 87%, are in
the optimal level, 4% (open beams) and 3% (wedged beams) are outside the tolerance level
(table 1). For wedge transmission factors 81% of the results are in the optimal level and 4%
are outside the tolerance level.
The “dosimetric” problems concern 45 beams out of the 133 beams rechecked. A total of 7%
(45/669 beams) of the checked photon beams have at least one checked parameter with
“dosimetric” problems. The largest number of set-up errors is for wedged beams. Probably,
this is so also in clinical practice.
Table 1: Number of photons beams with deviation in different intervals. The values in
standard characters contain all checked beams, including the beams with deviations due to a
set-up error in the TLD irradiation. The values in bold-italic characters concern the results of
checked beams minus the beams with set-up errors in the 1st check when the MU has not been
modified between the 1st and the 2nd checks.
Parameters checked Deviation Levels (Qm/Qs) Total of
Beams
� 3% >3 to � 5% > 5 to � 10% >10%
Reference Beam Output 676 (90%) 54 (7%) 17 (2%) 10 (1%) 757
637 (95%) 25 (4%) 5 (1%) 2 (<0.4%) 669
Percentage Depth Dose 603 (87%) 62 (9%) 16 (2%) 11 (2%) 692
548 (90%) 45 (7%) 11 (2%) 4 (1%) 608
Beam Output Variation
Open Beams
599 (84%) 82 (11%) 26 (4%) 9 (1%) 716
529 (84%) 78 (12%) 21 (3%) 3 (1%) 631
Beam Output Variation
Wedged Beams
558 (85%) 73 (11%) 14 (2%) 15 (2%) 660
511 (87%) 60 (10%) 11 (2%) 3 (1%) 585
Wedge Transmission Factor 520 (78%) 99 (15%) 22 (3%) 24 (4%) 665
475 (81%) 85 (15%) 19 (3%) 5 (1%) 480
Dosimetric results and observed deviations: Electron Beams
Since November 1999 till end of September 2000, 97 centres, out of 267 centres that have
applied, and 287 beams qualities have been checked. Table 2 contains all checked electron
beams, minus the beams with set-up errors in the 1st check and not yet followed up (287
beams minus 10 beams). As for the photon beam checks, the analyse of the overall results for
the electron beams checks is based on the results excluding beams with set-up errors during
the TLD irradiation.
86% of the reference beam output values were in the optimal level of deviation (Qm/Qs� ±
3 %), 13 % of the beams had a deviations between ± 3 % and ± 5 % and only 1 % were
outside the tolerance level (Qm/Qs >± 5 %) .As can be seen from Table 2 the largest
deviations were for the largest field size 15 cm x 20 cm.

IAEA-CN-85-48
628
Table 2: Number of deviations for EQUAL electron beam outputs checks with different field
sizes and SSDs. The results concern the electron beams checked minus the beams with set-up
errors in the 1st check.
Reference Beam Output TLD used Deviation Levels (Qm/Qs) Total of
� 3% >3 to � 5% > 5 to � 10% >10% beams
10 cm x 10 cm 1 and 2 239 (86%) 35 (13%) 3 (1%) - 277
15 cm x 20 cm 3 212 (81%) 46 (17%) 6 (2%) - 264
7 cm x 7 cm 4 241 (83%) 41 (15%) 4 (2%) - 266
10 cm x 10 cm (SSD � 105 cm) 5 116 (79%) 29 (20%) 1 (1%) - 146
Total All TLDs 788 (83%) 151 (16%) 14 (1%) - 953
The standard deviation for the beam output values in reference conditions (10 cm x 10 cm, at
SSD 100) is 2.1% with a mean value of 1.003 for Qm/Qs. The beam output for the 15 cm x 20
cm and 7 cm x 7 cm field size has a standard deviation of 2.4 % and 2.3 % respectively with a
mean value of 1.001.
Conclusion
The EQUAL network has carried out a total of 757 photon and 277 electron beam checks
during the last three years. A total of 398 centres have applied to participate in the EQUAL
programme (about 50 % of European Radiotherapy centres). The EQUAL programme for
electron beams were initiated in November 1999 and 268 centres have already applied to
participate.
In the first year of the programme mostly large centres applied. Efforts were therefore made to
stimulate small centres. This has resulted in a good participation also of centres with one or
two radiation machines.
For the photon beams in reference geometry the mean ratio of measured to stated doses is
0.997 with a SD of 1.8 % and for electrons the mean value is 1.003 with a SD of 2.1 %. About
7 % of the checked beams have dosimetric problems, which could have a real influence on the
patient cancer treatment. Beams with dosimetric problems have been followed up and the
errors have been corrected and confirmed by the rechecked measurements or on site visit
performed by the EQUAL physicists.
The results for the electron beam checks are very good, 98% of the beam outputs are within
the tolerance level (Qm/Qs ��5%) .For electron beams the number of deviations outside the
optimal level are about three times that for photon beams. This difference can be explained by
less accurate TPS algorithms and a larger uncertainty in the ionization chamber dosimetry
procedure than for photon beams.
The EQUAL programme shows that a consistent radiotherapy dosimetry for photon and
electron beams can be achieved in Europe. However, a number of dosimetric problems in
photons beams (7 % of the beams checked) for non-reference conditions have been
discovered. Improvements on the Quality Assurance programmes by some of the centres and
on the TPS algorithms are measures that could reduce the number of deviations.

IAEA-CN-85-48
629
Acknowledgements
They are very grateful to the physicists of the European centres for their participation and co-
operation to the EQUAL network.
The present work would not have been possible without the strong support of the ESTRO
Committee for Quality Assurance and the financial help of the EU Programme "Europe
Against Cancer".
References
[1] Marre D, Ferreira I H, Bridier A, Björeland A, Svensson H, Dutreix A and Chavaudra J
2000 Energy correction factors of LiF powder TLDs irradiated in high energy electron
beams and applied to mailed dosimetry for Quality Assurance Networks, Phys. Med.
Biol. 44, 3657-3674
[2] Ferreira I H, Dutreix A, Bridier A, Chavaudra J and Svensson H 2000 The ESTRO-
QUALity assurance network (EQUAL) Radiot. & Oncol. 55 273-84
[3] Thwaites, D.I., Williams, J.R, Aird, E.G., Klevenhagen, S.C. and Williams, P.C. A
dosimetric intercomparison of megavoltage photon beams in UK radiotherapy centres.
Phys. Med. Biol. 37: 445-461, 1992.
[4] Nisbet, A., and Thwaites, D.I., A dosimetric intercomparison of electron beams in UK
radiotherapy centres. Phys. Med. Biol. 42: 2393-2409, 1997.
[5] Izewska, J. and Andreo, P. the IAEA/WHO postal programme for radiotherapy hospital,
Radiother. Oncol. 54 65-72, 2000.

IAEA-CN-85-120
630
STANDARD OPERATING PROCEDURES FOR QUALITY AUDITS OF 60
Co EXTERNAL BEAM RADIOTHERAPY FACILITIES
E.F. Larrinaga Cortina1, L. Domínguez Hung
1, R. Campa Menéndez
2
1 Centro de Protección e Higiene de las Radiaciones, Havana, Cuba
2 Centro de Control Estatal de Equipos Médicos, Havana, Cuba
Abstract The use of the radiotherapy implies the necessity of rigorous quality standards in its different components, aimed
to provide the best possible treatment and avoid potential patient’s risks, that could even causing him the death.
Projects of technical cooperation had been developed in Cuba support by the International Atomic Energy
Agency addresses to the implementation of Programs of Quality Assurance (PGC) in radiotherapy services. The
establishment of the National Quality Audit Program (PNAC) is a superior stage. The National Control Center
for Medical Devices as the national regulator entity for the control and supervision of medical devices in the
National Health System is the responsible for the making and execution of the PNAC. The audit modality
selected was the inspection visit in situ due to its intrinsic advantages, our geographical extension and the number
of radiotherapy services. This paper presents the methodology for the execution of the PNAC, in form of a
Normalized Procedure of Operation (PNO) that defines the objectives, scope, terms and definitions,
responsibilities, composition and selection of the auditor team, security’s conditions, materials and equipment,
steps of the audit execution, results calculation and interpretation, records, etc.
1. Introducción
El cáncer constituye la segunda causa de muerte en nuestro país, representando este indicador el 20.6% de las defunciones ocurridas en 1999 [1]. El empleo de la radioterapia como una de las principales alternativas en la cura y paliación de esta enfermedad, implica el cumplimiento de rigurosos estándares de calidad en las diferentes componentes de su desempeño, con el fin de proporcionar el mejor tratamiento posible y evitar riesgos potenciales al paciente, que incluso pudieran llegar a causarle la muerte. En los últimos años en Cuba se han desarrollado proyectos internacionales de cooperación técnica con el Organismo Internacional de Energía Atómica (OIEA) dirigidos a la implementación de Programas de Garantía de Calidad (PGC) en los servicios de radioterapia y en la elaboración y adecuación a nuestra realidad actual, de protocolos internacionales de garantía de calidad en los aspectos físicos de la radioterapia. El establecimiento del Programa Nacional de Auditoria de Calidad (PNAC) es una etapa superior en los PGC en los servicios de radioterapia. El Centro de Control Estatal de Equipos Médicos es la entidad reguladora nacional para el control y supervisión de los equipos médicos del Sistema Nacional de Salud (SNS) y el responsable de la confección y ejecución del PNAC; para ello se apoya en un grupo tripartita integrado por el Instituto Nacional de Oncología y Radiobiología-Grupo Nacional de Oncología, responsable del fomento y supervisión de los PGC en los servicios de radioterapia y el Laboratorio Secundario de Calibraciones Dosimétricas del Centro de Protección e Higiene de las Radiaciones (LSCD-CPHR), encargado de garantizar las calibraciones de la instrumentación radiométrica y su traceabilidad como parte integrante de la red internacional de laboratorios patrón secundario OIEA. Debido a la extensión geográfica de Cuba y al número de servicios de radioterapia (9), se seleccionó como modalidad principal de auditoria la visita de inspección in situ, además por las ventajas intrínsecas que esta opción representa, puesto que permite una revisión general de un gran número de aspectos del PGC, de manera directa y en presencia del físico responsable
IAEA-CN-85-120
631
de su ejecución en el servicio. En el presente trabajo se expone la metodología para la ejecución del PNAC. 2. Desarrollo
La política de calidad del CCEEM define como objetivo principal el cumplimiento de los requisitos de seguridad y de efectividad de todos los equipos médicos, previo a su introducción en el SNS y durante su utilización en el mismo, mediante el desarrollo de los procesos de evaluación de mercado, control regulatorio y vigilancia sanitaria, acorde a las normas nacionales e internacionales vigentes [2,3]. Dentro de dicha política se integra la confección del Procedimiento Normalizado de Operación (PNO) [4] como documento metodológico y normativo de la actividad de auditoria de calidad a estos servicios de radioterapia del PNAC implementado por el CCEEM. Además las instalaciones de radioterapia, como equipos emisores de radiación ionizantes de categoría relevante están sometidos a control regulatorio por el Centro Nacional de Seguridad Radiológica y Nuclear (CNSN), así como las actividades relacionadas con dichas instalaciones [5], auditorias de calidad incluidas, constituyendo este PNO parte de la documentación necesaria para la acreditación de la actividad de auditoria de calidad ante el CNSN. El PNO describe detalladamente la forma de realizar las operaciones de rutina para garantizar la calidad y uniformidad organizativa del proceso de auditoria de calidad. En su parte inicial se define su objetivo, alcance, términos y definiciones empleadas y las responsabilidades. Como segunda parte se establece la composición del equipo auditor, condiciones de seguridad durante la realización de las visitas y los materiales y equipamiento necesarios a utilizar. Su tercera parte se refiere a las etapas de preparación y ejecución de la auditoria, el cálculo e interpretación de los resultados y la confección de los informes. Por último se definen lo registros de las visitas de auditorias. Además se anexan el protocolo para la recolección de evidencias objetivas y los modelos de recolección de datos. A continuación se explica de manera concisa la estructura antes mencionada. 2.1. Objetivo: su objetivo es establecer la metodología a seguir para la realización de las auditorias de calidad en instalaciones de teleterapia con unidades isotópica de 60Co pertenecientes al SNS. Como objetivo específico documenta y garantiza el cumplimiento de los requisitos regulatorios establecidos por la autoridad competente. 2.2. Alcance: aplicable en el CCEEM, Departamento de Radiofísica, para la ejecución de las auditorias de calidad anuales a las instalaciones de teleterapia con unidades de teleterapia isotópica de 60Co, de las instituciones asistenciales del SNS. 2.3. Términos y definiciones: se especifican conceptos pertenecientes al tema. 2.4. Responsabilidades: se definen las responsabilidades en la planificación, ejecución y control del procedimiento de auditoria de calidad en sí y de las garantía de las condiciones necesarias para lograr los objetivos de la auditoria, así como del entrenamiento y capacitación de los miembros del equipo auditor. 2.5. Condiciones de seguridad: se definen las garantías de la vigilancia radiológica individual del equipo auditor, se aclara la responsabilidad del equipo auditor de informarse acerca del manual de seguridad y el plan de emergencias radiológicas de la institución visitada y seguir las instrucciones y procedimientos en ellos establecidos para la operación

IAEA-CN-85-120
632
normal o en casos de accidentes radiológicos, además se aclara que la manipulación de la unidad de tratamiento y sus accesorios durante la toma de datos y comprobación del desempeño de los programas de garantía de calidad de radioterapia se harán solamente por el personal de la institución directamente encargado de dichas operaciones. Por último se especifica que los resultados de la auditoria son confidenciales. 2.6. Materiales y equipamiento: se detalla el tipo y estado requerido para el equipo radiométrico, accesorios y materiales necesarios para la recolección de evidencias objetivas. 2.7. Preparación de la visita de auditoria: para cada etapa se definen la responsabilidad de cada integrante del equipo auditor. a. Selección del equipo auditor: Selección de los especialistas que conformarán el equipo
auditor de acuerdo a la experiencia teórica-práctica de los mismos, capacitación en el tema de auditorias de calidad y competencia institucional. Designación del auditor principal.
b. Coordinación de la visita: Coordinación con el responsable del PGC del servicio a auditar de la fecha de visita. Envío de la comunicación oficial de la auditoria al responsable del servicio de radioterapia especificando: Objetivos, Composición del equipo auditor, Tipos de datos que se requerirán, Medidas a tomar, Tiempo requerido por las visitas, Número de secciones de trabajo, Tiempo por especialistas (físico médicos, oncólogo radioterapeuta, técnico radioterapeuta), Medidas y cálculos que se necesita sean realizados en la institución. Se envía además un modelo de información preliminar que se requiere al servicio sobre el PGC, datos utilizados en la práctica clínica, etc; de manera que se cuente con esa información antes de partir hacia la auditoria.
c. Notificación de la visita: Notificación al responsable del servicio de radioterapia la fecha en que se realizará la auditoria, como mínimo una semana antes de la fecha fijada.
d. Revisión preliminar: Revisión del modelo de información preliminar y análisis del mismo con vistas a orientar la ejecución de la auditoria a algún punto de interés.
e. Asignación del equipo auditor: Asignación de las responsabilidades de cada miembro del equipo auditor en cuanto a las componentes del PGC a auditar.
f. Equipos y accesorios: Preparación, gestión y verificación del estado (funcionamiento y aptitud: certificado de calibración, etc) de todo el equipo radiométrico, accesorios y materiales.
g. Documentos de trabajo: Preparación de los documentos de trabajo pertinentes (modelos de recolección de datos, formularios, hojas de cálculo, tablas de datos, etc) para facilitar al equipo auditor las investigaciones, documentación e informe de los resultados
2.8. Ejecución de la visita de auditoria: para cada etapa las responsabilidades se delimitan según la asignación realizada a cada miembro del equipo auditor durante la preparación de la visita. a. Reunión de apertura: Presentación de los miembros del equipo auditor al responsable del
servicio de radioterapia. Planteamiento del alcance y los objetivos de la auditoria, explicación de los métodos y procedimientos que serán utilizados en la auditoria, designación de un el eslabón de comunicación oficial entre el responsable y el equipo auditor. Se confirma que el equipo auditor tendrá acceso a los recursos y las áreas necesarias; así como la fecha y hora de la reunión de clausura y de cualquier otra reunión conjuntamente con el responsable. Esclarecimiento de cualquier detalle del programa de la auditoria
b. Verificación de la información preliminar: Verificación de la información preliminar requerida a la institución en la comunicación oficial de la auditoria, concordancia con los registros presentes en el servicio, disponibilidad y utilización rutinaria de la misma por

IAEA-CN-85-120
633
personal capacitado (físico médico y técnico radioterapeuta). Se verifican además detalles administrativos del PGC en lo referido a: manual de garantía de calidad y de seguridad, registros de los controles periódicos de calidad, plan de emergencias radiológicas, cadena de mando para reporte de problemas, etc.
c. Recolección de evidencias objetivas: Realización de la recolección de evidencias objetivas de los aspectos a auditar en lo referente a: Seguridad de la instalación y la unidad de tratamiento, Aspectos mecánicos de la unidad de tratamiento, Aspectos dosimétricos de la unidad de tratamiento y Aspectos clínicos del tratamiento; según la metodología empleada en la puesta en servicio para cada prueba en específico y el protocolo anexado al PNO. Se completan los modelo de recogida de datos correspondientes a cada una de los aspectos por los miembros responsables del equipo auditor, constituyendo esto un registro para su documentación.
d. Cálculos e interpretación de los resultados: El protocolo de recolección de evidencias objetivas detalla y explica cada una de las pruebas en específico a realizar para cada aspecto a auditar, el procesamiento de los datos adquiridos y la interpretación de sus resultados, definiendo además sus tolerancias.
e. Reunión de clausura: Realización de la reunión de clausura de la auditoria en presencia del responsable del servicio de radioterapia, una vez concluida la recolección de evidencias objetivas y el esclarecimiento de las posibles no conformidades halladas. Se comentará el cumplimiento de los objetivos de la visita y se expondrán de manera preliminar los resultados hallados en la misma así como de las recomendaciones que el equipo auditor considere pertinentes; destaque que las mismas pueden estar sujetas a cambios debido a análisis a posteriori. Se confirma la fecha de entrega del informe final de la auditoria
f. Informe de la auditoria: Se especifica el formato del informe conteniendo en lo general: Datos de la institución auditada (incluyendo marca y modelo de la unidad de tratamiento), Fecha, Documentos de referencia utilizados (de la institución y del equipo auditor), Resultados de la recolección de evidencias objetivas, Posibles acciones correctivas tomadas en el curso de la visita, Recomendaciones y conclusiones. Se instruye además los medios y plazos para el envío del informe al servicio de radioterapia, las reglas de confidenciabilidad para su distribución y su registro.
2.9. Registros: se definen los registros necesarios para la organización del PNAC, sus procedimientos de archivo y compartimentación pertinentes dentro del Dpto. Radiofísica CCEEM.
2.10. Verificación: se define el responsable de la revisión y conformidad del PNO elaborado, dentro de la política de calidad del CCEEM. Además se aclara que el informe de la auditoria debe ser revisado por una tercera parte independiente del equipo auditor que cumpla con los requisitos exigidos para este. 2.11. Referencias/Documentos aplicables: bibliografía utilizada para la elaboración y ejecución del PNO. 2.12. Anexos: se adjuntan los Registros, Modelos de recogida de datos y el Protocolo para la recolección de evidencias objetivas. En lo referido al protocolo, está basado en lo fundamental, en las recomendaciones de un panel de expertos organizado por el OIEA dentro de las actividades del Programa Regional ARCAL XXX “Mejoramiento de la Garantía de Calidad en Radioterapia” [6].

IAEA-CN-85-120
634
3. Conclusiones y recomendaciones
El PNO aquí abordado constituye un paso inicial en la conformación del PNAC, como una etapa superior en la ejecución de los PGC en servicios de radioterapia; por resultar novedoso en nuestro contexto necesita de un período de puesta a punto y mejoramiento continuo. El PNO garantiza uniformidad en la estructura organizativa del PNAC, los criterios en cuanto a las tomas de medidas, la interpretación de los resultados y sus tolerancias. El PNO está dirigido únicamente a las instalaciones de teleterapia con unidades de isotópica de 60Co. En lo referente al protocolo para la recolección de evidencias objetivas en los aspectos a auditar, se hace hincapié en los aspectos físicos del PGC, tratándose la parte clínica del tratamiento de manera menos profunda, aunque se comprueban casos típicos en la planificación de los tratamientos y la dosis de tratamiento impartida o unidades monitor (tiempo). El PNO constituye una parte de la información necesaria para la certificación del PNAC ante las entidades reguladoras competentes en materia de seguridad nuclear. Se recomienda complementar el PNAC mediante la modalidad de auditoria postal a través de las facilidades que brinda el LSCD-CPHR para mediciones con TLD, validando estos resultados con los registros de las auditorias postales realizadas por el OIEA a distintos servicios de radioterapia del país. Se debe completar y profundizar los aspectos clínicos del tratamiento como son los procedimientos clínicos utilizados, selección de las técnicas de tratamiento, sistemas computarizados de planificación de tratamiento, etc. Por último, el PNAC debe ampliarse a las instalaciones de braquiterapia y unidades de teleterapia de ortovoltaje, elaborándose la documentación metodológica y normativa para estas modalidades de la radioterapia Referencias
[1] DIRECCIÓN NACIONAL ESTADÍSTICA, Anuario Estadístico MINSAP 1999, República de Cuba (2000).
[2] NORMA CUBANA ISO/IEC 17025:2000, Requisitos Generales para la Competencia de los Laboratorios de Ensayo y Calibración, República de Cuba (2000).
[3] CENTRO DE CONTROL ESTATAL DE EQUIPOS MÉDICOS, Manual de Calidad, República de Cuba (Agosto/2000).
[4] CENTRO DE CONTROL ESTATAL DE EQUIPOS MÉDICOS, PNO 06-01-00 Guía para la Realización de Auditorias de Calidad en Instalaciones de Teleterapia con Unidades Isotópicas de 60Co, Cuba, 2000.
[5] DECRETO-LEY RESOLUCIÓN 25/98, Reglamento para la Autorización de Prácticas Asociadas al Empleo de Radiaciones Ionizantes, República de Cuba (1998).
[6] IAEA-TECDOC-1151, Aspectos Físicos de la Garantía de Calidad en Radioterapia: Protocolo de Control de Calidad, Austria (Junio/2000)

IAEA-CN-85-247
635
PRELIMINARY RESULTS OF A NATIONAL QUALITY
AUDIT PROGRAMME IN RADIOTHERAPY SERVICES IN CUBA
L. Domínguez Hung, E.F. Larrinaga Cortina
Centro de Control Estatal de Equipos Médicos, Havana, Cuba R. Campa Menéndez
Centro de Protección e Higiene de las Radiaciones, Havana, Cuba J.L. Morales López, A.F. García Yip Instituto Nacional de Oncología y Radiobiología, Havana, Cuba
Abstract
The current state of the radiotherapy in Cuba has allowed to pass to a superior stage in the process of the quality
assurance, the establishment of a National Quality Audit Program (PNAC). The National Control Center for
Medical Devices as national regulator entity for the control and supervision of the medical devices of the
National Health System is the responsible for the implementation of this program. This paper presents the
preliminary results of the execution of the PNAC in teletherapy services with isotopic units of 60Co. The audits
were carried out according to the methodology settled down in the normalized procedure of operation of the
PNAC. The physical aspects related with the treatment were audited, such as: the installation and unit’s safety,
mechanical and dosimetric aspects of the treatment unit and organizational aspects of the institution quality
assurance program. Also were carried out, in the clinical aspect, verifications of cases type planned by the
qualified personnel of the service. The results corresponding to the determination of the reference dose for each
institution were compared with those obtained in a postal audit with the International Atomic Energy Agency.
These first audits allowed to evaluate the performance of the institutions’ program of quality assurance and a
feedback for the setting about to the PNAC.
1. Introduccion
En los últimos años en Cuba se han desarrollado proyectos internacionales de cooperación técnica con el Organismo Internacional de Energía Atómica (OIEA) dirigidos a la implementación de Programas de Garantía de Calidad (PGC) en los servicios de radioterapia y en la elaboración y adecuación a nuestra realidad actual, de protocolos internacionales de garantía de calidad en los aspectos físicos de la radioterapia. Además se ha adquirido nuevo equipamiento (instalaciones de teleterapia con unidades isotópicas de 60Co) para sustituir y modernizar el existente en estos servicios, con muchos años de explotación. El Instituto Nacional de Oncología y Radiobiología-Grupo Nacional de Oncología (INOR) ha sido el responsable del fomento y apoyo a los PGC en los servicios de radioterapia. El establecimiento del Programa Nacional de Auditoria de Calidad (PNAC) es una etapa superior en los PGC en los servicios de radioterapia. El Centro de Control Estatal de Equipos Médicos es responsable de la confección y ejecución del PNAC; para ello se apoya en un grupo tripartita integrado conjuntamente con el INOR y el Laboratorio Secundario de Calibraciones Dosimétricas del Centro de Protección e Higiene de las Radiaciones (LSCD-CPHR), encargado este de garantizar las calibraciones de la instrumentación radiométrica y su traceabilidad como parte integrante de la red internacional de laboratorios patrón secundario OIEA.
En este trabajo presentaremos los resultados preliminares de las auditorias, visitas de inspección in situ, realizadas según la metodología establecida en el procedimiento normalizado de operación para la ejecución del PNAC [1]. Se auditaron 3 servicios de radioterapia de un total de 9. Además se comparan los resultados de la comprobación de la tasa de dosis de referencia en cada uno de los servicios auditados y su desempeño en la auditoria postal realizada por el OIEA.

IAEA-CN-85-247
636
2. Desarrolla
En cada visita de inspección el equipo auditor estuvo integrado por representantes del grupo tripartita. La recolección de evidencias objetivas, en un principio se realizó según las recomendaciones dadas por un panel de expertos en el marco del proyecto ARCAL XXX [2], dirigida fundamentalmente a la verificación de los aspectos físicos de la instalación y la unidad de tratamiento. Además se realizaron comprobaciones en la planificación de casos tipos, en lo referente a los aspectos clínicos del tratamiento, enviados a las instituciones previamente a la realización de la auditoria. El resumen de los principales resultados hallados se presenta para cada uno de los aspectos auditados en forma de tablas. Denotaremos a cada institución auditada por las letras a, b y c.
Tabla I. Aspectos de Seguridad de la Instalación y Unidad de Tratamiento
Resultados hallados y recomendaciones
Monitor estacionario de radiación del local:
(a) fuera de servicio
(b) sin conectar la indicación sonora
(c) verificar si la alimentación externa es confiable
(a) Posición inadecuada de la cámara del circuito cerrado de TV, no permite visualizar el paciente y los
indicadores de posición de la fuente ubicados en el cabezal del equipo simultáneamente
(c) Reparar el intercomunicador, para garantizar la necesaria comunicación paciente–operador
(c) Calibrar el monitor ambiental portátil del servicio
Tabla 2. Aspectos Mecánicos y Eléctricos de la Unidad de Tratamiento
Resultados hallados y recomendaciones
(a) Telemando, queda accionado el interruptor tipo “deadman” al accionar el movimiento de la camilla o
del brazo de la unidad.
Láseres:
(a) La comprobación diaria de los láseres y telémetro, debe ser supervisada por el físico semanalmente.
(b) Desajuste frecuente de los láseres laterales
(c) Precisar la no alineación de los láseres coronales en el sentido longitudinal de la camilla de
tratamiento y corregir la falta de colinealidad entre estos.
Indicadores de distancia:
(a) Reemplazar el comprobador de distancia colimador- isocentro de madera, por uno de un material más
resistente y colocarlo en el local de los físicos. Emplear el puntero mecánico del fabricante para verificar
mensualmente al comprobador de distancia de uso diario.
(c) Reparar la falta de nitidez del telémetro
(b) Desajuste de la indicación del tamaño del campo de radiación correspondiente a la apertura de los
colimadores en el caso del 10x10 cm2 en la dirección opuesta al brazo
3. Conclusiones y Recomendaciones
Los tres servicios visitados cuentan con nuevo equipamiento para el tratamiento radiante y están licenciados por el órgano regulador nacional para el uso de la energía nuclear, cumpliendo los requisitos de seguridad y protección, y documentados los procedimientos requeridos legalmente: Manual de seguridad de la instalación y Plan de emergencias radiológicas. La problemática presentada en el aspecto de seguridad, en general, está relacionada con la conexión de los monitores estacionarios de radiación y casuísticamente con la comunicación (visual y oral) técnico- paciente.

IAEA-CN-85-247
637
Tabla 3. Aspectos Dosimétricos de la Unidad de Tratamiento
Resultados hallados y recomendaciones
Perfiles de los campos de radiación:
(b) Realizar los cálculos de la planitud y la simetría, a partir de las mediciones de los perfiles del campo
realizadas en la puesta en servicio de la instalación
(c) Revisar y normalizar la técnica de procesamiento de las películas de verificación de forma que
permita una adecuada interpretación de los parámetros a comprobar con las mismas
(b) Realizar y registrar las mediciones correspondientes al control de la estabilidad de los dosímetros con
fuente de control de Sr-90.
(c) Medir los factores de las bandeja existentes en la instalación y compararlos con los instalados en los
sistemas computarizados de planificación utilizados en la práctica clínica
Tabla 4. Aspectos Clínicos
Tabla 5. Aspectos Organizativos del PGC y Registros
Resultados hallados y recomendaciones
Personal:
(a) Se necesita otro físico médico en el servicio de radioterapia por la carga de trabajo de la misma.
(b) Adiestramiento de personal técnico en las tareas de planificación, de manera que pueda contarse con
una persona independiente en el proceso de verificación de los casos
(a, b, c) Elaborar un registros de incidencias de mal funcionamiento del equipo independiente de los
controles de garantía de la calidad
(a, b, c) Disponer de un plan anual de ejecución de las actividades de control de calidad de la instalación,
identificando el responsable de cada una y un registro para verificar su ejecución
(a, b, c) Protección Radiológica: debe realizarse un registro de mediciones de tasa de dosis ambientales en
las zonas de la instalación y un registro de contaminación y fugas del cabezal
(a, b, c) Programa continuo de educación y entrenamiento con evaluaciones anuales al personal
ocupacionalmente expuesto
Tabla 6. Comparación entre los Resultados de la Determinación de Dosis de Referencia y los de
la Auditoria Postal OIEA
Institución % desv. rel. Audit* Fecha % desv. rel. OIEA Fecha
(a) -1.6 17.11.1999 -1.9 10.12.1999
(b) -0.1 20.12.1999 0.5 10.12.1999
(c) -0.5 24.06.2000 -0.8 10.12.1999
*%desv.rel.=100(Dmed-Dref)/Dref
Dmed: Dosis medida por la institución durante la auditoria para condiciones de referencia.
Dref: Dosis de referencia clínica, medida durante la puesta de servicio de la instalación.
Resultados hallados y recomendaciones
(a, b, c) Verificación manual de los cálculos derivados del uso de los sistemas computarizados de
planificación de tratamiento.
(b,c) Selección adecuada del sistema computarizado de planificación de tratamiento según la técnica
elegida tomando en cuenta las ventajas y limitaciones en la batería de planificación
(c) Se hallaron errores en la utilización de parámetros modificadores del haz durante la realización de los
cálculos de comprobación de uno de los casos tipos planificados durante la visita, factor de bandeja y
factor de campo incorrecto
(c) Uno de los sistemas computarizados de planificación de tratamiento utilizados, tiene instalado un
factor de bandeja lisa, cuando el que se utiliza en la práctica es el de bandeja ranurada.

IAEA-CN-85-247
638
En los aspectos mecánicos y eléctricos, las unidades de tratamiento adquiridas han mostrado una excelente estabilidad. Por otra parte, la necesidad del ajuste de los láseres de posicionamiento ha sido la evidencia objetiva recurrente en cada servicio visitado. La comprobación de la tasa de dosis en los aspectos dosimétricos de la unidad de tratamiento para las tres instalaciones auditadas arrojó la concordancia de las mismas dentro del 2% con respecto al valor clínico establecido durante la puesta de servicio y con los resultados de la auditoria postal OIEA. El temporizador de las unidades de tratamiento es reproducible y el error de entrada-salida de la fuente pequeño y en algunos casos despreciable. En lo correspondiente a la verificación de las aspectos clínicos del tratamiento se persiguió mediante el envío de casos tipos de referencia para su planificación en el servicio, comprobar la técnica de irradiación elegida, la selección del sistema computarizado de planificación de tratamiento, considerando las ventajas y limitaciones de los disponibles en el servicio, así como las vías de comprobación de los resultados, cálculo manual de las unidades monitor (tiempo). En todos los servicios visitados los físicos-médicos están capacitados para realizar las comprobaciones manuales y es su firma en el expediente clínico la que avala la verificación de la planificación realizada, pero no queda registrada dicha comprobación en el expediente: valor de dosis de referencia utilizados, valores de los distintos modificadores del haz y su descripción, pesos de los campos (si los hubiera), etc. A criterio del equipo auditor esta sería un buena práctica para constatar la realización del cálculo de comprobación y permitir verificaciones posteriores de forma rápidas y diáfana. En los aspectos organizativos del PGC se manifestó, para las instituciones (a, b), la necesidad de entrenamiento de personal que sustituya y/o apoye al físico-médico en la rutina clínica del servicio. En general se deben implementar registros que permitan documentar mejor el PGC detallando las acciones a ejecutar y que delimiten los responsable de las mismas, para extender la cultura de seguridad y calidad a todos los integrantes del servicio. Se constató una buena preparación, dedicación y compromiso con la calidad de los físicos-médicos en cada una de las instituciones visitadas. Estas primeras auditorias permitieron poner a punto la metodología del PNAC y los procedimientos de recolección de evidencias objetivas detallados en el procedimiento normalizados de operación. Es evidente la necesidad de profundizar las auditorias en la verificación de los aspectos clínicos del tratamiento y la evaluación de los sistemas computarizados de planificación de tratamientos. La exposición de los resultados de las auditorias se centró en las instalaciones de teletarapia con unidades isotópicas de 60Co, de los servicios de radioterapia auditados; aunque en el caso de la institución (a) también se auditó un equipo de teleterapia de ortovoltaje. Se recomienda la ampliación del PNAC a las instalaciones de teleterapia con unidades de ortovoltaje y a las instalaciones de braquiterapia de los servicios de radioterapia del país, confeccionando y validando la documentación necesaria para estos fines. Es importante además prestar atención a la capacitación y entrenamiento del personal auditor en el desarrollo del PNAC, previendo las perspectivas inmediatas y futuras de este.

IAEA-CN-85-247
639
Referencias
[1] CENTRO DE CONTROL ESTATAL DE EQUIPOS MÉDICOS, PNO 06-01-00 Guía para la Realización de Auditorias de Calidad en Instalaciones de Teleterapia con Unidades Isotópicas de 60Co, Cuba, 2000.
[2] IAEA-TECDOC-1151, Aspectos Físicos de la Garantía de Calidad en Radioterapia: Protocolo de Control de Calidad, Austria (Junio/2000)

IAEA-CN-85-170
640
ERROR PREVENTION IN RADIOTHERAPY TREATMENTS
USING A RECORD AND VERIFY SYSTEM
S. Navarrete Campos3,2
, A. Hernández Vitoria1,2
, M. Canellas Anoz2,
E. Millán Cebrián2, A. García Romero
2
1 Area de Radiología y Medicina Física, Facultad de Medicina de Zaragoza, Zaragoza, Spain
2 Servicio de Física y Protección Radiológica, Zaragoza, Spain
3 Servicio de Oncología Radioterápica,
Hospital Clínico Universitario Lozano Blesa de Zaragoza, Spain
Abstract
Computerized record-and-verify systems (RVS) are being used increasingly to improve the precision
of radiotherapy treatments. With the introduction of new treatment devices, such as multileaf or
asymmetric collimators and virtual wedges, the responsibility to ensure correct treatment has
increased. The purpose of this paper is to present the method that we are following to prevent some
potential radiotherapy errors and to point out some errors that can be easily detected using a RVS,
through a check of the daily recorded treatment information. We conclude that a RVS prevents the
occurrence of many errors, when the settings of the treatment machine do not match the intended
parameters within some maximal authorized deviation, and allows to detect easily other potential
errors related with a incorrect selection of the treatment patient data. A quality assurance program,
including a check of all beam data and a weekly control of the manual and electronic chart, has helped
reduce errors.
1. Introducción
En los últimos años se vienen introduciendo en los Servicios de Radioterapia los sistemas de
registro y verificación (RVS) que, entre otras cosas, permiten seleccionar datos de irradiación
de los pacientes en los modernos aceleradores lineales de electrones (ALE) usados en
radioterapia externa [1,4]. Estos sistemas constituyen un medio efectivo de verificar los datos
de irradiación programados para el tratamiento de cada paciente, impidiendo aplicarlo si
algún dato de la máquina se encuentra fuera de un margen previamente establecido o si no se
ha colocado algún accesorio programado (bandeja, cuña, aplicador).
El objetivo de este trabajo es presentar el proceso que seguimos para tratar de evitar errores en
los tratamientos radioterápicos, así como llamar la atención sobre algunas dificultades que
pueden encontrarse usando los modernos aceleradores dotados de un sistema de colimación
que permite definir campos asimétricos y dotados de cuñas virtuales, conectados a un sistema
RVS.
2. Material y método
En nuestro hospital se dispone de dos ALE (Mevatron KD2 y Primus de Siemens) que están
conectados a un sistema de RVS Lantis de Siemens (Sistema de información para redes
locales), que, entre otras cosas, permite:
�� seleccionar dentro de una lista el paciente que va a recibir tratamiento
�� visualizar los datos clínicos y administrativos del paciente
�� visualizar un resumen de las notas de configuración y campos de tratamiento a aplicar
�� visualizar los parámetros de los campos de tratamiento
�� la configuración automática del ALE: parámetros de consola, parámetros geométricos,
accesorios y posiciones del colimador

IAEA-CN-85-170
641
�� comprobar que los parámetros prescritos concuerdan con los reales
�� registrar los parámetros dosimétricos de los campos sobre los que se ha administrado
tratamiento
�� configurar y realizar actividades de película portal.
2. Procedimiento seguido antes de iniciar el tratamiento de un paciente
La dosimetría clínica de cada paciente la realiza un físico o un dosimetrista, y es revisada
siempre por un radiofísico.
El radioterapeuta cumplimenta la ficha de cada paciente en presencia del radiofísico y con los
datos que éste le suministra relacionados con la colocación y el tratamiento del paciente. El
radioterapeuta introduce los datos de la ficha de tratamiento en el sistema Lantis. En caso de
que el tratamiento incluya un campo conformado con multiláminas, el físico introduce en el
sistema Lantis la forma del campo.
El radioterapeuta autoriza los campos introducidos en el Lantis para el tratamiento de cada
paciente.
Previamente a la primera sesión de tratamiento de cada paciente: Los ATS/técnicos de la sala
de tratamiento comprueban que los datos de la ficha coinciden con los que muestra la pantalla
del ordenador para ese paciente, y, en el caso de campos conformados, comprueban que su
forma coincide con la que figura en las placas realizadas en el momento de la
localización/simulación del tratamiento, dibujando la forma del campo sobre ellas, para su
posterior revisión por el radioterapeuta.
El radioterapeuta y el radiofísico comprueban, a su vez, que los datos dosimétricos y de
colocación que figuran en la pantalla coinciden con los usados en los cálculos dosimétricos.
Se procede entonces a la colocación del paciente para recibir su primera sesión de
tratamiento, en presencia del radioterapeuta y del radiofísico y éstos firman la ficha si todo
está conforme.
Semanalmente, el radiofísico y el radioterapeuta, por separado, revisan las fichas de
tratamiento y comprueban que coinciden los datos de dosis acumulada en cada campo y
número de unidades de monitor para cada campo con los almacenados en el sistema Lantis.
3. Algunos errores que pueden cometerse/evitarse
A lo largo del tiempo de trabajo con los citados ALE, hemos podido ver que pueden surgir
inicialmente algunos errores relacionados con la falta de costumbre de uso de las posibilidades
que ofrecen (campos asimétricos, cuñas virtuales).
1º) Relacionadas con la tecnología de los nuevos ALE
En el caso de campos asimétricos se puede cometer un error si se traspasan directamente al
sistema Lantis las dimensiones de las cuatro mandíbulas (X1,X2, Y1,Y2) utilizadas en el
planificador y éste no tiene en cuenta el giro del colimador que se vaya a utilizar en el
tratamiento.

IAEA-CN-85-170
642
Este error, que es fácilmente detectable en el posicionamiento del paciente, puede evitarse si
previamente se establece una tabla de correspondencia de la posición de cada mandíbula
considerada en el planificador, con la de la unidad de tratamiento, en función del ángulo de
colimación utilizado. Al cumplimentar la ficha de tratamiento, resulta muy cómodo usar la
citada tabla.
Otro posible error puede venir derivado de no estar familiarizados con las cuñas virtuales que
se simulan moviendo una de las mandíbulas del ALE. Es preciso tener establecido claramente
el modo de controlar cómo se forman las cuñas virtuales, sabiendo, según la orientación de la
cuña que figura en los cálculos dosimétricos, qué posición deben ocupar las mandíbulas que
delimitan el campo de tratamiento del paciente para que la cuña virtual se genere en la
dirección y sentido debidos.
Este posible fallo puede controlarse de forma sencilla, bien fijando una pegatina en las
mandíbulas del ALE que indiquen, según la orientación prevista de la cuña, qué mandíbula
corresponde a la parte gruesa de la misma (por ejemplo, orientación 1 mandíbula Y1,
orientación 2 mandíbula Y2) y comprobar en la primera colocación del paciente para su
tratamiento que la ficha está perfectamente cumplimentada en cuanto a la identificación de la
orientación de la cuña y ángulo de colimador para que la cuña se genere según se había
previsto.
2º) Relacionadas con posibles confusiones de las personas que aplican los tratamientos a
diario.
Además de los posibles errores de posicionamiento que se pueden evitar utilizando un sistema
que controle los datos de irradiación del paciente mediante ordenador, hemos podido detectar
en algún caso, al verificar semanalmente la coincidencia de las sesiones de tratamiento que
figuran en la ficha con las que figuran en el sistema Lantis, que se había olvidado de tratar un
campo, en un tratamiento con varios campos, o que se había olvidado de anotar en la ficha un
tratamiento que sí se había efectuado.
También pueden producirse errores en la suma de las dosis que se van acumulando al
cumplimentar la ficha de modo manual.
Estos raros errores, se pueden detectar fácilmente en las revisiones semanales disponiendo de
un sistema RVS, no teniendo mayor transcendencia pero su existencia hace pensar que pueden
ocurrir, y no ser detectados, en otras unidades que no dispongan de este tipo de sistemas.
También puede ocurrir que se llame a un paciente para que entre a la sala de tratamiento y que
sea seleccionado el nombre de otro paciente en la pantalla del ordenador. Si, casualmente, la
localización del tratamiento en ambos pacientes y los tamaños y formas de campo son
similares, puede ocurrir que no se detecte la equivocación y se trate al paciente con un número
erróneo de unidades de monitor, es decir, con una dosis inadecuada. Este error es más fácil
que ocurra cuanto más automatizado sea el tratamiento en cuanto a los posibles accesorios que
conlleve (bloques, cuñas). Si, por ejemplo, la cuña es virtual,s e generará según esté
programada, pero si la cuña fuera física, debería coincidir para que se pudiera irradiar que la
cuña programada para ese paciente coincidiera con la que tenía programada el paciente
seleccionado de forma equivocada.

IAEA-CN-85-170
643
Este error puede verse favorecido por el modo de visualización de los nombres de los
pacientes en la pantalla (por ejemplo, tamaño pequeño de las letras) en el momento de
seleccionar el paciente, por el hecho de que la persona que aplica el tratamiento rellene la
ficha, sin detectar que el número de unidades de monitor de la pantalla no coincide con el que
figura en la ficha, ya que no sospecha su confusión.
Este fallo se puede detectar fácilmente porque cuando se selecciona de nuevo el nombre del
paciente para su tratamiento, que esta vez sí que corresponde al paciente real, el sistema de
RVS avisa de que el paciente ya se ha tratado ese día, pudiéndose entonces realizar las
estimaciones de dosis necesarias.
4. Conclusión
El uso de un sistema de registro y verificación permite evitar un número significativo de
errores y detectar otros en los tratamientos radioterápicos. También la introducción de
aceleradores lineales de electrones con modernos sistemas de colimación permiten
tratamientos más precisos, pero es necesario establecer bien la correspondencia entre los datos
usados en el planificador y los introducidos en el sistema RVS para controlar la irradiación de
cada paciente.
Es preciso establecer un programa eficaz para controlar que los tratamientos se llevan a cabo
según lo programado y para detectar posibles errores. A ello contribuyen en gran medida las
revisiones previas a la primera sesión de tratamiento de un paciente y la revisión semanal de la
ficha. Una estrecha colaboración entre radioterapeutas, físicos y personas que aplican los
tratamientos es de gran importancia, de forma que entre ellos se pueda transmitir la
información y sistemática de trabajo de forma clara.
Referencias
[1] SEELENTAG W.W, DAVIS J.B. “On the safe use of verify-and –record systems in
external beam radiation therapy”. En Quality assurance in radiotherapy. IAEA-
TECDOC-989, IAEA 1997.
[2] BARTHELEMY-BRICHANT N. y otros. “Evaluation of frequency and type of errors
detected by a computerised record and verify system during radiation treatment”.
Radioter.Oncol.53:149-154, 1999.
[3] KLEIN E. y otros. “A change in treatment process with a modern record and verify
system”. Int.J.Radiat.Oncol.Biol. Phys. 42:1163-1168, 1998.
[4] NATH R. y otros. “AAPM code of practice for radiotherapy accelerators”.
Med.Phys.21:1093-1121, 1994.
IAEA-CN-85-79
644
MANUAL CROSS CHECK OF COMPUTED DOSE TIMES
FOR MOTORISED WEDGED FIELDS
J. Porte
Queen Elizabeth Hospital, Barbados
Abstract
If a mass of tissue equivalent material is exposed in turn to wedged and open radiation fields of the same size, for
equal times, it is incorrect to assume that the resultant isodose pattern will be effectively that of a wedge having
half the angle of the wedged field. Computer programs have been written to address the problem of creating an
intermediate wedge field, commonly known as a motorized wedge. The total exposure time is apportioned
between the open and wedged fields, to produce a beam modification equivalent to that of a wedged field of a
given wedge angle.
1. Introduction
Manual cross check of open field dose calculations follows the usual pattern: -product of
relative exposure rate, exposure rate of standard applicator/field, BSF/TAR/%DD gives the
output in dose per unit time. Dividing the daily-prescribed dose by this result gives the
exposure time. For a wedged field, inclusion of the wedge factor should produce a correct
result. Manual planning essentially then, requires the mapping of isodose curves, using
accurate depth dose curves supplied, to arrive at a dose maximum normalized to 100% of the
prescribed dose, then applying the same calculation methods to arrive at the dose times.
With the advent of computer planning, the curves supplied are only relative and cannot be
used for accurate isodose mapping. In the absence of curve mapping, calculations alone can
produce acceptable accuracy with open fields and in some cases where identical opposing full-
wedged fields are used. However, appreciable discrepancies are seen with non-identical fields
and there is no simple way to manually check dose times when motorized wedges are
employed. This paper then is an attempt to devise such a method that will give approximately
+/-7% error that is accepted for machine output exposure rates.
2. Material and methods
Motorized wedges are routinely used in the tangential fields for treatment of post mastectomy
patients. Having created a symmetrical chest wall shape of average size and separation, that
would require a full 45-degree wedge, the data is entered and the dose times determined for a
given prescribed dose. The 6w x 15 cm wedge field used is generated on the computer at the
most accurate calculations matrix. A pair of such fields is then used on the test outline for
apping of the isodoses, arriving at the normalization dose and subsequent calculation of dose
times in the usual manner, with the inclusion of the given transmission factor for the wedge.
Calculation of the dose time by the manual method shows agreement to within +/-3%.
The most logical approach from here was to make a semilog plot of percentage transmission
vs. Wedge angle, connecting the two points 100% for the open field and 48.5% for the full
wedge, plot A of Fig. 1 this transmission factor was determined practically, by dosemeter
measurements in the open and wedged beams. The above exercise was then repeated, this time
using an outline appropriate for a half wedge, 22.5 degrees. The corresponding transmission
value was taken from the curve and used in the calculation as before. The manually calculated
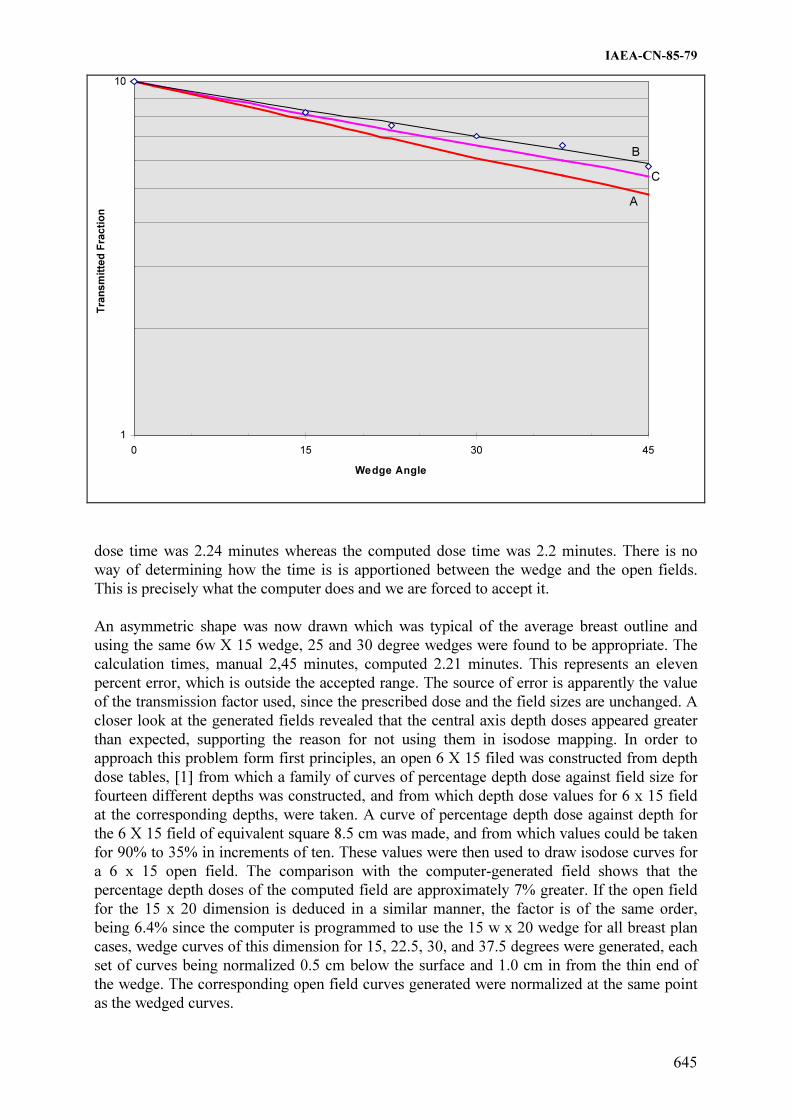
IAEA-CN-85-79
645
1
10
0 15 30 45
Wedge Angle
Tra
ns
mit
ted
Fra
cti
on
B
C
A
dose time was 2.24 minutes whereas the computed dose time was 2.2 minutes. There is no
way of determining how the time is is apportioned between the wedge and the open fields.
This is precisely what the computer does and we are forced to accept it.
An asymmetric shape was now drawn which was typical of the average breast outline and
using the same 6w X 15 wedge, 25 and 30 degree wedges were found to be appropriate. The
calculation times, manual 2,45 minutes, computed 2.21 minutes. This represents an eleven
percent error, which is outside the accepted range. The source of error is apparently the value
of the transmission factor used, since the prescribed dose and the field sizes are unchanged. A
closer look at the generated fields revealed that the central axis depth doses appeared greater
than expected, supporting the reason for not using them in isodose mapping. In order to
approach this problem form first principles, an open 6 X 15 filed was constructed from depth
dose tables, [1] from which a family of curves of percentage depth dose against field size for
fourteen different depths was constructed, and from which depth dose values for 6 x 15 field
at the corresponding depths, were taken. A curve of percentage depth dose against depth for
the 6 X 15 field of equivalent square 8.5 cm was made, and from which values could be taken
for 90% to 35% in increments of ten. These values were then used to draw isodose curves for
a 6 x 15 open field. The comparison with the computer-generated field shows that the
percentage depth doses of the computed field are approximately 7% greater. If the open field
for the 15 x 20 dimension is deduced in a similar manner, the factor is of the same order,
being 6.4% since the computer is programmed to use the 15 w x 20 wedge for all breast plan
cases, wedge curves of this dimension for 15, 22.5, 30, and 37.5 degrees were generated, each
set of curves being normalized 0.5 cm below the surface and 1.0 cm in from the thin end of
the wedge. The corresponding open field curves generated were normalized at the same point
as the wedged curves.

IAEA-CN-85-79
646
The open field is superimposed on the wedged fields in turn and a transmission factor for each
wedge is determined by using the ratios of the isodose values on the central axis, at equal
displacements on both sides and for four successive depths. The mean values of the
transmission factors were found to be in excess of those deduced from the graph used for half
wedge factor value. The transmission factors were adjusted by the factor in the previous
paragraph, 0.936 and then plotted on the semilog curve as Plot B adjacent to Plot A, the line
for straight line through the points was drawn and a third line, Plot C was constructed by
taking the mean between these two lines. This mean line was then used to determine
transmission factors for other wedge combinations and acceptable agreement in the does times
was seen for a 25deg / 30deg wedge combination used on the asymmetric outline which is
more often the general case. An attempt was made at constructing the equivalent symmetrical
outline for which 27.5-degree wedges were used and again acceptable agreement was realized.
Unfortunately the results for the full wedge and the 22.5 degree wedge showed a greater
deviation than when the lower curve was used.
The prescribed dose in all cases was 4000 CGy in 15 fractions of 267 CGy at 100% for the
chosen dose point. The table below shows the results for dose times using transmission factors
based on plots A and C compared with the computed dose times. This method, though crude,
gives a measure of satisfaction to the physicist who would otherwise be forced to blindly
accept the computed calculations.
Table 1: Comparison of results for different wedge combinations
WEDGE DOSE TIMES FOR METHOD
COMBINATIONS PLOT A COMPUTED PLOT C
Full 45.0 degrees 3.178 3.13 2.94
Half 22.5 degrees 2.24 2.20 2.07
Symmetric 25 deg 2.374 2.23 2.22
Asymmetric 25/30
deg
2.45 2.23 2.232
Reference
[1] Cohen, M., Jones, D.A.E. and Greece, D. Central Axis Depth Dose Data for Use in
Radiotherapy Supplement Number 11. British Journal of Radiologt, British Institute of
Radiology, London 1978. P. 59 Table 6.3. PERCENTAGE DEPTH DOSES : 80 cm
SSD for Cobalt 60 gamma rays.

IAEA-CN-85-239
647
QUALITY ASSURANCE OF THE TREATMENTS PERFORMED WITH A
LINEAR ACCELERATOR BY MEANS OF IN VIVO DOSIMETRY
N. Jornet, M. Ribas, T. Eudaldo, P. Carrasco
Servicio de Radiofísica y Radioprotección, Hospital de la Santa Creu i Sant Pau,
Barcelona, Spain Abstract
In vivo dosimetry by means of diode detectors has been used in routine in our hospital since 1996 to guarantee
the dose administrated to patients undergoing a radiotherapy treatment. The aim of this work is to present how in
vivo dosimetry was implemented in our centre and which kind of errors have been discovered and corrected.
Before the implementation it has to be clear which kind of errors want to be traced, the tolerance and action level
and who will perform the measurements and who will evaluate them. Once all these things are clear, the first
thing to do is to choose the more appropriate type of diodes and to calibrate them. The lower is the tolerance
level the more accurate the calibration has to be. At this point the training and motivation of people who will be
involved is very important to succeed implementing in vivo dosimetry in routine. Choosing one treatment unit
and one easy and frequent treatment technique is a good way of starting implementation. We started with prostate
treatments. In vivo entrance and exit doses were measured and dose to the ICRU point was calculated. Nowadays
in vivo dosimetry is performed in the second session of all treatments (X-rays and electrons).
1. Introducción
Aunque actualmente el cálculo de la dosis al paciente en un punto determinado, puede
especificarse con precisión suficiente, el problema que se plantea es garantizar que la dosis
prescrita por el radioterapeuta y calculada por el radiofísico se corresponda con la recibida
realmente por el paciente. Actualmente la única forma de conocerlo es mediante la dosimetria
in vivo durante las sesiones de tratamiento.
La utilización de dosimetría in vivo mediante detectores semiconductores (diodos) requiere
una elección adecuada del tipo de diodo y una correcta calibración de los mismos, que
contemple todos aquellos factores que influyen en la determinación de dosis bien sea a la
entrada o a la salida del paciente [1-2].
En este trabajo se presenta la implementación de la dosimetría in vivo en la práctica clínica en
este Centro desde 1996 para una unidad de tratamiento.
2. Material
Acelerador lineal Clinac 1800 (Varian) con energías de haces de fotones 6 y 18 MV y haces
de electrones de 4, 6, 9, 12 y 16 MeV. Equipo de dosimetría in vivo, DPD-510 con juego de
detectores para las diversas energías, EDP-10 (6 MV), EDP-30 (18 MV), QED negative
output (18 MV) y EDD2 (haces de electrones). Maniquí de láminas de poliestireno o de
“plastic water” y cámaras de ionización cilíndrica y plano-paralela para calibración de diodos.
3. Tipo de Detección de Errores
Con las medidas a la “entrada” del haz puede comprobarse la reproducibilidad de las
irradiaciones, verificar los parámetros de tratamiento y también determinar indirectamente la
dosis al volumen blanco.

IAEA-CN-85-239
648
La realización de medidas a la “salida” sirven para detectar cambios o errores en el espesor o
composición del paciente, y si estas se combinan con las de entrada permiten además
comprobar el algoritmo de cálculo de la dosis.
4. Metodología de Implementación
La implementación de la dosimetría in vivo en rutina obliga a definir un procedimiento que
abarca diversos aspectos, tales como: quien debe realizar las medidas, cuando, quien las
evalúa, que nivel de tolerancia y nivel de acción hay que fijar, saber cada una de las personas
envueltas en el proceso como deben actuar en cada momento y considerar el registro y
evaluación global de las medidas.
En este Centro la implementación práctica se decidió iniciarla en una técnica de irradiación
simple y de uso frecuente. Para ello se eligió la próstata que se trata con una técnica
isométrica de 4 campos ortogonales y conformados con haces de fotones 18 MV. Primero se
irradia la pelvis con 44 Gy y luego tiene lugar una sobredosis en la glándula prostática hasta
70 Gy.
El Servicio de Radiofísica diseñó una hoja para la recogida de datos del paciente. En ella
los/las dosimetristas anotan los datos suministrados por el propio sistema de planificación
(profundidad del punto ICRU, espesor del paciente, tamaño del campo, porcentaje de dosis en
profundidad en el punto ICRU, en plano medio, a la entrada, a la salida, etc.) [3].
Para contrastar el cálculo de la dosis en el punto ICRU se elaboró un algoritmo de cálculo a
partir de las medidas in vivo a la entrada y a la salida.
Se establecieron los niveles de tolerancia y de acción en la determinación de la dosis a la
entrada y al punto de prescripción de dosis (punto ICRU). En nuestro caso se ha elegido el
mismo nivel de tolerancia que de acción en cada caso y se fijó inicialmente en �5% tanto para
la dosis a la entrada como para el punto ICRU.
Tabla I.. Resumen de los promedios de desviaciones entre las dosis esperadas y las dosis obtenidas
mediante DIV para tratamientos de prostata. N = 2046 con 1 contorno y N = 532 con CT.
Campos A/P y P/A Campos laterales 1 contorno sin
corrección por
heterogeneidades
CT con corrección por
heterogeneidades
1 contorno sin
corrección por
heterogeneidades
CT con corrección por
heterogeneidades
Promedio %
S.D
Promedio % S.D Promedio % S.D Promedio % S.D
Entrada 1.36 2.15 1.33 1.90 0.34 2.22 -0.17 1.80
Salida -1.09 5.30 1.12 4.34 -6.42 7.80 -1.68 5.51
Punto ICRU 0.32 3.14 1.31 2.50 -2.06 4.43 0.57 3.20
La dosimetría in vivo la efectúan los técnicos de la unidad de tratamiento en la segunda sesión
de cada una de las partes del tratamiento y cuando se ha modificado algún parámetro en el
mismo. Se coloca en el centro de cada campo un diodo a la entrada y otro a la salida del haz,
se apuntan las lecturas y se hace la primera revisión sobre la dosis a la entrada. Cuando la
dosis a la entrada está fuera del nivel de tolerancia, se tiene que revisar todos los parámetros
de tratamiento indicados y señalar cual de ellos no es correcto.

IAEA-CN-85-239
649
0
50
100
150
200
250
300
350
400
450
< -
9.5 -9 -8 -7 -6 -5 -4 -3 -2 -1 0 1 2 3 4 5 6 7 8 9
> 9
.5
% diferencia entre la dosis medida y la dosis esperada en la entrada
frecuencia
lateral
A/P y P/A
lateral:
promedio = 0,34%
S.D. = 2,22%
N = 2046
A/P y P/A:
promedio = 1,36%
S.D. = 2,15%
N = 2046
0
50
100
150
200
250
<-18,5
-18.0
-17.0
-16.0
-15.0
-14.0
-13.0
-12.0
-11.0
-10.0
-9.0
-8.0
-7.0
-6.0
-5.0
-4.0
-3.0
-2.0
-1.0
0.0
1.0
2.0
3.0
4.0
5.0
6.0
7.0
8.0
9.0
10.0
% diferencia entre la dosis medida y la dosis esperada en la salida
frecuencia
C2+C4
C3+C1
lateral:
promedio = -6.42%
S.D. = 7.80%
N = 2046
A/P y P/A:
promedio = -1.09%
S.D. = 5.3%
N = 2046
0
50
100
150
200
250
300
350
< -
9.5 -9 -8 -7 -6 -5 -4 -3 -2 -1 0 1 2 3 4 5 6 7 8 9
> 9
.5
% diferencia entre la dosis medida y la dosis prescrita en el punto ICRU
frecuencia
lateral
A/P y P/A
lateral:
promedio = -2.06%
S.D. = 4.43%
N = 2046
A/P y P/A:
promedio = 0.32%
S.D. = 3.14%
N = 2046
Fig. 1 Histogramas de frecuencia para tratamientos de prostata

IAEA-CN-85-239
650
Una vez realizada la dosimetría in vivo y cuando las dosis de entrada están dentro de los
niveles de tolerancia el radiofísico introduce los datos en la hoja de cálculo y hace la
evaluación correspondiente, teniendo en cuenta los factores de corrección. Se compara las
dosis a la entrada y a la salida con las dosis medidas y la dosis prescrita con la calculada en el
punto ICRU, en este caso haciendo uso del algoritmo de cálculo desarrollado en el propio centro e
independiente del sistema de planificación.
5. Resultados
En la figura 1 se muestra el histograma de frecuencias que contiene una serie de 2046
dosimetrias in vivo de próstata. La figura se ha desglosado en tres apartados:
a) % de diferencia entre la dosis calculada y medida a la entrada
b) % de diferencia entre la dosis calculada y medida a la salida
c) % de diferencia entre la dosis calculada a partir de la dosimetría in vivo y
la prescrita en el punto ICRU.
Se observa una mayor desviación a la salida que a la entrada, esto obedece a que existe más
dificultad de colocación del diodo a la salida.
Posteriormente se introdujo en rutina la planificación 3D que contempla la corrección por
heterogeneidades. En la tabla I se indican las diferencias encontradas entre la planifición 2D
(sin corrección por heterogeneidades) y 3D.
Las desviaciones superiores al 5% en la dosis de entrada se debían primero a que el diodo se
había girado o caído, segundo a algún error en la colocación del paciente como distancia foco-
superficie, tamaño de campo o unidades de monitor y finalmente a un error en la introducción
de los factores de calibración de los diodos.
Las desviaciones superiores al 5% en la prescripción de la dosis fueron debidas a un cambio
en el contorno del paciente entre la planificación y el inicio del tratamiento y a las prótesis
incorporadas al paciente y cuya composición no contemplan los sistemas de planificación.
Posteriormente y después de analizar este proceso de implantación, se decidió extender la
aplicación de la dosimetría in vivo a otras técnicas de tratamiento, tales como las técnicas
isocéntricas con haces de fotones, y también a los tratamientos con haces de electrones. En
estos casos sólo se coloca un diodo en la puerta de entrada de cada haz.
Actualmente puede decirse que prácticamente todos los pacientes tratados mediante el
acelerador lineal son controlados con dosimetría in vivo.
6. Conclusión
La dosimetría in vivo es un medio de control de calidad relativamente fácil, exacto y que
consume poco tiempo en la unidad de tratamiento. Permite comprobar la dosis prescrita
durante el tratamiento del paciente y es un control independiente del sistema de cálculo.
Referencias
[1] JORNET, N., RIBAS, EUDALDO M. T. Intercomparison between two different in vivo
dosimetry diodes for 16 to 25 MV energy range. Med. Phys. Vol.27-6 (2000), 1287 a 1293.

IAEA-CN-85-239
651
[2] ESSERS M. and MIJNHEER B.J., In vivo dosimetry during external photon beam
radiotherapy. Int. J. Radiat. Oncol. Biol. Phys. 43 (1999) 245 a 249.
[3] JORNET,N., RIBAS, M., EUDALDO T., CARABANTE D., DUCH,M.A., GINJAUME,
M., ISERN, J. Quality assurance in radiotherapy by in vivo dosimetry with diodes during
prostatic treatments. Med. Biol. Eng. Com. Vol 35, supplement Part 2: 1082 (1997).

IAEA-CN-85-268
652
IAEA RADIATION EVENTS DATABASE (RADEV)
J. Wheatley, P. Ortiz-Lopez
International Atomic Energy Agency, Vienna
Abstract
Whilst the use of ionizing radiation continues to bring benefits to many people throughout the world there is
increasing concern at the number of reported accidents involving radiation. Such accidents have had an impact on
the lives of patients, workers and members of the public, the consequences of which have ranged from trivial
health effects to fatalities. In order to reduce the number of accidents and to mitigate their consequences it is,
therefore, necessary to raise awareness of the causes of accidents and to note the lessons that can be learned. The
IAEA’s database on unusual radiation events (RADEV) is intended to provide a world-wide focal point for such
information.
1. Introduction
The use of radiation sources and radioactive material is well established throughout the world
and brings substantial benefits to society when used in a safe and controlled manner. The
IAEA, in addition to facilitating the transference of technology that utilizes the constructive
properties of ionizing radiation, has a statutory function to establish international standards of
safety and to provide for their application. The International Basic Safety Standards [1], which
were jointly sponsored by FAO, IAEA, ILO, OECD/NEA, PAHO and WHO, establish
requirements for protection against the risks associated with exposure to ionizing radiation
and include a substantial appendix on Medical Exposure.
Even though many governments have adopted these international standards into their national
arrangements, the large number of radiological accidents that have been reported worldwide
implies that numerous radiation sources are not managed or regulated appropriately. Indeed,
IAEA has, with the cooperation of Member States, already published a number of reports of
accidents with significant consequences in order to provide feedback and identify lessons to
be learned [2, 3].
Global awareness of the magnitude and seriousness of the problem was raised in September
1998 at the first international conference on the ‘Safety of Radiation Sources and the Security
of Radioactive Material’ held in Dijon, France.
The conclusions of this conference were drawn to the attention of the IAEA Board of
Governors at the General Conference. Subsequently, the IAEA Secretariat was requested to
prepare and implement an Action Plan on the ‘Safety of Radiation Sources and the Security of
Radioactive Material’. The Action Plan, which was endorsed by the Board of Governors and
the General Conference in 1999 covers the following seven areas: regulatory infrastructures;
management of disused sources; categorization of sources; response to abnormal events;
information exchange; education and training; and international undertakings. One of the
actions under ‘Information Exchange’ is for the IAEA secretariat to fully develop and
maintain an international database on unusual radiation events (RADEV) and to make it
available to Member States.

IAEA-CN-85-268
653
2. BSS requirements for accidental Medical Exposures
As mentioned above, the BSS [1] includes requirements for Medical Exposures, amongst
which are specific requirements relating to accidental medical exposures (as given below).
RADEV has been designed to capture the details and lessons to be learned from such
accidents.
The following is an extract from Appendix II (Medical Exposures) of the BSS:
II.29. Registrants and licensees shall promptly investigate any of the following incidents:
(a) any therapeutic treatment delivered to either the wrong patient or the wrong tissue, or
using the wrong pharmaceutical, or with a dose or dose fractionation differing
substantially from the values prescribed by the medical practitioner or which may lead
to undue acute secondary effects;
(b) any diagnostic exposure substantially greater than intended or resulting in doses
repeatedly and substantially exceeding the established guidance levels; and
(c) any equipment failure, accident error, mishap or other unusual occurrence with the
potential for causing a patient exposure significantly different from that intended.
II.30. Registrants and licensees shall, with respect to any investigation required under
para. II.29:
(a) calculate or estimate the doses received and their distribution within the patient;
(b) indicate the corrective measures required to prevent recurrence of such an incident;
(c) implement all the corrective measures that are under their own responsibility;
(d) submit to the Regulatory Authority, as soon as possible after the investigation or as
otherwise specified by the Regulatory Authority, a written report which states the cause
of the incident and includes the information specified in (a) to (c), as relevant, and any
other information required by the Regulatory Authority; and
(e) inform the patient and his or her doctor about the incident.
3. Overall Objectives of RADEV
Capturing information about accidental medical exposures is only part of RADEV’s remit. On
a broader scale, RADEV includes many different types of events that have occurred outside
the nuclear power programme. The overall objectives of RADEV are to:
(a) disseminate information on radiation events and feedback lessons that may help to
prevent future accidents, or mitigate their consequences should they occur, and
(b) provide a tool to help Member States, the IAEA and other organizations to identify
priorities in their radiation safety programme to facilitate the efficient allocation of
resources.
In order to achieve these general objectives a centralized RADEV database is being
established at IAEA’s headquarters in Vienna to:
(a) provide a repository of information on accidents, near-misses and any other unusual
events involving radiation sources not directly involved in the production of nuclear power
or its fuel cycle;

IAEA-CN-85-268
654
(b) categorize events in a standardized manner to facilitate the search for events fitting
particular profiles, the identification of causes and the lessons to be learned;
(c) provide a means to analyze trends in radiation events; and
(d) provide summary descriptions of events that can be used directly as training material.
RADEV is designed to capture lessons to be learned from radiation events and is not meant to
be a real-time on-line database. A separate IAEA initiative is concerned with developing a 24-
hour reporting system for missing and found orphan sources.
4. Events to be included
General Events
�� events or potential events involving patients, workers or members of the public;
�� events involving radiation sources which have been lost, found, stolen, or subject to
unauthorized and inadvertent transfer/sale; and
�� events that occurred during the transportation of sources that result or could have resulted
in the loss or degradation of control of radiation sources.
Events Involving Patients
Many types of radiation events involving patients have been reported, including:
�� Wrong patient exposed
�� Wrong tissue exposed (correct patient)
�� Wrong radio-pharmaceutical administered
�� Wrong activity administered
�� Wrong beam settings
�� Delivered dose different from intended
The consequences of such events include: ineffective treatment, ineffective diagnosis, severe
radiation burns, severe degradation in quality of life and, in some cases death directly
attributable to high radiation exposure. Many of these events were caused by deficiencies in,
or a lack of: design, testing and calibration of equipment; education, training and qualification
of personnel; procedures; defense in depth; quality assurance. In some cases, events involving
patients have also resulted in exposures of hospital workers, lost sources and exposures of
members of the public.
5. Management and operation
The database has been designed to operate on a personal computer using Microsoft Access 97
or above. Copies of the RADEV software will be provided to selected organizations within
Member States for their own use and users will be requested to provide data to IAEA on a
regular basis. IAEA will be manage and operate the international RADEV database and will
act as the central focal point for all users. IAEA will publish regular summary reports from
RADEV and will provide electronic updates of the data to participating organizations.
Confidentiality will be maintained by IAEA at all times and details such as names of
individuals, hospitals and factories will not be divulged.

IAEA-CN-85-268
655
6. Implementation
The RADEV project is being implemented in 3 phases:
Phase 1: Establishment of the database. IAEA will collect currently available details of
radiation accidents and test the software.
Phase 2 : Limited international trials. IAEA will provide a working version of RADEV
to several international and national organizations (including professional
organizations in the medical field) for testing and evaluation. Feedback from
the trials will be reviewed by IAEA and any necessary changes made to the
software.
Phase 3: Distribution of RADEV. IAEA will collect data from participating
organizations, compile international statistics and produce summary reports.
Electronic copies of the summary reports and the updated database will be
available to participating organizations.
The current status at time of the Malaga Conference is that Phase 1 has been successfully
completed and international trials are taking place.
References
[1] FOOD AND AGRICULTURE ORGANIZATION OF THE UNITED NATIONS,
INTERNATIONAL ATOMIC ENERGY AGENCY, INTERNATIONAL LABOUR
ORGANISATION, OECD NUCLEAR ENERGY AGENCY, PAN AMERICAN
HEALTH ORGANIZATION, WORLD HEALTH ORGANIZATION, International
Basic Safety Standards for Protection against Ionizing Radiation and for the Safety of
Radiation Sources, Safety Series No. 115, IAEA, Vienna (1996).
[2] INTERNATIONAL ATOMIC ENERGY AGENCY, Lessons Learned from Accidents
in Radiotherapy, Safety Report No. 17, IAEA, Vienna (1998).
[3] INTERNATIONAL ATOMIC ENERGY AGENCY, Accidental Overexposure of
Radiotherapy Patients in San José, Costa Rica, IAEA, Vienna (1998).
IAEA-CN-85-165
656
METHODOLOGY FOR THE APPLICATION OF
PROBABILISTIC SAFETY ASSESSMENT TECHNIQUES (PSA)
TO THE COBALT-THERAPY UNITS IN CUBA
J.J. Vilaragut Llanes, R. Ferro Fernández, M. Troncoso Fleitas,
B. Lozano Lima, A. de la Fuente Puch, Y. Pérez Reyes, C. Duménigo González
Centro Nacional de Seguridad Nuclear (CNSN), Havana, Cuba
Abstract
The applications of PSA techniques in the nuclear power plants during the last two decades and the positive
results obtained for decision making in relation with safety, as a complement to deterministic methods, have
increased their use in the rest of the nuclear applications. At present a wide set of documents from international
institutions can be found summarizing the investigations carried out in this field and promoting their use in
radioactive facilities. Although still without a mandatory character, the new regulations of radiological safety also
promote the complete or partial application of the PSA techniques in the safety assessment of the radiological
practices. Also the IAEA, through various programs in which Cuba has been inserted, it is taking a group of
actions so that the nuclear community would encourage the application of the probabilistic risk methods for the
evaluations and decision making with respect to safety. However, the fact that in any radioactive installation it
has not still been carried out a complete PSA study, makes that certain methodological aspects require to be
improved and modified for the application of these techniques. This work presents the main elements for the use
of PSA in the evaluation of the safety of cobalt-therapy units in Cuba. Also presents, as part of the results of the
first stage of the Study, the Guidelines that are being applied in a Research Contract with the Agency by the
authors themselves, which belong to the CNSN, together with other specialists from the Cuban Ministry of Public
Health.
Resumen
La amplia utilización de las técnicas de APS en el sector nucleoenergético durante las pasadas dos décadas y los
positivos resultados obtenidos para la toma de decisiones en materia de seguridad, como complemento de los
métodos deterministas, han incentivado su utilización en el resto de las aplicaciones de la esfera nuclear. Son
cada vez más frecuentes los documentos de prestigiosas instituciones internacionales que resumen las
investigaciones realizadas en este campo y promueven su utilización en instalaciones radiactivas. Aunque aún sin
un carácter mandatorio, las nuevas regulaciones de seguridad radiológica también promueven la utilización
completa o parcial de las técnicas de APS en la evaluación de seguridad de las diferentes prácticas. Asimismo el
OIEA, a través de diversos programas en los que Cuba se ha insertado, está tomando un grupo de acciones para
que la comunidad nuclear priorice la aplicación de las técnicas probabilistas de riesgos en la evaluación y toma
de decisiones en materia de seguridad. Sin embargo, a pesar de ser una metodología con probada eficacia en el
sector nucleoenergético, el hecho de que en ninguna instalación radiactiva se haya realizado aún un estudio
completo de APS, hace que existan determinados aspectos metodológicos que requieran profundizarse y
adaptarse para la aplicación de dichas técnicas. En el presente trabajo se discuten los principales elementos
tenidos en cuenta para la utilización de los APS en la evaluación de la seguridad de las unidades de
cobaltoterapia de Cuba y se presenta, como parte de los resultados de la primera etapa del Estudio, la Guía
Metodológica que está siendo utilizada en un Contrato de Investigación del OIEA que actualmente realiza el
colectivo de autores del CNSN, de conjunto con otros especialistas del Ministerio de Salud Pública (MINSAP).
1. Introducción
La evaluación de la seguridad ha descansado tradicionalmente en el enfoque prescriptivo, es
decir, la evaluación del cumplimiento de determinados códigos y normas que resumen los
resultados de la evidencia histórica, la investigación y el desarrollo en un momento dado, así
como la comprobación mediante análisis deterministas en los que se utilizan las hipótesis más
desfavorables para comprobar que ante el peor accidente previsible no ocurren consecuencias
radiológicas graves y por tanto se garantiza que los resultados de las evaluaciones queden del
lado de la seguridad.

IAEA-CN-85-165
657
Este enfoque tiene a favor que la demostración de correspondencia es relativamente directa, a
la vez que asegura niveles aceptables de seguridad, integridad y fiabilidad. El método
determinista es incuestionable, sin embargo posee limitaciones que hacen conveniente el uso
de un enfoque complementario para la evaluación. Entre estas limitaciones están:
�� Las regulaciones descansan en requisitos precisos y detallados, por lo que tienen una
rigidez intrínseca que puede ser rápidamente rebasada por nuevos desarrollos
tecnológicos.
�� Los factores humanos y organizacionales que influyen en la seguridad son poco
propensos a la evaluación prescriptiva.
�� El enfoque prescriptivo puede inhibir la innovación y la búsqueda de soluciones más
óptimas para incrementar la seguridad.
�� Posee el riesgo de que el diseñador o el operador puede no entender la esencia o razón de
ser de las regulaciones, preocupándose simplemente por su cumplimiento. Esto es, este
enfoque promueve una “cultura de cumplimiento” más que la búsqueda de la seguridad
máxima factible por los medios mejores posibles.
Existe otro enfoque complementario de evaluación de la seguridad denominado “Análisis
Probabilista de Seguridad (APS)”, que utiliza herramientas conceptuales y matemáticas para
realizar una investigación sistemática, exhaustiva y estructurada de los diferentes escenarios
de riesgos que pueden conducir a un evento no deseado (secuencias accidentales) a partir de
la ocurrencia de fallos de equipos o errores humanos (sucesos iniciadores de accidentes).
En las últimas dos décadas, el APS ha sido ampliamente utilizado en el sector
nucleoenergético, realizándose decenas de estudio en los países con centrales nucleares, y
obteniendo positivos resultados para la toma de decisiones en materia de seguridad, como
complemento de los métodos deterministas.
El principal objetivo de un APS consiste en proporcionar información cualitativa y
cuantitativa acerca de las interioridades del diseño y funcionamiento de una instalación,
incluyendo la identificación de los contribuyentes al riesgo y comparación de opciones para
incrementar la seguridad.
Es decir, la finalidad de un APS se puede resumir en:
�� Determinar y precisar las combinaciones de sucesos que pueden conducir a un accidente o
evento no deseado;
�� Evaluar la probabilidad de que se produzca cada combinación;
�� Evaluar las consecuencias.
Con este fin, la metodología de APS integra información sobre el diseño, practicas de
operación y funcionamiento, historial operacional, fiabilidad de equipos y componentes,
comportamiento humano, fenómenos favorables a un accidente y efectos potenciales.
Toda esta información es utilizada para lograr que los posibles incidentes, deficiencias, errores
y vulnerabilidades de la instalación, proporcionen un panorama equilibrado de su efecto sobre
la seguridad, así como la importancia relativa de las contribuciones al riesgo de las secuencias
de accidente que podrían iniciarse a causa de fallos en el equipo o las modalidades de
operación.

IAEA-CN-85-165
658
Gestión y Organización del APS
I
Identificación de losSucesos Iniciadores II
Modelación de las Secuencias Accidentales III
Gestión de Datos de Confiabilidad IV
Análisis de Resultados del APS
VI
Cuantificación de las Secuencias Accidentales V
2. Metodología para la ejecución del APS
Para cualquier instalación o práctica, la realización de un Análisis Probabilista de Seguridad
comprende las 6 etapas fundamentales que se representan en el diagrama en bloques de la
Fig. 1.
Figura 1. Pasos para la Ejecución del APS
Aunque en principio los métodos de APS pueden ser aplicados a cualquier tipo de instalación,
existen un grupo de aspectos que requieren profundizarse para garantizar su plena utilización
metodológica, teniendo en cuenta los siguientes elementos:
1. Alcance del estudio
2. Naturaleza y complejidad de la instalación,
3. Grado de introducción del APS en instalaciones similares,
4. Disponibilidad y detalle de los análisis deterministas de seguridad,
5. Idoneidad de los modelos para la instalación
6. Disponibilidad y calidad de los datos de fiabilidad
7. Incidencia e importancia del factor humano en las secuencias accidentales a estudiar.
Especial atención en la aplicación de la filosofía del APS a la práctica de cobaltoterapia,
máxime cuando el Estudio está enfocado hacia la seguridad del paciente, debe prestarse a
hecho de que muchas de las características de las exposiciones potenciales que se identifiquen
serán mayoritariamente generadas por actuaciones humanas, por lo que el APS, en gran
medida será un análisis específico y detallado de los factores humanos que intervienen en las
secuencias accidentales.
Teniendo en cuenta este aspecto, y las limitaciones que existen para la estimación de las
probabilidades de errores humanos; y considerando que es muy elevado el número de posibles
actuaciones humanas, el APS deberá utilizar con el mayor nivel de detalle posible las técnicas
cualitativas de identificación de peligros y la evaluación de las incertidumbres en las
probabilidades asignadas.
Es por esta razón, que a pesar de la existencia de documentos metodológicos para la
realización de un APS, y de su utilidad práctica, se han adaptado para la ejecución de los
Análisis Probabilista de Seguridad a las prácticas de cobaltoterapia en Cuba las diferentes
etapas para la aplicación del Estudio, según se presenta en el diagrama en bloques de la Fig. 2.

IAEA-CN-85-165
659
En sentido general, la metodología tiene en cuenta los siguientes puntos:
�� Identificación de peligros o accidentes con consecuencias importantes que pueden tener
lugar durante el tratamiento con cobaltoterapia (estado de daño)
�� Identificación de cómo se puede llegar a iniciar las secuencias de sucesos que conlleven a
los estados de daño identificados (sucesos iniciadores de accidente). Para ello se
combinarán diferentes métodos, que de una forma sistemática y exhaustiva permitan
garantizar que la posible ausencia de un suceso iniciador de accidente, no tendrá un
aporte relativo significativo, con respecto a todos los considerados en el Estudio.
�� Determinación de los efectos sobre el paciente, el trabajador ocupacionalmente expuesto
y el público, a partir del análisis de los modos de fallos de los equipos y los posibles
errores humanos en las diferentes etapas del tratamiento con cobaltoterapia.
Definición de Objetivos y Alcance del APS 1
Administración del Proyecto
2
Selección de métodos y establecimiento de
procedimientos 3
Selección y organización del equipo
de trabajo 4Planificación del trabajo
5
Familiarización con la unidad
6
Definición de los Estados de Daño u otras
consecuencias 7
Selección de los sucesos iniciadores de accidente
(SI) 8
Determinación de las funciones de seguridad
9Agrupamiento de los SI
10
Modelación de Árboles de Fallos
14
Análisis de Errores Humanos
12
Modelación de Árboles de Eventos
13
Análisis de Dependencias Cualitativas 11
Determinar las ecuaciones booleanas 20
Cuantificación Inicial de las Secuencias Accidentales 21
Cuantificación final de las Secuencias Accidentales
22
Análisis de las Medidas de Importancia 23
Análisis de Sensibilidad 24
Documentación del APS
25
Estimación de probabilidades de
errores humanos 15
Análisis de Fiabilidad de Componentes
16
Evaluación de Probabilidades de
Fallos Causa Común 17
Análisis de Incertidumbres
19
Estimación de la Frecuencia de Eventos
Iniciadores 18
Figura 2. Diagrama en bloques de la Guía Metodológica para la ejecución del APS a la práctica de
cobaltoterapia en Cuba

IAEA-CN-85-165
660
�� Desarrollo de los árboles de sucesos que representen las secuencias posibles.
�� Análisis, por medio de árboles de fallos de los cabeceros modelados en los árboles de
sucesos.
�� Cuantificación de las probabilidades asociadas a los sucesos iniciadores y a los sucesos
básicos en los árboles de fallos.
�� Análisis de la fiabilidad de las acciones humanas que figuren en los sucesos iniciadores,
en los árboles de sucesos o en los árboles de fallos
�� Cuantificación de las frecuencias anuales de las diversas secuencias y peligros
identificados en el primer paso.
Para esta primera etapa del Estudio, no se realizarán de forma exprofesa estudios médicos
detallados de los accidentes identificados y las secuencias modeladas, así como no se
cuantificarán en términos económicos o de daños humanos las consecuencias consideradas en
los estados de daño, por lo que no se integrará el riesgo desde el punto de vista cuantitativo,
aunque sí será válido desde el punto de vista cualitativo.
Es decir, en esta primera etapa, el estudio solo tendrá un alcance de “Análisis Probabilista de
Seguridad (APS)” y no de un “Análisis Probabilista de Riesgo (APR)”1.
3. Conclusiones
El trabajo resume los principales elementos tenidos en cuanta durante la realización de la
“Guía Metodológica para la aplicación de las técnicas de Análisis Probabilista de Seguridad
(APS) a las unidades de cobaltoterapia en Cuba”.
Este documento constituye el primer resultado de un proyecto de investigación para la
evaluación de la seguridad del paciente durante la práctica de cobaltoterapia en el país.
La metodología incluye la aplicación conjunta de más de 5 técnicas de identificación de
riesgos, que posibilitarán el análisis exhaustivo, sistemático y estructurado de la práctica en
Cuba.
A su vez, la Guía podrá ser utilizada por nuestro órgano regulador como material de
referencia durante la evaluación de Estudios similares que se realicen en el país como parte
del proceso de licenciamiento de las diferentes instalaciones radiactivas.
1 En rigor, un Análisis Probabilista de Riesgo se deberá corresponder con la siguiente definición de riesgo:
���j
j
i
iDPR .
donde:
Pi: probabilidad de ocurrencia del accidente i
Dj: daño j; consecuencias del accidente, que deberán incluir tanto la salud como las socioeconómicas, y en
cuyo cálculo se incluye la magnitud de cada dosis.

IAEA-CN-85-165
661
Referencias
[1] Centro Nacional de Seguridad Nuclear, “Guía Metodológica para la realización de
Análisis Probabilista de Seguridad a la práctica con cobaltorapia en Cuba”. La Habana
(2000).
[2] International Atomic Energy Agency, International Basic Safety Standards for
Protection against Ionizing Radiation and for the Safety of Radiation Sources. Safety
Series No. 115. Vienna (1994).
[3] Centro Nacional de Seguridad Nuclear, “Manual de Instrucciones y Procedimientos de
Análisis de Seguridad”. La Habana (1999).
[4] International Commission on Radiological Protection, Protection from Potential
Exposures: Application to Selected Radiation Sources. ICRP Publication 76 (1996).
IAEA-CN-85-265
662
NORMAL TISSUE DAMAGE IN RADIOTHERAPY
DEVELOPMENT OF A CLINICAL AUDIT TOOL
A. Barrett
Beatson Oncology Centre, Dumbarton Road, Glasgow, United Kingdom
On behalf of the ESTRO MORQA Network, Task Group 2:Morbidity/European Society for
Therapeutic Radiology and Oncology, Brussels
Abstract
Radiotherapy treatments are evaluated by two main outcomes, rates of cure or local tumour control and normal
tissue complication rates. Many excellent schemes have been devised for recording the late effects of
radiotherapy treatments including the RTOG and LENT SOMA Scales. These have proved invaluable in
documenting the outcome of clinical trials, but have proved too complex and time consuming for routine daily
use in busy departments. A group in Eindhoven led by Professor Lybeert undertook a pilot study of a potential
way of auditing late radiation complications. Using a simplified form derived from the LENT SOMA scales,
they collected data on grade 3 and 4 complications in a total of 675 patients and were able to correlate a number
of particular complications with specific protocols, ICD codes and physician practice. Further review of the
case records made it possible to identify specific factors which may have led to toxicity and could be taken into
account to modify treatment protocols. From September 1999 clinicians in participating centres undertaking
normal follow-up procedures were asked to identify patients who showed evidence of grade 3 or 4 toxicity as
defined in the pro-forma. Date of radiotherapy was recorded so that a temporal correlation of complication with
treatment could be made, but this study did not attempt to assess the incidence of complications, but to provide
a cross-sectional study of prevalence. Centres participating in the study have been Eindhoven, Köln, Gent,
Brussels, Glasgow, Mount Vernon, Madrid, Genova and Lyon. In Eindhoven 651 reports were collected
between January 1995 and December 1999. 89 reports had to be discarded because complications were not
validated by the reviewing radiotherapists. Dr Lybeert noticed that individual radiotherapists appeared to have
different thresholds for reporting specific complications. 13 patients deaths appeared to be related to radiation
problems. An overall level of detection of morbidity was approximately 9%. It was possible to link morbidity
with specific protocols. Some of these employed large doses per fraction and in some cases these were given in
combination with chemotherapy. In the second phase of the study, patients undergoing routine follow-up at the
Beatson Oncology Centre were also studied. Forms were completed by the reviewing oncologist and checked
and analysed separately by two other radiotherapists. So far a total of 7645 forms have been placed. Of these
4372 have been completed and at routine follow-up 8.9% of these have recorded grade 3 or 4 toxicity.
Preliminary analysis of the data suggests again a correlation of large dose per fraction or concomitant
chemotherapy with radiotherapy related problems. It is hoped that this study will be completed by December
2000. Comparison of data from different centres will be made. Data from Lyon and Mount Vernon have been
extracted from existing databases. It is hoped that there may be some consistency in results which may provide
a benchmark for a useful audit tool. This approach will be discussed in relation to the need to develop a simple
prospective recording of late morbidity. Keywords: Radiotherapy, Morbidity, QA, Clinical audit** MORQA
Project , funded by the “Europe Against Cancer Programme “ of the EU
1. Introduction
Quality assurance programmes in radiotherapy are essential to ensure accuracy in treatment
delivery, to optimise local tumour control and survival and to avoid as far as possible any
undesirable late consequences.
The European Society of Therapeutic Radiology and Oncology with EU funding set up such
programmes in 1998 with two components ;
(1) EQUAL – a European QA network
(2) MORQA – a programme designed to measure the prevalence of complications of
treatment in patients who are cured of cancer.

IAEA-CN-85-265
663
2. Background
Radiotherapy treatments are evaluated by two main outcomes, rate of cure or local tumour
control, and normal tissue complication rates. Many schemes have been used for recording
late effects of radiotherapy treatments, including the RTOG and Lent-Soma scales. Although
these have been used widely in documenting the outcome of clinical trials, they are complex
and time consuming to record and therefore have not proved a very practical tool in busy
clinical practice. There is still a need for a simple method of assessment. In particular, there
would be great value from having a system which enabled the early detection of
complications which were associated with a specific protocol or treatment approach,
especially when new treatments are being introduced.
3. MORQA – Pilot Study
In 1995, Professor Lybeert set up a programme for registration of late morbidity in his
department in Eindhoven. The existing instruments developed by major collaborative groups
for measuring toxicity of treatment have proved too complex for routine daily use. He
therefore used a simplified form derived from the Lent-Soma scale to collect data on Grade 3
and 4 toxicity in 675 patients over a period of 5 years. His group was able to correlate a
number of particular complications with specific protocols, ICD codes and physician practice
using cluster analysis techniques and the work led to changes in the patient management
within the department. On the basis of his experience, this instrument was adopted as a tool
for the main MORQA study.
4. MORQA – Methodology
11 centres in Europe participated in the study after initial site visits to document their
structure, function and ability to collect data appropriately.
From September 1999, clinicians in participating centres undertaking routine follow-up care
of patients treated with radiotherapy were asked to identify those who showed evidence of
Grade 3 or 4 toxicity as defined in the pro forma. Information was sought about the date of
radiotherapy (for temporal correlation of complication with treatment) and other treatments
given (to assess the effect of treatment interactions). It was recognised that this study could
not assess the incidence of complications but only provide a cross-sectional study of
prevalence.Completed forms and patient files were assessed by two independent observers.
Regular network meetings were held to monitor the progress of the study.
5. Results
A number of different follow-up practices were observed in the participating centres. It was
striking that few centres had a fully comprehensive policy of following treated patients,
which would be essential for obtaining data on incidence of complications. Because of this
variation in practice, the data were collected in several different ways. Data were considered
to be complete and representative in 4 of the 11 participating centres. From 1 centre (Mount
Vernon), results from a prospectively collected database could be used to determine
incidence of complications in patients with two particular types of tumours.
The majority of the effects recorded developed within the first 5 years after treatment
although new complications were still recorded at 10-20 years after treatment. Other

IAEA-CN-85-265
664
treatments given at or near the time of radiotherapy may increase complication rates. We
observed that many patients had had surgery or chemotherapy which may have contributed to
the outcome. Cluster analysis for the data from Eindhoven has shown correlations with
particular schedules of treatment but this could not be confirmed for the overall group of
patients where clusters appeared rather to occur in association with the commonest types of
tumours. Over and under reporting of side effects was noted. Clinicians unfamiliar with
radiotherapy practice often ascribed effects to the treatment which were unconnected (eg.
problems with dentition after radiotherapy for carcinoma of the cervix) and doctors with less
experience in the specialty might fail to recognise side effects to which radiotherapy may
have contributed. There was clear evidence of general lack of knowledge in this area. Review
of the endpoints documented showed that some were useful and easily defined (myelitis)
whereas others were rarely used (fatigue) or difficult to assess (dyspnoea). It was clear that
patient and physician estimates of the severity of a problem could differ.
6. Conclusions and recommendations
1. There is no agreement on how patients who have been treated for cancer should best be
followed to determine
(a) local control rates
(b) overall survival
(c) consequences of treatment
These three endpoints are essential for determining whether a new treatment represents a real
improvement over an existing one (ie. shows an improvement in therapeutic ratio and not
just a higher cure rate at a greater cost).
Recommendation - The development of strategies for patient surveillance is a target for
future quality assurance programmes.
2. There is wide-spread ignorance about the consequences of successful treatment for
cancer and the interactions of various components of the treatment. An education programme
is needed to improve this situation. Collaborations should be set up with other European
Cancer groups (ESSO and ESMO through FECS) to study treatment interactions.
Recommendations - New ESTRO teaching programme on care of the cured patient and
consequences of cancer treatments.
Joint initiative with FECS to study treatment outcomes.
3. The established instruments for recording outcomes of treatment are effective within
clinical trials settings but too complex for routine practice. Further work is needed to develop
a simple tool. This present study shows that it should contain only a small number of items
(or it will not be used) and more work is needed to validate these items. Patient’s views must
contribute to the overall assessment of outcome.
Recommendations - Further discussion to reach a consensus at a European/International
level on ways of recording outcomes of treatment.
Development of a way of recording patient’s view of treatment outcome.
4. Cluster analysis (used routinely in other branches of science) does not seem to be a
sensitive method for use in the study of treatment side effects probably because they are rare
and affected by many factors other than radiation alone.
5. It is difficult to show a direct correlation between specific dosimetric estimates (from the
EQUAL Study) with particular outcomes because the variation due to errors in radiotherapy
delivery is small and co-morbidity and effects of other treatments influence radiotherapy
outcomes. Nevertheless dose response curves for complications can be derived and the
theoretical improvement to be expected from the QA programme calculated.

IAEA-CN-85-265
665
Recommendation - Continuation of both aspects of the QA programme is essential to
optimise outcomes of treatment.
7. Future programme
The network meetings led to an international meeting MITRE, set up to discuss the issues of
identifying, monitoring, recording, eliminating or treating undesired consequences of
treatment. This meeting held in Brussels in December 2000 was attended by 160 participants
from 29 countries and led to the production of a consensus statement for a strategy for future
studies. Application will be made to the Commission of the European Union for funding to
continue and develop the programme of quality assurance in cancer treatment
Acknowledgement
This study was made possible thanks to the support of the “Europe Against Cancer “
Programme of the EU.
References
[1] Trotti A, Byhardt R, Stetz J et al, Common Toxicity criteria: Version 2.0. An
improved reference for grading the acute effects of cancer treatment: Impact on
radiotherapy. Int J Radiat Oncol Biol Phys 2000; 47: 13-47
[2] Cox JD, Stetz J, Pajak TF, Toxicity criteria of the Radiation Therapy Oncology
Group (RTOG) and the European Organisation for Research and Treatment of Cancer
(EORTC). Int J Radiat Oncol Biol Phys 1995; 31:1341-1346
[3] Chassagne D., Cancer du col uterin. Glasaire ou lexique des complications. Bull
Cancer Paris 1980; 67:120-125
[4] Chassagne D, Sismondi P, Horiot JC et al, A glossary for reporting complications of
treatment in gynaecological cancers. Radiother Oncol 1994; 26:195-202
[5] Dische S, Warburton MF, Jones D and Lartigau E., The recording of morbidity
related to radiotherapy. Radiother Oncol 1989; 16:103-108
[6] Rubin P., Late effects of Normal Tissues (LENT) Consensus Conference. Radiat
Oncology Biol Phys 1995; 31:1035-1367.
[7] Pavy JJ, Denekamp J, Letscher J et al Late effects toxicity scoring: The SOMA scale.
Radiother Oncol 1995; 35:11-15
[8] Trotti, A., Toxicity in head and neck cancer: a review of trends and issues. Int J
Radiat Oncol Biol Phys 2000; 47:1-12
[9] Dische, S. The uniform reporting of treatment-related morbidity. Seminars in
Radiation Oncology

.

Topical Session 8b
RADIOLOGICAL PROTECTION OF PATIENTS IN
RADIOTHERAPY: BRACHYTHERAPY

.

IAEA-CN-85-6
669
ACCURATE ASSESSMENT OF THE DISTORTIONS PRODUCED BY THE
TRANSIT DOSE IN HDR BRACHYTHERAPY
E. K. Nani, A.W.K. Kyere
National Centre for Radiotherapy & Nuclear Medicine, Accra, Ghana K. Tetteh Department of Physics, University of Ghana, Legon, Ghana
Abstract
Current polynomial methods used in the modelling of the dose distributions in HDR brachytherapy have been
reformulated to improve accuracy. An example is provided to show the effects of the transit dose on the output.
The transit dose, which is neglected by current computer software for calculating doses, can result in significant
dosimetric errors. These additional unrecognised doses imply over-dosing and distortions in the dose
distributions within the irradiated volume. Assessment of dose to critical and radiosensitive organs is therefore
inaccurate. These could increase late tissue complications as predicted by the Linear Quadratic Model. Our
model works very well for straight catheters and is highly recommended for the evaluation of the transit dose
around such catheters.
1. Introduction
Every HDR application results in source dwell and transit doses. Dose calculation formalisms that incorporate the transit dose have been suggested for dose calculations in HDR brachytherapy by Houdek et al. [1], Bastin et al. [2] and later improved by Cho and Muller-Runkel [3]. Houdek’s [1] report on the determination of the transit dose was an oversimplification as it assumed that none other than the inverse square law attenuation was involved. Bastin et al. [2] made direct measurements with TLD chips as well as writing an algorithm to represent the transit dose distributions in HDR brachytherapy but observed a startling difference of 18.2 % (on the average) between their measured values and their own algorithm. This is not surprising, as they assumed isotropic dose distributions, coupled with errors introduced by the finite sizes of the TLD chips. Cho and Muller-Runkel [3] incorporated anisotropy but assumed anisotropy does not depend on radial distance. This could lead to very serious errors as there is, on the average uncertainties of +10 %, from distances within a short range of 1 - 10 cm from the centre of the source. In this investigation, current recommended parameters [4,5,6,7] have been used. The anisotropy and the radial dose distribution functions have been hybridised and a model for the calculation of the transit doses, based on the hybridised function, is developed. 2. Method
FIG. 1. The geometrical definition of r and ���� for a filtered radiation source
Radiation
Source
*a
y
r
P
�

IAEA-CN-85-006
670
The dose rate at a point P above is defined as follows [7,8,9].
� �1...........).........(),(),(
),(),(
00
0D rgrFrG
rGSr
k�
�
�� ��
�
From point – source approximation G(r,�)=1/r2 [10] where r2
= y2+a
2. Now G(r0,�0) and Λ0
are constants and the product g(r)F(r,�) is a function of the linear displacement y as shown in fig. 1 and so
���
}{)(),(
),()(
00
0 yoffunctionyFrG
rFrg
�
�.
)()],([
22dt
ay
yFSrDd
k
�
��
Generally G(r0,�0) = 1. From the relationship between y and F(y), we make use of a linear-linear polynomial expressed to the minimum possible degree to represent F(y) hence F(y) = A
+ By + Cy2 where A, B & C are constants. The source attains a finite velocity V when in
motion, resulting in transit dose of magnitude D(r,�) deposited at a point P and satisfies
)2(.......)(
)],([22 V
dy
ay
yFSrDd
V
dydt
dt
dyV
k
�
����� �
When the source moves from position y1 to position y2 with an average velocity V,
)3(.............)ln(2
arctan),(
2
1
2
1
22
22
2y
y
k
y
y
k ayB
a
y
a
DCy
V
Sdy
ay
CyByA
V
SrD �
�
���
����
��
��
�
��� ��
where D = A – C a2.
Assuming none other than the inverse square law attenuation,
)4(........arctan),(
2
1
0
y
y
k
a
y
aV
SrD �
�
���
���
�
� ��
When a = 0 eqn. (3) and eqn. (4) become
)5(...............ln),(
2
1
y
y
k CyyBy
A
V
SrD �
�
���
���
��
)6(...............1
),(
2
1
0
y
y
k
yV
SrDand �
�
���
� ���
respectively.
2.1. Calculations and results
Figure 2 below simulates a linear implant with (thirteen) 13-dwell positions and an inter-dwell spacing of 0.25 cm. A,B,C & D are calculation points.

IAEA-CN-85-6
671
� � � � � � � � � � � � *
FIG. 2. Illustration of example: �, dwell point; ����, calculation point
The value of Sk is 11.3056 cGy cm2 s
-1 [11] and �0 = 1.111 [12] for a 370 GBq 192Ir source (Mallinckroft Medical B. V.). V was obtained from the table provided by Houdek et al [1]. The inter-dwell transit doses and the exit doses within the same region, DT were calculated from eqns. (3) & (5). If the volume of the tissue preceding the proximal dwell site is negligibly small, the entry and exit transit doses DE, resulting from the travel between the HDR unit and the proximal dwell site could be evaluated from eqns. (4) & (6). The total transit dose is hence DET = DE + DT. Anisotropy and radial dose profile data generated by Russell et al [12] has been used in our dose calculations. The Computer Programme MATTLAB was used to evaluate the constants A, B & C in the expression F(y) = A + By +
Cy2 for 0 < � < �/2 and �/2 < � < � respectively, within the range 0 � y � 20 cm. Within this
range the data was split into two depending on the point at which we observed a discontinuity in the dependence of F(y) on y. For the special angles � = 0, �/2 & � the desired accuracy was achieved by using one single equation to parametrize F(y).
TABLE I: Calculated transit doses DT, DE & DET at selected points:
A B C D
DT(cGy) 1.918 0.630 1.616 0.489
DE(cGy) 0.291 0.228 0.186 0.121
DET(cGy) 2.209 0.858 1.802 0.610
3. Discussion and conclusion
The best results, for example those compatible with the objectives of HDR conformal brachytherapy are obtained by using small inter-dwell distances, that in turn permit fine variation of dwell times. Transit doses are however higher for such distances as the speeds are relatively low. To reduce the risk of late tissue complications, an increased fractionation schedule is applied in HDR relative to LDR brachytherapy. Since source movement is inherent during each HDR treatment cycle, the total transit dose is linearly increased with the number of fractions. Higher transit doses are therefore experienced in order to achieve the best results in HDR brachytherapy. The transit dose is directly proportional to the source strength and smaller catheter diameters will also increase the transit surface doses to proximal tissues. All together, the transit dose has no definite relationship with the static dose but varies widely among patients and different treatment schedules. This leads to over-dosing and more seriously, a distortion of the dose distributions within the irradiated volume.
A a (cm)
1 2 3
y (cm)
1
0
* *
4
C
D
2 * B
IAEA-CN-85-006
672
Consider for example the case of “base of tongue” cancer being treated with interstitial brachytherapy. A common fractionation schedule is to give 3 Gy / fraction / twice / day. If 3
Gy is given at a distance of 1 cm from a straight catheter we observed that the transit dose contributed, on the average up to 0.7 % of the total dose. For three of such catheters parallel to each other separated by 1.0 cm the total transit dose at the prescription point “A” (with respect to the central catheter) works out to be 5.3 cGy. Extending this to two of such planes parallel to each other such that one is exactly above the other and separated by just 0.5 cm, the transit dose is seen to contribute up to 3.4 % of the total dose at point “A”. So, as the complexity of the implant increases the contribution by the transit dose becomes more significant and can go above 10 %, in addition to the distortions that may result. From the magnitude of the contributions by the transit dose only, we may be operating outside acceptable limits if the transit dose is neglected and this will go a long way to affect the outcome of treatment. Our model reproduced the data used [12] within an accuracy of 0.05 %, which is a marked improvement over the work done by earlier investigators [1,2,3]. On the whole, the physical sizes and shapes of patients as well as heterogeneity effects have not been taken into account. The calculations were based on data from an infinite homogenous phantom [12]. We have started some work on applicators of complex geometry, using Monte Carlo Simulations. Heterogeneity effects from tissues, internal shields and air will be addressed. Scatter integration algorithms will also be written to correct for finite patient sizes and shapes. Brachytherapy using high dose rate afterloading is increasingly used worldwide for treating interstitial, intracavitary, intraluminal and percutaneous malignancies, owing to its inherent advantages over standard LDR brachytherapy. Current computer software for calculating doses in HDR brachytherapy neglects the transit dose. The contribution of the transit dose to the total dose is however very significant in some cases, especially if we aim at true conformal therapy, in line with the principles of HDR brachytherapy. A failure to account for the transit dose therefore means unreliable output in dosimetry. We strongly advocate for the transit dose to be incorporated into all high dose rate treatment planning systems. This will ensure accuracy in prescription and the assessment of potential risks to patients. Our model works very well for straight catheters and we recommend this very highly for the calculation of doses around such catheters. Apart from the example discussed, our model would work perfectly well, when the transit path preceding the proximal dwell site goes through an appreciable thickness of tissue e.g. in the case of endobronchial brachytherapy. With further development, the methods of calculation could be simplified, whilst not compromising accuracy.
Acknowledgements
We are grateful to Dr. S. Osae, Scientific Officer of the Ghana Atomic Energy Commission for his assistance in preparing this paper.
References
[1] HOUDEK, P.V., SCHWADE, J.G., WU, X., PISCIOTTA, V., FIELDLER, J.A.,
SERAGO, C.F., MARKOE, A.M., ABITBOL, A.A., LEWIN, A.A., BRAUNSCHWEIGER, P.G., SKLAR, M.D., Dose determination in high dose rate brachytherapy, Int. J. Radiat. Oncol. Biol. Phys. 24 (1992) 795-801.
IAEA-CN-85-6
673
[2] BASTIN, K.T., PODGORSAK, M.B., THOMASDEN, B.R., The transit dose component of high dose rate brachytherapy: direct measurements and clinical implications, Int. J. Radiat. Oncol. Biol. Phys. 26 (1993) 695-702.
[3] CHO, S.H., MULLER-RUNKEL, R., Effect of anisotropy corrections on the dynamic dose calculations in high dose rate (HDR) Brachytherapy, Phys. Med. Biol. 39 (1994) 1181-1188.
[4] BRITISH COMMITTEE ON RADIATION UNITS AND MEASUREMENTS, Specification of brachytherapy sources, Br. J. Radiol. 57 (1984) 941-942.
[5] INTERNATIONAL COMMISSION ON RADIATION UNITS AND MEASUREMENTS, Dose and volume specification for reporting intracavitary therapy in gynaecology, Report 38, Bethesda, MD (1985).
[6] AMERICAN ASSOCIATION OF PHYSICISTS IN MEDICINE, Specification of brachytherapy source strength: Recommendations of Task Group No. 32, American Institute of Physics, New York (1987).
[7] NATH, R., ANDERSON, L.L., WEAVER, K.A., WILLIAMSON, J.F., MEIGOONI, A.S., Dosimetry of interstitial brachytherapy sources: Recommendations of the AAPM Radiation Therapy Committee Task Group No. 43, Med. Phys. 22 (1995) 209 - 234.
[8] NATH, R., MEIGOONI, A.S., MELI, J.A., Dosimetry on the transverse axes of 125I and 192Ir interstitial brachytherapy sources, Med. Phs. 17 (1990a) 1032 – 1040.
[9] WILLIAMSON, J.F., Comparison of measured and calculated dose rates in water near 125I and 192Ir seeds, Med. Phys. 18 (1991) 776-786.
[10] WEAVER, K.A., SMITH, V., HUANG, D., BARNETT, C., SHELL, M., LING, C., Dose parameters of 125I and 192Ir seed sources, Med. Phys. 16 (1989) 636-643.
[11] DEPARTMENT OF MEDICAL PHYSICS, JOHANNESBURG HOSPITAL, Record of calibration of 192Ir HDR sources (Mallinckroft B.V.), Johannesburg, South Africa (1996-1998).
[12] RUSSELL, K.R., AHNESJÖ, A., Dose calculation in brachytherapy using a primary and scatter dose separation technique, Phys. Med. Biol. 41 (1996) 1007 -1024.

IAEA-CN-85-22
674
METHODOLOGY FOR COMPREHENSIVE PATIENT, WORKER AND
PUBLIC RADIATION PROTECTION CONSIDERATIONS WHILE
INTRODUCING NEW MEDICAL PROCEDURES
E. Neeman, M. Keren
Radiation Safety Division, Ministry of the Environment, Israel
Sackler Medicine School, Tel-Aviv University, Ramat-Aviv, Israel Abstract
Patient protection is a major consideration while introducing new medical procedure. But protection of the
workers and the public should be considered too. A methodology of combining non-patient radiation protection
considerations, with the introduction of new medical procedures is described. The new medical procedure was
the Intracoronary Gamma Irradiation for the Prevention of Restenosis, by using Iridium 192 gamma radiation
sources. The usual authors responsibility is the licensing of the use of radioactive materials while keeping public
protection. According to this responsibility, the methodology’s original orientation is public protection. As a
result of coordination between several competent authorities, managed by the authors, the methodology was
adopted for patient and worker protection too. Applicants, actually possible users (hospitals) of the new
procedure, were obliged to plan medical procedures and working area according to dose limits and constrains as
recommended by the International Atomic Energy Agency and local competent authorities. Exposure calculations
had to consider the usual parameters as sources types and activity, dose rate and dose levels, duration and number
of treatments. Special attention was given to the presence workers and public by chance presence in or near
treatment area. A usual condition to give a license was the installation of continues (during treatment) radiation
monitoring systems. But a special attention was given to physical barriers and procedures in order to stop
unauthorized personal to arrive near to working area. Satisfactory stuff training for normal operation and
emergency situations are essential, including appropriate safety procedures and the presence of safety assistance
team while executing treatment
1. Notification and justification
Catheter based intracoronary radiation plus stenting, or after stenting, is quit a new medical
procedure �1�. There was a search for means to control restenosis following balloon
angioplasty, and Intracoronary Gamma Irradiation is one of the promising of the anti-
restenosis strategies �2�. Two types of radiation are used - gamma and beta. In this paper we
will discuss only the use of gamma radiation.
One of the first obligations of any potential user of radiation sources is the notification of the
competent authority �3�. This was done when a local representative of a producer of gamma-
radiation anti-restenosis system, notified us about the wish to introduce the procedure to our
country.
First radiation protection requirement is the justification of the practice. In our country
different competent authorities has different responsibilities. The duty of justifying medical
procedures is Ministry of Health’s. A meeting of all parties concerned - Ministry of Health,
Ministry of Labor, hospitals representatives was organized under the supervision of The
Ministry of The Environment, Radiation Safety Division. All aspects of the new procedures
were explained in detail. Applicants had to persuade that the new procedure produce sufficient
benefit to the patients and the society to offset the radiation harm that it might cause �3�. Some
period later Ministry of Health gave the approval, namely - the justification.

IAEA-CN-85-22
675
2. Limits, constrains and optimization
Next radiation protection requirement is the optimization of protection and safety. The
applicant have to make this optimization, based on guidance provided to him by the
competent authority. In this case, the competent authority is Radiation Safety Division of The
Ministry of The Environment. Based on BSS-115 standards, our country adopted the
maximum dose limit for exposure of individuals of the public of 1 mSv/y �3�. The maximum
dose constrain value that is allowed in association with any particular practice is 0.3. For this
special and important practice we allowed the maximum constrain value. The meaning is that
any applicant had to prove us that maximum public yearly exposure should not exceed 0.3
mSv as a result of using this procedure. Attachment 1 �4� describes the methodology we use to
evaluate any application. All four hospitals that asked for such a license, fulfilled this demand.
Actually only two hospitals are using this procedure, and dose levels measured in public areas
were found smaller then predicted. Since actual procedures rate is less then planned,
accumulated public exposure is much smaller then the maximum allowed by the constrain.
Measured changes of workers accumulated doses were found negligible.
3. Other requirements, safety and security, intervention
The additional topics of radiation safety are elaborated in the BSS �3�. In order to guide applicants to
prepare their requests and actual radiation protection means according to the methodology described
in attachment 1, we provide them a general guiding questionnaire�4�, based on the BSS and that is
valid for all kinds of practices (Attachment.2). This questionnaire is built in a methodological way
that leads the applicant step by step through all aspects of radiation protection and license request. It
combines professional and administrative demands. Applicants should refer only to relevant topics.
References
[1] TEIRSTEIN P.S. et.el, Catheter-Based radiotherapy to inhibit restenosis after coronary
stenting. The New England Journal of Medicine, Vol 336 No 24, 1997.
[2] FAREH J. et.el, Cellular effects of �-particle delivery on vascular smooth muscle cells
and endothelial cells. A dose response study. Acute Coronary Syndromes, Vol 2 No 3,
1999.
[3] International Basic Safety Standards for Protection against Ionizing Radiation and for the
Safety of Radiation Sources, Safety Series No.115, IAEA, Vienna, 1996.
[4] J.J. ROZENTAL, Procedures, Format and Content for an Applicant, personal
communication, 1996.
[5] Veise G., Gaver E., Steps of intracoronary gamma irradiation treatment , Carmel Hospital,
1999.

IAEA-CN-85-22
676
Attachment 1: Processing a license request
Request for license and
Notification of an activity
�
Yes
Is the source exempted? �� The source is exempted, doses No need for
negligible, the source is safe �� license
�
Is the practice justified? (including No Too high doses and insufficient
other competent authorities �� control of sources and/or ��
demands?) rejection by other authorities R
� E
Is individual dose limitation No Individual Patient,Worker,Public
respected? �� exposure exceed dose limits �� Q
� E
Is protection optimized? No Doses are not ALARA or S
�� exceed constrains ��
T
�
Is the source secure? No Source does not comply with R
�� managerial or technical ��
requirements E
� J
Are protection and safety No Protection and/or safety does
verified? �� not comply with requirements �� C
� T
No
Can the source be decontrolled? �� Applicant has no waste or �� E
return to supplier arrangements
D
�
Did applicant fulfilled all No Applicant did not fulfilled all
administrative demands? �� Administrative demands ��
�
Registration and Licensing

IAEA-CN-85-22
677
Attachment 2: a guiding questionnaire
1. Site Selection - safety and environmental impact assessment, regional mapping;
2. Practice in operation;
3. Reasons for the Practice, Justification;
4. Applicant's Safety and Radiation Protection Organization;
5. Names, position, qualification, responsibility, (curricula vitae for RSO and Operator);
6. Description of the work
7. Project, map, drawing, layout, (adequate drawing and scale) ;
8. Quantification of the radionuclides, types and uses, chemical and physical form;
9. Description of any apparatus containing sealed sources, with copies of any prototype test
certificate supplied by the manufacturer demonstrating they met the ISO or equivalent
standard, all sealed sources needs the test certification demonstrating that they meet with ISO
or equivalent standards, including leakage test, also copy of catalogue or manual containing
instruction or procedures for radiation protection and maintenance should be sent;
10. Description of the available instruments, portable and fixed monitor, for measuring dose rates
and contamination levels, and its main characteristics, such integrated with access door
interlocks, visible and alarm signs;
11. Description of storage facilities, for the radionuclides and the radioactive waste, warning and
monitor system and access control, (adequate drawing and scale);
12. Description of the proposed waste management system, including disposal;
13. A formal method of assessment should be used for Safety Analysis for all Fixed Installation. It
should be necessary to considered in detail each safety component, and types of failure and
repercussion. Points of interest are connected to the viewing system, control room, points of
access to exposed room, warning system, safety systems and interlocks, beam stops, radiation
level detectors, fire control, ventilation system, including the quality assurance program,
materials, shielding thickness, protective barriers, occupancy factors, and calculus, methods
and results, as well as reference used by the applicant. The safety assessment should also give
confidence that the proposed facility is capable, basically, of meeting the regulatory
requirements for the management of waste
Defense in depth are requested for medical radiation beam therapy, accelerators, neutrons
generators, industrial and research irradiation facilities and all manufacturing installation,
including complex wet operations with risk of spills, labeled compound, and dry and dust
operations or others as required by the competent authority;
15. Special design and procedures are requested for uses of unsealed radioactive sources including
waste disposal system, decontamination, warning system and access controls;
Manual for Radiation Protection, including an effective occupational and public radiation
exposure control; internal dosimetry evaluation; environmental contamination; classification of
working places; protective measurements should be elaborated for appreciation and approval
by the Competent authority, including optimization or alternatives;
17. Program for training including Initial, On-the-job and refreshment;
18. Administrative Control, records, workers health, source accountability, calibration of survey
instruments, calibration and maintenance of devices, leak test program, old sources in use,
spent source;
19. Movement of Sources, internal and external of the installation;
20. Physical Security;
21. Emergency Response;
22. Special operational procedures for external uses of radionuclides, sealed or unsealed sources;
23. Consultant Evaluation on Radiation Protection Quality Assurance (In case of any external
Consultant on Safety and Radiation Protection)

IAEA-CN-85-12
678
RADIATION SAFETY PROGRAM IN A HIGH DOSE RATE
BRACHYTHERAPY FACILITY
L.V. Rodriguez
Department of Radiotherapy, Jose R. Reyes Memorial Medical Center, Manila, Philippines
R.C. Solis
Division of Radiation Oncology, St. Luke's Medical Center, Manila, Philippines
T.M. Hermoso
Department of Radiotherapy, Jose R. Reyes Memorial Medical Center, Manila, Philippines
Abstract
The use of remote afterloading equipment has been developed to improve radiation safety in the delivery of
treatment in brachytherapy. Several accidents however, have been reported involving high dose-rate
brachytherapy system. These events, together with the desire to address the concerns of radiation workers, and
the anticipated adoption of the International Basic Safety Standards for Protection Against Ionizing Radiation
(IAEA, 1996), led to the development of the radiation safety program at the Department of Radiotherapy, Jose R.
Reyes Memorial Medical Center and at the Division of Radiation Oncology, St. Luke's Medical Center. The
radiation safety program covers five major aspects: quality control/quality assurance, radiation monitoring,
preventive maintenance, administrative measures and quality audit. Measures for evaluation of effectiveness of
the program include decreased unnecessary exposures of patients and staff, improved accuracy in treatment
delivery and increased department efficiency due to the development of staff vigilance and decreased anxiety.
The success in the implementation required the participation and cooperation of all the personnel involved in the
procedures and strong management support. This paper will discuss the radiation safety program for a high dose
rate brachytherapy facility developed at these two institutes which may serve as a guideline for other hospitals
intending to install a similar facility.
1. Introduction
The use of radiation in treatment of patients involves both benefits and risks. Experiences
have shown that patients treated using radiation develop and manifest symptoms of side
effects depending on the amount of dose received and target area. Likewise, it has been
reported that early radiation workers had developed radiation-induced cancers. These
knowledge lead to the continuous work for the improvement of radiation safety of patients and
personnel. One of these developments is the use of remote afterloading equipment to improve
radiation safety in the delivery of brachytherapy. Several accidents however, have been
reported involving high dose-rate brachytherapy system [1].
The Department of Radiotherapy of Jose R. Reyes Memorial Medical Center and the
Radiation Oncology Division of St. Luke's Medical Center are two of the hospitals in the
Philippines to first acquire remote afterloading systems. The development of a radiation safety
program in these hospitals has been started prior to the acquisition of the equipment. The
foremost aim of the program is to improve the safety measures in the application of high dose
rate brachytherapy, which will be of greatest benefits to patients and staff, and at the same
time, satisfy requirements of regulatory agencies.
An effective radiation safety program will produce results such as decreased radiation
exposures of patient and staff, improved accuracy in the treatment and increased department
efficiency, which will eventually lead to reduced overall operating costs. A well observed
radiation safety program develops vigilance of staff as well as decreased personnel and
management anxiety.

IAEA-CN-85-12
679
The guiding document in the preparation of the radiation safety program at the above
mentioned hospitals has been the International Basic Safety Standards for Protection Against
Ionizing Radiation (IBSS) [2].
This paper will discuss the radiation safety program for a high dose rate brachytherapy facility
developed at the Department of Radiotherapy, Jose R. Reyes Memorial Medical Center and at
St. Luke's Medical Center which may serve as an example for other hospitals intending to
install a similar facility.
2. Radiation safety program
The radiation safety program developed includes the following aspects: quality control and
quality assurance, radiation monitoring, preventive maintenance, administrative measures, and
quality audit.
2.1. Quality control/quality assurance program
The quality control/quality assurance (QC/QA) program [3] is conducted daily, monthly, and
every source exchange. It consists of a set of mandated redundant performance checks,
physical measurement, and guidelines for the development of performance procedures that are
designed to minimize the frequency of human errors, miscommunication, and equipment
malfunction. The quality control program is shown in Table 1.
Table 1. Brachytherapy quality assurance program
Daily Monthly Quarterly
Keys/power switch Source position accuracy Source calibration
Printer operation Test run for all channels Indexer checks
Computer Display (date, time, decay
factor)
Source calibration Dummy and source drive
checks
Treatment Indicators Review of daily checks Radiation survey
Door Interlocks Radiation survey Computer hardware tests
Emergency/Interrupt buttons Check of safety features
Acoustic and light warning signals
Stored source position check
Patient monitoring system
Survey meters
Emergency safety containers
The success of patient treatment in brachytherapy depends on accurate treatment delivery.
Accurate delivery means that the intended radiation sources are delivered to their intended
positions within the correct applicator and remain there for the correct time. The results of
QC/QA tests have shown source position accuracy achievable to within 0.2 mm, and source
calibration reproducible to within 3% of specified activity.
The daily quality control includes computer operation checks, date/time and decay factor
check, and verification of safety aspects such as warning signs, door interlocks, emergency
buttons and patient monitor. These tests ensure that the patient is treated properly and that no
person will be unnecessarily exposed to radiation by accident. The monthly checks include
source position accuracy, source calibration, and applicator integrity. A graph of the %

IAEA-CN-85-12
680
difference between the manufacturer-quoted value and the clinically measured source activity
for the last four installations is shown in Figure 1.
Quarterly checks are made to coincide with the source change and the preventive maintenance
schedule.
Quality control checks are also conducted during treatment delivery process from the
entry of the treatment parameters into the remote afterloader to the delivery of treatment.
These checks are carried out to validate the entered data, to document the delivered treatment,
and to immediately respond to unexpected machine malfunction and emergencies.
2.2. Preventive maintenance program
The preventive maintenance program is based on the checks submitted by the service
engineers of the supplier of the company. For every source change, extensive mechanical
checks, hardware tests as well as checks on the cycle counter, battery and electronic boards are
performed. Values obtained should fall within the specifications and tolerance limits that are
followed during the installation and commissioning process.
-4.00%
-3.00%
-2.00%
-1.00%
0.00%
1.00%
2.00%
3.00%
4.00%
1st 2nd 3rd 4th
Upper lim it
% Difference
Lower lim it
Figure 1. Source calibration accuracy
A list of parts to be replaced on regular basis such as battery and motor drives is provided by
the manufacturer and is being followed.
2.3. Administrative measures
The head of the department is responsible for the overall departmental policy relating
to quality matters and radiation safety program. He sees to it that his personnel are properly
and adequately trained and that the radiation safety program is strictly observed. A medical
radiation safety committee, having representatives from the different staff groups aside from
the radiation health safety officer and management representative was formed to oversee this
task. A forum is held quarterly where members of the committee study and discuss the
radiation safety program in the department.
2.4. Radiation monitoring
Radiation monitoring has been used loosely to include activities referring to the source
location, survey, and source inventory. Regular area surveys are conducted as part of the
radiation monitoring program. Personnel exposures are monitored using film badges and
pocket dosimeters.

IAEA-CN-85-12
681
Calibration of survey instruments is performed is done before first used, semi-annually and
following repair [4]. The cylindrical ion chamber, well chamber, together with their respective
electrometer are calibrated annually unless repair has been done in which case calibration
must be performed prior to operation. Constancy checks is done on the dosemeter every
month to confirm that results fall within 2%.
2.5. Quality audit
The quality audit, involves internal and external aspects. The internal aspect includes medical,
technical, and procedural checks. The medical audit is performed by one of the consultants of
the department through chart rounds, whereby charts of patients being treated are reviewed.
The technical checks are conducted by the chief physicist to verify accuracy of source data and
treatment plans. Procedural audit is conducted by the supervising radiologic technologist
where spot checks are conducted to ensure that the treatment protocol is carried out.
The external audit is conducted by the regulatory agencies and includes checks on the list of
qualified users, inventory of sources and records and documentation of procedures.
It is recommended that an IAEA Postal Dose Inter-comparison be performed to be part of an
external audit for brachytherapy since it has been shown to be effective in highlighting
problem areas and in improving quality for external beam radiotherapy worldwide.
3. Receipt and transport of radioactive source
Brachytherapy sources should be received by trained personnel and should be kept in a
controlled and secured area. The type of radioactive source and the strength should agree with
what was ordered. When opening the source packaging, it should be determined that there is
no contamination present and that proper documents, including return documents, are inside
the shipping container. The spent source must be properly secured in the same way that it was
received and all documents necessary for its transport back to manufacturer must be complete.
The record for receipt and shipping out must be kept and maintained.
4. Records and documentation
Records of the radiation safety procedures and the quality control test results are necessary.
Records of equipment performance are kept throughout equipment life to enable
reconstruction of events in the future if required.
References
[1] Lessons Learned From Accidental Exposures in Radiotherapy, Safety Reports Series
No. 17, International Atomic Energy Agency, Vienna Austria (February, 2000).
[2] International Basic Safety Standards for Protection Against Ionizing Radiation, Safety
Series 115, International Atomic Energy Agency, Vienna Austria (1996).
[3] Rodriguez, L. et. al., Micro-Selectron HDR installation and quality assurance:
Philippine experience, Selectron Brachytherapy Journal 7 (1993), pp. 16-18.
[4] CPR Part 14 Licenses for Brachytherapy Sources for Medical Use, Philippine Nuclear
Research Institute, Diliman, Quezon City.
IAEA-CN-85-180
682
RADIATION PROTECTION OF PATIENTS IN
EPIESCLERAL BRACHYTHERAPY
J.M. de Frutos, G. Sánchez, J.R. Sendón, A. del Castillo, I. Hernando
Hospital Universitario de Valladoldi, Valladoldi, Spain
Abstract
Introduction. Choroidal melanoma and other ophthalmic tumors are treated with episcleral plaques.
Optimisation and other criteria are necessary to avoid damage in eye and visual function preservation.
Purpose. To study the dosimetric phases to apply radiation protection criteria. To determine procedures for
quality assurance of applicators, sources and treatment prescription and planning.
Method. We have revised treatment procedure. First, aspects shared for all the patients. Then treatment planning
and applicator assembling. After that, we study insertion and treatment. Finally, we check the chart flow to
modify, if necessary. It necessary consider normative and recommendations.
Results and conclusions. Quality assurance of sources (calibration, autoradiography), applicator (effects, dose
distribution) and treatment planning are revised. Appropriate patient data acquisition is essential due the special
characteristics of tumor and eye. Treatment planning involves optimisation as a factor. Seed selection is very
important to avoid misadministration. Next procedure is applicator assembling. We must car to choose the same
as dosimetry and to carry out its verification. Sources insertion is a surgical procedure. It is essential an accurate
placement. Desinsertion is also surgical, and must be adapted to dosimetry and prescription. Flow chart is
modified adding two staff meeting to discuss about patient data and doses.
1. Introducción
La braquiterapia epiescleral es una alternativa a la enucleación o extirpación del ojo afecto en
el melanoma uveal, el hemangioma circunscrito de coroides, el retinoblastoma o la
degeneración macular asociada a la edad. Como en todo tratamiento radioterápico, los
objetivos del tratamiento son suministrar la dosis prescrita minimizando en lo posible los
efectos secundarios. En el caso que nos ocupa, al evitar los efectos secundarios podemos
preservar el órgano, y más aún preservar la función visual [1, 2, 3].
En el caso de estos tumores, el problema es mayor porque el melanoma es un tumor
tradicionalmente considerado como radiorresistente, con lo que las dosis suministradas son
mayores que en otros tratamientos, y el angioma es un tumor benigno, por lo que cualquier
irradiación debe estar muy justificada. Además, en este caso, el paciente tiene más tiempo de
desarrollar efectos secundarios.
Los criterios de protección radiológica en estos tratamientos deben estar encaminados no sólo
a tratar de forma eficaz el tumor, sino también a conseguir que el paciente siga conservando la
visión.
2. Objetivos
Estudiar las fases de la dosimetría de la braquiterapia epiescleral, para discernir en cuáles de
ellas se pueden mejorar nuestros criterios de protección radiológica del paciente. Establecer
qué procedimientos son necesarios para asegurar la calidad de las fuentes, aplicadores y
sistemas de cálculo empleados. Protocolizar la realización de la dosimetría clínica para
conseguir el objetivo de minimar la dosis en los órganos de riesgo. Repasar el diagrama de

IAEA-CN-85-180
683
flujo de la información y responsabilidad que se había establecido para mejorar la toma de
decisiones y la circulación de la documentación.
3. Método
Hemos revisado el procedimiento del tratamiento de braquiterapia epiescleral en nuestro
centro. Se estudian por separado parámetros comunes a todos los tratamientos como el
aseguramiento de la calidad de fuentes y aplicadores, y del planificador de tratamientos.
Hemos revisado la adquisición de datos para cada paciente. Seguidamente se analiza la
preparación del tratamiento, tanto la planificación como la preparación del aplicador.
Después, se examina la aplicación del tratamiento tanto en la inserción, en el tiempo que el
paciente tiene el aplicador puesto como en la desinserción. Finalmente, se repasa el diagrama
de flujo del proceso
[4] con la información recopilada anteriormente, por si fuera necesario
modificarlo.
Todo el proceso ha sido observado a la luz tanto de la legislación aplicable, como de las
recomendaciones nacionales [5] e internacionales [6, 7].
4. Resultados y conclusiones
4.1. Aseguramiento de la calidad de fuentes, aplicadores y planificador
Las acciones en las que se debe incidir son:
Calibración de las fuentes con un detector pozo calibrado para las fuentes de I-125, en vez de
la mera verificación de la intensidad en un calibrador de Medicina Nuclear. Progresivo
empleo de la tasa de kerma de referencia en aire, TKRA.
La realización de radiografías y autorradiografías de las fuentes, aunque aconsejable, presenta
grandes dificultades por las reducidas dimensiones de las fuentes.
Algunos autores recomiendan que, cuando se manipulen las fuentes de I-125 con pinzas u
otros medios, se realice una prueba de hermeticidad, debido a su fino encapsulamiento.
El efecto del aplicador sobre la distribución de dosis debe ser incorporado, paulatinamente.
Los aspectos que deben investigarse son: atenuación de la TKRA por el alojamiento acrílico
de las fuentes y protección a las estructuras extraoculares por la placa metálica. Sobre la
distribución de isodosis existen varios trabajos publicados con métodos de Montecarlo, ante la
dificultad de realizar una verificación experimental.
4.2. Adquisición de datos del paciente
En braquiterapia epiescleral, este paso es más delicado, si cabe, que en otras aplicaciones. Los
tumores son menores que en el resto del organismo y el órgano donde asientan estos tumores,
el ojo, es también menor que el resto de los órganos huéspedes de tumores; con lo que la
distancia de los órganos críticos, en nuestro caso los más importantes, son la mácula y el
nervio óptico, es del orden de unos milímetros.
El melanoma es un tumor, tradicionalmente, considerado como radiorresistente por lo que la
dosis suministrada es del orden de 100 Gy, mayor que en resto de los tratamientos y el
IAEA-CN-85-180
684
angioma es una enfermedad benigna, con lo que el paciente va a tener más tiempo de
desarrollar efectos secundarios.
Por estos motivos, es necesario contar con la mayor cantidad de información disponible,
proveniente de los medios de imagen como son, ecografía, angiografía, fotografía de fondo de
ojo, TAC y RMN.
4.3. Planificación del tratamiento
Se ha descrito [8] cómo aprovechar la baja energía del I-125 para optimar la dosimetría
clínica, para que los órganos de riesgo reciban la dosis más baja posible. Como estos autores,
podemos aprovechar la anisotropía de las fuentes para disminuir dicha dosis, y evitar poner
todas las que permite el alojamiento. No mezclamos intensidades por la forma de suministro
de los lotes de fuentes.
Un aspecto importante a tener en cuenta es la edición de los lotes de fuentes, pues es
imprescindible que sólo pueda seleccionarse el que está en uso realmente. Si, por error,
empleáramos otro la duración del implante no sería correcta.
Hasta ahora, se realizaba un cálculo manual como comprobación del cálculo del planificador.
Se diseñará una hoja de cálculo con el que el cálculo será más cómodo, y más preciso al
automatizar, por ejemplo, las interpolaciones.
4.4. Preparación del aplicador
En esta parte del proceso hay que vigilar:
Que se emplea el aplicador fijado en la planificación.
Que se emplea el lote de fuentes adecuado.
Realizar una comprobación del aplicador de acuerdo con el procedimiento establecido.
Ensamblar el aplicador, como se ha previsto en la planificación, para preservar los órganos de
riesgo. Es especialmente importante cuando algún alojamiento cuando no se han colocado
todas las fuentes en el alojamiento.
Además, este proceso se ha de realizar en condiciones de esterilidad como corresponde
a un proceso quirúrgico. Este requerimiento puede entorpecer la ejecución del procedimiento.
Otra alternativa es esterilizar el aplicador después de su preparación, pero plantea más
problemas de protección radiológica.
4.5. Colocación del aplicador
Es una acción que tiene lugar en el quirófano, y que lleva a cabo un oftalmólogo con la
información que le suministra el resto del equipo. La colocación tiene lugar, en la mayoría de
las ocasiones, mediante transiluminación. En otras ocasiones, cuando la lesión no hace sombra
o tiene una localización poco accesible, se puede colocar midiendo la distancia a algunas
estructuras.
Los datos del tumor, obtenidos en fases anteriores, son los que van a dar una indicación del
tamaño del aplicador. Si estos no son correctos, no podremos dejar margen de seguridad entre

IAEA-CN-85-180
685
éste y el tumor. Además, se tiene que colocar con la orientación que marca la dosimetría para
mantener la posición relativa de las fuentes respectos a los órganos de riesgo y preservar así la
optimización de dosis.
4.6. Tratamiento y desinserción
Una vez colocado el aplicador el paciente pasa a una habitación radioprotegida en la que
permanece el tiempo fijado en la dosimetría clínica. Una vez transcurrido este tiempo vuelve
al quirófano para retirar las fuentes. Este segundo paso por el quirófano es especialmente
programado, pues debe respetarse la duración del implante, para suministrar la dosis calculada
4.7. Diagrama de flujo del proceso
Se incluyen dos reuniones de todo es equipo para comentar los datos de los medios de imagen
y las dosis que reciben los órganos críticos.
Referencias
[1] Shields J., Shields C., Donose L. "Management of posterior uveal melanoma". Surv
Ophthalmol 1991; 36:161-195.
[2] Madreperla S.A., Hungerford J.L., Plowman P.N. et al. "Choroidal hemangiomas: visual
and anatomic results of treatment by photocoagulation or radiation therapy".
Ophthalmology 1997; 104: 1773-1778.
[3] Hannounche D., Frau E., Desjardins L. et al. "Efficacy of proton therapy in circumscribed
choroidal haemangioma associated with serous retinal detachment". Ophthalmology
1997; 104: 1780-1784.
[4] de Frutos, J, et al. "Responsabilidades del radiofísico en braquiterapia epiescleral". Libro
de comunicaciones. ( Proc. XII Cong. Nac. De Física Médica, Santander 1999). SEFM
1999.

IAEA-CN-85-180
686
[5] Pérez, J., Arrans, R. Y col. "Calibración, matrices de dosis y control de calidad en
braquiterapia: Informe del grupo de trabajo de braquiterapia de la SEFM". Revista de
Física Médica 2000; 0: 1-49.
[6] Nath, R., Anderson, L., Meli, J. et al. "Code of practice for brachytherapy physics: Report
of the AAPM radiation therapy committee TG 56". Med. Phys. 1997; 24: 1557-1598.
[7] Kutcher, G., Coia, L., Svenson, G. et al. "Comprehensive QA for radiation oncology:
Report of AAPM radiation therapy committee TG 40". Med. Phys. 1994; 21: 581-618.
[8] Astrahan M., Luxton G., Jozsef G. et al. "Optimization of I-125 ophthalmic plaque
brachytherapy". Med. Phys.1990. 17:1053-1057.

IAEA-CN-85-173
687
ESTIMATION OF THE TRANSIT DOSE COMPONENT IN
HIGH DOSE RATE BRACHYTHERAPY
A. García Romero, E. Millán Cebrián, F.J. Lozano Flores,
R. Lope Lope, M. Canellas Anoz
Servicio de Física y P.R., Hospital Clínico U, “Lozano Blesa”, Zaragoza, Spain
Abstract
Current high dose rate brachytherapy (HDR) treatment planning systems usually calculate dose only from source
stopping positions (stationary component), but fails to account for the administered dose when the source is
moving (dynamic component or transit dose). Numerical values of this transit dose depends upon the source
velocity, implant geometry, source activity and prescribed dose. In some HDR treatments using particular
geometry the transit dose cannot be ignored because it increases the dose at the prescriptions points and also
could increase potential late tissue complications as predicted by the linear quadratic model. International
protocols recommend to verify this parameter [1]. The aim of this paper has been to establish a procedure for the
transit dose calculation for the Gammamed 12i equipment at the RT Department in the Clinical University
Hospital (Zaragoza-Spain). A numeric algorithm was implemented based on a dynamic point approximation for
the moving HDR source and the calculated results for the entrance-exit transit dose was compared with TLD
measurements made in some discrete points.
Resumen
Los sistemas de planificación asociados a equipos de alta tasa de dosis (HDR) suelen calcular la dosis
suponiendo que la única contribución se debe a cuando la fuente se encuentra en las diferentes posiciones de
parada (componente estacionaria), sin tener en cuenta la dosis suministrada cuando la fuente está en movimiento
(componente dinámica o de tránsito).
La magnitud de la dosis en tránsito depende fundamentalmente de la velocidad de la fuente, la geometría del
implante, la actividad de la fuente y la dosis prescrita, y, en determinadas aplicaciones de Alta Tasa esta dosis
puede llegar a ser significativa en cuanto al incremento de potenciales complicaciones tardías en los tejidos
sanos, y su estimación está recomendada en los protocolos de verificación [1]. El propósito de este trabajo ha
sido establecer una sistemática de cálculo de la componente de tránsito de la dosis, para el equipo Gammamed
12i existente en el Servicio de RT del HCU de Zaragoza. Se ha desarrollado un programa de cálculo y los
resultados de dosis entrada-salida calculados se han comparado con medidas hechas con TLD en puntos
discretos.
1. Método y resultados
1.1. Teoría general
La dosis total en un punto puede considerarse debida a dos componentes, una depositada
cuando la fuente se encuentra en reposo (Ds) y la otra cuando se encuentra en movimiento
(Dd), de forma que: DP = Ds + Dd.
El cálculo de Ds se lleva a cabo por el algoritmo definido en el Sistema de Planificación. Para
la estimación de Dd es preciso tener en cuenta a su vez otras tres contribuciones debidas a la
fuente en su recorrido de: entrada al aplicador, entre posiciones de parada y salida del
aplicador para recogerse en el equipo [2].
Podemos expresarlo como:
Dd = Dentrada + Dentre posiciones + Dsalida

IAEA-CN-85-173
688
En definitiva, cada componente de Dd depende de la distancia entre el punto considerado para
el cálculo y el punto en que se encuentra la fuente en cada momento, así como del tiempo que
le cuesta a la fuente recorrer cada intervalo de espacio (velocidad de la fuente).
1.2. Velocidad de la fuente
Puede comprobarse [2,3] que la fuente no se desplaza a velocidad constante en todo su
recorrido sino que esa velocidad depende del espacio que recorre. Para el equipo Gammamed
12i no hemos encontrado en la documentación ni en la bibliografía estimación de valores para
este parámetro, por lo que ha sido preciso realizar una determinación experimental del mismo.
Mediante un cronómetro se han medido:
- Tiempos de entrada y salida en el recorrido máximo de la fuente que para este equipo es
de 1300 mm (utilizando la fuente de simulación para tener una observación más directa).
Se obtuvo un valor de 433 mm/seg.
- Tiempos entre paradas, planificando múltiples paradas a intervalo constante, y para
diferentes intervalos. En este caso, como ha debido realizarse con la fuente real, se han
estimado tiempos totales y se han restado los de entrada y salida así como los de parada
seleccionados, para determinar el tiempo empleado en recorrer la totalidad de los espacios
inter-parada. Como se conoce el número de espacios y el intervalo entre paradas puede
calcularse la velocidad de la fuente en ese recorrido.
Los resultados obtenidos se muestran en la figura 1, y son análogos a los publicados en
(2) por otros autores para el equipo Nucletron.
Velocidad de la fuente vs Distancia entre
paradas
0
100
200
300
400
500
1 10 100 1000 10000
Distancia inter-paradas (mm)
Velo
cid
ad
(m
m/s
)
Velocidades
medidas
Figura 1. Velocidad de la fuente de Ir-192 del equipo Gammamed 12i de HDR, en función de la
distancia entre paradas
1.3. Estimación teórica de Dd
Se ha preparado un programa de ordenador en lenguaje C++ para el cálculo teórico de la dosis
dinámica en un aplicador lineal, integrando numéricamente la contribución a la dosis de la
fuente a lo largo de todo el recorrido. Una vez introducido el valor de la tasa de kerma en aire

IAEA-CN-85-173
689
de la fuente es preciso introducir la velocidad estimada para la componente de que se trate.
Para las componentes Dentrada y Dsalida el tiempo de irradiación de cada intervalo de integración
se calcula suponiendo la velocidad constante e igual a los 370 mm/seg que habíamos
determinado.
Para la estimación de Dentre posiciones, es preciso introducir el intervalo entre paradas y el número
de paradas, así como la velocidad estimada a partir de la gráfica de la figura 1.
Para el cálculo de dosis se han utilizado los mismos factores que utiliza el sistema de
planificación Abacus.
1.4. Verificación del algoritmo
Se han realizado medidas de dosis de entrada y salida con dosímetros TLD 100, calibrados
previamente para la energía del Co-60, dispuestos según el esquema de la figura 2.
Los dosímetros son de 3.2x3.2x0.9 mm3 y se leyeron con un lector 2800M de Victoreen,
utilizando un programa de lectura de 10” a 160º y 10” a 300º. El programa de borrado
utilizado es de 1h 400º y 8h a 100º.
Se programó una única posición de parada de 1 segundo a una distancia de 29 cm del
dosímetro más próximo, de forma que puede considerarse despreciable la contribución
estacionaria de dosis.
Los dosímetros se colocaron entre dos láminas de 3.5 cm de PMMA.
27 cm
1 cm
0.5 cm
Figura 2. Esquema de colocación de los dosímetros TLD para medida de dosis en tránsito

IAEA-CN-85-173
690
Comparación Dosis Tránsito
0,00
0,05
0,10
0,15
0,20
0,25
0,30
0,35
0,40
0 1 2 3 4
Distancia al tubo de transferencia (cm)
Do
sis
(c
Gy
/Ci·
Se
sió
n) Medidas TLD
Calculados
Potencial (Medidas
TLD)
Potencial
(Calculados)
Figura 3. Comparación de valores de dosis de tránsito experimentales y calculadas
La comparación entre los resultados experimentales y los calculados por el algoritmo se
muestra en la figura 3. Las diferencias encontradas son del orden de las estimadas en [2].
2. Conclusiones
Dado que la dosis en tránsito es linealmente dependiente de la actividad de la fuente, del
número de fracciones y de la velocidad de tránsito, y a la vista de los valores de dosis
obtenidos por unidad de actividad y sesión, la contribución de esta componente de dosis en
tejidos alrededor de la fuente puede llegar a ser considerable en el caso de que el número de
fracciones sea grande y aumente el número de canales utilizados, por lo que en esos casos
no debería despreciarse como suele hacerse en los sistemas de planificación asociados a
equipos de HDR.
El algoritmo desarrollado resulta práctico para el cálculo de la dosis en tránsito.
Referencias
[1] Pérez-Calatayud, R. Arrans Lara, J.Mª de Frutos Baraja, A. Guisasola Berasategui, J.
Macías Jaém, J. Valverde Morán. “Calibración, Matrices de Dosis y Control de Calidad en
Braquiterapia: Informe del Grupo de Trabajo de Braquiterapia de la SEFM”. Revista de
Física Médica 1 (0) (2000) 1-49.
[2] Bastin, M.B. Podgorsak, B.R. Thomadsen. “The transit dose component of high dose rate
brachytherapy: direct measurements and clinical implications”. Int. J. Radiat. Oncol. 26
(4) (1993) 695-702.
[3] Houdek, J.G. Schwade et al “Dose determination in high dose rate brachytherapy”. Int. J.
Radiat. Oncol. 24 (4) (1992) 795-801.

IAEA-CN-85-85
691
PATIENT DOSIMETRY IN INTRAVASCULAR RADIATION THERAPY
S. Van de Putte1, Y. Taeymans
2, H. Thierens
1
1Biomedical Physics Department, University Gent, Belgium
2 Department of Cardiology, University Hospital Gent, Belgium
Abstract
Percutaneous transluminal coronary angioplasty is a well-accepted method for nonsurgical myocardial
revascularization. However the long-term success of this method is limited by the occurrence of restenosis.
Endovascular brachytherapy has been put forward as means to avoid restenosis. Since this technique involves the
placement of a radioactive source in a catheter in the patient’s arteries, the possible radiation risk should be
considered. In this paper the effective dose of the patient associated with the use of Iridium-192 for IRT
treatment has been calculated using Monte Carlo techniques. To put the results into perspective the effective dose
form the PTCA procedure was also calculated using the same techniques. Calculations were based on the
measurement of DAP( Dose Area Product) for the procedure. We found a mean effective dose of 9 mSv for both
the PTCA procedures as for the IRT treatment. Thus leading to the conclusion that, from the perspective of
radiation burden, the elimination of one PTCA procedure through the use of IRT is a benefit for the patient.
1. Introduction
Percutaneous transluminal coronary angioplasty is a well-accepted method for nonsurgical
myocardial revascularization. However the long-term success of this method is limited by the
occurrence of restenosis. Restenosis is seen in approximately 30% of patients undergoing
PTCA and usually occurs within 6 months after angioplasty. A number of pharmaceutical
approaches have been tested to limit the rate of restenosis, none with sufficient success.
Implantation of a stent can only reduce the rate of restenosis for a number of patients.
Restenosis can be attributed to three components: recoil of the vessel, late remodelling of the
vessel and intimal hyperplasia. The first two components are adequately remedied through the
use of stents. The last component however, which is the growth of smooth muscle cells,
fibroblasts and intercellular matrix into the lumen of the vessel as a reaction to the injury of
the PTCA procedure, is not solved by stent placement. A promising approach is the use of
ionising radiation. This can be applied in different ways : implantation of radioactive stents
and catheters with gamma or beta sources. This paper focuses on the use of gamma sources, in
particular Iridium-192. Data from the SCRIPPS, WRIST and GAMMA I trial suggest that this
will be a useful technique to reduce restenosis. The main problem associated with the use of
gamma radiation is the range of the photons, which might pose a problem towards staff
dosimetry. A second point of interest is the extra dose the patient receives from this IRT
treatment. In order to evaluate these risks the RABAS (Radiation Burden Assessment) study
has been setup. In this study extensive dosimetry will be done for patients and staff in the
treatment of patients with Iridium sources. This paper describes the partial results for the
patient radiation burden.
2. Materials and methods
2.1. Catheterisation room and treatment procedure
All patients were treated in the catheterisation room of the University Hospital Ghent,
Belgium. The catheterisation room is a bi-plane room and consists of two Philips (Philips,
Hamburg, Germany) cardiovascular X-ray units. A DAP meter is attached to the tube housing.
These DAP meters are calibrated in situ using a Farmer NE2571 ionisation chamber and
Kodak X-Omat V film. The calculation of the calibration factor was done according to the

IAEA-CN-85-85
692
simplified method described by Shrimpton et al [1]. In this method the calibration factor is
taken as the ratio between the actual DAP, calculated as the dose in the centre of the field
multiplied with the field size as measured from the film, and the DAP reading. The usefulness
of these devices in the calculation of X-ray doses has already been investigated by a number
of authors [2-4]. To estimate the additional risk for both patient and staff an IRT-treated and a
control group of patients will be studied. Only male patients aged over 40 and satisfying
severe inclusion criteria are considered in the study. Prior to the IRT-treatment, the patients in
the treatment group are treated with normal PTCA procedures. When the cardiologist is
satisfied with the success of the PTCA procedure, the IRT treatment is started. Using
fluoroscopy and a dummy ribbon the length of the source is determined. Next the actual
source is moved in to the treatment position by a radiation oncologist. At this time only the
radiation oncologist is allowed in the room. During the actual treatment time, nobody is
allowed in the catheterisation room. After the IRT treatment has ended the cardiologist makes
the finals images to ascertain the initial success of the procedure. The patients in the control
group are treated with normal PTCA procedures.
2.2. Patient dose study
To calculate patient dose a number of parameters are recorded during the procedures. These
include DAP separately for every fluoroscopy and cine run. The position of the X-ray tubes,
indicated as a set of two angles: rotation and skew. These angles as well as the tube
parameters (tube potential, current, SID, II-field) are registered automatically for every cine
run. The values for fluoroscopy are copied from the first cine run following a series of
fluoroscopy. In the case of the IRT treated group the DAP and associated tube parameters are
divided in two parts. A first part consists of all radiation before the IRT-source placement, the
second is everything later on. In this way the additive X-ray patient dose associated with the
IRT-treatment can be assessed.
Patient dosimetry is divided in three components. The first component is the entrance skin
dose associated with the use of X-rays in interventional radiology. This part was measured
with TLD’s (LiF, Harshaw TLD-100 chips) attached to the body. A major problem associated
with the use of TLD’s ,as noted in a previous study [4], is the fact that is difficult to predict
the location on the skin where the highest dose will be delivered. The only way to overcome
this problem is through the use of an array of TLD chips. For this study 100 TLD’s are used
per patient. These TLD’s are spaced over an array of 95 cm by 20 cm leading to an equal
spacing of 5 cm in both the horizontal and vertical direction.
The second and third part are the organ and effective dose from the X-rays and 192-Iridium
source respectively. As measurement of these components is difficult or impossible Monte
Carlo calculations were done. The effective dose is then calculated using the tissue weighting
factors given in ICRP60 [5]. The dose to the bone-marrow is calculated using the method of
Rosenstein [6] to divide the energy deposited in the skeleton in two parts. Consequently
kerma-to-dose conversion factors calculated by Kerr et al [7] were used to calculate the dose
to the marrow. The dose to the bone surface is taken as the dose to the skeleton excluding the
marrow.
2.3. Monte Carlo calculations
In the literature different sets of conversion factors relating DAP to effective dose are
available. The factors used by most authors are those given in NRPB-R262 [3]. As tabulations

IAEA-CN-85-85
693
are always limited, we preferred to use our own Monte Carlo calculations. The Monte Carlo
code used was MCNP4b2 [8]. The kerma approximation with the following interactions were
considered: Rayleigh scattering, Compton Scattering, photoelectric effect and pair production.
The patient table is included in the model to compensate for additional attenuation. In the case
of X-ray simulation, the source position is calculated from the X-ray tube angles and from the
assumption that the iso-center of the bi-plane X-ray set-up is located at the heart for all
incidences. For the calculations of IRT doses the source is takes as a curved line source in
contact with the heart surface. The position was calculated to closely match the position of the
lesion treated in the patient. The IRT sources used in this study (Cordis) have three possible
lengths 23 mm, 39 mm and 55 mm. For calculation of the organ dose we used the
mathematical phantom developed by Christy and Eckerman [9]. For the calculation of the X-
ray dose the phantom has been adjusted for the above head position of the arms during the
PTCA procedure. For every patient a Monte Carlo simulation has been done for every tube
incidence and field-size used in the PTCA procedure.
2.4. Heart phantom and source position
We used the heart phantom as described in the mathematical phantom [9] which is the model
described by Coffey [10]. The surface of the heart is represented by four quarter ellipsoids.
Inside the heart a division is made between heart-wall and contents. The heart is described in
an auxiliary coordinate system that is related to the phantom coordinate system by a rotation
matrix. In this model the groove between atrium and ventricle can be approximated as the YZ-
plane, similarly the division between the left and right side of the heart can be approximated
as the XY-plane. The cardiovascular blood flow is supplied by two main coronary arteries, the
Left and Right coronary artery. Both these arteries have their offspring in the aorta. The RCA
(Right coronary artery) runs in the groove between the right atrium and ventricle. The Left
coronary artery almost immediately divides into two branches the LAD (left anterior
descending) which runs along the division between the left and right ventricle towards the tip
of the heart, and the CX (circumflex) that runs along the groove between the left ventricle and
atrium. All of these branches are divide in proximal, middle and distal parts.
3. Results and discussion
Table I gives some relevant dose determining parameters for the dose calculations. These
include total treatment IRT-dwell time, source activity, source length and source position.
Table 1. Relevant dose determining parameters for IRT procedure
Patient Dwell time
(min)
Activity
(MBq)
Source
length (mm)
Source
Position
A (1) 17.150 10748.5 39 Prox LAD
B (2) 17.150 10748.5 39 Prox CX
C (3) 18.088 6315.90 23 Prox LAD
D (4) 17.450 14737.1 55 Prox LAD
E (10) 15.106 12202.6 39 Prox RCA
Table II gives the dosimetric results for all patients. These include maximum skin dose ,
effective X-ray dose, effective X-ray dose after IRT treatment, effective dose from IRT
treatment.

IAEA-CN-85-85
694
Table 2. Dosimetric results
Patient Maximum
skin dose
(mGy)
Total
Effective
dose X-
ray (mSv)
Effective
dose X-
ray after
IRT
(mSv)
Effective
dose from
IRT
(mSv)
Effective dose
per
disintegration
(mSv/dis)
Patient Maximum
skin dose
(mGy)
Total
Effectiv
e dose
X-ray
(mSv)
A 863 16.0 5.63 7.73 6.99 10-13
F 241 3.07
B 501 7.13 1.30 9.55 8.64 10-13
G 818 11.1
C 853 16.9 1.22 4.70 7.11 10-13
H 753 11.9
D 442 7.73 1.14 10.4 6.94 10-13
I 352 7.51
E 368 6.09 1.28 6.99 6.33 10-13
J 473 7.43
-20.00 -15.00 -10.00 -5.00 0.00 5.00 10.00 15.00 20.00
-20.00 -15.00 -10.00 -5.00 0.00 5.00 10.00 15.00 20.00
0.00
5.00
10.00
15.00
20.00
Figure 1: Skin dose distribution for patient C. The horizontal axis indicates the position on the
back in cm , 0 is the centre and –20 is the right side. The color bar indicates the skin dose in
mSv
3.2. Effective dose
The higher dose found for patient A is due to stent placement. For patient C additional images
before the PTCA procedure were needed to determine the exact location of the lesion. It is
important to notice the dose after IRT-treatment in Table II, which has a mean value of
1.24 mSv excluding patient A, since a stent was placed after the IRT treatment. The effective
dose from the Iridium source itself seems to depend strongly on the source length and hence
the total activity. The dose for patient C for whom the longest source was used, is almost
twice that of patient B for whom the shortest source was used. This is logical since the total
activity on the longer source is also higher. If however we look at the dose per disintegration
we find that this value depends on source position and also on source length. Both aspects
have the same reason: the proximity to radiosensitive organs. If we compare the dose per
disintegration value for a 23 mm source in the prox LAD with that for a 55 mm source in the
same position, we find that the dose per disintegration is higher for the shortest source. This
can be explained if we look at the orientation of the heart and hence the source in the body.

IAEA-CN-85-85
695
Because the heart is tilted in the body, the average distance from the source to ,for example,
the oesophagus is longer for the longest source. If we compare the values per disintegration
with the MIRDOSE 3.0 value of 9.34 10-13
mSv/dis we find that this value is 30% higher than
the mean (7.2 10-13
mSv/dis) of the values given in table II. This can also be explained by the
geometrical effect. The calculation in MIRDOSE is based on activity uniformly distributed in
the hearth wall. The values in table II are for distinct locations on the hearth surface. If we use
our model to calculate the dose per disintegration for a source located posterior we find a
value of 10.69 10-13
mSv/dis, which is 17% higher than the MIRD value.
4. Conclusions
When considering the use of IRT-treatment in the fight against restenosis, one has to take the
potential radiation risk into consideration. To determine this risk Monte Carlo calculations
were done to calculate the effective dose associated with these procedures. The mean effective
dose found for a PTCA procedure was 9.29 mSv. The mean effective dose found for the IRT-
treatment was 9.14 mSv, consisting of 1.24 mSv from the additional X-ray use and 7.90 mSv
from the IRT source. It can thus be concluded that the extra radiation burden to the patient
from the IRT-treatment is comparable to the PTCA. Thus if one PTCA procedure can be
avoided through the use of IRT, then we can conclude that from the perspective of radiation
burden, the treatment is justified.
References
[1] Shrimpton, P C. and Wall, B F., An evaluation of the Diamentor transmission ionisation
chamber in indicating exposure-area product (R cm2) during diagnostic radiological
examinations, Phys. Med. Biol. 27 (1982) 871-878.
[2] Le Heron, J C., Estimation of effective dose to the patient during medical x-ray
examinations from measurements of the dose-area product, Phys. Med. Biol. 37 (1992)
2117-2126.
[3] Hart, D., Jones, DG and Wall, B F., Estimation of effective dose in diagnostic radiology
from entrance surface dose and dose-area product measurements, NRPB-R262, London,
HSMO (1994).
[4] Van de Putte, S., Verhaegen, F., Taeymans, Y., Thierens, H.,Correlation of patient skin
doses in cardiac interventional radiology with dose-area product, Br. J. Radiology 73
(2000) 504-513
[5] International Commission on Radiological Protection, Recommendations of the
international Commission on Radiological Protection, ICRP publication 60, Oxford,
Pergamon (1991).
[6] Rosenstein, M., Organ Doses in Diagnostic Radiology, US Department fo Health,
Education and Welfare, Bureau of Radiological Health BRh Tech, Publication DA 76-
8030 (1976).
[7] Kerr, G D., and Eckerman, K F., Neutron and Photon fluence-to-dose conversion factors
for active marrow of the skeleton (Proc. Of the fifth symposium on neutron dosimetry,
1985), Vol I,EUR 9762 EN, CEC Luxembourg.
[8] Briesmeister, J F., MCNP- A general Monte Carlo N-Particle Transport Code, Version
4B, LA-16252-M, Los Alamos 1997
[9] Christy, M., Eckerman, K F., Specific Absorbed Fractions of Energy at Various Ages
from Internal Photon Sources, ORNL/TM-8381, Oak Ridge 1987
[10] Coffey, J L., A revised mathematical model of the hearth for use in radiation absorbed
dose calculations, MS Thesis, Univ. Tenn., Knoxville 1978
IAEA-CN-85-195
696
DESIGN AND IMPLEMENTATION OF AN INTRAVASCULAR
BRACHYTHERAPY INSTALLATION IN CARDIOLOGY
C. Prieto1, E. Vano
1,2, M. Sabate
3, J.M. Fernandez
1,2, Y.C. Galvan
2,4
1 Medical Physics Service, San Carlos University Hospital, Madrid, Spain 2 Radiology Department, Medicine School, Complutense University, Madrid, Spain 3 Interventional Cardiology Service, San Carlos University Hospital, Madrid, Spain. 4 Radiotherapy Service. San Carlos University Hospital, Madrid, Spain
Abstract
Intravascular Brachytherapy (IVB) is a very promising technique for reducing restenosis rates. However, neither
the exact absolute dose needed nor the optimal spatial and temporal distribution of dose inside the vessel wall for
a successful treatment, nor the physical dosimetry of the various radioactive sources and devices for dose
delivery, are well known. In this paper, an overview will be given of the design strategy, the dosimetric and
radiation protection-related problems that we have met during the implementation of this technique at San Carlos
hospital, adopted or foreseen solutions, and future research fields that we intent to carry out in order to reduce
uncertainties and to achieve a deeper knowledge of the parameters that have an influence on the treatment.
1. Introduction
Ionising radiations have been used recently to reduce restenosis rates after percutaneous vascular interventions in technique generically known as Intravascular Brachytherapy. This new technique, consisting of the irradiation with � or � sources to reduce restenosis rates after angioplasty, is being widely investigated �1�.
IVB procedures are radiotherapeutic procedures if we consider them as every process of therapeutic irradiation as stated in the Spanish legislation �2� derived from the European Directive on Medical Exposures �3�. However, there are some aspects different from classic radiotherapy that should be taken into account. The important uncertainties involved in this kind of treatment should not be an excuse to give up this technique as, even taking them into account, the results in patients treated are encouraging. Nevertheless, researching and elaboration of Quality Assurance Programs in this area of Radiotherapy must be encouraged and supported. 2. Objectives
��To list the problems that we have found in the implementation of IVB techniques in the
San Carlos University Hospital (SCUH). ��To show the available alternatives and research fields that we have envisaged to solve
these problems.
3. Material and methods
The Interventional Cardiology Service of the SCUH is licensed to use one IVB system which consists of a train of Sr-90/Y-90 sealed sources that are hydraulically positioned through a

IAEA-CN-85-195
697
non-centering catheter1. Before long we will be licensed to use another system of afterloading brachytherapy in which a wire with a P-32 source on its tip, advances through a especial balloon2.
The aim of these IVB systems (and of any other) is to uniformly irradiate the target volume, which is usually very irregular, with the suitable dose. However there are some challenging technical and organisation difficulties that are studied hereafter. 4. Discussion
From the experience obtained in the design and implementation of our IVB installation, we have realised the importance of the following aspects: 1. Coordination between the professional groups involved (cardiologists, radiooncologists,
medical physicists). The creation of multidisciplinary task groups that work to overcome the problems and uncertainties in IVB is advisable.
2. Difficulties to gather and bring documentation to the Regulatory Authority because
of the fast introduction of many new and different systems. 3. Feasible incidents analysis and emergency plans design. This analysis is specially
difficult due to the variety of systems and to the limited experience with them. 4. Design of operation procedures that intend to avoid errors and emergency situations. 5. Redesign needs of cath labs to use ���� sources. The extra necessary shielding weight
would lead, in our case, to structural problems. Therefore, we expect the implementation of IVB with � sources in a properly equipped radiotherapy room.
6. Evaluation of uncertainties in imparted dose. These uncertainties are greater than the
ones of conventional Radiotherapy and Brachytherapy due to the steepness of the depth dose curve for � radiation, the positioning errors, the movement with heart beat, the asymmetry in the target volume, etc.
7. Even if we have full certainty of the target volume (the latest studies indicate that the
target volume should be the adventitia), this is accurately known not before the balloon dilatation and later imaging with IVUS3, which means that dosimetry must usually be
retrospective. Since a previous dosimetry (before the dilatation) can not be made, we will attempt to make an on-line dosimetry (right after post-dilatation ultrasound imaging) in order to decide the suitable treatment parameters. Afterwards, a more accurate dosimetry will be made retrospectively. The option to make angioplasty and IVUS imaging one day before the brachytherapy treatment, would allow us to make an accurate dosimetry planification in advance. Nevertheless, this would increase the catheterization-related risks, and remodeling in the period from dilatation to treatment would introduce more uncertainties than those that we attempt to avoid with this option.
1 (Beta-Cath System. Novoste Corporation. Brussels, Belgium). 2 (Galileo. Guidant S.A. Diegem, Belgium). 3 IVUS: Intravascular Ultrasound.