radio science june 2016 - arecibo observatorynaic.edu/~astro/ao50/rsb_357_2016_06-twt-etal.pdf ·...
TRANSCRIPT

UNIONRADIO-SCIENTIFIQUE
INTERNATIONALE
INTERNATIONALUNION OF
RADIO SCIENCE
ISSN
102
4-45
30
URSI, c/o Ghent University (INTEC)St.-Pietersnieuwstraat 41, B-9000 Gent (Belgium)
No 357June 2016R
adio
Sci
ence
Bul
letin

2 The Radio Science Bulletin No 357 (June 2016)
Front cover: A schematic overview of S-band (13 cm wavelength) Arecibo-Lunar Reconnaissance Orbiter mapping of the moon. See the paper by Thomas W. Thompson, Bruce A. Campbell, and D. Benjamin J. Bussey, pp. 23-35.
ContentsRadio Science Bulletin Staff ....................................................................................... 3URSI Offi cers and Secretariat.................................................................................... 6Editor’s Comments ..................................................................................................... 8URSI 2017 GASS....................................................................................................... 10Awards for Young Scientists - Conditions ............................................................... 11Modifi cation of the Ionosphere by Precursors of Strong Earthquakes ............... 1250 Years of Arecibo Lunar Radar Mapping ........................................................... 23Special Section: Joint URSI BeNeLux - IEEE AP-S -NARF Symposium ........... 36Implementation of Diff erent RF-Chains to Drive Acousto-Optical Tunable
Filters in the Framework of an ESA Space Mission .......................................... 37JS’17 ........................................................................................................................... 44In Memoriam: Per-Simon Kildal ............................................................................. 45In Memoriam: Richard Davis .................................................................................. 473rd URSI-RCRS ........................................................................................................ 48Et Cetera .................................................................................................................... 49EUCAP 2017 .............................................................................................................. 50Solution Box ............................................................................................................... 51DIPED 2016 ............................................................................................................... 54Ethically Speaking .................................................................................................... 55RFI 2016 ..................................................................................................................... 56Telecommunications Health and Safety .................................................................. 57Early Career Representative Column ..................................................................... 60National Radio Science Meeting USNC/URSI ....................................................... 69Women in Radio Science .......................................................................................... 71Report on Frequencies and Radioscience 2016 Workshop ................................... 74URSI Conference Calendar ...................................................................................... 76Information for Authors ........................................................................................... 78
The International Union of Radio Science (URSI) is a foundation Union (1919) of the International Council of Scientifi c Unions as direct and immediate successor of the Commission Internationale de Télégraphie Sans Fil which dates from 1914.Unless marked otherwise, all material in this issue is under copyright © 2016 by Radio Science Press, Belgium, acting as agent and trustee for the International Union of Radio Science (URSI). All rights reserved. Radio science researchers and instructors are permitted to copy, for non-commercial use without fee and with credit to the source, material covered by such (URSI) copyright. Permission to use author-copyrighted material must be obtained from the authors concerned.The articles published in the Radio Science Bulletin refl ect the authors’ opinions and are published as presented. Their inclusion in this publication does not necessarily constitute endorsement by the publisher. Neither URSI, nor Radio Science Press, nor its contributors accept liability for errors or consequential damages.

8 The Radio Science Bulletin No 357 (June 2016)
Editor’s Comments
Ross StoneStoneware Limited840 Armada TerraceSan Diego, CA 92106, USATel: +1-619 222 1915, Fax: +1-619 222 1606E-mail: [email protected]
Our Papers
We have three papers in this issue. They span a wide range of radio-science topics, cover more than 50
years of history, and the authors cover the spectrum from students to senior researchers.
Our first paper, by G. Ya. Khachikyan, B. T. Zhumabayev, and A. V. Streltsov, is an invited contribution that resulted from a very interesting presentation I heard at the USNC-URSI National Radio Science Meeting in January of this year. The paper reviews results from numerical simulations and experiments showing that the precursors to earthquakes with a magnitude greater than seven can produce measurable modifi cations to ionospheric parameters over periods ranging from several hours to several days before the start of the earthquake. The paper begins with a review of 50 years of reports of observations of such ionospheric modifi cations. A review of simulations of how ionospheric parameters can be modifi ed by earthquakes is then presented. These models are based on the global electric circuit concept, which is explained. The use of the models to explain the DEMETER satellite observations of the ionosphere above strong earthquakes and their precursors is analyzed. One of the results of this analysis is the conclusion that there is a relationship among where strong earthquakes occur, where geomagnetic fi eld lines penetrate the Earth’s surface near the earthquake’s epicenter, and the occurrence of modifi cations to the ionosphere as a precursor to the earthquake. This also leads to some interesting conclusions regarding the likely ability to observe such relationships over the next few years. I think you will fi nd this a fascinating paper.
John Mathews has brought us an invited paper by Thomas Thompson, Bruce Campbell, and Ben Bussey, tracing 50 years of radar mapping of the Earth’s moon using the Arecibo Observatory. The paper begins with the recognition before Arecibo was built by William Gordon – who conceived Arecibo and made it a reality – that the facility could be used for radar studies of the moon. It
recounts the fi rst lunar radar observations done as part of Arecibo’s commissioning in 1964, and traces the various lunar-mapping programs done using the delay-Doppler technique from the 1960s through the 1980s. The use of synthetic-aperture-radar techniques combined with bistatic measurements that begin in the 1990s is then described. These techniques resulted in a signifi cant improvement in resolution, and in the information that could be obtained using the polarization of the signals. The more-recent use of satellite-based radar combined with the Arecibo Observatory is explained. The features that can be determined from lunar radar scattering, and how they are derived, are then considered. This is followed by an annotated bibliography tracing Arecibo lunar radar measurements. This paper is both a signifi cant contribution to the record of the history of radio science, and a most interesting look at one way the world’s largest radio telescope has been used for 50 years.
Special Section: BeNeLux Student Paper Winner
Our third paper is one of the winners of the Student Paper Contest from a BeNeLux symposium held in December, 2015. The paper is by J. Vanhamel, with coauthors S. Berkenbosch, E. Dekemper, D. Fussen, P. Leroux, E. Neefs, and E. Van Lil. The topic is the implementation of RF drivers for tunable acousto-optical fi lters for a space mission. The challenges faced in the work reported were to design RF chains to drive the fi lters in each of the three operating-wavelength ranges – ultraviolet (UV), visible, and near-infrared (NIR) – using space-qualifi ed parts. The paper begins with a discussion of the requirements and the challenges. Possible RF-generator architectures are examined, and the bases for focusing on the phased-locked-loop and Hilbert transform architectures are explained. The designs for implementing these architectures are presented. The results obtained from tests of the systems built for each channel are analyzed. The paper concludes with a discussion of planned future work. This paper provides

The Radio Science Bulletin No 357 (June 2016) 9
an excellent introduction to the realities of designing and building circuits to meet the requirements of space fl ight.
Our Other Contributions
Stefan Wijnholds has provided us with a tutorial on academic publishing, authored by W. Ross Stone, Stefan Wijnholds, and Phil Wilkinson. Put simply, the Editor of the Radio Science Bulletin, the Chair of the URSI Early Career Representatives, and the Editor-in-Chief of Radio Science have written an article describing the process of academic publishing, intended for those who may be new to the process or who would like more information about the details of the process – and using those two publications as examples. Some of this may also be of interest to those who are experienced authors.
In his Ethically Speaking column, Randy Haupt looks at the age-old question, “How full is your glass?” He explains why the meaning attached to the answer to that question is what really matters.
In the Solution Box, Özgür Ergül has brought us solutions to a pair of problems by Ismail E. Uysal, H. Arda Ülkü, and Hakan Bağcı. They provide solutions to the computation of the fi elds scattered from gold spheres incorporating plasmonic eff ects that dominate at optical frequencies. There were several computational challenges to be overcome in solving these problems, and alternative solutions are sought.
In his Telecommunications Health and Safety column, Jim Lin reviews recent developments in transcranial magnetic stimulation. This uses transient, high-strength, pulsed magnetic fi elds to stimulate nerve cells in the brain. The goal is to improve symptoms of depression or other psychiatric diseases that are resistant to drug therapy.
Asta Pellinen-Wannberg’s Women in Radio Science column has a contribution from Anthea Coster, who is Assistant Director for the Haystack Observatory. She describes her career path and how it was infl uenced over the years. She also off ers some suggestions for those trying to work out their own career paths, and for those who would help them do so.
Important Dates
The calls for papers – and the paper-submission deadlines – for several important conferences appear in this issue. The XXXIInd General Assembly and Scientifi c Symposium of URSI, to be held August 19-26, 2017, in Montréal, Quebec, Canada, is one of those. The paper-submission deadline for the GASS is January 30, 2017. That is also the deadline for submission for applications for Young Scientist Awards, and for submissions to the Student Paper Contest. More information can be found on the Web site: www.GASS2017.org.
The Asia-Pacifi c Radio Science Conference (AP-RASC 2016) will be held August 21-25, 2016, at the Grand Hilton Seoul Hotel in Seoul, Korea. 678 papers from 34 countries have been submitted, with all 10 URSI Commissions well represented. There is still time to make plans to attend this conference, which promises to be an outstanding gathering of radio scientists. Visit the Web site at aprasc2016.org immediately to make hotel reservations at the conference venue. I look forward to seeing you there!

The Radio Science Bulletin No 357 (June 2016) 23
50 Years of AreciboLunar Radar Mapping
Thomas W. Thompson,1 Bruce A. Campbell,2 and D. Benjamin J. Bussey3
1Jet Propulsion LaboratoryPasadena, CA USA
E-mail: [email protected]
2Center for Earth and Planetary Studies, Smithsonian InstitutionWashington, DC USA
E-mail: [email protected]
3Applied Physics Laboratory, Johns Hopkins UniversityLaurel, MD USA
E-mail: [email protected]
Abstract
William E. Gordon conceived the giant radar/radio telescope at Arecibo, Puerto Rico (Figure 1) in 1958 as a backscatter radar system to measure the density and temperature of the ionosphere at altitudes of up to a few thousand kilometers [1, 2]. The backscattered ionospheric echo was calculated to be weak, requiring a large antenna with a diameter of 1000 ft (305 m) to measure it. From the beginning, Gordon (as noted in his in his 1958 URSI abstract on incoherent scattering [3]) realized that a radar system with an antenna that large could conduct radar studies of the moon and planets. With the recent celebration of the 50th anniversary of the Arecibo radio/radar telescope, it is appropriate to describe how radar mapping of the moon has evolved over the years: from the early monostatic 70-cm observations in the 1960s through the 1980s, to the 13-cm and 70-cm wavelength bistatic observation using the Robert C. Byrd Green Bank telescope in the 1990s to today, and then to the 13-cm wavelength bistatic observations conducted using the mini-RF radar instrument fl own on the NASA/US Lunar Reconnaissance Orbiter spacecraft in the last few years.
1. Introduction/Background
The radar mapping of the moon that took place from the 1960s to the present using the Arecibo radio/radar
telescope, like most scientifi c and engineering advances, had a number of important precursors. The fi rst radar
echoes from the moon were detected in 1946 when US Army Signal Corp personnel pointed their radar at the moon [4]. This was a huge media event in its day. About a month later, Zoltan Bay also detected lunar radar echoes using a Hungarian radar [5].
In the early 1960s, it was realized that the high-power transmitters and larger antennas of the day could be used to probe planetary surfaces. These methods were formulated when Gordon Pettengill, Tor Hagfors, John Evans, and others at the Massachusetts Institute of Technology (MIT) conducted a summer course on planetary radar. MIT personnel at that time used 7.84-m (784-cm) radars at El Campo, Texas, the 68-cm radar at Millstone Hill, Massachusetts, and the 3.6-cm radar at Pleasanton, California, to measure the scattering behavior of the moon [6]. In parallel, Richard Goldstein successfully detected anomalous scattering areas on Venus [7] using the then newly commissioned Deep Space Network antennas at Goldstone, California. This work demonstrated radar’s ability to see through the thick clouds that obscure the Venusian surface.
An important precursor to the radar mapping of the moon, as well as of Venus, Mars, and the asteroids, was the development of the delay-Doppler technique. This was fi rst demonstrated by lunar radar observations conducted at MIT’s Millstone Hill radar (Westford, Massachusetts) [8]. This technique makes it possible to map radar refl ectivity across the disk of moon, as shown in Figure 3. Radar echoes are located by their delay along the radar’s line of sight and their Doppler shift due to the apparent rotation

24 The Radio Science Bulletin No 357 (June 2016)
of the moon. When viewed from Earth, echoes with the same delay are rings concentric with the center of the lunar disk. Echoes with the same Doppler frequency are strips parallel with the moon’s apparent axis of rotation. Location by delay and Doppler shifts are ambiguous, as two separate areas have the same properties. As noted below, narrow antenna beams that view only one these two areas can resolve this ambiguity. Once the echoes are located in the radar-centric , ,d d dx y z coordinate system, their location
in selenographic coordinates (latitude and longitude) can be determined by a rotation about the origin of , ,d d dx y z coordinates, as described in Appendix 1.
This fi rst delay-Doppler mapping of the moon showed that the crater Tycho [9] had much stronger echoes than other lunar areas. Tycho’s stronger echoes are attributed to an abundance of wavelength-sized (centimeter- and meter-sized) rocks associated with this recent lunar impact. The observation that the young, large lunar impact craters had more centimeter- and meter-sized rocks was also shown by Saari and Shorthill [10], who observed the infrared cooling of the moon during a lunar eclipse. Warmer areas in these observations associated with large, young impact craters were consistent with the hypothesis of an increased abundance of rocks with sizes greater than about 5 cm, as rocks of these sizes still radiated heat while the nearby lunar (dusty) surface had cooled. All of this provided a basis for lunar radar observations at Arecibo that commenced in 1964, when the 1000-ft radio/radar telescope was being commissioned.
2. 1960s to 1980s
From 1964 through the 1980s, there was a progression of radar observations of the moon using the Arecibo radio/radar telescope, shown in Figure 1. The fi rst radar echoes of the moon were detected by William Gordon and Merle LaLonde, using a horn feed at Arecibo that was installed on site to provide a means of validating the high-power 430-MHz (70 cm wavelength) transmitter before the main antenna/radar system (see Figure 4 of Mathews [11]). Soon
Figure 1. The Arecibo radio/radar telescope. It was constructed in the early 1960s, dedicated in late 1963, and commissioned in 1964. The refl ector surface diameter is 1000 feet (305 m). Note that the antenna beamwidth at 70 cm wavelength (430 MHz) is 10 arc-minutes, and 1.8 arc-minutes at 13 cm wave-length. The moon’s angular width is 30 arc-minutes to 33 arc-minutes.
Figure 2b. Power as a function of delay for beam position 2 on Oceanus Procellarum with the antenna pointed 10 arc minutes from the center of the lunar disk for the opposite-sense-circular (OC) polarized component. Note the enhanced radar echoes associated with the large, young craters Copernicus, Kepler, and Aristarchus [12]
Figure 2a. The fi rst lunar radar observations were conducted by pointing the 10-arc-minute antenna beam at eight positions around the limb of the 30 arc-minute lunar disc and recording echoes versus delay, as shown here [12].

The Radio Science Bulletin No 357 (June 2016) 25
thereafter, the fi rst lunar radar observations were conducted in 1964 when the Arecibo radio/radar telescope was being commissioned [12]. These fi rst observations were conducted by pointing the 10-arc-minute antenna beam at eight positions around the limb of the 30 arc-minute lunar disc and recording echoes versus delay, as shown in Figure 2a. The observations showed that large young craters (such as Copernicus, Tycho, Kepler, and Aristarchus) had enhanced backscatter, similar to the crater Tycho enhancement seen by Pettengill and Henry [9], as shown in Figure 2b. Later in 1964, preliminary delay-Doppler observations yielded maps with resolutions on the order of 20 km to 30 km, as shown in Figure 3b. These and other very early maps (Figure 4) were suffi cient to verify the enhanced radar backscatter associated with the larger, young craters. In addition, these observations showed that the lunar highlands (the terrae) had stronger echoes than the lunar maria by a factor of two to four.
We note that the moon is a very cooperative body for radar imaging using delay-Doppler techniques. There are three primary factors:
1. The narrow Arecibo antenna beamwidths,
2. The relatively slow apparent rotation of the moon, and
3. The large angles in the plane of the sky between the actual and apparent axes of rotation.
These three factors enable effi cient radar imaging of the moon with the Arecibo antenna. There is an intrinsic ambiguity in delay-Doppler observations, as there are two areas that appear at the same delay and Doppler frequency, as shown in Figure 3. This ambiguity is resolved by pointing the antenna beam at one of the two ambiguous areas. Echoes from the other ambiguous area are suppressed as they are within the antenna’s sidelobes. The Arecibo antenna’s beamwidths at 70-cm and 13-cm wavelengths are 10 arc-minutes and 2 arc-minutes, both smaller than the angular diameter of the moon (30 arc-minutes to 33 arc-minutes).
The second factor – the slow apparent rotation of the moon – as described in Appendix 1, produces about 10 Hz of limb-to-limb spread in Doppler frequencies at 430 MHz (70 cm wavelength). At 2380 MHz (13 cm wavelength) the spread in Doppler frequencies for echoes from areas illuminated by the antenna beam is 7.5 Hz. Pulse repetition rates of 10 Hz are thus enough to produce spectra that readily enable surface resolutions on the order of a few tens of kilometers with frequency resolutions of 0.01 Hz to 0.1 Hz. Such frequency resolutions can be achieved with time records (coherence intervals) of 10 seconds to 100 seconds in length. Equivalent range resolutions are accomplished by transmitting pulses of 10 microseconds to 100 microseconds.
The third factor is the fact that the moon’s apparent axis of rotation in the sky can diff er from the actual axis of rotation by angles as great as 45. This enables radar imaging of the moon’s equatorial regions. Figure 4 shows a radar image of crater Tycho obtained during the Arecibo commissioning in 1964.
From 1966 through 1969, the Apollo Program was well underway, and many lunar engineers and scientists
Figure 3. The geometry for delay-Doppler mapping of the moon with the 10 arc-minute Arecibo antenna beam at 430 MHz (70 cm wavelength). The intrinsic north-south ambiguity in delay-Doppler mapping was resolved by pointing the antenna at one of the ambigu-ous areas and having antenna sidelobes suppress echoes from the other ambiguous area. Here, 0x , 0y , and 0z are a Cartesian coordinate system aligned with the radar observer, where the 0y axis is aligned with an apparent axis of rotation, the 0z axis is along the ra-dar’s line-of-sight, and the 0x axis completes the triad.
Figure 4. An example of a 1964 delay-Doppler mapping of the moon at 70 cm wavelength: a radar-scattering map of the crater Tycho and its environs. The power contours are for polar-ized, opposite-sense-circular (OC) radar echoes. The resolution was 20 km to 36 km [12].

26 The Radio Science Bulletin No 357 (June 2016)
were called upon to assist in landing-site selections. This led to the Photographic Lunar Atlas [13], used as base maps for the 1964 delay-Doppler maps, and to the 1:1,000,000 scale Lunar Aeronautical Charts (LAC) [14]. These Lunar Aeronautical Charts covered areas along the lunar equator with maps that covered 16° in latitude and 20° in longitude. Farther away from the equator, the latitude range remained 16°, but the longitude range was increased to 24°. Still farther from the equator, the longitude range was increased to 30°. As these map areas fi t conveniently within the 10 arc-minute antenna beam at 430 MHz (70 cm wavelength),
lunar radar observations in 1966 to 1969 concentrated on observation of each of the Lunar Aeronautical Chart areas. This resulted in the fi rst global lunar radar map of the near side of the moon [15], shown in Figure 5.
Later, in the 1980s, it was realized that with improvements in computers and in data-storage capabilities, the global mapping of the late 1960s could be further improved. Rather than the 44 positions for the 1960s global lunar radar map tied to the Lunar Aeronautical Charts, 28 positions were used to map the moon’s near-side hemisphere. Here, a coarse resolution “beam-swing’ delay-Doppler mapping was performed to provide a background map. This in turn eliminated the map-to-map discontinuities in the 1960s’ map. The resulting global radar map of the moon [16] is shown in Figure 6.
Figure 5a. 1966-1969 radar mapping of the moon: a lunar global radar map at 70 cm wavelength. The resolution was 5 km to 10 km. 42 separate observations were referenced to the Lunar Aeronautical Charts (LAC). These were the fi rst global radar mapping results for the moon’s near side [16]. This shows the opposite-sense-circular (OC) polarized component.
Figure 5b. As in Figure 5a, but for the same-sense-circular (SC) depolarized component.
Figure 6a. A 1980s lunar global radar map at 70 cm wavelength. The resolution was 3 km to 5 km. 28 separate observations were used [16]. This shows the opposite-sense-circular (OC) polarized component.
Figure 6b. As in Figure 6a, but for the same-sense-circular (SC) depolarized component.

The Radio Science Bulletin No 357 (June 2016) 27
In the late 1960s, another type of lunar radar observation was conducted. In this observation, lunar echoes from long-wavelength (7.5 m) transmissions were observed in a bistatic confi guration using the main 1000 ft (305 m) Arecibo antenna and a nearby smaller auxiliary antenna. This 7.5 m transmitter system, which was coaxial with the 430 MHz feed (see Figure 5 of Mathews [11]), was installed in 1965 to off er a dual-frequency capability for ionospheric studies. It was never successfully used for incoherent-scatter measurements, possibly due to clutter issues. This low-frequency feed was conveniently attached to one of the carriage houses, and enabled tracking of the moon.
In order to obtain radar maps of the lunar surface at this wavelength, the separation of ambiguous delay-Doppler refl ecting areas had to rely on a diff erent technique. Alan Rodgers (MIT Lincoln Laboratory) had developed a bistatic radar-mapping method for Venus, where the phase diff erences between echoes from ambiguous refl ecting areas observed by two nearby antennas could be used to separate their signals [17]. His mapping of radar echoes from Venus with this technique was the fi rst for any planetary body.
For the mapping of the moon with this technique at 7.5 m wavelength, the optimum spacing between the main antenna and an auxiliary antenna placed this second antenna just inside the property owned by the Arecibo Observatory. The auxiliary Yagi antenna had a 40° beamwidth, so it could see lunar radar echoes for the 20 of zenith coverage of the main antenna. This bistatic technique was used for two observations [18, 19]. Figure 7a is an overview of the radar confi guration. Figure 7b shows the global radar image resulting from the second observation.
It is useful here to summarize the improvements in the Arecibo radar system over the years, as these have led to a wide variety of lunar radar experiments. These were:
1963: 430 MHz system, pulsed transmitter, 2.5 MW peak, 150 kW maximum average power, which enabled the lunar radar mapping at 70 cm wavelength, described above.
1965: 40 MHz transmitter, pulsed or CW, 100 kW average power, 2 MW peak power. Although this transmitter was decommissioned in 1971, it enabled the lunar radar mapping at 7.5 m wavelength, described above.
1974: 2,380 MHz CW transmitter, 450 kW maximum power, installed as a part of a major upgrading of the Arecibo radio telescope/radar systems. This enabled the lunar radar mapping at 12.6 cm wavelength, described below.
1997: 2,380 MHz CW transmitter installed, 1.0 MW maximum power, an upgrade to the 1974, 450 kW transmitter that enabled improved lunar radar mapping at 12.6 cm wavelength, described below.
3. 1990s to Present: Arecibo–Green Bank Bistatic Observations
Lunar radar mapping through the late 1980s used well-demonstrated delay-Doppler techniques to achieve image spatial resolutions on the order of a few kilometers. The realization of fi ner resolutions over the full illuminated area on the moon required “focusing” of the echoes by adapting synthetic-aperture radar (SAR) techniques that account for both range migration and a very signifi cant phase variation that occurs over integration periods longer than a few minutes. Nick Stacy [20, 21] demonstrated this using the 13 cm wavelength radar system in his PhD research at Arecibo.
Figure 7a. The geometry of the lunar-surface radar re-fl ections as observed by a two-element interferometer. The coordinates X, Y, and Z are radar-based, while , , and are the standard selenographic direction cosines. Here, the intrinsic north-south delay-Doppler ambiguity was resolved via phase diff erences of the echoes observed by an interferometer.
Figure 7b. A lunar global radar map at 40 MHz, 7.5 m wavelength [19].

28 The Radio Science Bulletin No 357 (June 2016)
The fi rst bistatic observations of the moon at the 13.6 cm wavelength were conducted by Nick Stacy in 1990 and 1992 [20], using an auxiliary 30.5 m Los Caños antenna, 11 km to the north of the 305 m telescope. This auxiliary antenna was equipped with a dual-polarization maser receiver, and was used for both Venus (interferometry) and lunar radar mapping. These observations were also the fi rst high-resolution, full-Stokes-parameter radar observations of the moon, and possibly of any other planetary surface.
Practical application for synoptic mapping needed a second receiving system to allow for dual-polarization measurements at both 13 cm and 70 cm wavelengths, since the Arecibo confi guration did not support this type of observing. A bistatic confi guration was implemented in 2003, using the Arecibo telescope for transmitting and the National Radio Astronomy Observatory’s Green Bank telescope (Figure 8) in West Virginia for receiving lunar radar echoes (Figure 9).
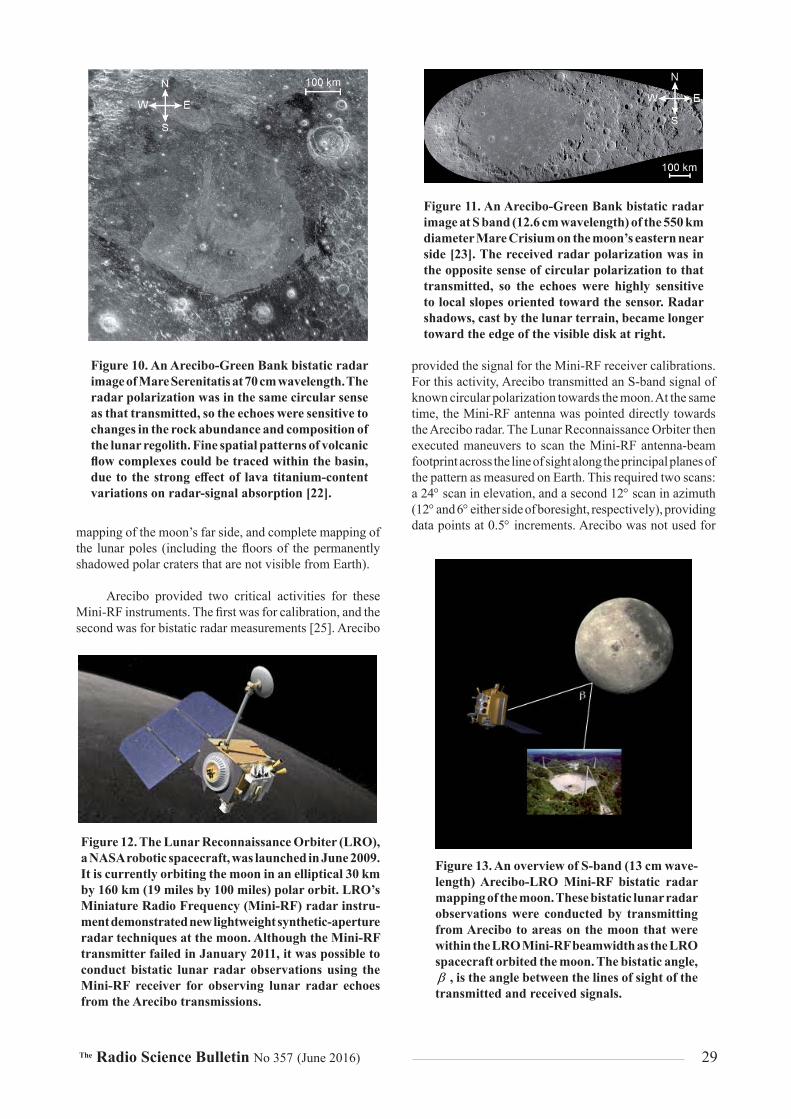
Initial experiments at 430 MHz with an uncoded, 3 s pulse and 17 minute coherence intervals showed that range- and Doppler-focusing could produce maps with 400 m to 600 m spatial resolution. This approach eventually yielded a map of most of the moon’s near side [22]. Ongoing research uses the fi nest 1 μs time resolution of the 70 cm wavelength Arecibo transmitter with about 40 minute coherence intervals to make maps with 200 m spatial resolution, such as that of Mare Serenitatis shown in Figure 10 [23]. Observations at 13 cm wavelength can achieve spatial resolution as fi ne as 20 m per pixel, although the associated 57 minute coherence interval requires the use of auto-focusing methods to refi ne the ephemeris-based estimation of the relative motion of the sensor and selenographic points across the illuminated beam. Regional mapping at S band continues, using the Arecibo system
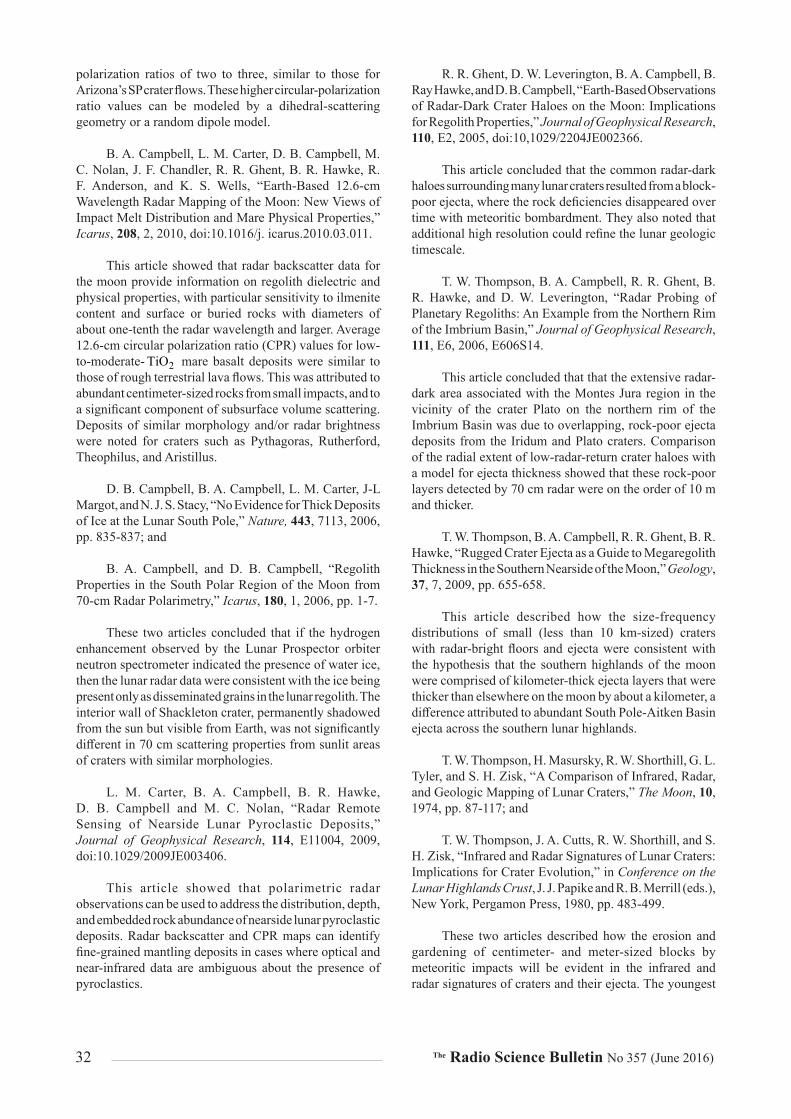
with a 0.2 μsec time resolution and a 29 minute integration period to yield four-look radar images with 80 m spatial resolution, such as that of Mare Crisium shown in Figure 11 [24]. Important scientifi c results of these eff orts include delineation of impact-melt deposits from large craters up to the basin scale, mapping of ancient basalts now hidden by ejecta from the basins, refi nement of mare stratigraphy and volcanic/tectonic history, as well as mapping of volcanic-ash deposits and rugged lava fl ows associated with some of the moon’s most unusual geologic features.
4. Recent Lunar-Reconnaissance Orbiter Mini-RF Bistatic
Observations
Recently, another type of lunar radar mapping has been achieved using spacecraft radars. In the late 2000s, NASA launched two lightweight synthetic-aperture radars (SARs) to the moon as part of the Mini-RF project. The fi rst SAR fl ew on the Indian Space Research Organisation’s (ISRO’s) Chandrayaan-1 lunar orbiter, while the second operated on NASA’s Lunar Reconnaissance Orbiter (LRO, Figure 12). Both instruments operated at 2380 MHz (12.6 cm wavelength), and the Lunar Reconnaissance Orbiter instrument also operated at 7140 MHz (4.2 cm wavelength). Collectively, they successfully mapped more than two thirds of the lunar surface, including the fi rst SAR
Figure 8. The Robert C. Byrd Green Bank Radio Telescope is the world’s largest fully steerable radio telescope, with an aperture diameter of 300 feet (92 m). It is located at the National Radio Astronomy Observa-tory (NRAO), Green Bank, West Virginia, USA. The antenna beamwidth at 70 cm is 33 arc-minutes, and 5 arc-minutes at 13 cm. For comparison, the moon’s angular diameter is 30 arc-minutes to 33 arc-minutes. Figure 9. An overview of bistatic observations
of the moon with the Arecibo (transmitter) and Green Bank (receiver) radio telescopes. Note that the Arecibo antenna’s beamwidths of 10 arc-minutes at 430 MHz (70 cm wavelength) and 2 arc-minutes at 2380 MHz (13 cm wavelength) were suffi cient to resolve the intrinsic north-south ambiguity in delay-Doppler mapping.
The Radio Science Bulletin No 357 (June 2016) 29
mapping of the moon’s far side, and complete mapping of the lunar poles (including the fl oors of the permanently shadowed polar craters that are not visible from Earth).
Arecibo provided two critical activities for these Mini-RF instruments. The fi rst was for calibration, and the second was for bistatic radar measurements [25]. Arecibo
provided the signal for the Mini-RF receiver calibrations. For this activity, Arecibo transmitted an S-band signal of known circular polarization towards the moon. At the same time, the Mini-RF antenna was pointed directly towards the Arecibo radar. The Lunar Reconnaissance Orbiter then executed maneuvers to scan the Mini-RF antenna-beam footprint across the line of sight along the principal planes of the pattern as measured on Earth. This required two scans: a 24 scan in elevation, and a second 12 scan in azimuth (12 and 6 either side of boresight, respectively), providing data points at 0.5 increments. Arecibo was not used for
Figure 10. An Arecibo-Green Bank bistatic radar image of Mare Serenitatis at 70 cm wavelength. The radar polarization was in the same circular sense as that transmitted, so the echoes were sensitive to changes in the rock abundance and composition of the lunar regolith. Fine spatial patterns of volcanic fl ow complexes could be traced within the basin, due to the strong eff ect of lava titanium-content variations on radar-signal absorption [22].
Figure 11. An Arecibo-Green Bank bistatic radar image at S band (12.6 cm wavelength) of the 550 km diameter Mare Crisium on the moon’s eastern near side [23]. The received radar polarization was in the opposite sense of circular polarization to that transmitted, so the echoes were highly sensitive to local slopes oriented toward the sensor. Radar shadows, cast by the lunar terrain, became longer toward the edge of the visible disk at right.
Figure 12. The Lunar Reconnaissance Orbiter (LRO), a NASA robotic spacecraft, was launched in June 2009. It is currently orbiting the moon in an elliptical 30 km by 160 km (19 miles by 100 miles) polar orbit. LRO’s Miniature Radio Frequency (Mini-RF) radar instru-ment demonstrated new lightweight synthetic-aperture radar techniques at the moon. Although the Mini-RF transmitter failed in January 2011, it was possible to conduct bistatic lunar radar observations using the Mini-RF receiver for observing lunar radar echoes from the Arecibo transmissions.
Figure 13. An overview of S-band (13 cm wave-length) Arecibo-LRO Mini-RF bistatic radar mapping of the moon. These bistatic lunar radar observations were conducted by transmitting from Arecibo to areas on the moon that were within the LRO Mini-RF beamwidth as the LRO spacecraft orbited the moon. The bistatic angle, , is the angle between the lines of sight of the transmitted and received signals.

30 The Radio Science Bulletin No 357 (June 2016)
the Mini-RF transmitting calibration. The Greenbank radio telescope was instead used, as it could directly receive horizontal and vertical polarizations, whereas Arecibo received only circular polarizations.
The second activity was a bistatic radar mapping of the lunar surface. Here, the bistatic angle, , is the angle between the lines of sight of the transmitted and received signals (see Figure 13). When the same antenna is used for both transmitting and receiving, is zero. For bistatic observations where both antennas are on the Earth (e.g., Arecibo-Green Bank), is very small, 0.35 . By using Arecibo as the transmitter, and Mini-RF on the Lunar Reconnaissance Orbiter in lunar orbit as the receiver, the fi rst-ever planetary bistatic-angle images were obtained. Measuring how the circular polarization ratio (CPR) varied as a function of provided a unique method to discriminate between rocks and buried ice deposits. Figure 14 shows an Arecibo-Lunar Reconnaissance Orbiter bistatic radar image of crater Kepler and surrounding Oceanus Procellarum.
5. Salient Global Features of Lunar Radar Scattering
To understand these Arecibo lunar radar observations, we examine the average backscatter behavior of the moon as described by the average radar cross section per unit surface area, a dimensionless quantity that varies with the angle of incidence, as shown in Figure 15. Here, the angle of incidence of 0 is at the center of the lunar disk, and 90 is at the limb as viewed from Earth. Hagfors [26] tabulated these radar cross section values for wavelengths of 3.8 cm, 23 cm, and 68 cm, based on the earlier measurements of Evans and Pettengill [6]. These radar cross sections were obtained using the usual Earth-based radar confi guration, where circularly polarized waves were transmitted and received to obviate the adverse eff ects of Faraday rotation of linearly polarized waves in the Earth’s ionosphere.
The values given by Hagfors [26] were for opposite-sense circular (OC) echoes, the polarization for mirror refl ections from large, fl at surfaces that are oriented perpendicular to the radar’s line-of-sight. Average radar echoes in the same-sense circular (SC) polarization have been shown to be proportional to the cosine of the angle of incidence ( ), with values such that the ratio of stronger opposite-sense-circular to weaker same-sense-circular echoes is two at the limb, as observed in the 1960s lunar
radar experiments performed by the Massachusetts Institute of Technology [6], as well as at 13 cm wavelength by Campbell [27]. Observed average opposite-sense-circular, polarized echoes have an angular dependence where the echoes fall precipitously from angles of incidence of 0 to about 20 to 30, then gradually diminish to 70°, and then fall precipitously again from 70° to 90 at the limb. Observed same-sense-circular, depolarized echoes diminish gradually, with a cosine-like dependence, from angles of incidence of 0 for the center of the disk to 90 at the limb.
Evans and Hagfors [28] showed that the lunar radar echoes can be interpreted as consisting of specular and diff use components, as shown in Figure 15. The specular component results from mirror-like echoes from large (10 radar wavelengths, or more) surfaces, which are fl at to one-tenth of the radar wavelength and oriented perpendicular to the radar’s line-of-sight. As the lunar surface is gently undulating with root mean square (rms) slopes on the order of 2 to 4 in the maria and 6 to 8 in the terra [29], the specular scattering from the surface-regolith interface contribute only to the opposite-sense-circular echoes with strengths that decrease sharply with angle of incidence. For angles of incidence beyond about 35, the opposite-sense-circular echoes have a 1.5cos dependence. Thompson et al. [30] showed that the subsurface layers of crater ejecta observed in Apollo core-tube data could create average opposite-sense-circular cross sections with this 1.5cos dependence.
The diff use component is attributed to scattering from wavelength-sized (one-tenth to 10 wavelengths) rocks, either on the surface or subsurface up to the radar’s penetration depth, which is on the order of 10 wavelengths in the maria and up to 40 wavelengths in terra [31]. We also note that as slopes modulate lunar-radar echoes – so that areas tilted toward the radar have stronger echoes and areas tilted away from the radar have weaker echoes – the radar images of the moon appear similar to visual photographs of sunlit terrains.
Other salient global features of lunar radar scattering at 430 MHz (70 cm wavelength) are shown in Figures 5, 7, and 10. The strongest same-sense-circular (SC), depolarized, echoes are associated with the large young craters such as Aristarchus, Copernicus, Kepler, Langrenus, Theophilus, and Tycho, where echo strengths are on average an order-of-magnitude stronger than their environs. Opposite-sense-circular (OC) polarized echoes for these large young craters
Figure 14. Arecibo-LRO Mini-RF bi-static 13 cm wavelength observations of crater Kepler, a 32 km diameter Copernican crater in Oceanus Pro-cellarum: (a) The Stokes parameter S1, total power; (b) bistatic angle; (c) circular polarization ratio, CPR.

The Radio Science Bulletin No 357 (June 2016) 31
vary, depending upon their location with respect to the center of the lunar disk. For Copernicus, which is observed at low angles of incidence near the center of the disk, polarized echoes are only three times stronger than its environs. Aristarchus and Langrenus, which are nearer the lunar limb, have opposite-sense-circular echo enhancements slightly smaller than the same-sense-circular echo enhancements.
Echo enhancements for other craters depend upon their ages, with the young Copernican and middle-aged Eratosthenian craters having notable echo enhancements, while older Nectarian craters have no echo enhancements. This is attributed to meteoritic gardening of the lunar surface, a process that wears away at the excess wavelength-sized rock populations associated with the younger craters [32, 33]. These salient features of 430 MHz (70 cm wavelength) lunar radar echoes are also seen in the near-global 40 MHz, (7.5 m wavelength) image shown in Figure 6b, which shows the mare-terra diff erences, as well as an echo enhancement for crater Tycho. Similar radar-echo diff erences for these younger lunar craters were observed in the 2380 MHz frequency (13 cm wavelength) Arecibo-Green Bank and Arecibo-Lunar Reconnaissance Orbiter Mini-RF bistatic experiments.
The terra backscatter same-sense circular depolarized echoes are also two to four times stronger than mare echoes. This is attributed to higher electrical losses in the fi rst few meters of the lunar maria, resulting from higher concentrations of iron and titanium [31]. This can be seen in Figure 2b, where the echoes for the beam position on Oceanus Procellarum are less than the average for the eight beam positions around the disk of the moon. Similar mare-terra radar echo diff erences were observed in Arecibo-Green Bank and Arecibo-Lunar Reconnaissance Orbiter Mini-RF bistatic experiments at 2380 MHz frequency (13 cm wavelength).
6. Scientifi c Results and Annotated Bibliography
The scientifi c legacy of the Arecibo lunar radar observations is illustrated here by citing a number of journal articles based on Arecibo lunar radar measurements. These articles are:
B. A. Campbell, “Planetary Geology with Imaging Radar: Insights from Earth-based Lunar Studies, 2001-2015,” Publications of the Astronomical Society of the Pacifi c, 128, 2016, doi:10.1088/1538-3873/128/964/062001.
This paper traced these developments through a case study of lunar observations over the past 15 years, and their implications for ongoing and future solar-system radar studies. During the period, advances in computing power and imaging techniques also allowed Earth-based radar experiments to acquire data at the highest spatial resolutions permitted by their transmitter systems. The interpretation of radar echoes from the moon and planets has dramatically changed. These changes include development of polarimetric scattering models developed through lunar radar observations, terrestrial fi eld measurements, and airborne radar studies.
B. A. Campbell, B. R. Hawke, and T. W. Thompson, “Regolith Composition and Structure in the Lunar Maria: Results of Long Wavelength Radar Studies,” Journal of Geophysical Research, 102, E8, 1997, pp. 19307-19320.
This article showed that the majority of the radar scatter from the lunar maria comes from Mie scattering by rocks buried in the regolith, and that scattering from a buried substrate does not greatly aff ect radar echo strengths.
B. A. Campbell, “High Circular Polarization Ratios in Radar Scattering from Geologic Targets,” Journal of Geophysical Research, 117, E06008, 2012, doi:10.1029/2012JE004061.
This article examined the occurrence of circular-polarization ratios (CPRs) greater than unity in terrestrial and planetary observations as a guide to associated surface morphologies. Lunar-crater deposits have circular-
Figure 15. The interpretation of lunar radar backscatter as the sum of inferred specular and diff use echoes, as hypothesized by Evans and Hagfors [28]. The specular component is associated with the echoes for large smooth (10 radar wavelengths or more) areas that are fl at to one-tenth of the radar wavelength, and are oriented perpendicular to the radar’s line-of-sight. The dif-fuse component is associated with the scattering from wavelength-sized (one-tenth to 10 wavelengths) rocks, either on the surface or subsurface up to the radar’s penetration depth (on the order of 10 wavelengths in the maria, and up to 40 wavelengths in terra). Thompson et al. [30] showed that specular scattering from subsurface layers of crater ejecta can generate high-angle opposite-sense-circular (OC) echoes that vary with the angle of incidence, , as 1.5cos .
32 The Radio Science Bulletin No 357 (June 2016)
polarization ratios of two to three, similar to those for Arizona’s SP crater fl ows. These higher circular-polarization ratio values can be modeled by a dihedral-scattering geometry or a random dipole model.
B. A. Campbell, L. M. Carter, D. B. Campbell, M. C. Nolan, J. F. Chandler, R. R. Ghent, B. R. Hawke, R. F. Anderson, and K. S. Wells, “Earth-Based 12.6-cm Wavelength Radar Mapping of the Moon: New Views of Impact Melt Distribution and Mare Physical Properties,” Icarus, 208, 2, 2010, doi:10.1016/j. icarus.2010.03.011.
This article showed that radar backscatter data for the moon provide information on regolith dielectric and physical properties, with particular sensitivity to ilmenite content and surface or buried rocks with diameters of about one-tenth the radar wavelength and larger. Average 12.6-cm circular polarization ratio (CPR) values for low-to-moderate- 2TiO mare basalt deposits were similar to those of rough terrestrial lava fl ows. This was attributed to abundant centimeter-sized rocks from small impacts, and to a signifi cant component of subsurface volume scattering. Deposits of similar morphology and/or radar brightness were noted for craters such as Pythagoras, Rutherford, Theophilus, and Aristillus.
D. B. Campbell, B. A. Campbell, L. M. Carter, J-L Margot, and N. J. S. Stacy, “No Evidence for Thick Deposits of Ice at the Lunar South Pole,” Nature, 443, 7113, 2006, pp. 835-837; and
B. A. Campbell, and D. B. Campbell, “Regolith Properties in the South Polar Region of the Moon from 70-cm Radar Polarimetry,” Icarus, 180, 1, 2006, pp. 1-7.
These two articles concluded that if the hydrogen enhancement observed by the Lunar Prospector orbiter neutron spectrometer indicated the presence of water ice, then the lunar radar data were consistent with the ice being present only as disseminated grains in the lunar regolith. The interior wall of Shackleton crater, permanently shadowed from the sun but visible from Earth, was not signifi cantly diff erent in 70 cm scattering properties from sunlit areas of craters with similar morphologies.
L. M. Carter, B. A. Campbell, B. R. Hawke, D. B. Campbell and M. C. Nolan, “Radar Remote Sensing of Nearside Lunar Pyroclastic Deposits,” Journal of Geophysical Research, 114, E11004, 2009, doi:10.1029/2009JE003406.
This article showed that polarimetric radar observations can be used to address the distribution, depth, and embedded rock abundance of nearside lunar pyroclastic deposits. Radar backscatter and CPR maps can identify fi ne-grained mantling deposits in cases where optical and near-infrared data are ambiguous about the presence of pyroclastics.
R. R. Ghent, D. W. Leverington, B. A. Campbell, B. Ray Hawke, and D. B. Campbell, “Earth-Based Observations of Radar-Dark Crater Haloes on the Moon: Implications for Regolith Properties,” Journal of Geophysical Research, 110, E2, 2005, doi:10,1029/2204JE002366.
This article concluded that the common radar-dark haloes surrounding many lunar craters resulted from a block-poor ejecta, where the rock defi ciencies disappeared over time with meteoritic bombardment. They also noted that additional high resolution could refi ne the lunar geologic timescale.
T. W. Thompson, B. A. Campbell, R. R. Ghent, B. R. Hawke, and D. W. Leverington, “Radar Probing of Planetary Regoliths: An Example from the Northern Rim of the Imbrium Basin,” Journal of Geophysical Research, 111, E6, 2006, E606S14.
This article concluded that that the extensive radar-dark area associated with the Montes Jura region in the vicinity of the crater Plato on the northern rim of the Imbrium Basin was due to overlapping, rock-poor ejecta deposits from the Iridum and Plato craters. Comparison of the radial extent of low-radar-return crater haloes with a model for ejecta thickness showed that these rock-poor layers detected by 70 cm radar were on the order of 10 m and thicker.
T. W. Thompson, B. A. Campbell, R. R. Ghent, B. R. Hawke, “Rugged Crater Ejecta as a Guide to Megaregolith Thickness in the Southern Nearside of the Moon,” Geology, 37, 7, 2009, pp. 655-658.
This article described how the size-frequency distributions of small (less than 10 km-sized) craters with radar-bright fl oors and ejecta were consistent with the hypothesis that the southern highlands of the moon were comprised of kilometer-thick ejecta layers that were thicker than elsewhere on the moon by about a kilometer, a diff erence attributed to abundant South Pole-Aitken Basin ejecta across the southern lunar highlands.
T. W. Thompson, H. Masursky, R. W. Shorthill, G. L. Tyler, and S. H. Zisk, “A Comparison of Infrared, Radar, and Geologic Mapping of Lunar Craters,” The Moon, 10, 1974, pp. 87-117; and
T. W. Thompson, J. A. Cutts, R. W. Shorthill, and S.
H. Zisk, “Infrared and Radar Signatures of Lunar Craters: Implications for Crater Evolution,” in Conference on the Lunar Highlands Crust, J. J. Papike and R. B. Merrill (eds.), New York, Pergamon Press, 1980, pp. 483-499.
These two articles described how the erosion and gardening of centimeter- and meter-sized blocks by meteoritic impacts will be evident in the infrared and radar signatures of craters and their ejecta. The youngest

The Radio Science Bulletin No 357 (June 2016) 33
craters have enhanced infrared eclipse temperatures and radar echoes. As these craters age, the enhancements diminish and disappear. The infrared and short (4 cm) radar enhancements disappear fi rst, followed by long wavelength (70 cm) radar enhancement.
7. Concluding Remarks
Radar mapping/imaging of the moon has progressed through a series of resolution improvements over the years, as shown in Table 1. The best resolutions at 70 cm wavelength are now a hundred times better than those of the fi rst 1964 observations, and the best resolutions at 13 cm wavelength are a thousand times better.
In broader terms, planetary radar studies pioneered in the 1960s with our nearest celestial neighbor, the moon, have evolved signifi cantly over the intervening decades. Planetary radar studies have become a very eff ective means of providing a wealth of data on the surface geology of the moon, as well as of Venus, Mars, and the asteroids. Both Earth-based and space-borne radar studies of Venus, Mars, and the asteroids have further demonstrated the great potential of the planetary radar studies.
8. Acknowledgment
The Associate Editor thanks D. B. Campbell and S. Kesaraju for their valuable and expert assistance in reviewing this article.
9. Appendix 1
Here, we provide a description of one of the key elements in delay-Doppler mapping of the moon and other planetary bodies. This is the limb-to-limb diff erence in Doppler frequencies as observed at the radar. It is convenient to use a radar-observer Cartesian coordinate system, shown in Figure 3, where the y axis is aligned with an apparent axis of rotation, the z axis is along the radar’s line-of-sight, and the x axis completes the triad. The z axis intersects the moon’s surface at the sub-radar point, the point that appears to the radar to be at the center of the lunar disk. This sub-radar point is described by a longitude, l' , and a latitude, b' , quantities that vary slowly with time. The moon’s natural librations generate a diff erence of about 7° in l' and about 5° in b' over the moon’s 27 day orbital period. In addition, the motion of the radar on the rotating Earth generates diff erences of about 2° in 12 hours. The locations of l' and b' move across the surface with velocities of the order of 2 m/s.
The formulae that describe this, as given in Thompson [10] and shown in Figure 3, are:
2 2
a xd yd , (1)
ddxdb't
, (2)
dcos
dydl'b't
, (3)
d arctan xd
yda
, (4)
where a is the total apparent rotation rate of the moon,xd is the apparent rotation about the radar-observer x
axis, yd is the apparent rotation about the radar-observer y axis, and da is the angle between the moon’s apparent and true axes of rotation as observed at the radar.
The apparent spin of the moon creates a velocity diff erence between the approaching and receding limbs of the moon. This in turn creates a frequency spread that is characterized by the limb-to-limb Doppler shift, given by
2 4ll af v R , (5)
where llf is the limb-to-limb Doppler shift between the approaching and receding limbs, v is the velocity diff erence between the approaching and receding limbs of the moon, is the radar wavelength, a is the apparent angular spin rate of the moon, and R is the radius of the moon (1738 km).
Once the apparent angular spin rate has been determined, the radar-echo delay and Doppler frequency can be located in the , ,d d dx y z coordinate system by
2d llx f f , (6)
2 21d d dy x z , (7)
1 11,595dz d , (8)

34 The Radio Science Bulletin No 357 (June 2016)
where f is the off set in Doppler frequency from that of the center of the moon, and d is the delay beyond the fi rst echo from the moon in microseconds. Note that dx is positive toward moon’s east limb, and negative toward its west limb. Also, dy is positive toward the north and negative toward the south. The , ,d d dx y z coordinate system is normalized so that the lunar radius equals unity. Once the echoes are located in the , ,d d dx y z coordinate system, their location in selenographic coordinates (latitude and longitude) can be determined as described by Thompson [10].
10. Acknowledgements
The authors, as well as all of the users of the Arecibo radar/radio telescope, are deeply indebted to William E. Gordon for his ingenuity and steadfast perseverance that led to the construction of this world-class facility. The authors are also indebted to Gordon Pettengill and Donald Campbell, who pioneered radar-astronomy studies with this facility. The accom plishments since the 1960s reported here were also enabled by the dedication and perseverance of the technical staff of the Arecibo and Green Bank Observatories. The dedication and perseverance of the technical staff of the Lunar Reconnaissance Orbiter Mission and Lunar Reconnaissance Orbiter Mini-RF Instrument made the recent novel Arecibo-Lunar Reconnaissance Orbiter bistatic observations possible. NASA support from the mid-1960s to the present enabled all of the radar observations described here. Two anonymous reviewers are acknowledged for their insightful comments and suggestions. Our colleagues, Eugene Ustinov as well as JPL documentarians Roger Carlson and Mary Young provided invaluable help in preparing this paper.
Preparation of this document was supported at the Jet Propulsion Laboratory, California Institute of Technology, under a contract with the National Aeronautics and Space Administration.
11. References
1. W. E. Gordon, “Incoherent Scattering of Radio Waves by Free Electrons with Applications to Space Exploration by Radar,” Proceedings of the Institute of Radio Engineers, 46, 1958, pp. 1824-1829.
2. M. H. Cohen, “Genesis of the 1000-Foot Arecibo Dish,” Journal of Astronomical History and Heritage, 12, 2, 2009, pp. 141-152.
3. D. Mathews, “Fifty Years of Radio Science at Arecibo Ob-servatory: A Brief Overview,” URSI Radio Science Bulletin, 346, 2013, pp. 12-16.
4. J. H. Dewitt, Jr., and E. K. Stodola, “Detection of Radio Sig-nals Refl ected from the Moon,” Proceedings of the Institute of Radio Engineers, 37, 3, 1949, pp. 229-242, doi:10.1109/JRPROC.1949.231276.
5. Kovacs, Laszlo, “Zoltan Bay and the First Moon-Radar Experi-ment in Europe (Hungary, 1946),” Science and Education, 7, 3, pp. 313-316.
6. J. V. Evans and G. H. Pettengill, “The Scattering Behavior of the Moon at Wavelengths of 3.6, 68 and 784 Centimeters,” Journal of Geophysical Research, 68, 2, 1963, pp. 423-447, doi:10.1029/JZ068i002p00423.
7. R. M. Goldstein, Radar Exploration of Venus, PhD Thesis, California Institute of Technology, Pasadena, California, 1962.
8. P. E. Green, Jr., “Radar Astronomy Symposium Report,” R. Leadabrand (ed.), Journal of Geophysical Research, 65, 1960, pp. 1108-1115.
9. G. H. Pettengill and J. C. Henry, “Enhancement of Radar Refl ectivity Associated with Lunar Crater Tycho,” Journal of Geophysical Research, 67, 12, 1962, pp. 4881-4885.
10. J. M. Saarri and R. W. Shorthill, “Isotherms of Crater Regions on the Illuminated and Eclipsed Moon,” Icarus, 2, 1963, pp. 115-1363.
11. J. D. Mathews, “A Short History of the Geophysical Radar at Arecibo Observatory,” History of Geo- and Space Sciences, 4, 1, 2013, pp. 9-33, doi:10.5194/hgss-4-19-2013.
12. T. W. Thompson, A Study of Radar-Scattering Behavior of Lunar Craters at 70 cm, PhD Thesis, Research Report RS 64, Center for Radiophysics and Space Research, Cornell University, Ithaca, New York, 1965.
13. G. P. Kuiper, Photographic Lunar Atlas, Chicago, University of Chicago Press, 1960.
14. L. A. Schimerman (ed.), The Lunar Cartographic Dossier, NASA-CR 1464000, Defense Mapping Agency, Aerospace Center, St. Louis, MO, 1973; available at Lunar and Planetary Institute LAC Web site http://www.lpi.usra.edu/resources/mapcatalog/LAC/.
15. T. W. Thompson, “Atlas of Lunar Radar Maps at 70 cm Wavelength,” The Moon, 10, 1974, pp. 51-85.
16. T. W. Thompson, “High-Resolution Lunar Radar Map at 70 cm Wavelength,” Earth, Moon and Planets, 37, 1987, pp. 59-70.
17. A. E. E. Rodgers and R. P. Ingalls, “Radar Mapping of Venus with Interferometric Resolution of the Range-Doppler Ambi-guity,” Radio Science, 5, 1970, pp. 425-433.
18. T. W. Thompson, “Map of Lunar Refl ectivity at 7.5-Meter Wavelength,” Icarus, 13, 3, 1970, pp. 365-370.
19. T. W. Thompson, “High-Resolution Lunar Radar Map at 7.5 Meter Wavelength,” Icarus, 36, 1978, pp. 174-188.
20. N. Stacy, “High Resolution Synthetic Aperture Radar Obser-vations of the Moon,” PhD Thesis, Cornell University, 1993.
21. J. L. H. Webb, D. C. Munson, and N. J. S. Stacy, “High-Resolution Planetary Imaging via Spotlight-Mode Synthetic Aperture Radar,” IEEE Transactions on Image Processing, 7, 1998, pp. 1571-1582.
22. A. Campbell, D. B. Campbell, J. L. Margot, R. R. Ghent, M. Nolan, J. Chandler, L. M. Carter, and N. J. S. Stacy, “Focused 70-cm Radar Mapping of the Moon,” IEEE Transactions on Geoscience and Remote Sensing, 45, 12, 2007, pp. 4032-4042, doi:10.1109/TGRS.2007.906582.

The Radio Science Bulletin No 357 (June 2016) 35
23. B. A. Campbell, B. R. Hawke, G. A. Morgan, L. M. Carter,D. B. Campbell, and M. Nolan, “Improved Discrimination of Volcanic Complexes, Tectonic Features, and Regolith Properties in Mare Serenitatis from Earth-based Radar Mapping,” Journal of Geophysical Research, 119, 2014, doi:10.1002/2013JE004486.
24. B. A. Campbell, L. M. Carter, D. B. Campbell, M. Nolan, J. Chandler, R. R. Ghent, B. R. Hawke, R. F. Anderson, and K. Wells, “Earth-based 12.6-cm Wavelength Radar Mapping of the Moon: New Views of Impact Melt Distribution and Mare Physical Properties,” Icarus, 208, 2, 2010, pp. 565-573, doi:10.1016/j.icarus.2010.03.011.
25. G. W. Patterson, et al. “Mini-RF on LRO and AreciboObservatory Bistatic Radar Observations of the Moon,” 46th Lunar and Planetary Science Conference, 2888, 2015.
26. T. Hagfors, “Remote Probing of the Moon By Infrared and Microwave Emissions and By Radar,” Radio Science, 5, 2, 1970, pp. 189-227. doi:10.1029/RS005i002p00189.
27. B. A. Campbell, “High Circular Polarization Ratios in Radar Scattering from Geologic Targets,” Journal of Geophysical Research, 117, 2012, E06008, doi:10.1029/2012JE004061.
28. J. V. Evans, and T. Hagfors, “On the Interpretation of Radar Refl ections From the Moon,” Icarus, 3, 2, 1964, pp. 151-160, doi:10.1016/0019-1035(64)90056-9.
29. G. L. Tyler, and H. T. Howard, “Dual-Frequency Bistatic-Radar Investigations of the Moon with Apollos 14 and 15,” J. Geophys. Res., 78, 23, 1973, pp. 4852-4874, doi:10.1029/JB078i023p04852.
30. T. W. Thompson, E. A. Ustinov, and E. Heggy, “Modeling Radar Scattering From Icy Lunar Regoliths at 13 cm and 4 cm Wavelengths,” Journal of Geophysical Research, 116, 2011, E01006, doi:10.1029/2009JE003368.
31. B. A. Campbell, and B. R. Hawke, “Radar Mapping of Lunar Cryptomaria East of Orientale Basin,” Journal of Geophysical Research, 110, 2005, E09002, doi:10.1029/2005JE002425.
32. T. W. Thompson, H. Masursky, R. W. Shorthill, G. L. Tyler, and S. H. Zisk, “A Comparison of Infrared, Radar, and Geologic Mapping of Lunar Craters,” The Moon, 10, 1, 1974, pp. 87-117.
33. T. W. Thompson, J. A. Cutts, R. W. Shorthill, and S. H. Zisk, “Infrared and Radar Signatures of Lunar Craters: Implica-tions for Crater Evolution,” in J. J. Papike and R. B. Merrill (eds.), Conference on the Lunar Highlands Crust, New York, Pergamon Press, 1980, pp. 483-499.