radio-frequency ion thrusters power measurement and power
TRANSCRIPT
Radio-Frequency Ion ThrustersPower
Measurement and Power Distribution Modeling
Published in Journal of Propulsion and Power, DOI: 10.2514/1.B36868
C. Volkmara, C. Geileb, and K. Hannemannc
Spacecraft Department, Institute of Aerodynamics and Flow Technology,
German Aerospace Center, Bunsenstrasse 10, 37073 Goettingen, Germany
We present a methodology to measure the power delivered to sustain an inductive
plasma discharge inside radio-frequency ion thrusters. This measurement is performed
in real time near the coil within the resonant circuit using a patented low-noise radio-
frequency voltage and current sensor system. With knowledge of the actual forwarded
power, the eciency of the generator under consideration, including the power feed
cable, is assessed in real time. The variation of the power-to-thrust ratio can thus
be understood more clearly since its value is given by physical changes of the plasma
properties as well as the quality of the impedance bridge between the generator and
plasma load. The latter can directly be determined by the proposed methodology,
while the inuence of the plasma parameters on the power-to-thrust ratio is obtained
by means of a numerical model that is used in postprocessing to assess the power
distribution within the thruster.
I. Introduction
Electric propulsion is now of substantial interest for modern space ight. The applicationspectrum of electric thrusters ranges from the station keeping and orbit raising of satellites tointerplanetary space ight [13].With the appearance of all-electric communication satellites, theimportance of electric propulsion has recently moved farther into the foreground, primarily due toits superior mass usage eciency compared to chemical propulsion. Those satellite platforms alsooer enough power on the spacecraft to release the full potential of electric propulsion in terms ofpropulsive force [4].
Electric propulsion assemblies are constituted by the thruster itself and several peripheral de-vices supplying it with propellant, power, and operational signaling. Those devices are often com-bined in dedicated power supply and control units PSCUs [5]. Performance optimization strategiesare therefore ideally implemented at the assembly level, which gradually transforms the historicallyrather scientic view of those thrusters to a systems engineering view.
With this work, we want to introduce an approach that helps us to better understand theinteraction of radio-frequency (RF) ion thrusters (RITs), electric thrusters of particular interest forthis work, with their radio-frequency generators (RFGs). The RFG is a crucial part of the PSCUof a RIT assembly, but there is little information available, if any at all, that describes the impactthe two systems have on each other. In our approach, we want to make it clear that the RFG hasa signicant inuence on the overall power balance of a RIT assembly.
A. State of the Art
Radio-frequency generators used for RITs are typically composed of a half-bridge topology,which is operated in the near-resonant mode around 1− 2 MHz [6]. The actual choice of operatingfrequency f is a function of the inductive discharge parameters and thus the dimensions of the coiland plasma chamber d. Roughly, an antiproportional correlation can be assumed; i.e., f ∝∼ 1/d. The
a Electric propulsion test facility engineer, [email protected] Electric propulsion test facility technician, [email protected] Head of Spacecraft Department, [email protected]

(a) (b)
Fig. 1 a) Typical diagram of a RIT powered within a resonant circuit and b) comparison ofpurely ohmic matched and bridged impedances.
thruster itself is composed of the previously mentioned induction coil, which is typically wrappedaround a cylindrical, trapezoidal, or hemispherical discharge chamber. Additionally, a set of eithertwo or three extraction grids is attached to the discharge vessel and used for electrostatic ionextraction. More details on the design of a RIT can be found in [7,8].
A basic propulsive system assembly includes the thruster and the PSCU, which is subdividedinto the RFG, a DC power supply for the RFG, a mass ow controller, and DC power supplies forpositive high voltage (PHV) and negative high voltage (NHV) for the extraction grid system. TheRFG is attached to the antenna coil surrounding the thruster using a coaxial or triaxial feeding cable.In this conguration, the thruster is driven within a resonant circuit consisting of the inductanceof the thruster LRIT, an equivalent ohmic resistance RRIT that includes plasma, coil wire and eddycurrent losses, and a series capacitance Cres that is part of the output stage of the RFG. The controllogic of the RFG is based on a phase-locked-loop/frequency-lockedloop scheme that tends to switchone of the transistors when the current measured in the return line is near zero, as depicted in Fig.1a. This method is referred to as zero-current switching and is used to eciently transfer powerto a load if the source has small output resistance [9]. This methodology is known as impedancebridging and enables transfer eciency greater 0.5; i.e., η = PRF/PDC > 0.5. In contrast toimpedance matching, which is commonly used in 50 Ohm-RF systems with η ≈ 0.5, it is possibleto overcome severe power loss within the generator in the bridging mode [10]. Figure 1b showsthe quantitative comparison of both operating regimes. The impedances will be exactly matched ifRsource = Rload, given that both load and source impedances show only ohmic behavior. In the caseof Rsource < Rload, as indicated in the gure by the shaded area, the impedances are bridged. Thisimplies that the transferred power is not at its maximum, which enables power transfer eciencygreater than 0.5. Impedance bridging is sometimes referred to as loading reduction [11].
B. Proposed Methodology
Since the load of the previously dened resonant circuit is dened by the plasma parameters itcomprises a highly dynamic behavior if the thruster is driven in dierent operational modes, e.g.,transition from low- to high-thrust mode. Depending on the relation RRIT/R, with R denotingthe output resistance of the generator including the RF cable, the eciency of the power couplingwill be aected, which ultimately leads to power loss in the generator/cable. Since most scientistsand engineers only refer to the power drawn from the DC supply PDC, it can be misleading whenassessing performance data of the thrusters such as the power-to-thrust ratio (PTTR).
Here, we want to dierentiate between the DC power and the actual RF power that is forwardedto the thruster to sustain the plasma discharge at given points of operation by means of phase-
2

Input
Setupgeometry
Initialvalues
Chargeconserv.
Testable?
Boundaryconditions
EM model Energyconserv.
χstable? Extraction
modelParticleconserv.
pstable? Impedance
modelPerform.
model
y y y
n n n
Fig. 2 Flow chart of the numerical model. It consists of three conservation equations (charge,energy, and mass conservation) that are iteratively brought to convergence.
resolved power measurement. The experimental setup and the methodology are described in Sec.III in more detail. The accurate power measurement was achieved by an Impedans Poly OctivVIsensor that is available commercially. This device has the advantage of low insertion loss andthus a minimal impact on the resonant circuit itself. Previous attempts, such as presented in [12],always suered from unstable latency and phase shift between voltage and current sensors andhence exhibited large error bars if the experiments were not conducted in thermal equilibrium. It isevident that this is not always possible due to dierent processes such as mode transitions or eventhe diurnal thermal cycle.
With the experimentally measured RF power, a direct statement about coupling eciency ispossible with
η =PRF
PDC. (1)
The remaining power PDC − PRF = (1− η)PDC is lost within the generator and feeding cable andcurrently cannot be divided any further. However, since the semiconductor junction resistance iscommonly known from data sheets, an approximate relation of the losses may be deduced fromthat. Here, however, we will instead focus on the power transferred to the thruster with the aidof numerical modeling. With this model, which is explained in more detail in Sec. II, we canfurthermore divide PRF into several channels of loss. Those are typically wire and eddy currentloss, ionization and excitation loss, wall ux and sheath potential loss, and elastic, Coulomb, andstochastic collision losses.With this methodology, it is therefore possible to exactly reveal the powerdistribution of the complete assembly, which is considered very valuable for optimizing systemperformance and creating input parameters for thermal analyses that additionally aim to increasethe system quality.
II. Model Overview
A ow chart of the model developed is shown in Fig. 2. In the following, the model is introduced,including a description of its working principle, basic assumptions used, and the most importantfeatures for the actual study. The input into the model is given by the working point parameters ofthe thruster; i.e., propellant mass ow V in standard cubic centimeters per minute (sccm), voltagesfor the screen grid Vscr, and acceleration grid Vacc, respectively, extracted ion beam current Ib, andneutral gas (and thruster housing) temperature Tn. All other important quantitites, such as coilcurrent, applied frequency, and plasma parameters, are calculated within the model. The model'scomplete architecture and other detailed information can be found in [13,14].
The assumptions made within the proposed model correspond to those used within the vastmajority of volume-averaged models [1521] that mostly follow Lee and Lieberman's [22] approach,at least to a certain extent. Those assumptions are summarized as follows.
The cold gas approximation is used; i.e., neutrals and ions are assumed to be in thermal equilib-rium with the wall temperature (Tn = Ti = Tw). This is due to the typically low ionization fractionin inductively coupled discharges as well as the high elementary weight of the xenon ions, whichare commonly used as propellant, that makes them practically invariant to the quickly oscillatingelectric eld induced by the coil.
Electrons are assumed to have a Maxwellian distribution in phase space. Therefore, the electrontemperature can be used to express the mean kinetic energy of the electrons. The plasma is assumed
3

to be quasi-neutral within the bulk region; i.e., ne = ni. This is, however, not true in the sheatharea where ni > ne. The sheath area is not resolved in the electromagnetic part of this code.
Only singly charged xenon ions are assumed. Because of the low electron temperature (typicallyin the area of 2− 5 eV), the chance to have electrons reach the second ionization potential of xenonis very small. No secondary electron emission from the surfaces touching the plasma is assumed dueto the low mean electron temperature.
The pre-sheath region is not included in the electromagnetic model. That region is necessaryfor pre-acceleration of ions toward the sheath in order to give them enough kinetic energy to reachthe Bohm velocity at the sheath edge. Otherwise, they would not be able to surpass the potentialbarrier. In the code, ions at the sheath edge are assumed to have reached the Bohm velocityuB = (kTe/mi)
1/2 instantaneously, with k denoting Boltzmann's constant and mi denoting the ionicmass.
The following collisions are taken into account: elastic electron-neutral collisions, elasticelectron-ion collisions, elastic ion-neutral collisions, inelastic electron-neutral collisions (excitationand ionization), and stochastic collisions as dened in [15].
Electron heating in the H mode only is assumed due to comparably high degrees of ionization[17]. Typically, an inductive discharge is sustained by both capacitive and inductive heating, goingfrom the E mode toH mode with an increasing degree of ionization (which is caused by an increasingcoil current). The degree of ionization is still low, typically in the order of 10−4 − 10−2, regardlessof the actual heating mode of the discharge. Because of the assumption of explicit H mode heating,the electrical behavior of the plasma load is represented by an inductive-ohmic impedance.
All of these assumptions apply for the plasma model, which is regarded as the core of theself-consistent treatment. The self-consistent solution begins with the input of the axi-symmetricgeometry of the thruster consisting of a discharge chamber, an extraction grid system, thrusterhousing, and other conducting parts within the assembly. In axi-symmetric systems, ∂/∂φ = 0holds true, with φ denoting the azimuthal component.
A. Charge Conservation
First, a charge conservation equation that relates the volume ionization rate to the loss of chargeto the walls is solved:
Kiznn =uB
deff(2)
In this equation, Kiz denotes the Maxwellian-averaged rate constant for ionization, and deff denotesthe eective bulk plasma size that is iteratively calculated with an analytic expression for the plasmasheath thickness. After convergence, the mean Maxwellian electron temperature can be obtainedanalytically. The cross-sections for the collisions are taken from [23,24].
B. Energy Conservation
Energy conservation is achieved if the deposited electromagnetic power in the plasma, which iscalculated by the electromagnetic model, equals the power lost to collisions:
1
2
˚V
∣∣∣E∣∣∣2 Reκp dV = Pcoll (3)
In this Eq. (3), E denotes the induced electric eld. The link between the plasma and electromag-netic model is given by the conductivity κp, which again is determined by the plasma parameters:
κp ≈ε0ω
2pe
ν2en,eff + ω2
eff
(νen,eff − iωeff) (4)
In this equation, ε0 denotes the vacuum permittivity and ωpe denotes the electron plasma frequency;i.e., the collective response of electrons to the excitation by electric elds. Furthermore, νen,eff
denotes the eective electron-neutral collision frequency, which is given by νen,eff = νen + νei + νstoc,and ωeff the electron eective RF oscillation frequency. This eective frequency slightly diers from
4

the applied RF due to electron kinetic processes. The eective frequency is calculated following anapproach described in [25].
C. Electromagnetic Coupling
The governing equation within the electromagnetic model is the time-harmonic quasi-stationarydiusion equation [26]:
∇×(
1
µ∇× A
)+ iωκA + Js = 0 (5)
This is assumed valid for RITs because the wavelength of the applied current signal through thecoil is typically orders of magnitude larger than the coil wire. Therefore, radiation will only playa minor role. In this equation, A denotes the phasor of the vector potential eld, Js denotes thephasor of the source current density eld, and µ = µ0µr denotes the permeability, with the vacuumpermeability µ0 and the relative permeability µr, of the media within the simulation domain. Inthe axisymmetric representation, only the azimuthal component of the vector potential eld is ofinterest, leading to A = Aφuφ, with uφ denoting the unit vector in the azimuthal direction. Theconductivity is dened per Eq. (4) in plasma regions. Conductivities of metallic structures are alsoimplemented as a function of material and temperature, following the relation
κ (T ) =1
ρ0 [1 + α (T − T0)], (6)
with ρ0 denoting the electrical resistivity at temperature T0 and α denoting an empirical t param-eter. Information on both can be found for various metals in many databases, e.g., provided by theNational Institute of Standards and Technology. For this study, the temperatures of the dischargevessel, the neutral gas, and all metallic structures except the induction coil are xed at 100 C or120 C, depending on the extracted beam current. There are four temperature sensors attached tosignicant structural points of the thruster that verify these values. The induction coil is activelywater cooled at 10 C. This is taken into account in the model. The conductivity is assumed to beisotropic; no magnetic connement is modeled.
The solver for the vector potential is based on a nite-dierence representation of Eq. (5), whichis not further explained in this paper. Since the presheath region is not modeled, there is no scalarpotential distribution, which in reality exists due to ambipolar diusion, and the electric eld canbe calculated from
Eφ = −iωAφ. (7)
The magnetic ux density eld in axi-symmetric coordinates is given by:
B =
(Aφr
+∂Aφ∂r
)uz −
∂Aφ∂z
ur (8)
The induced eddy currents (in the plasma as well as in other conducting media) are furthermoreobtained by Ampère's law:
Jind =∂Hr
∂z− ∂Hz
∂r(9)
The displacement current term is neglected due to quasi-stationary time dependence of the elds.With the axi-symmetric representation, high resolution in the r−z plane is achievable. Features
such as the impact of the skin and proximity eect in the coil wire can thus be taken into account,while the model can still be run on a standard desktop computer. The skin eect is caused bythe current density in the conducting wire, which is induced in the direction opposite of the sourcecurrent density. In contrast to that, the proximity eect is, in principle, the skin eect mutuallycaused in adjacent coil windings. It is almost impossible to nd analytic solutions for the impactof the proximity eect if nonideal geometries are considered, as is the case here due to the thruster
5
housing and the plasma that both consist of conductive media that have to be taken into account.Therefore, it is regarded as benecial that the diusion equation intrinsically covers this eect bymeans of the lossy media term [26]. As a result of those two eects, the resistance of the coil wirewill be aected by current displacement (skin eect) and crowding (proximity eect), which areboth functions of the complex geometry and the applied RF. The resistance of the coil determinesthe coupling eciency from coil to plasma and is thus a very important measure for the performanceof a RIT.
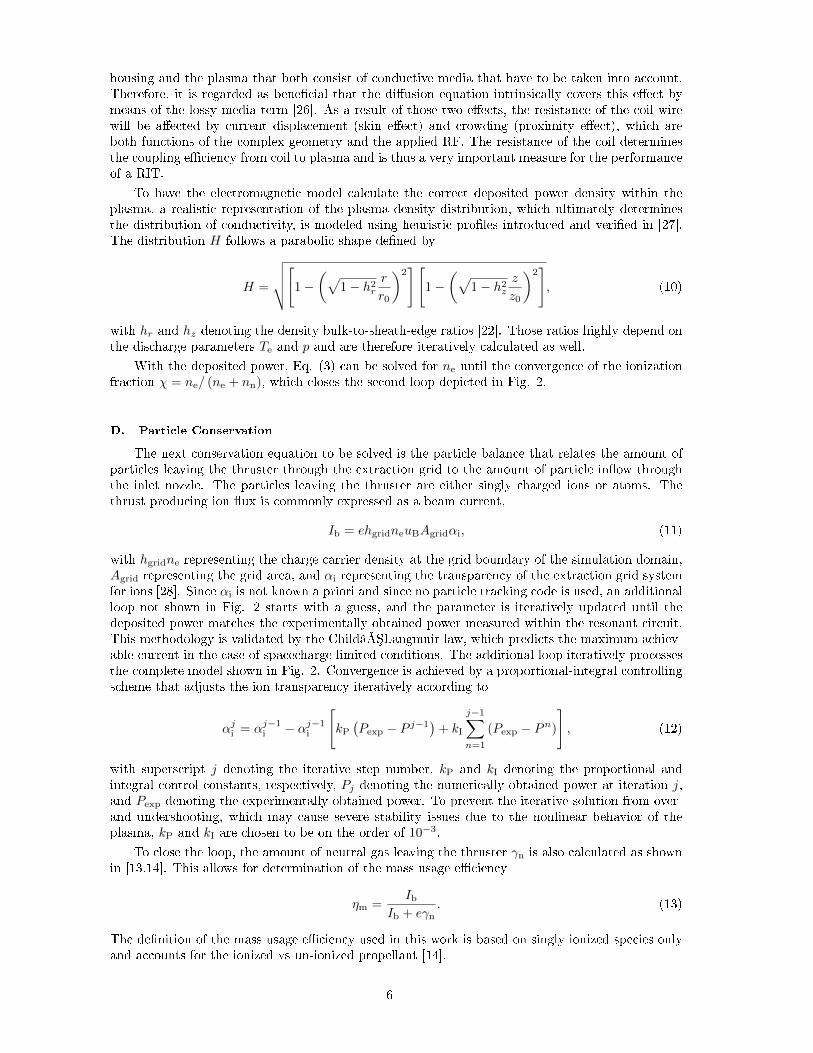
To have the electromagnetic model calculate the correct deposited power density within theplasma, a realistic representation of the plasma density distribution, which ultimately determinesthe distribution of conductivity, is modeled using heuristic proles introduced and veried in [27].The distribution H follows a parabolic shape dened by
H =
√√√√[1−(√
1− h2r
r
r0
)2][
1−(√
1− h2z
z
z0
)2], (10)
with hr and hz denoting the density bulk-to-sheath-edge ratios [22]. Those ratios highly depend onthe discharge parameters Te and p and are therefore iteratively calculated as well.
With the deposited power, Eq. (3) can be solved for ne until the convergence of the ionizationfraction χ = ne/ (ne + nn), which closes the second loop depicted in Fig. 2.
D. Particle Conservation
The next conservation equation to be solved is the particle balance that relates the amount ofparticles leaving the thruster through the extraction grid to the amount of particle inow throughthe inlet nozzle. The particles leaving the thruster are either singly charged ions or atoms. Thethrust producing ion ux is commonly expressed as a beam current,
Ib = ehgridneuBAgridαi, (11)
with hgridne representing the charge carrier density at the grid boundary of the simulation domain,Agrid representing the grid area, and αi representing the transparency of the extraction grid systemfor ions [28]. Since αi is not known a priori and since no particle tracking code is used, an additionalloop not shown in Fig. 2 starts with a guess, and the parameter is iteratively updated until thedeposited power matches the experimentally obtained power measured within the resonant circuit.This methodology is validated by the ChildâLangmuir law, which predicts the maximum achiev-able current in the case of spacecharge limited conditions. The additional loop iteratively processesthe complete model shown in Fig. 2. Convergence is achieved by a proportional-integral controllingscheme that adjusts the ion transparency iteratively according to
αji = αj−1i − αj−1
i
[kP
(Pexp − P j−1
)+ kI
j−1∑n=1
(Pexp − Pn)
], (12)
with superscript j denoting the iterative step number, kP and kI denoting the proportional andintegral control constants, respectively, Pj denoting the numerically obtained power at iteration j,and Pexp denoting the experimentally obtained power. To prevent the iterative solution from over-and undershooting, which may cause severe stability issues due to the nonlinear behavior of theplasma, kP and kI are chosen to be on the order of 10−3.
To close the loop, the amount of neutral gas leaving the thruster γn is also calculated as shownin [13,14]. This allows for determination of the mass usage eciency
ηm =Ib
Ib + eγn. (13)
The denition of the mass usage eciency used in this work is based on singly ionized species onlyand accounts for the ionized vs un-ionized propellant [14].
6

E. Thruster Impedance and Propulsive Performance
After convergence of the conservation equations, the self-consistent loop is nished, and phys-ically meaningful results are obtained. From those converged parameters, the thruster impedancecan be derived. The Poynting theorem for time-harmonic elds, neglecting the radiative term due toa large wavelength compared to the coilâs size, is used to evaluate the lumped circuit elements'values that are used to describe the discharge on a global scale as dened in Fig. 1 [26]:
1
2I∗V =
1
2
˚V
∣∣∣E∣∣∣2 κp dV + 2iω
˚V
(ue − um) dV (14)
In this equation, the asterisk denotes the complex conjugate of a quantity, and ue and um denoteelectric and magnetic energy density, respectively. Those energy densities can be derived from theelectromagnetic elds dened earlier. The resistive and reactive components of the load impedancecan be derived from Eq. (14).
Furthermore, the propulsive performance of the thruster such as thrust and specic impulse canbe obtained from the converged solution. Taking the mean kinetic velocity of neutrals vn and theelectrostatically accelerated velocity of ions vi = (2eVscr/mi)
1/2 and their respective uxes leavingthe thruster into account, and assuming mi ≈ mn, the total thrust is obtained:
T = mi (γivi + γnvn) (15)
The specic impulse can nally be calculated to
Isp =veff
g0, (16)
with the eective exhaust velocity veff = T/mi (γi + γn) and standard gravity g0 [16].
III. Experiment
The experimental setup for in-situ power measurement is schematically shown in Fig. 3. AnOctiv VI probe from Impedans, Ltd., is used. Because of its patented spectrum-averaging method-ology [29], it oers high phase stability and nominal resolution down to 0.01 deg. It, furthermore,oers phase-resolved voltage and current measurement up to several hundred megahertz and exhibitshardly any insertion loss (manufacturer's denition: 0.1 dB) into the circuit under test. Voltageand current signals are collected by capacitive and inductive pickup circuits, respectively, withoutdistorting the RF waveform. The collected signals are digitized in an analog-to-digital converter(ADC) and then processed within the Octiv logic, which is implemented in a eld programmablegate array, facilitating high-speed applications. The logic uses a fast Fourier transform (FFT) toconvert the collected signals to the frequency domain, in which the previously mentioned spectrumaveraging is performed. For that purpose, the time signal is organized into blocks of equal lengths(on the order of microseconds). Each block of data is then processed by the FFT algorithm witha special signal windowing function to reduce spectral spreading. The obtained rms voltage, rmscurrent, phase, forwarded power, and reected power values are then forwarded to a software thatoers several methods of visualization of the data.
Impedans calibrates each device to traceable standards. A detailed description of its standardsof calibration can be found in [30]. The calibration ensures voltage, current, and power measurementaccuracy of ±1 %; frequency accuracy of ±10 kHz; and phase accuracy of ±1 deg.
For validation, a test without the probe was performed before the power measurement. Nochange in thruster performance, i.e., DC power consumption or any other parameters such as thrustand ion beam current, was observed. Additionally, there was no change of the resonant frequencyby the RFG after inserting the probe, which conrms that the probe does not signicantly changethe load. Unfortunately, the RFG is not capable of measuring RF power at its output terminal.Before the experiment, complex dummy loads were powered with the RFG, and the signals weremeasured with the Octiv. The resulting impedances were in excellent agreement with LCR metermeasurements.
The coaxial feed cables slightly change the source and load impedance. However, because ofthe short cable lengths, this eect is assumed negligible for the assessment of power distribution.
7

RFG RF Cable 1
l = 30 cm
A
Octiv VI RF Cable 2
l = 20 cm
Thruster
CresRinLRIT
RRIT
V
Fig. 3 Schematic diagram of the experimental setup. Input and load impedance are slightlyaltered due to parasitic RF cable impedance.
Table 1 Thruster modes for numerical and experimental investigation.
Vscr Vacc Ib
Mode 1: 1800 V −300 V 9.97 mAMode 2: 1800 V −300 V 15.25 mA
The reactance of the RG 213 cables used in this setup is primarily of the inductive type sincethe load is typically driven at around 2 MHz. Hence, 1/ωC ωL, with C denoting the cables'capacitance, which is on the order of several pF m−1, and L denoting their inductance on the order of100 nH m−1 (nanohenries per meter). Based on that, there is substantially no current driven throughthe capacitive shunt. Additionally, ohmic losses are on the order of several mΩm−1 (milliohms permeter), and thus no signicant power consumption of the cables is expected.
Once the RFG has matched the load by tuning its frequency to the resonant frequency
ω0 =1√
(L+ LRIT)Cres
(17)
the reactances cancel each other, leaving only the ohmic components Rin and RRIT. The relationof those resistances determines the power forwarded to the thruster and thus the plasma discharge.The signals within the resonant circuit are continuously captured using the Octiv VI probe. Be-cause of the characteristics of the resonant circuit, the current and the voltage signals' values areamplied with respect to the DC input's values. From those signals, all the important quantitieslike impedance, coupled power, and coupling eciency are derived.
The experiments were performed in the high-vacuum plume test facility for electric thrusters(ET) (STG) at the Spacecraft Department of the German Aerospace Center in Goettingen, Germany.The facility oers realistic environmental conditions for electric thrusters due to its size and theachievable base pressure. The chamber is cylindrical, with 12.2 m in axial length and 5 m indiameter, resulting in a total volume of approximately 230,000 L, taking the curvature of the lidsinto account. A schematic of the chamber is shown in Fig. 4. A detailed description of the facilityincluding thrust, plasma, and ion beam diagnostics is given in [31,32].
The pumping arrangement, consisting of four rough vacuum pumps, four turbo molecularpumps, and ten cryogenic pumps, each 50 cm in diameter, was designed to achieve a base pressure inthe low 10−7 mbar range. The pumping speed on cold xenon gas was approximately 130, 000 L s−1
(liters per second). The pressure gauges were installed symmetrically around the thruster exit assuggested in [33].
The pumping arrangement, consisting of four rough vacuum pumps, four turbo molecular pumpsand ten cryogenic pumps, each 50 cm in diameter, is designed to achieve a base pressure in the low10−7 mbar range. The pumping speed on cold xenon gas is approximately 130, 000 L s−1. Thepressure gauges are installed symmetrically around the thruster exit as suggested in [33].
IV. Results
Two dierent sets of input parameters are investigated here. The parameter sets, correspondingto two modes, are dened by the screen grid voltage Vscr, the acceleration grid voltage Vacc, andthe ion beam current Ib. For each mode, the acceleration grid current Iacc was well below 1 % ofthe screen grid current Iscr, leading to Ib = Iscr − Iacc ≈ Iscr. The modes of thruster operation areshown in Table 1.
8

Venting Valve
Balancing Valve Valve
Roots Pump 2
Electric Valve
Rotary Vane Pump 2 Rotary Vane Pump 1
Roots Pump 1
Electric Valves
Turbo Molecular Pumps
Cryogenic Pumps
Fig. 4 Schematic drawing of the vacuum facility STG ET with pumping layout.
Both the simulation and experiment were performed with those modes. In mode 1, the neutralxenon volumetric inow rate was varied from V = 1 . . . 10 sccm. Because of instabilities at highermass ow, the inow rate in mode 2 was limited to V = 1 . . . 8 sccm.
The thruster used for this work was a RIT-10/37 engine developed by the University of Giessenand distributed by TransMIT, GmbH. It is composed of a discharge chamber with 10 cm in diameterand an extraction system with 37 beamlets. The nominal thrust level of this thruster lies in thelower single-digit millinewton range.
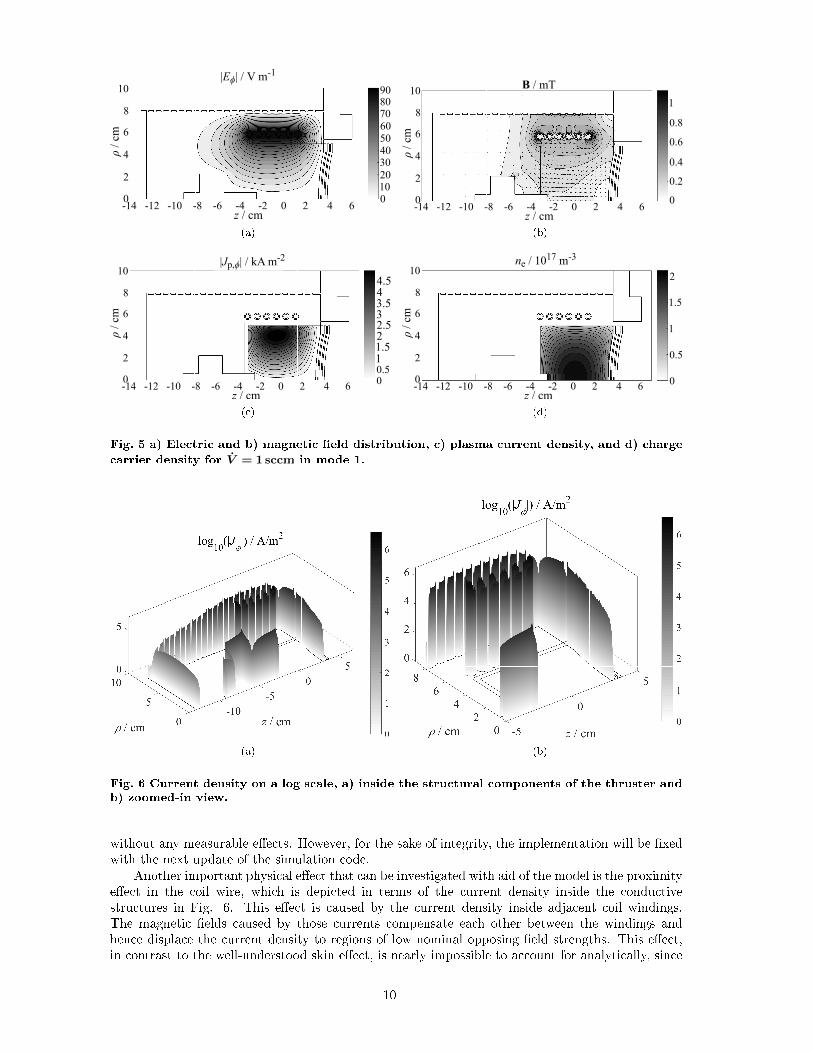
In the following, some numerically obtained results are shown to give an overviewof the plasmaparameters as well as the performance of the thruster. First, the electromagnetic elds and theplasma current and charge carrier density inside the simulation domain are presented in Figs. 5a-5d. A typical simulation result, corresponding to the case of V = 1 sccm in mode 1 is shown.
An inuence of the conductive structures of the thruster on the eld distributions can be ob-served. Especially, the gas inlet, which is composed of solid titanium, seems to have a measurableeect on the electric eld, as depicted in Fig. 5a in terms of the distortion of the eld lines. Theelectric eld does not penetrate into the highly conductive metal. Instead, it is distorted, and eddycurrents are induced at the material's surface. Those inuences will ultimately lead to increasededdy losses and thus alter the power distribution within the thruster.
It is also interesting to study the magnetic eld inside the plasma (Fig. 5b). The magnetic eldlines encircle the peak value of the plasma current density. The peak is localized near the radialwall of the discharge chamber due to the location of the induction coil (Fig. 5c).
The charge carrier density distribution, as depicted in Fig. 5d, follows the parabolic proledened in Eq. (10). A discontinuity at the edge of the gas inlet is observable. This is due to erroneousimplementation of the prole. Specically, the excess length of the gas inlet into the dischargechamber was not taken into account when the shape of the density prole was modeled. However,since this region is not eectively heated by the electromagnetic elds, as can be concluded fromFig. 5c, no substantial impact on the converged solution of the plasma parameters is anticipated.This assumption was proven valid by manually tuning the density values in the corresponding area
9
|Eϕ| / V m-1
z / cm
ρ/ c
m
0
2
4
6
8
10
-14 -12 -10 -8 -6 -4 -2 0 2 4 6
20
40
70
0
60
80
10
30
50
90
(a)
/ cmz
ρ/ c
m
0
2
4
6
8
10
-14 -12 -10 -8 -6 -4 -2 0 2 4 6
B / mT
0.4
0.8
0
0.2
0.6
1
(b)
z / cm
ρ/ c
m
0
2
4
6
8
10
-14 -12 -10 -8 -6 -4 -2 0 2 4 6
|Jp,ϕ| / kA m-2
00.511.522.533.544.5
(c)
z / cmρ
/ cm
0
2
4
6
8
10
-14 -12 -10 -8 -6 -4 -2 0 2 4 6
ne / 1017 m-3
0
0.5
1
1.5
2
(d)
Fig. 5 a) Electric and b) magnetic eld distribution, c) plasma current density, and d) charge
carrier density for V = 1sccm in mode 1.
(a) (b)
Fig. 6 Current density on a log scale, a) inside the structural components of the thruster andb) zoomed-in view.
without any measurable eects. However, for the sake of integrity, the implementation will be xedwith the next update of the simulation code.
Another important physical eect that can be investigated with aid of the model is the proximityeect in the coil wire, which is depicted in terms of the current density inside the conductivestructures in Fig. 6. This eect is caused by the current density inside adjacent coil windings.The magnetic elds caused by those currents compensate each other between the windings andhence displace the current density to regions of low nominal opposing eld strengths. This eect,in contrast to the well-understood skin eect, is nearly impossible to account for analytically, since
10

1 2 3 4 5 6 7 8 9 1 00 . 5 0
0 . 7 5
1 . 0 0
1 . 2 5
1 . 5 0
1 . 7 5
2 . 0 0
Thrus
t / mN
M a s s f l o w / s c c m
T o t a l t h r u s t @ m o d e 2 I o n t h r u s t @ m o d e 2 T h r u s t b a l a n c e @ m o d e 2 T o t a l t h r u s t @ m o d e 1 I o n t h r u s t @ m o d e 1
(a)
1 2 3 4 5 6 7 8 9 1 00
2 5 0
5 0 0
7 5 0
1 0 0 0
1 2 5 0
Speci
fic im
pulse
/ s
M a s s f l o w / s c c m
M o d e 1 M o d e 2
(b)
Fig. 7 (a) Thrust and b) specic impulse of the RIT-10/37 thruster in operation modes 1 and
2. The thrust was measured atV = 3sccm in mode 2.
it is a strong function of geometry. A very realistic current distribution, which again inuences thecoupling of energy from coil to plasma, can be derived with this functionality. It is thus consideredextremely valuable to account for the proximity eect in RIT simulations.
Thrust and specic impulse of modes 1 and 2 are shown in Figs. 7a and 7b, respectively.Aninverted pendulum thrust balance manufactured by Advanced Space Technologies GmbH was usedto measure the thrust at one nominal operating point (V = 3 sccm in mode 2). It shows large errorbars in the lower millinewton range since it was designed for higher thrust levels up to 250 mN [31].It is only used here to perform a plausibility check of the model.
Figure 7a shows the ion thrust for modes 1 and 2, which is held constant by the parametersdened in Table 1. Furthermore, the impact of the neutral gas leaving the thruster can be determinedwith aid of the self-consistent model. The curves show that, especially in areas of low thrust, as isthe case with the RIT-10/37, there is a signicant contribution of neutrals to the overall deliveredthrust. The inuence of the neutral gas ow is also depicted in Fig. 7b in terms of Isp. Thethruster under the test has relatively few extraction apertures and hence is not optimized for highIsp applications as is typically the case for RITs. However, even using this nonideal grid system,an Isp ≈ 2000 s may be achieved by setting the ow rate V < 1 sccm. Unfortunately, the massow controller used for this study showed unstable behavior in this range and could not be used togenerate further data points at the lower ow rates.
The thruster assembly DC power consumption (including generator and RF cables) as well asthe forwarded power at the thruster coil are shown in Fig. 8. It can be seen that at ow rates below2 sccm the forwarded power decreases while the DC input still increases. That is attributed to theimpedance bridge mismatch introduced in Sec. I.A and is regarded as a new design parameter for theassembly of an electric propulsion system based on RIT. Overall, the DC power consumption of a RIT
assembly not only correlates to discharge but also circuit parameters following PDC = f(Iscr, V , η
).
Those parameters again depend on other discharge parameters as shown in Sec. II.The error bars in Fig. 8 are due to measurement inaccuracy of the grid current data acquisition,
which is based on a 10 bit ADC. The resolution of the PHV voltage supply attached to the screengrid is 0.59 mA, which manifests in fairly high uncertainty when going down to low beam currents.With PDC, PRF ∝ Iscr, it follows that ∆PRF ∝ ∆Iscr, with ∆ being the absolute error. Essentially,
the same behavior is seen at the measured resonant coil current IRF =∣∣∣IRF
∣∣∣ = (PRF/RRIT)1/2, as
depicted in Fig. 9.There is an observable deviation between the coil currents calculated by the model and the
measured values that is mainly due to the plasma discharge being modeled using continuummethods.This conclusion is supported by the development of the deviation (dashed lines in Figs. 9a and 9b),which decreases at higher ow rates. The coil current is the most important gure of merit in terms
11

1 2 3 4 5 6 7 8 9 1 01 01 52 02 53 03 54 04 55 05 56 0
DC in
put po
wer /
W
M a s s f l o w / s c c m
M o d e 2 M o d e 1
(a)
1 2 3 4 5 6 7 8 9 1 01 01 52 02 53 03 54 04 55 05 56 0
Forw
arded
power
/ W
M a s s f l o w / s c c m
M o d e 2 M o d e 1
(b)
Fig. 8 (a) Measured DC power consumption and (b) measured forwarded RF power.
1 2 3 4 5 6 7 8 9 1 01 . 82 . 02 . 22 . 42 . 62 . 83 . 0 E x p e r i m e n t
M o d e l D e v i a t i o n ( r i g h t a x i s ) M e a n d e v i a t i o n ( r i g h t a x i s )
Coil c
urrent
/ A
M a s s f l o w / s c c m- 1 6- 1 5- 1 4- 1 3- 1 2- 1 1- 1 0
Devia
tion /
%
(a)
1 2 3 4 5 6 7 82 . 02 . 22 . 42 . 62 . 83 . 03 . 23 . 43 . 6 E x p e r i m e n t
M o d e l D e v i a t i o n ( r i g h t a x i s ) M e a n d e v i a t i o n ( r i g h t a x i s )
Coil c
urrent
/ A
M a s s f l o w / s c c m
- 1 6- 1 5- 1 4- 1 3- 1 2- 1 1- 1 0- 9- 8
Devia
tion /
%
(b)
Fig. 9 Experimentally and numerically obtained coil currents for a) mode 1 and b) mode 2.The mean deviation of the model is approximately 13% below the measured values.
of the accuracy of the model. Since the model is adjusted with measured power values, this power(along with the other input parameters) is used to determine the coil current as well as the thrusterresistance RRIT iteratively. At the circuit level, under the assumption of purely ohmic impedance,which holds true because the thruster is driven in resonant mode, Eq. (14) essentially simpliesto P = I2RRIT, with I denoting the coil current. It is therefore very important to have at leastan acceptable agreement of numerically and experimentally obtained current values to justify thecorrect output of the plasma model (charge carrier density and electron temperature), which againare used to correctly determine power distribution and any derived quantities.
Since the coil current is an integral quantity, it does not directly correlate to local power dissipa-tion within the thruster. But it can be related to changes in the plasma, and those can be stimulatedby the input parameters, which aect those local distributions that in turn can be attributed tothe particular terms in Eq. (14). This equation essentially is a conservation equation for electricalenergy.
The Knudsen number Kn = λ/l, with the mean free path between collisions λ and the circum-ference of the discharge chamber l, is also shown in Fig. 10a. The range of data clearly shows thatthe rarecation of gas particles within the discharge lies between absolutely rareed (Kn ≥ 10) andcontinuum (Kn < 0.1). This area is also referred to as the transition regime. Given the simplicity ofthe proposed model and thus the short simulation duration of only a few minutes per data point, the
12

1 2 3 4 5 6 7 8 9 1 00 . 10 . 20 . 30 . 40 . 50 . 60 . 70 . 80 . 9
Knuds
en num
ber
M a s s f l o w / s c c m
M o d e 1 M o d e 2
(a)
1 2 3 4 5 6 7 810-3
10-2
10-1
100
101
102
DC inputOverallforwardedExcitationWall andsheathIonizationEddy currentCoil wireElasticcollisionStochasticcollisionCoulombcollision
Pow
er d
istr
ibut
ion
/ W
Mass flow / sccm
2
3
4
3
5
66
7
9
8
10
7
8
9
10
1 1
2
4
5
(b)
Fig. 10 a) Knudsen numbers for modes 1 and 2 and b) the power distribution for mode 2.
deviation is acceptable. More accurate results could be obtained by using a free molecular kinetictype of code like DSMC [34]. This would imply long simulation times and is thus not the scope ofthis work because simulation duration is considered a crucial aspect for engineering purposes.
The power distribution within the thruster, including structural losses, is depicted in Fig. 10b.It is observable that a signicant amount of power is lost to excitation processes, especially whengoing to higher mass ows. This behavior is expected due to increasing pressure inside the dischargechamber and hence decreasing mean free length between collisions. At very low pressure, as indicatedin the gure below 2 sccm, the electron energy is high enough to ionize a particle instead of excitingit to a higher energy state. This can happen because electrons can gain sucient energy fromthe accelerating electric eld due to the very large mean free path between collisions. This is alsoobserved in the experiment. The discharge appears darker at lower ow rates. Since the extractednumber of ions is kept constant, as a result, there is less excitation and hence fewer radiativetransitions. For further information, the cross-sections of the corresponding processes should beassessed [23].
It is furthermore expected that eddy current losses inside the thruster might be higher in reality.Since the geometric representation is merely an approximation of the actual thruster, some featureslike screws, sharp edges, and other irregularities are not considered at the moment. In the nextrelease, the model will be updated to be capable of importing CAD drawings, which is anticipatedto describe structural losses more realistically.
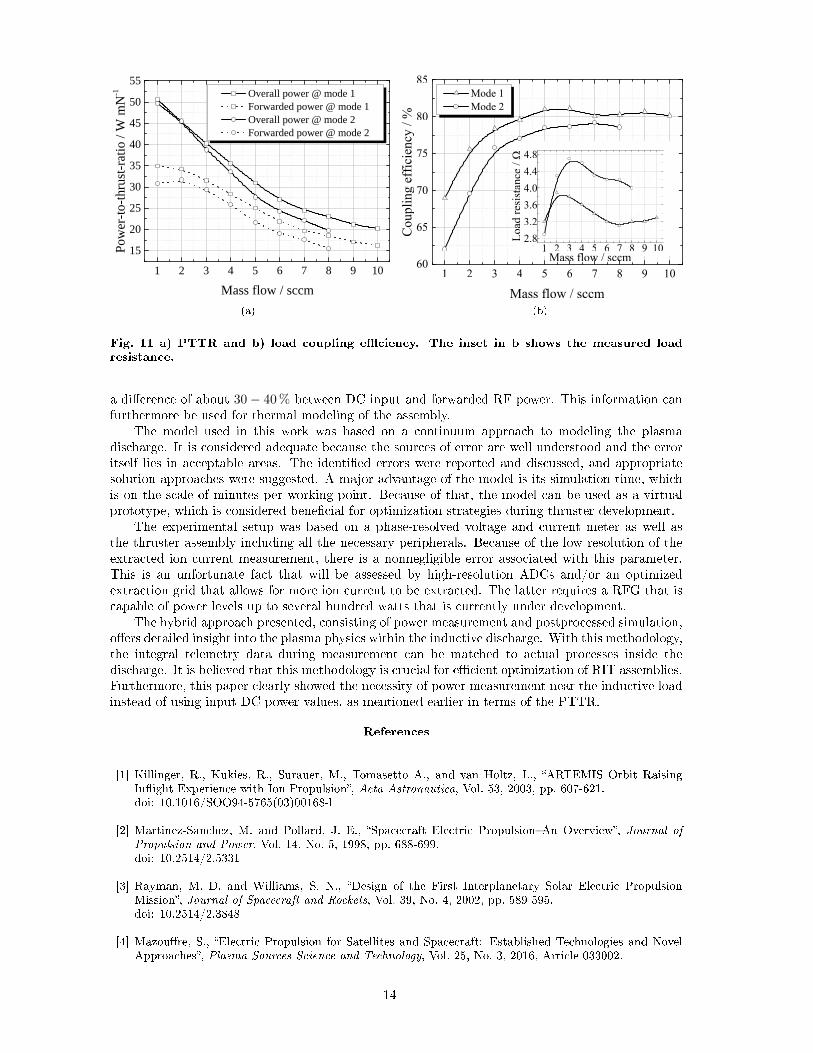
The numerically obtained thrust from Fig. 7a together with the measured forwarded and DCpower are used to introduce the PTTR in Fig. 11a. It can be seen that the PTTR in case of DCpower increases with lower mass ows. In contrast to that, the PTTR based on the actual forwardedpower decreases with decreases in mass ow. This is due to the aforementioned mismatch of theimpedance bridge between the RFG and thruster. Figure 11b shows this mismatch in terms ofcoupling eciency. As can be observed in the inset, the resistance of the load strongly decreaseswhen approaching low mass ow rates. This decrease leads to an electrically adverse relation betweensource and load resistance, which again results in power loss within the generator.
V. Conclusion
This paper presented a concise approach based on experimental and numerical studies to distin-guish between power absorption at the assembly and the thruster level. The power consumption ofthe assembly, prominently consisting of the thruster, the RFG, and feeding cables, has to be inter-preted with great care due to eects like impedance bridge mismatch. Power lost to this channel isoften attributed to eects inside the thruster, or the plasma, and thus may lead to miscalculation ofactual thruster performance. An applicable example is given by the PTTR. This paper showed that,especially in areas of low mass ow, which are common in space missions due to longevity, there is
13
1 2 3 4 5 6 7 8 9 1 01 52 02 53 03 54 04 55 05 5
Powe
r-to-th
rust-ra
tio / W
mN-1
M a s s f l o w / s c c m
O v e r a l l p o w e r @ m o d e 1 F o r w a r d e d p o w e r @ m o d e 1 O v e r a l l p o w e r @ m o d e 2 F o r w a r d e d p o w e r @ m o d e 2
(a)
1 2 3 4 5 6 7 8 9 1060
65
70
75
80
85Mode 1Mode 2
Cou
plin
g ef
fici
ency
/ %
Mass flow / sccm
1 2 3 4 5 6 7 8 9 102.8
3.2
3.6
4.0
4.4
4.8
Mass flow / sccm
Loa
d re
sist
ance
/ Ω
(b)
Fig. 11 a) PTTR and b) load coupling eciency. The inset in b shows the measured loadresistance.
a dierence of about 30− 40 % between DC input and forwarded RF power. This information canfurthermore be used for thermal modeling of the assembly.
The model used in this work was based on a continuum approach to modeling the plasmadischarge. It is considered adequate because the sources of error are well understood and the erroritself lies in acceptable areas. The identied errors were reported and discussed, and appropriatesolution approaches were suggested. A major advantage of the model is its simulation time, whichis on the scale of minutes per working point. Because of that, the model can be used as a virtualprototype, which is considered benecial for optimization strategies during thruster development.
The experimental setup was based on a phase-resolved voltage and current meter as well asthe thruster assembly including all the necessary peripherals. Because of the low resolution of theextracted ion current measurement, there is a nonnegligible error associated with this parameter.This is an unfortunate fact that will be assessed by high-resolution ADCs and/or an optimizedextraction grid that allows for more ion current to be extracted. The latter requires a RFG that iscapable of power levels up to several hundred watts that is currently under development.
The hybrid approach presented, consisting of power measurement and postprocessed simulation,oers detailed insight into the plasma physics within the inductive discharge. With this methodology,the integral telemetry data during measurement can be matched to actual processes inside thedischarge. It is believed that this methodology is crucial for ecient optimization of RIT assemblies.Furthermore, this paper clearly showed the necessity of power measurement near the inductive loadinstead of using input DC power values, as mentioned earlier in terms of the PTTR.
References
[1] Killinger, R., Kukies, R., Surauer, M., Tomasetto A., and van Holtz, L., ARTEMIS Orbit RaisingInight Experience with Ion Propulsion, Acta Astronautica, Vol. 53, 2003, pp. 607-621.doi: 10.1016/SOO94-5765(03)00168-l
[2] Martinez-Sanchez, M. and Pollard, J. E., Spacecraft Electric PropulsionAn Overview, Journal ofPropulsion and Power, Vol. 14, No. 5, 1998, pp. 688-699.doi: 10.2514/2.5331
[3] Rayman, M. D. and Williams, S. N., Design of the First Interplanetary Solar Electric PropulsionMission, Journal of Spacecraft and Rockets, Vol. 39, No. 4, 2002, pp. 589-595.doi: 10.2514/2.3848
[4] Mazoure, S., Electric Propulsion for Satellites and Spacecraft: Established Technologies and NovelApproaches, Plasma Sources Science and Technology, Vol. 25, No. 3, 2016, Article 033002.
14
doi: 10.1088/0963-0252/25/3/033002
[5] Hutchins, M., Simpson, H. and Jimenez, J. P., QinetiQ's T6 and T5 Ion Thruster Electric PropulsionSystem Architectures and Performances, Proceedings of the 34th International Electric PropulsionConference, Hyogo-Kobe, Japan, 2015, Proceeding IEPC-2015-131.
[6] Simon, J., Probst, U. and Klar, P. J., Development of a Radio-Frequency Generator for RF IonThrusters, Transactions of the Japan Society for Aeronautical and Space Sciences, Aerospace Technol-ogy, Vol. 14, No. ists30, 2016, Article Pb_33.doi: 10.2322/tastj.14.Pb_33
[7] Leiter, H. J, Loeb, H. W. and Schartner, K.-H., The RIT-15 Ion EnginesA Survey of the PresentState of Radio Frequency Ion Thruster Technology and its Future Potentiality, Third InternationalConference on Spacecraft Propulsion, Cannes, France, 2000, pp. 423-432.
[8] Bassner, H., Killinger, R., Leiter, H. and Mueller, J., Development Steps of the RF-Ion ThrustersRIT, Proceedings of the 27th International Electric Propulsion Conference, Passadena, USA, 2001,Proceeding IEPC-2001-105.
[9] Erickson, R. W. and Maksimovic, D., Fundamentals of Power Electronics, 2nd ed., Springer US, NewYork, USA, 2001.
[10] Bowick, C., Blyler, J. and Ajluni, C., RF Circuit Design, 2nd ed., Newnes, Pennsylvania, USA, 2007.
[11] de Silva, C. W., Sensor Systems: Fundamentals and Applications, CRC Press, Florida, USA, 2016.
[12] Simon, J., Volkmar, C. and Probst, U., High-Precision Power Measurement for Accurate Character-ization of RF Ion Thrusters, Proceedings of the 5th International Conference on Space Propulsion,Rome, Italy, 2016, Proceeding SP2016_3124614.
[13] Volkmar, C. and Ricklefs, U., Implementation and Verication of a Hybrid Performance andImpedance Model of Gridded Radio-Frequency Ion Thrusters, European Physical Journal D, Vol. 69,2015, Article 227.doi: 10.1140/epjd/e2015-60380-4
[14] Volkmar, C., Ricklefs, U. and Klar, P. J., Self-Consistent Numerical 0D/3D Hybrid Modelingof Radio-Frequency Ion Thrusters, Transactions of the Japan Society for Aeronautical and SpaceSciences, Aerospace Technology, Vol. 14, No. ists30, 2016, Article Pb_23.doi: 10.2322/tastj.14.Pb_23
[15] Lieberman, M. A. and Lichtenberg, A. J., Principles of Plasma Discharges and Materials Processing,2nd ed., Wiley, New Jersey, USA, 2005.
[16] Goebel, D. M. and Katz, I., Fundamentals of Electric Propulsion: Ion and Hall Thrusters, 1st ed.,Wiley, New Jersey, USA, 2008.
[17] Chabert, P. and Braithwaite, N. S. J., Physics of Radio-Frequency Plasmas, 1st ed., CambridgeUniversity Press, New York, USA, 2011.
[18] Goebel, D. M., Analytical Discharge Model for RF Ion Thrusters, IEEE Transactions on PlasmaScience, Vol. 36, 2008, pp. 2111-2121.doi: 10.1109/TPS.2008.2004232
[19] Chabert, P., Monreal, J. A., Bredin, J., Popelier, L. and Aanesland, A., Global Model of a Gridded-IonThruster Powered by a Radiofrequency Inductive Coil, Physics of Plasmas, Vol. 19, 2012, Article073512.doi: 10.1063/1.4737114
[20] Tsay, M. M. and Martinez-Sanchez, M., Simple Performance Modeling of a Radio-Frequency IonThruster, Proceedings of the 30th International Electric Propulsion Conference, Florence, Italy, 2007,Proceeding IEPC-2007-072.
[21] Turkoz, E. and Celik, M., 2-D Electromagnetic and Fluid Models for Inductively Coupled Plasmafor RF Ion Thruster Performance Evaluation, IEEE Transactions on Plasma Science, Vol. 42, 2014,
15
pp. 235-240.doi: 10.1109/TPS.2013.2287903
[22] Lee, C. and Lieberman, M. A., Global Model of Ar, O2, Cl2, and Ar/O2 Highdensity PlasmaDischarges, Journal of Vacuum Science and Technology A, Vol. 13, 1995, pp. 368-380.doi: 10.1116/1.579366
[23] Hayashi, M., Bibliography of Electron and Photon Cross Sections with Atoms and Molecules Publishedin the 20th Century Xenon, NIFS, NIFS-DATA-79, 2003.
[24] Hayashi, M., Determination of Electron-Xenon Total Excitation Cross-Sections, from Threshold to100 eV, from Experimental Values of Townsend's α, Journal of Physics D: Applied Physics, Vol. 16,1983, pp. 581-589.doi: 10.1088/0022-3727/16/4/018
[25] Godyak, V. A., Piejak, R. B. and Alexandrovich, B. M., Electron Energy Distribution FunctionMeasurements and Plasma Parameters in Inductively Coupled Argon Plasma, Plasma Sources Scienceand Technology, Vol. 11, 2002, pp. 525-543.doi: 10.1088/0963-0252/11/4/320
[26] Jackson, J. D., Classical Electrodynamics, 3rd ed., Wiley, New Jersey, USA, 1998.
[27] Dobkevicius, M. and Feili, D., A Coupled Performance and Thermal Model for Radio-FrequencyGridded Ion Thrusters, European Physical Journal D, Vol. 70, 2016, Article 227.doi: 10.1140/epjd/e2016-70273-7
[28] Farnell, C. C., Performance and Lifetime Simulation of Ion Thruster Optics, PhD Dissertation,Colorado State University, USA, 2007.
[29] Scullin, P. and Hopkins, M., Analysing RF Signals from a Plasma System, Patent WO 2014016357A3, 2014.
[30] Lennon, J., Poghosyan, T., Gahan, D., Scullin, P. and Hopkins, M. B., Octiv VI Technology -Standards of Calibration, Technical Note [OC04], https://impedans.com/sites/default/files/pdf_downloads/oc04_octiv_vi_technology_-_standards_of_calibration.pdf.
[31] Neumann, A., STG-ET: DLR Electric Propulsion Test Facility, Journal of Large-Scale ResearchFacilities JLSRF, Vol. 3, 2017, Article A108.doi: 10.17815/jlsrf-3-156
[32] Neumann, A., Update on Diagnostics for DLR's Electric Propulsion Test Facility, Procedia Engineer-ing, Vol. 185, 2017, pp. 47-52.doi: 10.1016/j.proeng.2017.03.289
[33] Dankanich, J. W., Walker, M., Swiatek, M. W. and Yim, J. T., Recommended Practice for PressureMeasurement and Calculation of Eective Pumping Speed in Electric Propulsion Testing, Journal ofPropulsion and Power, Vol. 33, No. 3, 2017, pp. 668-680.doi: 10.2514/1.B35478
[34] Bird, G. A., Molecular Gas Dynamics and the Direct Simulation of Gas Flows, 2nd ed., ClarendonPress, Oxford, UK, 1994.
16