radio frequency compatibility of unwanted emissions … · radio frequency compatibility of...
TRANSCRIPT

Report ITU-R RS.2308-0 (09/2014)
Radio frequency compatibility of unwanted emissions from 9 GHz EESS synthetic
aperture radars with the Earth exploration-satellite service (passive), space research service (passive), space research service and radio astronomy service operating in
the frequency bands 8 400-8 500 MHz and 10.6-10.7 GHz, respectively
RS Series
Remote sensing systems
ii Rep. ITU-R RS.2308-0
Foreword
The role of the Radiocommunication Sector is to ensure the rational, equitable, efficient and economical use of the
radio-frequency spectrum by all radiocommunication services, including satellite services, and carry out studies without
limit of frequency range on the basis of which Recommendations are adopted.
The regulatory and policy functions of the Radiocommunication Sector are performed by World and Regional
Radiocommunication Conferences and Radiocommunication Assemblies supported by Study Groups.
Policy on Intellectual Property Right (IPR)
ITU-R policy on IPR is described in the Common Patent Policy for ITU-T/ITU-R/ISO/IEC referenced in Annex 1 of
Resolution ITU-R 1. Forms to be used for the submission of patent statements and licensing declarations by patent
holders are available from http://www.itu.int/ITU-R/go/patents/en where the Guidelines for Implementation of the
Common Patent Policy for ITU-T/ITU-R/ISO/IEC and the ITU-R patent information database can also be found.
Series of ITU-R Reports
(Also available online at http://www.itu.int/publ/R-REP/en)
Series Title
BO Satellite delivery
BR Recording for production, archival and play-out; film for television
BS Broadcasting service (sound)
BT Broadcasting service (television)
F Fixed service
M Mobile, radiodetermination, amateur and related satellite services
P Radiowave propagation
RA Radio astronomy
RS Remote sensing systems
S Fixed-satellite service
SA Space applications and meteorology
SF Frequency sharing and coordination between fixed-satellite and fixed service systems
SM Spectrum management
Note: This ITU-R Report was approved in English by the Study Group under the procedure detailed in
Resolution ITU-R 1.
Electronic Publication
Geneva, 2015
ITU 2015
All rights reserved. No part of this publication may be reproduced, by any means whatsoever, without written permission of ITU.
Rep. ITU-R RS.2308-0 1
REPORT ITU-R RS.2308-0
Radio frequency compatibility of unwanted emissions from 9 GHz EESS
synthetic aperture radars with the Earth exploration-satellite service (passive),
space research service (passive), space research service and radio astronomy
service operating in the frequency bands 8 400-8 500 MHz and 10.6-10.7 GHz,
respectively
(2014)
TABLE OF CONTENTS
Page
1 Introduction .................................................................................................................... 3
2 Characteristics of EESS SAR used in the studies........................................................... 3
3 Analysis of the impact of unwanted emissions of EESS SAR operating around
9 600 MHz on radio astronomy stations operating in the band 10.6-10.7 GHz ............. 6
3.1 Introduction ......................................................................................................... 6
3.2 Characteristics of stations operating in the radio astronomy service (RAS) ...... 6
3.3 Methodology ....................................................................................................... 7
3.3.1 Static analysis ....................................................................................... 7
3.3.2 Dynamic analysis ................................................................................. 8
3.4 Simulation results and discussion ....................................................................... 9
3.5 Additional potential impairments of RAS operations ........................................ 14
3.5.1 Basic assumptions ................................................................................ 14
3.5.2 Detection and blocking by strong ambient signals from outside
the receiver IF bandwidth..................................................................... 14
3.5.3 Non-linear response of RAS receivers to strong signals ...................... 15
3.5.4 Risk of damage to the RAS receiver .................................................... 16
4 Compatibility between EESS (active) around 9 600 MHz and EESS (passive) in
the frequency band 10.6-10.7 GHz ................................................................................. 19
4.1 Introduction ......................................................................................................... 19
4.2 Characteristics of EESS (passive) ...................................................................... 19
4.2.1 Provisions of the EESS (passive) allocation ........................................ 19
4.2.2 Required protection criteria.................................................................. 19
4.2.3 Operational characteristics ................................................................... 19
4.3 Static analysis of the impact of SAR-4 on EESS (passive) ................................ 21
2 Rep. ITU-R RS.2308-0
Page
4.4 Dynamic analysis of the impact of SAR-4 on EESS (passive) .......................... 24
5 Compatibility between EESS (active) and SRS in the frequency band
8 400-8 500 MHz ............................................................................................................ 26
5.1 Introduction ......................................................................................................... 26
5.2 Characteristics of stations operating in the space research service .................... 26
5.3 Static analysis with SRS deep-space earth stations ............................................ 27
5.4 Dynamic analysis with both deep-space and near-Earth SRS ............................ 29
5.5 Proposed interference mitigation techniques ...................................................... 33
5.5.1 Pulse shaping ........................................................................................ 33
5.5.2 Antenna pointing .................................................................................. 33
5.5.3 Filtering ................................................................................................ 34
5.5.4 Selection of frequency sweep and pulse duration ................................ 34
5.5.5 Location of the 600 MHz extension ..................................................... 34
5.5.6 Geographic separation .......................................................................... 35
5.6 Potential saturation and damage of the SRS earth station front end ................... 35
6 Summary and conclusions .............................................................................................. 36
6.1 Conclusions regarding the radioastronomy service (RAS)................................. 36
6.2 Conclusions regarding the EESS (passive) ......................................................... 37
6.3 Conclusions regarding the space research service (SRS) ................................... 37
7 Supporting documents .................................................................................................... 38
Annex A – Pulse shaping methods and their performance ...................................................... 41
Annex B – Abbreviations ......................................................................................................... 47

Rep. ITU-R RS.2308-0 3
1 Introduction
This Report comprises results from studies on unwanted emissions from Earth exploration-satellite
service (EESS) (active) into the radio astronomy service (RAS) and the EESS (passive) in the
frequency band 10.6-10.7 GHz, as well as the space research service (SRS) in the frequency band
8 400-8 500 MHz.
Section 2 provides the assumed characteristics of EESS synthetic aperture radars (SARs) operating
around 9 600 MHz as defined by Recommendation ITU-R RS.2043.
Compatibility studies and results are provided in
– Section 3 on unwanted emissions of EESS SARs operating around 9 600 MHz into RAS
– Section 4 on compatibility studies of EESS (active) with EESS (passive)
– Section 5 on compatibility studies of EESS (active) with SRS
Summary and conclusions for each of the studies are provided in § 6 and referenced documents in
§ 7.
Annex A: Pulse shaping methods and their performance
Annex B: Abbreviations used in this Report
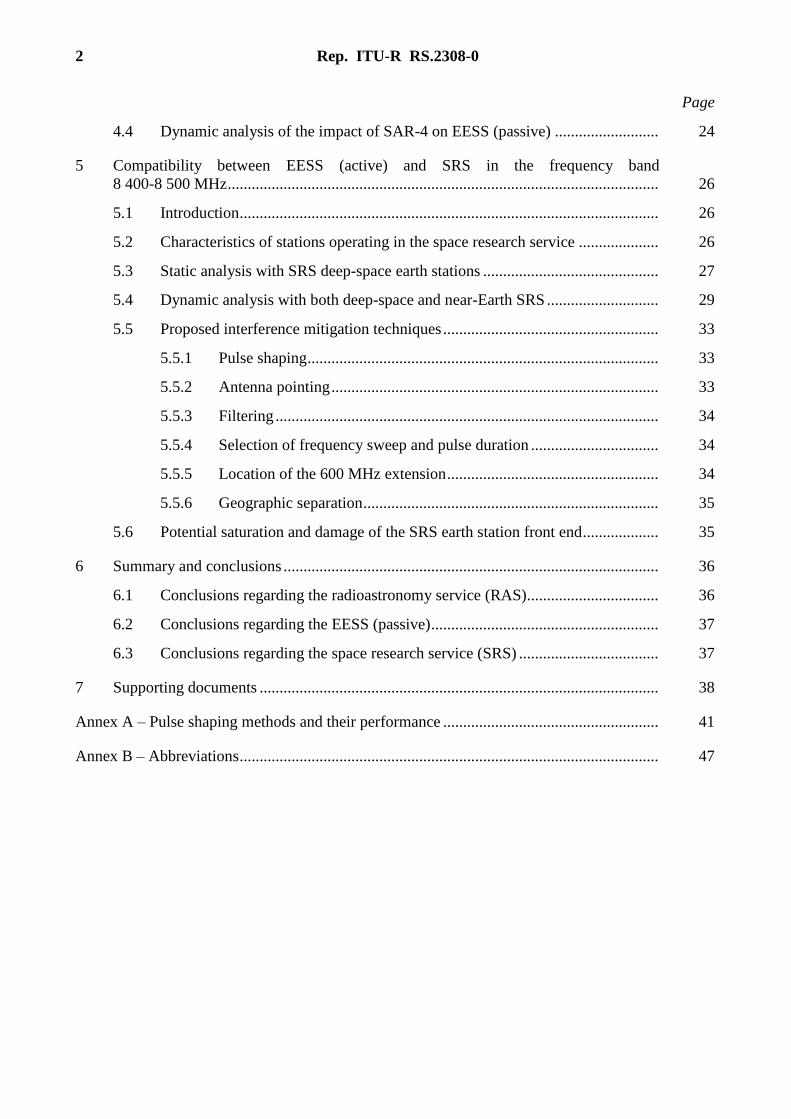
2 Characteristics of EESS SAR used in the studies
Table 1 provides the characteristics of the currently operated SAR-1, SAR-2 and SAR-3 systems as
well as SAR-4 which were taken from Recommendation ITU-R RS.2043. SAR-4 represents a new
generation of SAR systems intending to provide high resolution performance of less than 25 cm
while using transmission chirp bandwidth of up to 1 200 MHz. Figure 1 shows the typical operating
modes of SAR systems in Table 1.
4 Rep. ITU-R RS.2308-0
TABLE 1
Technical characteristics of EESS SAR systems
Parameter SAR-1 SAR-2 SAR-3 SAR-4
Orbital altitude (km) 400 619 506 510
Orbital inclination (degrees) 57 98 98 98
RF centre frequency (GHz) 9.6 9.6 9.6 9.3-9.9*
Peak radiated power (W) 1 500 5 000 25 000 7 000
Pulse modulation Linear FM
chirp
Linear FM
chirp
Linear FM
chirp
Linear FM
chirp
Chirp bandwidth (MHz) 10 400 450 1 200
Pulse duration (s) 33.8 10-80 1-10 50
Pulse repetition rate (pps) 1 736 2 000-4 500 410-515 6 000
Duty cycle (%) 5.9 2.0-28.0 0.04-0.5 30
Range compression ratio 338 < 12 000 450-4 500 60 000
Antenna type Slotted
waveguide
Planar array Planar phased
array
Planar array
Antenna peak gain (dBi) 44.0 44.0-46.0 39.5-42.5 47.0
e.i.r.p. (dBW) 75.8 83.0 83.5-88.5 85.5
Antenna orientation from
Nadir
20° to 55° 34° 20° to 44° 18.5° to 49.3°
Antenna beamwidth 5.5° (El)
0.14° (Az)
1.6-2.3° (El)
0.3° (Az)
1.1-2.3° (El)
1.15° (Az)
1.13° (El)
0.53° (Az)
Antenna polarization Linear vertical Linear HH or
VV
Linear
horizontal/
vertical
Linear
horizontal/
vertical
System noise temperature (K) 551 500 600 500
* Final value depends on the decision eventually taken under WRC-15 agenda item 1.12.
It should be noted that only the technical characteristics of a SAR-4 system have been taken for the
studies since only SAR-4 systems are assumed to transmit with the full bandwidth of up to
1 200 MHz.
Table 2 provides the pattern of a SAR-4 antenna. The antenna patterns of SAR-1 to SAR-3 systems
are defined in Recommendation ITU-R RS.2043.
Rep. ITU-R RS.2308-0 5
TABLE 2
SAR-4 average antenna gain pattern near 9 600 MHz
Pattern Gain G() (dBi) as function of
off-axis angle (degrees) Angular range (degrees)
Vertical (elevation) Gv(v) = 47.0 – 9.91 (v)²
Gv(θv) = 35.189 – 1.944θv
Gv(θv) = 21.043 – 0.468θv
Gv(θv) = 12.562 – 0.185θv
Gv(v) = 3.291
v <1.149
1.149 ≤ v ≤ 9.587
9.587 ≤ v ≤ 29.976
29.976 ≤ v ≤ 50
50.0 ≤ v
Horizontal (azimuth) Gh(h) = 0 –45.53(h)²
Gh(h) = −11.210 – 4.022h
Gh(h) = −26.720 – 0.953h
Gh(h) = −35.031 – 0.388h
Gh(h) = −41.936 – 0.158h
Gh(h) = −51.387
h ≤ 0.542
0.542 <h ≤ 5.053
5.053 <h ≤ 14.708
14.708 <h ≤ 30.00
30.00 <h ≤ 59.915
59.915 <h
Beam pattern G() = Gv(v) + Gh(h)
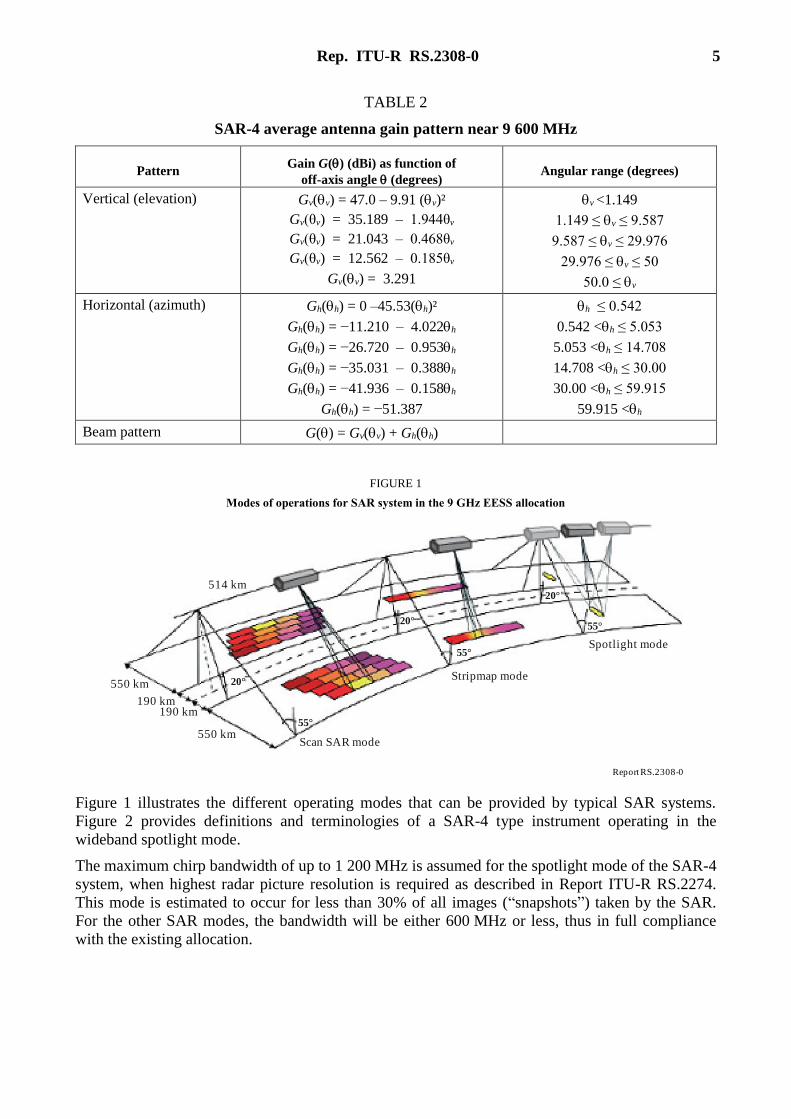
FIGURE 1
Modes of operations for SAR system in the 9 GHz EESS allocation
R pe ort RS.2308-01
Scan SAR mode
Stripmap mode
Spotlight mode
55°
20°
55°
55°
20°
20°
514 km
550 km
190 km190 km
550 km
Figure 1 illustrates the different operating modes that can be provided by typical SAR systems.
Figure 2 provides definitions and terminologies of a SAR-4 type instrument operating in the
wideband spotlight mode.
The maximum chirp bandwidth of up to 1 200 MHz is assumed for the spotlight mode of the SAR-4
system, when highest radar picture resolution is required as described in Report ITU-R RS.2274.
This mode is estimated to occur for less than 30% of all images (“snapshots”) taken by the SAR.
For the other SAR modes, the bandwidth will be either 600 MHz or less, thus in full compliance
with the existing allocation.
6 Rep. ITU-R RS.2308-0
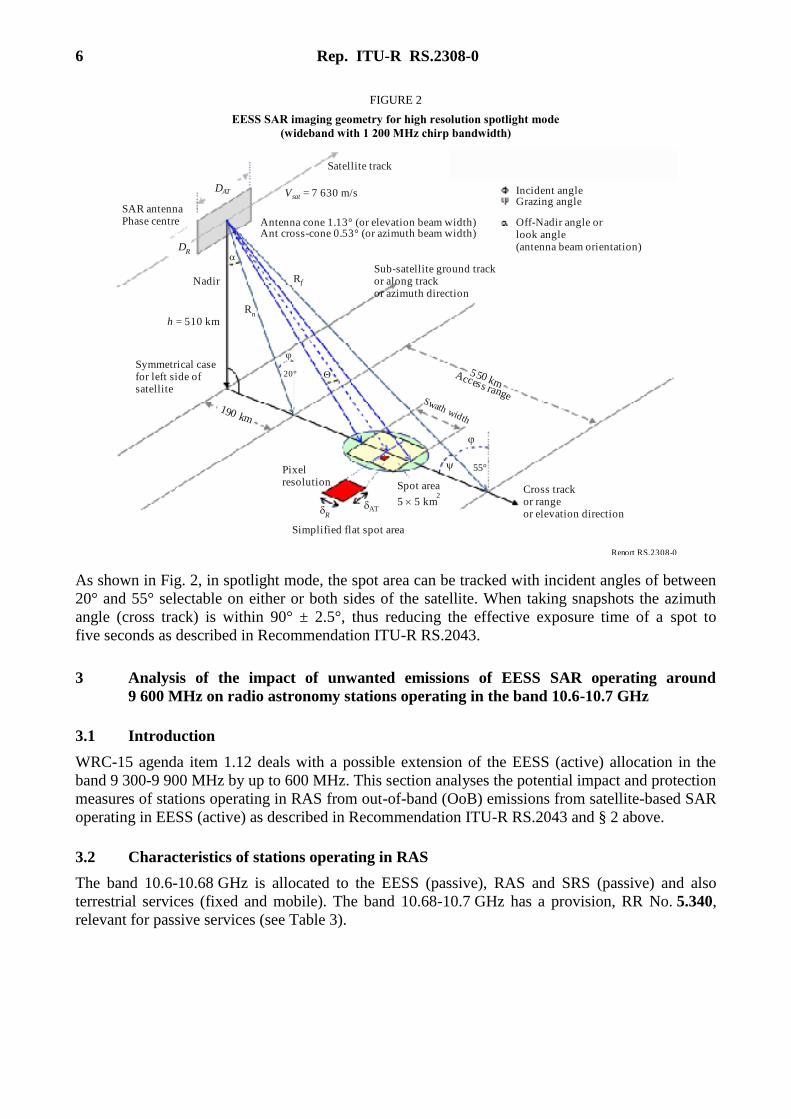
FIGURE 2
EESS SAR imaging geometry for high resolution spotlight mode
(wideband with 1 200 MHz chirp bandwidth)
R pe ort RS.2308-02
Incident angleGrazing angle
Off-Nadir angle orlook angle(antenna beam orientation)
Antenna cone 1.13° (or elevation beam width)Ant cross-cone 0.53° (or azimuth beam width)
SAR antennaPhase centre
Sub-satellite ground trackor along trackor azimuth direction
Symmetrical casefor left side ofsatellite
h = 510 km
Nadir
DR
DAT Vsat = 7 630 m/s
Satellite track
Rn
Rf
R
AT
Cross trackor rangeor elevation direction
Spot area
5 5 km2
Pixelresolution
190 km
550 kmAccess range
Swath width
55°
20°
Simplified flat spot area
As shown in Fig. 2, in spotlight mode, the spot area can be tracked with incident angles of between
20° and 55° selectable on either or both sides of the satellite. When taking snapshots the azimuth
angle (cross track) is within 90° ± 2.5°, thus reducing the effective exposure time of a spot to
five seconds as described in Recommendation ITU-R RS.2043.
3 Analysis of the impact of unwanted emissions of EESS SAR operating around
9 600 MHz on radio astronomy stations operating in the band 10.6-10.7 GHz
3.1 Introduction
WRC-15 agenda item 1.12 deals with a possible extension of the EESS (active) allocation in the
band 9 300-9 900 MHz by up to 600 MHz. This section analyses the potential impact and protection
measures of stations operating in RAS from out-of-band (OoB) emissions from satellite-based SAR
operating in EESS (active) as described in Recommendation ITU-R RS.2043 and § 2 above.
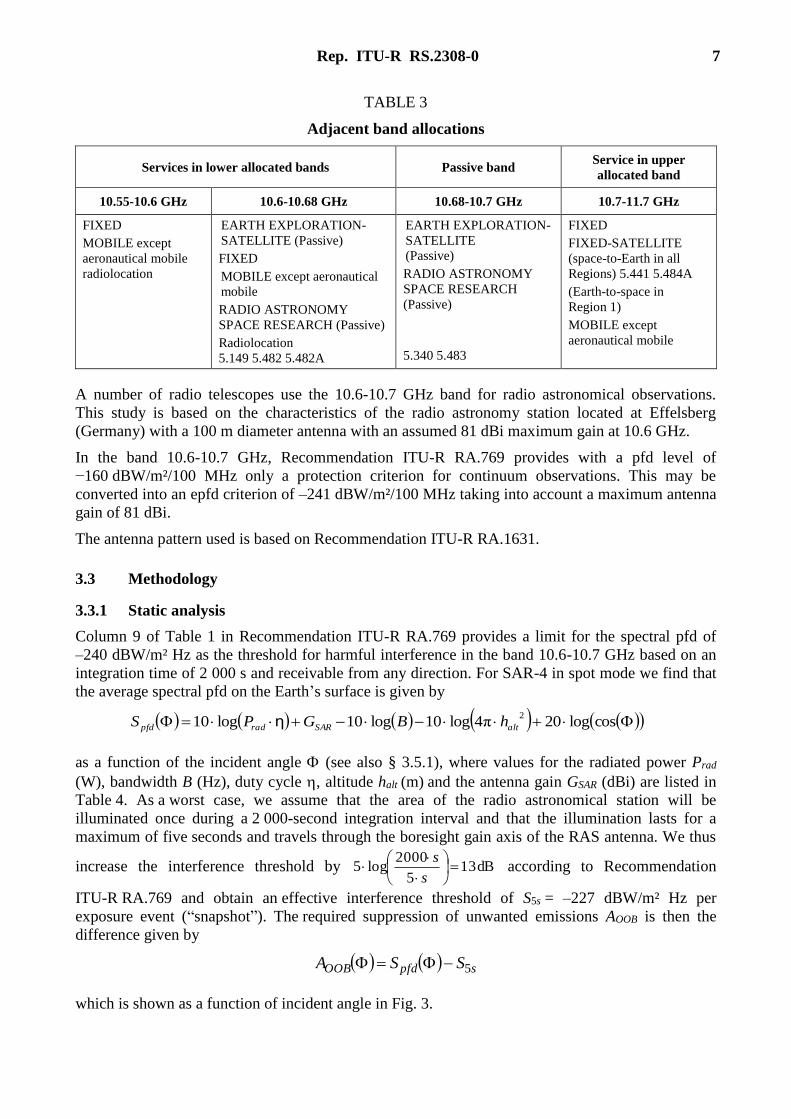
3.2 Characteristics of stations operating in RAS
The band 10.6-10.68 GHz is allocated to the EESS (passive), RAS and SRS (passive) and also
terrestrial services (fixed and mobile). The band 10.68-10.7 GHz has a provision, RR No. 5.340,
relevant for passive services (see Table 3).
Rep. ITU-R RS.2308-0 7
TABLE 3
Adjacent band allocations
Services in lower allocated bands Passive band Service in upper
allocated band
10.55-10.6 GHz 10.6-10.68 GHz 10.68-10.7 GHz 10.7-11.7 GHz
FIXED
MOBILE except
aeronautical mobile
radiolocation
EARTH EXPLORATION-
SATELLITE (Passive)
FIXED
MOBILE except aeronautical
mobile
RADIO ASTRONOMY
SPACE RESEARCH (Passive)
Radiolocation
5.149 5.482 5.482A
EARTH EXPLORATION-
SATELLITE
(Passive)
RADIO ASTRONOMY
SPACE RESEARCH
(Passive)
5.340 5.483
FIXED
FIXED-SATELLITE
(space-to-Earth in all
Regions) 5.441 5.484A
(Earth-to-space in
Region 1)
MOBILE except
aeronautical mobile
A number of radio telescopes use the 10.6-10.7 GHz band for radio astronomical observations.
This study is based on the characteristics of the radio astronomy station located at Effelsberg
(Germany) with a 100 m diameter antenna with an assumed 81 dBi maximum gain at 10.6 GHz.
In the band 10.6-10.7 GHz, Recommendation ITU-R RA.769 provides with a pfd level of
−160 dBW/m²/100 MHz only a protection criterion for continuum observations. This may be
converted into an epfd criterion of –241 dBW/m²/100 MHz taking into account a maximum antenna
gain of 81 dBi.
The antenna pattern used is based on Recommendation ITU-R RA.1631.
3.3 Methodology
3.3.1 Static analysis
Column 9 of Table 1 in Recommendation ITU-R RA.769 provides a limit for the spectral pfd of
–240 dBW/m² Hz as the threshold for harmful interference in the band 10.6-10.7 GHz based on an
integration time of 2 000 s and receivable from any direction. For SAR-4 in spot mode we find that
the average spectral pfd on the Earthʼs surface is given by
coslog20π4log10log10log102
altSARradpfd hBGPS η
as a function of the incident angle (see also § 3.5.1), where values for the radiated power Prad
(W), bandwidth B (Hz), duty cycle , altitude halt (m) and the antenna gain GSAR (dBi) are listed in
Table 4. As a worst case, we assume that the area of the radio astronomical station will be
illuminated once during a 2 000-second integration interval and that the illumination lasts for a
maximum of five seconds and travels through the boresight gain axis of the RAS antenna. We thus
increase the interference threshold by dB 135
2000log5
s
s according to Recommendation
ITU-R RA.769 and obtain an effective interference threshold of S5s = –227 dBW/m² Hz per
exposure event (“snapshot”). The required suppression of unwanted emissions AOOB is then the
difference given by
spfdOOB SSA 5
which is shown as a function of incident angle in Fig. 3.
8 Rep. ITU-R RS.2308-0
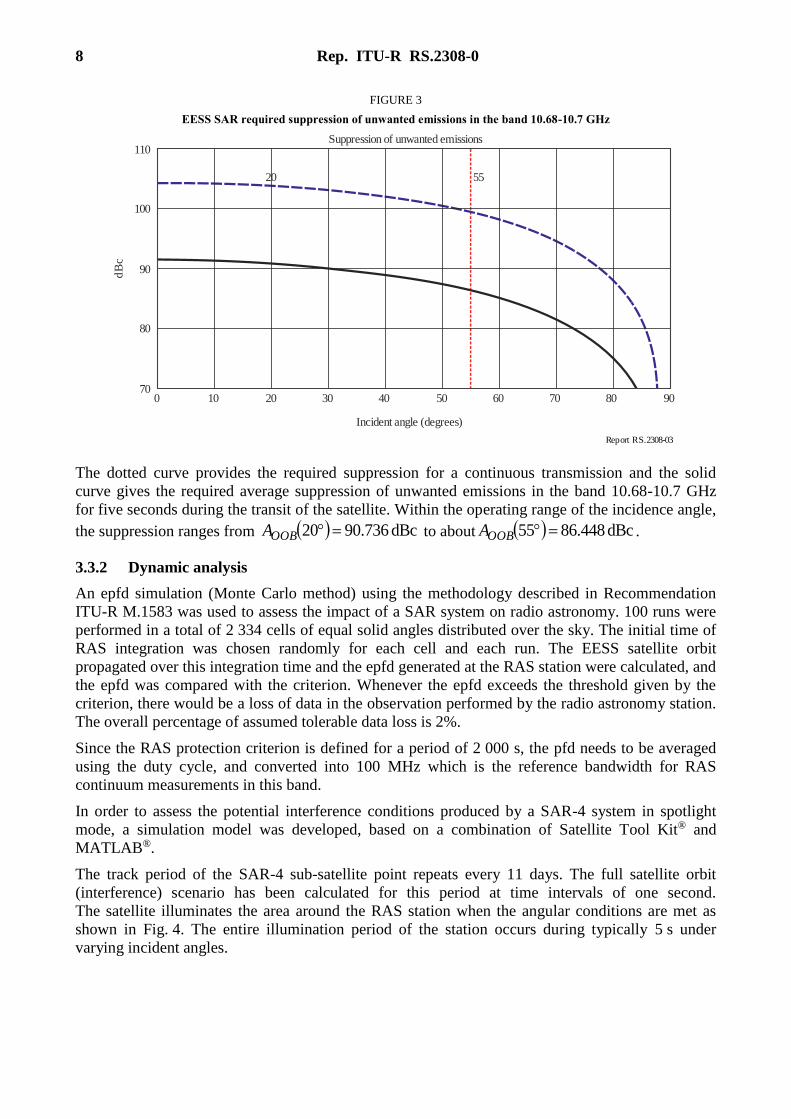
FIGURE 3
EESS SAR required suppression of unwanted emissions in the band 10.68-10.7 GHz
R pe ort RS.2308-03
0 10 20 30 40 50 60 70 80 90
Incident angle (degrees)
70
80
90
100
110
dB
c
20 55
Suppression of unwanted emissions
The dotted curve provides the required suppression for a continuous transmission and the solid
curve gives the required average suppression of unwanted emissions in the band 10.68-10.7 GHz
for five seconds during the transit of the satellite. Within the operating range of the incidence angle,
the suppression ranges from dBc 736.9020 OOBA to about dBc 448.8655 OOBA .
3.3.2 Dynamic analysis
An epfd simulation (Monte Carlo method) using the methodology described in Recommendation
ITU-R M.1583 was used to assess the impact of a SAR system on radio astronomy. 100 runs were
performed in a total of 2 334 cells of equal solid angles distributed over the sky. The initial time of
RAS integration was chosen randomly for each cell and each run. The EESS satellite orbit
propagated over this integration time and the epfd generated at the RAS station were calculated, and
the epfd was compared with the criterion. Whenever the epfd exceeds the threshold given by the
criterion, there would be a loss of data in the observation performed by the radio astronomy station.
The overall percentage of assumed tolerable data loss is 2%.
Since the RAS protection criterion is defined for a period of 2 000 s, the pfd needs to be averaged
using the duty cycle, and converted into 100 MHz which is the reference bandwidth for RAS
continuum measurements in this band.
In order to assess the potential interference conditions produced by a SAR-4 system in spotlight
mode, a simulation model was developed, based on a combination of Satellite Tool Kit® and
MATLAB®.
The track period of the SAR-4 sub-satellite point repeats every 11 days. The full satellite orbit
(interference) scenario has been calculated for this period at time intervals of one second.
The satellite illuminates the area around the RAS station when the angular conditions are met as
shown in Fig. 4. The entire illumination period of the station occurs during typically 5 s under
varying incident angles.
Rep. ITU-R RS.2308-0 9
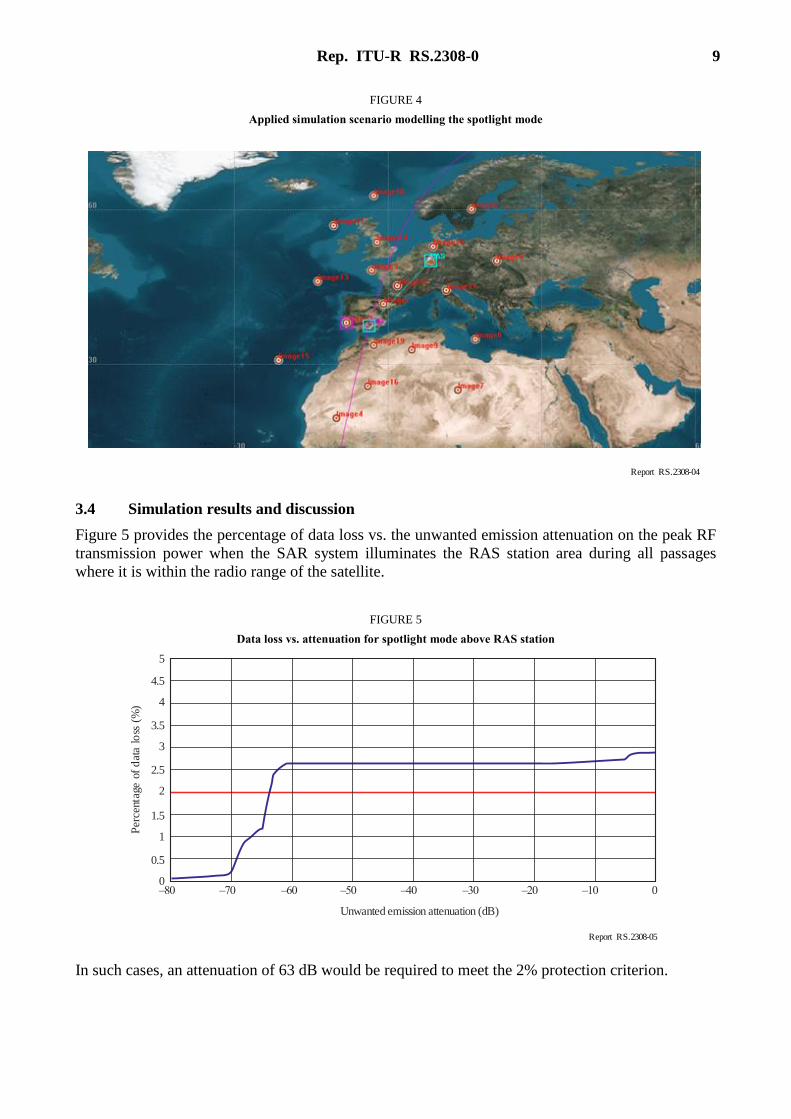
FIGURE 4
Applied simulation scenario modelling the spotlight mode
R pe ort RS.2308-04
3.4 Simulation results and discussion
Figure 5 provides the percentage of data loss vs. the unwanted emission attenuation on the peak RF
transmission power when the SAR system illuminates the RAS station area during all passages
where it is within the radio range of the satellite.
FIGURE 5
Data loss vs. attenuation for spotlight mode above RAS station
R pe ort RS.2308-05
–80
Unwanted emission attenuation (dB)
4
5
Per
cent
age
of d
ata
loss
(%
)
–70 –60 –50 –40 –30 –10–20 0
4.5
3
3.5
2
2.5
1
1.5
0
0.5
In such cases, an attenuation of 63 dB would be required to meet the 2% protection criterion.
10 Rep. ITU-R RS.2308-0
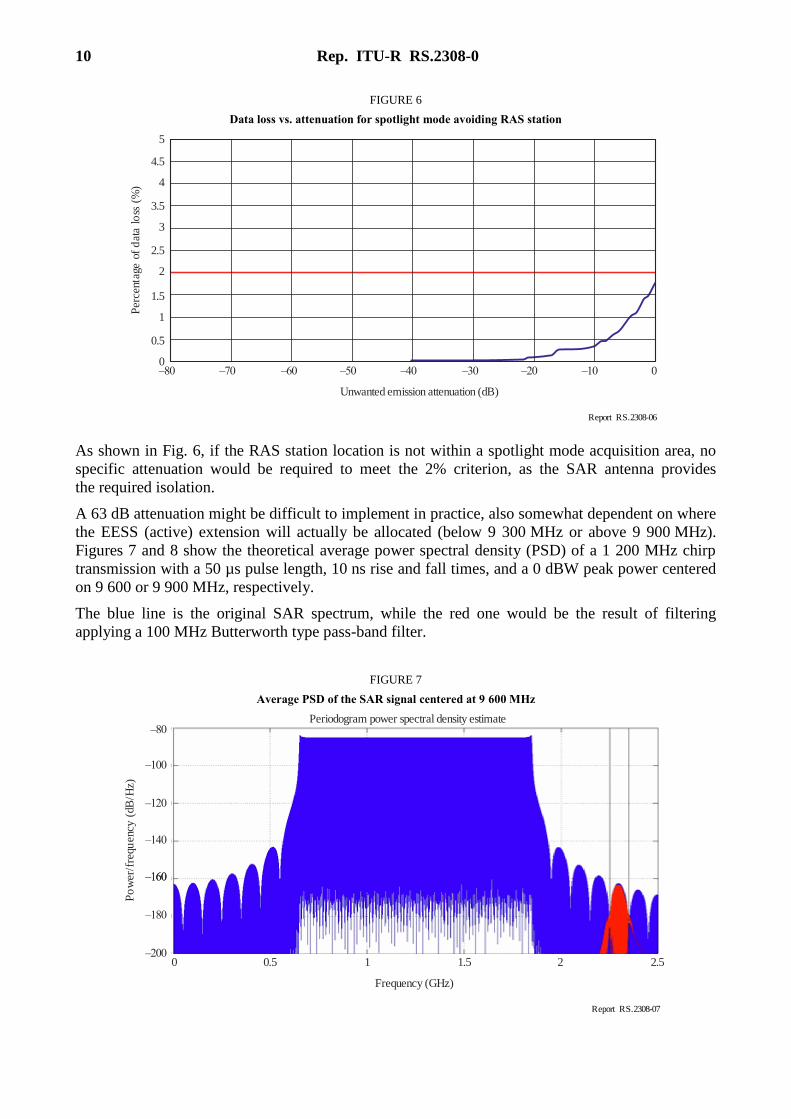
FIGURE 6
Data loss vs. attenuation for spotlight mode avoiding RAS station
R pe ort RS.2308-06
–80
Unwanted emission attenuation (dB)
4
5P
erce
ntag
e of
dat
a lo
ss (
%)
–70 –60 –50 –40 –30 –10–20 0
4.5
3
3.5
2
2.5
1
1.5
0
0.5
As shown in Fig. 6, if the RAS station location is not within a spotlight mode acquisition area, no
specific attenuation would be required to meet the 2% criterion, as the SAR antenna provides
the required isolation.
A 63 dB attenuation might be difficult to implement in practice, also somewhat dependent on where
the EESS (active) extension will actually be allocated (below 9 300 MHz or above 9 900 MHz).
Figures 7 and 8 show the theoretical average power spectral density (PSD) of a 1 200 MHz chirp
transmission with a 50 µs pulse length, 10 ns rise and fall times, and a 0 dBW peak power centered
on 9 600 or 9 900 MHz, respectively.
The blue line is the original SAR spectrum, while the red one would be the result of filtering
applying a 100 MHz Butterworth type pass-band filter.
FIGURE 7
Average PSD of the SAR signal centered at 9 600 MHz
R pe ort RS.2308-07
0
Frequency (GHz)
Po
wer
/fre
quen
cy (
dB/H
z)
0.5 1 1.5 2 2.5
–160
–180
–200
Periodogram power spectral density estimate
–140
–120
–160
–100
–80
Rep. ITU-R RS.2308-0 11
The average power produced in the RAS band is –96 dBW.
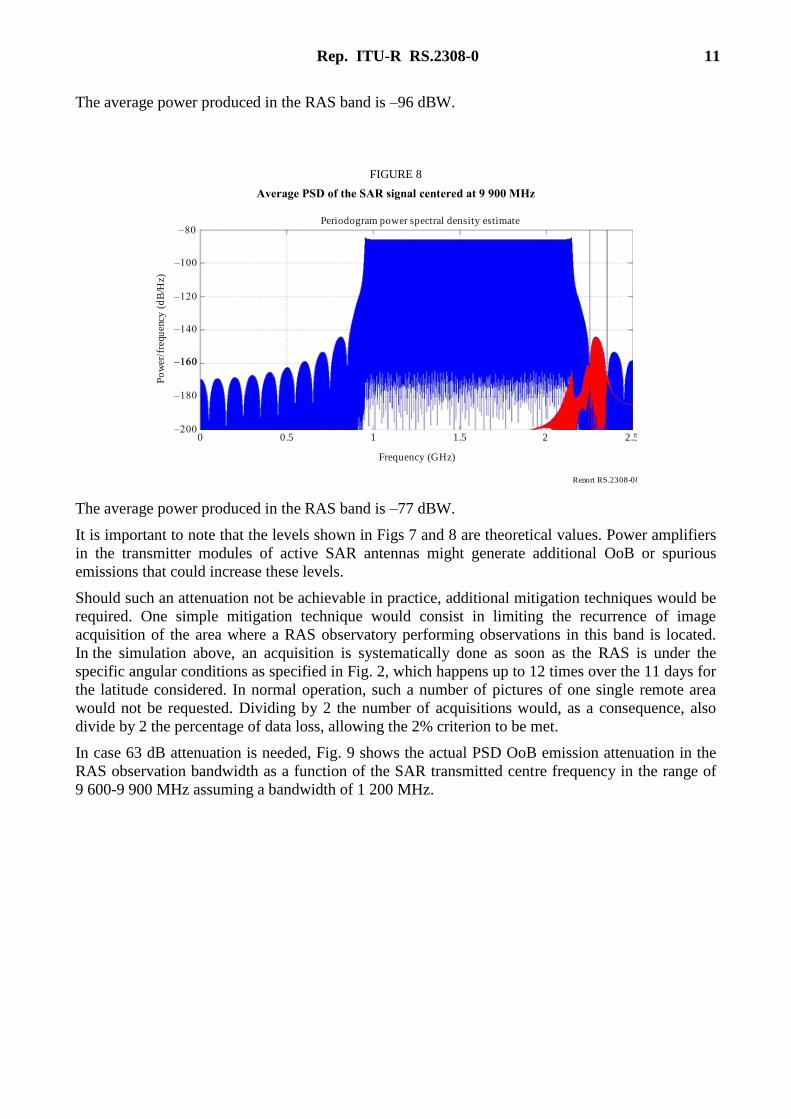
FIGURE 8
Average PSD of the SAR signal centered at 9 900 MHz
R pe ort RS.2308-08
0
Frequency (GHz)
0.5 1 1.5 2 2.5
Periodogram power spectral density estimate
Po
wer
/fre
quen
cy (
dB
/Hz)
–160
–180
–200
–140
–120
–160
–100
–80
The average power produced in the RAS band is –77 dBW.
It is important to note that the levels shown in Figs 7 and 8 are theoretical values. Power amplifiers
in the transmitter modules of active SAR antennas might generate additional OoB or spurious
emissions that could increase these levels.
Should such an attenuation not be achievable in practice, additional mitigation techniques would be
required. One simple mitigation technique would consist in limiting the recurrence of image
acquisition of the area where a RAS observatory performing observations in this band is located.
In the simulation above, an acquisition is systematically done as soon as the RAS is under the
specific angular conditions as specified in Fig. 2, which happens up to 12 times over the 11 days for
the latitude considered. In normal operation, such a number of pictures of one single remote area
would not be requested. Dividing by 2 the number of acquisitions would, as a consequence, also
divide by 2 the percentage of data loss, allowing the 2% criterion to be met.
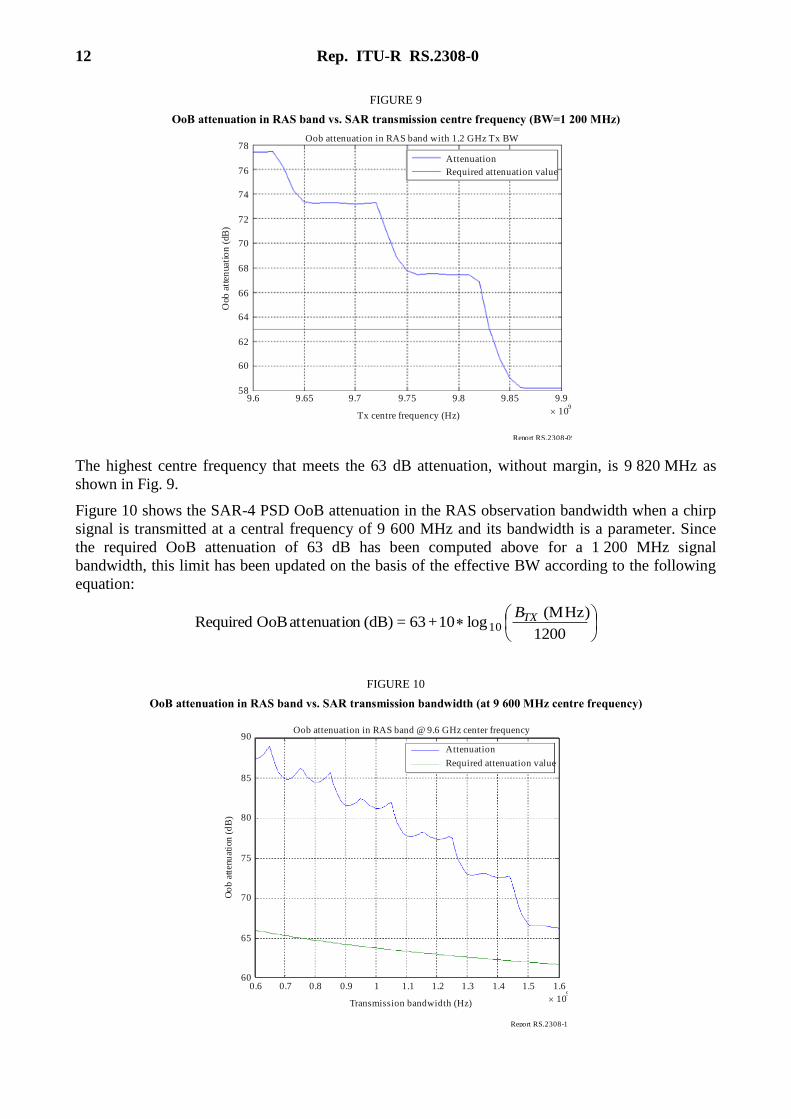
In case 63 dB attenuation is needed, Fig. 9 shows the actual PSD OoB emission attenuation in the
RAS observation bandwidth as a function of the SAR transmitted centre frequency in the range of
9 600-9 900 MHz assuming a bandwidth of 1 200 MHz.
12 Rep. ITU-R RS.2308-0
FIGURE 9
OoB attenuation in RAS band vs. SAR transmission centre frequency (BW=1 200 MHz)
R pe ort RS.2308-09
9.6
Tx centre frequency (Hz)
Oob attenuation in RAS band with 1.2 GHz Tx BW
Oob
att
enua
tio
n (
dB)
60
589.65 9.7 9.75 9.8 9.85 9.9
62
66
64
68
72
70
74
78
76
Attenuation
Required attenuation value
109
The highest centre frequency that meets the 63 dB attenuation, without margin, is 9 820 MHz as
shown in Fig. 9.
Figure 10 shows the SAR-4 PSD OoB attenuation in the RAS observation bandwidth when a chirp
signal is transmitted at a central frequency of 9 600 MHz and its bandwidth is a parameter. Since
the required OoB attenuation of 63 dB has been computed above for a 1 200 MHz signal
bandwidth, this limit has been updated on the basis of the effective BW according to the following
equation:
1200
(MHz) log 10+63=(dB)n attenuatio OoB Required 10
TXB
FIGURE 10
OoB attenuation in RAS band vs. SAR transmission bandwidth (at 9 600 MHz centre frequency)
R pe ort RS.2308-10
0.6
Transmission bandwidth (Hz)
Oob attenuation in RAS band @ 9.6 GHz center frequency
Oo
b at
tenu
atio
n (
dB
)
65
600.7 0.9 1.1
70
75
80
85
90
Attenuation
Required attenuation value
109
0.8 1 1.2 1.3 1.4 1.5 1.6
Rep. ITU-R RS.2308-0 13
The result of this analysis is that the required SAR OoB emission attenuation limit to meet the RAS
protection threshold is always met when the signal carrier is at 9 600 MHz.
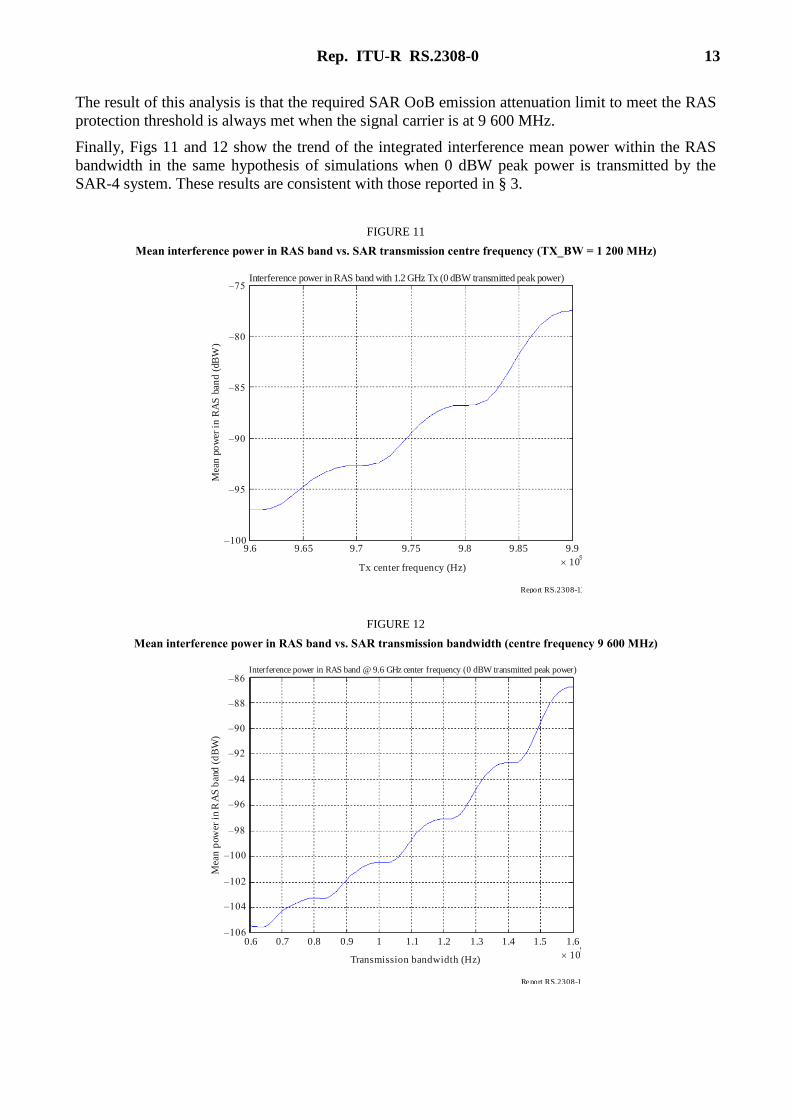
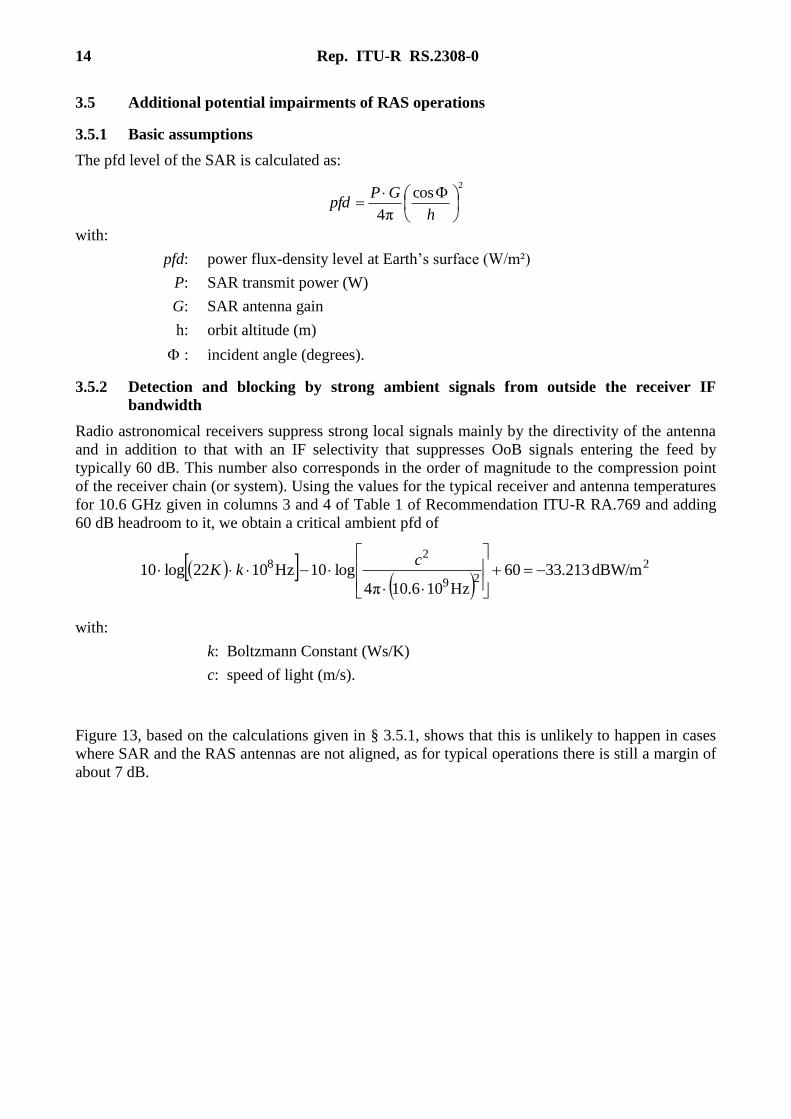
Finally, Figs 11 and 12 show the trend of the integrated interference mean power within the RAS
bandwidth in the same hypothesis of simulations when 0 dBW peak power is transmitted by the
SAR-4 system. These results are consistent with those reported in § 3.
FIGURE 11
Mean interference power in RAS band vs. SAR transmission centre frequency (TX_BW = 1 200 MHz)
R pe ort RS.2308-11
9.6
Tx center frequency (Hz)
Interference power in RAS band with 1.2 GHz Tx (0 dBW transmitted peak power)
Mea
n po
wer
in
RA
S b
and
(dB
W)
–1009.65
–75
109
9.7 9.75 9.8 9.85 9.9
–95
–90
–80
–85
FIGURE 12
Mean interference power in RAS band vs. SAR transmission bandwidth (centre frequency 9 600 MHz)
R pe ort RS.2308-12
0.6
Transmission bandwidth (Hz)
Interference power in RAS band @ 9.6 GHz center frequency (0 dBW transmitted peak power)
Mea
n p
ower
in
RA
S b
and
(d
BW
)
–1060.8
–86
109
0.7 1.1
–102
–98
–90
–94
0.9 1 1.2 1.3 1.4 1.5 1.6
–104
–100
–96
–92
–88
14 Rep. ITU-R RS.2308-0
3.5 Additional potential impairments of RAS operations
3.5.1 Basic assumptions
The pfd level of the SAR is calculated as:
2cos
π4
h
GPpfd
with:
pfd: power flux-density level at Earthʼs surface (W/m²)
P: SAR transmit power (W)
G: SAR antenna gain
h: orbit altitude (m)
: incident angle (degrees).
3.5.2 Detection and blocking by strong ambient signals from outside the receiver IF
bandwidth
Radio astronomical receivers suppress strong local signals mainly by the directivity of the antenna
and in addition to that with an IF selectivity that suppresses OoB signals entering the feed by
typically 60 dB. This number also corresponds in the order of magnitude to the compression point
of the receiver chain (or system). Using the values for the typical receiver and antenna temperatures
for 10.6 GHz given in columns 3 and 4 of Table 1 of Recommendation ITU-R RA.769 and adding
60 dB headroom to it, we obtain a critical ambient pfd of
2
29
28 dBW/m 213.3360
Hz106.10π4
log10Hz1022log10
c
kK
with:
k: Boltzmann Constant (Ws/K)
c: speed of light (m/s).
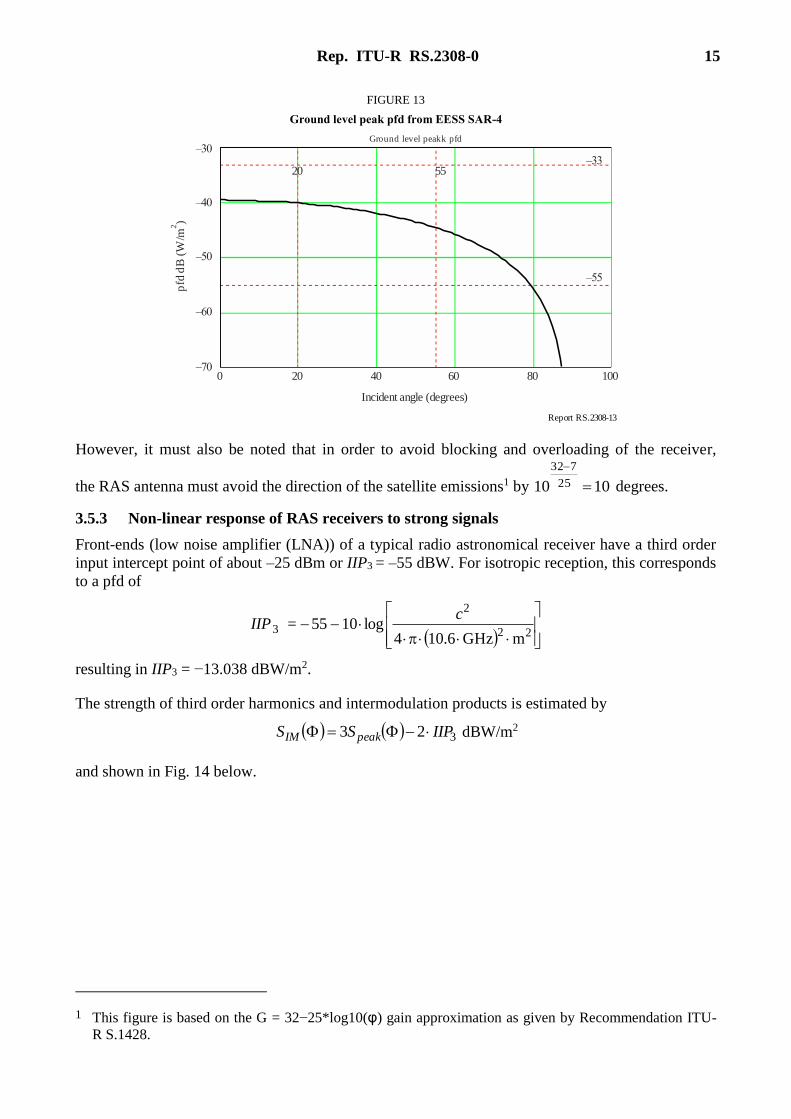
Figure 13, based on the calculations given in § 3.5.1, shows that this is unlikely to happen in cases
where SAR and the RAS antennas are not aligned, as for typical operations there is still a margin of
about 7 dB.
Rep. ITU-R RS.2308-0 15
FIGURE 13
Ground level peak pfd from EESS SAR-4
R pe ort RS.2308-13
0
Incident angle (degrees)
Ground level peakk pfd
pfd
dB
(W
/m)
2
–7020
–60
–50
–40
40 60 80 100
–30
20 55–33
–55
However, it must also be noted that in order to avoid blocking and overloading of the receiver,
the RAS antenna must avoid the direction of the satellite emissions1 by 1010 25
732
degrees.
3.5.3 Non-linear response of RAS receivers to strong signals
Front-ends (low noise amplifier (LNA)) of a typical radio astronomical receiver have a third order
input intercept point of about –25 dBm or IIP3 = –55 dBW. For isotropic reception, this corresponds
to a pfd of
22
2
3mGHz6.104
log1055=c
IIP
resulting in IIP3 = −13.038 dBW/m2.
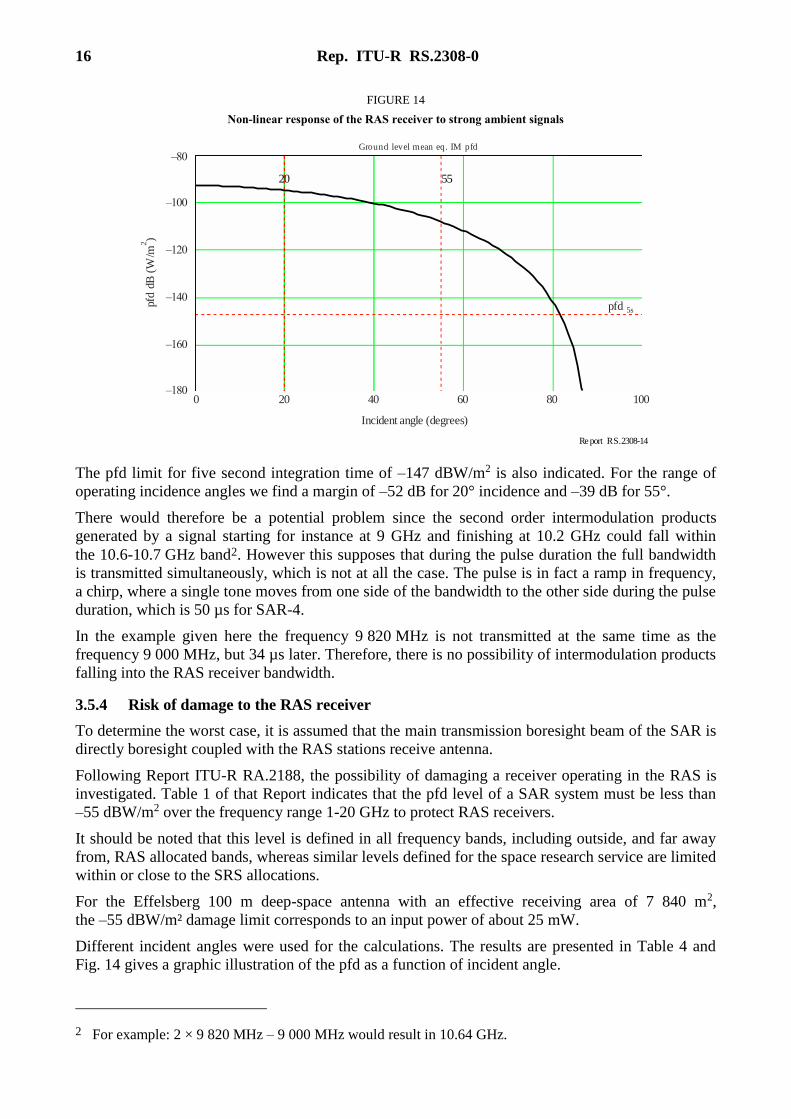
The strength of third order harmonics and intermodulation products is estimated by
323 IIPSS peakIM dBW/m2
and shown in Fig. 14 below.
1 This figure is based on the G = 32−25*log10(φ) gain approximation as given by Recommendation ITU-
R S.1428.
16 Rep. ITU-R RS.2308-0
FIGURE 14
Non-linear response of the RAS receiver to strong ambient signals
R pe ort RS.2308-14
0
Incident angle (degrees)
Ground level mean eq. IM pfdpf
d dB
(W
/m)
2
–18020
–160
–140
–120
40 60 80 100
–80
–100
20 55
pfd 5s
The pfd limit for five second integration time of –147 dBW/m2 is also indicated. For the range of
operating incidence angles we find a margin of –52 dB for 20° incidence and –39 dB for 55°.
There would therefore be a potential problem since the second order intermodulation products
generated by a signal starting for instance at 9 GHz and finishing at 10.2 GHz could fall within
the 10.6-10.7 GHz band2. However this supposes that during the pulse duration the full bandwidth
is transmitted simultaneously, which is not at all the case. The pulse is in fact a ramp in frequency,
a chirp, where a single tone moves from one side of the bandwidth to the other side during the pulse
duration, which is 50 µs for SAR-4.
In the example given here the frequency 9 820 MHz is not transmitted at the same time as the
frequency 9 000 MHz, but 34 µs later. Therefore, there is no possibility of intermodulation products
falling into the RAS receiver bandwidth.
3.5.4 Risk of damage to the RAS receiver
To determine the worst case, it is assumed that the main transmission boresight beam of the SAR is
directly boresight coupled with the RAS stations receive antenna.
Following Report ITU-R RA.2188, the possibility of damaging a receiver operating in the RAS is
investigated. Table 1 of that Report indicates that the pfd level of a SAR system must be less than
–55 dBW/m2 over the frequency range 1-20 GHz to protect RAS receivers.
It should be noted that this level is defined in all frequency bands, including outside, and far away
from, RAS allocated bands, whereas similar levels defined for the space research service are limited
within or close to the SRS allocations.
For the Effelsberg 100 m deep-space antenna with an effective receiving area of 7 840 m2,
the –55 dBW/m² damage limit corresponds to an input power of about 25 mW.
Different incident angles were used for the calculations. The results are presented in Table 4 and
Fig. 14 gives a graphic illustration of the pfd as a function of incident angle.
2 For example: 2 × 9 820 MHz – 9 000 MHz would result in 10.64 GHz.
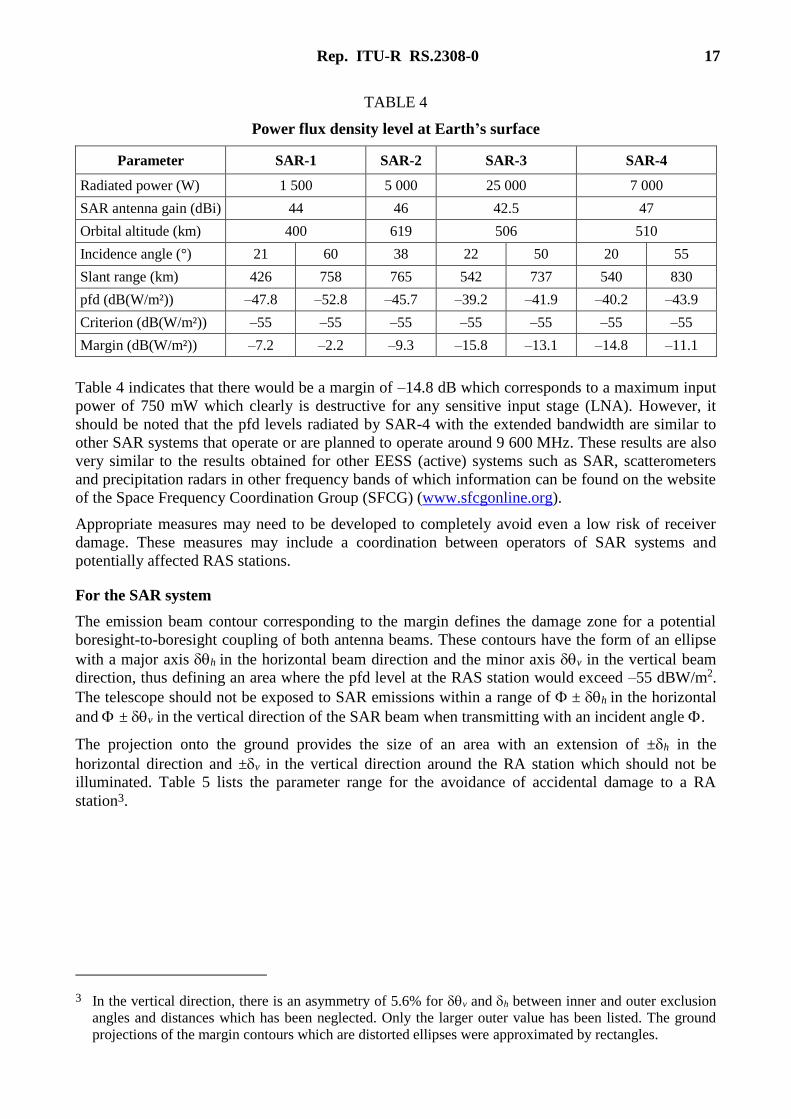
Rep. ITU-R RS.2308-0 17
TABLE 4
Power flux density level at Earthʼs surface
Parameter SAR-1 SAR-2 SAR-3 SAR-4
Radiated power (W) 1 500 5 000 25 000 7 000
SAR antenna gain (dBi) 44 46 42.5 47
Orbital altitude (km) 400 619 506 510
Incidence angle (°) 21 60 38 22 50 20 55
Slant range (km) 426 758 765 542 737 540 830
pfd (dB(W/m²)) –47.8 –52.8 –45.7 –39.2 –41.9 –40.2 –43.9
Criterion (dB(W/m²)) –55 –55 –55 –55 –55 –55 –55
Margin (dB(W/m²)) –7.2 –2.2 –9.3 –15.8 –13.1 –14.8 –11.1
Table 4 indicates that there would be a margin of –14.8 dB which corresponds to a maximum input
power of 750 mW which clearly is destructive for any sensitive input stage (LNA). However, it
should be noted that the pfd levels radiated by SAR-4 with the extended bandwidth are similar to
other SAR systems that operate or are planned to operate around 9 600 MHz. These results are also
very similar to the results obtained for other EESS (active) systems such as SAR, scatterometers
and precipitation radars in other frequency bands of which information can be found on the website
of the Space Frequency Coordination Group (SFCG) (www.sfcgonline.org).
Appropriate measures may need to be developed to completely avoid even a low risk of receiver
damage. These measures may include a coordination between operators of SAR systems and
potentially affected RAS stations.
For the SAR system
The emission beam contour corresponding to the margin defines the damage zone for a potential
boresight-to-boresight coupling of both antenna beams. These contours have the form of an ellipse
with a major axis h in the horizontal beam direction and the minor axis v in the vertical beam
direction, thus defining an area where the pfd level at the RAS station would exceed –55 dBW/m2.
The telescope should not be exposed to SAR emissions within a range of ± h in the horizontal
and ± v in the vertical direction of the SAR beam when transmitting with an incident angle .
The projection onto the ground provides the size of an area with an extension of ±h in the
horizontal direction and ±v in the vertical direction around the RA station which should not be
illuminated. Table 5 lists the parameter range for the avoidance of accidental damage to a RA
station3.
3 In the vertical direction, there is an asymmetry of 5.6% for v and h between inner and outer exclusion
angles and distances which has been neglected. Only the larger outer value has been listed. The ground
projections of the margin contours which are distorted ellipses were approximated by rectangles.
18 Rep. ITU-R RS.2308-0
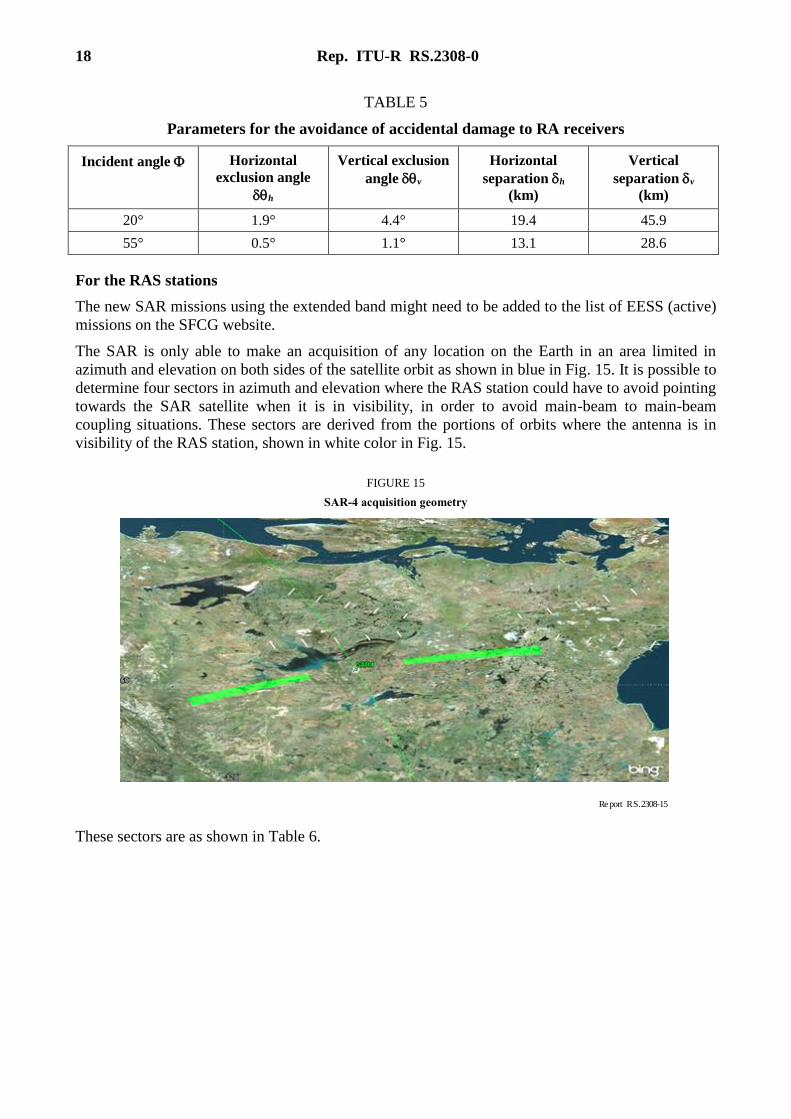
TABLE 5
Parameters for the avoidance of accidental damage to RA receivers
Incident angle Horizontal
exclusion angle
h
Vertical exclusion
anglev
Horizontal
separation h
(km)
Vertical
separation v
(km)
20° 1.9° 4.4° 19.4 45.9
55° 0.5° 1.1° 13.1 28.6
For the RAS stations
The new SAR missions using the extended band might need to be added to the list of EESS (active)
missions on the SFCG website.
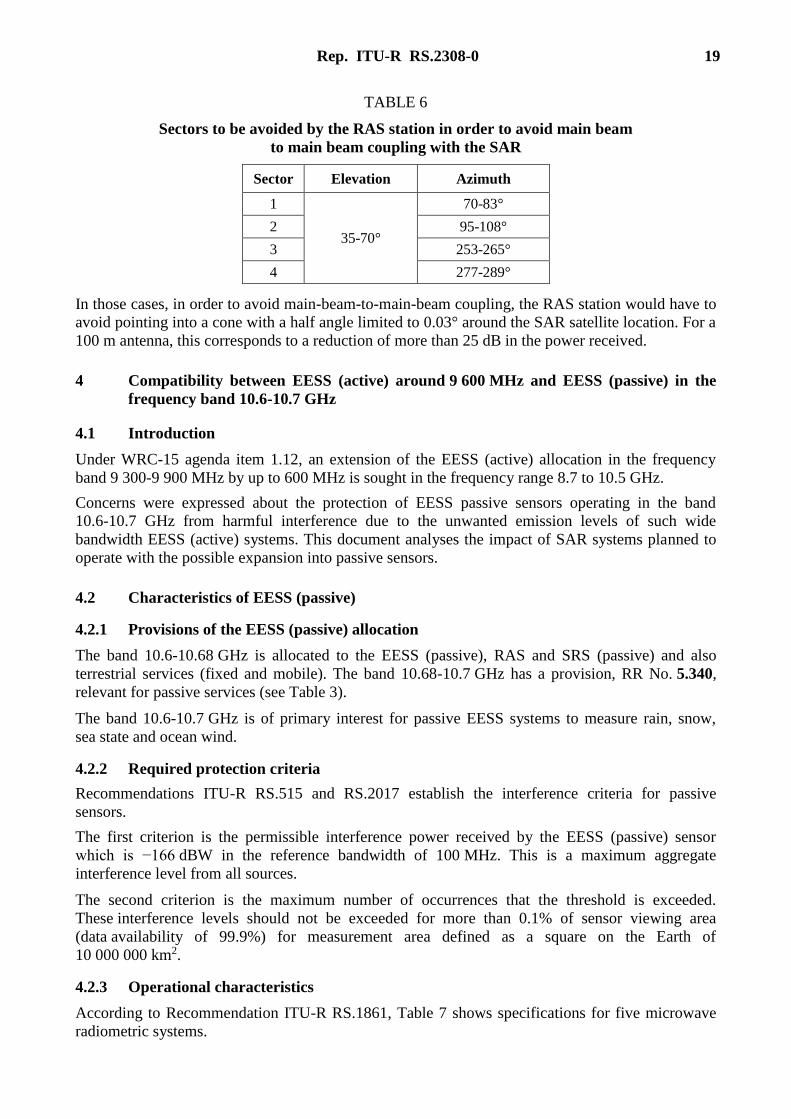
The SAR is only able to make an acquisition of any location on the Earth in an area limited in
azimuth and elevation on both sides of the satellite orbit as shown in blue in Fig. 15. It is possible to
determine four sectors in azimuth and elevation where the RAS station could have to avoid pointing
towards the SAR satellite when it is in visibility, in order to avoid main-beam to main-beam
coupling situations. These sectors are derived from the portions of orbits where the antenna is in
visibility of the RAS station, shown in white color in Fig. 15.
FIGURE 15
SAR-4 acquisition geometry
R pe ort RS.2308-15
These sectors are as shown in Table 6.
Rep. ITU-R RS.2308-0 19
TABLE 6
Sectors to be avoided by the RAS station in order to avoid main beam
to main beam coupling with the SAR
Sector Elevation Azimuth
1
35-70°
70-83°
2 95-108°
3 253-265°
4 277-289°
In those cases, in order to avoid main-beam-to-main-beam coupling, the RAS station would have to
avoid pointing into a cone with a half angle limited to 0.03° around the SAR satellite location. For a
100 m antenna, this corresponds to a reduction of more than 25 dB in the power received.
4 Compatibility between EESS (active) around 9 600 MHz and EESS (passive) in the
frequency band 10.6-10.7 GHz
4.1 Introduction
Under WRC-15 agenda item 1.12, an extension of the EESS (active) allocation in the frequency
band 9 300-9 900 MHz by up to 600 MHz is sought in the frequency range 8.7 to 10.5 GHz.
Concerns were expressed about the protection of EESS passive sensors operating in the band
10.6-10.7 GHz from harmful interference due to the unwanted emission levels of such wide
bandwidth EESS (active) systems. This document analyses the impact of SAR systems planned to
operate with the possible expansion into passive sensors.
4.2 Characteristics of EESS (passive)
4.2.1 Provisions of the EESS (passive) allocation
The band 10.6-10.68 GHz is allocated to the EESS (passive), RAS and SRS (passive) and also
terrestrial services (fixed and mobile). The band 10.68-10.7 GHz has a provision, RR No. 5.340,
relevant for passive services (see Table 3).
The band 10.6-10.7 GHz is of primary interest for passive EESS systems to measure rain, snow,
sea state and ocean wind.
4.2.2 Required protection criteria
Recommendations ITU-R RS.515 and RS.2017 establish the interference criteria for passive
sensors.
The first criterion is the permissible interference power received by the EESS (passive) sensor
which is −166 dBW in the reference bandwidth of 100 MHz. This is a maximum aggregate
interference level from all sources.
The second criterion is the maximum number of occurrences that the threshold is exceeded.
These interference levels should not be exceeded for more than 0.1% of sensor viewing area
(data availability of 99.9%) for measurement area defined as a square on the Earth of
10 000 000 km2.
4.2.3 Operational characteristics
According to Recommendation ITU-R RS.1861, Table 7 shows specifications for five microwave
radiometric systems.
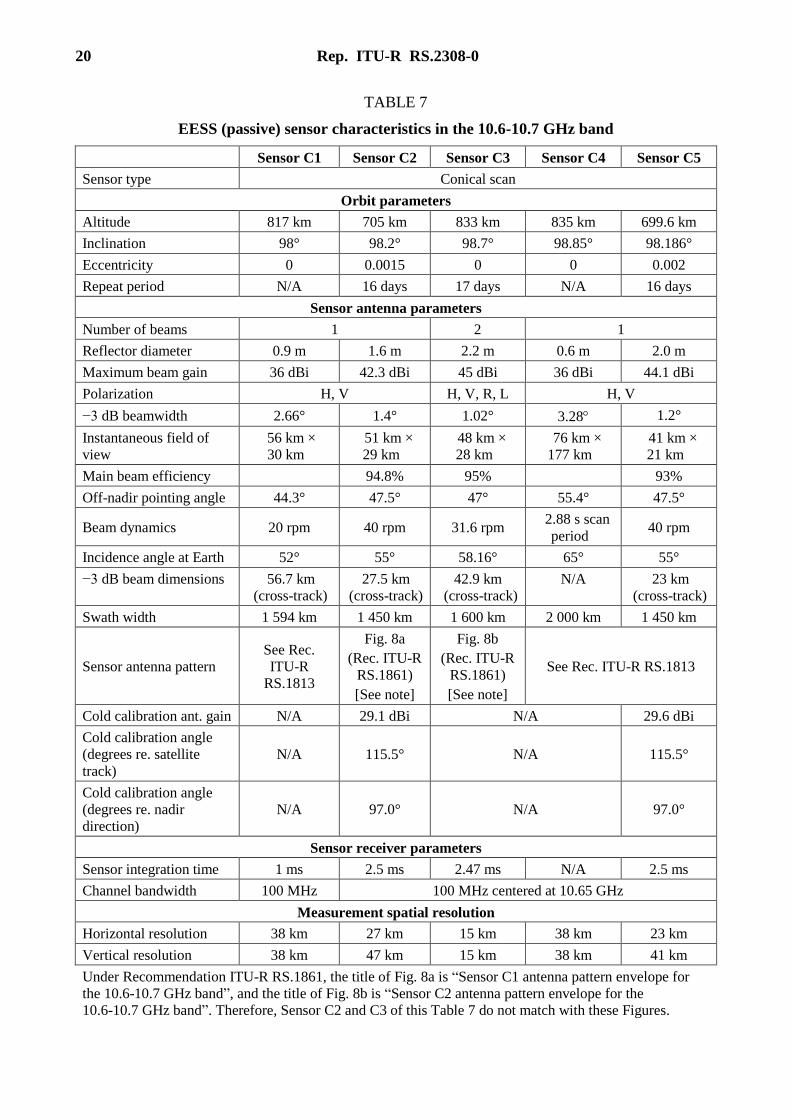
20 Rep. ITU-R RS.2308-0
TABLE 7
EESS (passive) sensor characteristics in the 10.6-10.7 GHz band
Sensor C1 Sensor C2 Sensor C3 Sensor C4 Sensor C5
Sensor type Conical scan
Orbit parameters
Altitude 817 km 705 km 833 km 835 km 699.6 km
Inclination 98° 98.2° 98.7° 98.85° 98.186°
Eccentricity 0 0.0015 0 0 0.002
Repeat period N/A 16 days 17 days N/A 16 days
Sensor antenna parameters
Number of beams 1 2 1
Reflector diameter 0.9 m 1.6 m 2.2 m 0.6 m 2.0 m
Maximum beam gain 36 dBi 42.3 dBi 45 dBi 36 dBi 44.1 dBi
Polarization H, V H, V, R, L H, V
−3 dB beamwidth 2.66° 1.4° 1.02° 3.28 1.2°
Instantaneous field of
view
56 km ×
30 km
51 km ×
29 km
48 km ×
28 km
76 km ×
177 km
41 km ×
21 km
Main beam efficiency 94.8% 95% 93%
Off-nadir pointing angle 44.3° 47.5° 47° 55.4° 47.5°
Beam dynamics 20 rpm 40 rpm 31.6 rpm 2.88 s scan
period 40 rpm
Incidence angle at Earth 52° 55° 58.16° 65° 55°
−3 dB beam dimensions 56.7 km
(cross-track)
27.5 km
(cross-track)
42.9 km
(cross-track)
N/A 23 km
(cross-track)
Swath width 1 594 km 1 450 km 1 600 km 2 000 km 1 450 km
Sensor antenna pattern
See Rec.
ITU-R
RS.1813
Fig. 8a
(Rec. ITU-R
RS.1861)
[See note]
Fig. 8b
(Rec. ITU-R
RS.1861)
[See note]
See Rec. ITU-R RS.1813
Cold calibration ant. gain N/A 29.1 dBi N/A 29.6 dBi
Cold calibration angle
(degrees re. satellite
track)
N/A 115.5° N/A 115.5°
Cold calibration angle
(degrees re. nadir
direction)
N/A 97.0° N/A 97.0°
Sensor receiver parameters
Sensor integration time 1 ms 2.5 ms 2.47 ms N/A 2.5 ms
Channel bandwidth 100 MHz 100 MHz centered at 10.65 GHz
Measurement spatial resolution
Horizontal resolution 38 km 27 km 15 km 38 km 23 km
Vertical resolution 38 km 47 km 15 km 38 km 41 km
Under Recommendation ITU-R RS.1861, the title of Fig. 8a is “Sensor C1 antenna pattern envelope for
the 10.6-10.7 GHz band”, and the title of Fig. 8b is “Sensor C2 antenna pattern envelope for the
10.6-10.7 GHz band”. Therefore, Sensor C2 and C3 of this Table 7 do not match with these Figures.
Rep. ITU-R RS.2308-0 21
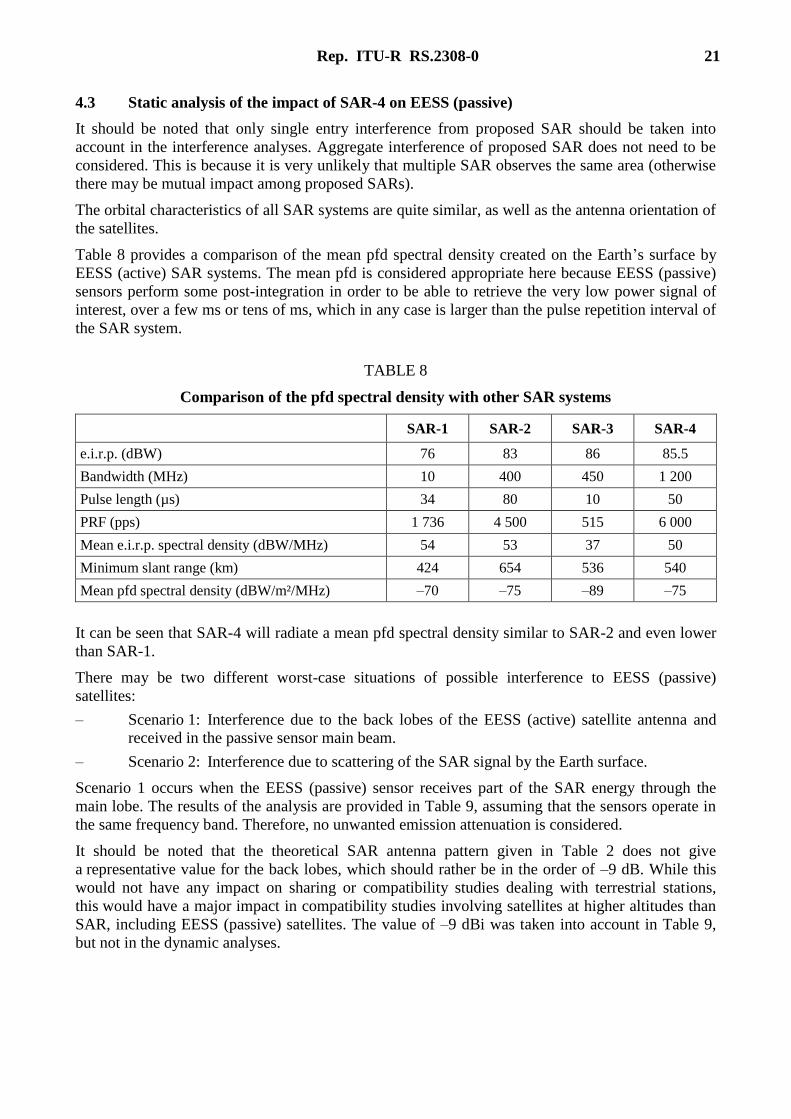
4.3 Static analysis of the impact of SAR-4 on EESS (passive)
It should be noted that only single entry interference from proposed SAR should be taken into
account in the interference analyses. Aggregate interference of proposed SAR does not need to be
considered. This is because it is very unlikely that multiple SAR observes the same area (otherwise
there may be mutual impact among proposed SARs).
The orbital characteristics of all SAR systems are quite similar, as well as the antenna orientation of
the satellites.
Table 8 provides a comparison of the mean pfd spectral density created on the Earthʼs surface by
EESS (active) SAR systems. The mean pfd is considered appropriate here because EESS (passive)
sensors perform some post-integration in order to be able to retrieve the very low power signal of
interest, over a few ms or tens of ms, which in any case is larger than the pulse repetition interval of
the SAR system.
TABLE 8
Comparison of the pfd spectral density with other SAR systems
SAR-1 SAR-2 SAR-3 SAR-4
e.i.r.p. (dBW) 76 83 86 85.5
Bandwidth (MHz) 10 400 450 1 200
Pulse length (µs) 34 80 10 50
PRF (pps) 1 736 4 500 515 6 000
Mean e.i.r.p. spectral density (dBW/MHz) 54 53 37 50
Minimum slant range (km) 424 654 536 540
Mean pfd spectral density (dBW/m²/MHz) –70 –75 –89 –75
It can be seen that SAR-4 will radiate a mean pfd spectral density similar to SAR-2 and even lower
than SAR-1.
There may be two different worst-case situations of possible interference to EESS (passive)
satellites:
– Scenario 1: Interference due to the back lobes of the EESS (active) satellite antenna and
received in the passive sensor main beam.
– Scenario 2: Interference due to scattering of the SAR signal by the Earth surface.
Scenario 1 occurs when the EESS (passive) sensor receives part of the SAR energy through the
main lobe. The results of the analysis are provided in Table 9, assuming that the sensors operate in
the same frequency band. Therefore, no unwanted emission attenuation is considered.
It should be noted that the theoretical SAR antenna pattern given in Table 2 does not give
a representative value for the back lobes, which should rather be in the order of –9 dB. While this
would not have any impact on sharing or compatibility studies dealing with terrestrial stations,
this would have a major impact in compatibility studies involving satellites at higher altitudes than
SAR, including EESS (passive) satellites. The value of –9 dBi was taken into account in Table 9,
but not in the dynamic analyses.
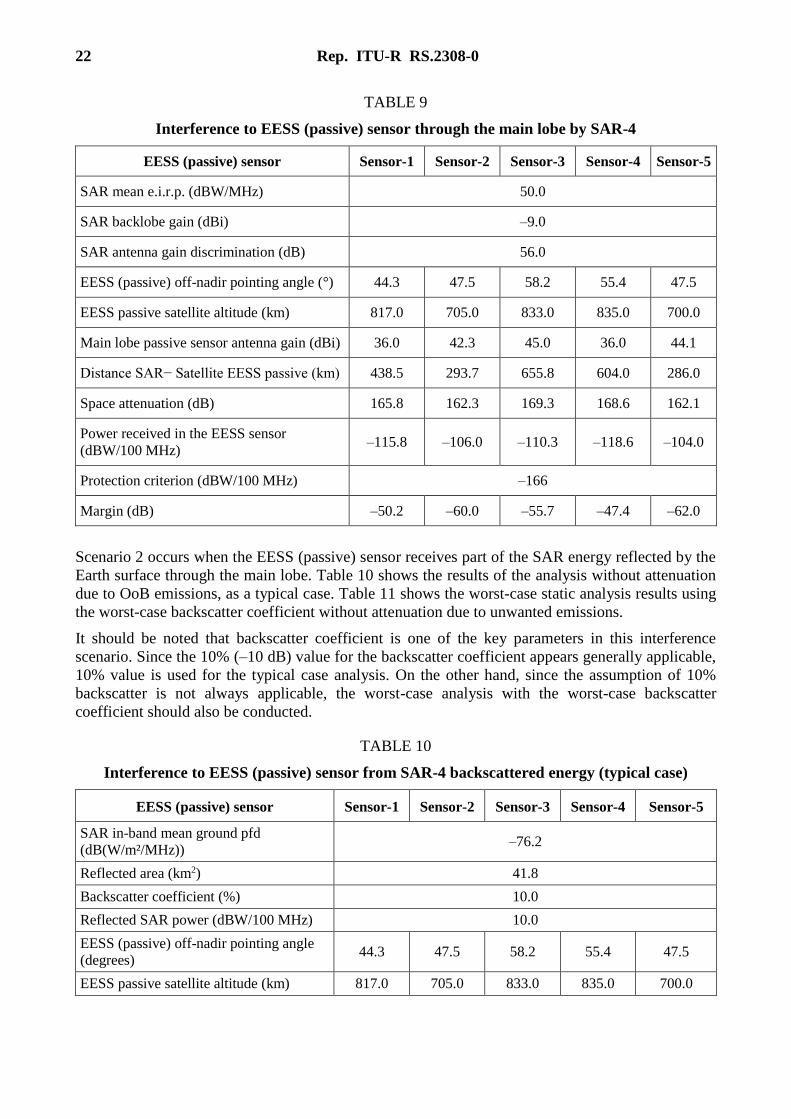
22 Rep. ITU-R RS.2308-0
TABLE 9
Interference to EESS (passive) sensor through the main lobe by SAR-4
EESS (passive) sensor Sensor-1 Sensor-2 Sensor-3 Sensor-4 Sensor-5
SAR mean e.i.r.p. (dBW/MHz) 50.0
SAR backlobe gain (dBi) –9.0
SAR antenna gain discrimination (dB) 56.0
EESS (passive) off-nadir pointing angle (°) 44.3 47.5 58.2 55.4 47.5
EESS passive satellite altitude (km) 817.0 705.0 833.0 835.0 700.0
Main lobe passive sensor antenna gain (dBi) 36.0 42.3 45.0 36.0 44.1
Distance SAR− Satellite EESS passive (km) 438.5 293.7 655.8 604.0 286.0
Space attenuation (dB) 165.8 162.3 169.3 168.6 162.1
Power received in the EESS sensor
(dBW/100 MHz) –115.8 –106.0 –110.3 –118.6 –104.0
Protection criterion (dBW/100 MHz) –166
Margin (dB) –50.2 –60.0 –55.7 –47.4 –62.0
Scenario 2 occurs when the EESS (passive) sensor receives part of the SAR energy reflected by the
Earth surface through the main lobe. Table 10 shows the results of the analysis without attenuation
due to OoB emissions, as a typical case. Table 11 shows the worst-case static analysis results using
the worst-case backscatter coefficient without attenuation due to unwanted emissions.
It should be noted that backscatter coefficient is one of the key parameters in this interference
scenario. Since the 10% (–10 dB) value for the backscatter coefficient appears generally applicable,
10% value is used for the typical case analysis. On the other hand, since the assumption of 10%
backscatter is not always applicable, the worst-case analysis with the worst-case backscatter
coefficient should also be conducted.
TABLE 10
Interference to EESS (passive) sensor from SAR-4 backscattered energy (typical case)
EESS (passive) sensor Sensor-1 Sensor-2 Sensor-3 Sensor-4 Sensor-5
SAR in-band mean ground pfd
(dB(W/m²/MHz)) –76.2
Reflected area (km2) 41.8
Backscatter coefficient (%) 10.0
Reflected SAR power (dBW/100 MHz) 10.0
EESS (passive) off-nadir pointing angle
(degrees) 44.3 47.5 58.2 55.4 47.5
EESS passive satellite altitude (km) 817.0 705.0 833.0 835.0 700.0
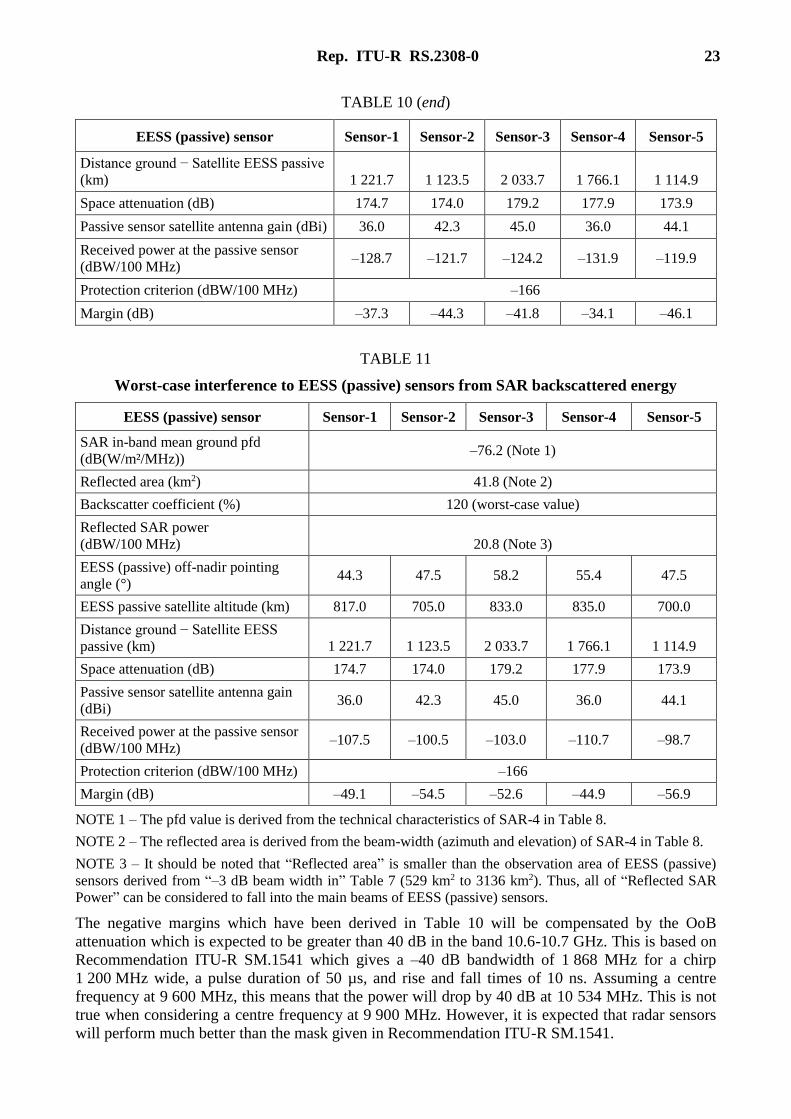
Rep. ITU-R RS.2308-0 23
TABLE 10 (end)
EESS (passive) sensor Sensor-1 Sensor-2 Sensor-3 Sensor-4 Sensor-5
Distance ground − Satellite EESS passive
(km) 1 221.7 1 123.5 2 033.7 1 766.1 1 114.9
Space attenuation (dB) 174.7 174.0 179.2 177.9 173.9
Passive sensor satellite antenna gain (dBi) 36.0 42.3 45.0 36.0 44.1
Received power at the passive sensor
(dBW/100 MHz) –128.7 –121.7 –124.2 –131.9 –119.9
Protection criterion (dBW/100 MHz) –166
Margin (dB) –37.3 –44.3 –41.8 –34.1 –46.1
TABLE 11
Worst-case interference to EESS (passive) sensors from SAR backscattered energy
EESS (passive) sensor Sensor-1 Sensor-2 Sensor-3 Sensor-4 Sensor-5
SAR in-band mean ground pfd
(dB(W/m²/MHz)) –76.2 (Note 1)
Reflected area (km2) 41.8 (Note 2)
Backscatter coefficient (%) 120 (worst-case value)
Reflected SAR power
(dBW/100 MHz) 20.8 (Note 3)
EESS (passive) off-nadir pointing
angle (°) 44.3 47.5 58.2 55.4 47.5
EESS passive satellite altitude (km) 817.0 705.0 833.0 835.0 700.0
Distance ground − Satellite EESS
passive (km) 1 221.7 1 123.5 2 033.7 1 766.1 1 114.9
Space attenuation (dB) 174.7 174.0 179.2 177.9 173.9
Passive sensor satellite antenna gain
(dBi) 36.0 42.3 45.0 36.0 44.1
Received power at the passive sensor
(dBW/100 MHz) –107.5 –100.5 –103.0 –110.7 –98.7
Protection criterion (dBW/100 MHz) –166
Margin (dB) –49.1 –54.5 –52.6 –44.9 –56.9
NOTE 1 – The pfd value is derived from the technical characteristics of SAR-4 in Table 8.
NOTE 2 – The reflected area is derived from the beam-width (azimuth and elevation) of SAR-4 in Table 8.
NOTE 3 – It should be noted that “Reflected area” is smaller than the observation area of EESS (passive)
sensors derived from “–3 dB beam width in” Table 7 (529 km2 to 3136 km2). Thus, all of “Reflected SAR
Power” can be considered to fall into the main beams of EESS (passive) sensors.
The negative margins which have been derived in Table 10 will be compensated by the OoB
attenuation which is expected to be greater than 40 dB in the band 10.6-10.7 GHz. This is based on
Recommendation ITU-R SM.1541 which gives a –40 dB bandwidth of 1 868 MHz for a chirp
1 200 MHz wide, a pulse duration of 50 µs, and rise and fall times of 10 ns. Assuming a centre
frequency at 9 600 MHz, this means that the power will drop by 40 dB at 10 534 MHz. This is not
true when considering a centre frequency at 9 900 MHz. However, it is expected that radar sensors
will perform much better than the mask given in Recommendation ITU-R SM.1541.

24 Rep. ITU-R RS.2308-0
It should also be noted that the situations described above are very unlikely to happen in practice.
Indeed, the risk that the SAR satellite is within the main lobe of the passive sensor is already a rare
situation which last only for a very small amount of time. A SAR is not always transmitting, as the
transmission time per orbit for SAR-4 is in average 200 s. The conjunction of a SAR transmitting
while in the main beam of a passive sensor is an event unlikely to happen.
The same should be true for the scattering scenario. The conjunction of a passive sensor pointing to
a pixel while a SAR-4 system is taking a high resolution picture of exactly the same pixel at the
same time is very unlikely.
4.4 Dynamic analysis of the impact of SAR-4 on EESS (passive)
In order to assess the potential interference conditions produced by a SAR-4 system in spotlight
mode, a simulation model was developed, based on a combination of Satellite Tool Kit® and
MATLAB® as shown in Fig. 16. The difficulty of this kind of simulation is that the time and
location of SAR acquisitions are variable and largely unknown. In this simulation a number of
20 areas have been deployed, concentrated over Europe. Each time the SAR is in visibility of these
areas with the conditions given in the previous paragraph, a picture in high resolution is taken.
This simulation is intended to verify the likelihood of scenario 1 and does not account for the SAR
backscattered energy.
FIGURE 16
Applied simulation scenario modeling the spotlight mode
R pe ort RS.2308-16
The interference received by EESS (passive) Sensor 2 (on board the AQUA satellite) was
calculated and is shown in Fig. 17. Two types of SAR orbits are considered: A SAR-1 orbit
(e.g. TerraSAR-X) and a SAR-2 orbit (e.g. COSMO SKYMED).
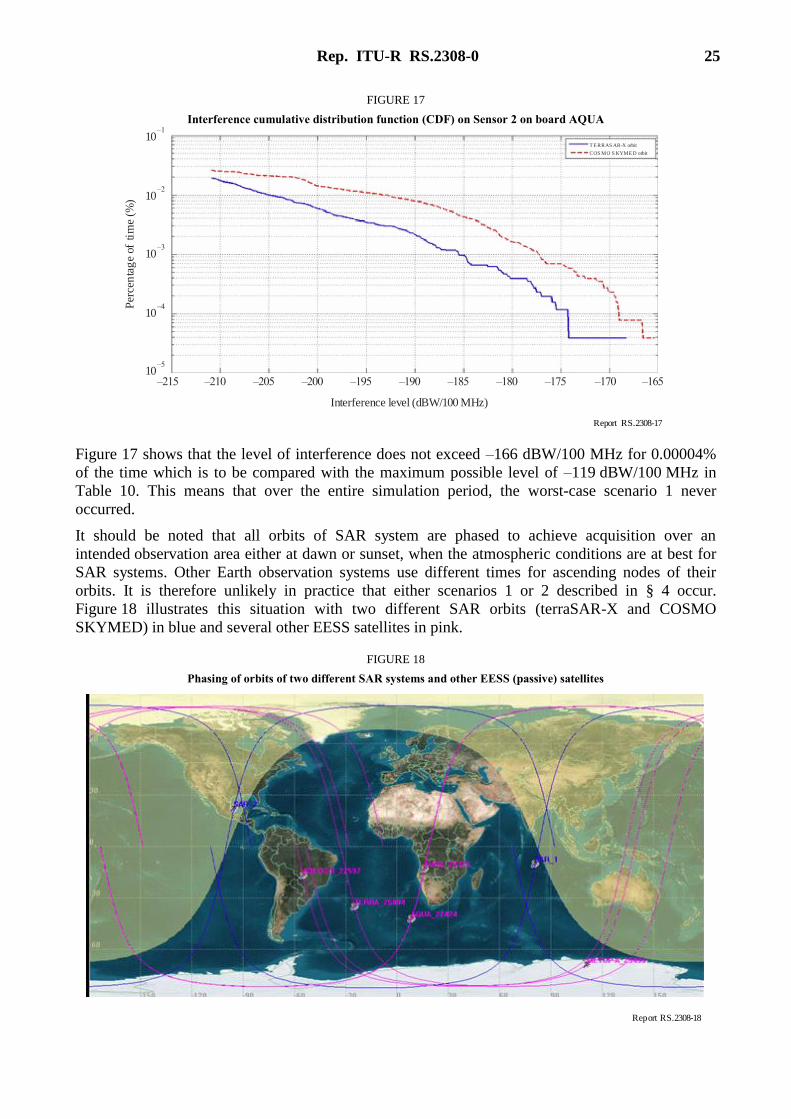
Rep. ITU-R RS.2308-0 25
FIGURE 17
Interference cumulative distribution function (CDF) on Sensor 2 on board AQUA
R pe ort RS.2308-17
–215
Interference level (dBW/100 MHz)
Per
cen
tag
e of
tim
e (%
)10
–1
10–2
10–3
10–4
10–5
–210 –205 –200 –195 –190 –185 –180 –175 –170 –165
T E RRAS AR-X orbit
COS MO S KYME D orbit
Figure 17 shows that the level of interference does not exceed –166 dBW/100 MHz for 0.00004%
of the time which is to be compared with the maximum possible level of –119 dBW/100 MHz in
Table 10. This means that over the entire simulation period, the worst-case scenario 1 never
occurred.
It should be noted that all orbits of SAR system are phased to achieve acquisition over an
intended observation area either at dawn or sunset, when the atmospheric conditions are at best for
SAR systems. Other Earth observation systems use different times for ascending nodes of their
orbits. It is therefore unlikely in practice that either scenarios 1 or 2 described in § 4 occur.
Figure 18 illustrates this situation with two different SAR orbits (terraSAR-X and COSMO
SKYMED) in blue and several other EESS satellites in pink.
FIGURE 18
Phasing of orbits of two different SAR systems and other EESS (passive) satellites
R pe ort RS.2308-18
26 Rep. ITU-R RS.2308-0
5 Compatibility between EESS (active) and SRS in the frequency band
8 400-8 500 MHz
5.1 Introduction
Under WRC-15 agenda item 1.12, an extension of the EESS (active) allocation in the frequency
band 9 300-9 900 MHz by up to 600 MHz is to be studied in the frequency range 8.7 to 10.5 GHz.
This section provides an analysis of the compatibility of space borne SAR that intend to use the full
extended bandwidth of 1 200 MHz with space research systems operating in the SRS (space-to-
Earth) allocated in the band 8 400-8 500 MHz. Both, deep-space SRS in the band 8 400-8 450 MHz
and near-Earth SRS in the band 8 450-8 500 MHz, are analysed.
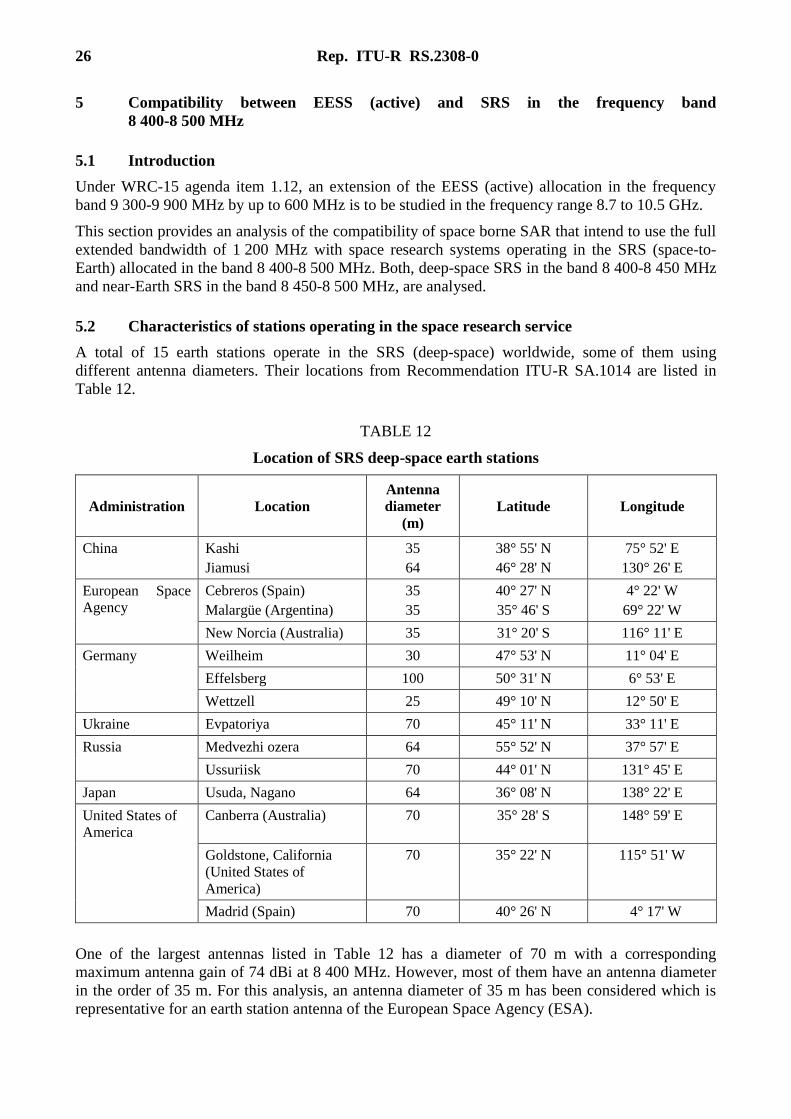
5.2 Characteristics of stations operating in the space research service
A total of 15 earth stations operate in the SRS (deep-space) worldwide, some of them using
different antenna diameters. Their locations from Recommendation ITU-R SA.1014 are listed in
Table 12.
TABLE 12
Location of SRS deep-space earth stations
Administration Location
Antenna
diameter
(m)
Latitude Longitude
China Kashi
Jiamusi
35
64
38° 55' N
46° 28' N
75° 52' E
130° 26' E
European Space
Agency
Cebreros (Spain)
Malargüe (Argentina)
35
35
40° 27' N
35° 46' S
4° 22' W
69° 22' W
New Norcia (Australia) 35 31° 20' S 116° 11' E
Germany Weilheim 30 47° 53' N 11° 04' E
Effelsberg 100 50° 31' N 6° 53' E
Wettzell 25 49° 10' N 12° 50' E
Ukraine Evpatoriya 70 45° 11' N 33° 11' E
Russia Medvezhi ozera 64 55° 52' N 37° 57' E
Ussuriisk 70 44° 01' N 131° 45' E
Japan Usuda, Nagano 64 36° 08' N 138° 22' E
United States of
America
Canberra (Australia) 70 35° 28' S 148° 59' E
Goldstone, California
(United States of
America)
70 35° 22' N 115° 51' W
Madrid (Spain) 70 40° 26' N 04° 17' W
One of the largest antennas listed in Table 12 has a diameter of 70 m with a corresponding
maximum antenna gain of 74 dBi at 8 400 MHz. However, most of them have an antenna diameter
in the order of 35 m. For this analysis, an antenna diameter of 35 m has been considered which is
representative for an earth station antenna of the European Space Agency (ESA).
Rep. ITU-R RS.2308-0 27
The 35 m antenna is also used for Lagrange missions. Other near-Earth earth stations may use
smaller antennas for missions in high elliptical orbits or to the Moon. However, the same antenna
diameter of 35 m was also used for these missions in the analysis.
Recommendation ITU-R SA.1157 gives the protection criteria of SRS deep-space Earth stations as
–221 dB(W/Hz) for the SRS frequency band 8 400-8 450 MHz. The calculation of non-line-of-sight
interference due to trans-horizon propagation should be based on weather statistics that apply for
0.001% of the time. Recommendation ITU-R SA.1157 provides the protection criteria for receivers
in SRS deep-space systems. These protection criteria are set up to protect operations of SRS deep-
space earth stations and spacecraft.
Compliance to the protection criteria for these assets determines the mission success of SRS
deep-space missions. Harmful interference during mission critical events, e.g. orbit insertions,
planetary fly-bys, and entry-decent-and-landing (EDL) phases, can cause potential loss of a
spacecraft or loss of invaluable data. There are also one-time scientific observations where
a spacecraft penetrates the atmosphere of a planet or a moon, or it impacts a moon, a planet,
an asteroid, or a comet. The spacecraft may be destroyed in the process, and therefore, the data
transmitted during the approach or the moments before and during the impacts define the success of
the missions.
In addition to the provisioning of communications and navigation needs for SRS deep-space
spacecraft, the 8 400-8 450 MHz frequency band is also used for radio science experiments.
For these experiments, it can be difficult to distinguish between interference events and valid
observations. Therefore, the protection of SRS deep-space spacecraft and earth stations, to the
extent demanded by Recommendation ITU-R SA.1157, is crucial for the success of SRS deep-space
missions.
It has to be recognized that the SRS deep-space bands are not shared with any space or aeronautical
radio services. For the analyses it was assumed, that the value of –221 dBW/Hz is essential to be
met for 100% of the time.
Recommendation ITU-R SA.609 recommends a protection criterion for near-Earth SRS earth
stations of –216 dBW/Hz in frequency bands below 20 GHz. Similar to Recommendation ITU-R
SA.1157, Recommendation ITU-R SA.609 leaves ambiguities when dealing with non-terrestrial
interference sources. However, similar to other studies performed in the past and at 37-38 GHz,
a percentage of time of 0.1% was considered for unmanned missions and 0.001% for manned
missions.
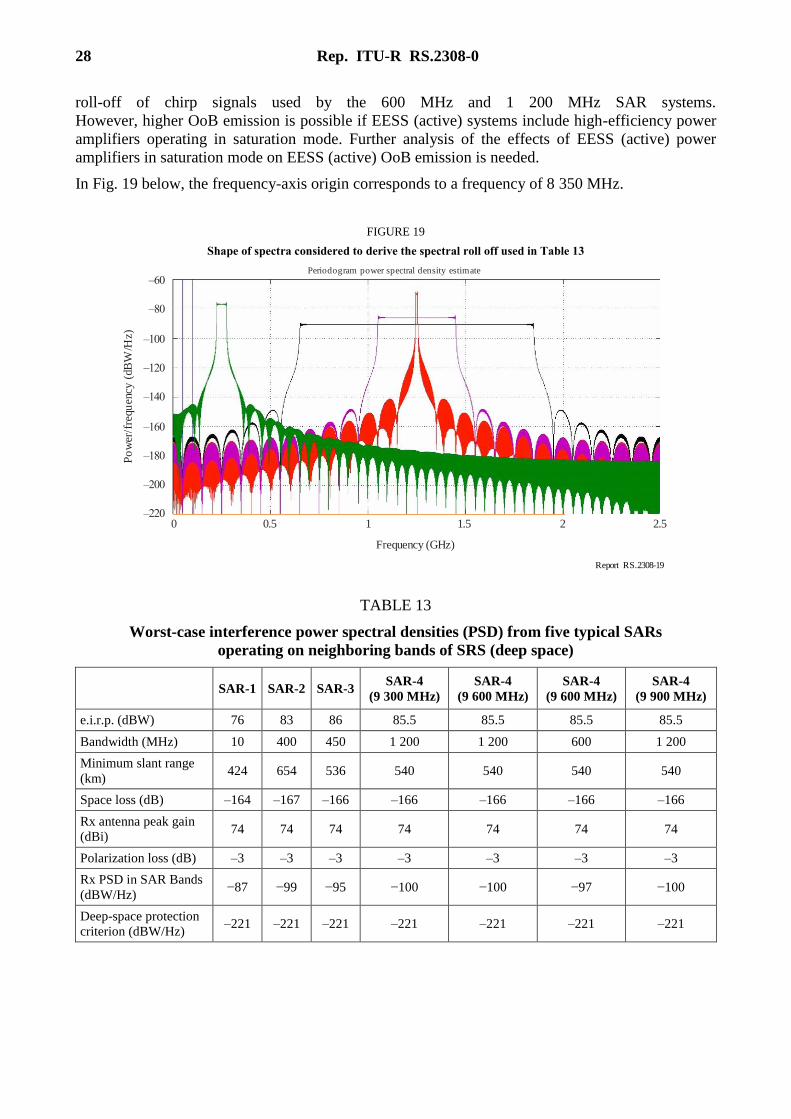
5.3 Static analysis with SRS deep-space earth stations
Table 13 provides the results of a static analysis using the characteristics of SAR-1, SAR-2 and
SAR-3 systems which were taken into account in the studies prior to WRC-07 leading to the
extension of the EESS allocation from 300 to 600 MHz. SAR-4 represents a new SAR system
generation that intends to provide high resolution performance using a 1 200 MHz chirp bandwidth,
preferably with a centered frequency at 9 600 MHz.
Four cases were defined for SAR-4 transmissions:
– a chirp bandwidth of 1 200 MHz centered on 9 300 MHz;
– a chirp bandwidth of 600 MHz centered on 9 600 MHz;
– a chirp bandwidth of 1 200 MHz centered on 9 600 MHz;
– a chirp bandwidth of 1 200 MHz centered on 9 900 MHz.
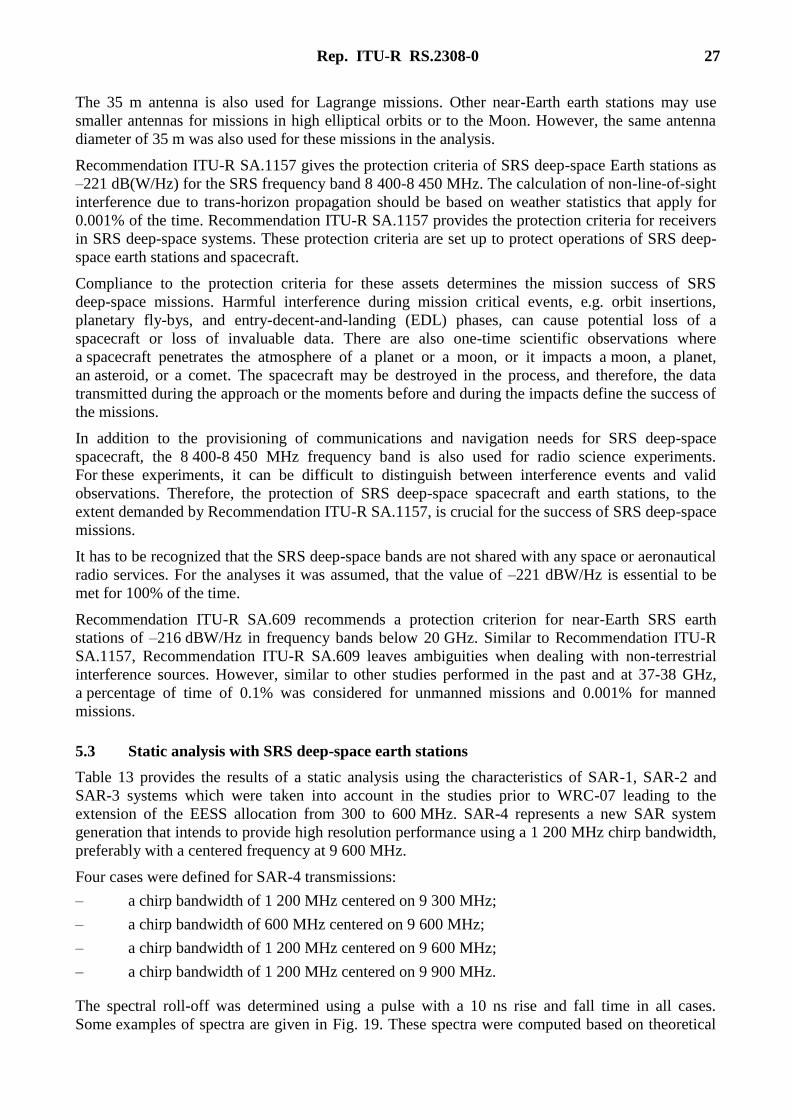
The spectral roll-off was determined using a pulse with a 10 ns rise and fall time in all cases.
Some examples of spectra are given in Fig. 19. These spectra were computed based on theoretical
28 Rep. ITU-R RS.2308-0
roll-off of chirp signals used by the 600 MHz and 1 200 MHz SAR systems.
However, higher OoB emission is possible if EESS (active) systems include high-efficiency power
amplifiers operating in saturation mode. Further analysis of the effects of EESS (active) power
amplifiers in saturation mode on EESS (active) OoB emission is needed.
In Fig. 19 below, the frequency-axis origin corresponds to a frequency of 8 350 MHz.
FIGURE 19
Shape of spectra considered to derive the spectral roll off used in Table 13
R pe ort RS.2308-19
0
Frequency (GHz)
Periodogram power spectral density estimate
Po
wer
/fre
quen
cy (
dBW
/Hz)
–200
0.5
–160
–140
–120
1 1.5 2 2.5
–60
–100
–220
–180
–80
TABLE 13
Worst-case interference power spectral densities (PSD) from five typical SARs
operating on neighboring bands of SRS (deep space)
SAR-1 SAR-2 SAR-3 SAR-4
(9 300 MHz)
SAR-4
(9 600 MHz)
SAR-4
(9 600 MHz)
SAR-4
(9 900 MHz)
e.i.r.p. (dBW) 76 83 86 85.5 85.5 85.5 85.5
Bandwidth (MHz) 10 400 450 1 200 1 200 600 1 200
Minimum slant range
(km) 424 654 536 540 540 540 540
Space loss (dB) –164 –167 –166 –166 –166 –166 –166
Rx antenna peak gain
(dBi) 74 74 74 74 74 74 74
Polarization loss (dB) –3 –3 –3 –3 –3 –3 –3
Rx PSD in SAR Bands
(dBW/Hz) −87 −99 −95 −100 −100 −97 −100
Deep-space protection
criterion (dBW/Hz) –221 –221 –221 –221 –221 –221 –221
Rep. ITU-R RS.2308-0 29
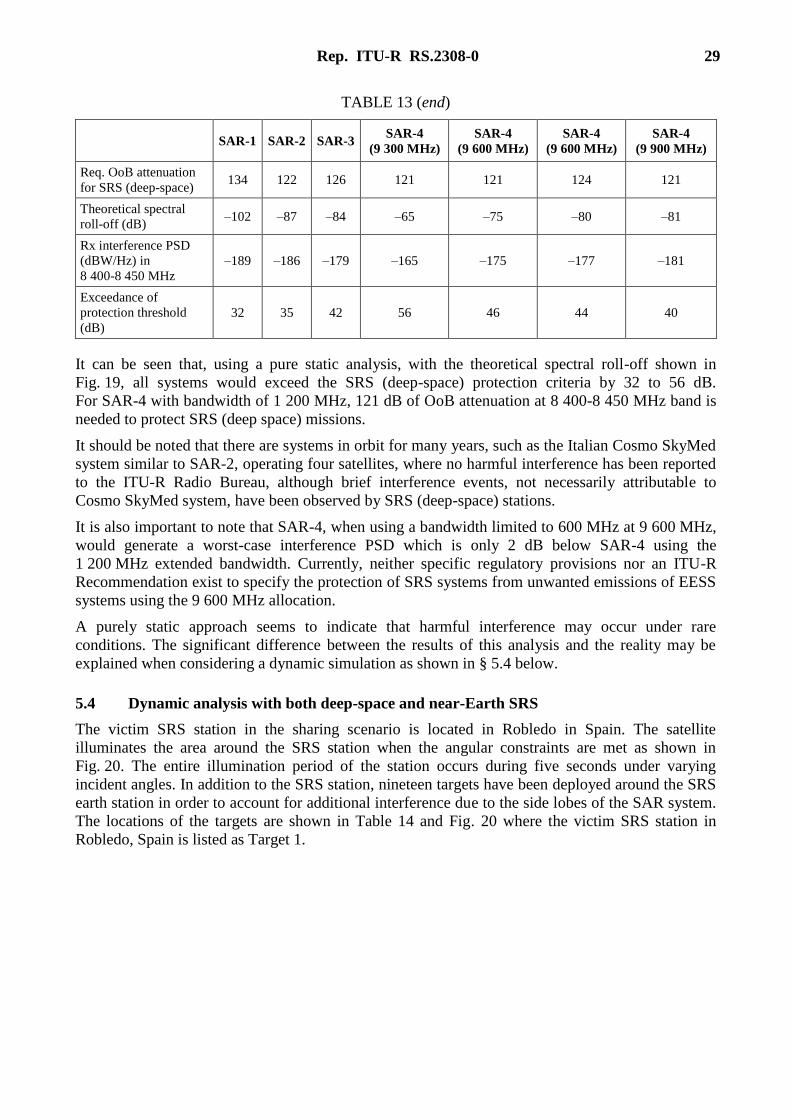
TABLE 13 (end)
SAR-1 SAR-2 SAR-3 SAR-4
(9 300 MHz)
SAR-4
(9 600 MHz)
SAR-4
(9 600 MHz)
SAR-4
(9 900 MHz)
Req. OoB attenuation
for SRS (deep-space) 134 122 126 121 121 124 121
Theoretical spectral
roll-off (dB) –102 –87 –84 –65 –75 –80 –81
Rx interference PSD
(dBW/Hz) in
8 400-8 450 MHz
–189 –186 –179 –165 –175 –177 –181
Exceedance of
protection threshold
(dB)
32 35 42 56 46 44 40
It can be seen that, using a pure static analysis, with the theoretical spectral roll-off shown in
Fig. 19, all systems would exceed the SRS (deep-space) protection criteria by 32 to 56 dB.
For SAR-4 with bandwidth of 1 200 MHz, 121 dB of OoB attenuation at 8 400-8 450 MHz band is
needed to protect SRS (deep space) missions.
It should be noted that there are systems in orbit for many years, such as the Italian Cosmo SkyMed
system similar to SAR-2, operating four satellites, where no harmful interference has been reported
to the ITU-R Radio Bureau, although brief interference events, not necessarily attributable to
Cosmo SkyMed system, have been observed by SRS (deep-space) stations.
It is also important to note that SAR-4, when using a bandwidth limited to 600 MHz at 9 600 MHz,
would generate a worst-case interference PSD which is only 2 dB below SAR-4 using the
1 200 MHz extended bandwidth. Currently, neither specific regulatory provisions nor an ITU-R
Recommendation exist to specify the protection of SRS systems from unwanted emissions of EESS
systems using the 9 600 MHz allocation.
A purely static approach seems to indicate that harmful interference may occur under rare
conditions. The significant difference between the results of this analysis and the reality may be
explained when considering a dynamic simulation as shown in § 5.4 below.
5.4 Dynamic analysis with both deep-space and near-Earth SRS
The victim SRS station in the sharing scenario is located in Robledo in Spain. The satellite
illuminates the area around the SRS station when the angular constraints are met as shown in
Fig. 20. The entire illumination period of the station occurs during five seconds under varying
incident angles. In addition to the SRS station, nineteen targets have been deployed around the SRS
earth station in order to account for additional interference due to the side lobes of the SAR system.
The locations of the targets are shown in Table 14 and Fig. 20 where the victim SRS station in
Robledo, Spain is listed as Target 1.
30 Rep. ITU-R RS.2308-0
TABLE 14
Targets used in dynamic simulations of OoB interference to SRS
Lat (degrees) Lon (degrees) Lat (degrees) Lon (degrees)
Target 1 40.260 –4.170 Target 11 62.730 –2.708
Target 2 41.648 –0.805 Target 12 33.645 –2.802
Target 3 52.840 8.828 Target 13 37.978 –8.145
Target 4 44.354 11.442 Target 14 48.161 –3.191
Target 5 45.226 1.809 Target 15 19.463 –10.006
Target 6 46.097 –13.741 Target 16 50.035 21.268
Target 7 53.712 –2.136 Target 17 60.159 16.357
Target 8 30.730 –21.310 Target 18 24.876 13.650
Target 9 25.687 –3.939 Target 19 34.799 17.058
Target 10 56.856 –10.571 Target 20 32.749 4.653
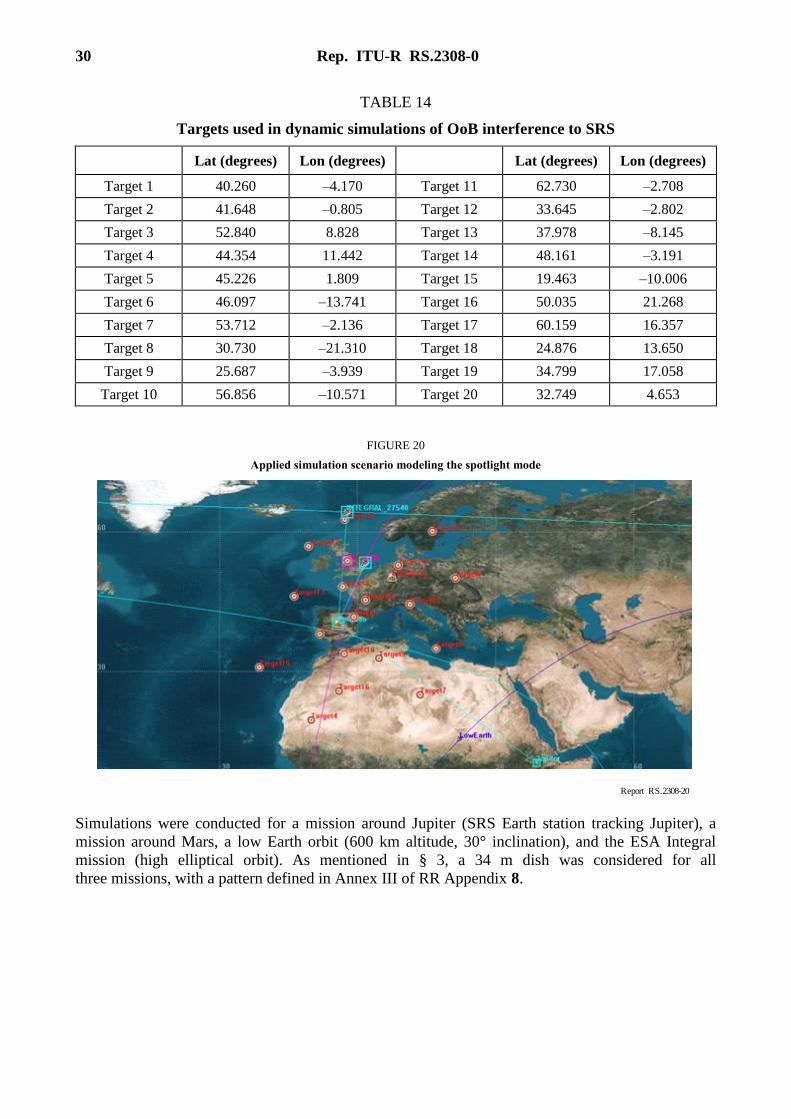
FIGURE 20
Applied simulation scenario modeling the spotlight mode
R pe ort RS.2308-20
Simulations were conducted for a mission around Jupiter (SRS Earth station tracking Jupiter), a
mission around Mars, a low Earth orbit (600 km altitude, 30° inclination), and the ESA Integral
mission (high elliptical orbit). As mentioned in § 3, a 34 m dish was considered for all
three missions, with a pattern defined in Annex III of RR Appendix 8.
Rep. ITU-R RS.2308-0 31
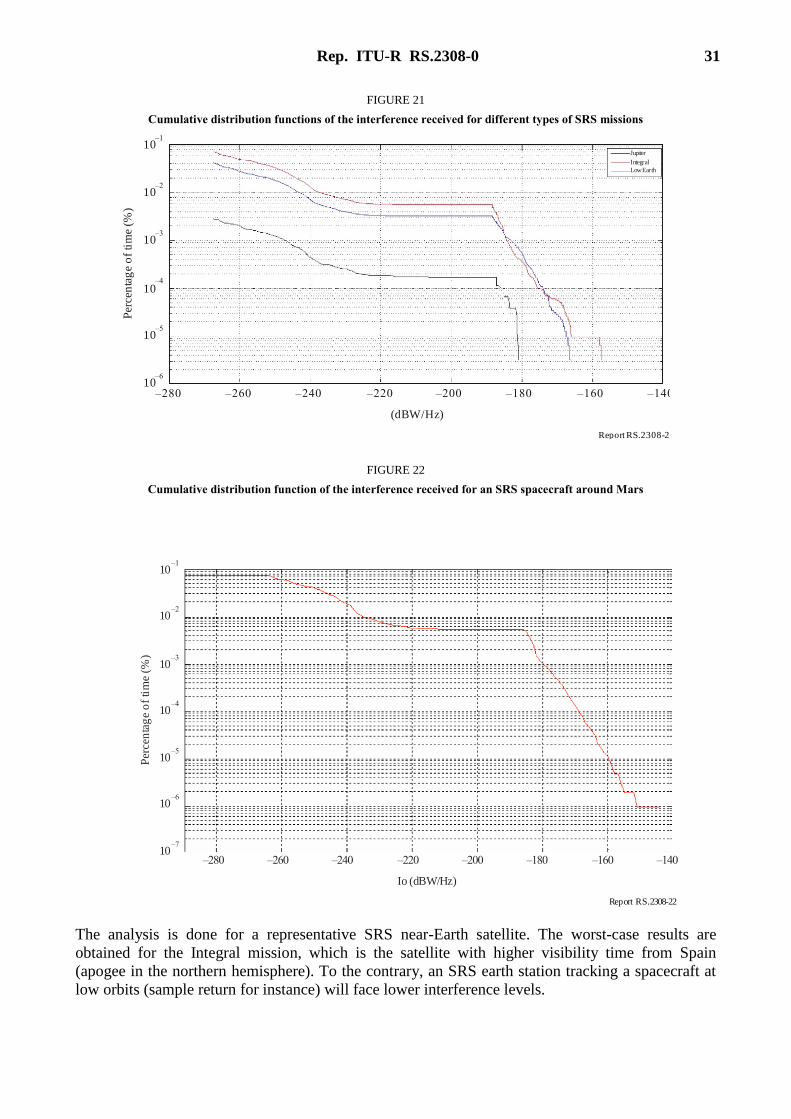
FIGURE 21
Cumulative distribution functions of the interference received for different types of SRS missions
R pe ort RS.2308-21
–280
(dBW/Hz)
Per
cen
tag
e o
f ti
me
(%)
10–1
10–2
10–3
10–4
10–6
–260 –240 –220 –200 –180 –160 –140
Jupiter
Integral
10–5
Low Earth
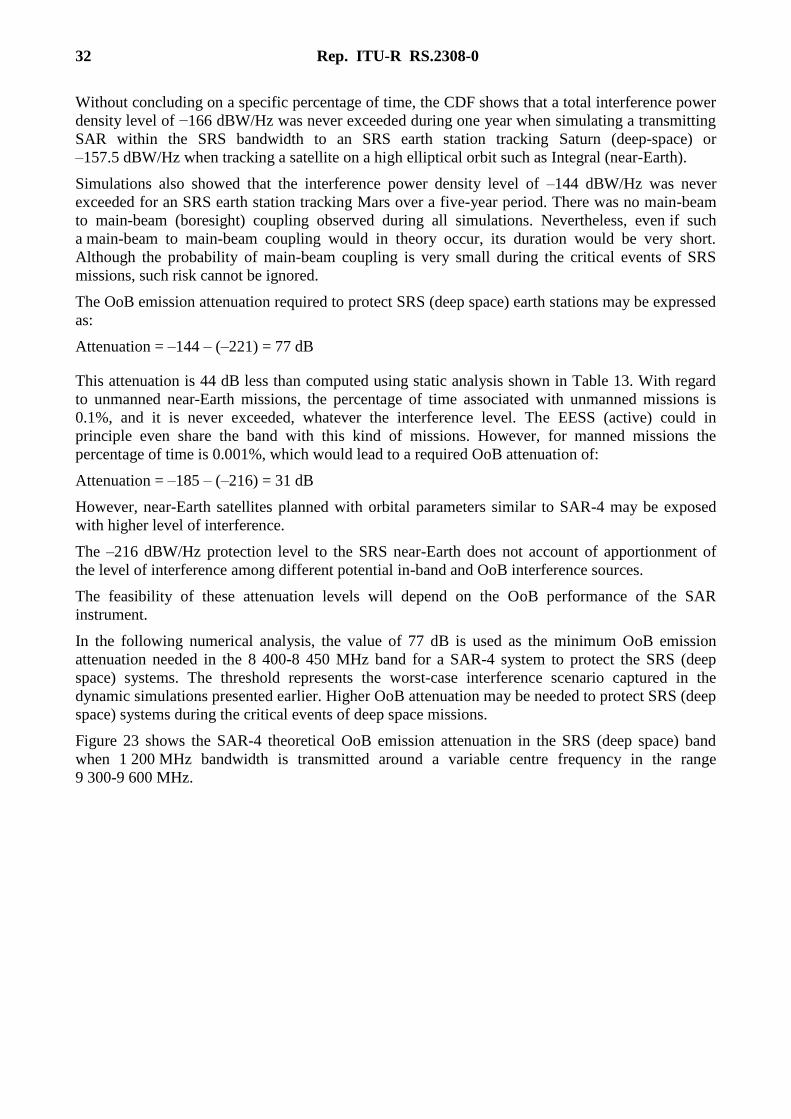
FIGURE 22
Cumulative distribution function of the interference received for an SRS spacecraft around Mars
R pe ort RS.2308-22
–280
Io (dBW/Hz)
Per
cen
tag
e o
f ti
me
(%)
10–1
10–2
10–3
10–4
10–6
–260 –240 –220 –200 –180 –160 –140
10–5
10–7
The analysis is done for a representative SRS near-Earth satellite. The worst-case results are
obtained for the Integral mission, which is the satellite with higher visibility time from Spain
(apogee in the northern hemisphere). To the contrary, an SRS earth station tracking a spacecraft at
low orbits (sample return for instance) will face lower interference levels.
32 Rep. ITU-R RS.2308-0
Without concluding on a specific percentage of time, the CDF shows that a total interference power
density level of −166 dBW/Hz was never exceeded during one year when simulating a transmitting
SAR within the SRS bandwidth to an SRS earth station tracking Saturn (deep-space) or
–157.5 dBW/Hz when tracking a satellite on a high elliptical orbit such as Integral (near-Earth).
Simulations also showed that the interference power density level of –144 dBW/Hz was never
exceeded for an SRS earth station tracking Mars over a five-year period. There was no main-beam
to main-beam (boresight) coupling observed during all simulations. Nevertheless, even if such
a main-beam to main-beam coupling would in theory occur, its duration would be very short.
Although the probability of main-beam coupling is very small during the critical events of SRS
missions, such risk cannot be ignored.
The OoB emission attenuation required to protect SRS (deep space) earth stations may be expressed
as:
Attenuation = –144 – (–221) = 77 dB
This attenuation is 44 dB less than computed using static analysis shown in Table 13. With regard
to unmanned near-Earth missions, the percentage of time associated with unmanned missions is
0.1%, and it is never exceeded, whatever the interference level. The EESS (active) could in
principle even share the band with this kind of missions. However, for manned missions the
percentage of time is 0.001%, which would lead to a required OoB attenuation of:
Attenuation = –185 – (–216) = 31 dB
However, near-Earth satellites planned with orbital parameters similar to SAR-4 may be exposed
with higher level of interference.
The –216 dBW/Hz protection level to the SRS near-Earth does not account of apportionment of
the level of interference among different potential in-band and OoB interference sources.
The feasibility of these attenuation levels will depend on the OoB performance of the SAR
instrument.
In the following numerical analysis, the value of 77 dB is used as the minimum OoB emission
attenuation needed in the 8 400-8 450 MHz band for a SAR-4 system to protect the SRS (deep
space) systems. The threshold represents the worst-case interference scenario captured in the
dynamic simulations presented earlier. Higher OoB attenuation may be needed to protect SRS (deep
space) systems during the critical events of deep space missions.
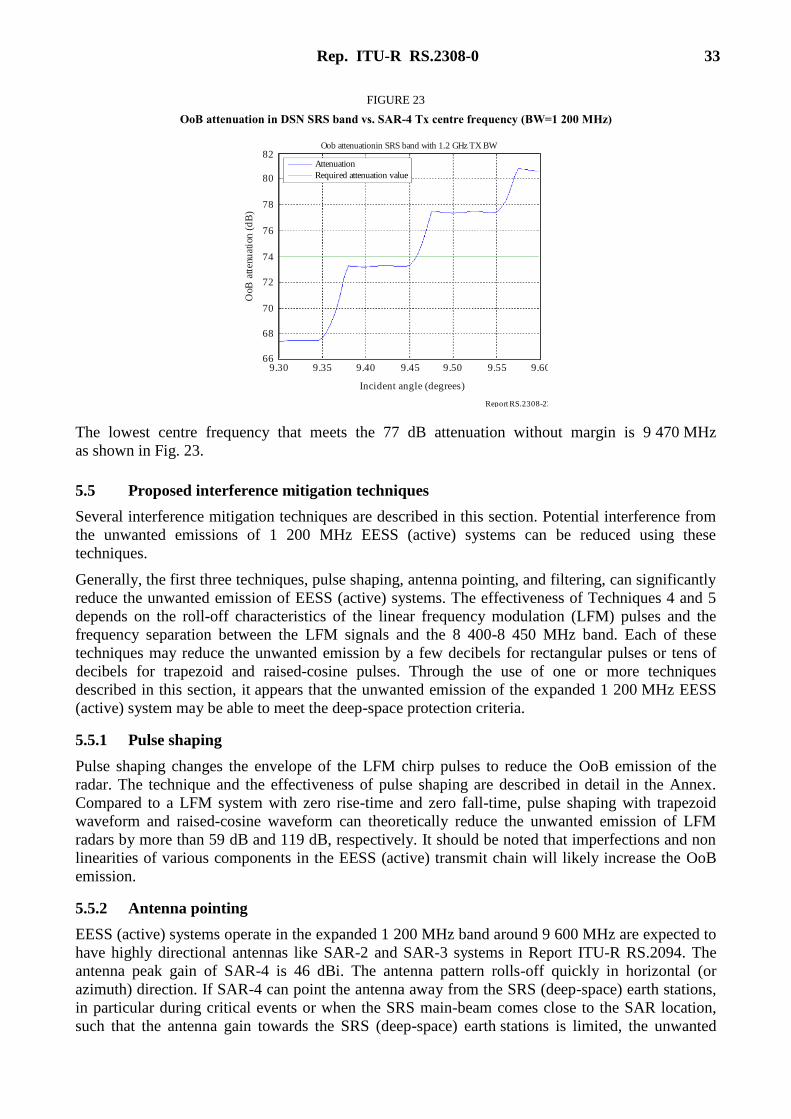
Figure 23 shows the SAR-4 theoretical OoB emission attenuation in the SRS (deep space) band
when 1 200 MHz bandwidth is transmitted around a variable centre frequency in the range
9 300-9 600 MHz.
Rep. ITU-R RS.2308-0 33
FIGURE 23
OoB attenuation in DSN SRS band vs. SAR-4 Tx centre frequency (BW=1 200 MHz)
R pe ort RS.2308-23
9.30
Incident angle (degrees)
Oob attenuationin SRS band with 1.2 GHz TX BW
OoB
att
enu
atio
n (
dB
)
66
70
72
76
82
78
Required attenuation value
9.35 9.40 9.45 9.50 9.55 9.60
68
74
80
Attenuation
The lowest centre frequency that meets the 77 dB attenuation without margin is 9 470 MHz
as shown in Fig. 23.
5.5 Proposed interference mitigation techniques
Several interference mitigation techniques are described in this section. Potential interference from
the unwanted emissions of 1 200 MHz EESS (active) systems can be reduced using these
techniques.
Generally, the first three techniques, pulse shaping, antenna pointing, and filtering, can significantly
reduce the unwanted emission of EESS (active) systems. The effectiveness of Techniques 4 and 5
depends on the roll-off characteristics of the linear frequency modulation (LFM) pulses and the
frequency separation between the LFM signals and the 8 400-8 450 MHz band. Each of these
techniques may reduce the unwanted emission by a few decibels for rectangular pulses or tens of
decibels for trapezoid and raised-cosine pulses. Through the use of one or more techniques
described in this section, it appears that the unwanted emission of the expanded 1 200 MHz EESS
(active) system may be able to meet the deep-space protection criteria.
5.5.1 Pulse shaping
Pulse shaping changes the envelope of the LFM chirp pulses to reduce the OoB emission of the
radar. The technique and the effectiveness of pulse shaping are described in detail in the Annex.
Compared to a LFM system with zero rise-time and zero fall-time, pulse shaping with trapezoid
waveform and raised-cosine waveform can theoretically reduce the unwanted emission of LFM
radars by more than 59 dB and 119 dB, respectively. It should be noted that imperfections and non
linearities of various components in the EESS (active) transmit chain will likely increase the OoB
emission.
5.5.2 Antenna pointing
EESS (active) systems operate in the expanded 1 200 MHz band around 9 600 MHz are expected to
have highly directional antennas like SAR-2 and SAR-3 systems in Report ITU-R RS.2094. The
antenna peak gain of SAR-4 is 46 dBi. The antenna pattern rolls-off quickly in horizontal (or
azimuth) direction. If SAR-4 can point the antenna away from the SRS (deep-space) earth stations,
in particular during critical events or when the SRS main-beam comes close to the SAR location,
such that the antenna gain towards the SRS (deep-space) earth stations is limited, the unwanted
34 Rep. ITU-R RS.2308-0
emission of SAR-4 would be drastically reduced, thus reducing the likelihood of harmful
interference or saturation of SRS receivers.
This could be achieved through operational coordination between the SRS (deep space) operator
and the EESS (active) operator.
5.5.3 Filtering
Depending on the implementations of EESS (active) systems, transmit filters and waveguides with
steep cut-off below the EESS (active) band can be implemented to limit the unwanted emission of
the systems. Filtering techniques have been successfully implemented by EESS space-to-Earth links
in the 8 025-8 400 MHz band to reduce the unwanted emission of EESS downlinks by 40 dB and
more in the 8 400-8 450 MHz band.
The phased array antennas are composed of several hundreds of transmission and receive (TR)
modules including high-power amplifiers. Any output filtering would have to be applied to the high
power stages of these modules and, thus, unduly increases the system complexity, costs,
and performance losses of the radar. As an example, the specifications for radar systems in Europe
in terms of spurious emission levels are 100 dB PEP, with the exception of phased array radars for
which it is 60 dB PEP, for the reasons given above. It should be noted that the filtering capability of
each TR module radiating element is also limited, contrary to other types of antennas where their
gain decreases rapidly with frequency.
However, if needed, an appropriate notch filter may be added in the transmission chain in order to
attenuate to the best possible extent the unwanted emissions of the SAR, in a limited bandwidth.
5.5.4 Selection of frequency sweep and pulse duration
The unwanted emission of LFM radars is a function of both the frequency sweep range and duration
of the chirp signal. The unwanted emission increases as the chirp sweep range increases, and also as
the time duration of the chirp signal decreases. It may be possible for an EESS (active) operator to
vary the radar sweep range and pulse duration to reduce the unwanted emission, especially when the
EESS (active) antenna is pointing near as SRS deep-space earth station. For example, the EESS
satellite will use only 600 MHz of spectrum instead of the full 1 200 MHz bandwidth when
operating in scan mode. The full 1200 MHz spectrum will only be used in the spotlight mode, when
highest resolution is required. This can be assumed to occur for less than 30% of all images taken
by the radar.
A different pulse width would allow for only a slight variation in terms of average PSD in the SRS
(deep-space) bandwidth, and would not be sufficient by itself.
The area acquisition in spotlight-mode is performed by telecommand of the desired beam geometry
(size, pointing) followed by a beam steering controlled through orbit tracking. Therefore, no scan or
other acquisition pattern precedes a high-resolution spot measurement.
5.5.5 Location of the 600 MHz extension
As Figures A-1, A-2, and A-3 in Annex A show, unwanted emission of LFM systems decreases as
the frequency separation from the EESS (active) band increases. Tables A-1, A-2, and A-3 in
Annex A show that among the three expansion options examined, unwanted interference to the
8 400-8 450 MHz band is the lowest when the additional 600 MHz is added above the current
9 300-9 900 MHz allocation. The interference to the 8 400-8 450 MHz is the highest if the
additional 600 MHz is added below the current allocation, closer to the 8 400-8 450 MHz band.
This would be feasible in practice, although the best performance would be obtained if the same
centre frequency as with legacy modes is retained. It is also important to mention that it would not
be possible to use different centre frequencies between different Regions.
Rep. ITU-R RS.2308-0 35
5.5.6 Geographic separation
It is also possible to reduce the interference from EESS (active) systems through geographic
separation. EESS (active) systems may keep a minimum slant range from an SRS deep-space earth
station to maintain a minimum free space loss resulting in an exclusion zone. Taken to extreme,
EESS (active) systems may refrain from transmission whenever there is line-of-sight between the
EESS (active) systems and a SRS deep-space earth station.
Preventing the spotlight mode over an area of several thousands of square-kilometers around an
SRS earth station is however assumed to be too constraining and not necessary.
5.6 Potential saturation and damage of the SRS earth station front end
NASA and ESA have provided characteristics of potential damage level if their earth stations would
be exposed to SAR radiation under most unfavourable geometry, i.e. near boresight coupling of
antennas. These levels are –107 dBW in the band of 8 400-8 500 MHz for the ESA earth stations
and –105 dBW in the band of 8 200-8 700 MHz for the NASA earth stations as measured at the
direct input terminal of the receiver front-ends (LNA). NASA’s SRS receivers in Table 12 are
designed to also support NASA’s solar system radar operating in the frequency range
8 500-8 700 MHz which is allocated to radiolocation service. These damage levels should not be
exceeded for any amount of time.
The saturation level for the NASA earth station is –115 dBW. The OoB emission from the EESS
(active) should be below this level especially during the critical events of SRS missions.
There are usually no particular filter inserted between the termination of an SRS earth station
antenna and the LNA.
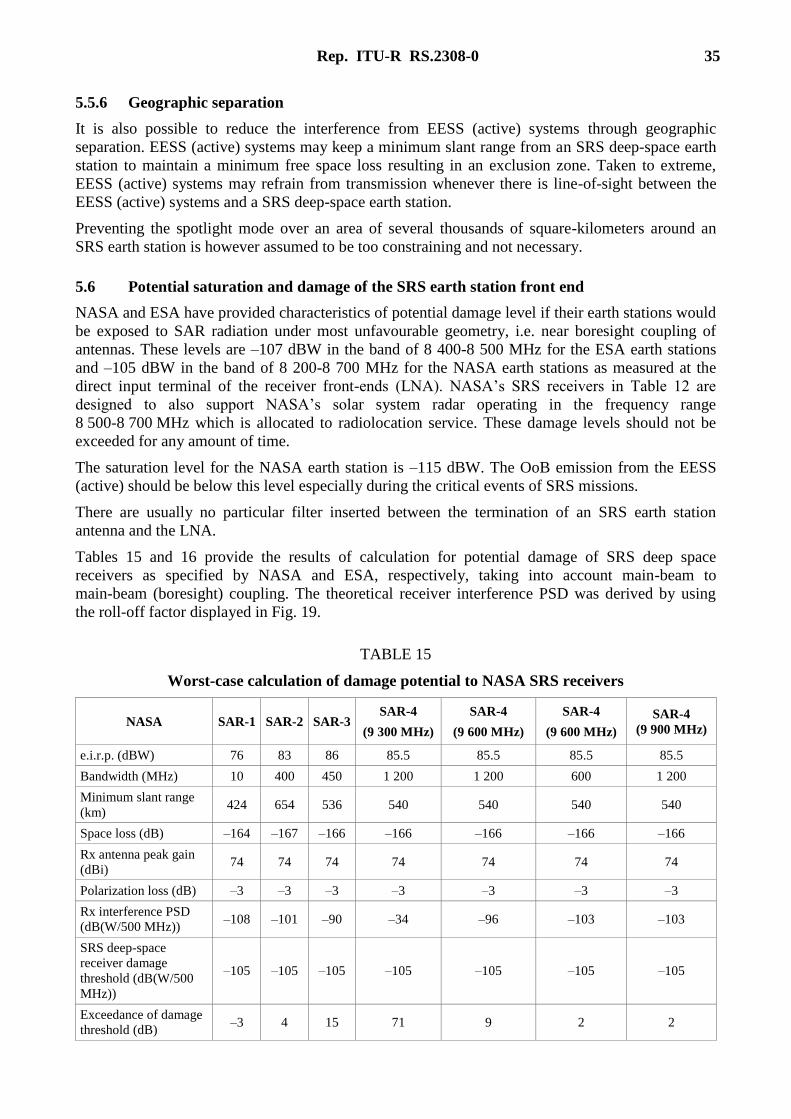
Tables 15 and 16 provide the results of calculation for potential damage of SRS deep space
receivers as specified by NASA and ESA, respectively, taking into account main-beam to
main-beam (boresight) coupling. The theoretical receiver interference PSD was derived by using
the roll-off factor displayed in Fig. 19.
TABLE 15
Worst-case calculation of damage potential to NASA SRS receivers
NASA SAR-1 SAR-2 SAR-3 SAR-4
(9 300 MHz)
SAR-4
(9 600 MHz)
SAR-4
(9 600 MHz)
SAR-4
(9 900 MHz)
e.i.r.p. (dBW) 76 83 86 85.5 85.5 85.5 85.5
Bandwidth (MHz) 10 400 450 1 200 1 200 600 1 200
Minimum slant range
(km) 424 654 536 540 540 540 540
Space loss (dB) –164 –167 –166 –166 –166 –166 –166
Rx antenna peak gain
(dBi) 74 74 74 74 74 74 74
Polarization loss (dB) –3 –3 –3 –3 –3 –3 –3
Rx interference PSD
(dB(W/500 MHz)) –108 –101 –90 –34 –96 –103 –103
SRS deep-space
receiver damage
threshold (dB(W/500
MHz))
–105 –105 –105 –105 –105 –105 –105
Exceedance of damage
threshold (dB) –3 4 15 71 9 2 2
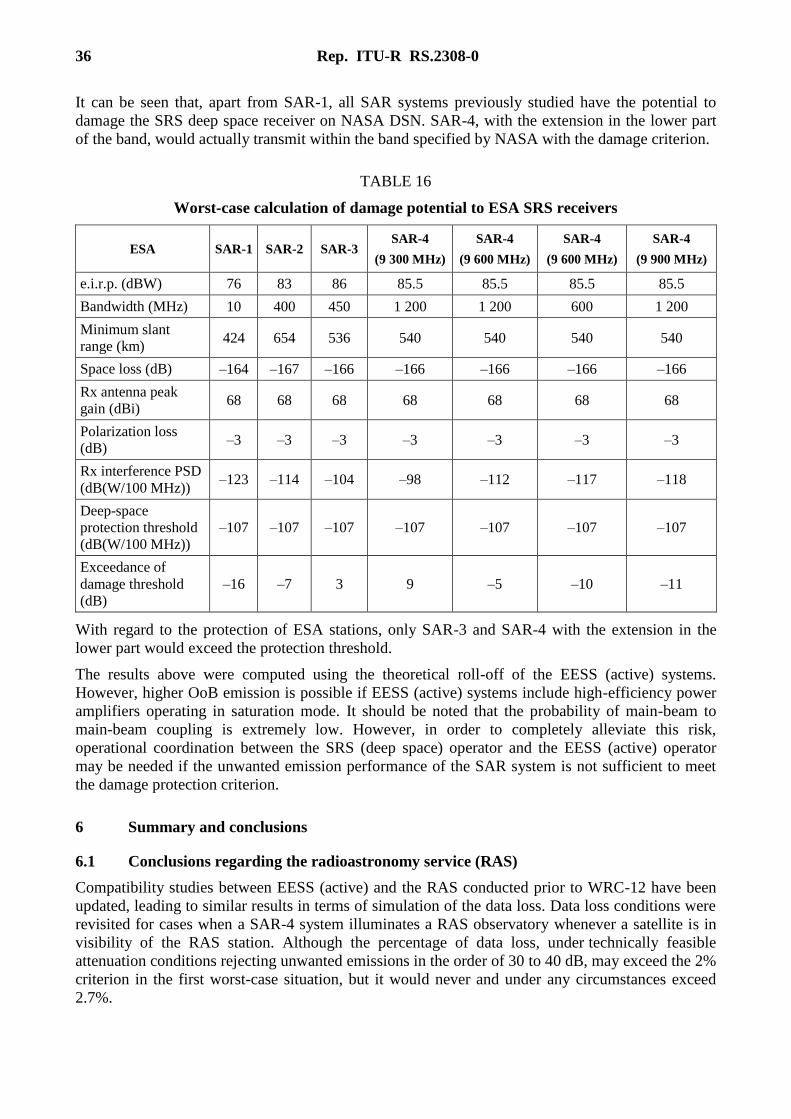
36 Rep. ITU-R RS.2308-0
It can be seen that, apart from SAR-1, all SAR systems previously studied have the potential to
damage the SRS deep space receiver on NASA DSN. SAR-4, with the extension in the lower part
of the band, would actually transmit within the band specified by NASA with the damage criterion.
TABLE 16
Worst-case calculation of damage potential to ESA SRS receivers
ESA SAR-1 SAR-2 SAR-3 SAR-4
(9 300 MHz)
SAR-4
(9 600 MHz)
SAR-4
(9 600 MHz)
SAR-4
(9 900 MHz)
e.i.r.p. (dBW) 76 83 86 85.5 85.5 85.5 85.5
Bandwidth (MHz) 10 400 450 1 200 1 200 600 1 200
Minimum slant
range (km) 424 654 536 540 540 540 540
Space loss (dB) –164 –167 –166 –166 –166 –166 –166
Rx antenna peak
gain (dBi) 68 68 68 68 68 68 68
Polarization loss
(dB) –3 –3 –3 –3 –3 –3 –3
Rx interference PSD
(dB(W/100 MHz)) –123 –114 –104 –98 –112 –117 –118
Deep-space
protection threshold
(dB(W/100 MHz))
–107 –107 –107 –107 –107 –107 –107
Exceedance of
damage threshold
(dB)
–16 –7 3 9 –5 –10 –11
With regard to the protection of ESA stations, only SAR-3 and SAR-4 with the extension in the
lower part would exceed the protection threshold.
The results above were computed using the theoretical roll-off of the EESS (active) systems.
However, higher OoB emission is possible if EESS (active) systems include high-efficiency power
amplifiers operating in saturation mode. It should be noted that the probability of main-beam to
main-beam coupling is extremely low. However, in order to completely alleviate this risk,
operational coordination between the SRS (deep space) operator and the EESS (active) operator
may be needed if the unwanted emission performance of the SAR system is not sufficient to meet
the damage protection criterion.
6 Summary and conclusions
6.1 Conclusions regarding the radioastronomy service (RAS)
Compatibility studies between EESS (active) and the RAS conducted prior to WRC-12 have been
updated, leading to similar results in terms of simulation of the data loss. Data loss conditions were
revisited for cases when a SAR-4 system illuminates a RAS observatory whenever a satellite is in
visibility of the RAS station. Although the percentage of data loss, under technically feasible
attenuation conditions rejecting unwanted emissions in the order of 30 to 40 dB, may exceed the 2%
criterion in the first worst-case situation, but it would never and under any circumstances exceed
2.7%.
Rep. ITU-R RS.2308-0 37
Reducing the data loss to 2%, as required by Recommendation ITU-R RA.1513, would make it
necessary to attenuate the unwanted emissions by 63 dB with regard to the peak envelope power of
the SAR pulse. If this would be impossible, particularly in the case of an extension into frequencies
above the current allocation, additional mitigation techniques would become necessary. One of
these possible mitigation techniques would consist in limiting the number of image acquisitions of
areas where RAS observatories performing observations in the 10.6-10.7 GHz range are located.
Accidental damage to the RAS receiver can be avoided, if an area of up to 46 km (vertical) by
19.4 km (horizontal) centered on the RAS station is excluded from illumination, or if the RAS
station avoids pointing towards the satellite, or to four angular sectors while the satellite is visible.
6.2 Conclusions regarding the EESS (passive)
The sharing conditions of a new generation of very wide band SAR-4 system using chirp bandwidth
of up to 1 200 MHz around 9 600 MHz has been analysed. Although the worst-case analyses
suggest a potential necessity of high attenuation levels for OOB emissions, the more realistic cases
show that such worst-case scenarios are very unlikely to occur. Considering realistic SAR systems
which are only transmitting in the high resolution mode for very short fractions of time, the
protection criterion of EESS (passive) sensors will not be exceeded for more than 0.00004% of time
over 11 days.
It is expected that EESS (active) unwanted emissions would not cause difficulties to the protection
of EESS (passive) operating in the frequency band 10.6-10.7 GHz.
6.3 Conclusions regarding the space research service (SRS)
Studies have provided assessments of the unwanted emission of the bandwidth-expanded EESS
(active) systems and the impacts on the SRS deep-space and near-Earth downlinks in the bands
8 400-8 450 MHz and 8 450-8 500 MHz, respectively. Without any mitigating techniques,
1 200 MHz EESS (active) SAR systems pose a potential significant threat to the SRS deep-space
and near-Earth downlinks depending on the location of the new 600 MHz spectrum.
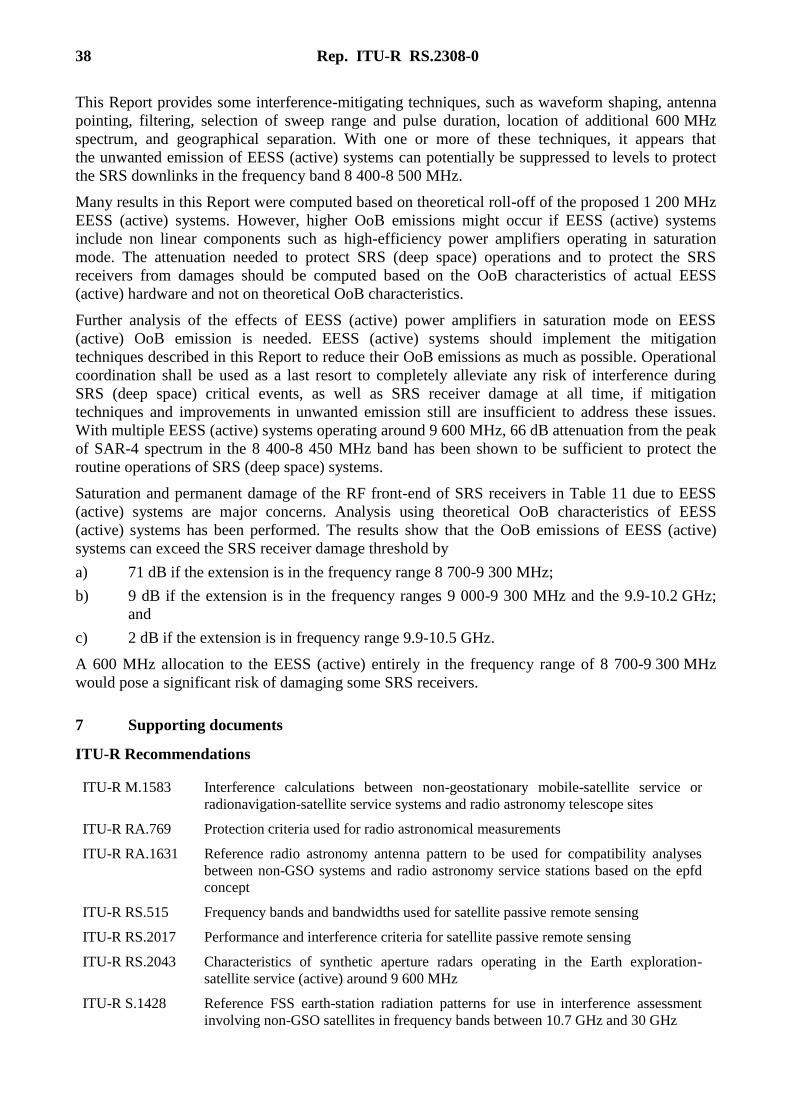
38 Rep. ITU-R RS.2308-0
This Report provides some interference-mitigating techniques, such as waveform shaping, antenna
pointing, filtering, selection of sweep range and pulse duration, location of additional 600 MHz
spectrum, and geographical separation. With one or more of these techniques, it appears that
the unwanted emission of EESS (active) systems can potentially be suppressed to levels to protect
the SRS downlinks in the frequency band 8 400-8 500 MHz.
Many results in this Report were computed based on theoretical roll-off of the proposed 1 200 MHz
EESS (active) systems. However, higher OoB emissions might occur if EESS (active) systems
include non linear components such as high-efficiency power amplifiers operating in saturation
mode. The attenuation needed to protect SRS (deep space) operations and to protect the SRS
receivers from damages should be computed based on the OoB characteristics of actual EESS
(active) hardware and not on theoretical OoB characteristics.
Further analysis of the effects of EESS (active) power amplifiers in saturation mode on EESS
(active) OoB emission is needed. EESS (active) systems should implement the mitigation
techniques described in this Report to reduce their OoB emissions as much as possible. Operational
coordination shall be used as a last resort to completely alleviate any risk of interference during
SRS (deep space) critical events, as well as SRS receiver damage at all time, if mitigation
techniques and improvements in unwanted emission still are insufficient to address these issues.
With multiple EESS (active) systems operating around 9 600 MHz, 66 dB attenuation from the peak
of SAR-4 spectrum in the 8 400-8 450 MHz band has been shown to be sufficient to protect the
routine operations of SRS (deep space) systems.
Saturation and permanent damage of the RF front-end of SRS receivers in Table 11 due to EESS
(active) systems are major concerns. Analysis using theoretical OoB characteristics of EESS
(active) systems has been performed. The results show that the OoB emissions of EESS (active)
systems can exceed the SRS receiver damage threshold by
a) 71 dB if the extension is in the frequency range 8 700-9 300 MHz;
b) 9 dB if the extension is in the frequency ranges 9 000-9 300 MHz and the 9.9-10.2 GHz;
and
c) 2 dB if the extension is in frequency range 9.9-10.5 GHz.
A 600 MHz allocation to the EESS (active) entirely in the frequency range of 8 700-9 300 MHz
would pose a significant risk of damaging some SRS receivers.
7 Supporting documents
ITU-R Recommendations
ITU-R M.1583 Interference calculations between non-geostationary mobile-satellite service or
radionavigation-satellite service systems and radio astronomy telescope sites
ITU-R RA.769 Protection criteria used for radio astronomical measurements
ITU-R RA.1631 Reference radio astronomy antenna pattern to be used for compatibility analyses
between non-GSO systems and radio astronomy service stations based on the epfd
concept
ITU-R RS.515 Frequency bands and bandwidths used for satellite passive remote sensing
ITU-R RS.2017 Performance and interference criteria for satellite passive remote sensing
ITU-R RS.2043 Characteristics of synthetic aperture radars operating in the Earth exploration-
satellite service (active) around 9 600 MHz
ITU-R S.1428 Reference FSS earth-station radiation patterns for use in interference assessment
involving non-GSO satellites in frequency bands between 10.7 GHz and 30 GHz
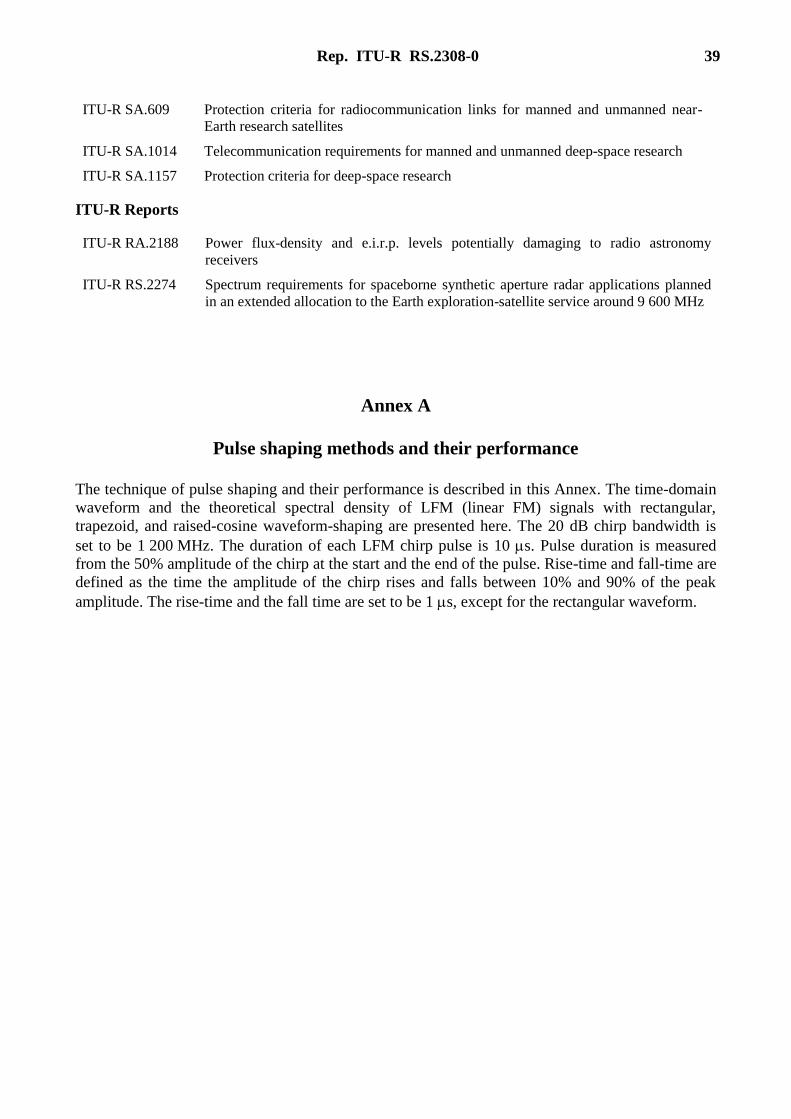
Rep. ITU-R RS.2308-0 39
ITU-R SA.609 Protection criteria for radiocommunication links for manned and unmanned near-
Earth research satellites
ITU-R SA.1014 Telecommunication requirements for manned and unmanned deep-space research
ITU-R SA.1157 Protection criteria for deep-space research
ITU-R Reports
ITU-R RA.2188 Power flux-density and e.i.r.p. levels potentially damaging to radio astronomy
receivers
ITU-R RS.2274 Spectrum requirements for spaceborne synthetic aperture radar applications planned
in an extended allocation to the Earth exploration-satellite service around 9 600 MHz
Annex A
Pulse shaping methods and their performance
The technique of pulse shaping and their performance is described in this Annex. The time-domain
waveform and the theoretical spectral density of LFM (linear FM) signals with rectangular,
trapezoid, and raised-cosine waveform-shaping are presented here. The 20 dB chirp bandwidth is
set to be 1 200 MHz. The duration of each LFM chirp pulse is 10 s. Pulse duration is measured
from the 50% amplitude of the chirp at the start and the end of the pulse. Rise-time and fall-time are
defined as the time the amplitude of the chirp rises and falls between 10% and 90% of the peak
amplitude. The rise-time and the fall time are set to be 1 s, except for the rectangular waveform.
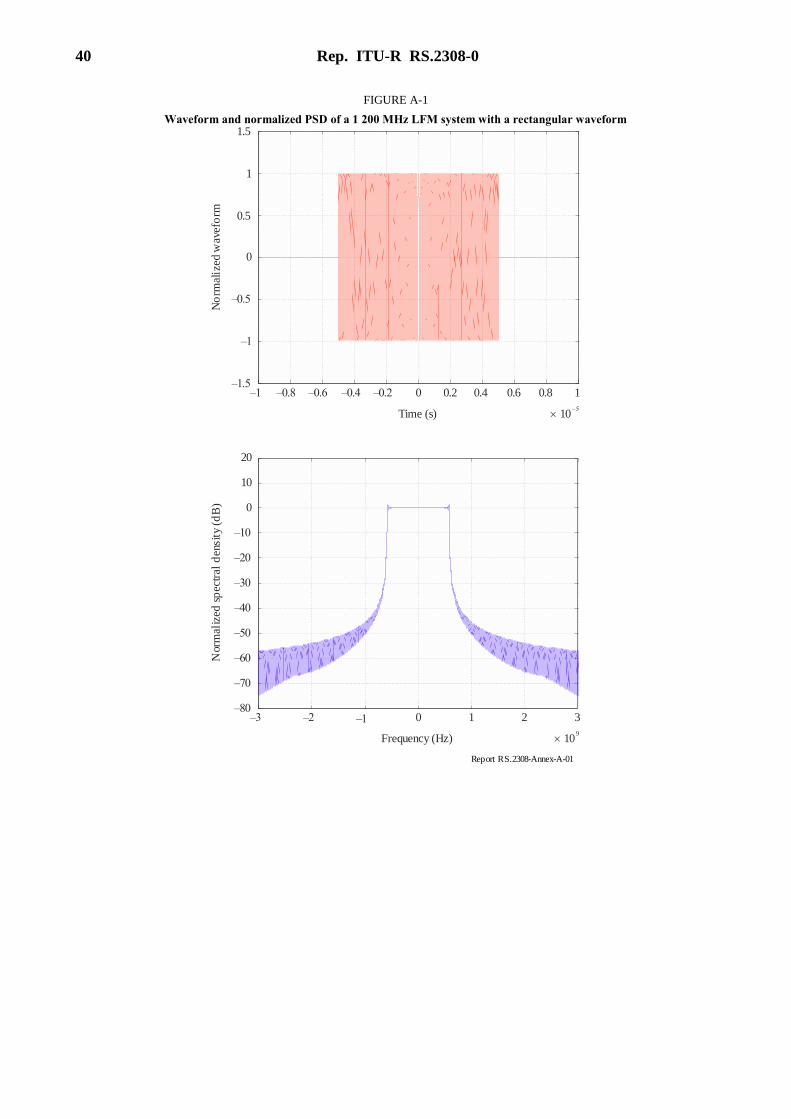
40 Rep. ITU-R RS.2308-0
FIGURE A-1
Waveform and normalized PSD of a 1 200 MHz LFM system with a rectangular waveform
–0.8
Time (s)
No
rmal
ized
wav
efo
rm
–1.5
–1
–0.5
0
–1 –0.6 –0.4 –0.2 0 0.2 0.4 0.6 0.8 1
0.5
1.5
1
R pe ort RS.2308-Annex-A-01
Frequency (Hz)
Nor
mal
ized
sp
ectr
al d
ensi
ty (
dB
)
–80–3 –2 –1 0 1 2 3
–70
–60
–50
–40
–30
–20
–10
0
20
10
10–5
109
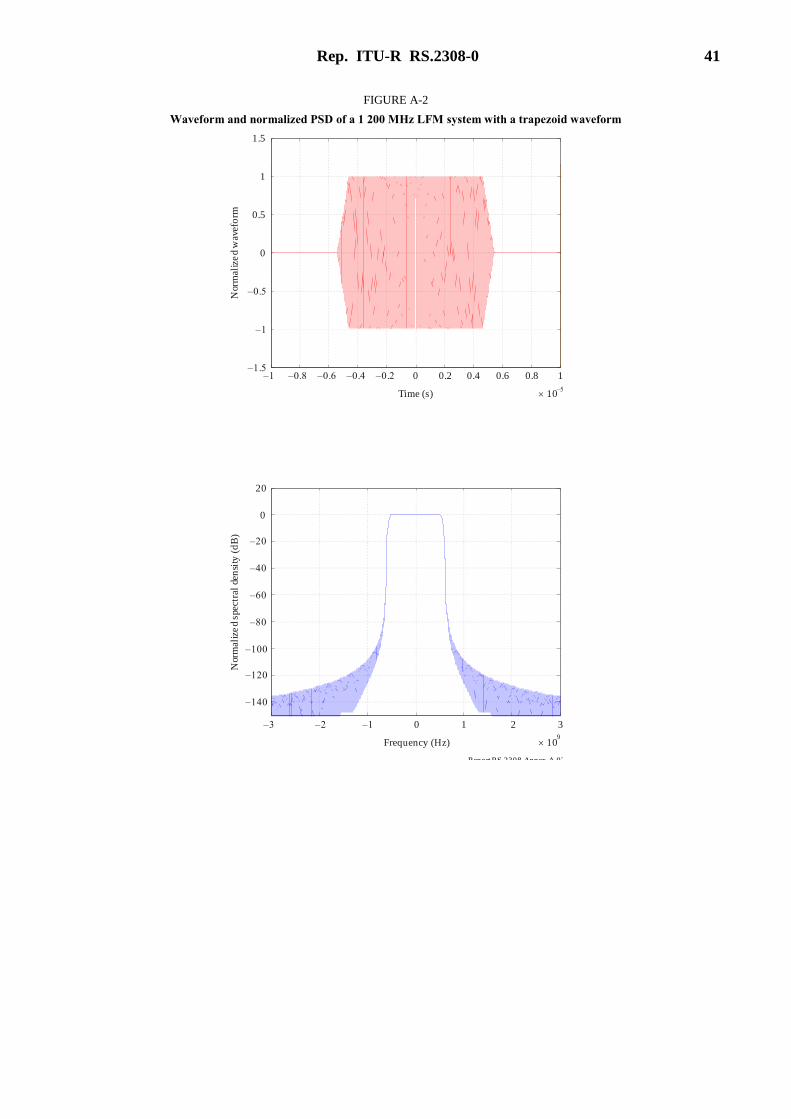
Rep. ITU-R RS.2308-0 41
FIGURE A-2
Waveform and normalized PSD of a 1 200 MHz LFM system with a trapezoid waveform
–0.8
Time (s)
Nor
mal
ize
d w
avef
orm
–1.5
–1
–0.5
0
–1 –0.6 –0.4 –0.2 0 0.2 0.4 0.6 0.8 1
0.5
1.5
1
R pe ort RS.2308-Annex-A-02
Frequency (Hz)
Nor
mal
ize
d sp
ectr
al d
ensi
ty (
dB
)
–80
–3 –2 –1 0 1 2 3
–140
–60
–100
–40
–120
–20
0
20
10–5
109
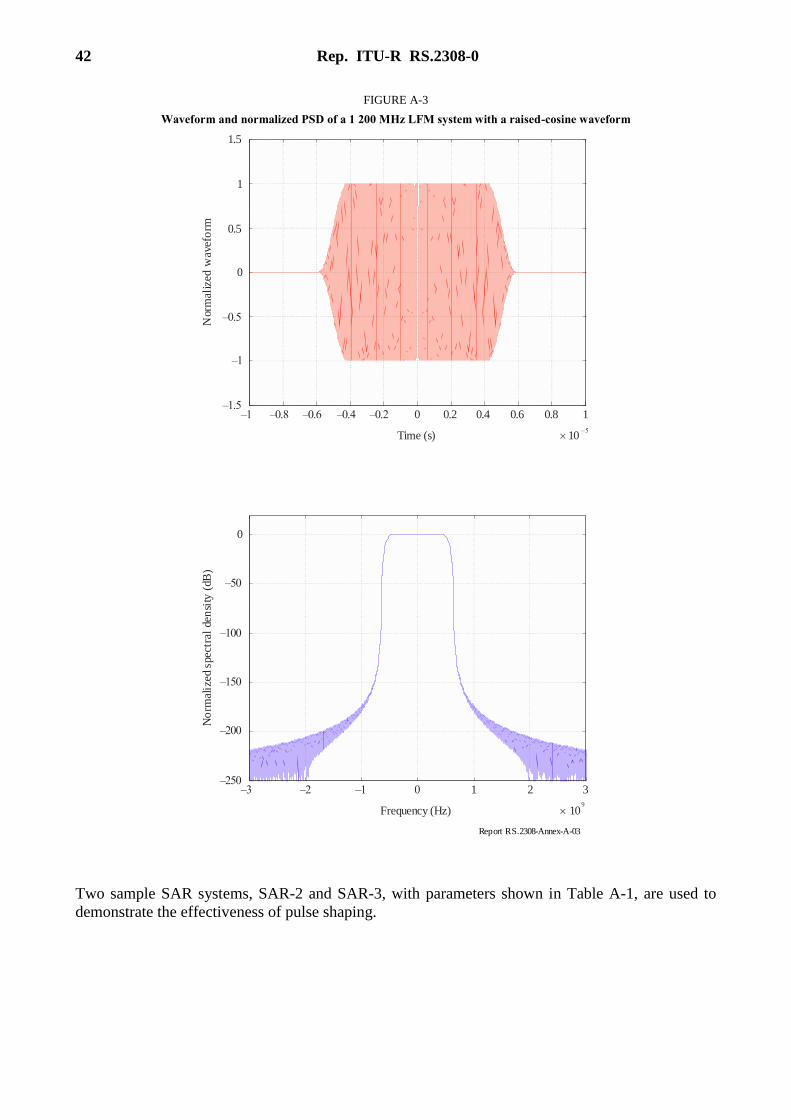
42 Rep. ITU-R RS.2308-0
FIGURE A-3
Waveform and normalized PSD of a 1 200 MHz LFM system with a raised-cosine waveform
–0.8
Time (s)
Nor
mal
ized
wav
efo
rm
–1.5
–1
–0.5
0
–1 –0.6 –0.4 –0.2 0 0.2 0.4 0.6 0.8 1
0.5
1.5
1
R pe ort RS.2308-Annex-A-03
Frequency (Hz)
No
rmal
ized
spe
ctra
l de
nsi
ty (
dB)
–3 –2 –1 0 1 2 3–250
–100
–150
–50
–200
0
10–5
109
Two sample SAR systems, SAR-2 and SAR-3, with parameters shown in Table A-1, are used to
demonstrate the effectiveness of pulse shaping.
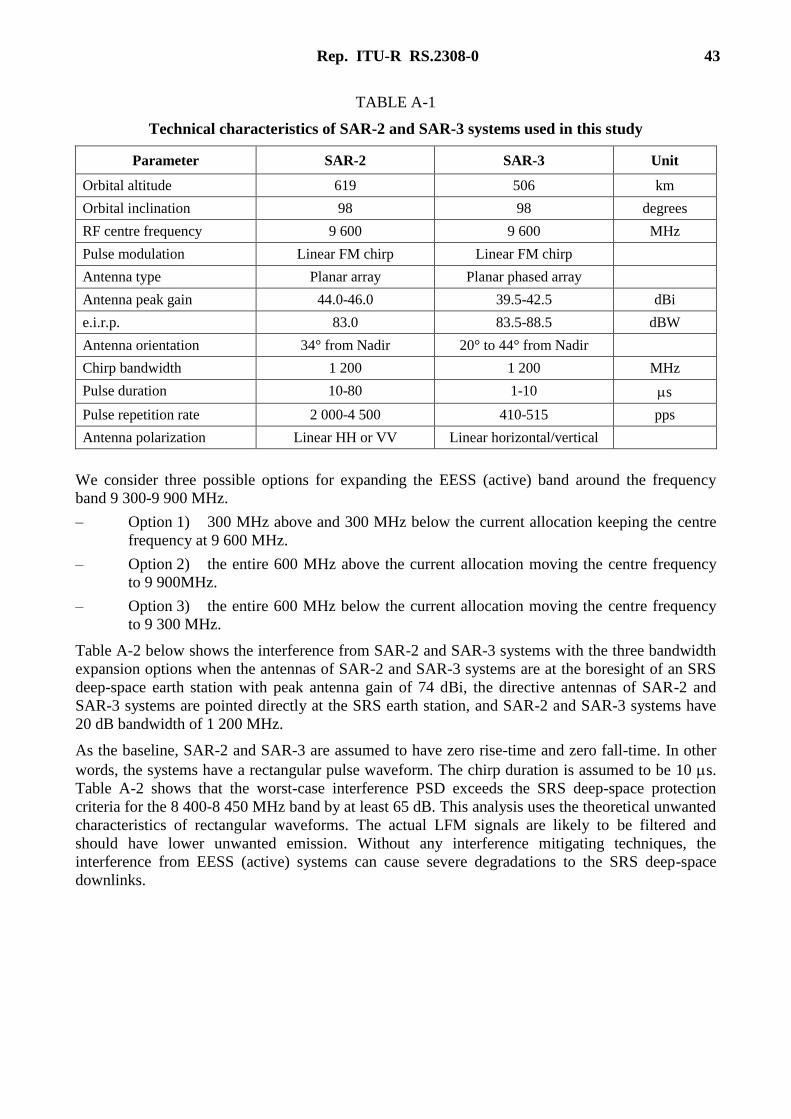
Rep. ITU-R RS.2308-0 43
TABLE A-1
Technical characteristics of SAR-2 and SAR-3 systems used in this study
Parameter SAR-2 SAR-3 Unit
Orbital altitude 619 506 km
Orbital inclination 98 98 degrees
RF centre frequency 9 600 9 600 MHz
Pulse modulation Linear FM chirp Linear FM chirp
Antenna type Planar array Planar phased array
Antenna peak gain 44.0-46.0 39.5-42.5 dBi
e.i.r.p. 83.0 83.5-88.5 dBW
Antenna orientation 34° from Nadir 20° to 44° from Nadir
Chirp bandwidth 1 200 1 200 MHz
Pulse duration 10-80 1-10 s
Pulse repetition rate 2 000-4 500 410-515 pps
Antenna polarization Linear HH or VV Linear horizontal/vertical
We consider three possible options for expanding the EESS (active) band around the frequency
band 9 300-9 900 MHz.
– Option 1) 300 MHz above and 300 MHz below the current allocation keeping the centre
frequency at 9 600 MHz.
– Option 2) the entire 600 MHz above the current allocation moving the centre frequency
to 9 900MHz.
– Option 3) the entire 600 MHz below the current allocation moving the centre frequency
to 9 300 MHz.
Table A-2 below shows the interference from SAR-2 and SAR-3 systems with the three bandwidth
expansion options when the antennas of SAR-2 and SAR-3 systems are at the boresight of an SRS
deep-space earth station with peak antenna gain of 74 dBi, the directive antennas of SAR-2 and
SAR-3 systems are pointed directly at the SRS earth station, and SAR-2 and SAR-3 systems have
20 dB bandwidth of 1 200 MHz.
As the baseline, SAR-2 and SAR-3 are assumed to have zero rise-time and zero fall-time. In other
words, the systems have a rectangular pulse waveform. The chirp duration is assumed to be 10 s.
Table A-2 shows that the worst-case interference PSD exceeds the SRS deep-space protection
criteria for the 8 400-8 450 MHz band by at least 65 dB. This analysis uses the theoretical unwanted
characteristics of rectangular waveforms. The actual LFM signals are likely to be filtered and
should have lower unwanted emission. Without any interference mitigating techniques, the
interference from EESS (active) systems can cause severe degradations to the SRS deep-space
downlinks.
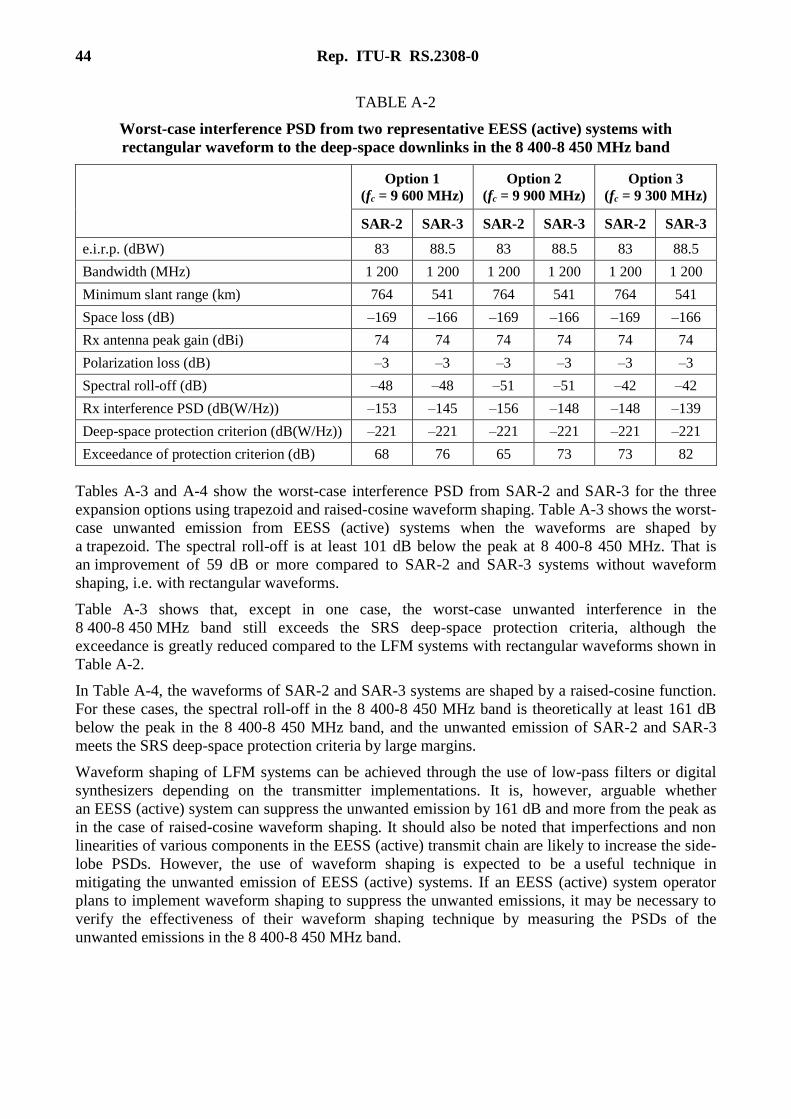
44 Rep. ITU-R RS.2308-0
TABLE A-2
Worst-case interference PSD from two representative EESS (active) systems with
rectangular waveform to the deep-space downlinks in the 8 400-8 450 MHz band
Option 1
(fc = 9 600 MHz)
Option 2
(fc = 9 900 MHz)
Option 3
(fc = 9 300 MHz)
SAR-2 SAR-3 SAR-2 SAR-3 SAR-2 SAR-3
e.i.r.p. (dBW) 83 88.5 83 88.5 83 88.5
Bandwidth (MHz) 1 200 1 200 1 200 1 200 1 200 1 200
Minimum slant range (km) 764 541 764 541 764 541
Space loss (dB) –169 –166 –169 –166 –169 –166
Rx antenna peak gain (dBi) 74 74 74 74 74 74
Polarization loss (dB) –3 –3 –3 –3 –3 –3
Spectral roll-off (dB) –48 –48 –51 –51 –42 –42
Rx interference PSD (dB(W/Hz)) –153 –145 –156 –148 –148 –139
Deep-space protection criterion (dB(W/Hz)) –221 –221 –221 –221 –221 –221
Exceedance of protection criterion (dB) 68 76 65 73 73 82
Tables A-3 and A-4 show the worst-case interference PSD from SAR-2 and SAR-3 for the three
expansion options using trapezoid and raised-cosine waveform shaping. Table A-3 shows the worst-
case unwanted emission from EESS (active) systems when the waveforms are shaped by
a trapezoid. The spectral roll-off is at least 101 dB below the peak at 8 400-8 450 MHz. That is
an improvement of 59 dB or more compared to SAR-2 and SAR-3 systems without waveform
shaping, i.e. with rectangular waveforms.
Table A-3 shows that, except in one case, the worst-case unwanted interference in the
8 400-8 450 MHz band still exceeds the SRS deep-space protection criteria, although the
exceedance is greatly reduced compared to the LFM systems with rectangular waveforms shown in
Table A-2.
In Table A-4, the waveforms of SAR-2 and SAR-3 systems are shaped by a raised-cosine function.
For these cases, the spectral roll-off in the 8 400-8 450 MHz band is theoretically at least 161 dB
below the peak in the 8 400-8 450 MHz band, and the unwanted emission of SAR-2 and SAR-3
meets the SRS deep-space protection criteria by large margins.
Waveform shaping of LFM systems can be achieved through the use of low-pass filters or digital
synthesizers depending on the transmitter implementations. It is, however, arguable whether
an EESS (active) system can suppress the unwanted emission by 161 dB and more from the peak as
in the case of raised-cosine waveform shaping. It should also be noted that imperfections and non
linearities of various components in the EESS (active) transmit chain are likely to increase the side-
lobe PSDs. However, the use of waveform shaping is expected to be a useful technique in
mitigating the unwanted emission of EESS (active) systems. If an EESS (active) system operator
plans to implement waveform shaping to suppress the unwanted emissions, it may be necessary to
verify the effectiveness of their waveform shaping technique by measuring the PSDs of the
unwanted emissions in the 8 400-8 450 MHz band.
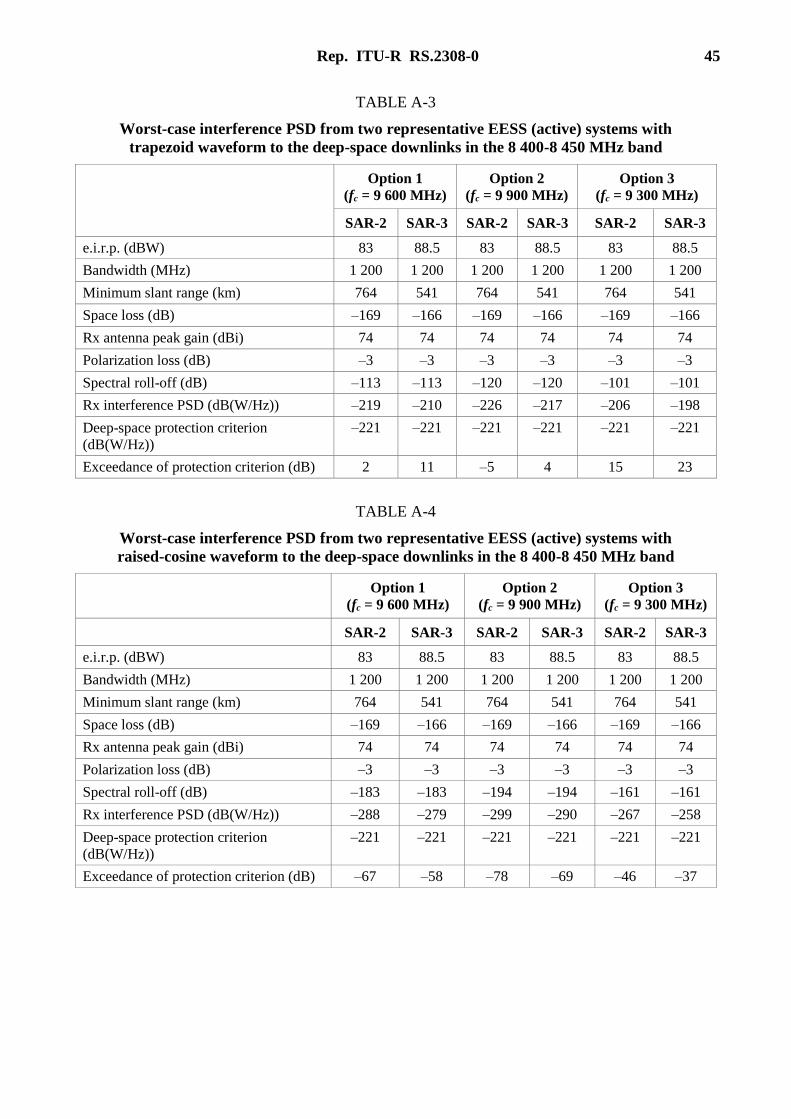
Rep. ITU-R RS.2308-0 45
TABLE A-3
Worst-case interference PSD from two representative EESS (active) systems with
trapezoid waveform to the deep-space downlinks in the 8 400-8 450 MHz band
Option 1
(fc = 9 600 MHz)
Option 2
(fc = 9 900 MHz)
Option 3
(fc = 9 300 MHz)
SAR-2 SAR-3 SAR-2 SAR-3 SAR-2 SAR-3
e.i.r.p. (dBW) 83 88.5 83 88.5 83 88.5
Bandwidth (MHz) 1 200 1 200 1 200 1 200 1 200 1 200
Minimum slant range (km) 764 541 764 541 764 541
Space loss (dB) –169 –166 –169 –166 –169 –166
Rx antenna peak gain (dBi) 74 74 74 74 74 74
Polarization loss (dB) –3 –3 –3 –3 –3 –3
Spectral roll-off (dB) –113 –113 –120 –120 –101 –101
Rx interference PSD (dB(W/Hz)) –219 –210 –226 –217 –206 –198
Deep-space protection criterion
(dB(W/Hz))
–221 –221 –221 –221 –221 –221
Exceedance of protection criterion (dB) 2 11 –5 4 15 23
TABLE A-4
Worst-case interference PSD from two representative EESS (active) systems with
raised-cosine waveform to the deep-space downlinks in the 8 400-8 450 MHz band
Option 1
(fc = 9 600 MHz)
Option 2
(fc = 9 900 MHz)
Option 3
(fc = 9 300 MHz)
SAR-2 SAR-3 SAR-2 SAR-3 SAR-2 SAR-3
e.i.r.p. (dBW) 83 88.5 83 88.5 83 88.5
Bandwidth (MHz) 1 200 1 200 1 200 1 200 1 200 1 200
Minimum slant range (km) 764 541 764 541 764 541
Space loss (dB) –169 –166 –169 –166 –169 –166
Rx antenna peak gain (dBi) 74 74 74 74 74 74
Polarization loss (dB) –3 –3 –3 –3 –3 –3
Spectral roll-off (dB) –183 –183 –194 –194 –161 –161
Rx interference PSD (dB(W/Hz)) –288 –279 –299 –290 –267 –258
Deep-space protection criterion
(dB(W/Hz))
–221 –221 –221 –221 –221 –221
Exceedance of protection criterion (dB) –67 –58 –78 –69 –46 –37
46 Rep. ITU-R RS.2308-0
Annex B
Abbreviations
CDF Cumulative distribution function
DSN Deep space network
LFM Linear frequency modulation
LNA Low noise amplifier
PEP Peak envelope power
______________