radiation therapy: nutritional strategies to improve outcomes
TRANSCRIPT
Strategiesto Improve Outcomes
Jeanne M. Wallace, PhD, CNC© 2017 Nutritional Solutions
www.Nutritional-Solutions.net
Radiation Therapy
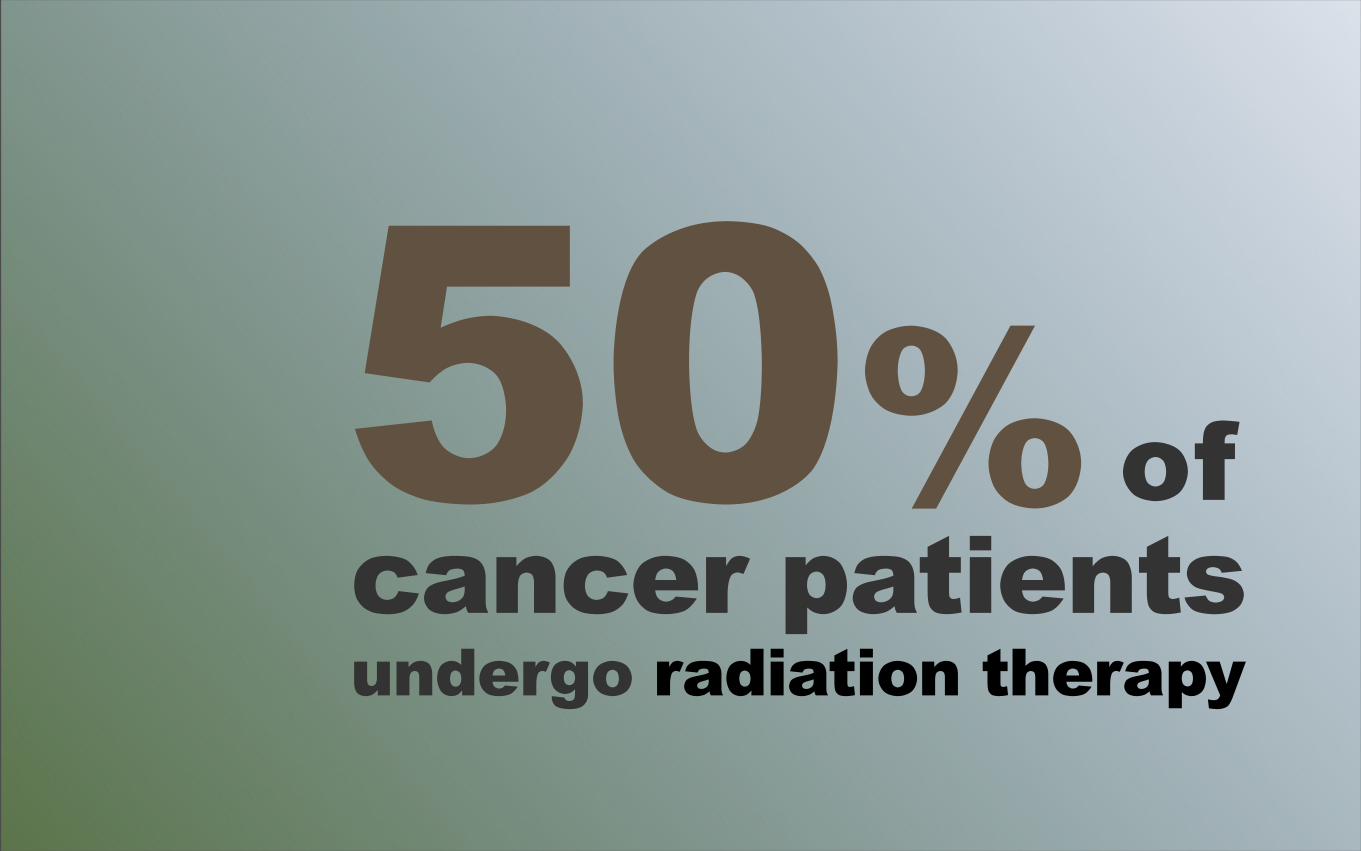
cancer patientsundergo radiation therapy
50%of
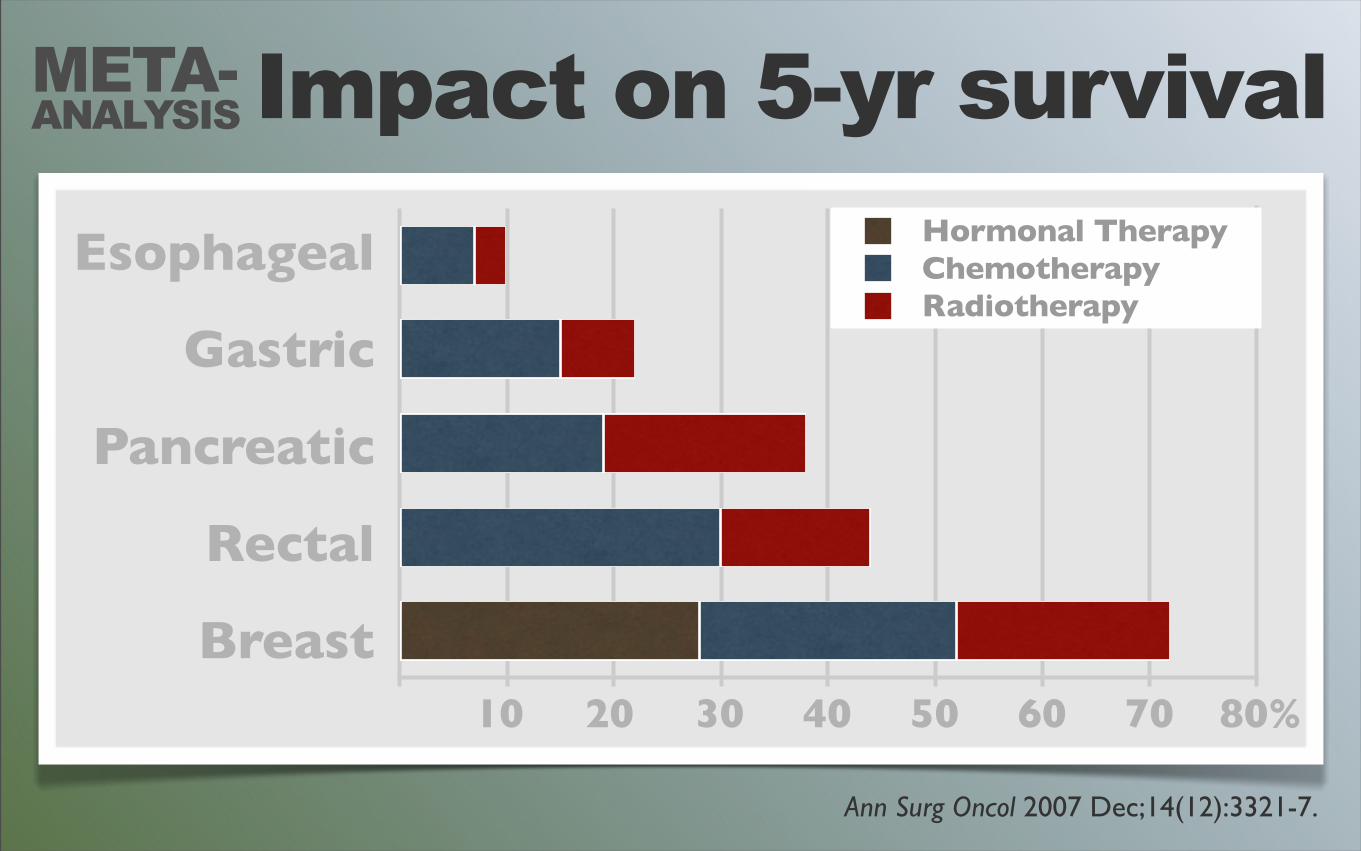
Impact on 5-yr survival
Ann Surg Oncol 2007 Dec;14(12):3321-7.
Esophageal
Gastric
Pancreatic
Rectal
Breast10 20 30 40 50 60 70 80%
Hormonal TherapyChemotherapyRadiotherapy
META-ANALYSIS
WHY Doesn’t Radiation Always Work?
“
”

SO
IL
Why doaphids ‘attack’ plants?
EC
OS
YS
TE
M
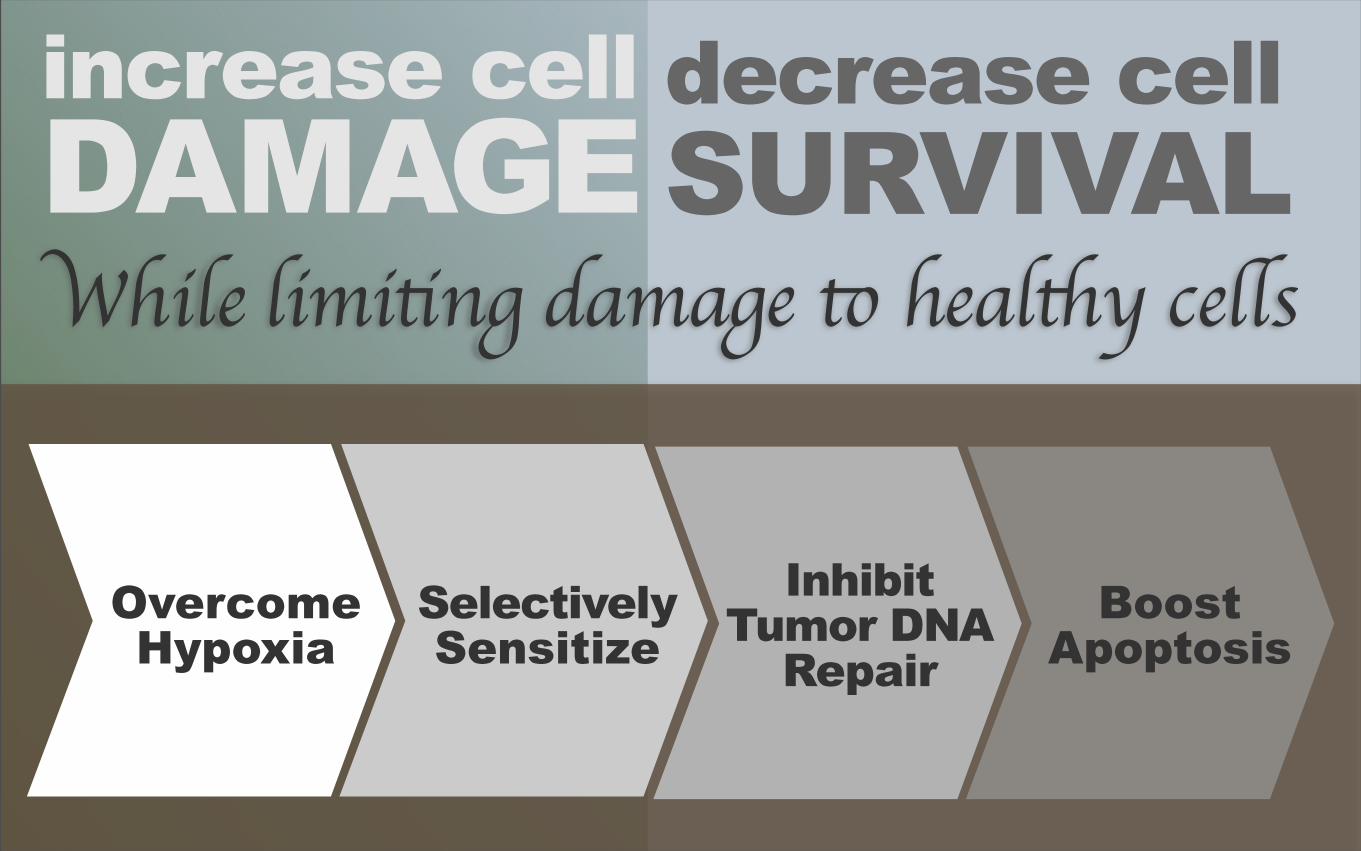
While limiting damage to healthy cells
decrease cellSURVIVAL
increase cellDAMAGE
OvercomeHypoxia
SelectivelySensitize
Inhibit Tumor DNA
RepairBoost
Apoptosis
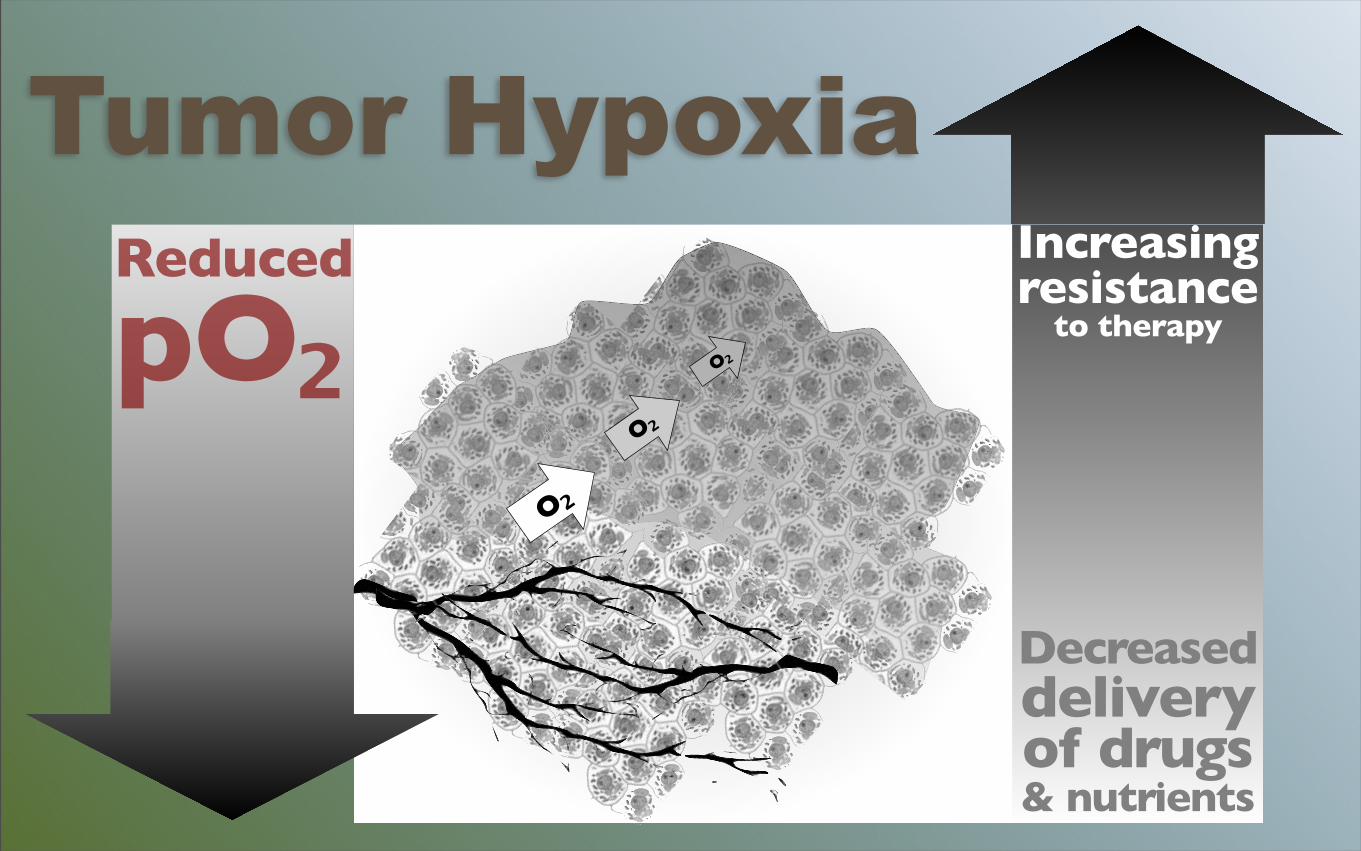
O₂
O₂
O₂
Increasingresistance
to therapy
Decreaseddelivery
of drugs & nutrients
Reduced
pO₂Tumor Hypoxia
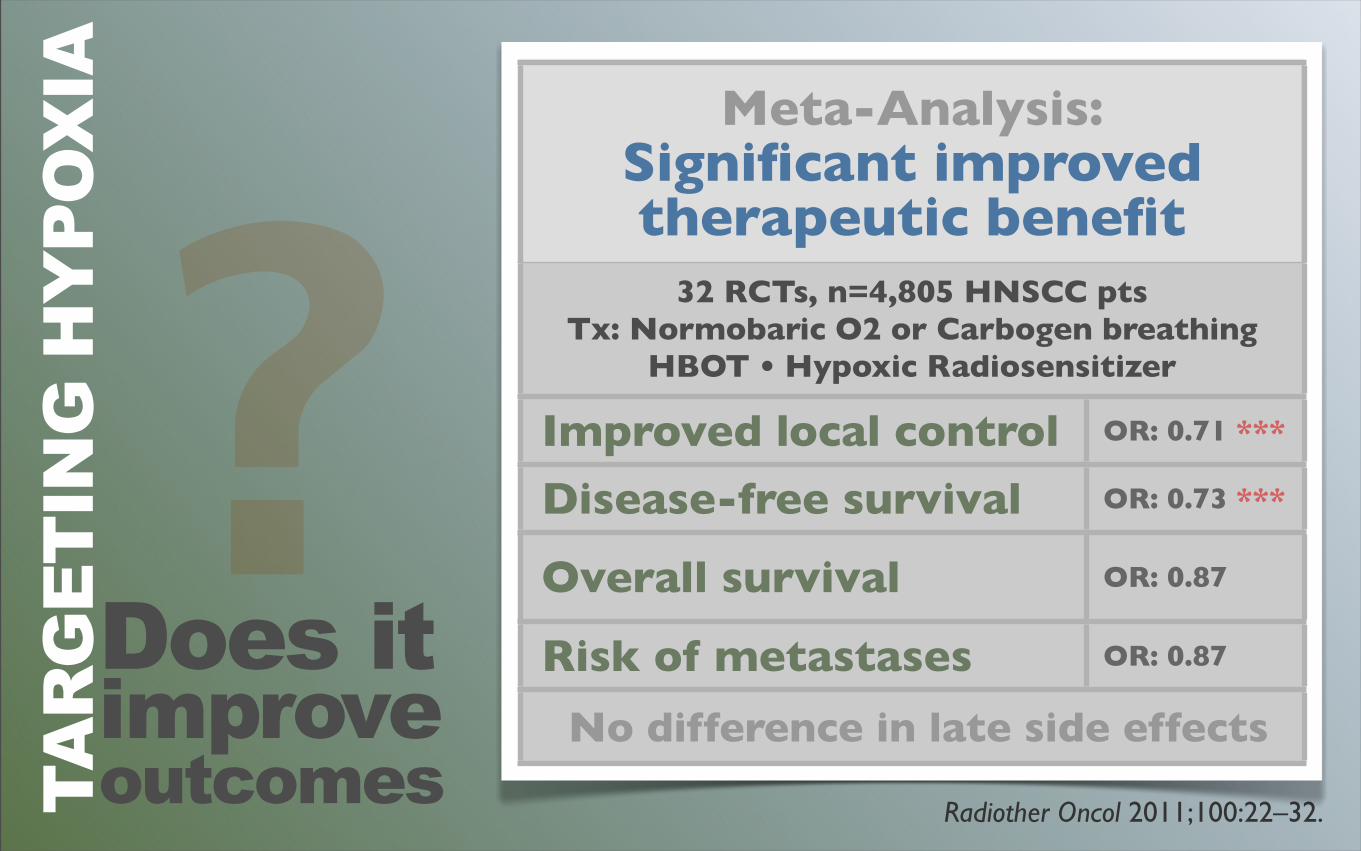
Radiother Oncol 2011;100:22–32.
Meta-Analysis:Significant improved therapeutic benefit
Meta-Analysis:Significant improved therapeutic benefit
32 RCTs, n=4,805 HNSCC pts Tx: Normobaric O2 or Carbogen breathing
HBOT • Hypoxic Radiosensitizer
32 RCTs, n=4,805 HNSCC pts Tx: Normobaric O2 or Carbogen breathing
HBOT • Hypoxic Radiosensitizer
Improved local control OR: 0.71 ***
Disease-free survival OR: 0.73 ***
Overall survival OR: 0.87
Risk of metastases OR: 0.87
No difference in late side effects No difference in late side effects
Does itimprove outcomes
?TA
RG
ETIN
G H
YPO
XIA
Things to Consider...
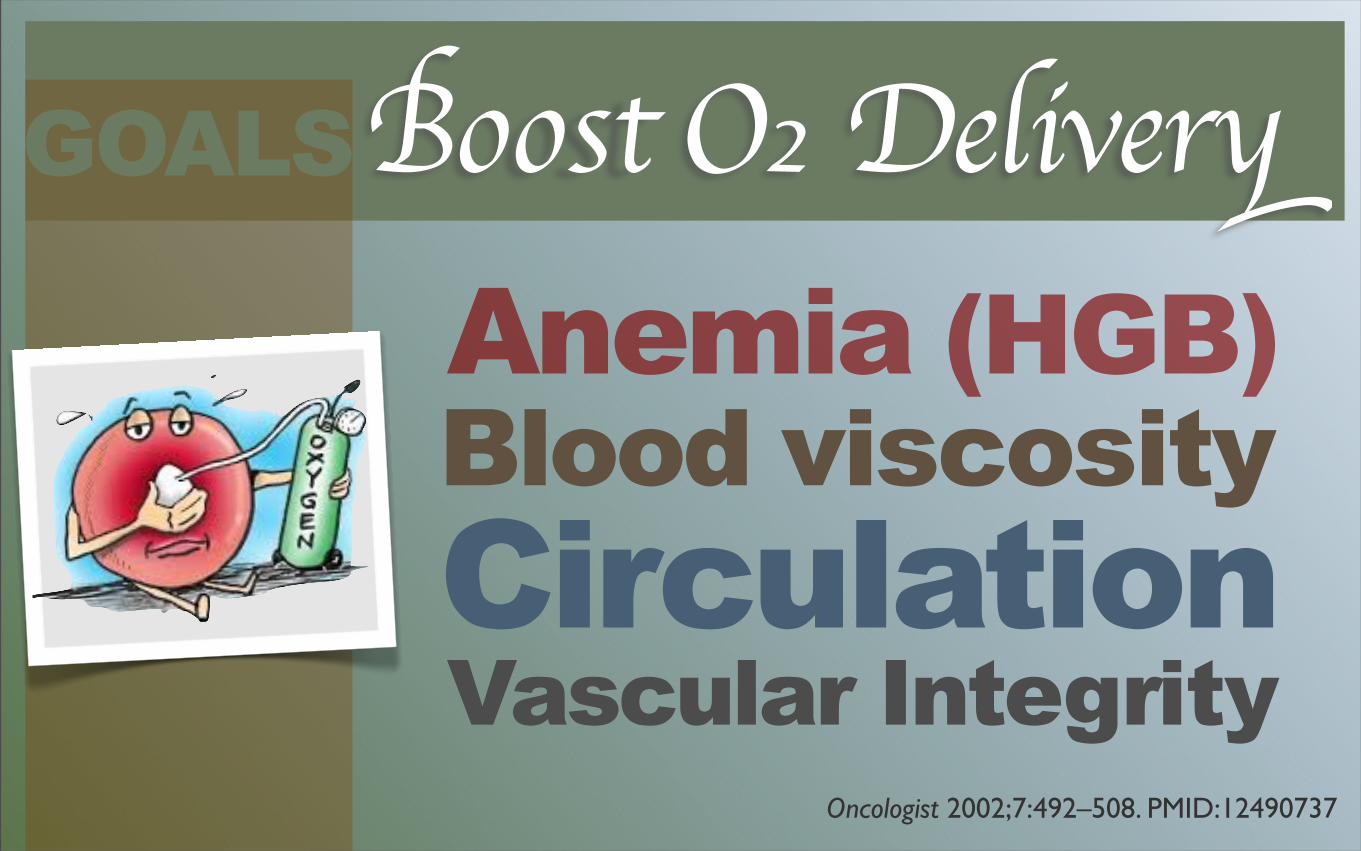
Vascular Integrity
Anemia (HGB)
CirculationBlood viscosity
Boost O₂ Delivery
Oncologist 2002;7:492–508. PMID:12490737
GOALS
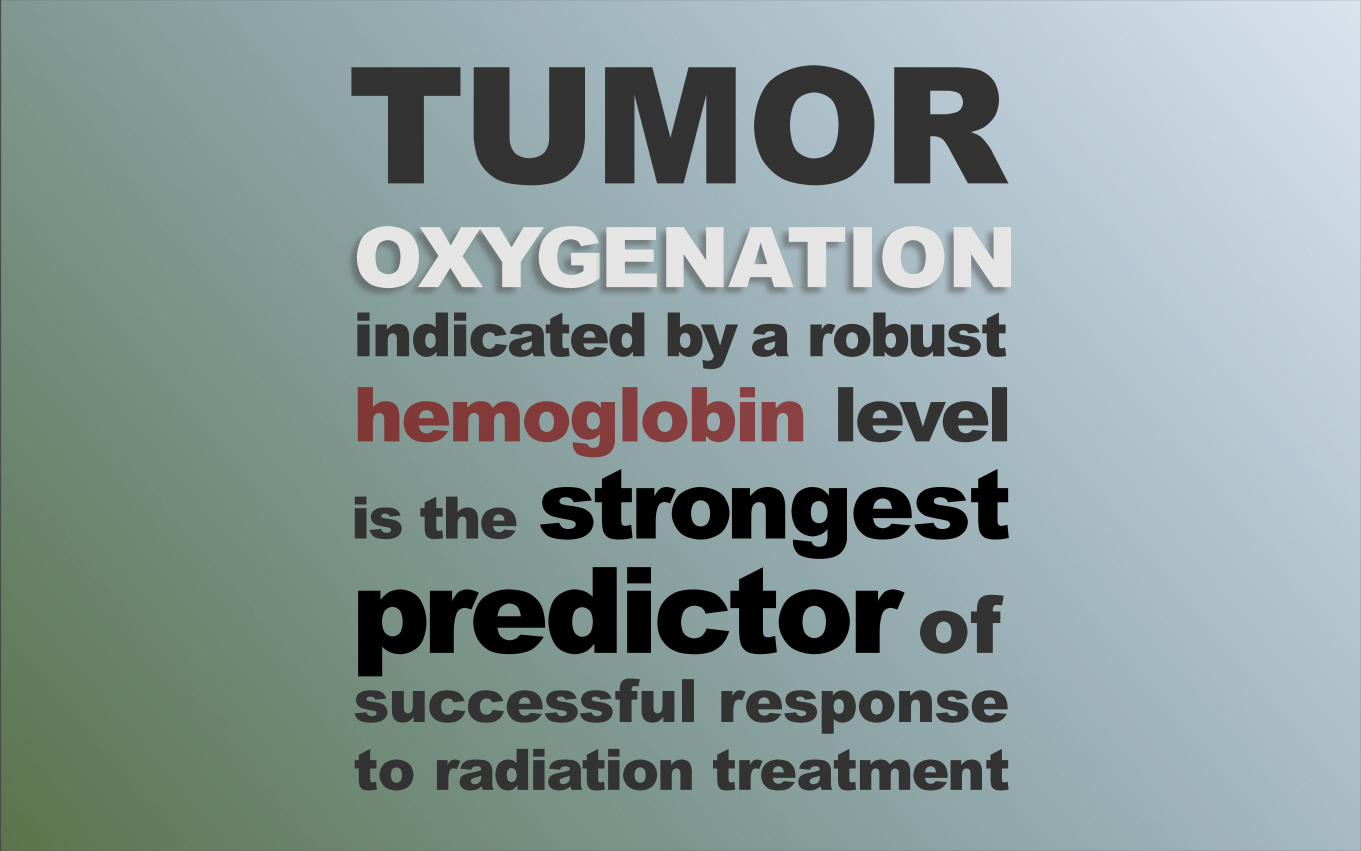
OXYGENATION
is the strongest predictor of
indicated by a robust hemoglobin level
successful response to radiation treatment
TUMOR
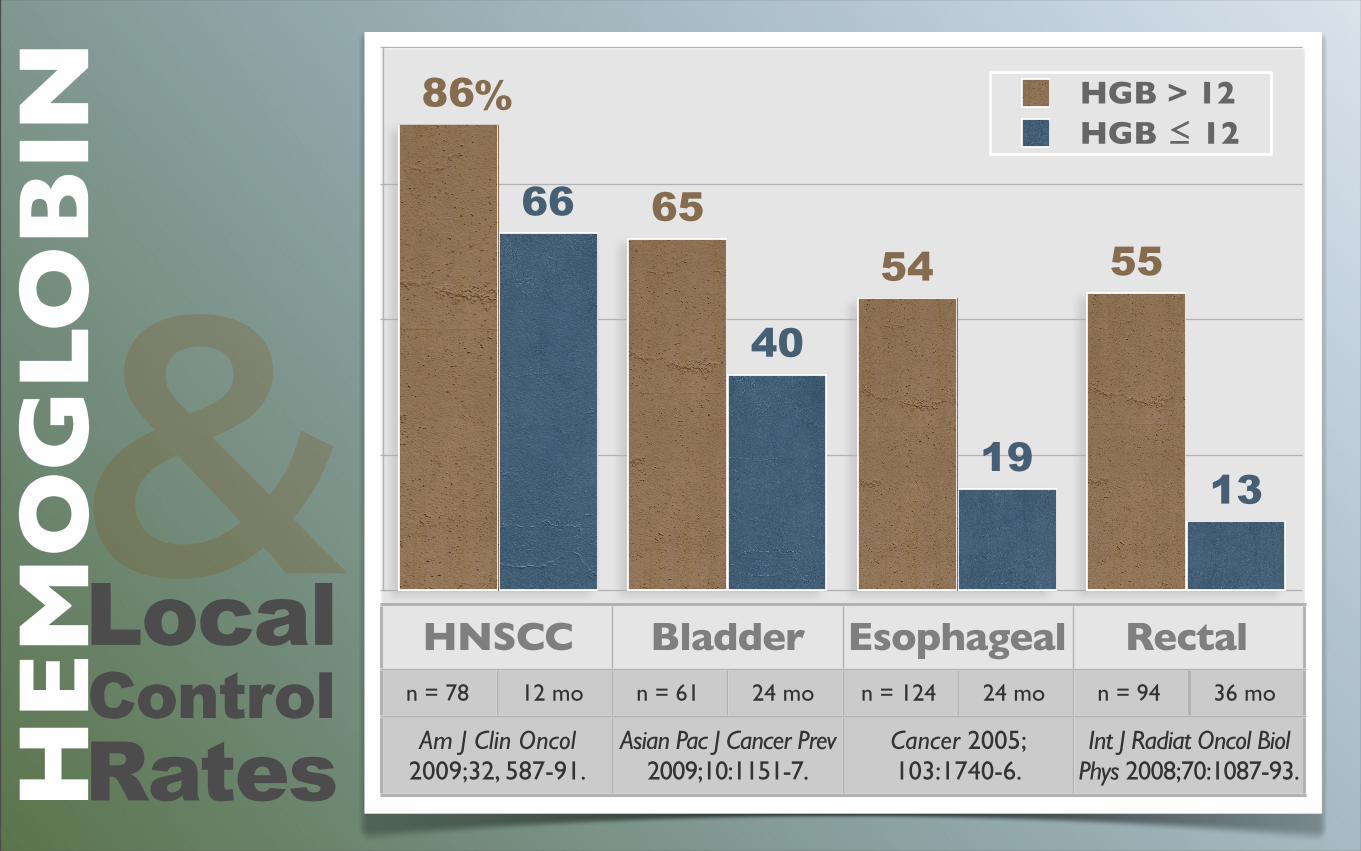
HNSCC Bladder Esophageal Rectal
1319
40
665554
65
86 HGB > 12HGB ≤ 12
n = 78 12 mo n = 61 24 mo n = 124 24 mo n = 94 36 mo
Am J Clin Oncol 2009;32, 587-91.Am J Clin Oncol
2009;32, 587-91.Asian Pac J Cancer Prev
2009;10:1151-7.Asian Pac J Cancer Prev
2009;10:1151-7.Cancer 2005;103:1740-6.Cancer 2005;103:1740-6.
Int J Radiat Oncol Biol Phys 2008;70:1087-93.Int J Radiat Oncol Biol
Phys 2008;70:1087-93.
LocalControlRatesHE
MO
GLO
BIN
&%
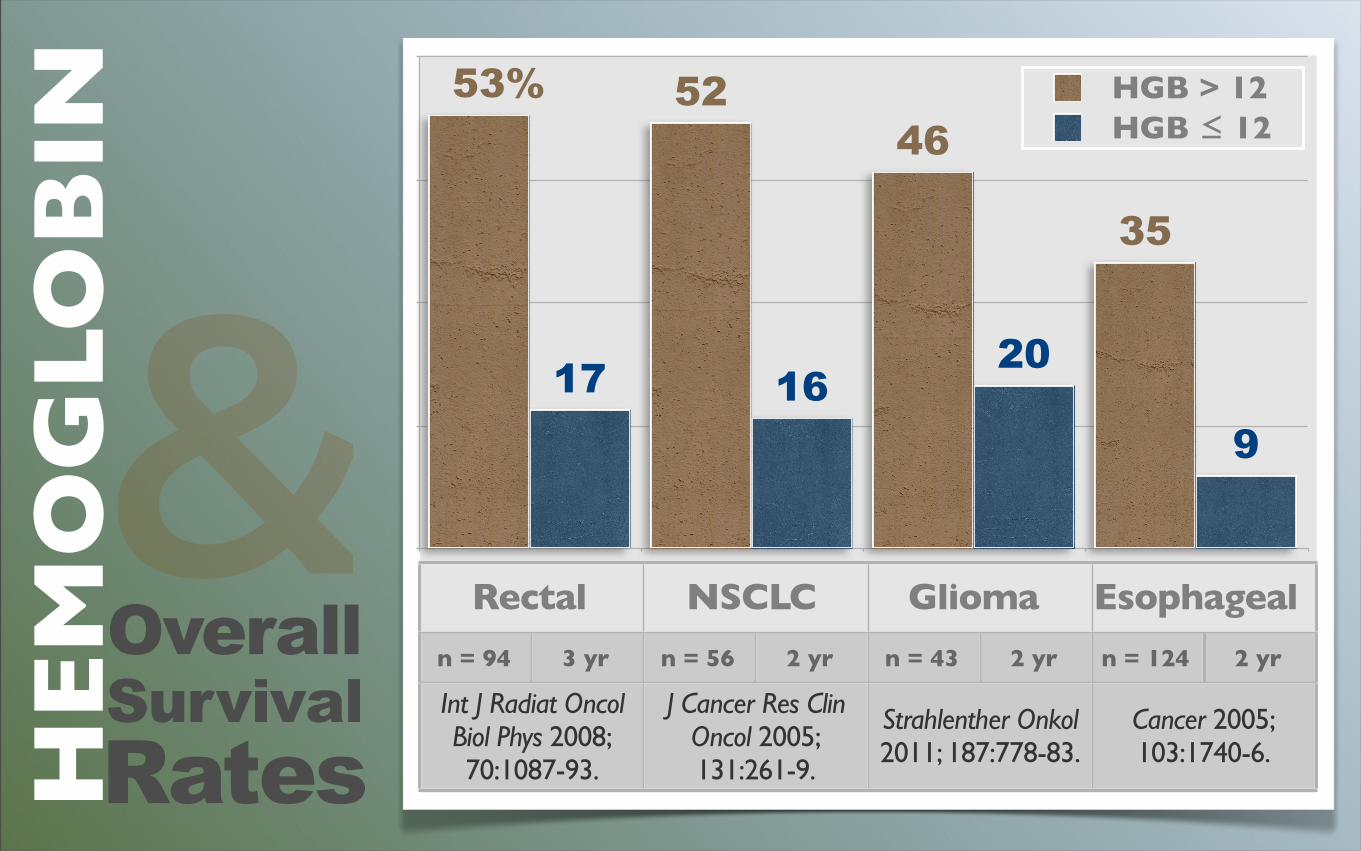
Rectal NSCLC Glioma Esophageal
9
201617
35
465253 HGB > 12
HGB ≤ 12
n = 94 3 yr n = 56 2 yr n = 43 2 yr n = 124 2 yr
Int J Radiat Oncol Biol Phys 2008; 70:1087-93.
Int J Radiat Oncol Biol Phys 2008; 70:1087-93.
J Cancer Res Clin Oncol 2005; 131:261-9.
J Cancer Res Clin Oncol 2005; 131:261-9.
Strahlenther Onkol 2011; 187:778-83.Strahlenther Onkol 2011; 187:778-83.
Cancer 2005;103:1740-6.Cancer 2005;103:1740-6.
OverallSurvivalRatesHE
MO
GLO
BIN
&%
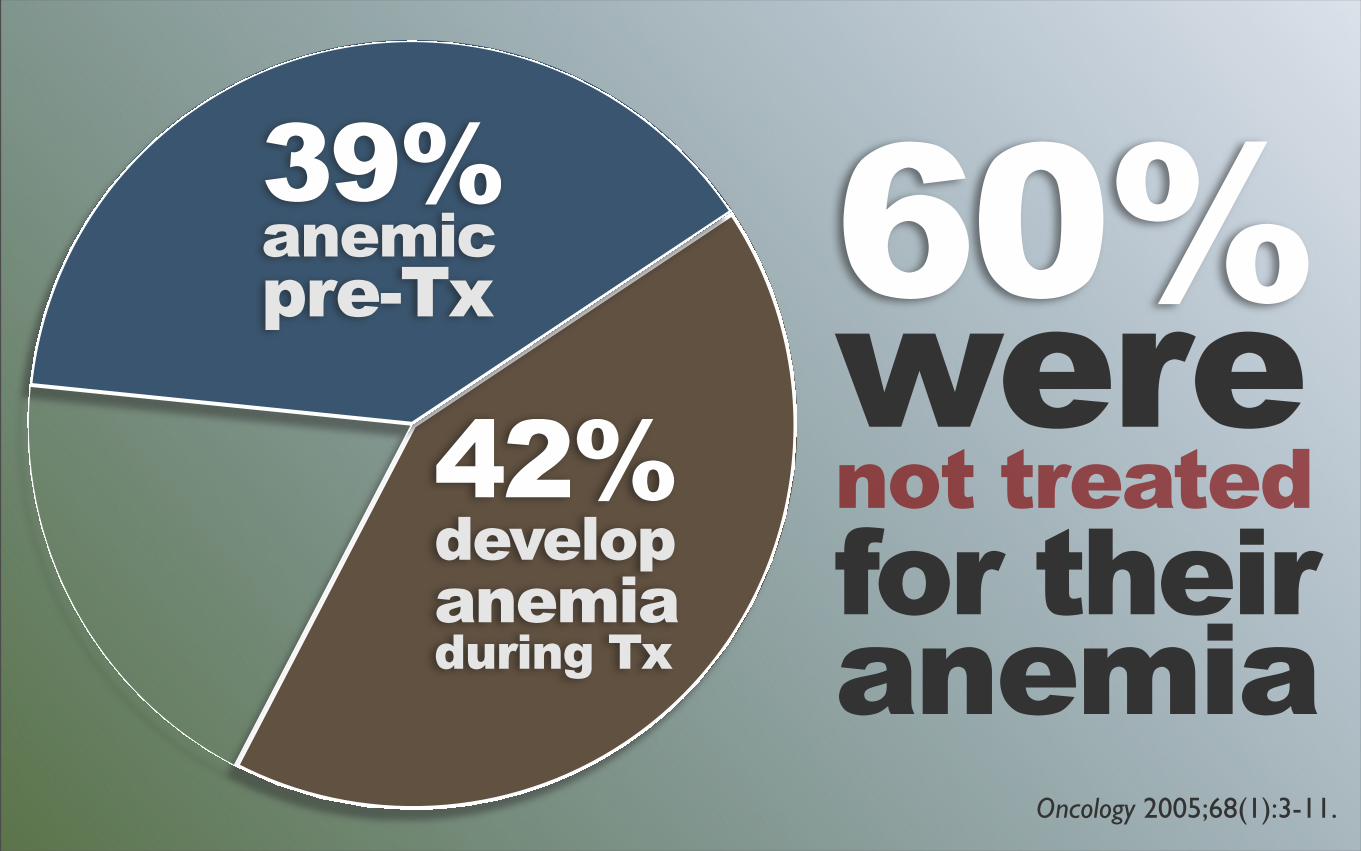
Oncology 2005;68(1):3-11.
60%werenot treatedfor theiranemia
39%anemicpre-Tx
42%developanemiaduring Tx
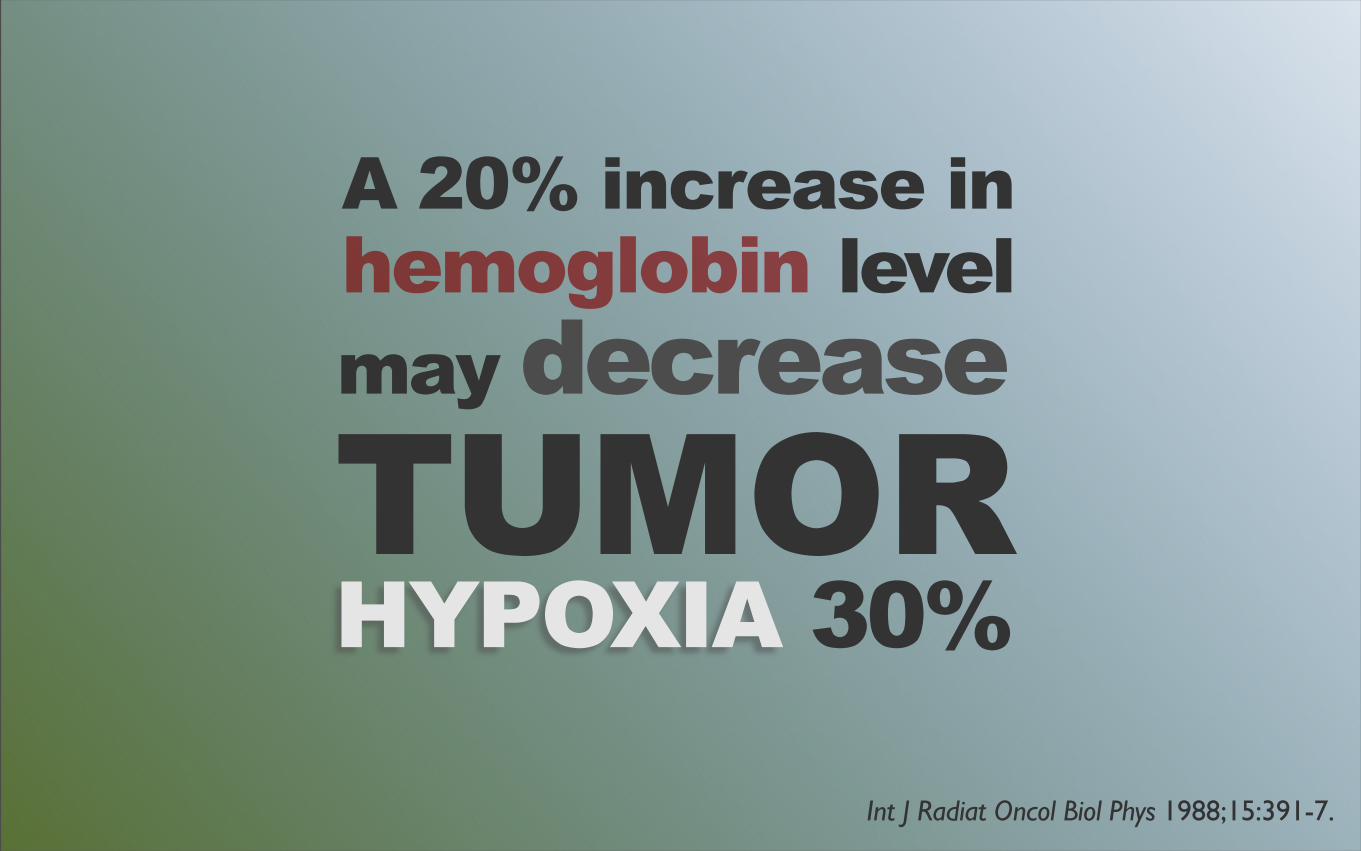
HYPOXIA 30%
may decrease
A 20% increase in hemoglobin level
TUMORInt J Radiat Oncol Biol Phys 1988;15:391-7.
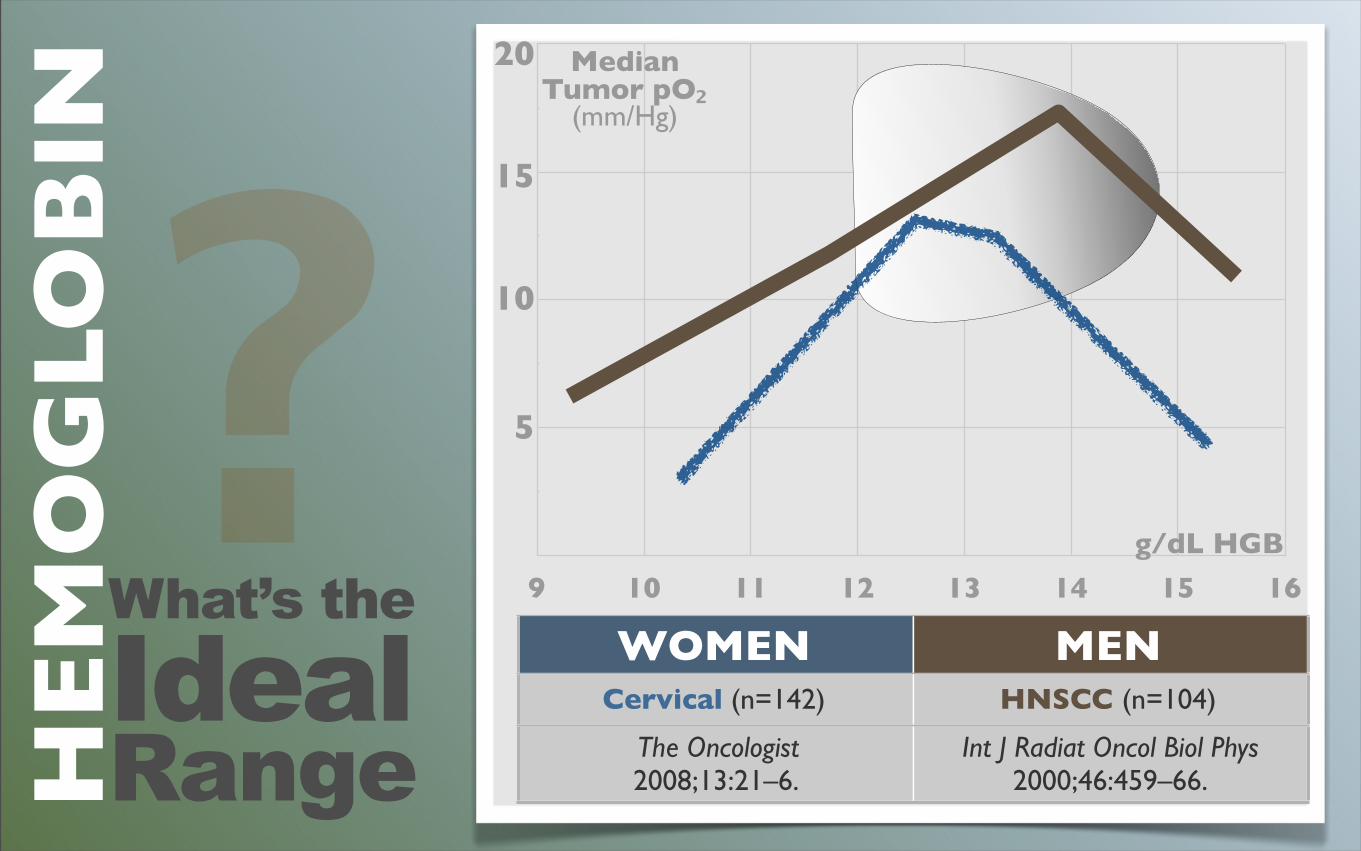
HE
MO
GLO
BIN
What’s the
IdealRange
?WOMEN MEN
Cervical (n=142) HNSCC (n=104)
The Oncologist 2008;13:21–6.
Int J Radiat Oncol Biol Phys 2000;46:459–66.
9 10 11 12 13 14 15 16
g/dL HGB
20
15
10
5
Median Tumor pO₂
(mm/Hg)
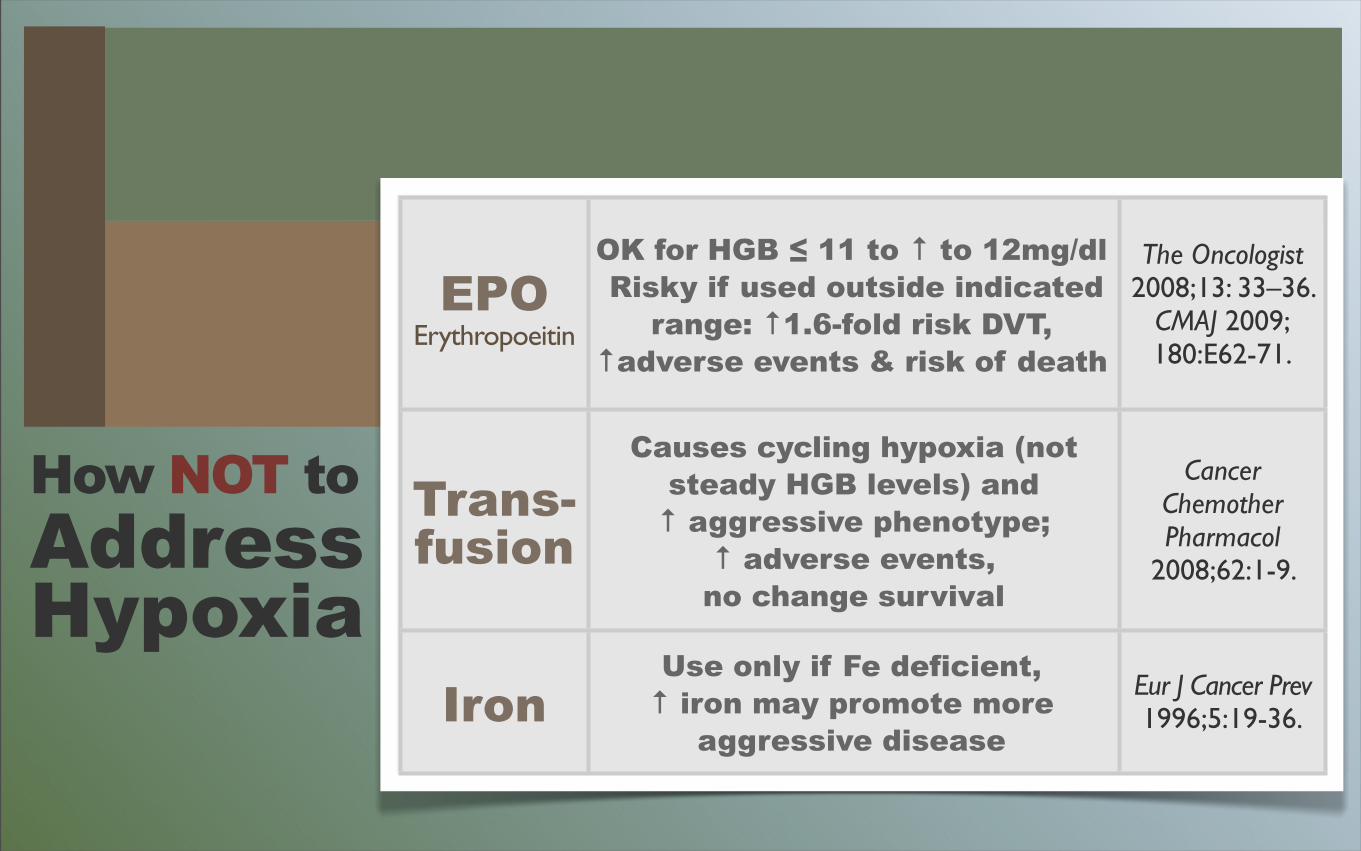
How NOT toAddressHypoxia
EPOErythropoeitin
OK for HGB ≤ 11 to ↑ to 12mg/dl Risky if used outside indicated
range: ↑1.6-fold risk DVT, ↑adverse events & risk of death
The Oncologist 2008;13: 33–36.
CMAJ 2009;180:E62-71.
Trans-fusion
Causes cycling hypoxia (not steady HGB levels) and ↑ aggressive phenotype;
↑ adverse events, no change survival
Cancer Chemother Pharmacol
2008;62:1-9.
IronUse only if Fe deficient, ↑ iron may promote more
aggressive disease
Eur J Cancer Prev1996;5:19-36.
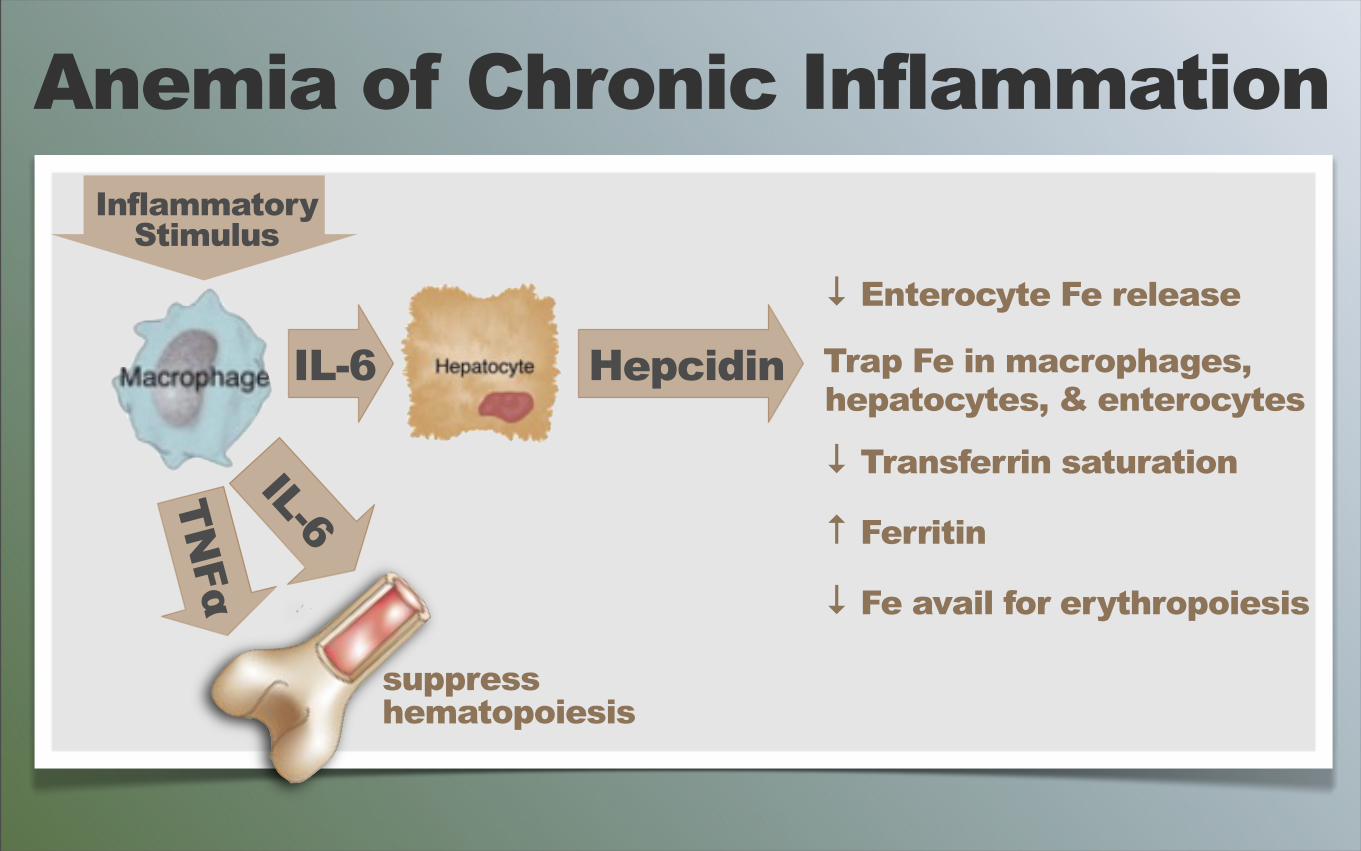
IL-6
InflammatoryStimulus
↓ Enterocyte Fe release
Trap Fe in macrophages, hepatocytes, & enterocytes
↓ Transferrin saturation
↑ Ferritin
↓ Fe avail for erythropoiesis
Anemia of Chronic Inflammation
TNFα
IL-6
suppresshematopoiesis
Hepcidin
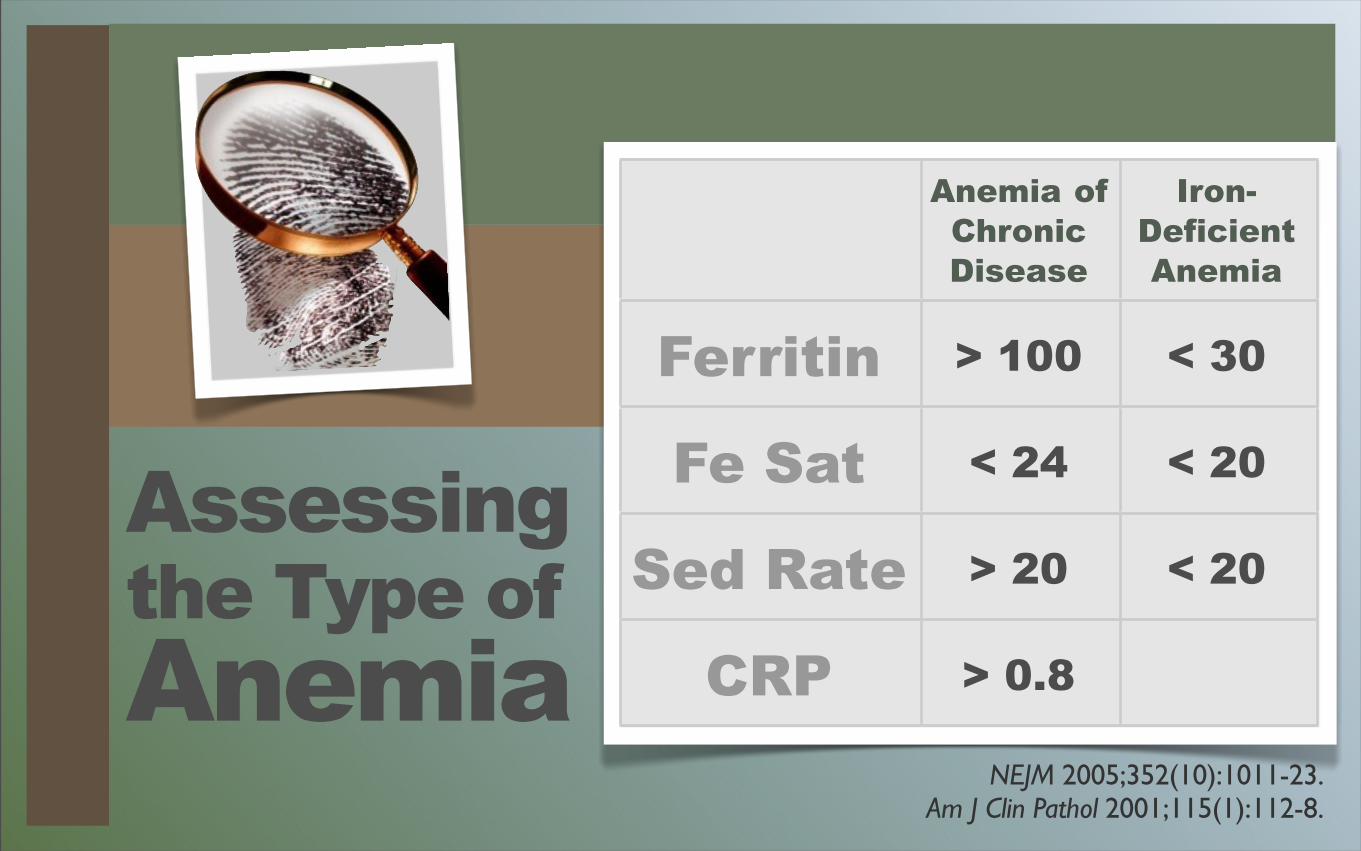
Assessingthe Type ofAnemia
Anemia of Chronic Disease
Iron-DeficientAnemia
Ferritin > 100 < 30
Fe Sat < 24 < 20
Sed Rate > 20 < 20
CRP > 0.8
NEJM 2005;352(10):1011-23.Am J Clin Pathol 2001;115(1):112-8.
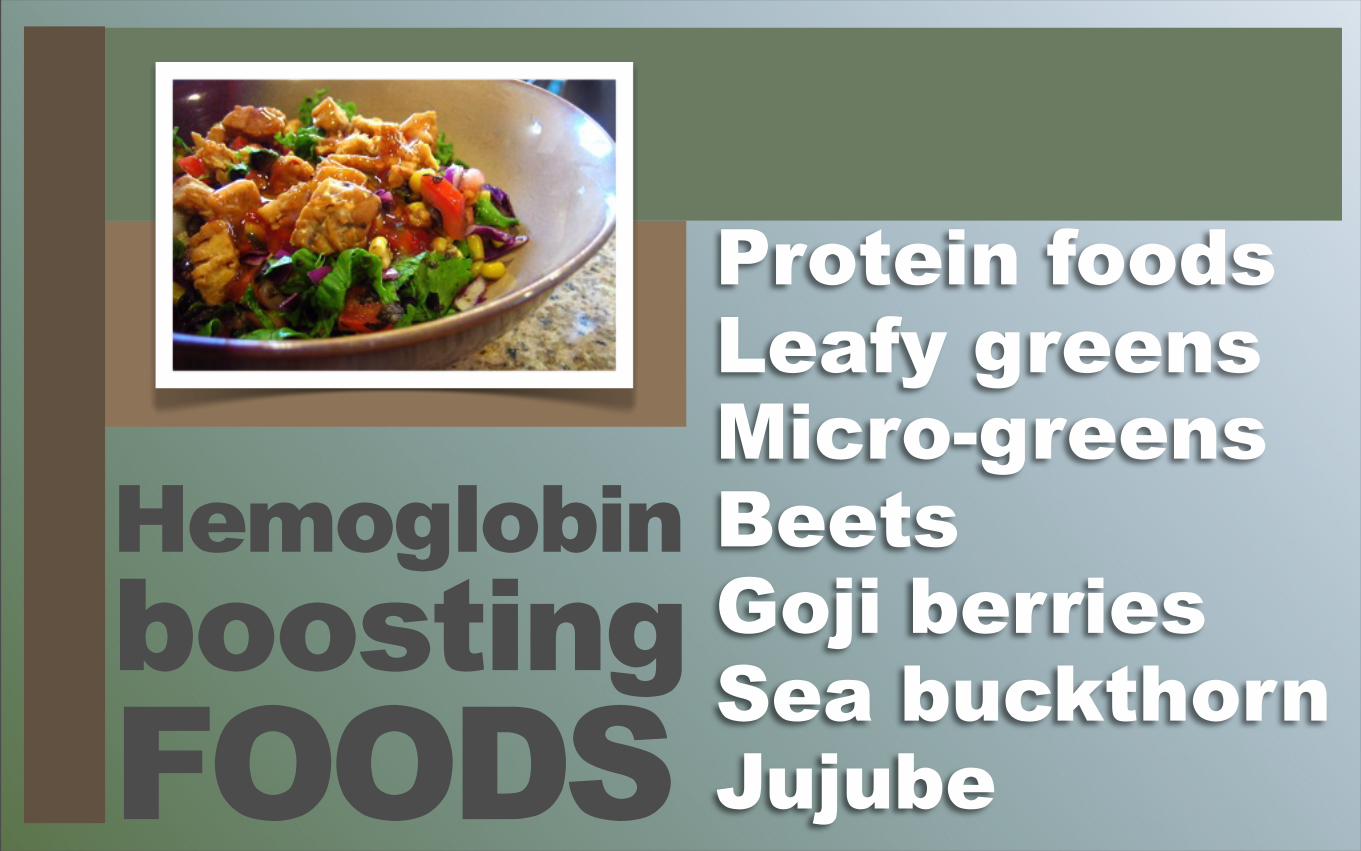
HemoglobinboostingFOODS
Protein foods Leafy greensMicro-greensBeetsGoji berriesSea buckthornJujube
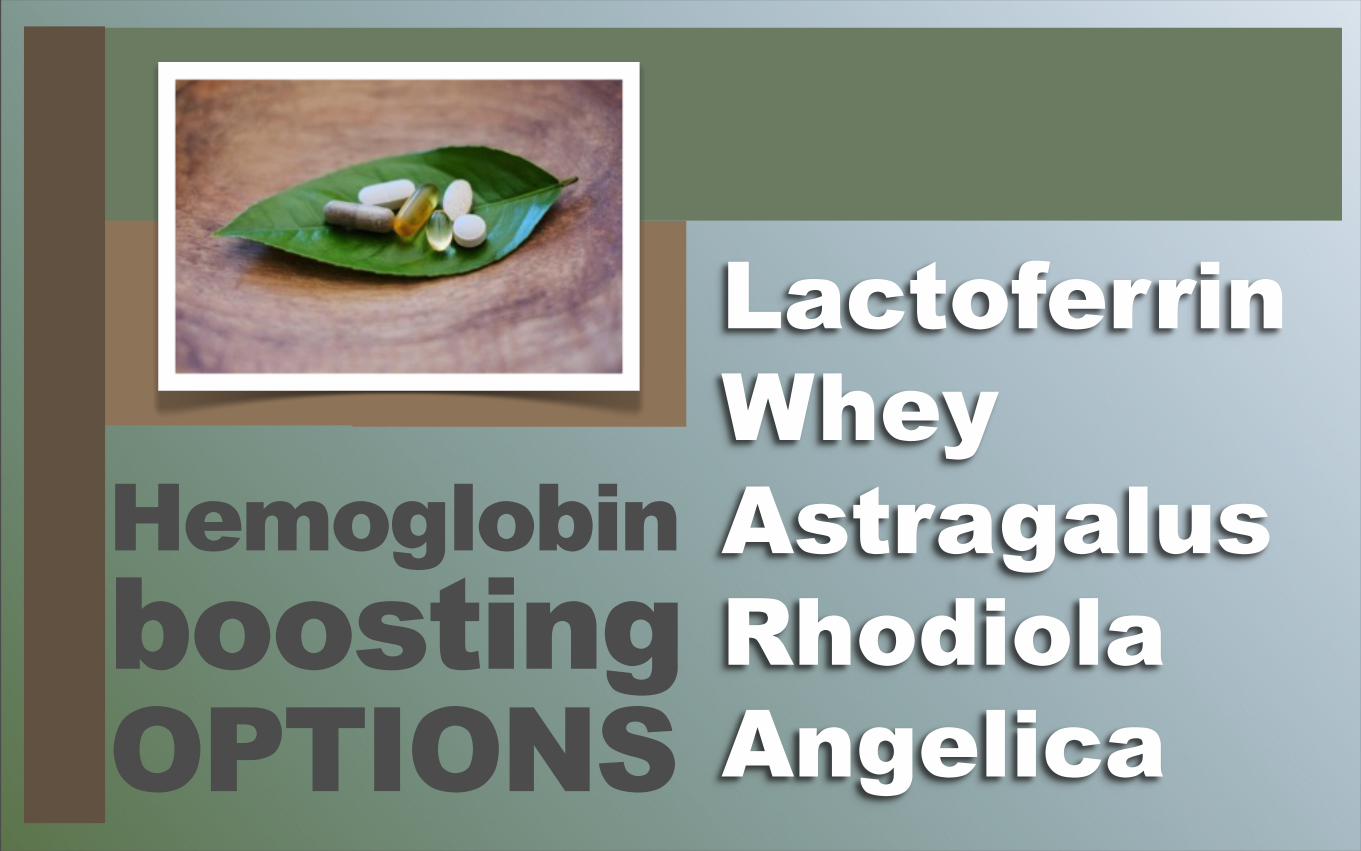
LactoferrinWheyAstragalusRhodiola Angelica
HemoglobinboostingOPTIONS
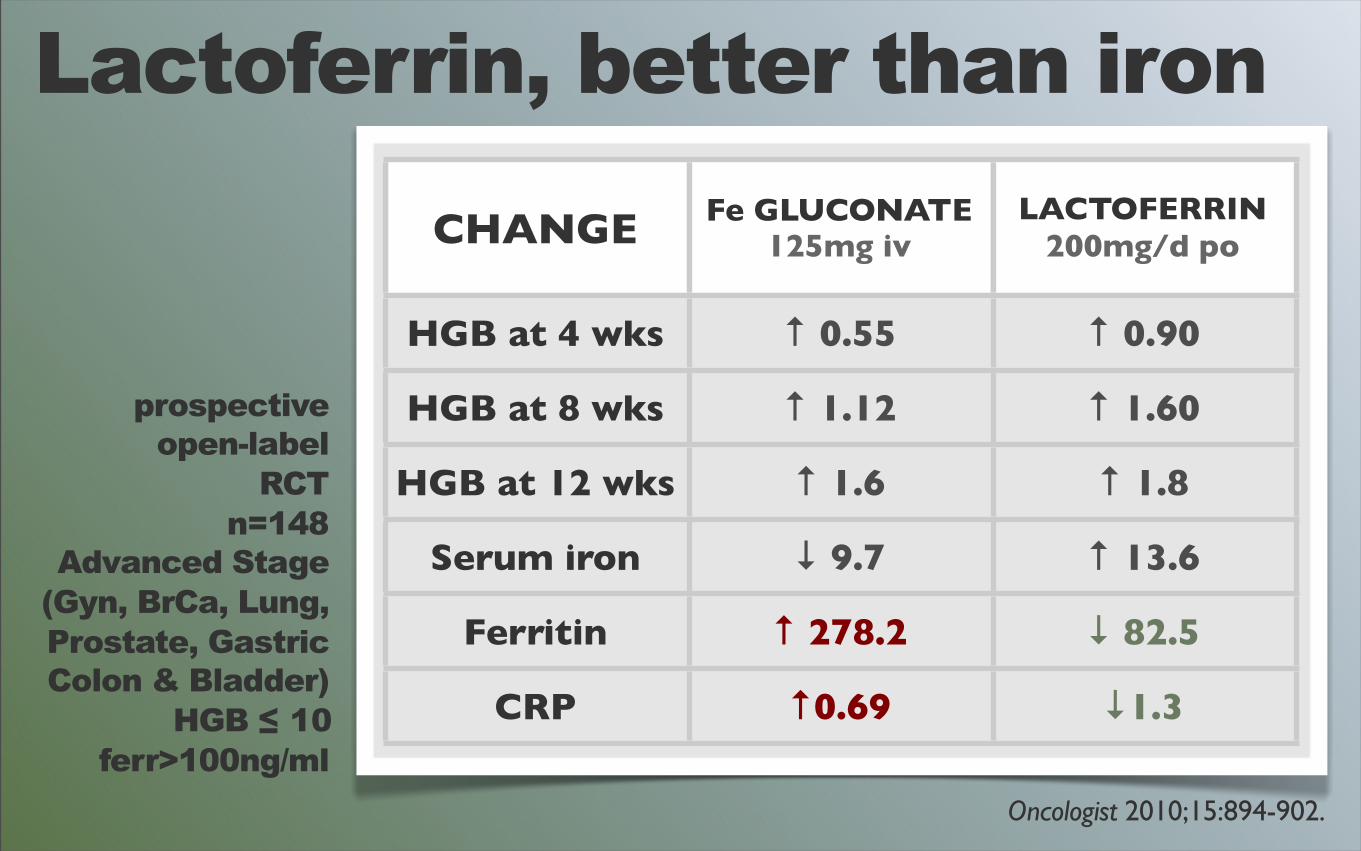
Lactoferrin, better than iron
prospectiveopen-label
RCTn=148
Advanced Stage(Gyn, BrCa, Lung,Prostate, GastricColon & Bladder)
HGB ≤ 10ferr>100ng/ml
CHANGE Fe GLUCONATE125mg iv
LACTOFERRIN200mg/d po
HGB at 4 wks ↑ 0.55 ↑ 0.90
HGB at 8 wks ↑ 1.12 ↑ 1.60
HGB at 12 wks ↑ 1.6 ↑ 1.8
Serum iron ↓ 9.7 ↑ 13.6
Ferritin ↑ 278.2 ↓ 82.5
CRP ↑0.69 ↓1.3
Oncologist 2010;15:894-902.
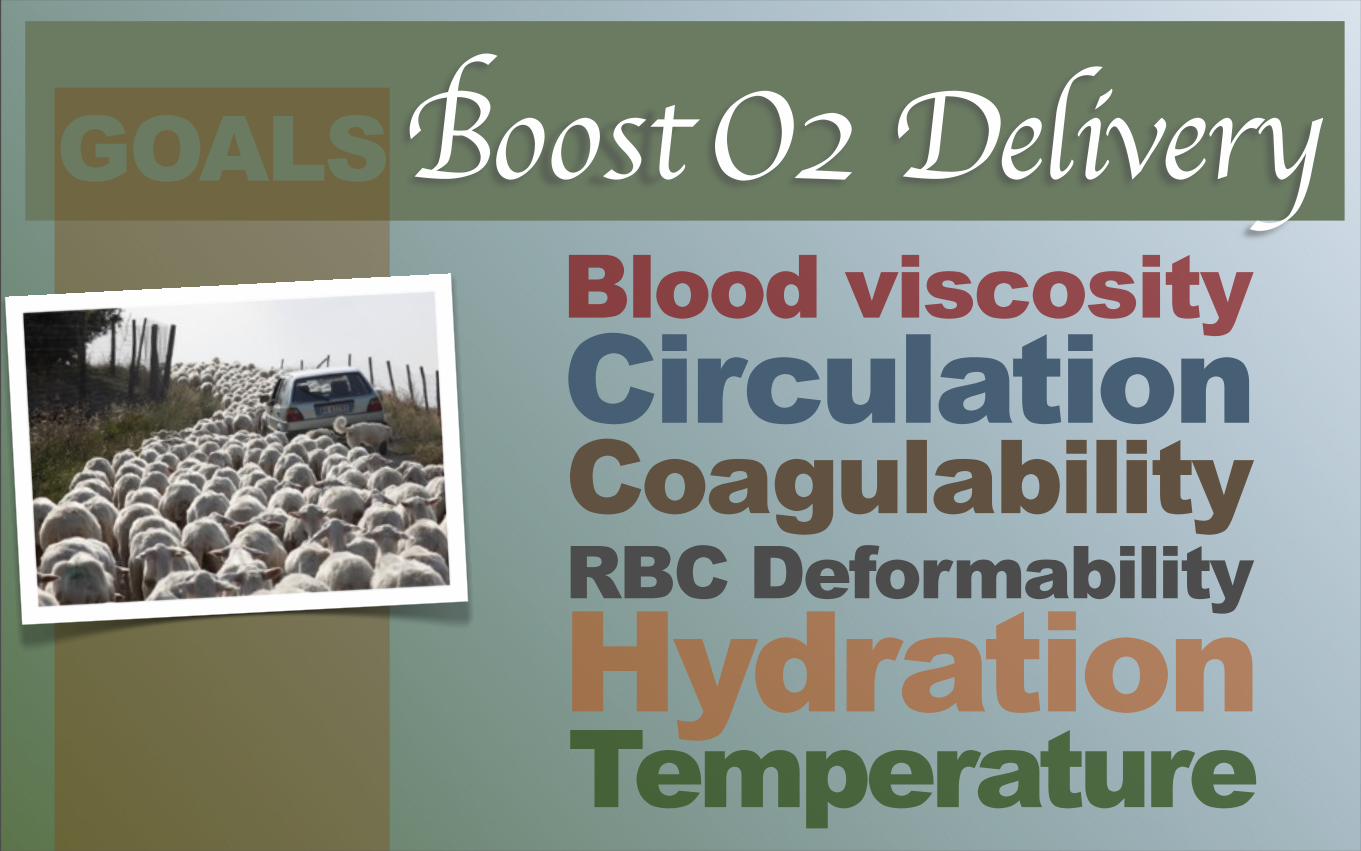
Things to Consider...Boost O2 Delivery
RBC DeformabilityCoagulabilityCirculationBlood viscosity
TemperatureHydration
GOALS
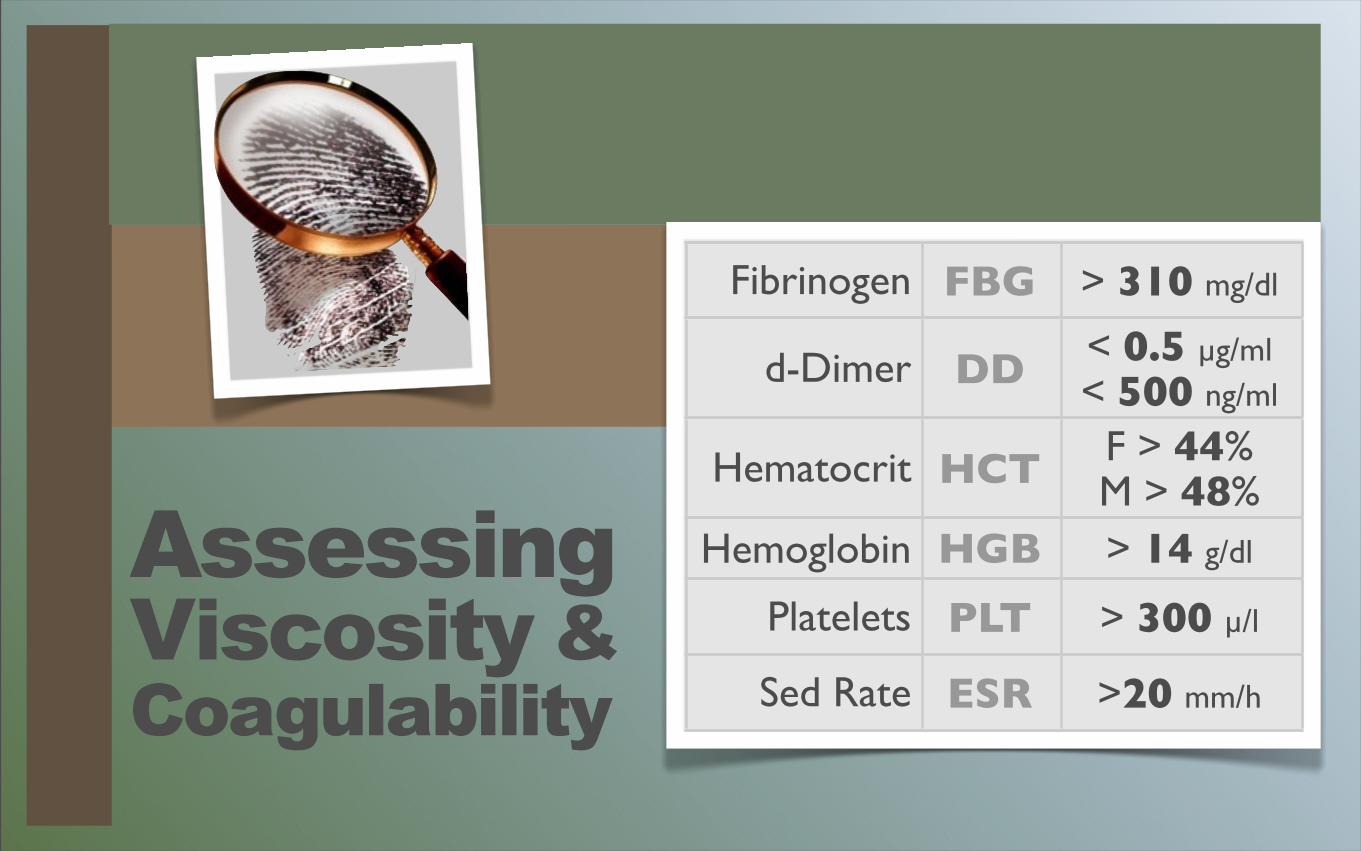
Fibrinogen FBG > 310 mg/dl
d-Dimer DD < 0.5 µg/ml< 500 ng/ml
Hematocrit HCT F > 44%M > 48%
Hemoglobin HGB > 14 g/dl
Platelets PLT > 300 µ/l
Sed Rate ESR >20 mm/h
AssessingViscosity &Coagulability
FIB
RIN
OG
EN
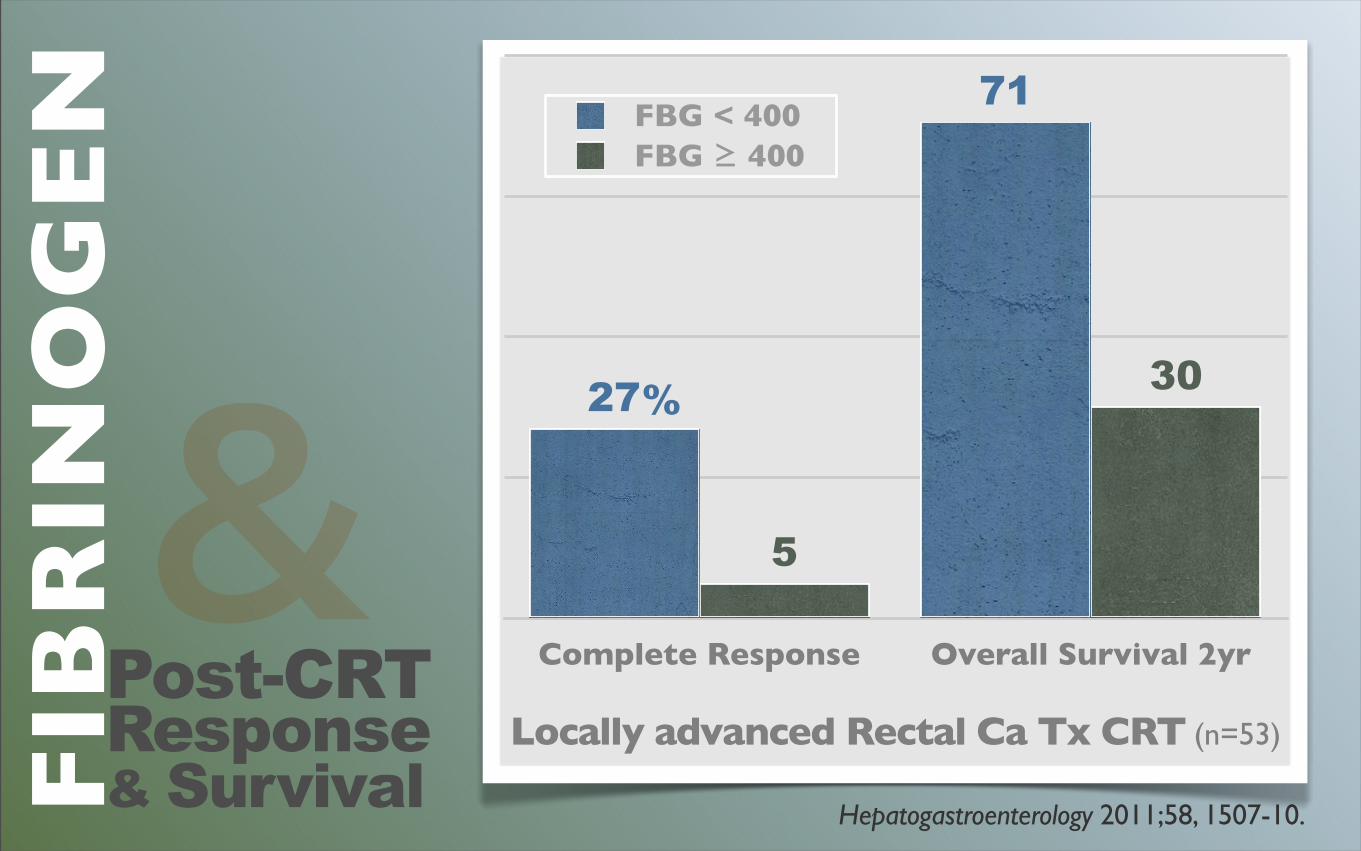
&Hepatogastroenterology 2011;58, 1507-10.
Complete Response Overall Survival 2yr
30
5
71
27
FBG < 400FBG ≥ 400
%
Locally advanced Rectal Ca Tx CRT (n=53)
Post-CRTResponse& Survival
Co
agu
lab
ilit
y
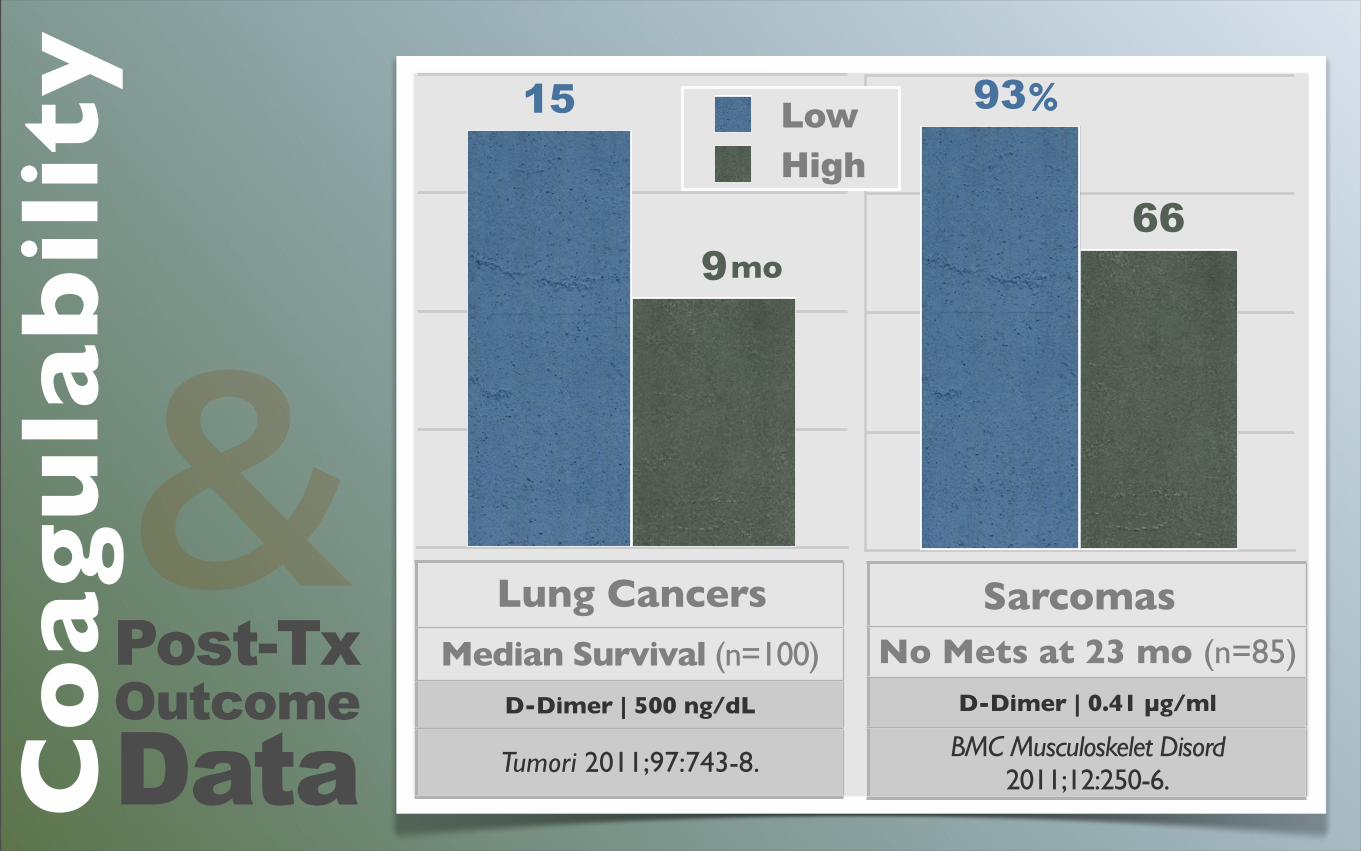
&Post-TxOutcomeData
Sarcomas
66
93
Lung Cancers
9
15
No Mets at 23 mo (n=85)D-Dimer | 0.41 µg/ml
BMC Musculoskelet Disord 2011;12:250-6.
Median Survival (n=100)D-Dimer | 500 ng/dL
Tumori 2011;97:743-8.
mo
%LowHigh
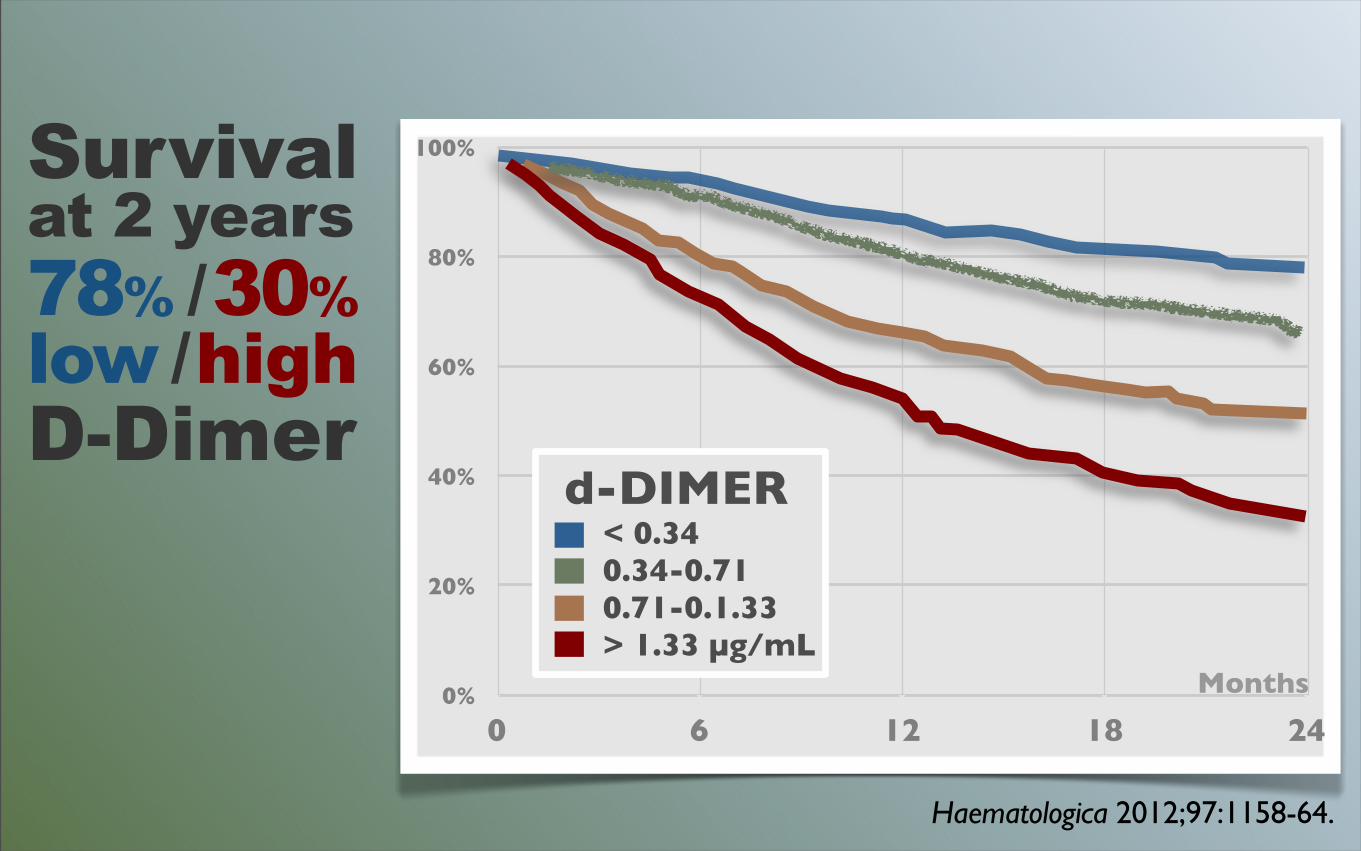
Survival at 2 years78% / 30%low / highD-Dimer
Haematologica 2012;97:1158-64.
0%
20%
40%
60%
80%
100%
0 6 12 18 24
Months
d-DIMER< 0.340.34-0.710.71-0.1.33> 1.33 µg/mL
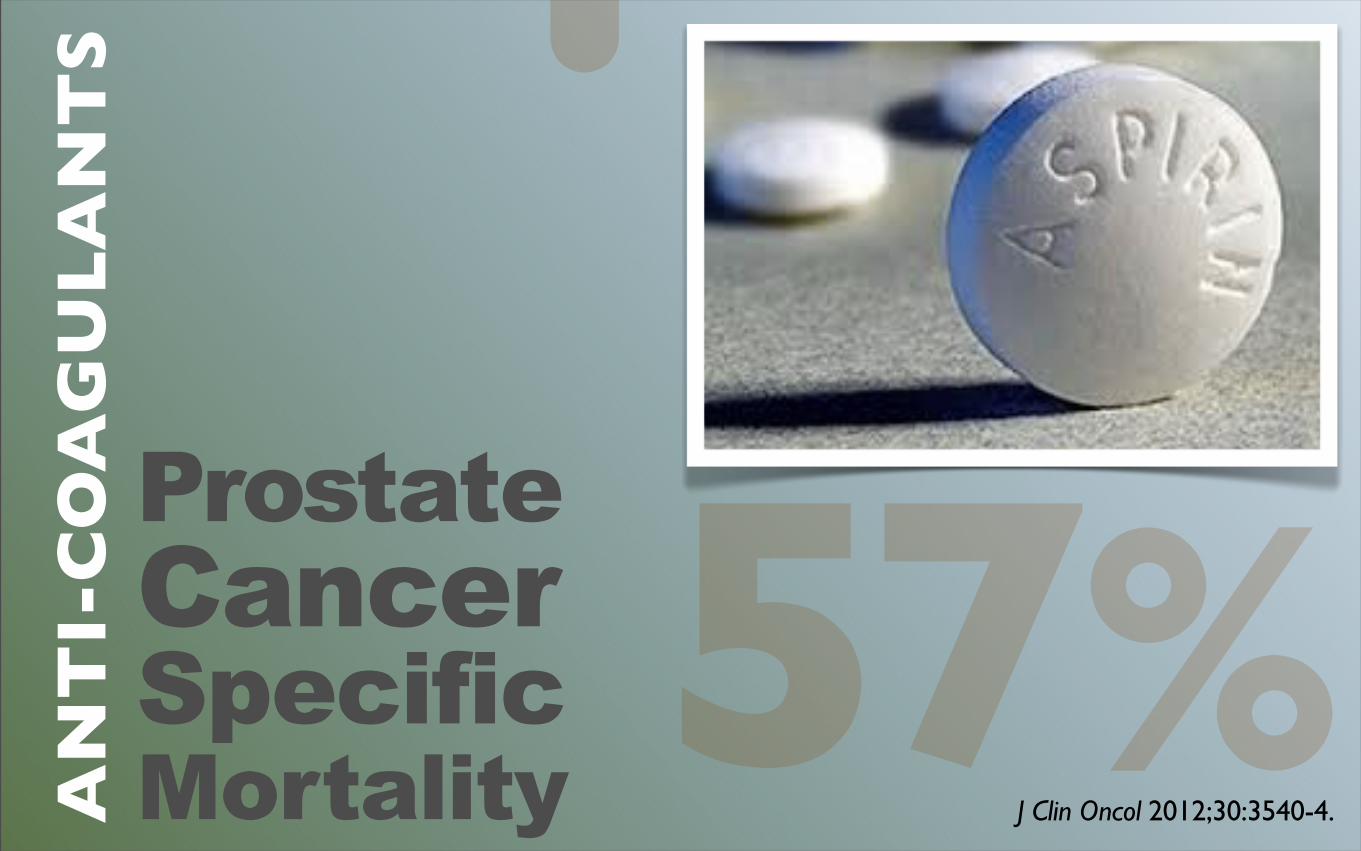
AN
TI-
CO
AG
UL
AN
TS
J Clin Oncol 2012;30:3540-4.
ProstateCancerSpecificMortality
➜
57%
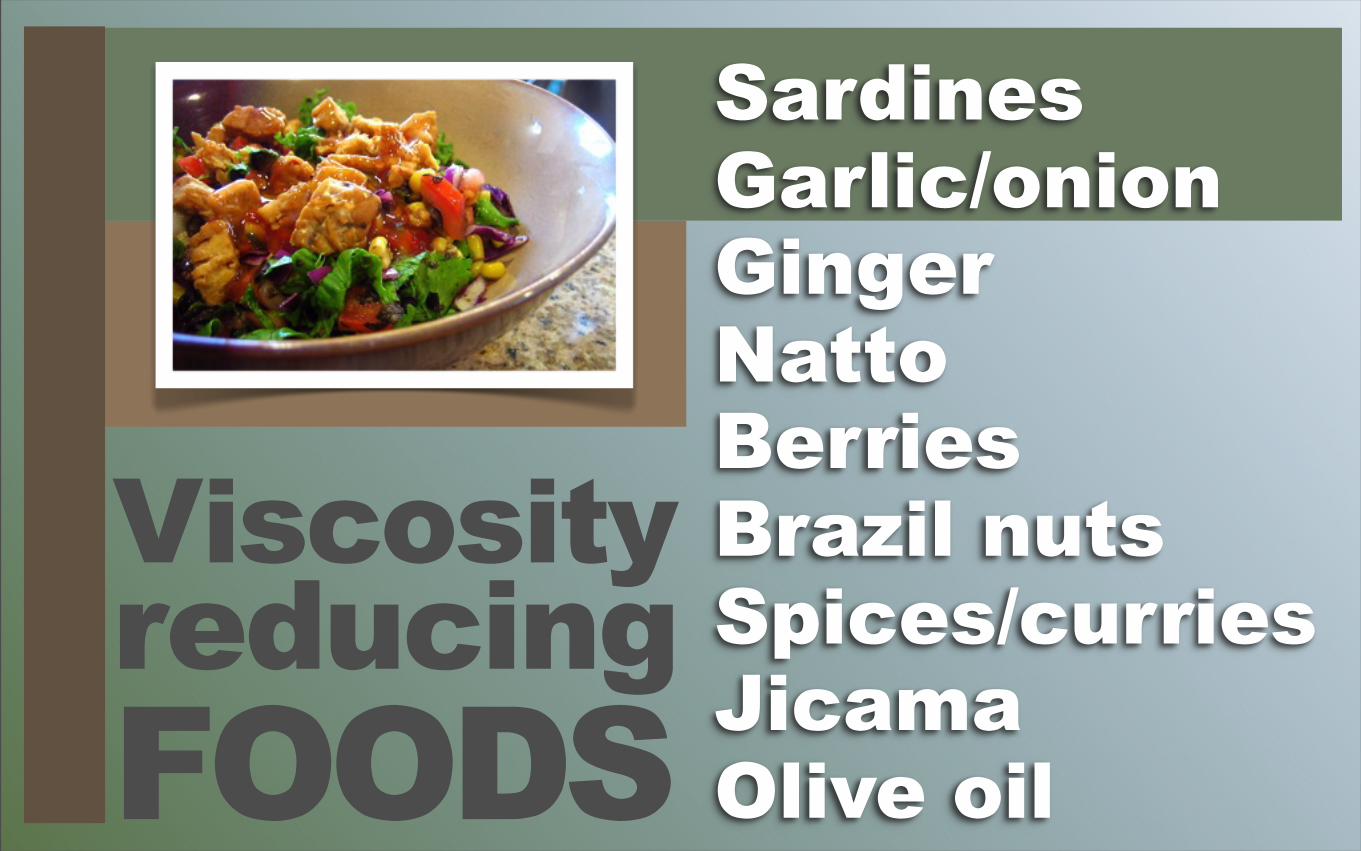
ViscosityreducingFOODS
SardinesGarlic/onionGingerNattoBerriesBrazil nutsSpices/curriesJicamaOlive oil
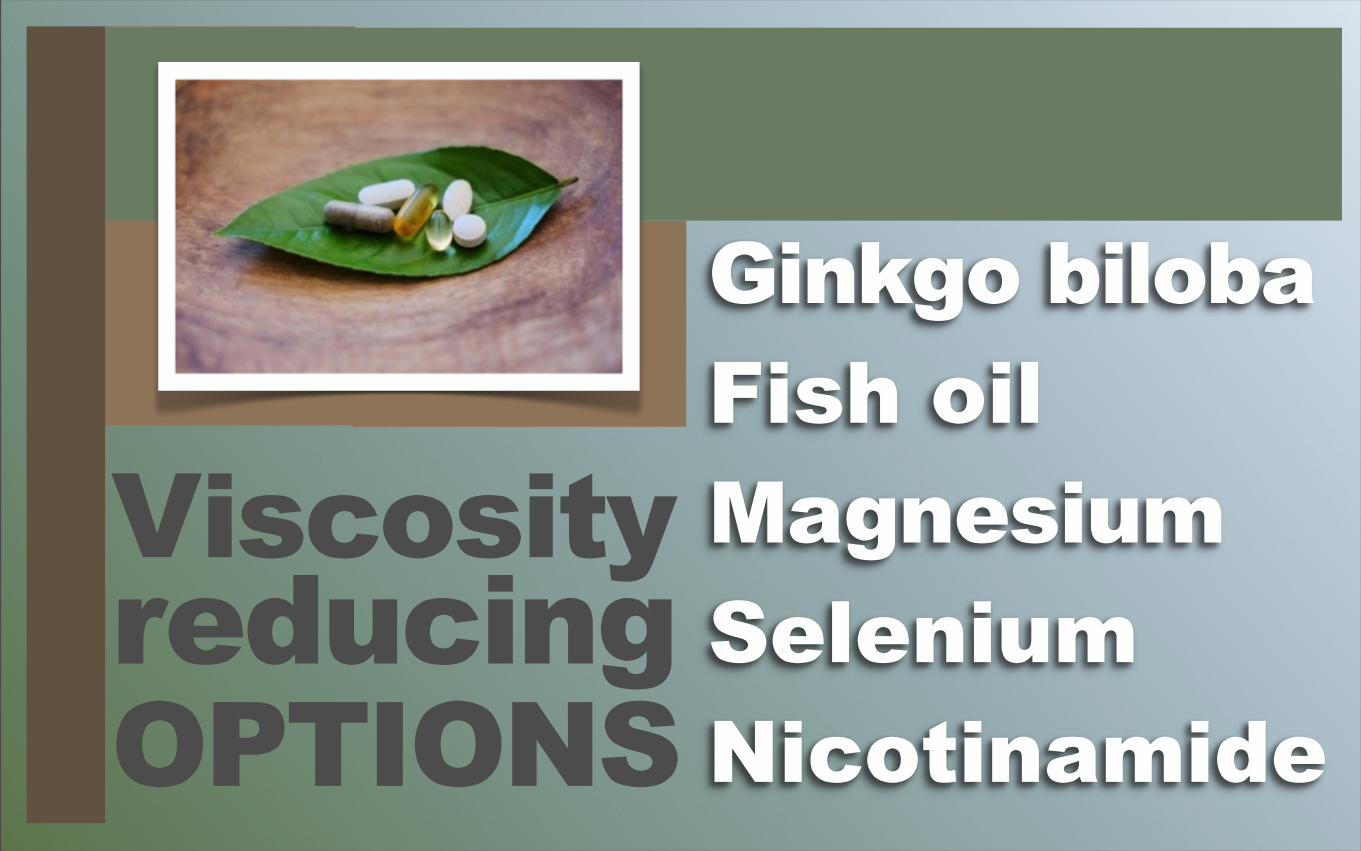
Ginkgo bilobaFish oilMagnesiumSeleniumNicotinamide
ViscosityreducingOPTIONS
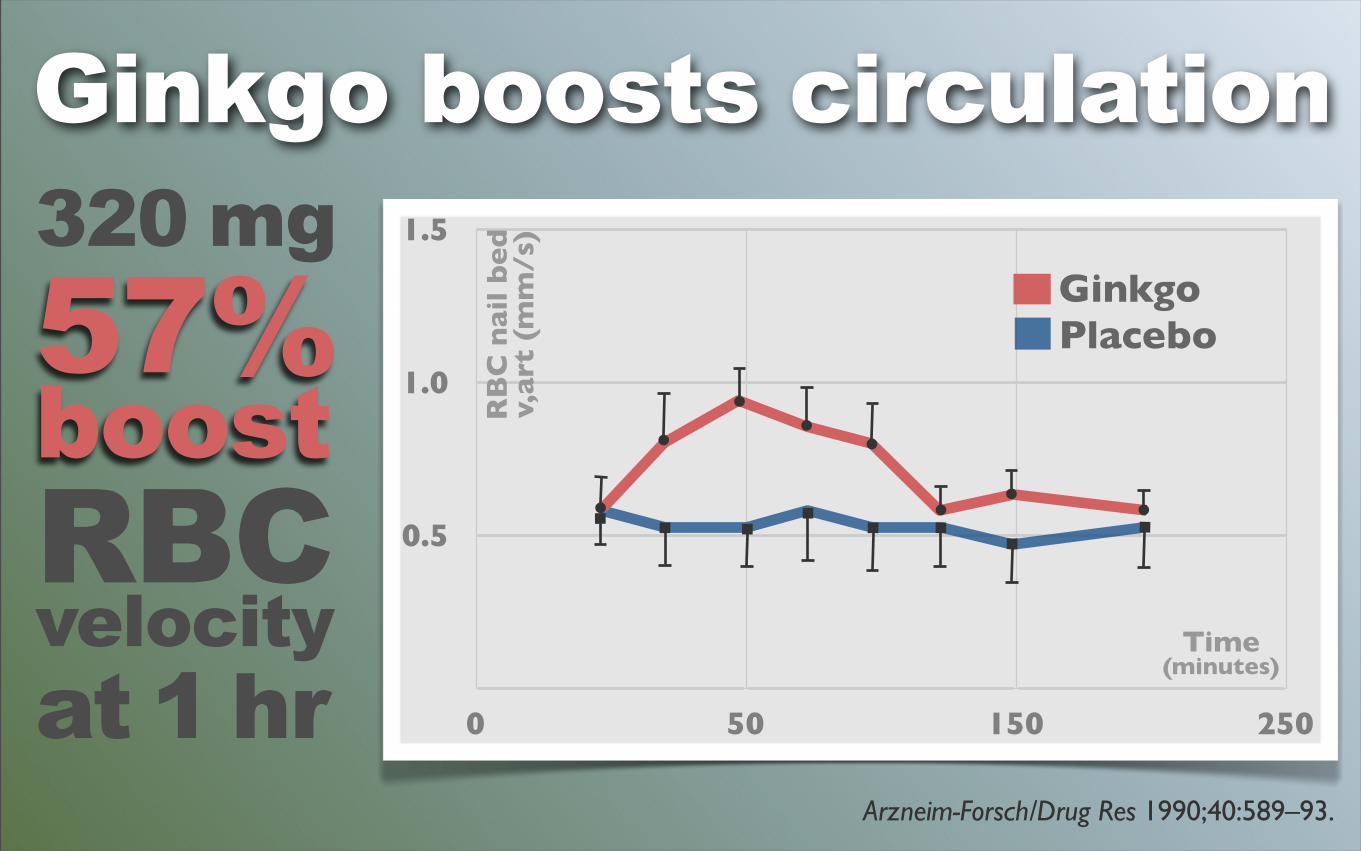
v,art(mm/s)
Arzneim-Forsch/Drug Res 1990;40:589–93.
0.5
1.0
1.5
0 50 150 250
Time(minutes)
GinkgoPlacebo
320 mg57%boostRBCvelocityat 1 hr
RB
C n
ail
be
dv,
art
(m
m/s
)
Ginkgo boosts circulation
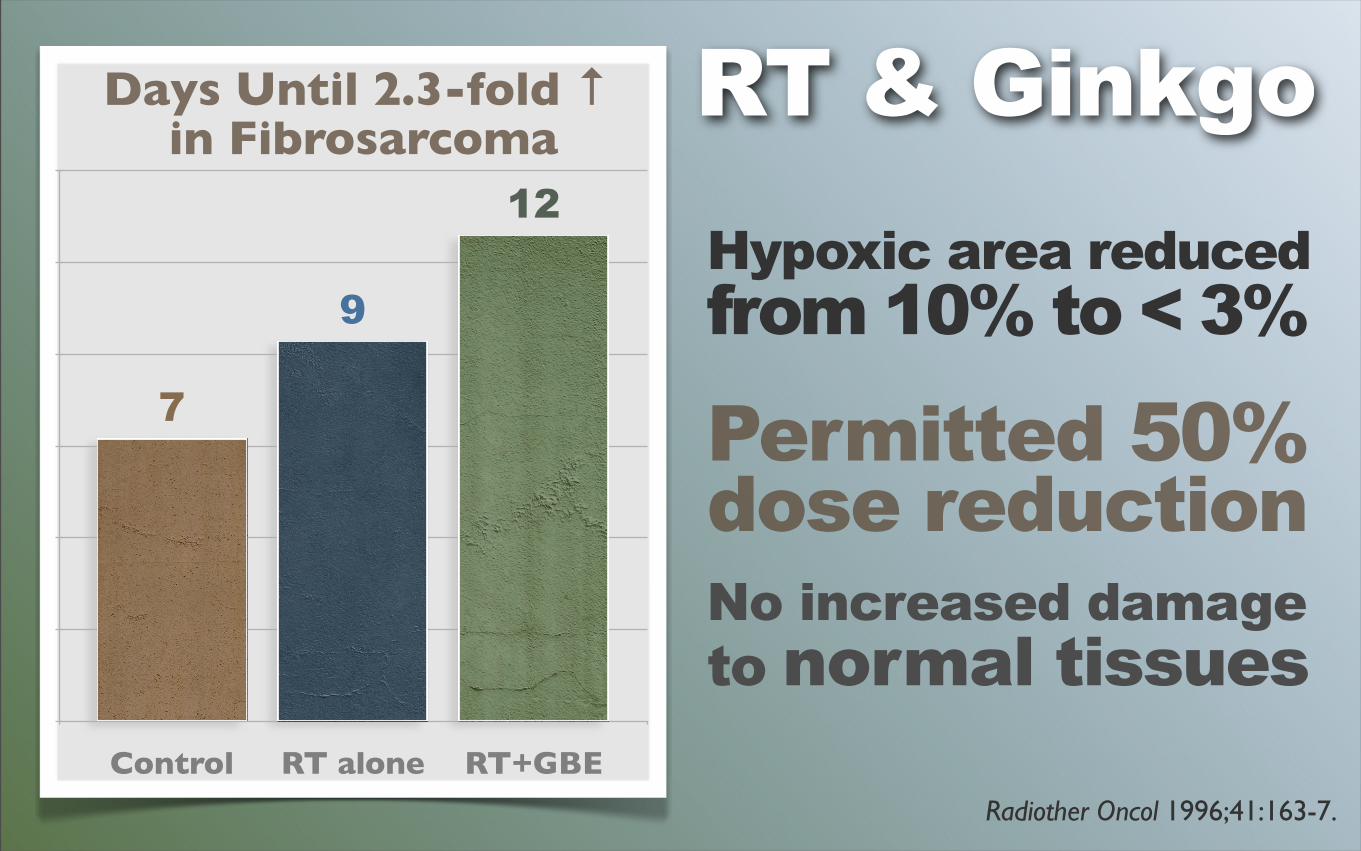
Radiother Oncol 1996;41:163-7.
Control RT alone RT+GBE
12
9
7
Days Until 2.3-fold ↑ in Fibrosarcoma
RT & GinkgoHypoxic area reduced from 10% to < 3%
Permitted 50%dose reductionNo increased damageto normal tissues
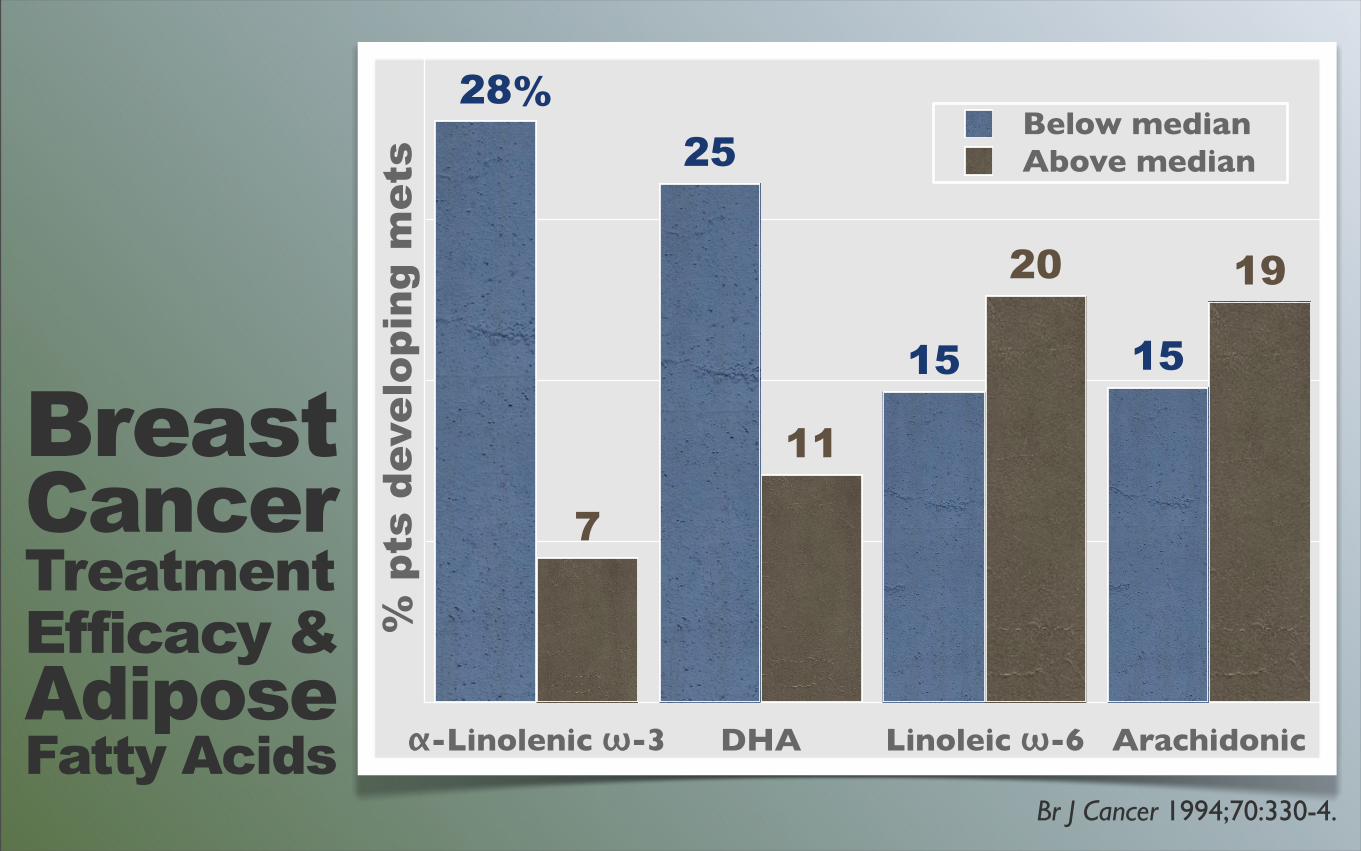
Br J Cancer 1994;70:330-4.
α-Linolenic ω-3 DHA Linoleic ω-6 Arachidonic
1920
11
7
1515
2528
Below medianAbove median
%
% p
ts d
evel
opin
g m
ets
Breast Cancer Treatment Efficacy & Adipose Fatty Acids
Gan To Kagaku Ryoho 2008;35:437-40.
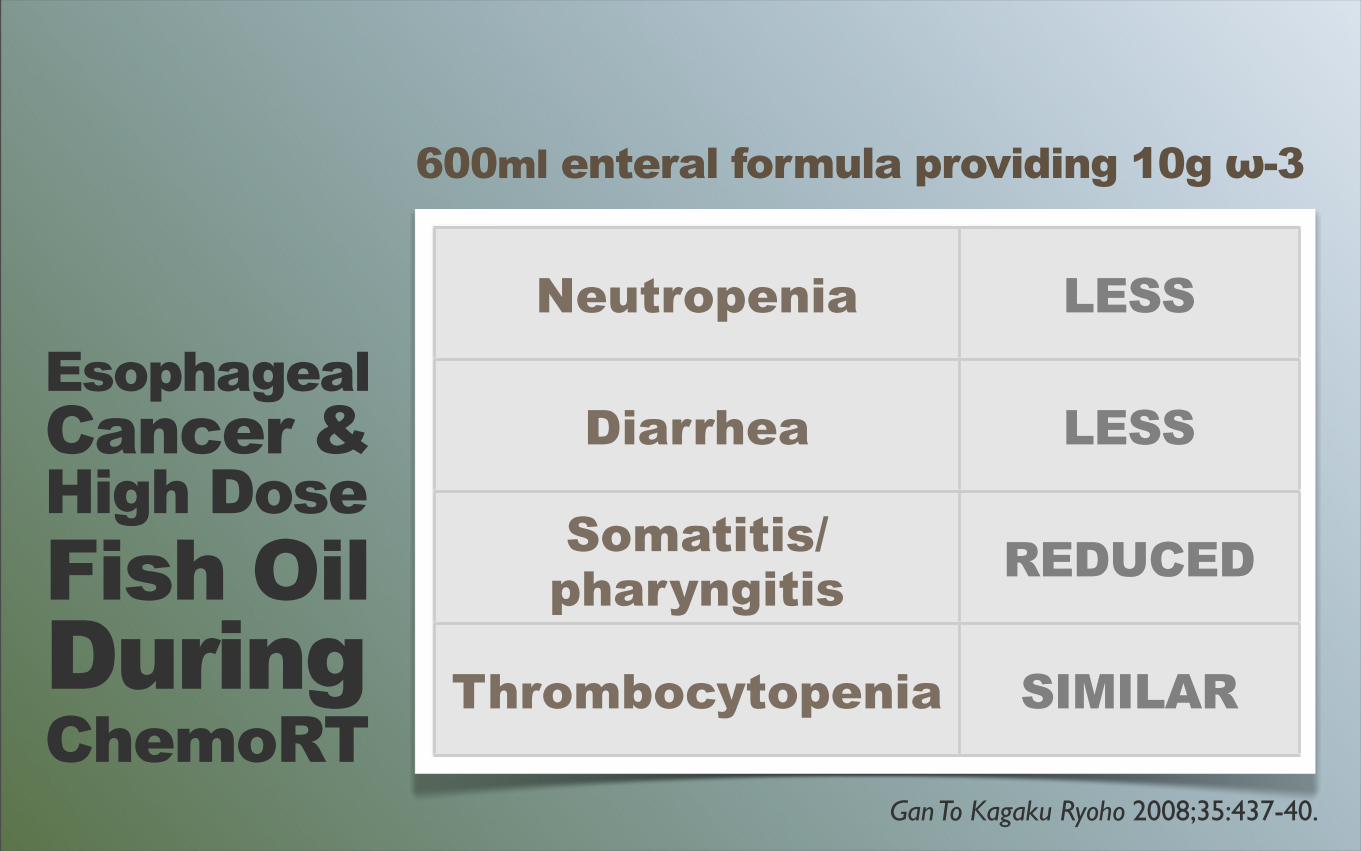
600ml enteral formula providing 10g ω-3
EsophagealCancer &High Dose Fish OilDuring ChemoRT
Neutropenia LESS
Diarrhea LESS
Somatitis/pharyngitis REDUCED
Thrombocytopenia SIMILAR
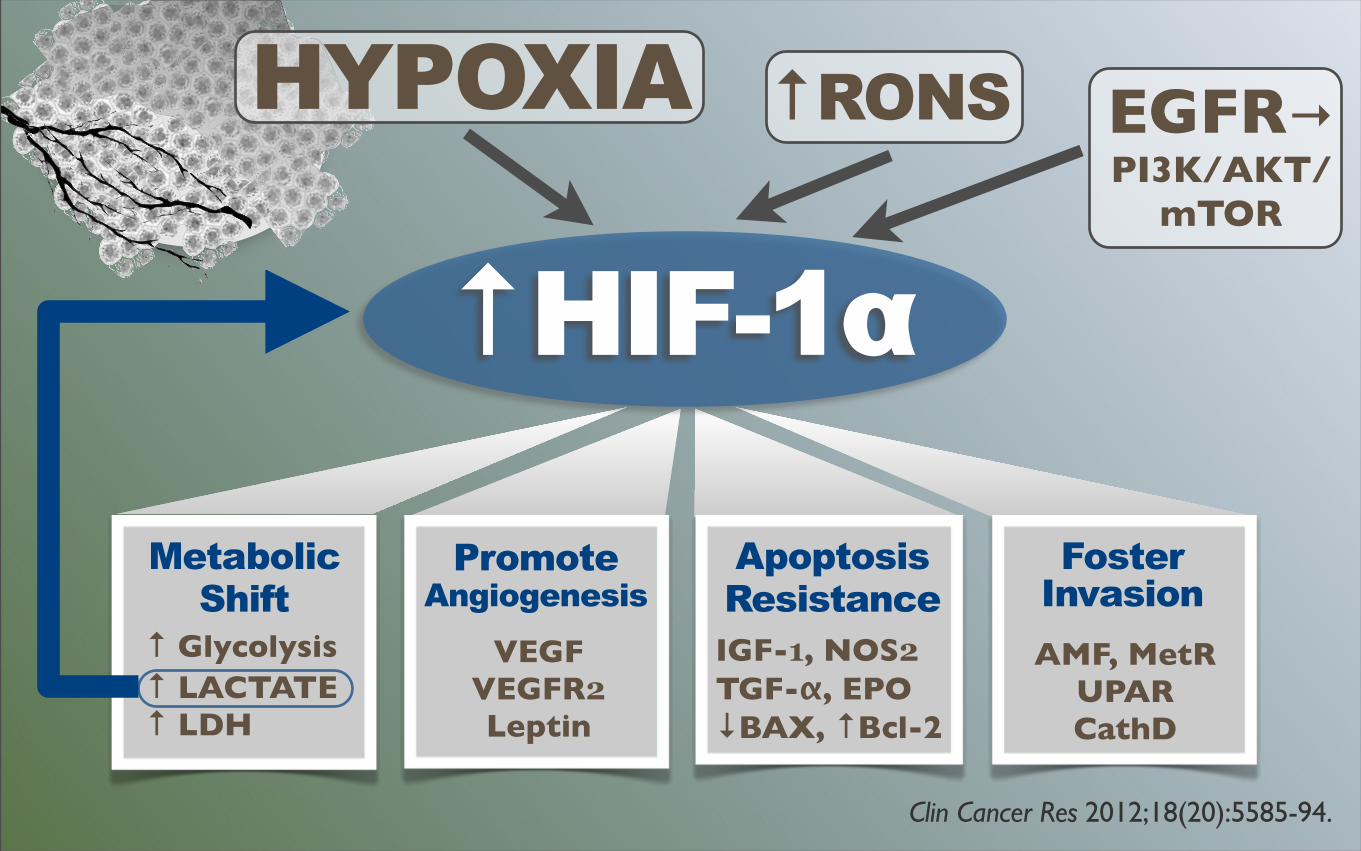
Clin Cancer Res 2012;18(20):5585-94.
HYPOXIA
↑ HIF-1α
FosterInvasion
Metabolic Shift
Promote Angiogenesis
ApoptosisResistance
↑ Glycolysis↑ LACTATE↑ LDH
VEGFVEGFR2Leptin
IGF-1, NOS2TGF-α, EPO↓BAX, ↑Bcl-2
AMF, MetRUPARCathD
↑ RONS EGFR→PI3K/AKT/
mTOR
High HIF1-α expressioncorrelates with poor locoregional control and increased riskof tumor-related mortality
Clin Cancer Res 2012;18(20):5585-94.
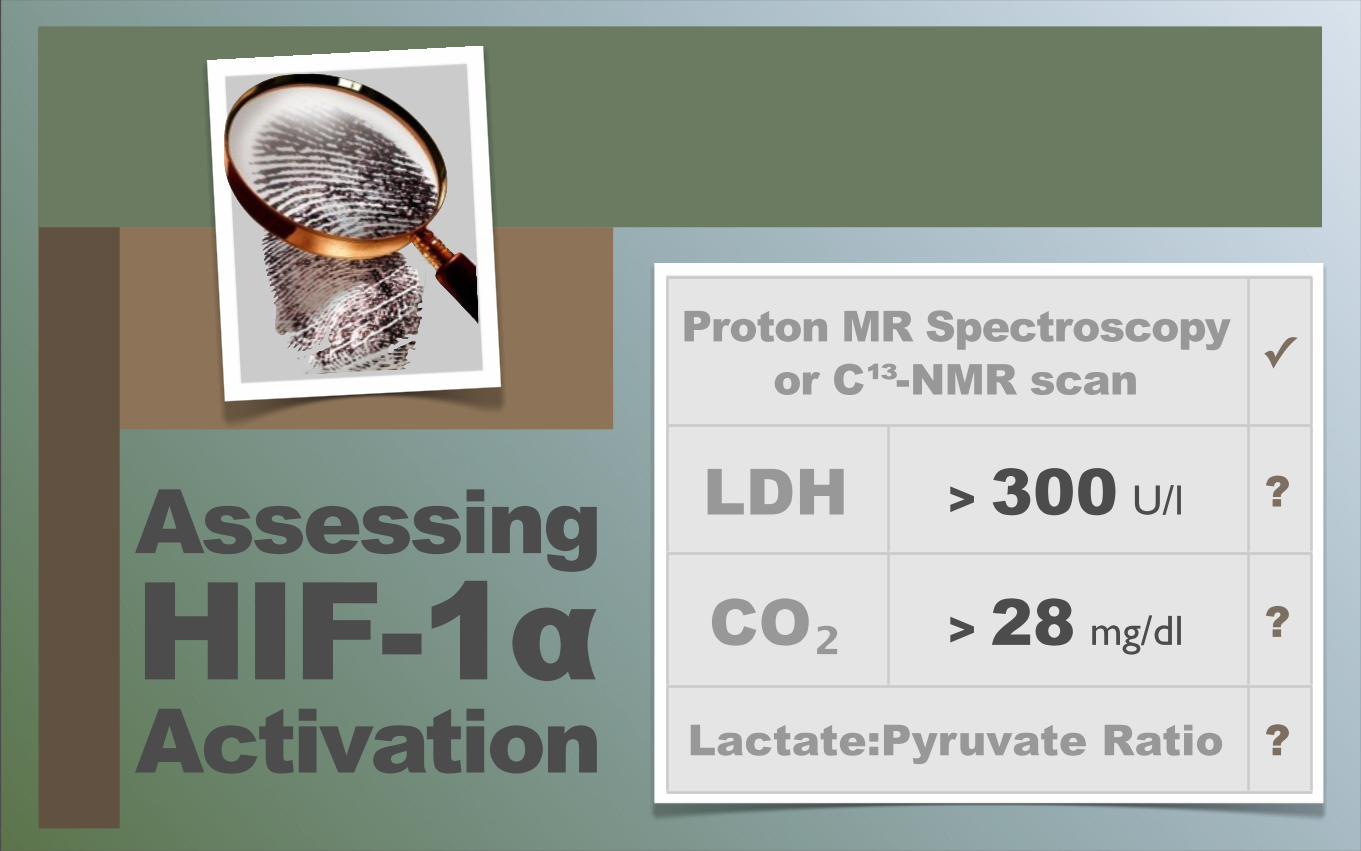
AssessingHIF-1αActivation
Proton MR Spectroscopyor C¹³-NMR scan
Proton MR Spectroscopyor C¹³-NMR scan ✓
LDH > 300 U/l ?
CO₂ > 28 mg/dl ?
Lactate:Pyruvate RatioLactate:Pyruvate Ratio ?
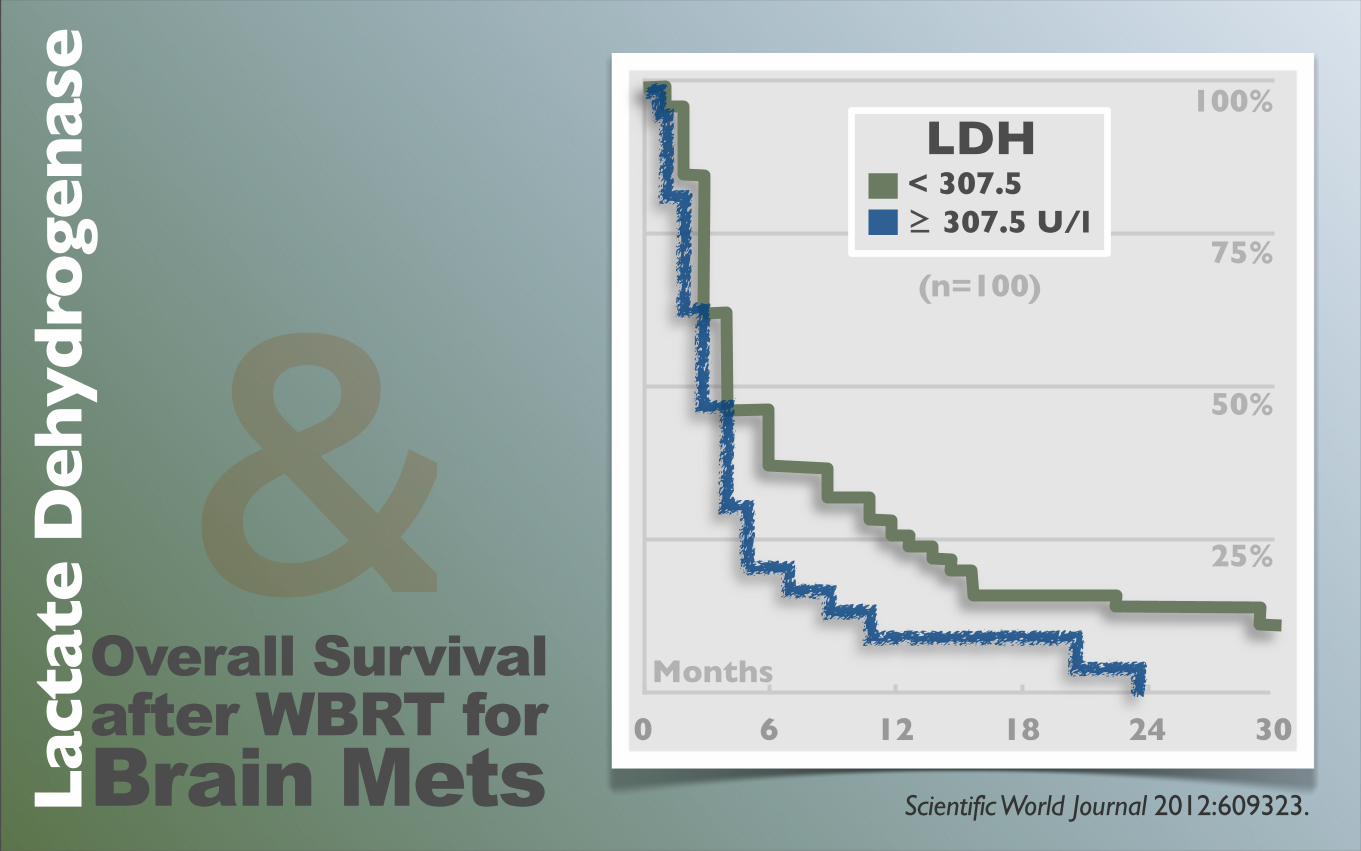
Overall Survivalafter WBRT forBrain MetsLac
tate
Deh
ydro
gen
ase
&Scientific World Journal 2012:609323.
0 6 12 18 24 30
Months
100%
75%
50%
25%
LDH< 307.5 ≥ 307.5 U/l
(n=100)
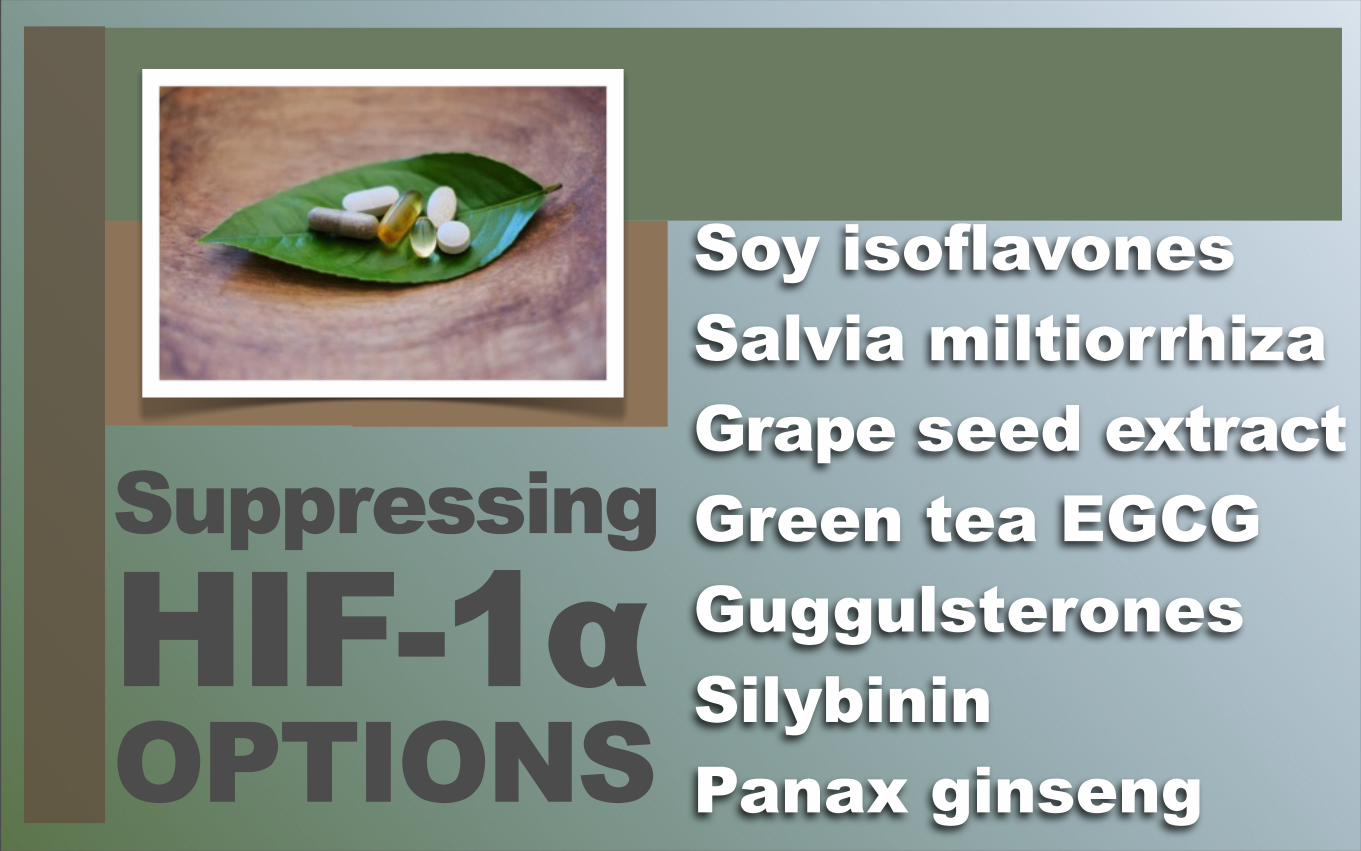
Suppressing
HIF-1αOPTIONS
Soy isoflavones Salvia miltiorrhizaGrape seed extractGreen tea EGCGGuggulsterones SilybininPanax ginseng
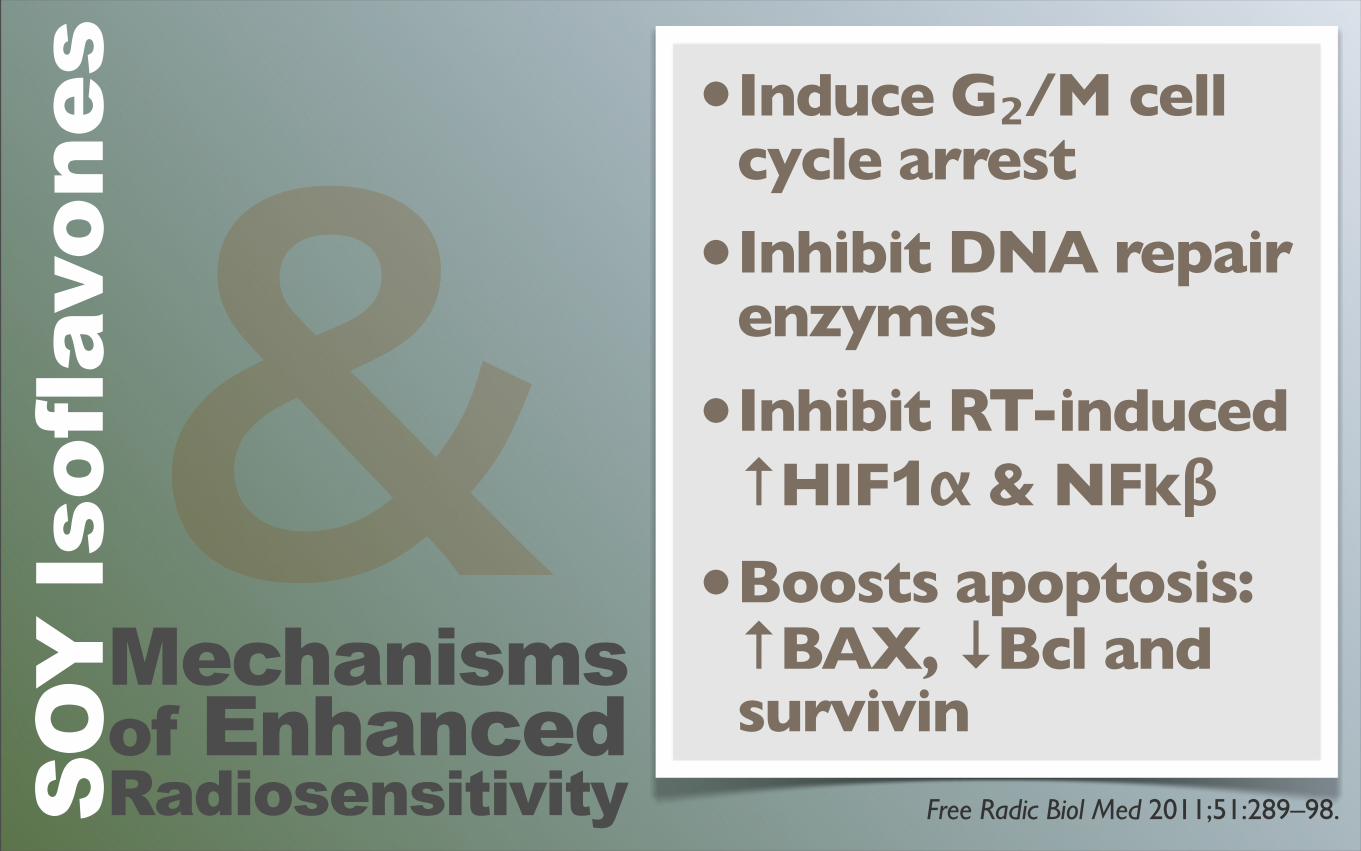
Mechanisms of EnhancedRadiosensitivitySOY
Isof
lavo
nes •Induce G₂/M cell
cycle arrest
•Inhibit DNA repair enzymes
•Inhibit RT-induced ↑HIF1α & NFkβ
•Boosts apoptosis: ↑BAX, ↓Bcl and survivin
Free Radic Biol Med 2011;51:289–98.
&
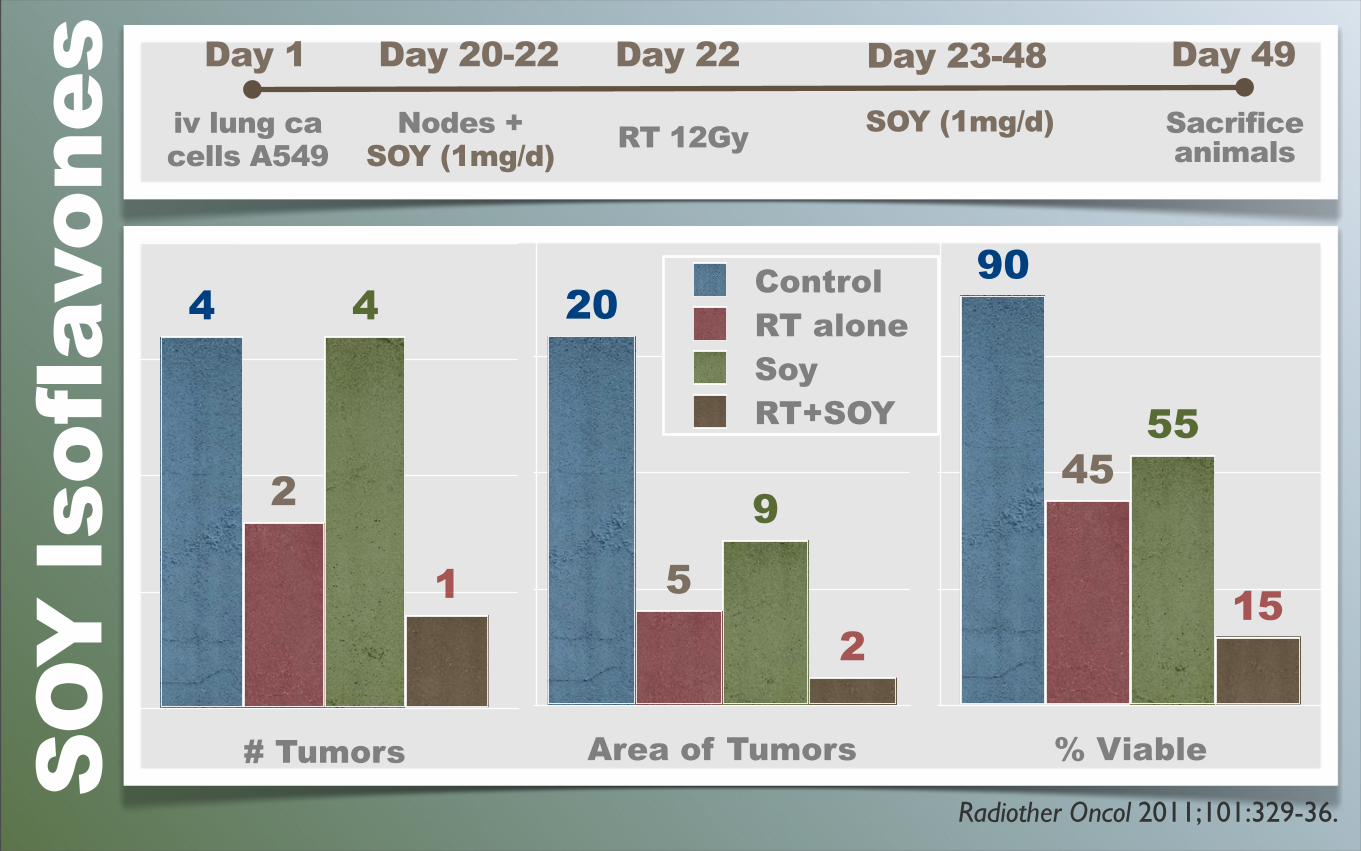
Radiother Oncol 2011;101:329-36.
SOY
Isof
lavo
nes Day 1 Day 20-22 Day 23-48 Day 49
iv lung cacells A549
Nodes +SOY (1mg/d)
Day 22
RT 12Gy SOY (1mg/d) Sacrificeanimals
# Tumors
1
4
2
4
% Viable
15
5545
90
Area of Tumors
2
9
5
20 ControlRT aloneSoyRT+SOY
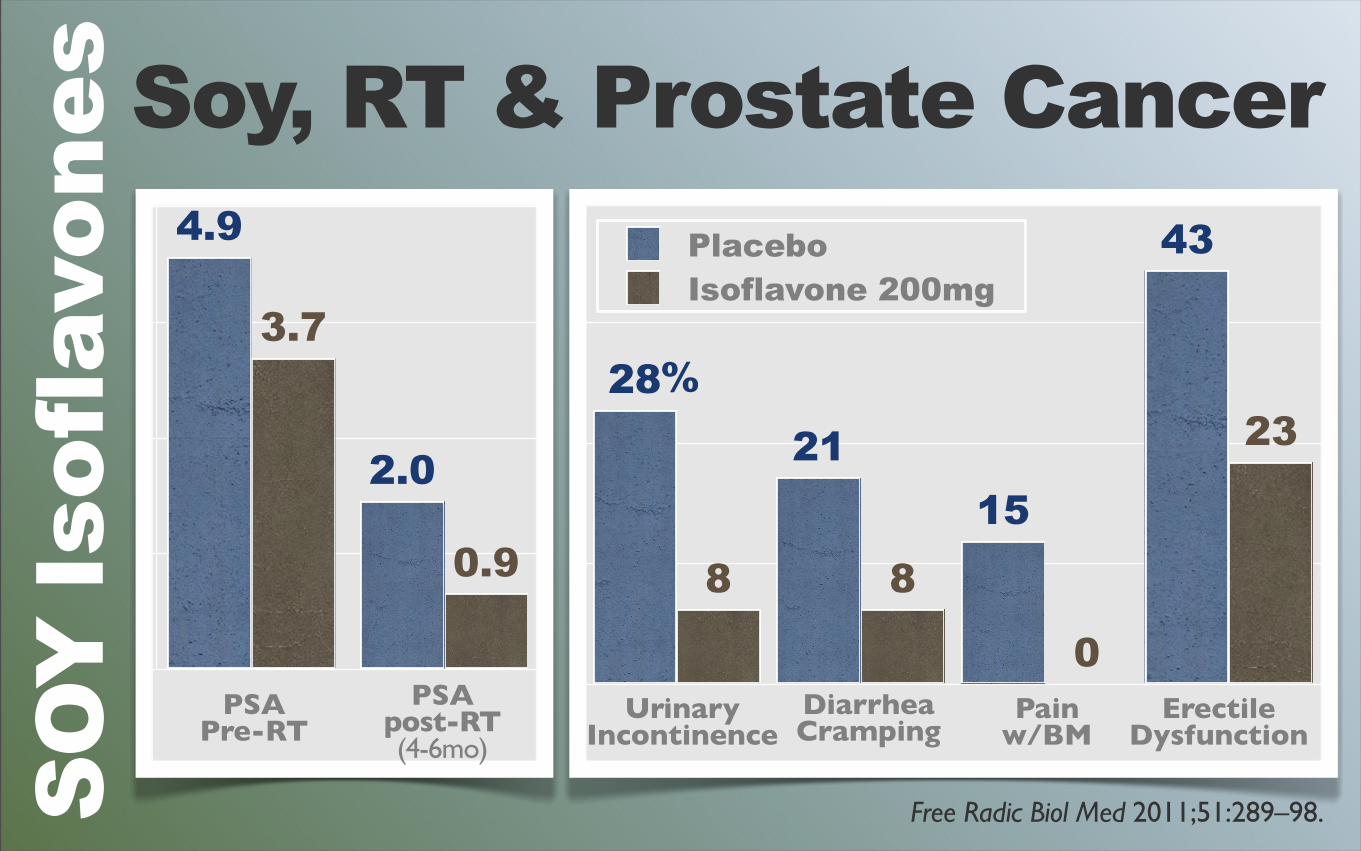
Soy, RT & Prostate Cancer
Free Radic Biol Med 2011;51:289–98.SOY
Isof
lavo
nes
23
0
88
43
1521
28
PlaceboIsoflavone 200mg
UrinaryIncontinence
DiarrheaCramping
ErectileDysfunction
Pain w/BM
0.9
3.7
2.0
4.9
PSAPre-RT
PSApost-RT(4-6mo)
%
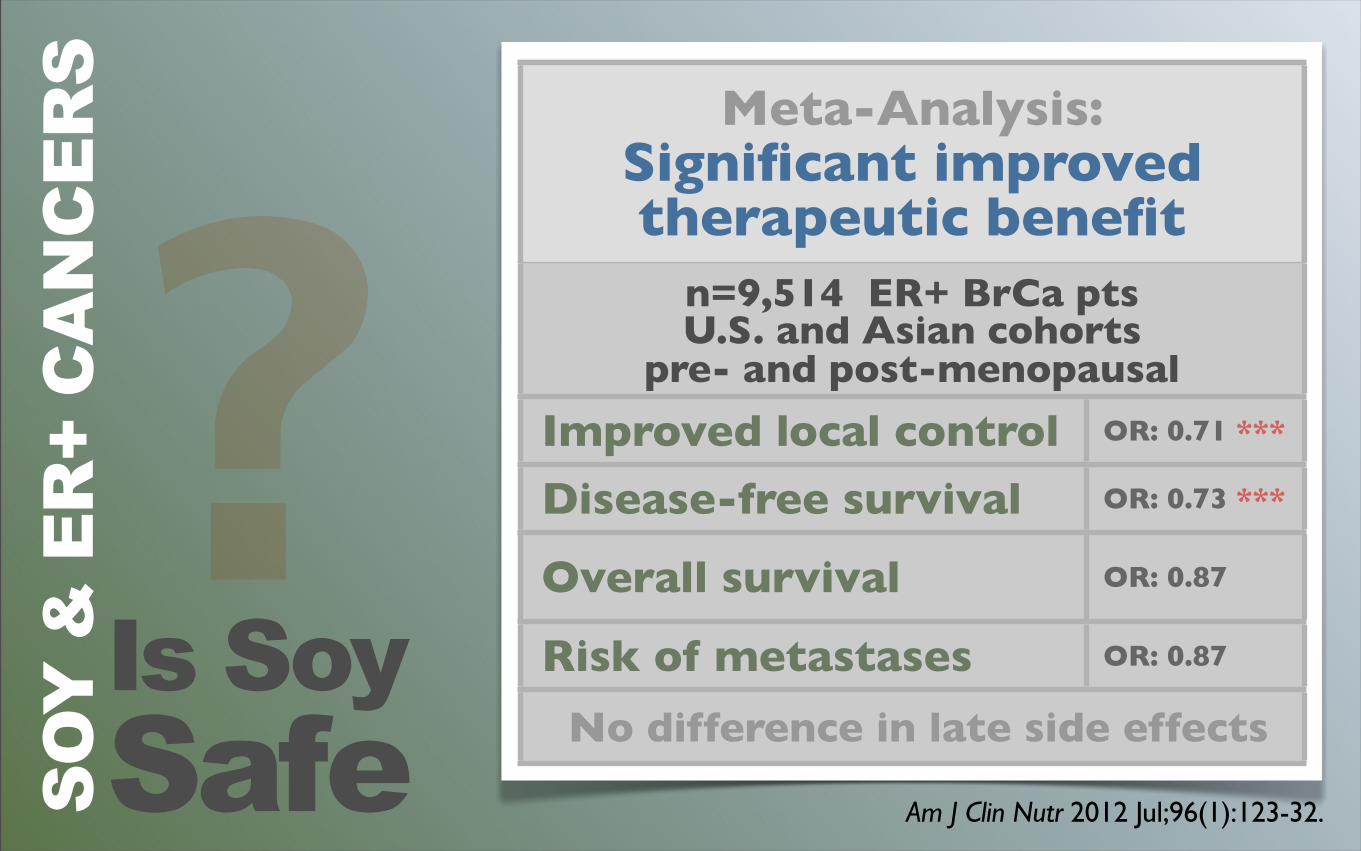
Am J Clin Nutr 2012 Jul;96(1):123-32.
Meta-Analysis:Significant improved therapeutic benefit
Meta-Analysis:Significant improved therapeutic benefit
n=9,514 ER+ BrCa pts U.S. and Asian cohorts
pre- and post-menopausal
n=9,514 ER+ BrCa pts U.S. and Asian cohorts
pre- and post-menopausal
Improved local control OR: 0.71 ***
Disease-free survival OR: 0.73 ***
Overall survival OR: 0.87
Risk of metastases OR: 0.87
No difference in late side effects No difference in late side effectsIs SoySafe
?SO
Y &
ER
+ C
AN
CER
S
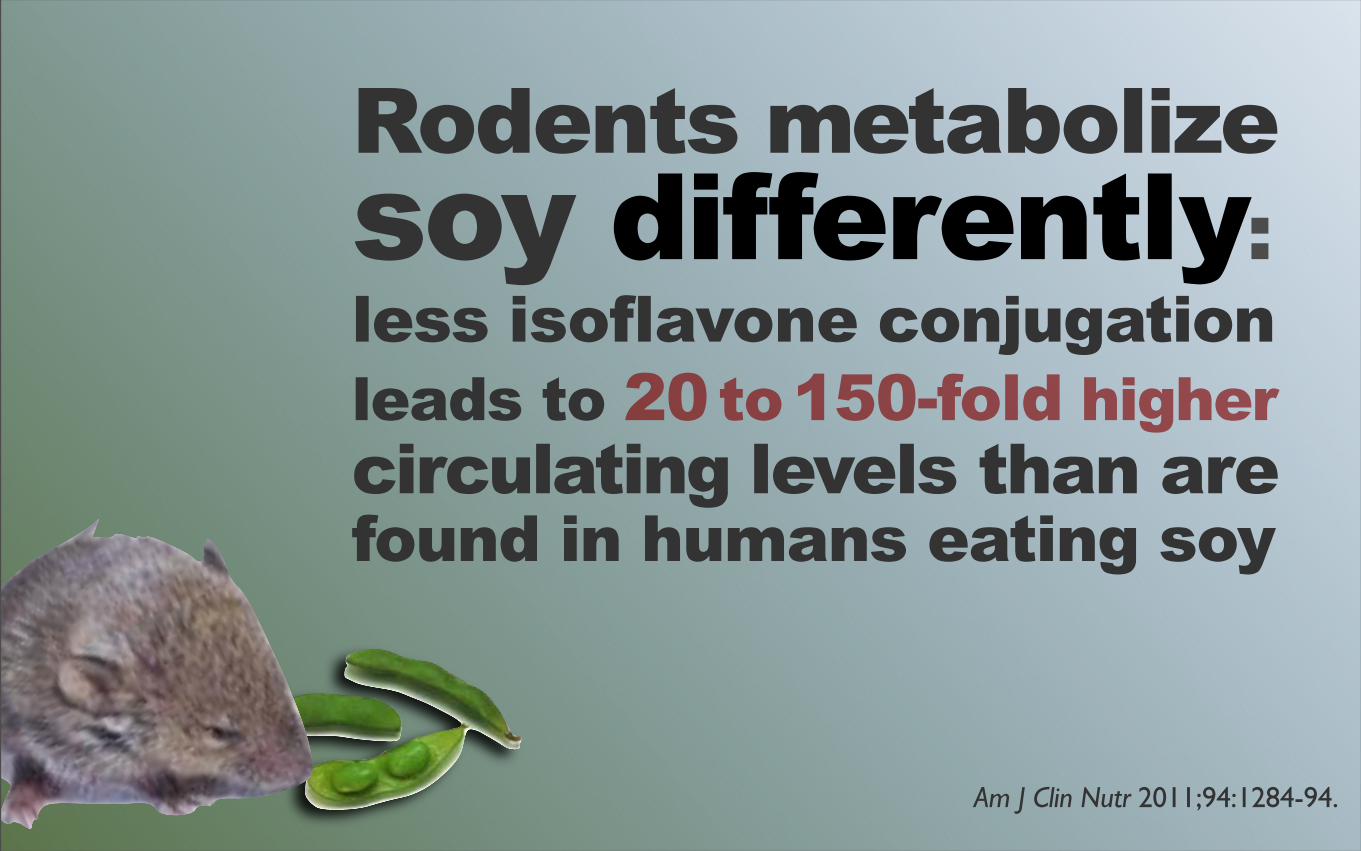
Rodents metabolizesoy differently:less isoflavone conjugationleads to 20 to 150-fold highercirculating levels than are found in humans eating soy
Am J Clin Nutr 2011;94:1284-94.
Wait a minute here,what about antioxidants?
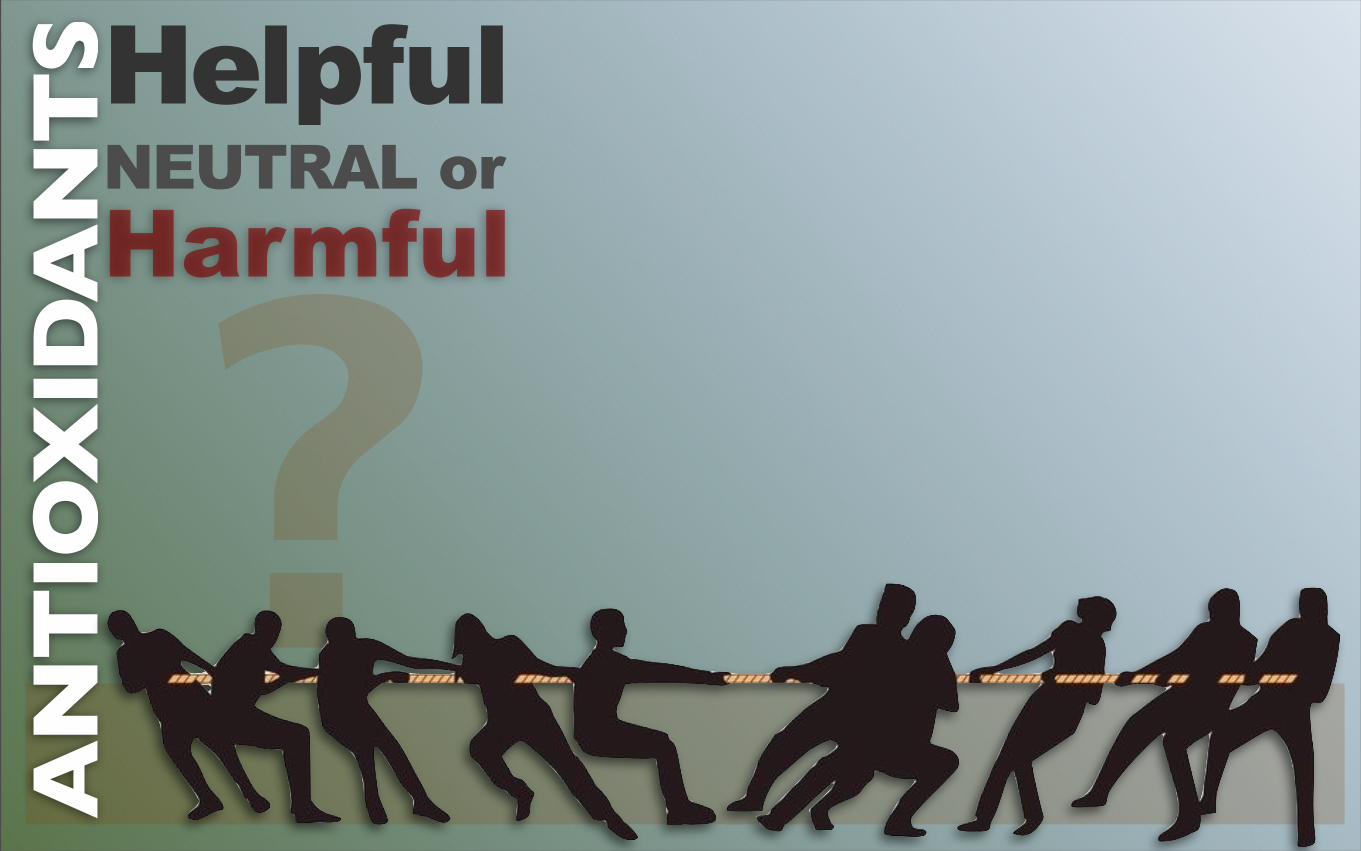
AN
TIO
XID
AN
TSHelpful
NEUTRAL orHarmful
?
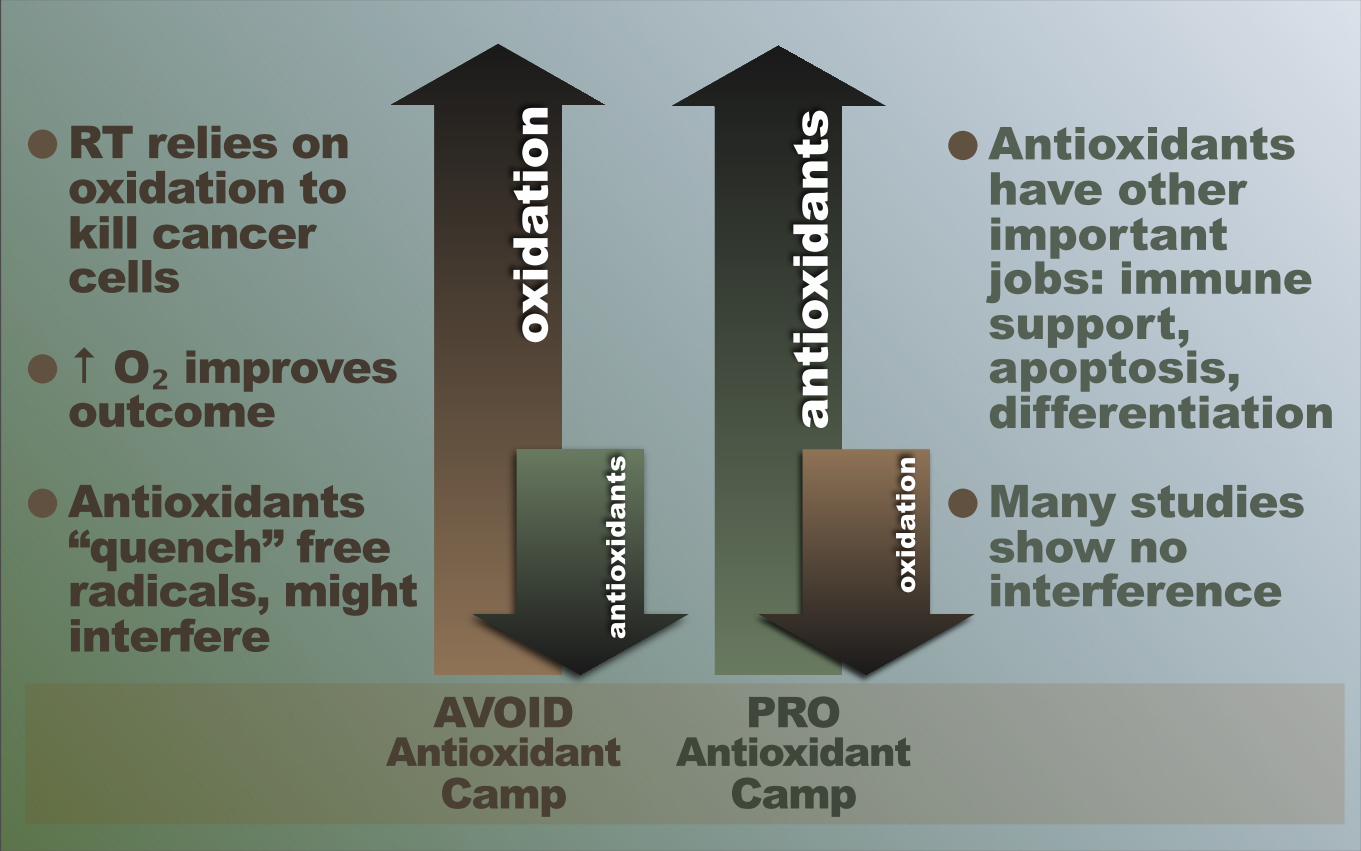
•RT relies on oxidation to kill cancer cells
•↑ O₂ improves outcome
•Antioxidants “quench” free radicals, might interfere
•Antioxidants have other important jobs: immune support, apoptosis, differentiation
•Many studies show no interference
oxid
atio
n
AVOIDAntioxidant
Camp
anti
oxid
ants
anti
oxid
ants
PROAntioxidant
Camp
oxid
atio
n
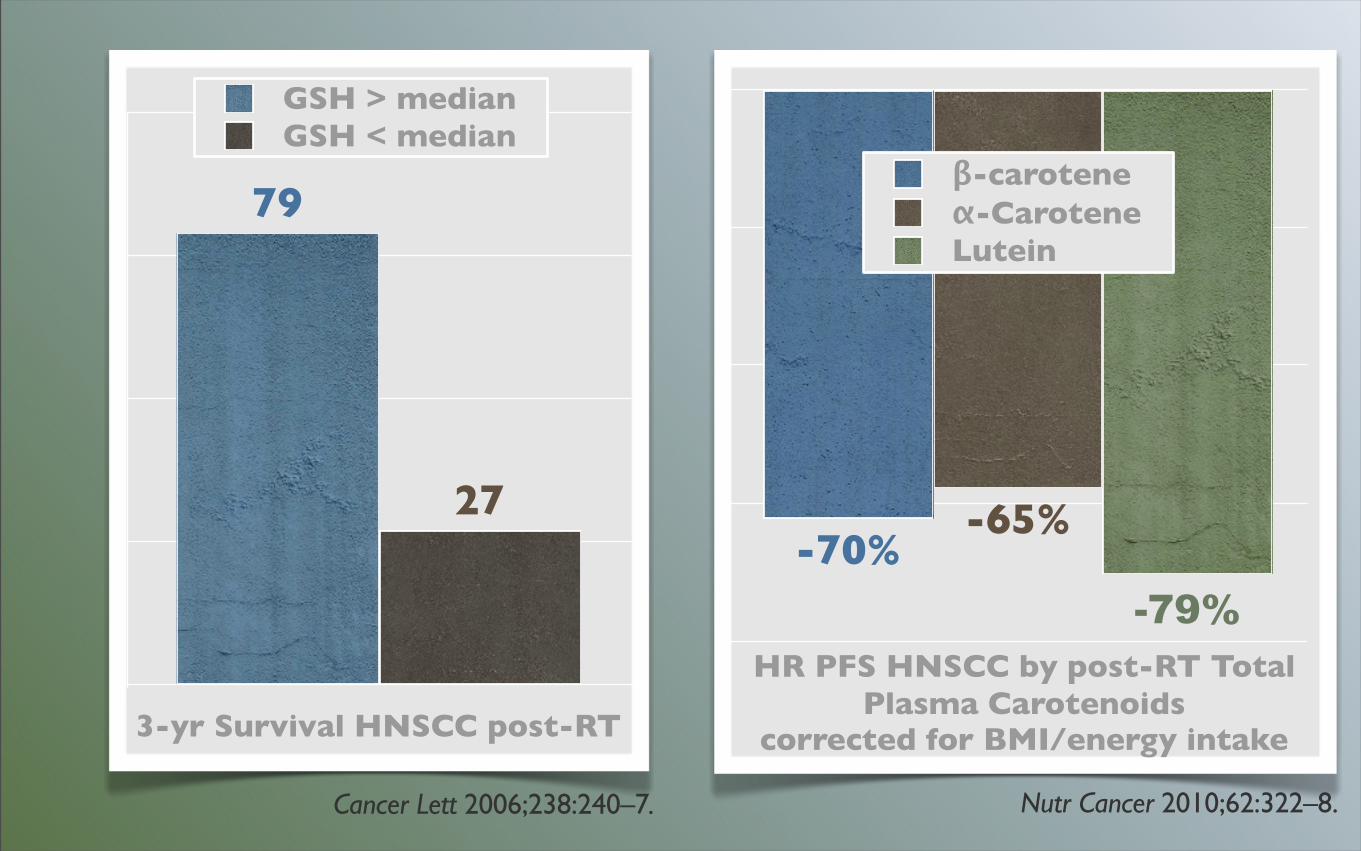
Cancer Lett 2006;238:240–7.
3-yr Survival HNSCC post-RT
27
79
GSH > medianGSH < median
-79%
-65%-70%
β-caroteneα-CaroteneLutein
Nutr Cancer 2010;62:322–8.
HR PFS HNSCC by post-RT Total Plasma Carotenoids
corrected for BMI/energy intake
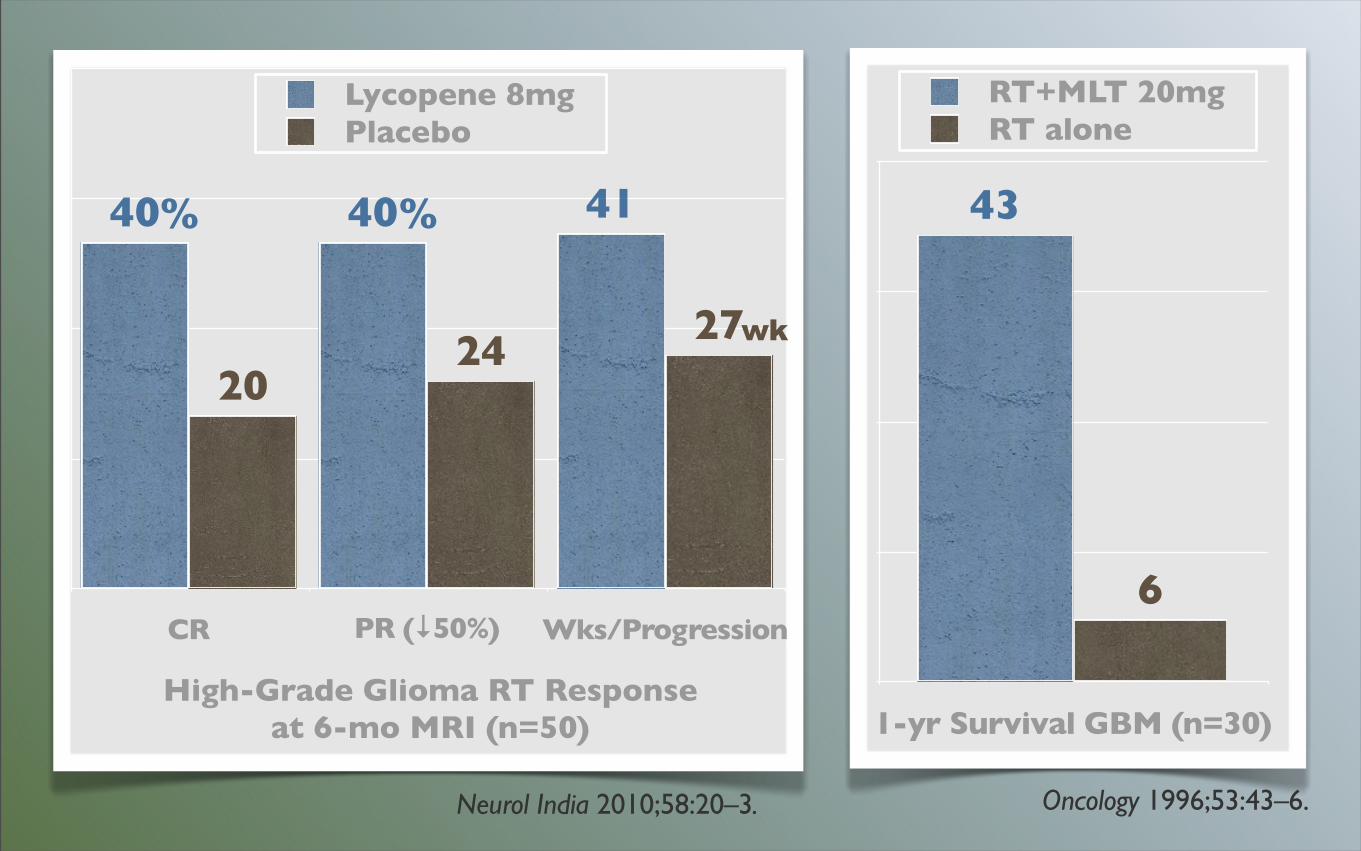
1-yr Survival GBM (n=30)
6
43
RT+MLT 20mgRT alone
Oncology 1996;53:43–6.
CR PR (↓50%) Wks/Progression
2724
20
414040
Lycopene 8mgPlacebo
High-Grade Glioma RT Response at 6-mo MRI (n=50)
Neurol India 2010;58:20–3.
%
wk
%
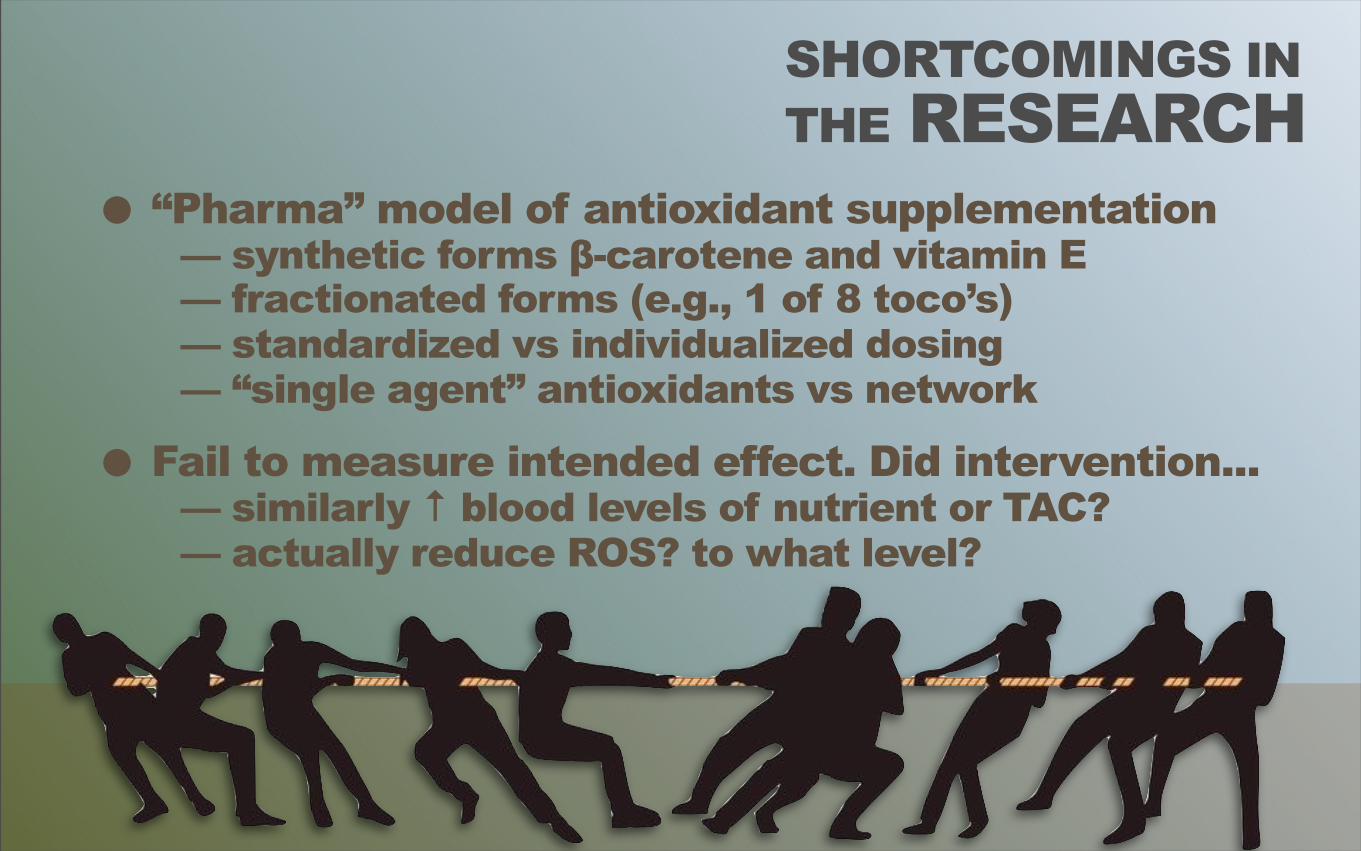
• “Pharma” model of antioxidant supplementation — synthetic forms β-carotene and vitamin E — fractionated forms (e.g., 1 of 8 toco’s) — standardized vs individualized dosing — “single agent” antioxidants vs network
• Fail to measure intended effect. Did intervention... — similarly ↑ blood levels of nutrient or TAC? — actually reduce ROS? to what level?
SHORTCOMINGS IN THE RESEARCH
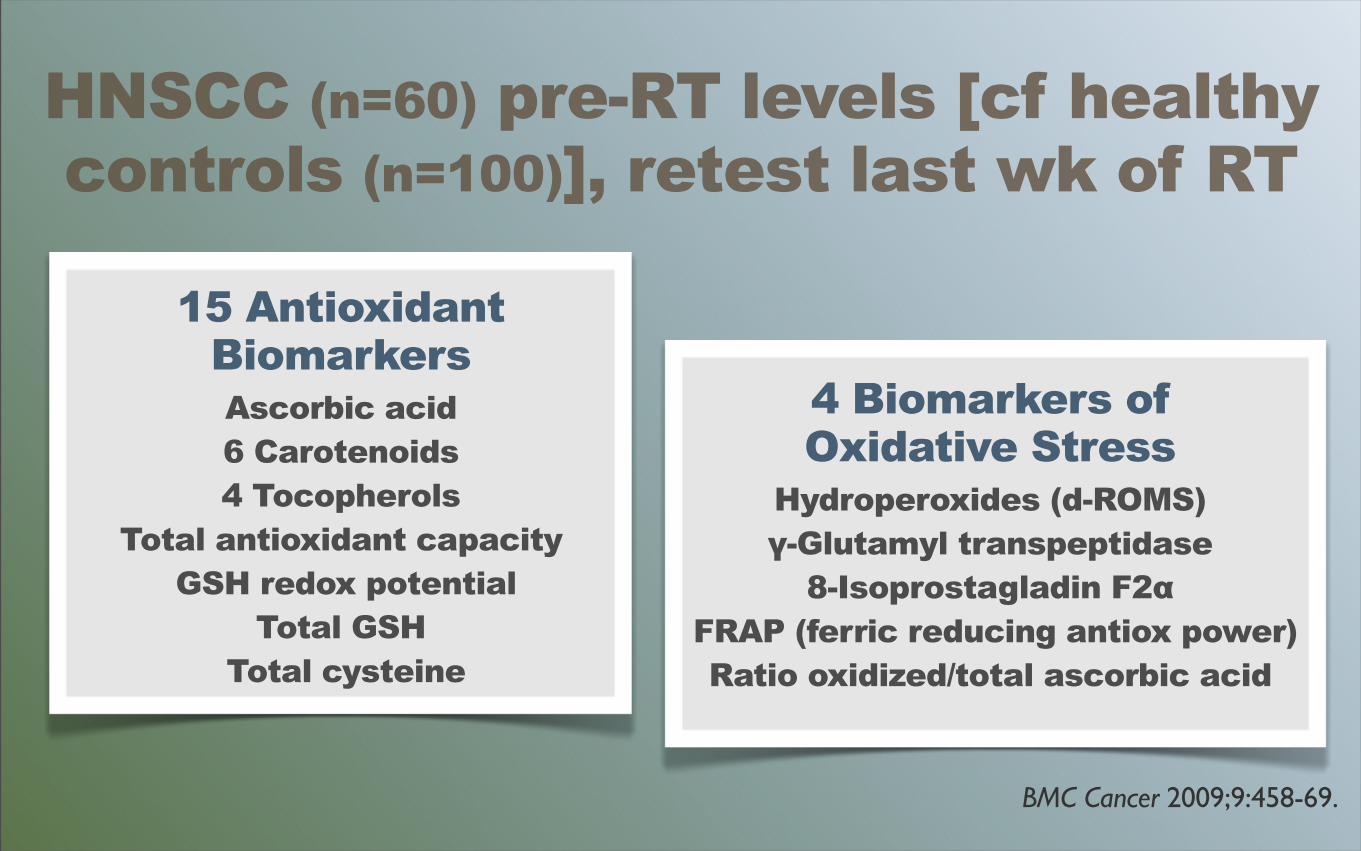
4 Biomarkers ofOxidative Stress
Hydroperoxides (d-ROMS) γ-Glutamyl transpeptidase
8-Isoprostagladin F2α FRAP (ferric reducing antiox power)
Ratio oxidized/total ascorbic acid
BMC Cancer 2009;9:458-69.
15 AntioxidantBiomarkersAscorbic acid 6 Carotenoids4 Tocopherols
Total antioxidant capacity GSH redox potential
Total GSH Total cysteine
HNSCC (n=60) pre-RT levels [cf healthy controls (n=100)], retest last wk of RT
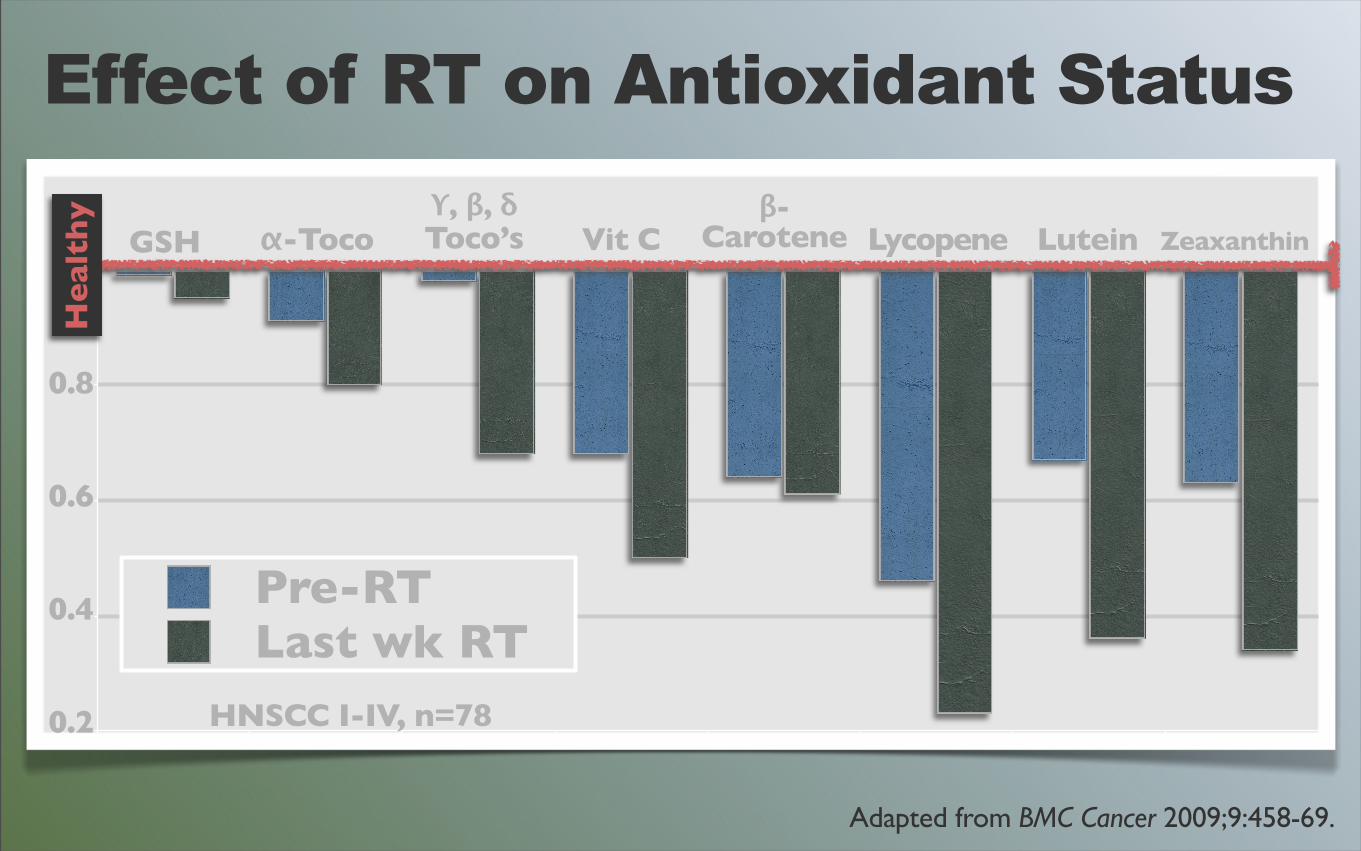
Adapted from BMC Cancer 2009;9:458-69.
0.8
0.6
0.4
0.2
Effect of RT on Antioxidant Status
GSH α-Tocoϒ, β, δToco’s Vit C
β-Carotene Lycopene Lutein Zeaxanthin
He
alth
y
Pre-RTLast wk RT
HNSCC I-IV, n=78
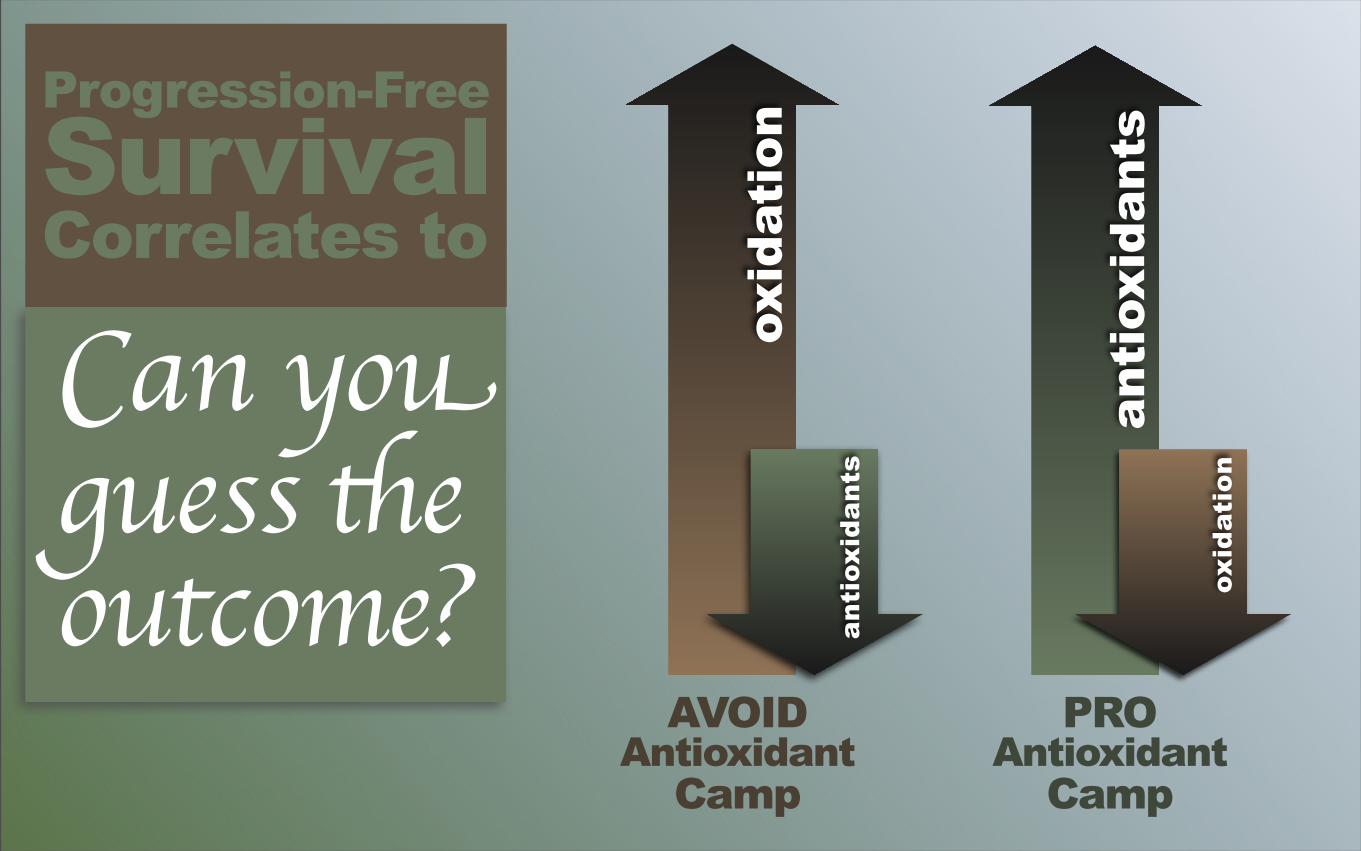
Can youguess the outcome?
Progression-FreeSurvival Correlates to
oxid
atio
nAVOID
AntioxidantCamp
anti
oxid
ants
anti
oxid
ants
PROAntioxidant
Camp
oxid
atio
n
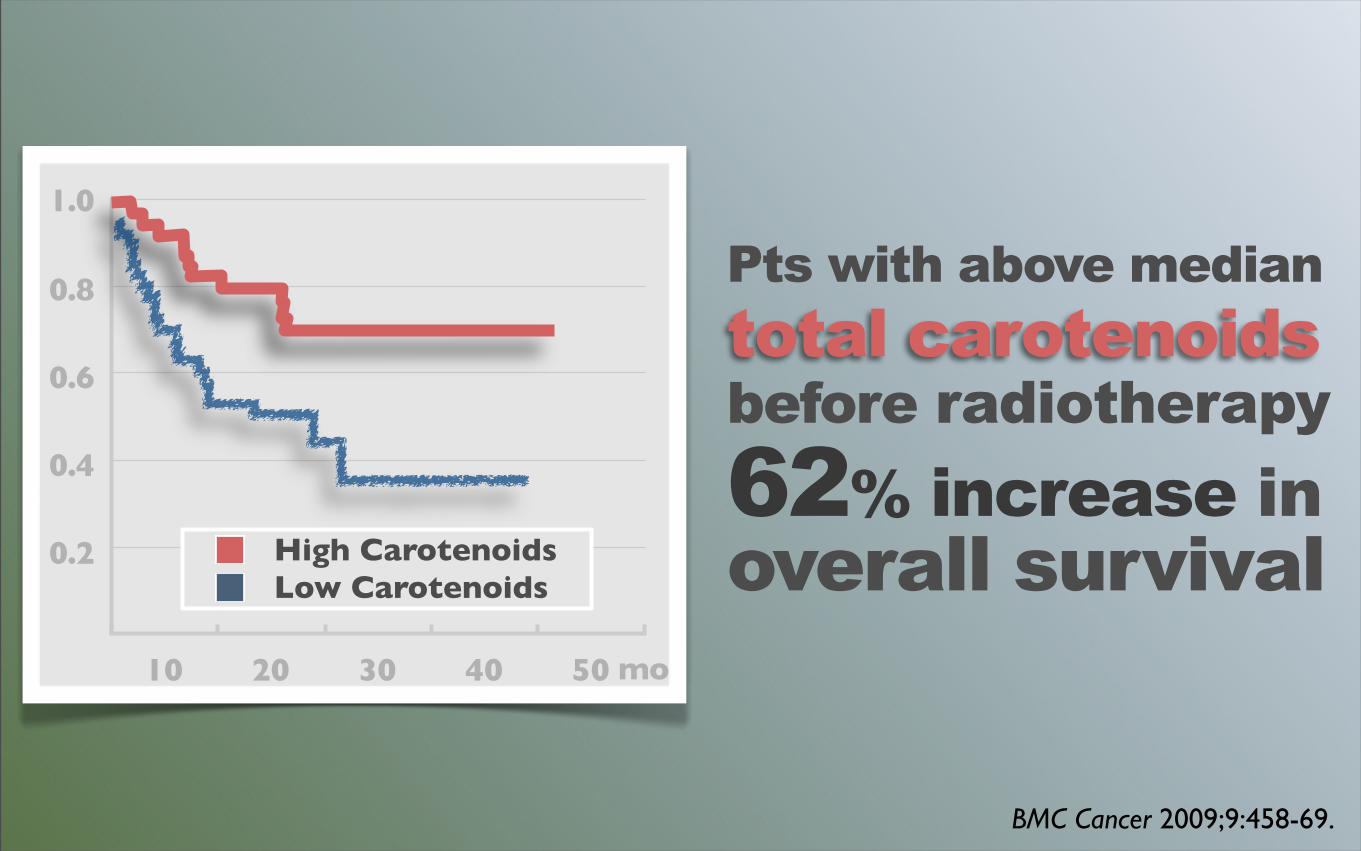
BMC Cancer 2009;9:458-69.
10 20 30 40 50
High CarotenoidsLow Carotenoids
mo
1.0
0.8
0.6
0.4
0.2
Pts with above mediantotal carotenoids before radiotherapy62% increase in overall survival
BMC Cancer 2009;9:458-69.
10 20 30 40 50
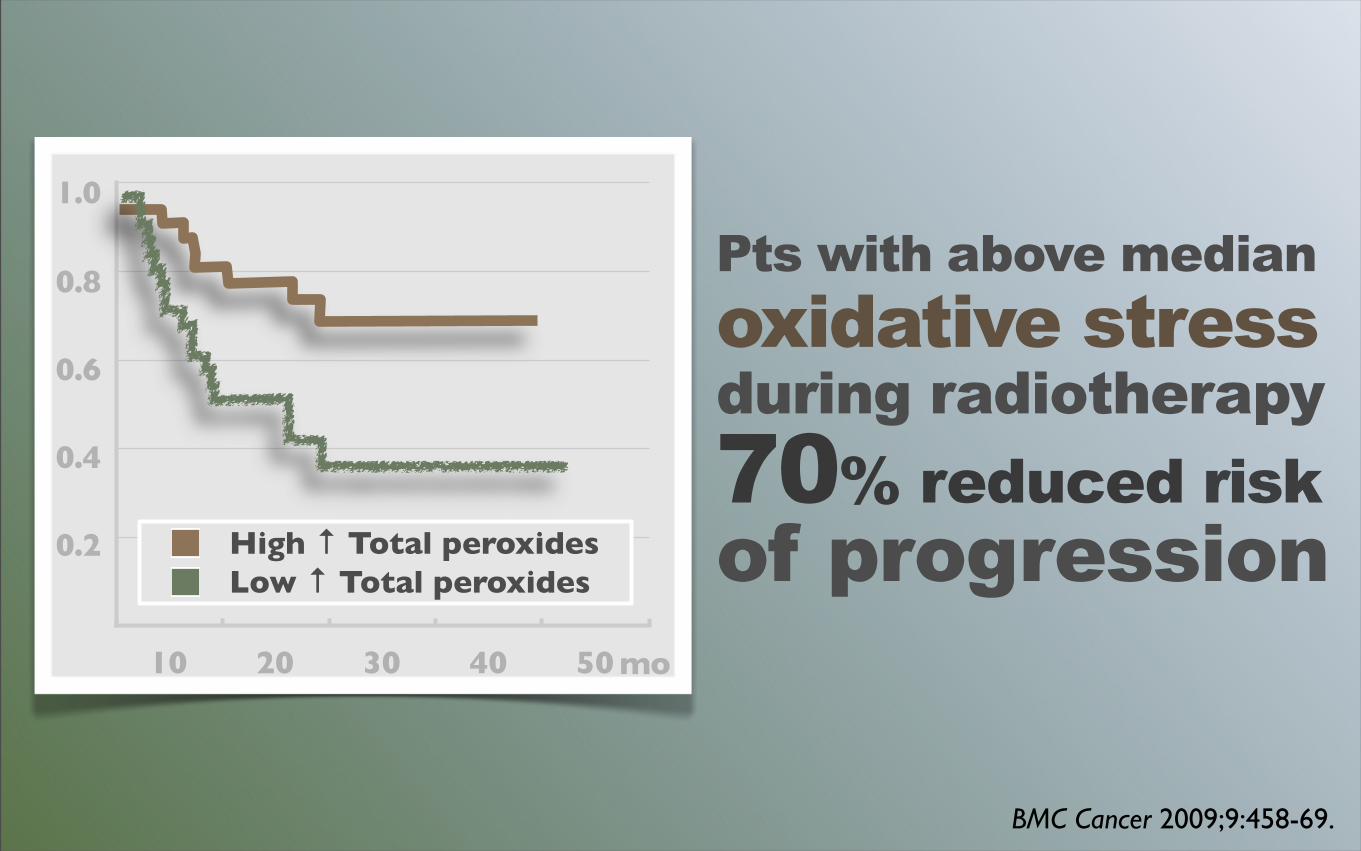
High ↑ Total peroxidesLow ↑ Total peroxides
mo
1.0
0.8
0.6
0.4
0.2
Pts with above medianoxidative stress during radiotherapy70% reduced riskof progression
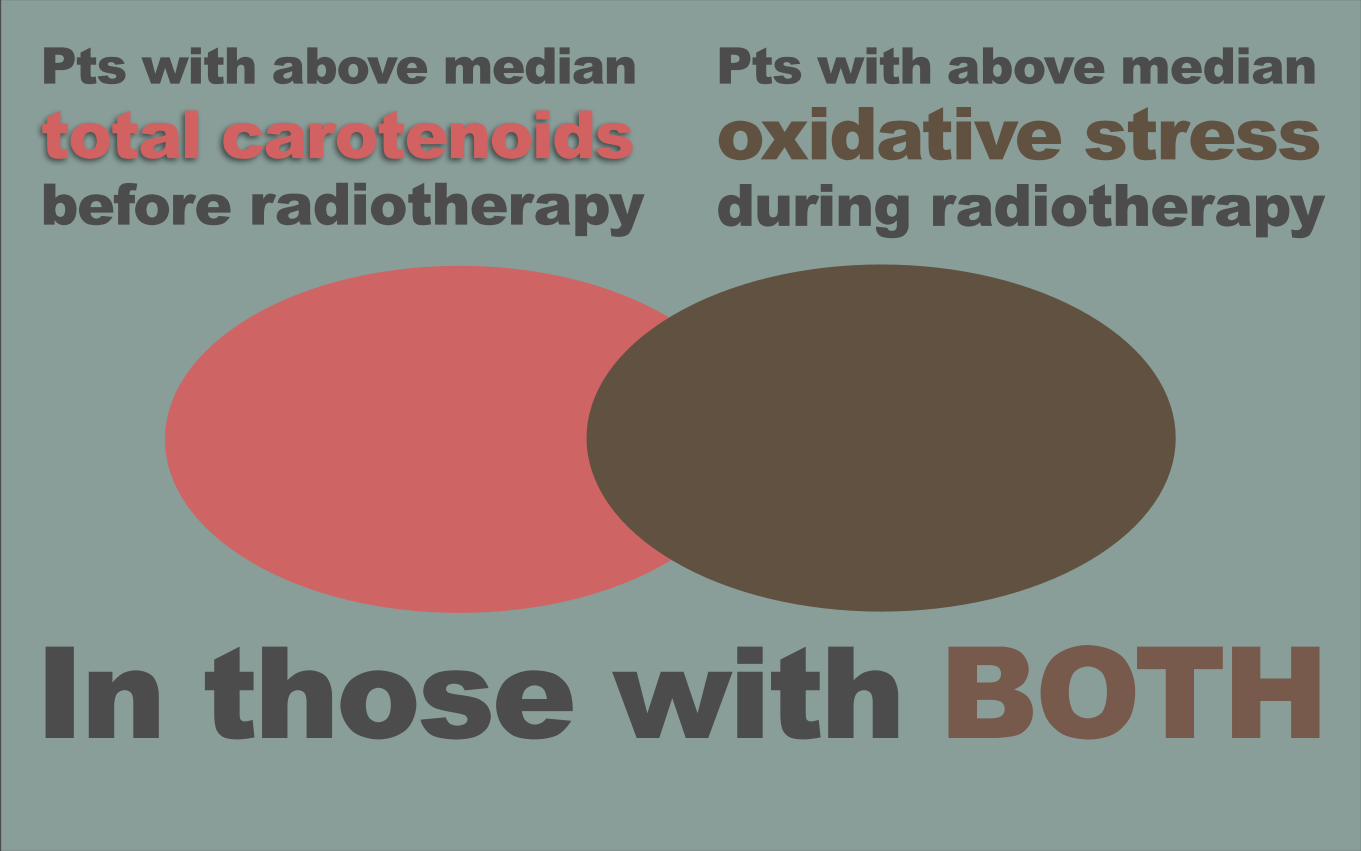
In those with BOTH
Pts with above medianoxidative stress during radiotherapy
Pts with above mediantotal carotenoids before radiotherapy
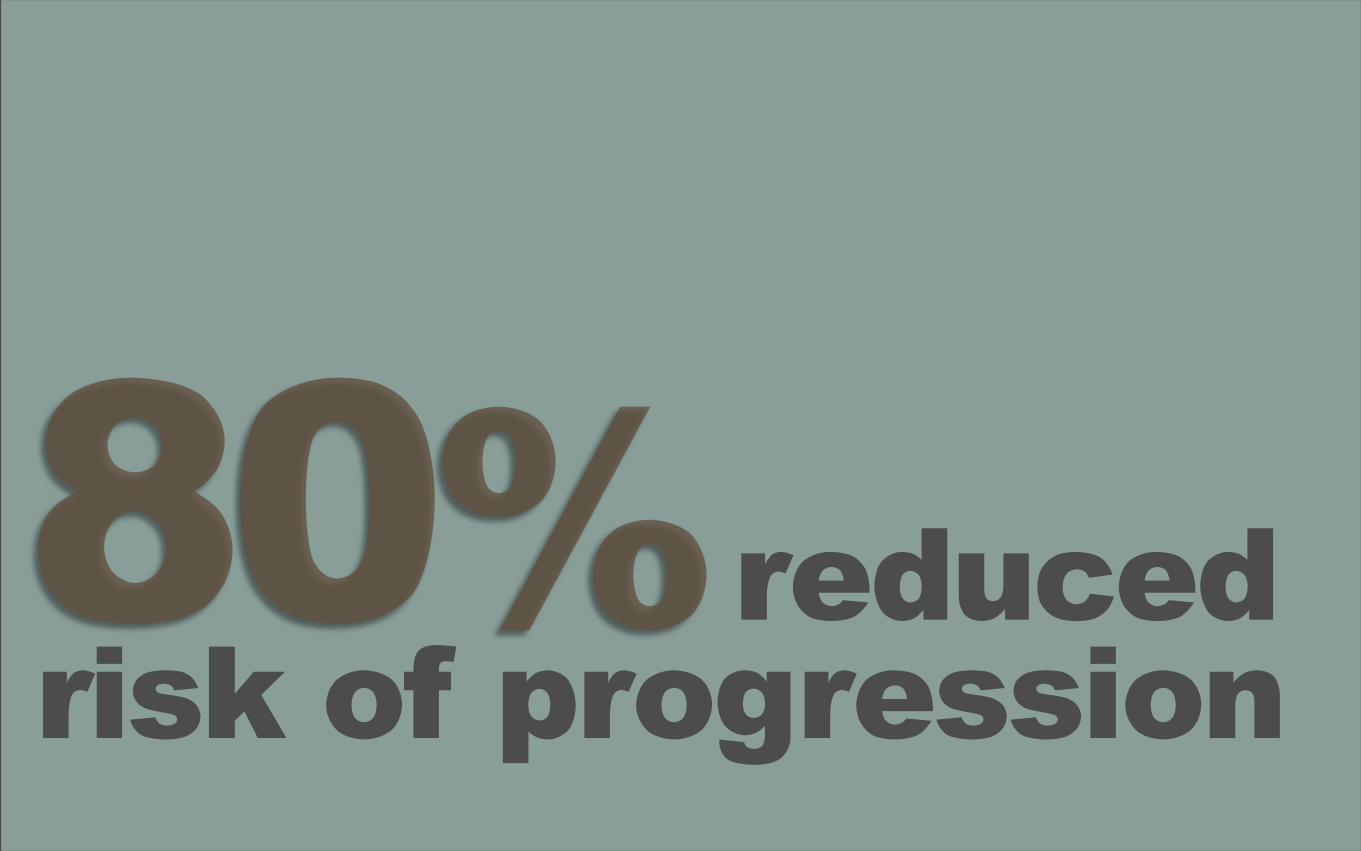
risk of progression80%reduced
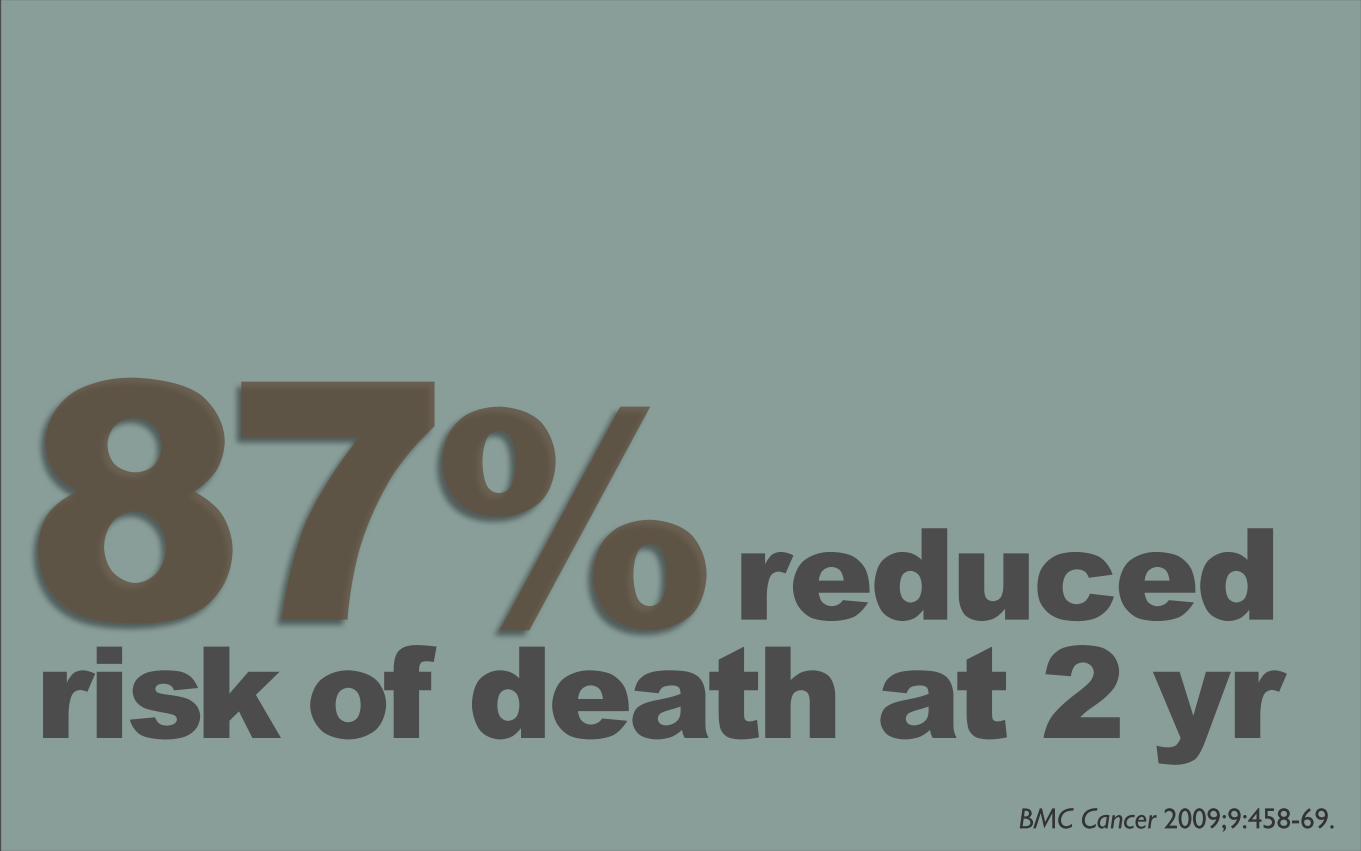
BMC Cancer 2009;9:458-69.
risk of death at 2 yr87%reduced

oxid
atio
n
ANTIAntioxidant
Camp
anti
oxid
ants
anti
oxid
ants
PROAntioxidant
Campox
idat
ion
NewUnderstanding
oxid
atio
n
anti
oxid
ants
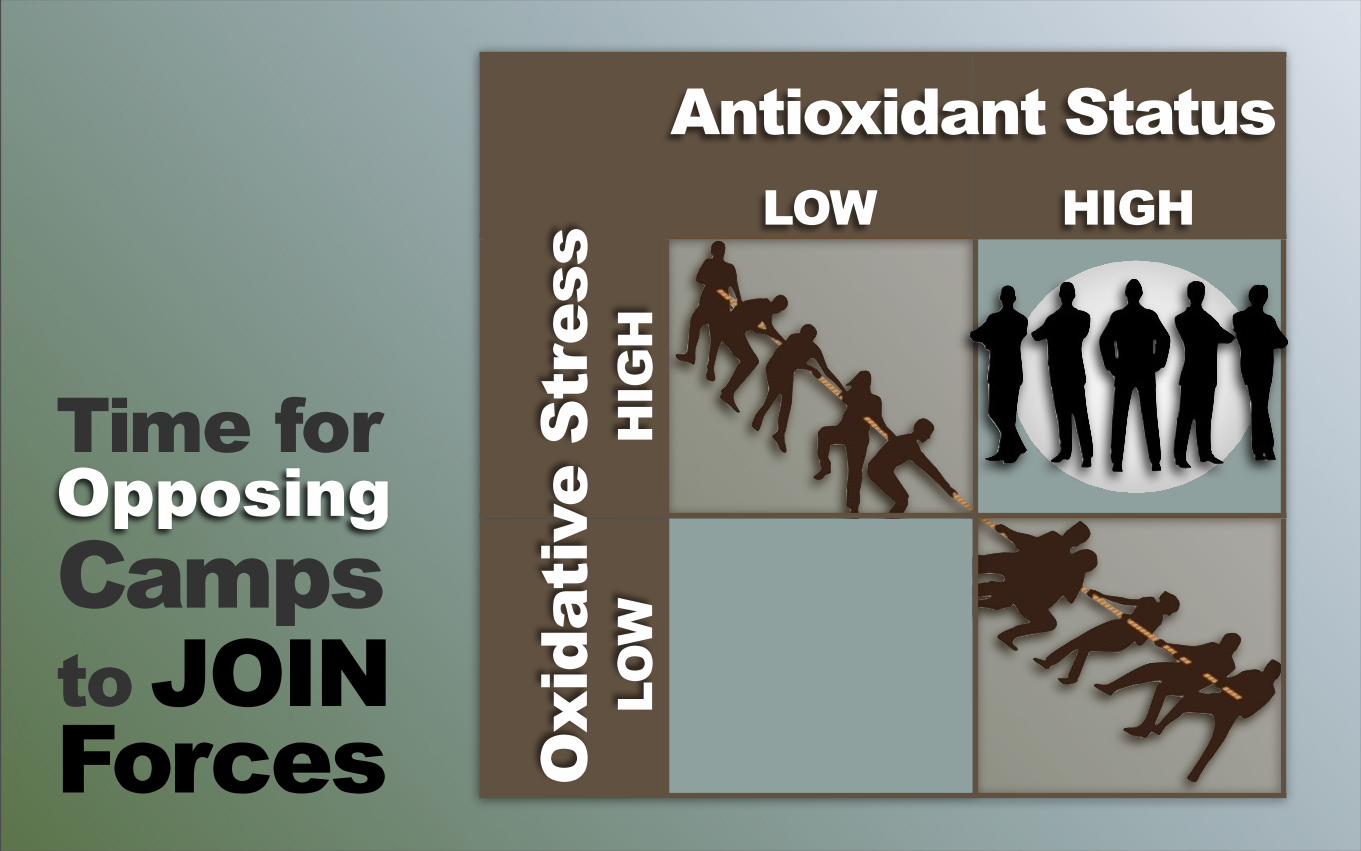
HIGH
Antioxidant Status
HIG
H
LOW
LOW
Oxi
dati
ve S
tres
s
Time forOpposingCampsto JOINForces
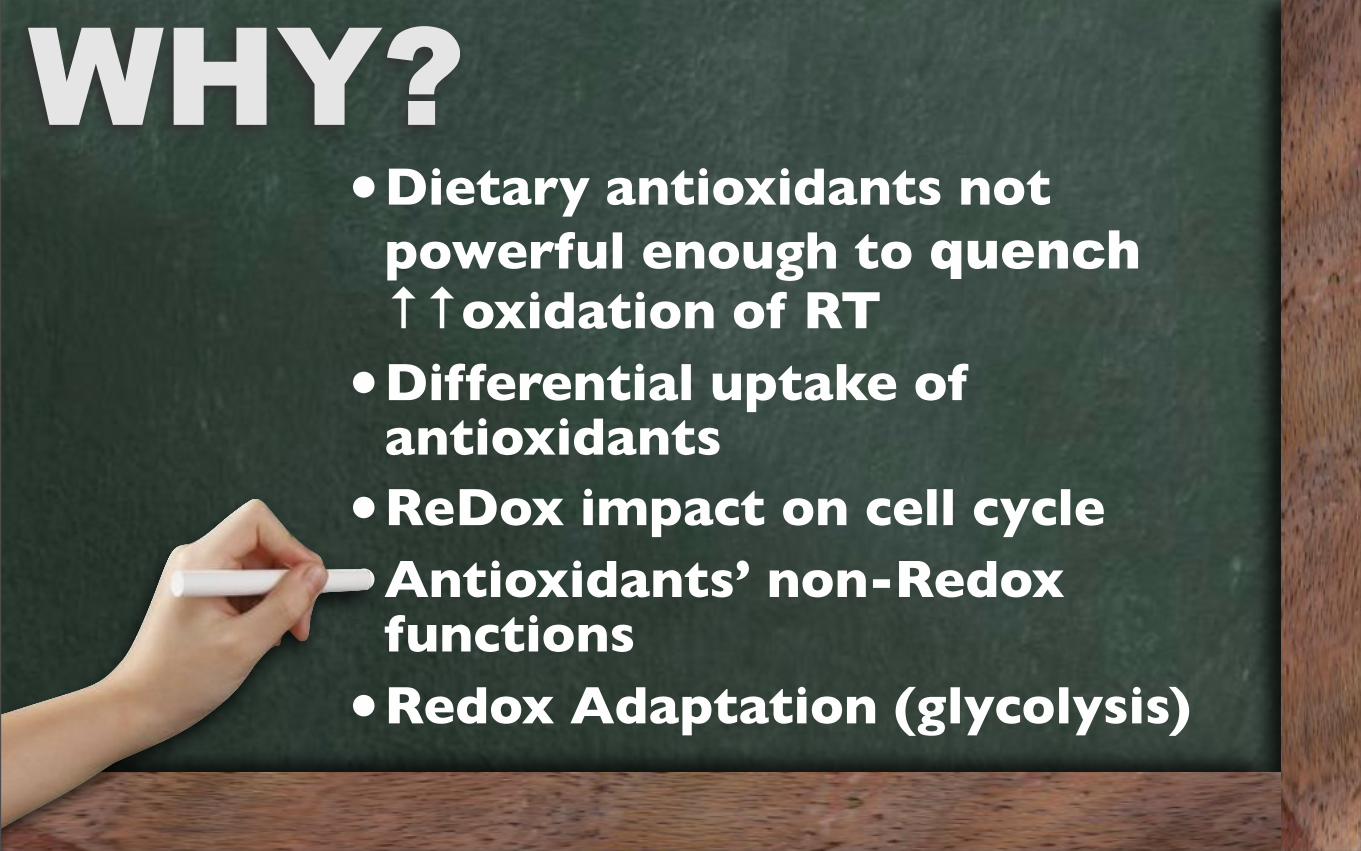
WHY?•Dietary antioxidants not
powerful enough to quench ↑↑oxidation of RT
•Differential uptake of antioxidants
•ReDox impact on cell cycle•Antioxidants’ non-Redox
functions•Redox Adaptation (glycolysis)
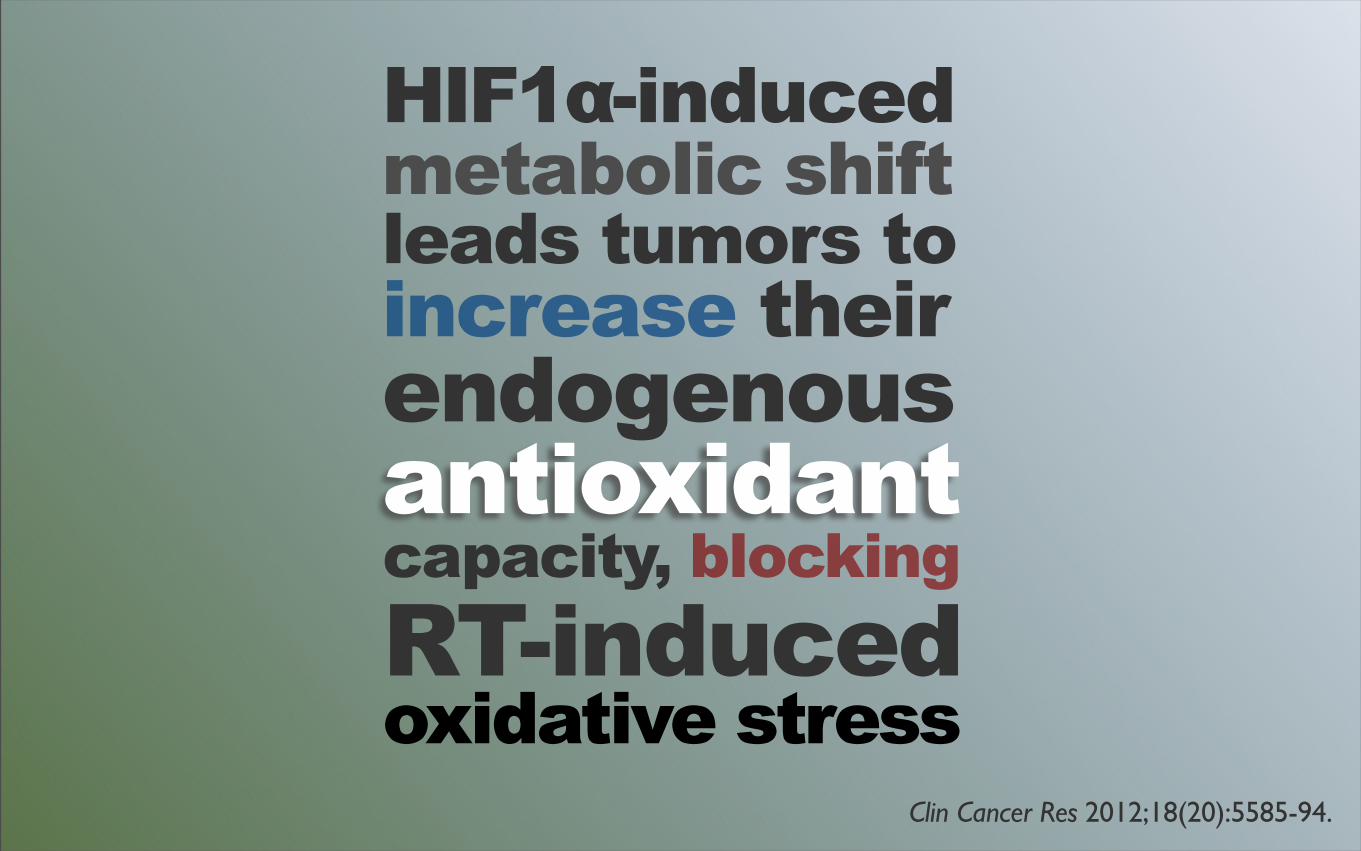
HIF1α-inducedmetabolic shiftleads tumors to increase theirendogenousantioxidantcapacity, blockingRT-inducedoxidative stress
Clin Cancer Res 2012;18(20):5585-94.
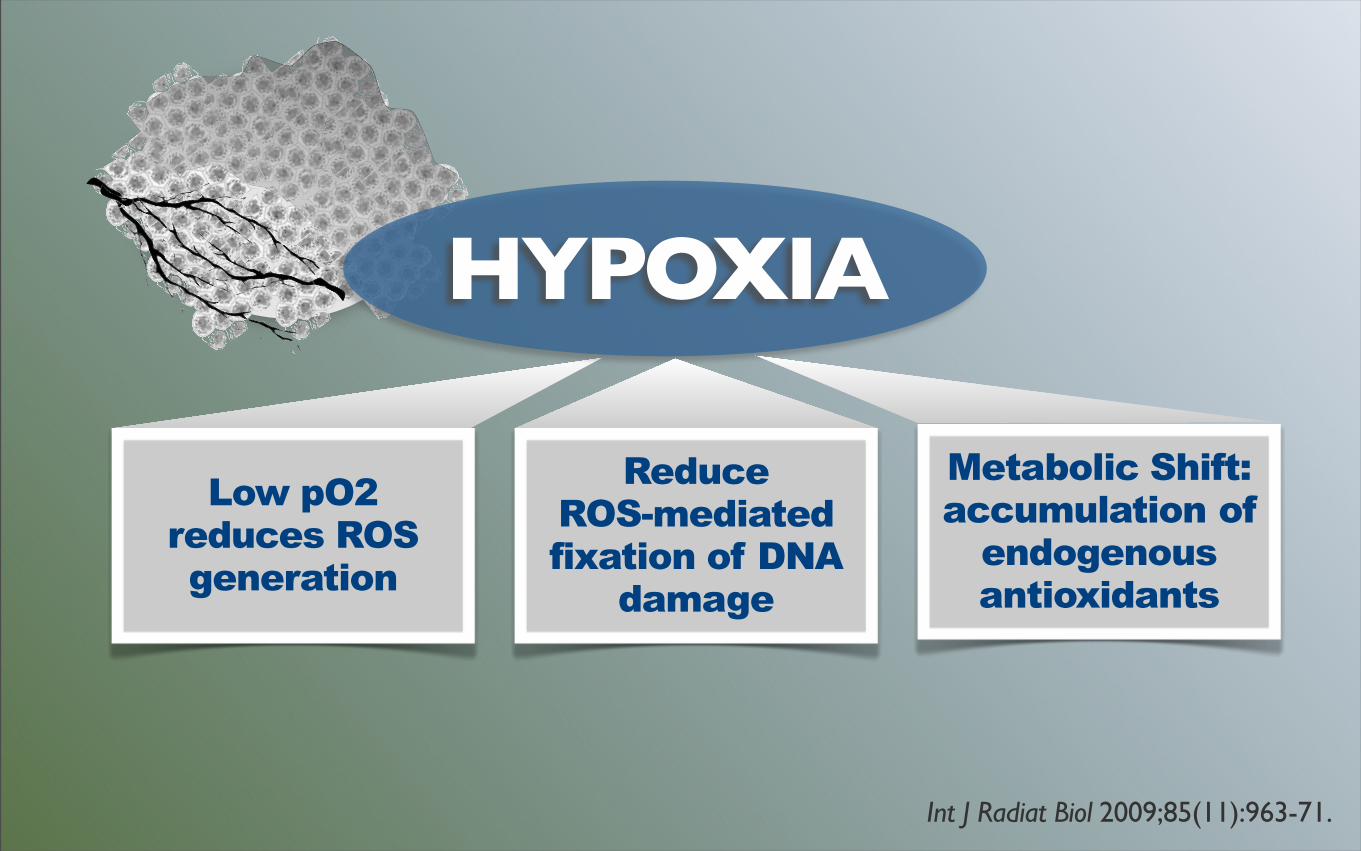
Low pO2reduces ROS generation
HYPOXIA
ReduceROS-mediatedfixation of DNA
damage
Metabolic Shift: accumulation of
endogenous antioxidants
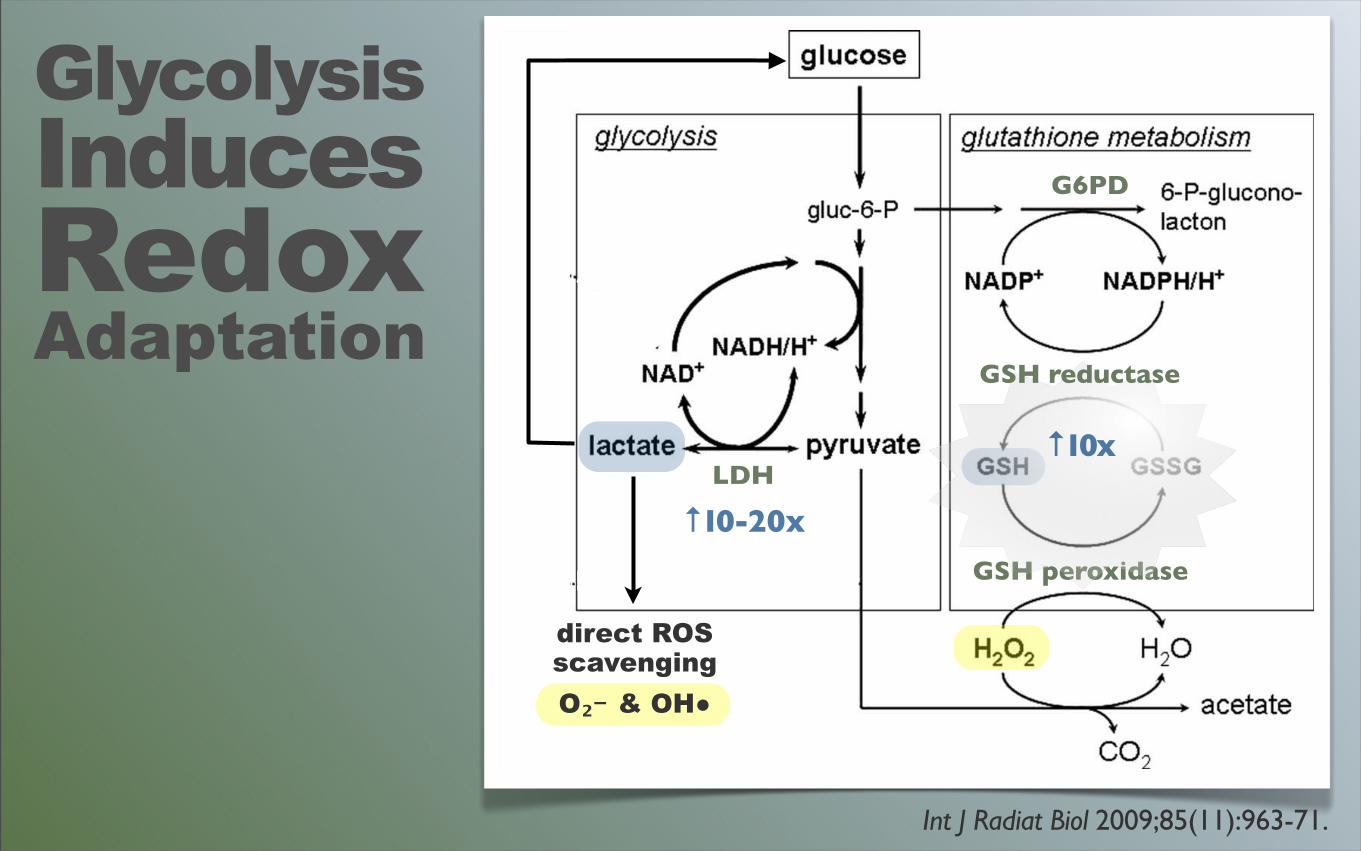
Int J Radiat Biol 2009;85(11):963-71.
Redox imaging with quantitativebioluminescence
The conclusion that more research on the redox stateof cancer cells would be desirable lead us to develop
a technique for the quantitative assessment of theredox metabolism of solid malignant tumours. Sincetumours often represent an irregular arrangement ofviable and necrotic cancer cell areas, normal stromaand host defense cells, an imaging method was
Figure 4. The relationship between respiration, glycolysis and glutathione metabolism in cancer cells. The differences in boldness of the
arrows are to indicate the more or less preferential pathways in transformed cells. (1) LDH; (2) pyruvate dehydrogenase; (3) glucose-6-
phosphate dehydrogenase; (4) GSH reductase; GSH peroxidase.
Figure 5. Representative array of serial cryosections through a snap-frozen hSCC xenografted in a nude mouse. The upper two sections were
stained with hematoxylin and eosine (H&E) or with anti-mouse antibodies (stromal tissue). This is followed by the lower four colour-coded
metabolite concentration distributions measured with induced bioluminescence with the colour-code given in mmol/g in the upper right-
hand part of the figure. The two holes (distance 2 mm) allow for the exact overlay of the sections; they are generated by driving two parallelchannels through the frozen tissue specimen perpendicular to the prospective sectioning plane. Such an overlay can be used for metabolic
analysis in selected tissue areas, such as viable tumour regions (upper part of the specimen) versus tumour-adjacent cutaneous and
subcutaneous tissue (lower part of the specimen). Furthermore, the overlay makes it possible to derive ratios of corresponding pixelconcentration values from different metabolites. Since the lactate/pyruvate (L/P) ratio is considered a measure of the cellular redox state, the
generation of L/P maps can be used for quantitative redox imaging in solid tumours.
968 U. G. A. Sattler & W. Mueller-Klieser
Downloaded By: [Mueller-Klieser, W.] At: 08:13 4 November 2009
GlycolysisInducesRedoxAdaptation
LDH
G6PD
GSH peroxidase
Int J Radiat Biol 2009;85(11):963-71.
↑10-20x
direct ROSscavengingO₂﹣& OH●
↑10x
GSH reductase
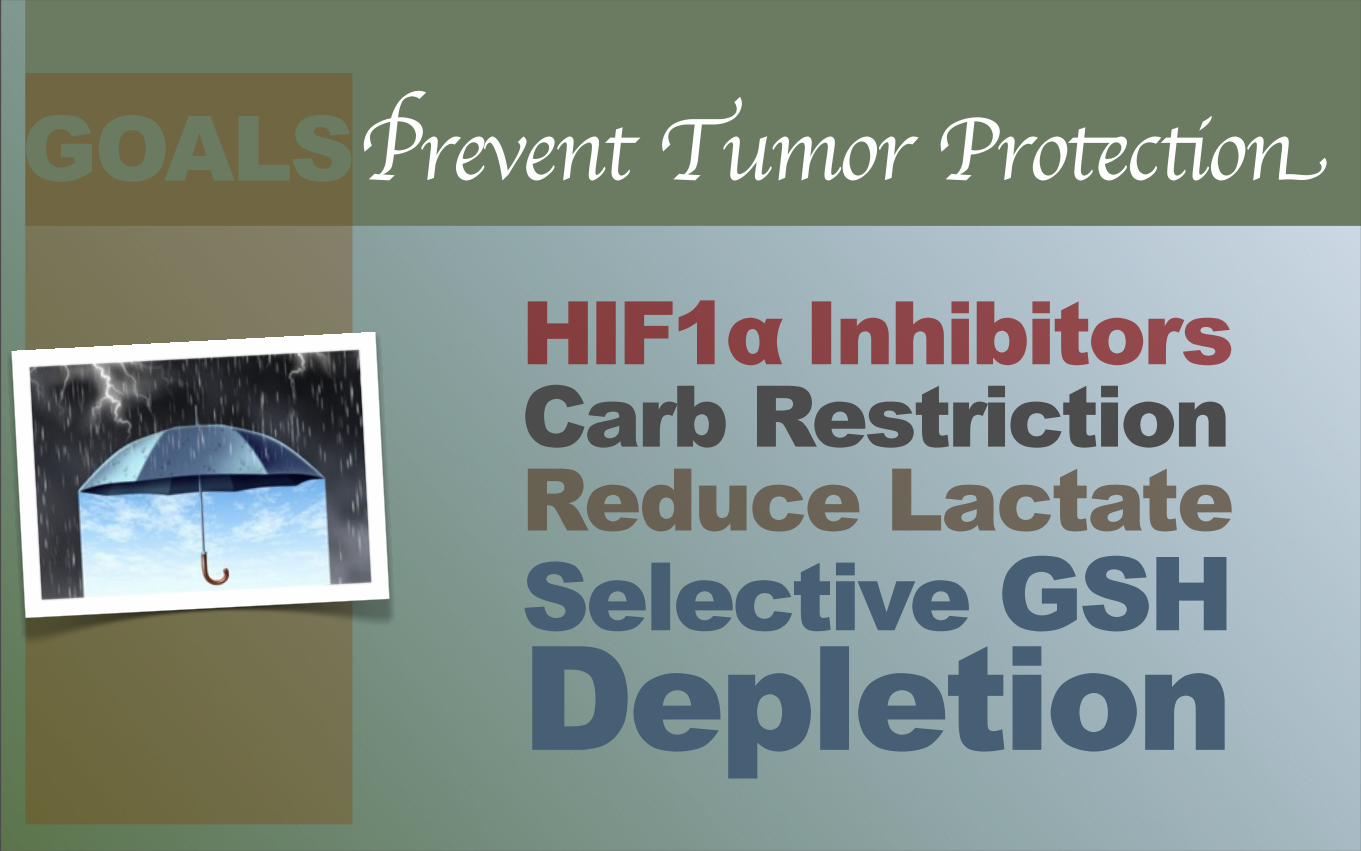
GOALSPrevent Tumor Protection
Carb Restriction
Selective GSHDepletion
HIF1α Inhibitors
Reduce Lactate
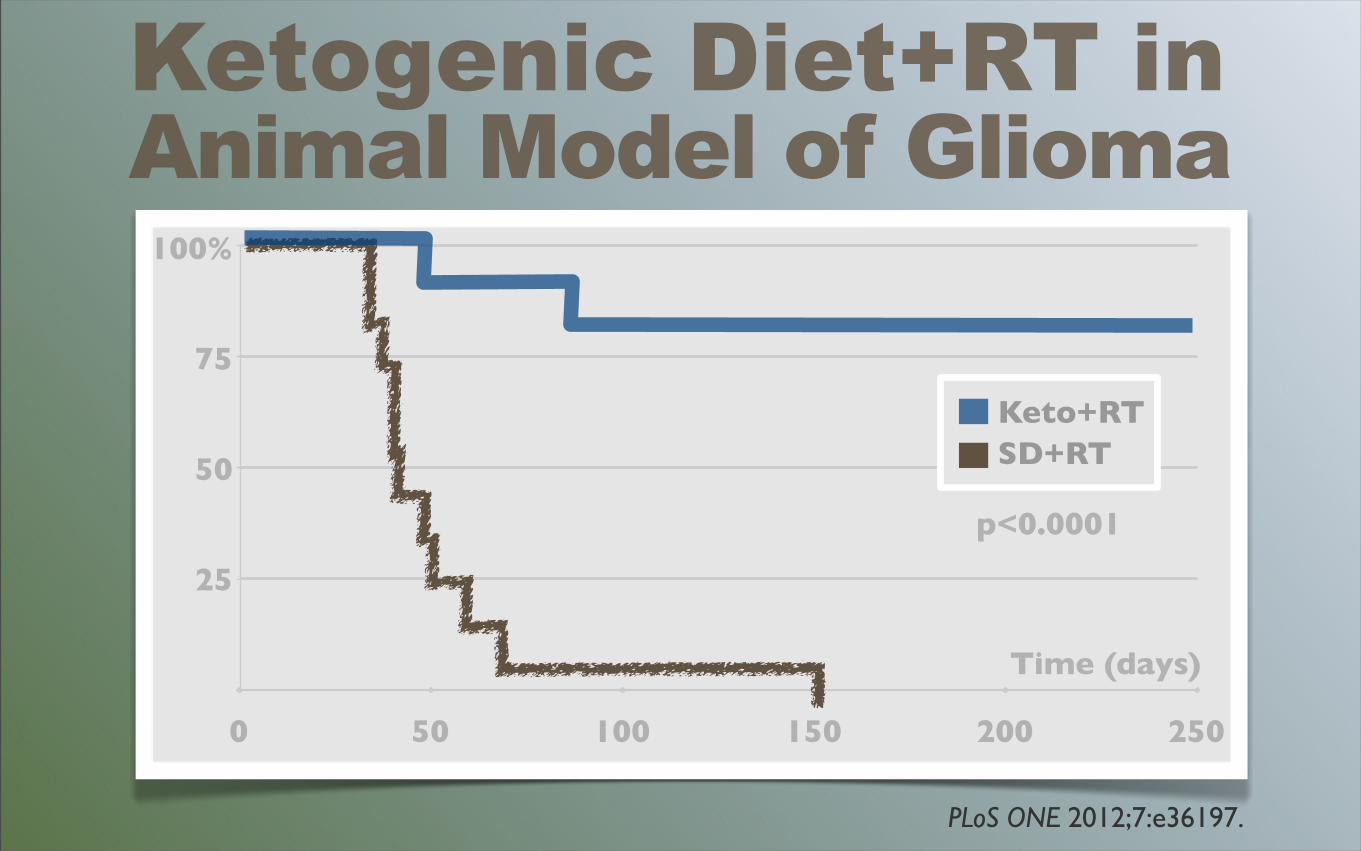
Ketogenic Diet+RT in Animal Model of Glioma
PLoS ONE 2012;7:e36197.
0 50 100 150 200 250
Keto+RT SD+RT
p<0.0001
100%
75
50
25
Time (days)
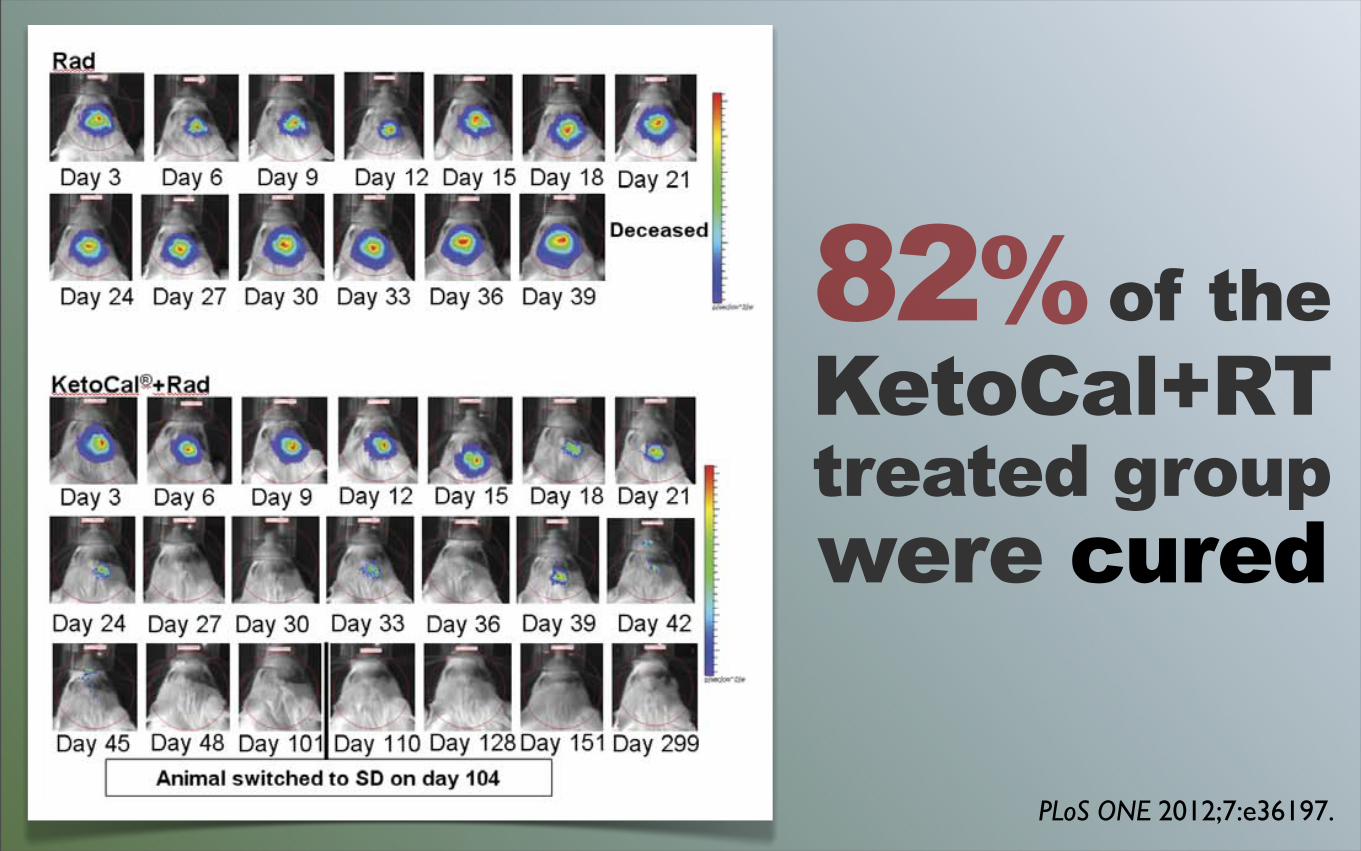
apparently cured of their implanted tumor (Figure 1B). The in vivoimaging data from one representative animal treated withradiation alone and one treated with radiation and KC is shownin Figure 2. After an initial period of slower growth (Figure 2B,inset), there was rapid tumor growth in the animals fed SD andtreated with radiation until the animal succumbed to the tumor(Figure 2A, B) with a final photon count of 6.9956109 p/sec/cm2/sr on day 39 following tumor implantation. In the animaltreated with radiation and KC the presence of growing tumor canbe seen for the first 1.5–2 weeks following implantation, reaching amaximum bioluminescent signal of 1.2586107 p/sec/cm2/sr onday 9 following tumor implantation. This was followed by a nearexponential decline that approaches background levels 60 daysfollowing implantation. Bioluminescence remained undetectableand on day 104 post-implantation the 9 surviving animals treatedwith radiation and KC were switched from KC to the standardrodent chow. There was no detectable recurrence of tumor asdemonstrated by the continued absence of detectable biolumines-cent signal. The animals were sacrificed on day 299. Histologicalevidence upon necropsy using hematoxylin and eosin (H&E)staining of brain tissue from the apparently cured KC plusradiation animals showed no evidence of tumor cells in or near thearea of implantation (data not shown).Survival data from SD alone, KC alone, SD+radiation, and
KC+radiation were examined for interaction effects using CoxProportional Hazards. The p-value for radiation and KC isp = 1.03610211 vs. SD. The implication being that there is aprofound enhancing (by mean survival) effect of radiation with KCvs. SD alone. There is also an enhancing effect of radiation withSD (p= 8.3861022) but the effect is many orders of magnitudeless. Thus, we propose that a more than additive and highly
positive survival effect is seen through the KC diet and adjuvantradiation therapy.
Animals Fed KetoCalH Exhibit Elevated bHB levelsAnimals fed KC had a statistically significant increase in blood
bHB levels (Figure 3A) both 6 and 13 days post-implantation. Thegreatest increase in bHB levels was seen in animals given adjuvantradiation therapy. However, increased bHB levels did notcorrelate with a decrease in blood glucose levels. Glucose levelswere significantly lower in the KC and KC plus radiation groupson day 6 (p,0.0001) than SD and SD plus radiation; and only inthe KC group on day 13 (p,0.001) when compared to SD.KC diet itself had very little effect on the animal’s body weight,
indicating that the diet itself was tolerable. Body weight remainedvery close to the starting weight in animals that were changed toKC three days following implantation. Eighteen days followingimplantation, body weights for SD and KC fed animals start todecline slowly as symptoms began to present (Figure 4A). Weightloss just prior to death is a function of the onset of symptoms dueto tumor burden and not KC treatment.Animals fed KC and treated with radiation saw a noticeable dip
in weights 3–6 days following treatment (Figure 4B), indicatingthat combination therapy had an effect on body weight. Theseanimals rapidly gained their weight back and there was nodifference between the 2 groups by day 15. This treatment groupalso had a slightly higher level of blood BHB and a slightly lowerlevel of blood glucose on day 6 compared to day 13. While wecannot rule out the possibility that the transient drop in weight andslightly lower glucose on day 6 contributed to the survival benefitseen when radiation and KC were combined, it is unlikely that thisplayed a major role since tumor shrinkage continued well after the
Figure 2. KetoCalH plus radiation treated animals experienced a loss of bioluminescence. (A) Radiation and KetoCalH plus radiationanimal imaged every three days. Color scheme represents signal intensity with red representing the highest intensity photon count. (B) (C)Bioluminescent signal plotted as in vivo photon count versus days post-implantation.doi:10.1371/journal.pone.0036197.g002
Ketogenic Diet as an Adjuvant to Radiation Therapy
PLoS ONE | www.plosone.org 3 May 2012 | Volume 7 | Issue 5 | e36197
82% of theKetoCal+RT treated groupwere cured
PLoS ONE 2012;7:e36197.
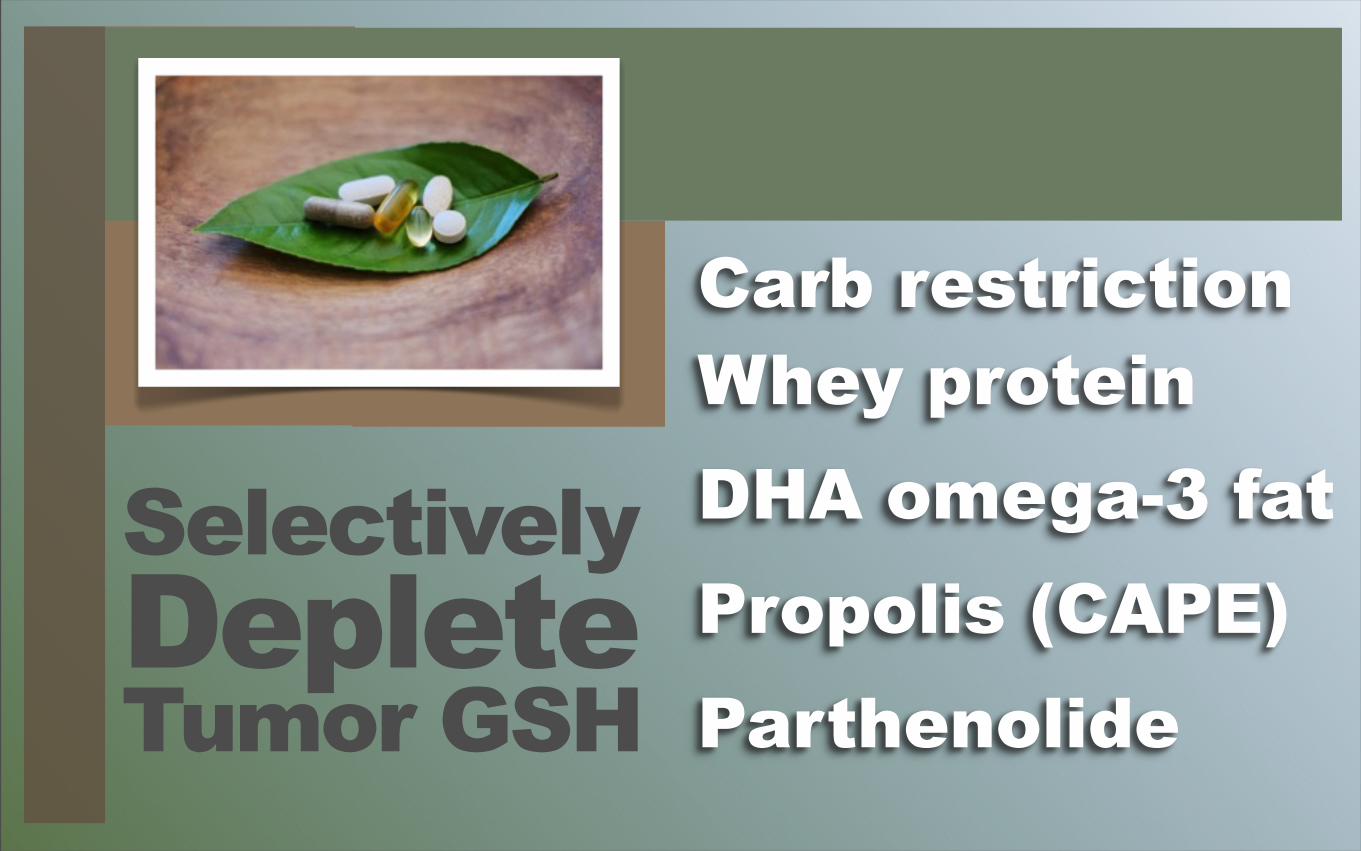
SelectivelyDepleteTumor GSH
Carb restriction Whey proteinDHA omega-3 fatPropolis (CAPE) Parthenolide
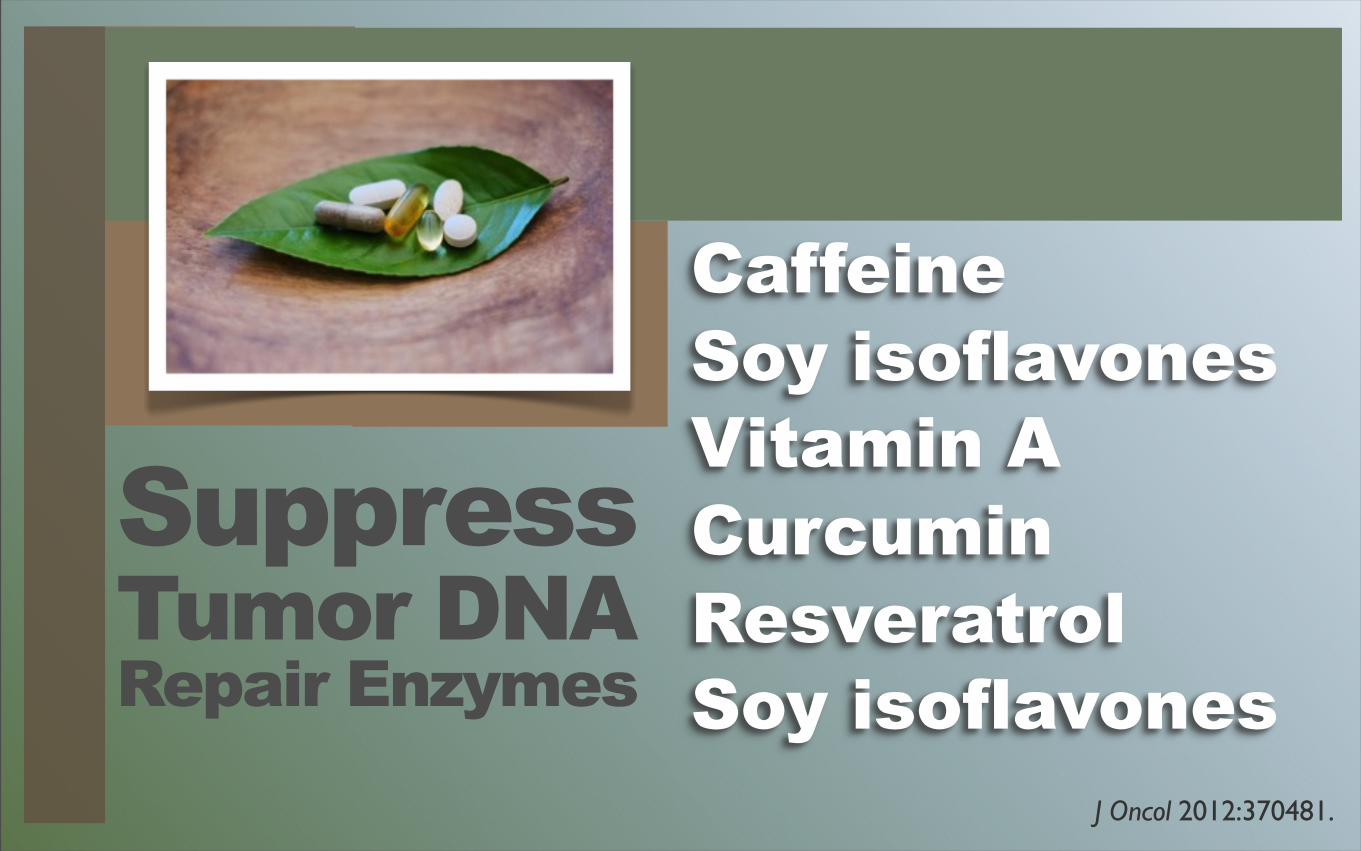
SuppressTumor DNARepair Enzymes
CaffeineSoy isoflavonesVitamin ACurcuminResveratrolSoy isoflavones
J Oncol 2012:370481.
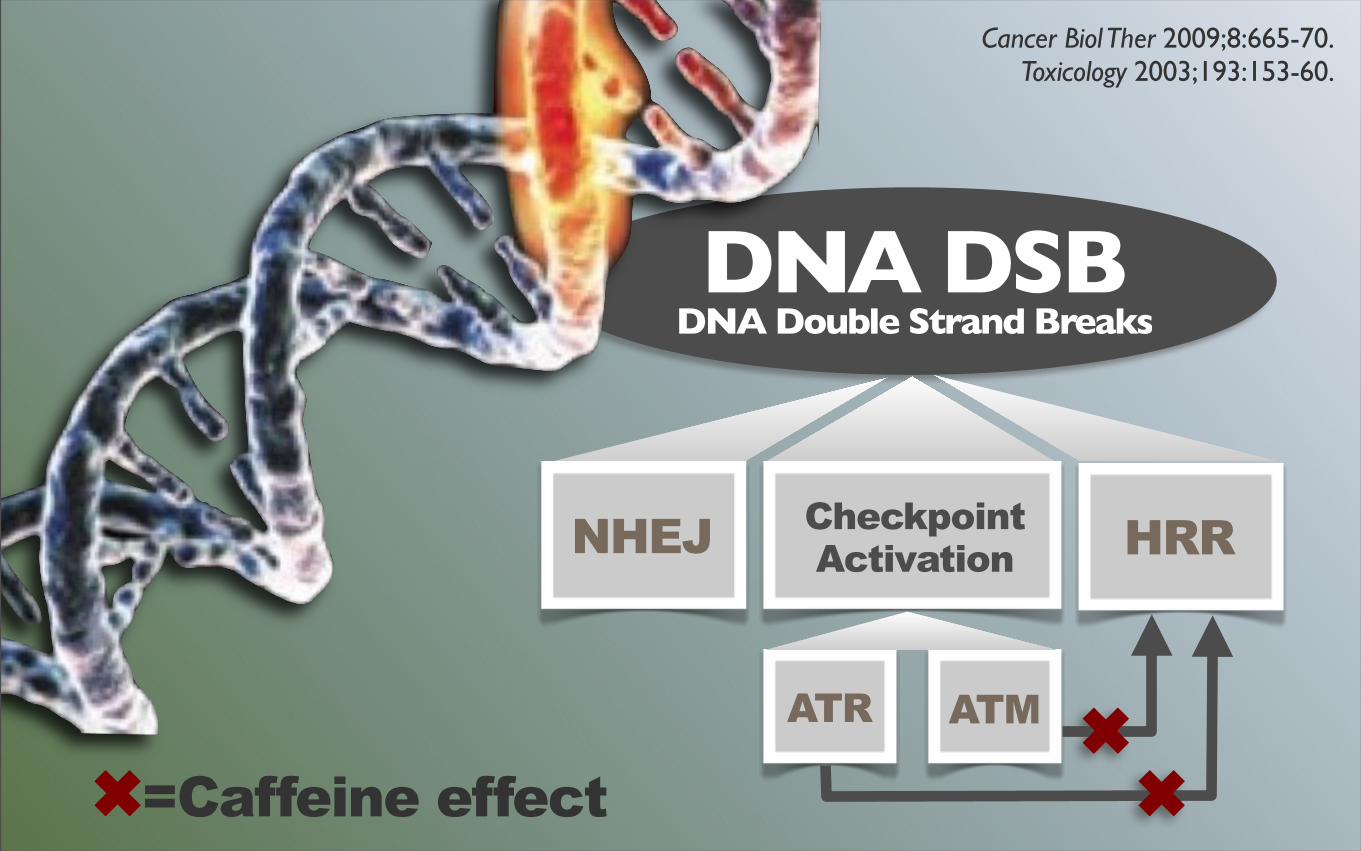
DNA DSBDNA Double Strand Breaks
ATR ATM
CheckpointActivation HRRNHEJ
✖✖✖=Caffeine effect
Cancer Biol Ther 2009;8:665-70. Toxicology 2003;193:153-60.
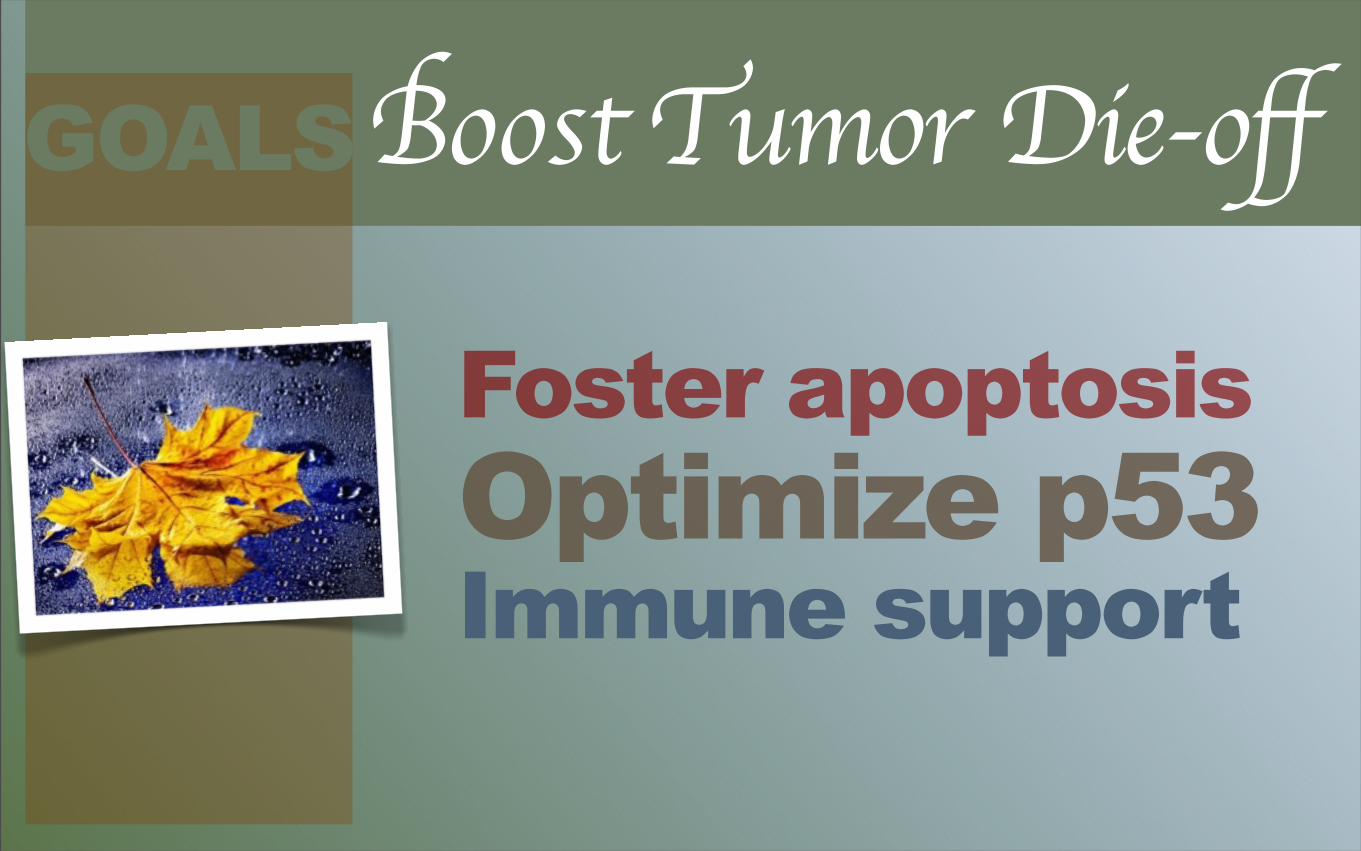
GOALSBoost Tumor Die-off
Optimize p53Foster apoptosis
Immune support
Cell Cycle 2012 Dec 1;11(23):4436-46.
Carb restrictedbut calorie adequatediet depletes mutated p53but not wild type p53
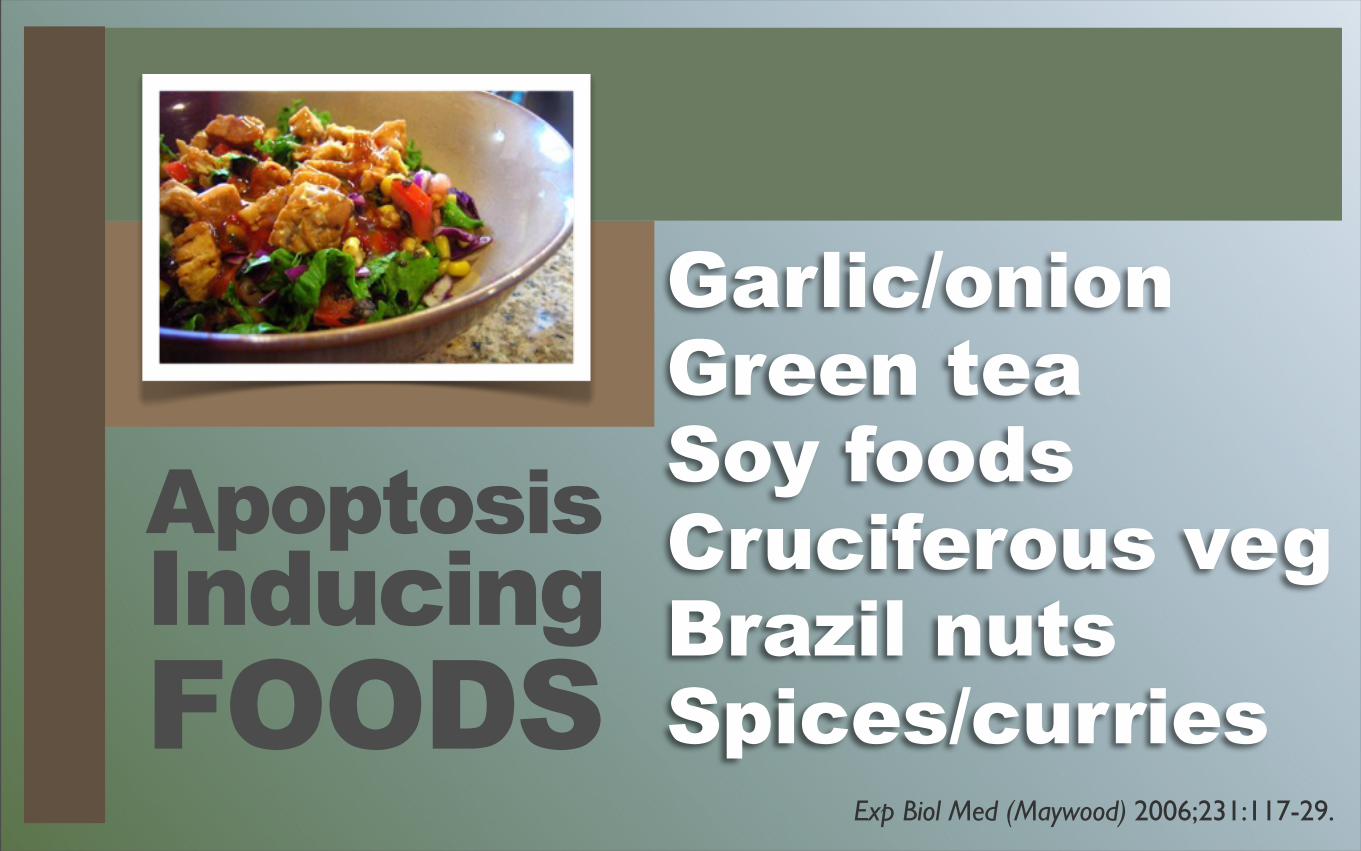
Garlic/onionGreen teaSoy foodsCruciferous vegBrazil nutsSpices/curries
ApoptosisInducingFOODS
Exp Biol Med (Maywood) 2006;231:117-29.
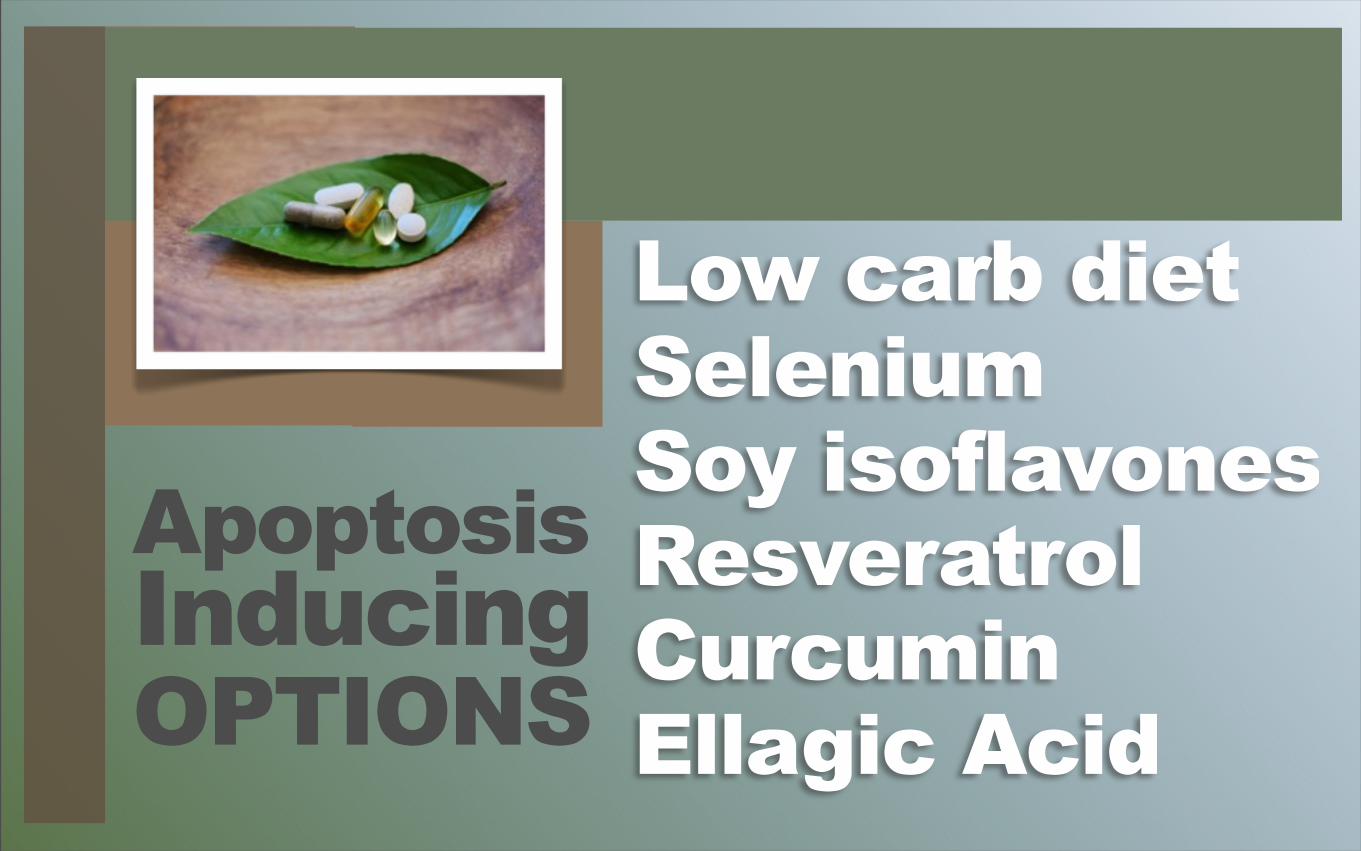
ApoptosisInducingOPTIONS
Low carb diet SeleniumSoy isoflavonesResveratrolCurcuminEllagic Acid
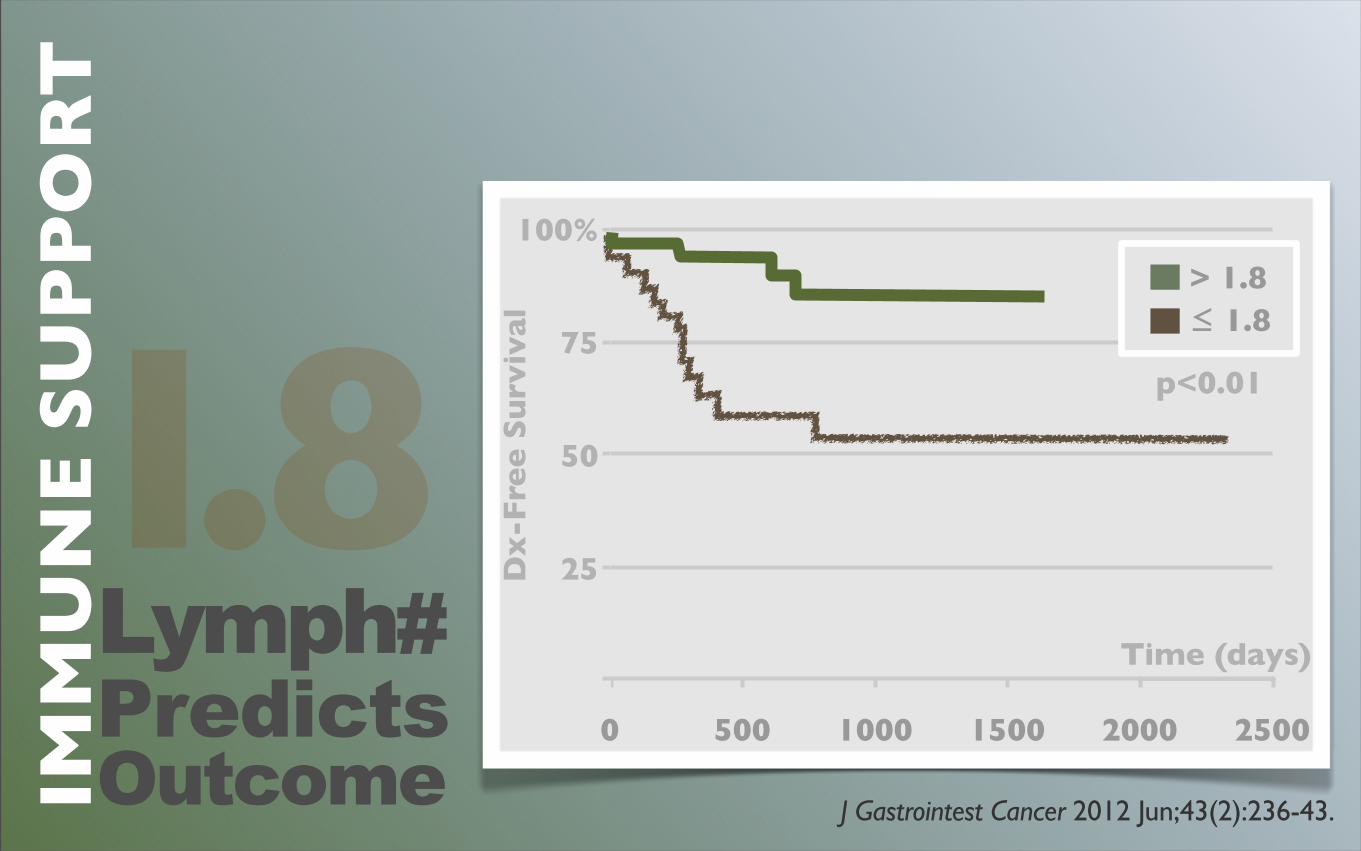
J Gastrointest Cancer 2012 Jun;43(2):236-43.
Lymphocyte-mediatedimmune responseis important for suppression of recurrence
IMM
UN
E S
UP
PO
RT
J Gastrointest Cancer 2012 Jun;43(2):236-43.
0 500 1000 1500 2000 2500
> 1.8 ≤ 1.8
100%
75
50
25
Time (days)
Dx
-Fre
e S
urv
ival
p<0.01
Lymph#PredictsOutcome
1.8
IMM
UN
E S
UP
PO
RT
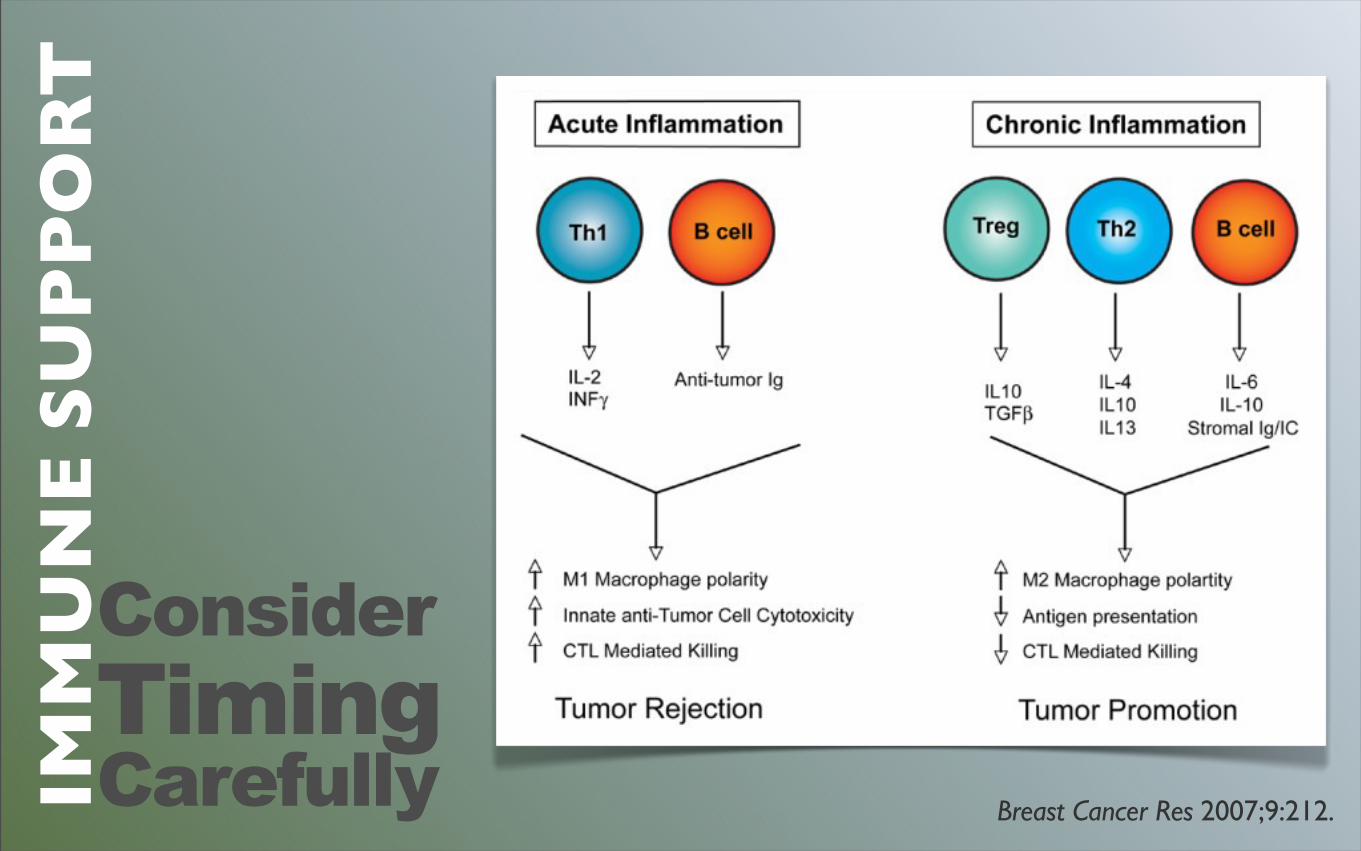
Breast Cancer Res 2007;9:212.
Consider TimingCarefully
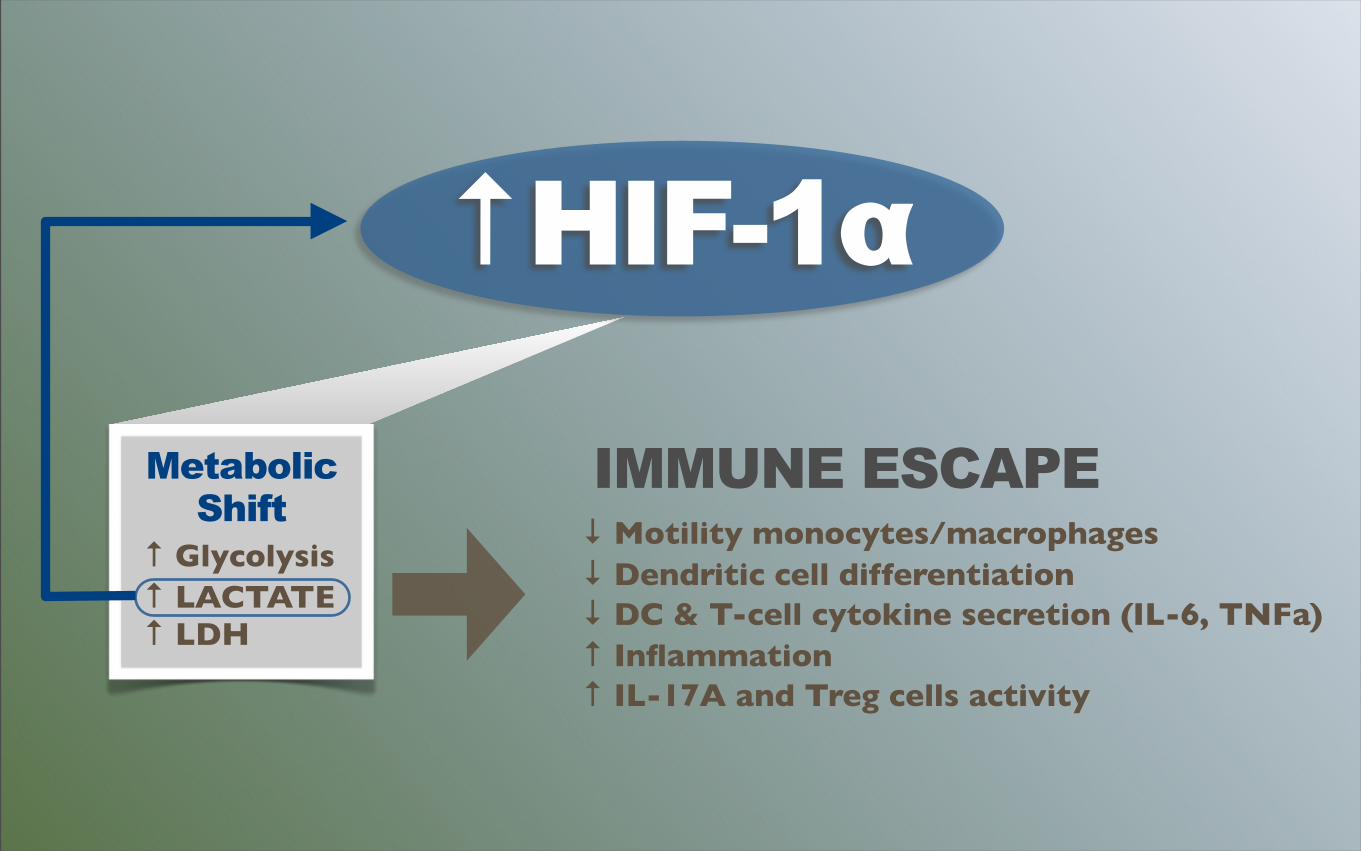
↑ HIF-1α
Metabolic Shift
↑ Glycolysis↑ LACTATE↑ LDH
IMMUNE ESCAPE↓ Motility monocytes/macrophages↓ Dendritic cell differentiation↓ DC & T-cell cytokine secretion (IL-6, TNFa)↑ Inflammation↑ IL-17A and Treg cells activity
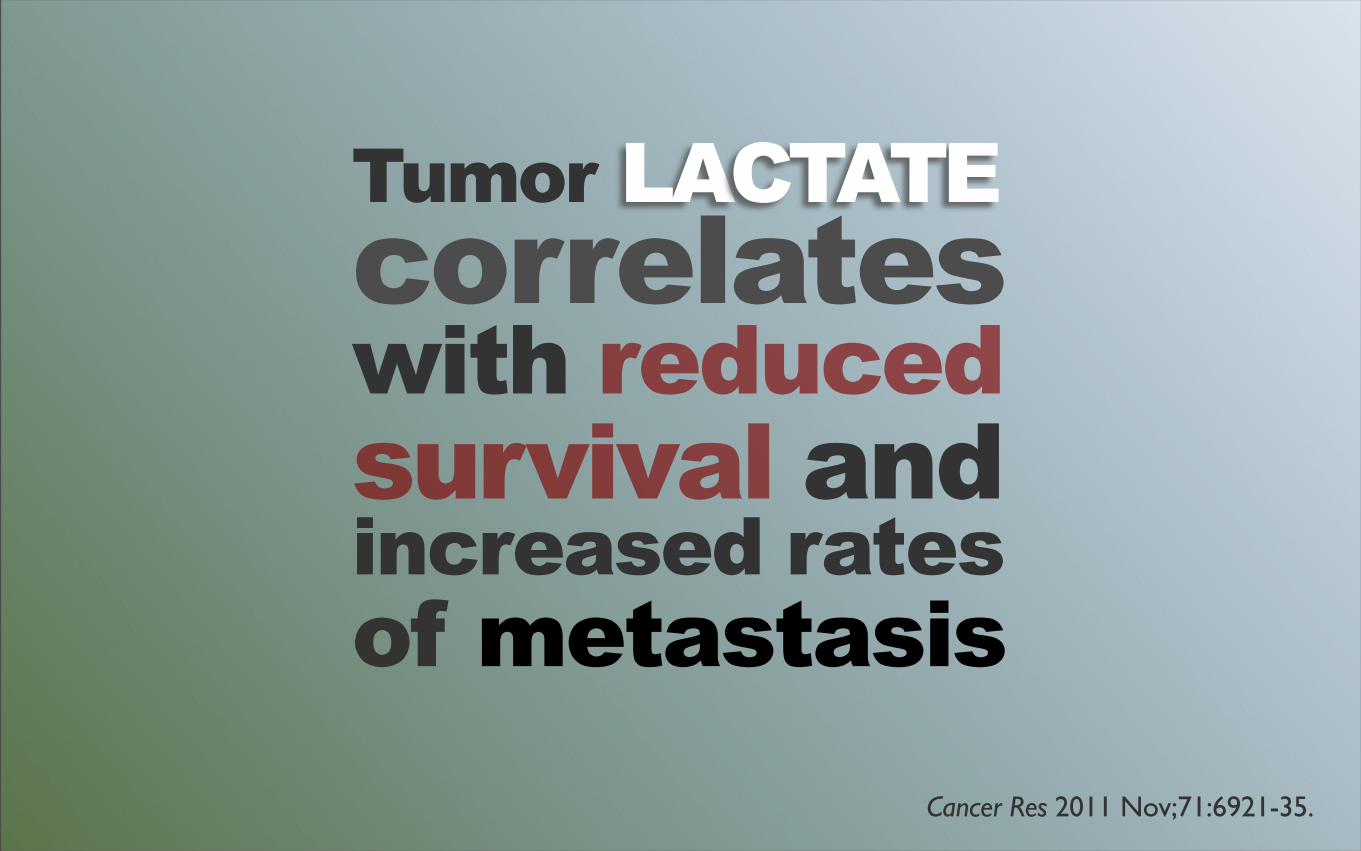
Tumor LACTATEcorrelates with reduced survival and increased ratesof metastasis
Cancer Res 2011 Nov;71:6921-35.
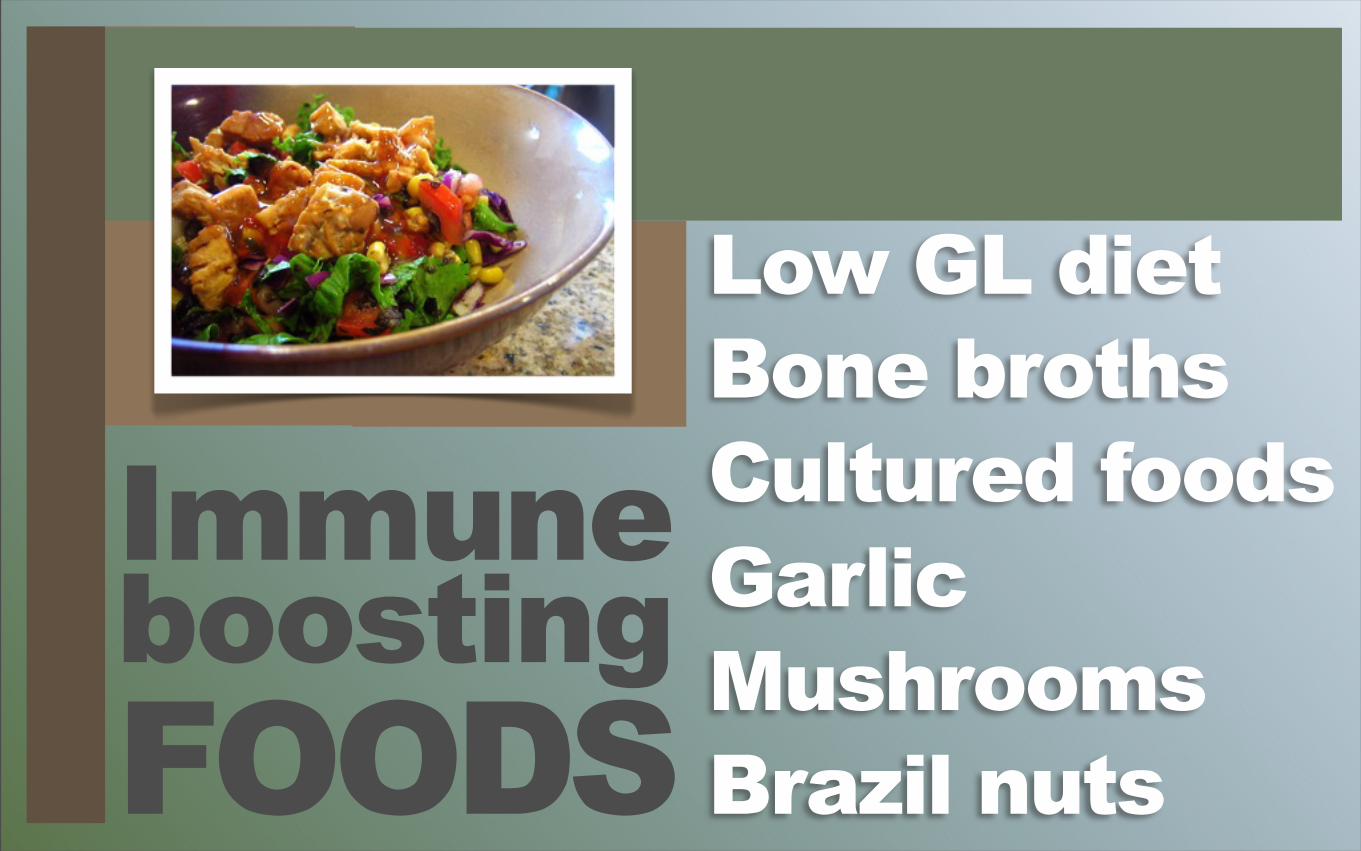
Low GL dietBone brothsCultured foodsGarlicMushroomsBrazil nuts
ImmuneboostingFOODS
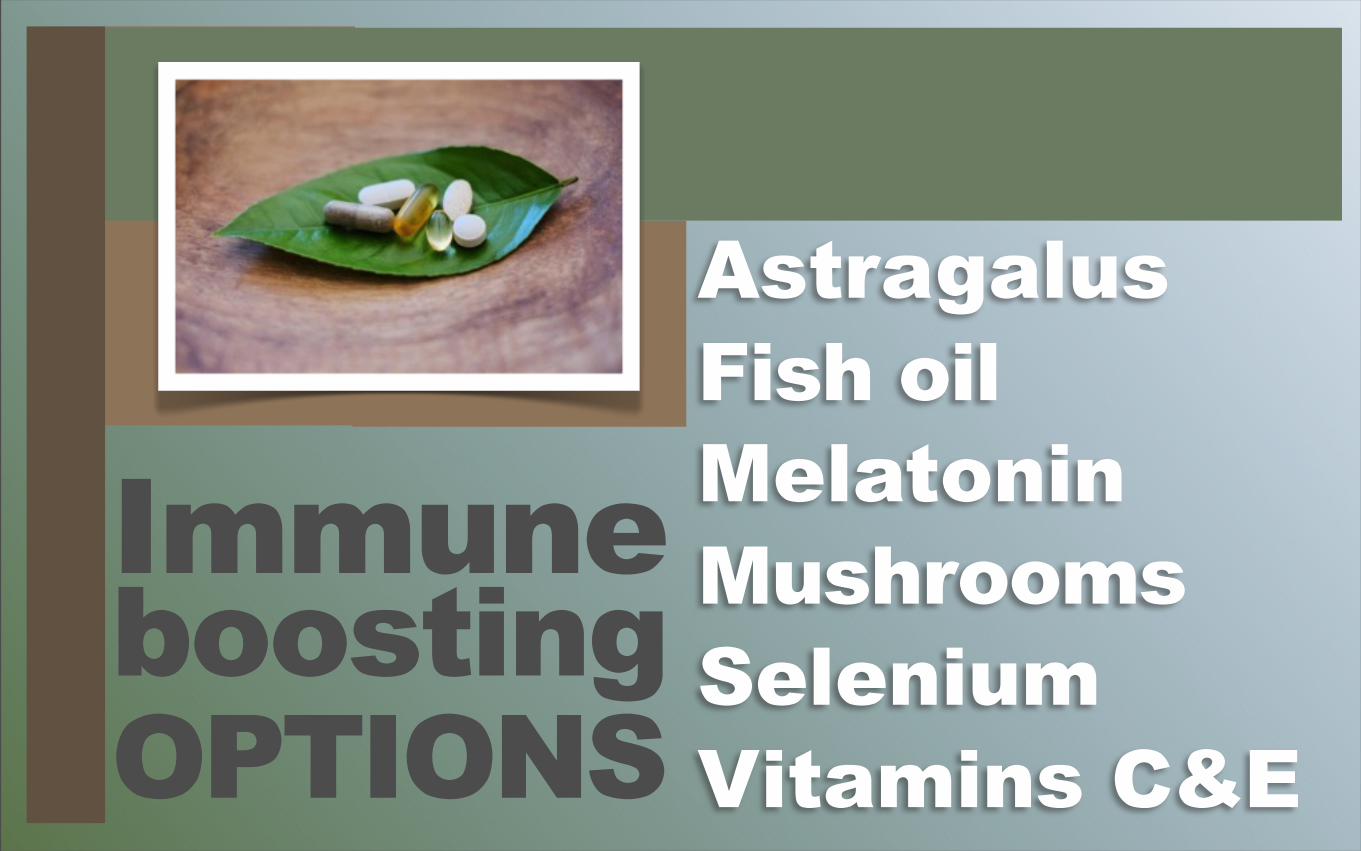
AstragalusFish oilMelatonin MushroomsSeleniumVitamins C&E
ImmuneboostingOPTIONS

Address Side EffectsGOALS
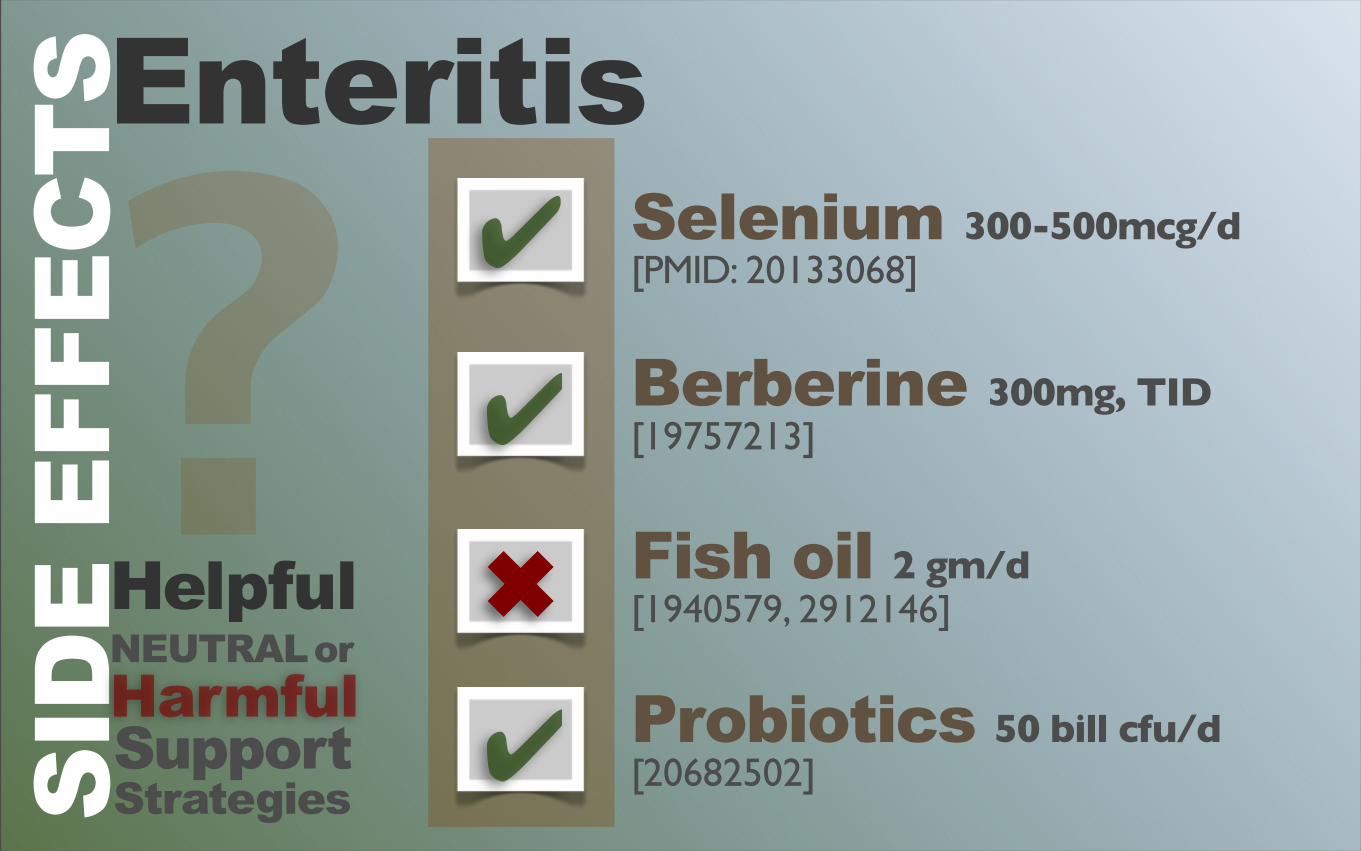
Enteritis
MucositisDermatitisPneumonitis
Proctitis
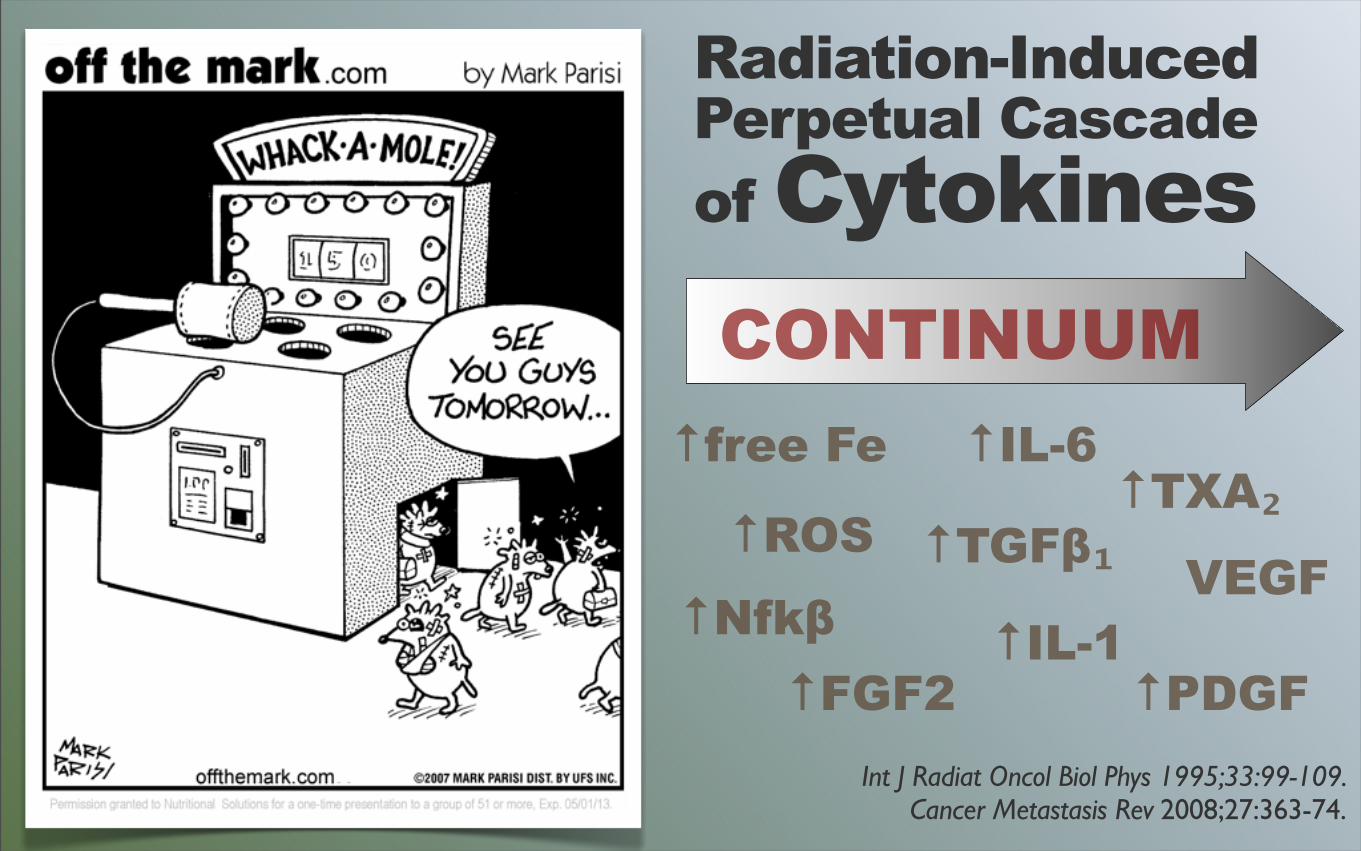
Int J Radiat Oncol Biol Phys 1995;33:99-109. Cancer Metastasis Rev 2008;27:363-74.
Radiation-InducedPerpetual Cascadeof CytokinesCONTINUUM
↑ROS
↑free Fe
↑Nfkβ
↑IL-6
↑TGFβ₁↑TXA₂
↑IL-1↑FGF2
VEGF
↑PDGF
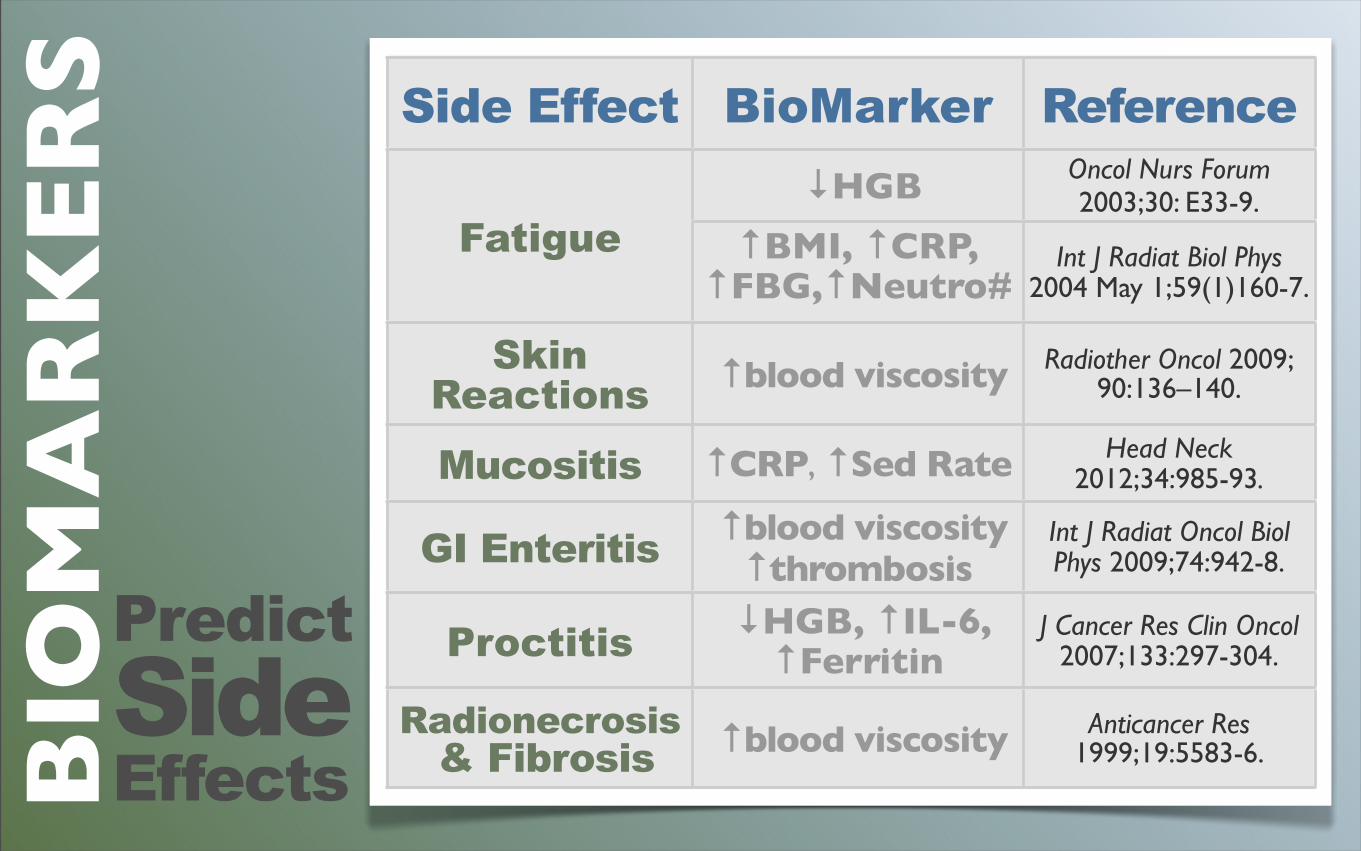
PredictSideEffects
Side Effect BioMarker Reference
Fatigue ↓HGB Oncol Nurs Forum
2003;30: E33-9.Fatigue ↑BMI, ↑CRP,
↑FBG,↑Neutro#Int J Radiat Biol Phys
2004 May 1;59(1)160-7.
SkinReactions ↑blood viscosity Radiother Oncol 2009;
90:136–140.
Mucositis ↑CRP, ↑Sed Rate Head Neck 2012;34:985-93.
GI Enteritis ↑blood viscosity↑thrombosis
Int J Radiat Oncol Biol Phys 2009;74:942-8.
Proctitis ↓HGB, ↑IL-6, ↑Ferritin
J Cancer Res Clin Oncol 2007;133:297-304.
Radionecrosis & Fibrosis ↑blood viscosity Anticancer Res
1999;19:5583-6.BIO
MA
RK
ER
S
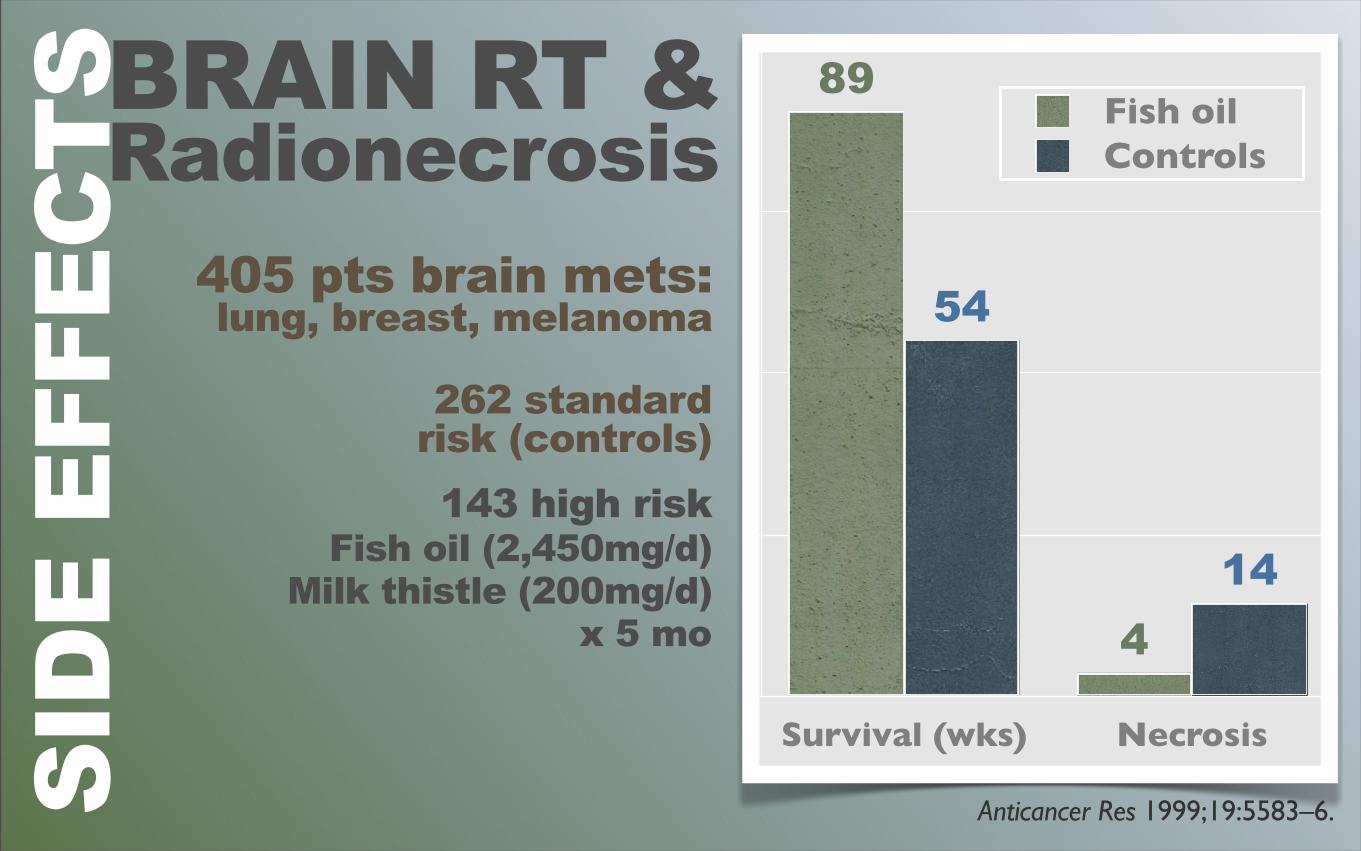
BRAIN RT &Radionecrosis
Anticancer Res 1999;19:5583–6.
405 pts brain mets: lung, breast, melanoma
262 standard risk (controls)143 high risk
Fish oil (2,450mg/d)Milk thistle (200mg/d)
x 5 mo
Survival (wks) Necrosis
14
54
4
89Fish oilControls
SID
E EF
FEC
TS
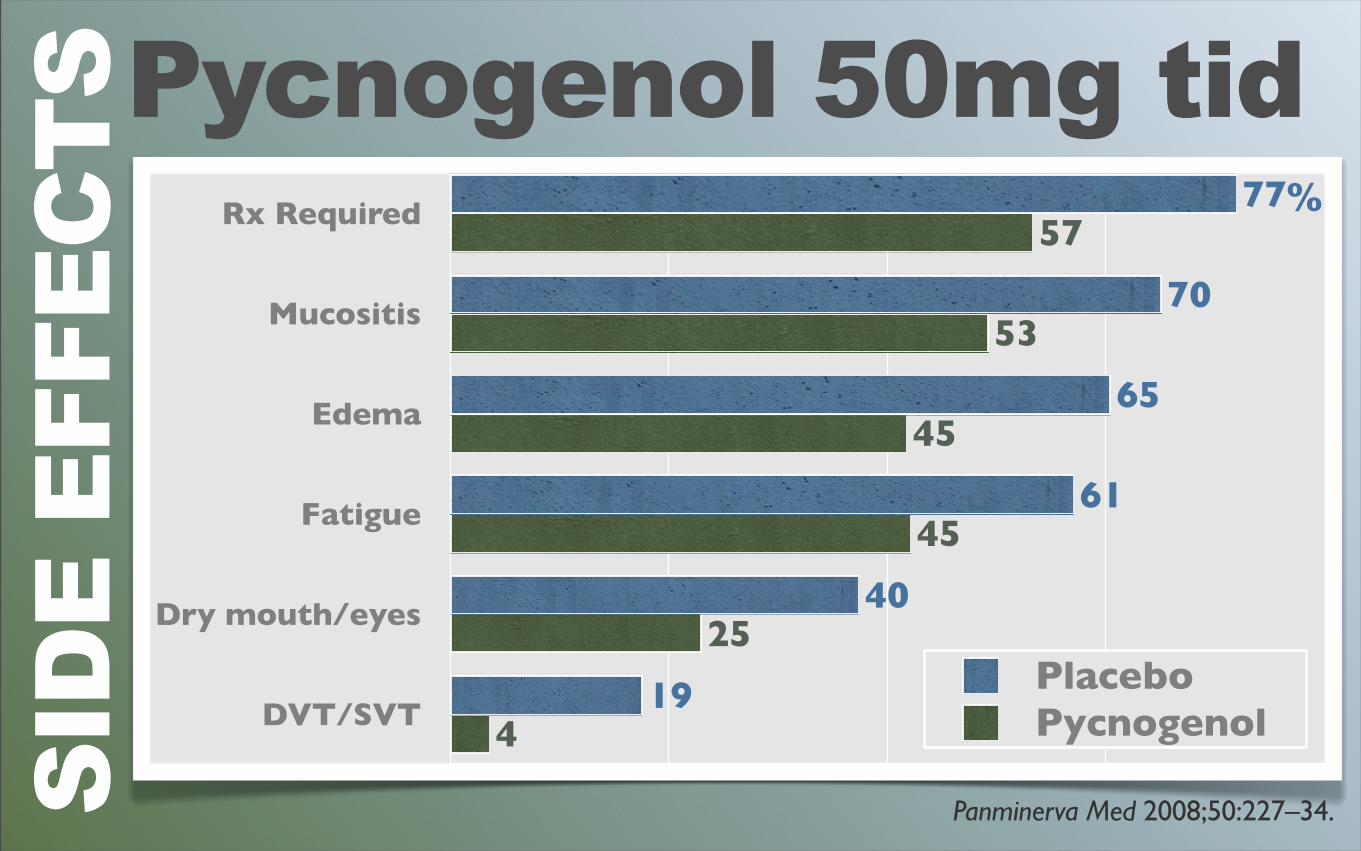
Pycnogenol 50mg tidSI
DE
EFFE
CTS
Rx Required
Mucositis
Edema
Fatigue
Dry mouth/eyes
DVT/SVT 4
25
45
45
53
57
19
40
61
65
70
77
PlaceboPycnogenol
Panminerva Med 2008;50:227–34.
%
SID
E EF
FEC
TS
✔
✔
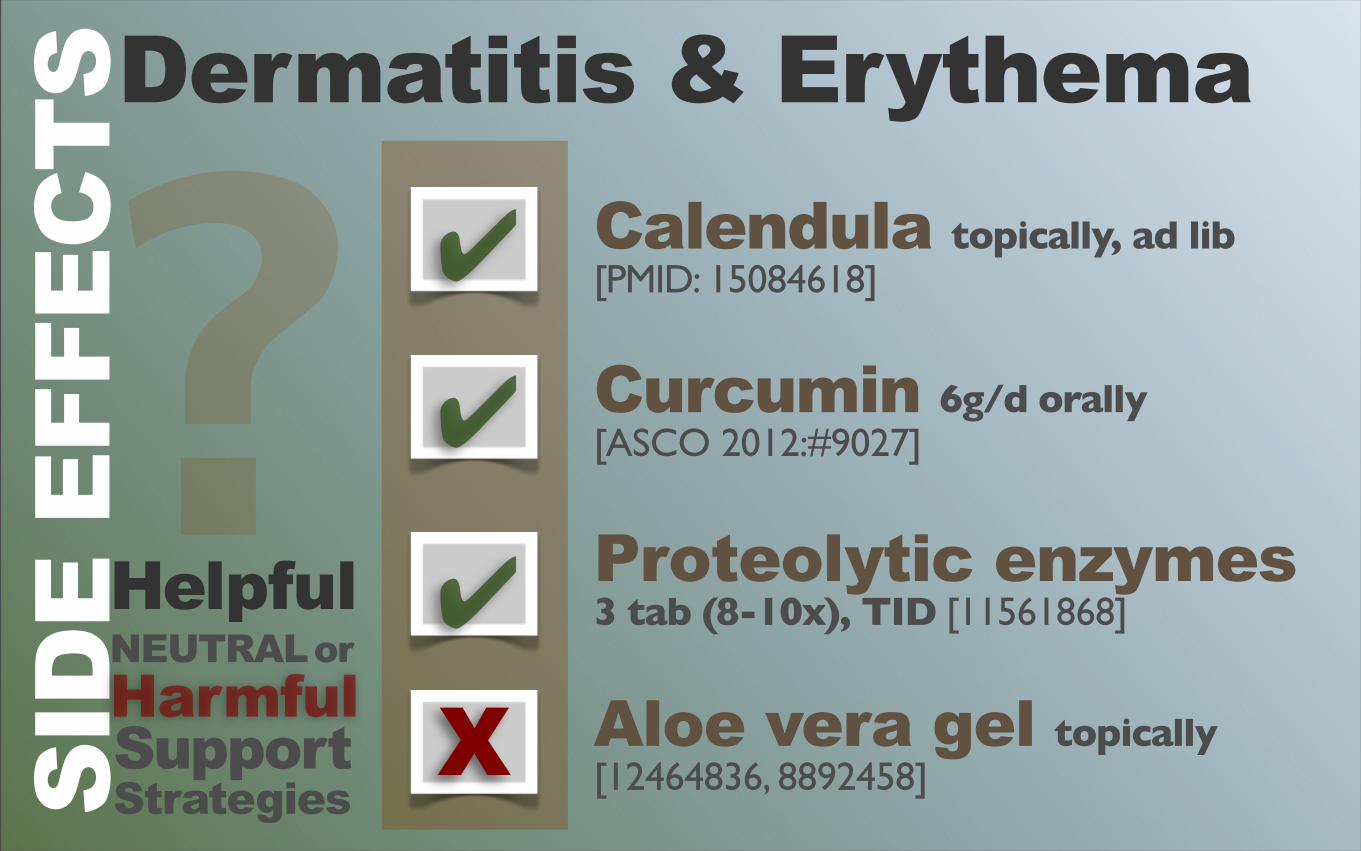
Calendula topically, ad lib [PMID: 15084618]
Curcumin 6g/d orally [ASCO 2012:#9027]
Proteolytic enzymes 3 tab (8-10x), TID [11561868]
Aloe vera gel topically [12464836, 8892458]
]
HelpfulNEUTRAL orHarmfulSupportStrategies
?X
✔
Dermatitis & Erythema
SID
E EF
FEC
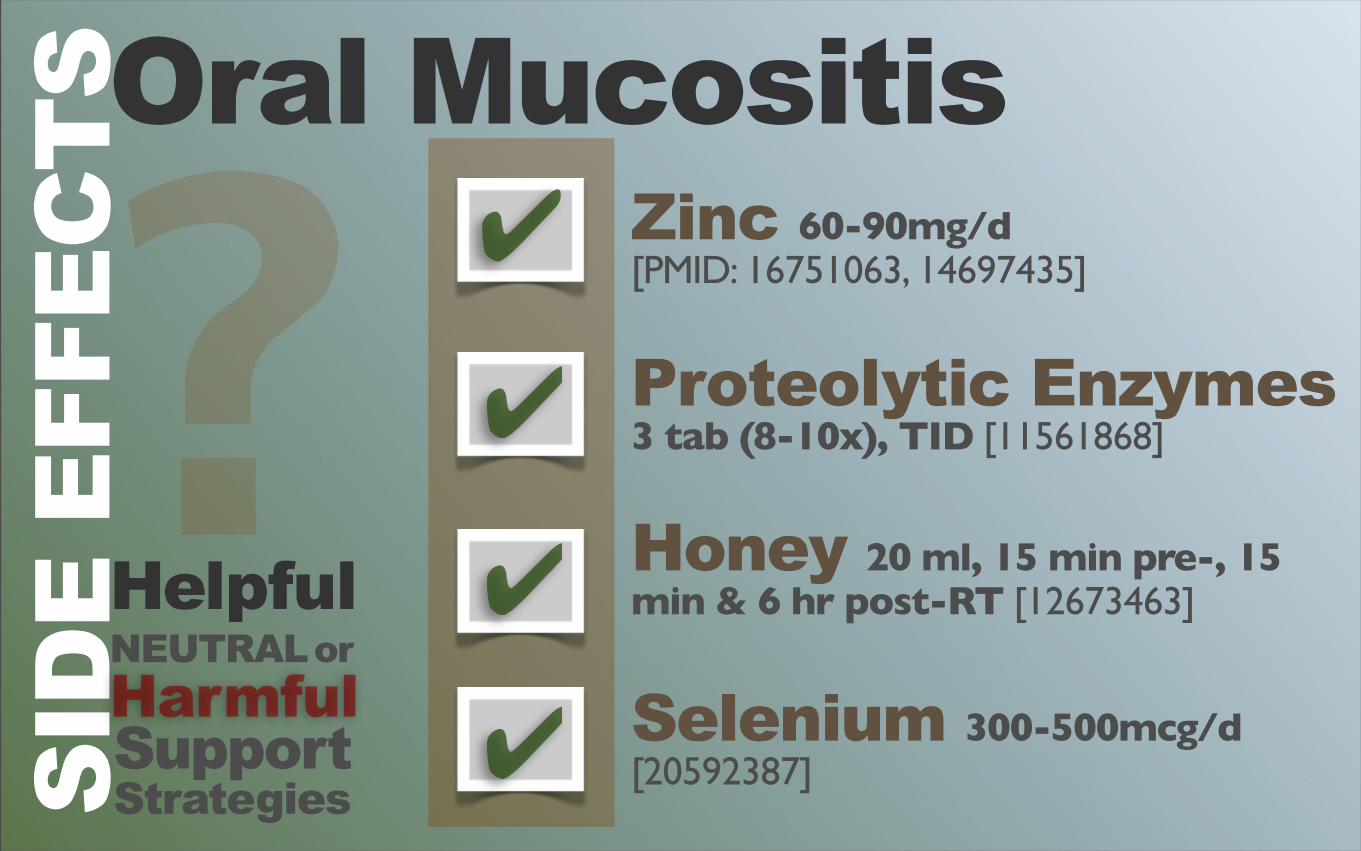
TSOral Mucositis
✔
✔
HelpfulNEUTRAL orHarmfulSupportStrategies
? ✔
✔
Zinc 60-90mg/d [PMID: 16751063, 14697435]
Proteolytic Enzymes 3 tab (8-10x), TID [11561868]
Honey 20 ml, 15 min pre-, 15 min & 6 hr post-RT [12673463]
Selenium 300-500mcg/d [20592387]
✖
✔
EnteritisSI
DE
EFFE
CTS
HelpfulNEUTRAL orHarmfulSupportStrategies
? ✔
✔
Selenium 300-500mcg/d [PMID: 20133068]
Berberine 300mg, TID [19757213]
Fish oil 2 gm/d [1940579, 2912146]
Probiotics 50 bill cfu/d [20682502]
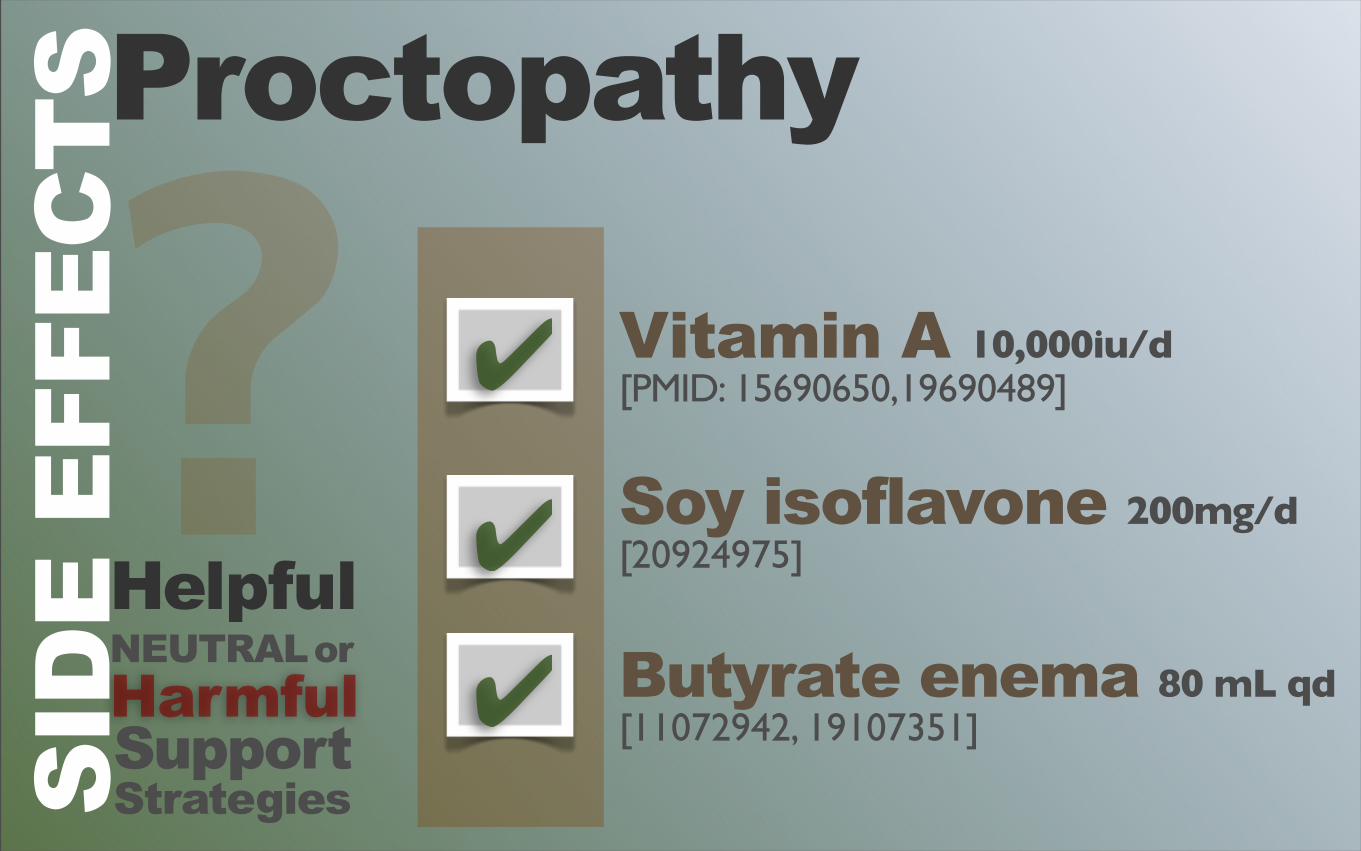
✔
✔
HelpfulNEUTRAL orHarmfulSupportStrategies
?✔
Vitamin A 10,000iu/d [PMID: 15690650,19690489]
Soy isoflavone 200mg/d[20924975]
Butyrate enema 80 mL qd [11072942, 19107351]
SID
E EF
FEC
TSProctopathy
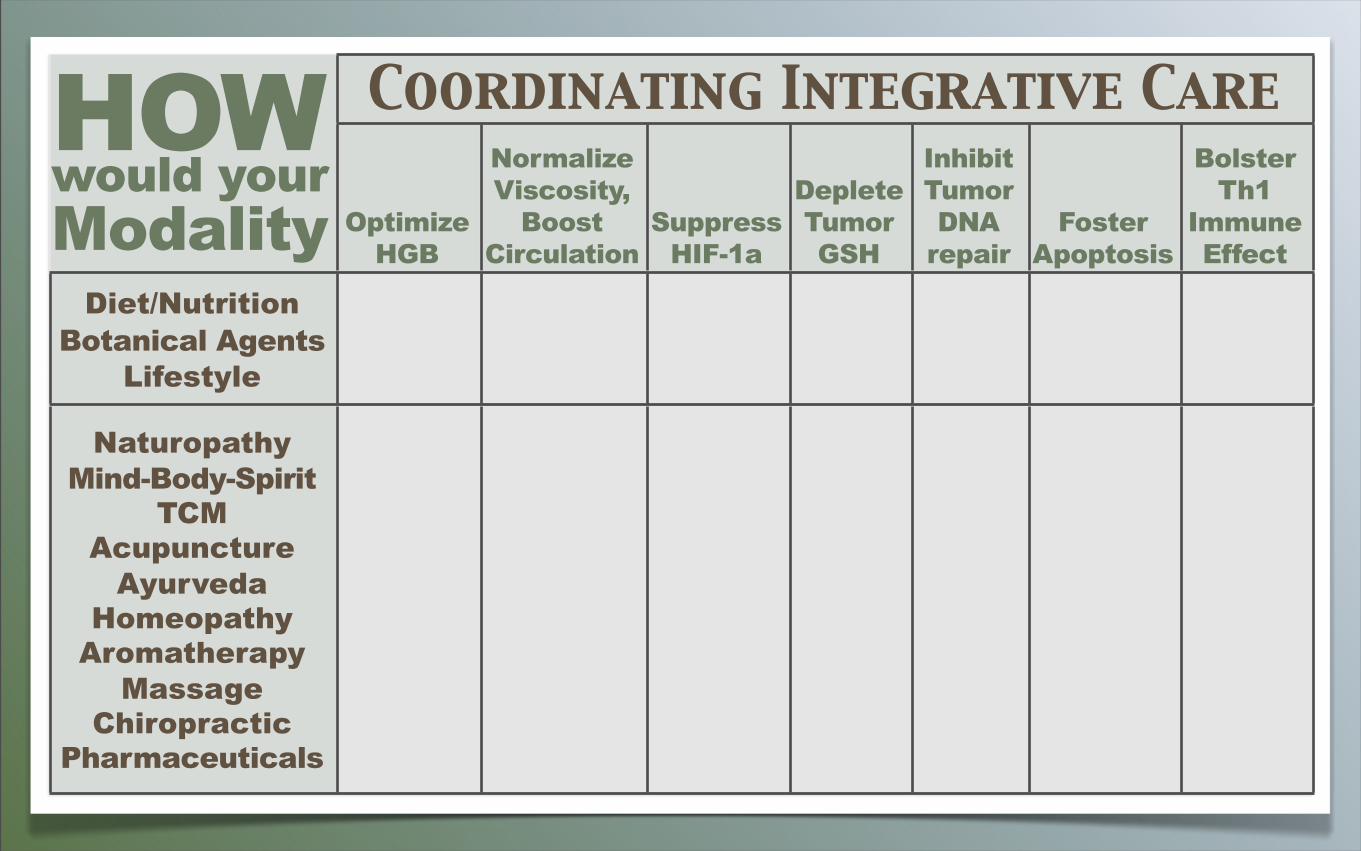
Coordinating Integrative CareCoordinating Integrative CareCoordinating Integrative CareCoordinating Integrative CareCoordinating Integrative CareCoordinating Integrative CareCoordinating Integrative Care
Optimize HGB
NormalizeViscosity,
Boost Circulation
SuppressHIF-1a
DepleteTumorGSH
InhibitTumor DNA
repairFoster
Apoptosis
BolsterTh1
ImmuneEffect
Diet/NutritionBotanical Agents
Lifestyle
NaturopathyMind-Body-Spirit
TCM Acupuncture
AyurvedaHomeopathy
AromatherapyMassage
ChiropracticPharmaceuticals
HOWwould yourModality