radial basis function neural network application to … · radial basis function neural network...
TRANSCRIPT

Hindawi Publishing CorporationMathematical Problems in EngineeringVolume 2012, Article ID 647305, 14 pagesdoi:10.1155/2012/647305
Research ArticleRadial Basis Function Neural Network Applicationto Measurement and Control of Shunt ReactorOvervoltages Based on Analytical Rules
Iman Sadeghkhani,1 Abbas Ketabi,2 and Rene Feuillet3
1 Department of Electrical Engineering, Najafabad Branch, Islamic Azad University,Najafabad 85141-43131, Iran
2 Department of Electrical Engineering, University of Kashan, Kashan 87317-51167, Iran3 Grenoble Electrical Engineering Lab (G2ELab), Grenoble INP, BP46,38402 Saint Martin d’Heres Cedex, France
Correspondence should be addressed to Iman Sadeghkhani, [email protected]
Received 5 March 2012; Accepted 11 August 2012
Academic Editor: Gordon Huang
Copyright q 2012 Iman Sadeghkhani et al. This is an open access article distributed under theCreative Commons Attribution License, which permits unrestricted use, distribution, andreproduction in any medium, provided the original work is properly cited.
This paper presents an artificial intelligence application to measure switching overvoltages causedby shunt reactor energization by applying analytical rules. In a small power system that appears inan early stage of a black start of a power system, an overvoltage could be caused by core saturationon the energization of a reactor with residual flux. A radial basis function (RBF) neural network hasbeen used to estimate the overvoltages due to reactor energization. Equivalent circuit parametersof network have been used as artificial neural network (ANN) inputs; thus, RBF neural networkis applicable to every studied system. The developed ANN is trained with the worst case of theswitching angle and remanent flux and tested for typical cases. The simulated results for a partialof 39-bus New England test system show that the proposed technique canmeasure the peak valuesand duration of switching overvoltages with good accuracy.
1. Introduction
In high-voltage (HV) power systems usually power is transmitted through long high-voltagetransmission lines. During the low demand periods (nights or weekends), excessive reactivepower produced by the capacitance of these lines causes a voltage increase over 1.1 p.u. atthe high-voltage/medium-voltage (HV/MV) substations. For the absorption of the surplusreactive power, HV shunt reactors are connected to the receiving end of the transmissionlines. Switching of those shunt reactors produce transients that need to be carefully studiedand, if required, limited [1–7].
If the frequency characteristic of the system shows resonance conditions aroundmultiples of the fundamental frequency, very high and weakly damped temporary

2 Mathematical Problems in Engineering
overvoltages (TOVs) of long duration may occur when the system is excited by a harmonicdisturbance [8–14].
Overvoltages can be classified as transient overvoltages, sustained overvoltages, har-monic resonance overvoltages, and overvoltages resulting from ferroresonance. Excessive-sustained overvoltages may lead to the damage of transformers and other power systemequipments. Transient overvoltages are a consequence of switching operations on longtransmission lines, or the switching of capacitive devices, and may result in arrester failures.Ferroresonance is a nonharmonic resonance characterized by overvoltages whose waveformsare highly distorted and can cause catastrophic equipment damages [11, 15].
Overvoltage will put the shunt reactor into saturation, causing core heating andcopious harmonic current generation. Circuit breaker called upon to operate during periodsof high voltage will have reduced interrupting capability [11, 16].
In this paper power system blockset (PSB), a MATLAB/Simulink-based simulationtool [17, 18] is used for computation of temporary overvoltages. In order to study temporaryovervoltages for a large number of possible system configurations, it is necessary to runmanytime-domain simulations resulting in a large amount of simulation time. A way to limit theoverall calculation time is to reduce the number of simulations by applying analytical orknowledge-based rules to discard a number of system configurations before an actual time-domain simulation is carried out. This paper presents the artificial neural network (ANN)application for estimation of peak and duration overvoltages under switching transientsduring reactor energization. A tool such as the one proposed in this paper that can givethe maximum switching overvoltage and its duration will be helpful to the operator duringsystem restoration. Also it can be used as a training tool for the operators. Results of thestudies are presented for a partial of 39-bus New England test system to illustrate theproposed approach.
2. Study System Modelling
The electrical components of the network are modeled using the MATLAB/Simulinkenvironment [17]. These models should be adapted for the desired frequency range (herethe frequencies up to f = 10f0 are considered to be sufficient). The generator is representedby an ideal voltage source behind the subtransient inductance in series with the armaturewinding resistance that can be as accurate as the Park model [19]. Phase of voltage sourceis determined by the load flow results. Transmission lines are described by distributed linemodels. The circuit breaker is represented by an ideal switch. The shunt reactor model takesinto account the leakage inductance as well as the magnetizing characteristics of the core,which is modeled by a resistance, Rm, simulating the core active losses and a saturableinductance, Lsat. The saturation characteristic is specified as a piecewise linear characteristic[20]. All of the loads are modeled as constant impedances.
3. Harmonic Overvoltages during Restoration
This paper concentrates on the estimation of harmonic overvoltages. These are a result ofnetwork resonance frequencies close to multiples of the fundamental frequency. They can beexcited by harmonic sources such as saturated reactors, power electronics, and so forth. Theymay lead to long lasting overvoltages resulting in arrester failures and system faults [21, 22].
Mathematical Problems in Engineering 3
G
Bus 2Bus 1
Line1 2
Reqv Leqv
Ceqv
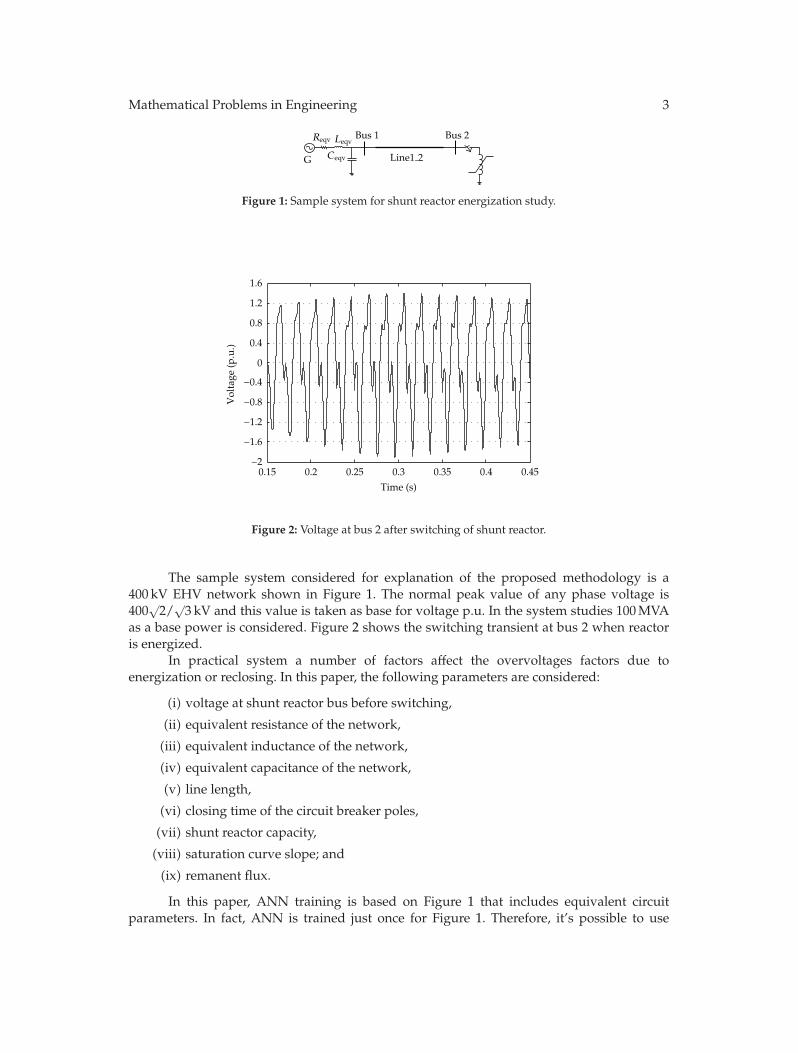
Figure 1: Sample system for shunt reactor energization study.
0.15 0.2 0.25 0.3 0.35 0.4 0.45
0
0.4
0.8
1.2
1.6
Time (s)
Vol
tage
(p.u
.)
−2
−1.6
−1.2
−0.8
−0.4
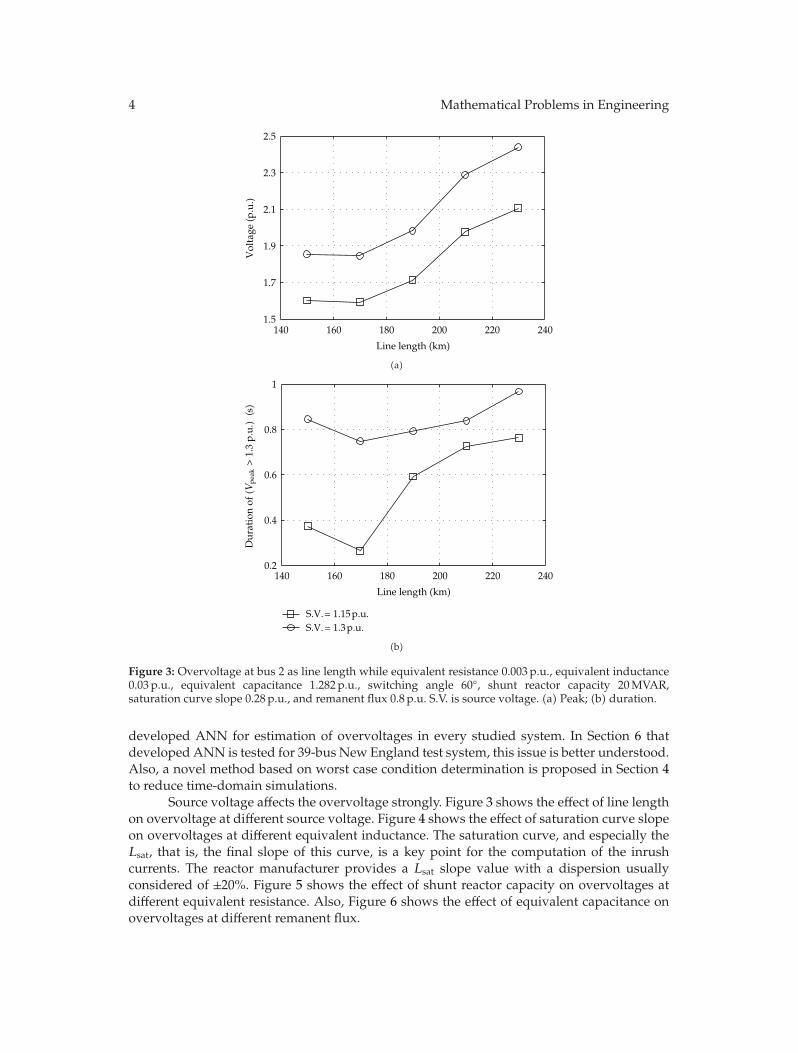
Figure 2: Voltage at bus 2 after switching of shunt reactor.
The sample system considered for explanation of the proposed methodology is a400 kV EHV network shown in Figure 1. The normal peak value of any phase voltage is400
√2/
√3 kV and this value is taken as base for voltage p.u. In the system studies 100MVA
as a base power is considered. Figure 2 shows the switching transient at bus 2 when reactoris energized.
In practical system a number of factors affect the overvoltages factors due toenergization or reclosing. In this paper, the following parameters are considered:
(i) voltage at shunt reactor bus before switching,
(ii) equivalent resistance of the network,
(iii) equivalent inductance of the network,
(iv) equivalent capacitance of the network,
(v) line length,
(vi) closing time of the circuit breaker poles,
(vii) shunt reactor capacity,
(viii) saturation curve slope; and
(ix) remanent flux.
In this paper, ANN training is based on Figure 1 that includes equivalent circuitparameters. In fact, ANN is trained just once for Figure 1. Therefore, it’s possible to use
4 Mathematical Problems in Engineering
140 160 180 200 220 2401.5
1.7
1.9
2.1
2.3
2.5
Line length (km)
Vol
tage
(p.u
.)
(a)
140 160 180 200 220 2400.2
0.4
0.6
0.8
1
Line length (km)
S.V.= 1.15 p.u.S.V.= 1.3 p.u.
Dur
atio
n of
(Vpe
ak>
1.3
p.u.) (s)
(b)
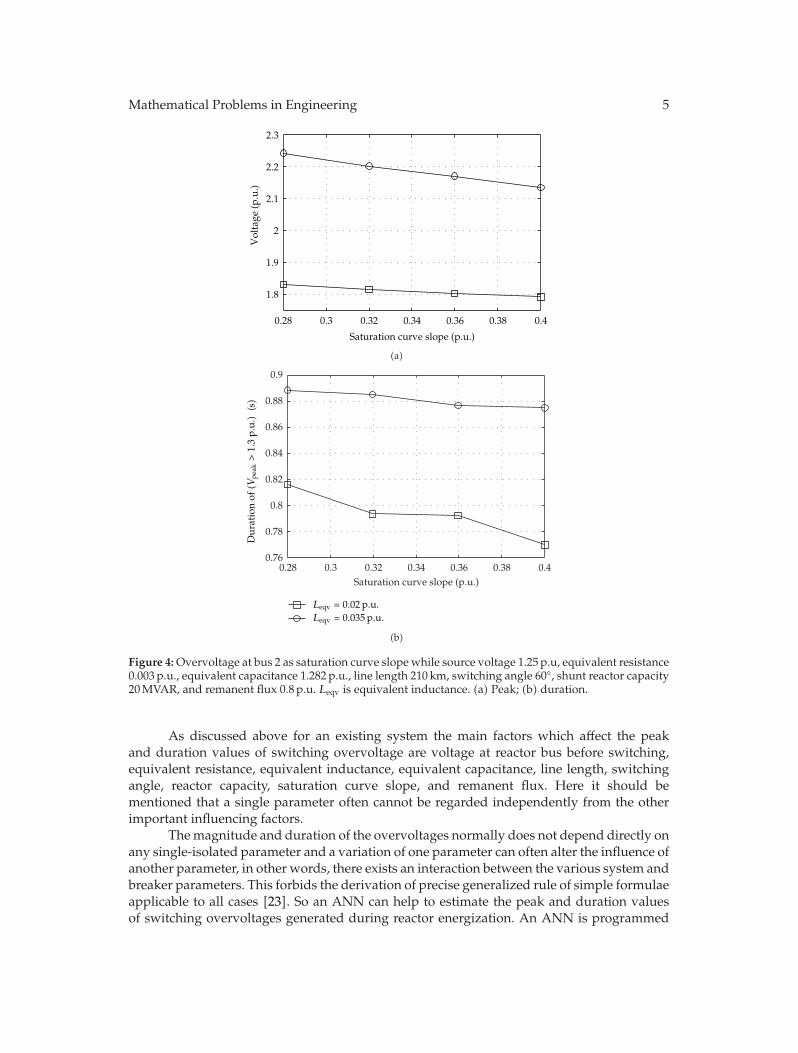
Figure 3: Overvoltage at bus 2 as line length while equivalent resistance 0.003 p.u., equivalent inductance0.03 p.u., equivalent capacitance 1.282 p.u., switching angle 60◦, shunt reactor capacity 20MVAR,saturation curve slope 0.28 p.u., and remanent flux 0.8 p.u. S.V. is source voltage. (a) Peak; (b) duration.
developed ANN for estimation of overvoltages in every studied system. In Section 6 thatdeveloped ANN is tested for 39-bus New England test system, this issue is better understood.Also, a novel method based on worst case condition determination is proposed in Section 4to reduce time-domain simulations.
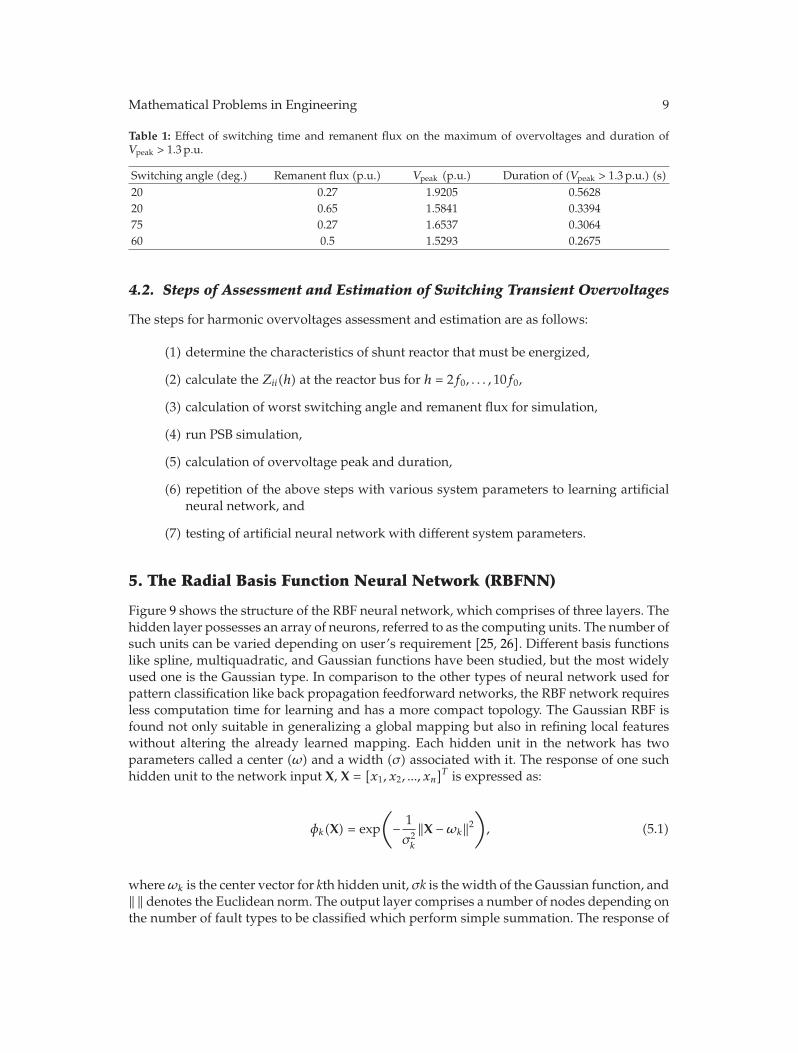
Source voltage affects the overvoltage strongly. Figure 3 shows the effect of line lengthon overvoltage at different source voltage. Figure 4 shows the effect of saturation curve slopeon overvoltages at different equivalent inductance. The saturation curve, and especially theLsat, that is, the final slope of this curve, is a key point for the computation of the inrushcurrents. The reactor manufacturer provides a Lsat slope value with a dispersion usuallyconsidered of ±20%. Figure 5 shows the effect of shunt reactor capacity on overvoltages atdifferent equivalent resistance. Also, Figure 6 shows the effect of equivalent capacitance onovervoltages at different remanent flux.
Mathematical Problems in Engineering 5
0.28 0.3 0.32 0.34 0.36 0.38 0.4
1.8
1.9
2
2.1
2.2
2.3
Saturation curve slope (p.u.)
Vol
tage
(p.u
.)
(a)
0.76
0.78
0.8
0.82
0.84
0.86
0.88
0.9
0.28 0.3 0.32 0.34 0.36 0.38 0.4Saturation curve slope (p.u.)
Leqv = 0.02 p.u.Leqv = 0.035 p.u.
Dur
atio
n of
(Vpe
ak>
1.3
p.u.) (s)
(b)
Figure 4:Overvoltage at bus 2 as saturation curve slope while source voltage 1.25 p.u, equivalent resistance0.003 p.u., equivalent capacitance 1.282 p.u., line length 210 km, switching angle 60◦, shunt reactor capacity20MVAR, and remanent flux 0.8 p.u. Leqv is equivalent inductance. (a) Peak; (b) duration.
As discussed above for an existing system the main factors which affect the peakand duration values of switching overvoltage are voltage at reactor bus before switching,equivalent resistance, equivalent inductance, equivalent capacitance, line length, switchingangle, reactor capacity, saturation curve slope, and remanent flux. Here it should bementioned that a single parameter often cannot be regarded independently from the otherimportant influencing factors.
Themagnitude and duration of the overvoltages normally does not depend directly onany single-isolated parameter and a variation of one parameter can often alter the influence ofanother parameter, in other words, there exists an interaction between the various system andbreaker parameters. This forbids the derivation of precise generalized rule of simple formulaeapplicable to all cases [23]. So an ANN can help to estimate the peak and duration valuesof switching overvoltages generated during reactor energization. An ANN is programmed

6 Mathematical Problems in Engineering
20 30 40 50 60 70 801.55
1.575
1.6
1.625
1.65
1.675
1.7
1.725
1.75
Shunt reactor capacity (MVAR)
Vol
tage
(p.u
.)
(a)
20 30 40 50 60 70 800.1
0.2
0.3
0.4
0.5
0.6
Shunt reactor capacity (MVAR)
Reqv = 0.003 p.u.Reqv = 0.006 p.u.
Dur
atio
n of
(Vpe
ak>
1.3
p.u.) (s)
(b)
Figure 5: Overvoltage at bus 2 as shunt reactor capacity while source voltage 1.2 p.u., equivalentinductance 0.025 p.u., equivalent capacitance 1.8912 p.u., line length 190 km, switching angle 45◦,saturation curve slope 0.32 p.u., and remanent flux 0.8 p.u. Reqv is equivalent resistance. (a) Peak; (b)duration.
by presenting it with training set of input/output patterns from which it then learns therelationship between the inputs and outputs. In the next section, an ANN-based approach isdescribed which can give an acceptable solution of switching transients by the help of whichan operator can take a quick decision at the time of operation.
4. Proposed Method for Harmonic Overvoltages Study
4.1. Worst-Case Condition Determination for Overvoltages Simulation
Normally for harmonic overvoltages analysis, the worst case of the switching angle andremanent flux must be considered which it is a function of switching time, reactor

Mathematical Problems in Engineering 7
0 0.5 1 1.5 2 2.51.68
1.69
1.7
1.71
1.72
1.73
Equivalent capacitance (p.u.)
Vol
tage
(p.u
.)
(a)
0 0.5 1 1.5 2 2.50.59
0.61
0.63
0.65
0.67
Equivalent capacitance (p.u.)
Φr = 0.2 p.u.Φr = 0.8 p.u.
Dur
atio
n of
(Vpe
ak>
1.3
p.u.) (s)
(b)
Figure 6:Overvoltage at bus 2 as equivalent capacitance while source voltage 1.2 p.u, equivalent resistance0.004 p.u., equivalent inductance 0.025 p.u., line length 190 km, switching angle 45◦, shunt reactor capacity20MVAR, and saturation curve slope 0.32 p.u. Φr is remanent flux. (a) Peak; (b) duration.
characteristics and its initial flux condition, and impedance characteristics of the switchingbus [20]. Using the worst switching angle and remanent flux, the number of simulations foreach case can be reduced significantly.
In order to determine the worst-case switching time and remanent flux, the followingindex is defined as
W =10∑
h=2
Zjj(h) · Ij(h, t0, φr
), (4.1)

8 Mathematical Problems in Engineering
0 60 120 180 240 300 360 420 480 540 6000
1
2
3
4
5
6
Frequency (Hz)
Impe
dan
ceZ
bus
2(p
.u.)
Figure 7: Voltage at bus 2 after switching of shunt reactor.
0 10 20 30 40 50 60 70 80 90
00.10.2
0.30.4
0.50.6
0.70.8
0
0.1
0.2
0.3
0.4
0.5
0.6
0.7
Switching angle (deg)Remanent flux (p.u.)
Har
mon
ic in
dex
W
Figure 8: Changes ofW index with respect to current starting angle and remanent flux.
where t0 is the switching time, φr is initial transformer flux, and h is harmonic order. Thisindex can be a definition for the worst-case switching angle and remanent flux. Using anumerical algorithm, one can find the switching time and remanent flux for which W aremaximal (i.e., harmonic overvoltages are maximal).
Figure 7 shows the result of the PSB frequency analysis at bus 2. The magnitudeof the Thevenin impedance, seen from bus 2, Zbus2 shows a parallel resonance peak at174Hz. Figure 8 shows changes of W index with respect to the current starting angle andremanent flux. Figure 2 shows voltage at bus 2 after reactor switching for the worst-casecondition (i.e., switching angle 20◦ and remanent flux 0.27 p.u.). For temporary overvoltages,the overvoltage duration has to be taken into account in addition to the amplitude [24].Table 1 summarizes the results of overvoltages simulation for four different switching angleand remanent flux that verify the effectiveness of W index.
Mathematical Problems in Engineering 9
Table 1: Effect of switching time and remanent flux on the maximum of overvoltages and duration ofVpeak > 1.3 p.u.
Switching angle (deg.) Remanent flux (p.u.) Vpeak (p.u.) Duration of (Vpeak > 1.3 p.u.) (s)20 0.27 1.9205 0.562820 0.65 1.5841 0.339475 0.27 1.6537 0.306460 0.5 1.5293 0.2675
4.2. Steps of Assessment and Estimation of Switching Transient Overvoltages
The steps for harmonic overvoltages assessment and estimation are as follows:
(1) determine the characteristics of shunt reactor that must be energized,
(2) calculate the Zii(h) at the reactor bus for h = 2f0, . . . , 10f0,
(3) calculation of worst switching angle and remanent flux for simulation,
(4) run PSB simulation,
(5) calculation of overvoltage peak and duration,
(6) repetition of the above steps with various system parameters to learning artificialneural network, and
(7) testing of artificial neural network with different system parameters.
5. The Radial Basis Function Neural Network (RBFNN)
Figure 9 shows the structure of the RBF neural network, which comprises of three layers. Thehidden layer possesses an array of neurons, referred to as the computing units. The number ofsuch units can be varied depending on user’s requirement [25, 26]. Different basis functionslike spline, multiquadratic, and Gaussian functions have been studied, but the most widelyused one is the Gaussian type. In comparison to the other types of neural network used forpattern classification like back propagation feedforward networks, the RBF network requiresless computation time for learning and has a more compact topology. The Gaussian RBF isfound not only suitable in generalizing a global mapping but also in refining local featureswithout altering the already learned mapping. Each hidden unit in the network has twoparameters called a center (ω) and a width (σ) associated with it. The response of one suchhidden unit to the network input X, X = [x1, x2, ..., xn]
T is expressed as:
φk(X) = exp
(− 1σ2k
‖X −ωk‖2), (5.1)
whereωk is the center vector for kth hidden unit, σk is the width of the Gaussian function, and‖ ‖ denotes the Euclidean norm. The output layer comprises a number of nodes depending onthe number of fault types to be classified which perform simple summation. The response of

10 Mathematical Problems in Engineering
1
2
1
2X1
X2
mXm
W1 σ1
W2 σ2
Wk−1 σk−1
Wk σk
k − 1
k
α1o
∑
∑
αmo
f(x)
Input
layer
Hidden
layer
Output
layer
Figure 9: The structure of RBF neural network.
each hidden unit (4.1) is scaled by its connecting weights (α’s) to the output nodes and thensummed to produce the overall network output. The overall network output is expressed as:
fm(X) = αmo +N∑
k=1
αmkφk(X), (5.2)
where N indicates the total number of hidden neurons in the network, αmk is the connectingweight of the kth hidden unit to mth output node, and αmo is the bias term for thecorresponding mth output neuron. The learning process of the RBFNN involves with theallocation of new hidden units and tuning of network parameters. The learning process isterminated when the output error goes under the defined threshold [27].
5.1. Training Artificial Neural Network
All experiments have been repeated for different system parameters (2000 sets). 1000 setswere used to train RBFNN and 1000 sets were used to test RBFNN. RBFANN learned in 73epochs. After learning, all parameters of the trained networks have been frozen and thenused in the retrieval mode for testing the capabilities of the system on the data not used inlearning. The testing data samples have been generated through the PSB program by placingthe parameter values not used in learning, by applying different parameters. A large number

Mathematical Problems in Engineering 11
Table 2: Some sample testing data and output.
V Reqv Leqv Ceqv L.L. S.R. Lsat VPSB VRBF errorV TPSB TRBF errorT1.208 0.003 0.0325 1.2825 180 20 0.34 1.6582 1.6793 1.2749 0.3673 0.3565 2.95171.234 0.003 0.0325 1.2825 240 20 0.34 1.9675 1.9838 0.8261 0.4661 0.4741 1.72051.257 0.003 0.0225 1.2825 220 20 0.3 1.8831 1.8657 0.9235 0.5154 0.5219 1.26941.269 0.003 0.0275 1.2825 220 20 0.38 2.1371 2.2158 3.6829 0.8831 0.8692 1.57361.292 0.003 0.0275 1.2825 160 20 0.26 1.8194 1.7917 1.5216 0.5747 0.5597 2.61281.328 0.003 0.0275 1.2825 240 20 0.38 2.2339 2.1944 1.7684 0.9075 0.8968 1.18051.354 0.003 0.0375 1.2825 180 20 0.34 2.0425 2.0850 2.0831 0.8573 0.8856 3.29851.381 0.003 0.0325 1.2825 240 20 0.34 2.3117 2.3954 3.6194 0.9812 0.9958 1.49181.296 0.0035 0.025 0.9781 190 10 0.32 1.8302 1.8234 0.3742 0.6035 0.6172 2.26571.296 0.0035 0.025 0.9781 190 70 0.32 1.6653 1.6342 1.8671 0.5387 0.5235 2.82431.301 0.0055 0.025 2.1956 190 50 0.32 1.7195 1.7059 0.7938 0.3995 0.4123 3.19841.282 0.0065 0.025 1.5869 190 50 0.32 1.7102 1.6852 1.4628 0.3567 0.3645 2.18641.294 0.0045 0.025 1.5869 190 90 0.32 1.6417 1.5735 4.1559 0.3126 0.3152 0.82151.279 0.0045 0.025 0.3694 190 90 0.32 1.6215 1.6556 2.1035 0.2369 0.2408 1.64781.306 0.0065 0.025 2.8044 190 30 0.32 1.7743 1.7253 2.7642 0.4734 0.4616 2.4961V : voltage at shunt reactor bus before switching (p.u.), Reqv: equivalent resistance (p.u.), Leqv: equivalent inductance (p.u.),Ceqv: equivalent capacitance (p.u.), L.L.: line length (km), S.R.: shunt reactor capacity (MVAR), Lsat: saturation curve slope(p.u.), errorV : voltage error (%), and errorT : duration time error (%).
of testing data have been used to check the proposed solution in the most objective way atpractically all possible parameters variation. Percentage error is calculated as:
error(%) =|ANN − PSB|
PSB× 100. (5.3)
Results for a sample test data are presented in Table 2. Values in column VPSB are the absolutevalues of peak voltage at bus 2 calculated by PSB program in p.u. where the VRBF valuesare the values simulated by trained network. Also values in column TPSB are the values ofovervoltage duration calculated by PSB program in second and TRBF values are the valuessimulated by trained network.
The proposed model tested with portion of 39-bus New England test system. Variouscases of shunt reactor energization are taken into account and corresponding peak andduration values estimated from trained model.
6. Case Study
In this section, the proposed algorithm is demonstrated for two case studies that are a portionof 39-bus New England test system, of which its parameters are listed in [28]. The simulationsare undertaken on a single-phase representation. In the proposed method, first, studiedsystem must be converted to equivalent circuit of Figure 1. In the other words, values ofequivalent resistance, equivalent inductance, and equivalent capacitance are determined andused in trained artificial neural network to estimate overvoltages peak and duration.
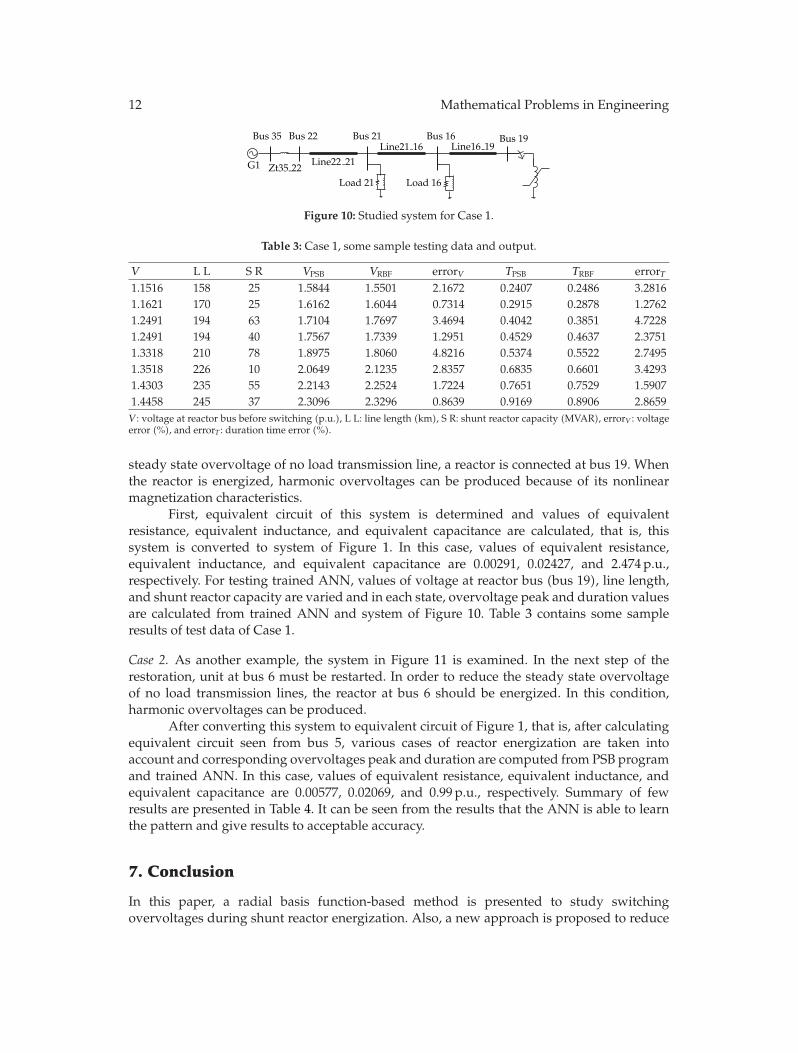
Case 1. Figure 10 shows a one-line diagram of a portion of 39-bus New England test systemwhich is in restorative state. The generator at bus 35 is a black-start unit. In order to reduce the
12 Mathematical Problems in Engineering
G1
Bus 35 Bus 22
Zt35 22Line22 21
Bus 21
Load 21
Line21 16Bus 16
Load 16
Line16 19Bus 19
Figure 10: Studied system for Case 1.
Table 3: Case 1, some sample testing data and output.
V L L S R VPSB VRBF errorV TPSB TRBF errorT1.1516 158 25 1.5844 1.5501 2.1672 0.2407 0.2486 3.28161.1621 170 25 1.6162 1.6044 0.7314 0.2915 0.2878 1.27621.2491 194 63 1.7104 1.7697 3.4694 0.4042 0.3851 4.72281.2491 194 40 1.7567 1.7339 1.2951 0.4529 0.4637 2.37511.3318 210 78 1.8975 1.8060 4.8216 0.5374 0.5522 2.74951.3518 226 10 2.0649 2.1235 2.8357 0.6835 0.6601 3.42931.4303 235 55 2.2143 2.2524 1.7224 0.7651 0.7529 1.59071.4458 245 37 2.3096 2.3296 0.8639 0.9169 0.8906 2.8659V : voltage at reactor bus before switching (p.u.), L L: line length (km), S R: shunt reactor capacity (MVAR), errorV : voltageerror (%), and errorT : duration time error (%).
steady state overvoltage of no load transmission line, a reactor is connected at bus 19. Whenthe reactor is energized, harmonic overvoltages can be produced because of its nonlinearmagnetization characteristics.
First, equivalent circuit of this system is determined and values of equivalentresistance, equivalent inductance, and equivalent capacitance are calculated, that is, thissystem is converted to system of Figure 1. In this case, values of equivalent resistance,equivalent inductance, and equivalent capacitance are 0.00291, 0.02427, and 2.474 p.u.,respectively. For testing trained ANN, values of voltage at reactor bus (bus 19), line length,and shunt reactor capacity are varied and in each state, overvoltage peak and duration valuesare calculated from trained ANN and system of Figure 10. Table 3 contains some sampleresults of test data of Case 1.
Case 2. As another example, the system in Figure 11 is examined. In the next step of therestoration, unit at bus 6 must be restarted. In order to reduce the steady state overvoltageof no load transmission lines, the reactor at bus 6 should be energized. In this condition,harmonic overvoltages can be produced.
After converting this system to equivalent circuit of Figure 1, that is, after calculatingequivalent circuit seen from bus 5, various cases of reactor energization are taken intoaccount and corresponding overvoltages peak and duration are computed from PSB programand trained ANN. In this case, values of equivalent resistance, equivalent inductance, andequivalent capacitance are 0.00577, 0.02069, and 0.99 p.u., respectively. Summary of fewresults are presented in Table 4. It can be seen from the results that the ANN is able to learnthe pattern and give results to acceptable accuracy.
7. Conclusion
In this paper, a radial basis function-based method is presented to study switchingovervoltages during shunt reactor energization. Also, a new approach is proposed to reduce

Mathematical Problems in Engineering 13
G1
Bus 30
Zt30 2
Bus 2
Line2 1
Bus 1
Line1 39 Zt2
Bus 39
G2Bus 6
Line5 6
Bus 5
Line8 5
Bus 8
Line9 8
Bus 9
Line39 9
Load 3Load 8
Figure 11: Studied system for Case 2.
Table 4: Case 2, some sample testing data and output.
V L L S R VPSB VRBF errorV TPSB TRBF errorT1.1442 150 70 1.5011 1.5268 1.7135 0.1936 0.1881 2.82141.1561 165 45 1.5453 1.5356 0.6281 0.2375 0.2268 4.51841.2302 178 30 1.6769 1.6141 3.7428 0.3469 0.3557 2.53691.2514 200 30 1.7481 1.7206 1.5746 0.3952 0.3902 1.26571.3326 215 23 1.9507 1.9955 2.2974 0.5104 0.5214 2.16241.3326 215 17 1.9914 1.9295 3.1108 0.5536 0.5612 1.37511.4165 230 17 2.1652 2.2251 2.7659 0.6742 0.6407 4.97521.4327 242 10 2.2479 2.2811 1.4782 0.7593 0.7809 2.8395V : voltage at reactor bus before switching (p.u.), L L: line length (km), S R: shunt reactor capacity (MVAR), errorV : voltageerror (%), and errorT : duration time error (%).
time-domain simulations based on worst switching angle and remanent flux determination.In addition, since equivalent circuit parameters of the network are used as ANN inputs,developed ANN is applicable to every studied system. The results from this scheme are closeto results from the conventional method and helpful in predicting the overvoltage of the othercase studies within the range of a training set. The proposed ANN approach is tested on apartial 39-bus New England test system. This method omits time-consuming time-domainsimulations and it is suitable for real time applications during system restoration. Also it canbe used as a training tool for the operators.
References
[1] C. D. Tsirekis, N. D. Hatziargyriou, and B. C. Papadias, “Control of shunt reactor inrush currents inthe hellenic-interconnected power system,” IEEE Transactions on Power Delivery, vol. 20, no. 2 I, pp.757–764, 2005.
[2] X. Liu, X. Cui, and L. Qi, “Calculation of lightning-induced overvoltages on overhead lines basedon DEPACT macromodel using circuit simulation software,” IEEE Transactions on ElectromagneticCompatibility, vol. 54, no. 4, pp. 837–849, 2012.
[3] D. Li, C. Wang, and X. Liu, “Investigation of lightning-induced overvoltages affected by the sag ofthe overhead transmission line,” in Proceedings of the IEEE Power Engineering and Automation Conference(PEAM), vol. 1, pp. 335–338, Wuhan, China, September 2011.
[4] Y. Shinohara, K. Fukui, S. Nomoto, and H. Matsubara, “Measurement of switching overvoltages atsubstations and on transmission lines in extra high voltage systems,” in Proceedings of the Transmissionand Distribution Exposition Conference: 2008 IEEE PES Powering Toward the Future (PIMS’08), pp. 1–6,Chicago, Ill, USA, April 2008.
[5] S. A. Taher and I. Sadeghkhani, “Estimation of magnitude and time duration of temporaryovervoltages using ANN in transmission lines during power system restoration,” SimulationModelling Practice and Theory, vol. 18, no. 6, pp. 787–805, 2010.

14 Mathematical Problems in Engineering
[6] P. Yang, S. Chen, and J. He, “Effect of different arresters on switching overvoltages in UHVtransmission lines,” Tsinghua Science and Technology, vol. 15, no. 3, pp. 325–328, 2010.
[7] S. Chen and H. Yu, “A review on overvoltages in microgrid,” in Proceedings of the Asia-Pacific Powerand Energy Engineering Conference (APPEEC’10), pp. 1–4, Chengdu, China, March 2010.
[8] B. Gustavsen, “Study of transformer resonant overvoltages caused by cable-transformer high-frequency interaction,” IEEE Transactions on Power Delivery, vol. 25, no. 2, pp. 770–779, 2010.
[9] H. A. Hamid, N. Harid, and A. Haddad, “Determination of transient overvoltages during shuntreactor deenergization,” in Proceedings of the 44th International Universities Power Engineering Conference(UPEC’09), pp. 1–4, Glasgow, UK, September 2009.
[10] A. Ketabi, I. Sadeghkhani, and R. Feuillet, “Using artificial neural network to analyze harmonicovervoltages during power system restoration,” European Transactions on Electrical Power, vol. 21, no.7, pp. 1941–1953, 2011.
[11] M. M. Adibi, R.W. Alexander, and B. Avramovic, “Overvoltage control during restoration,” IEEETransactions on Power Systems, vol. 7, no. 4, pp. 1464–1470, 1992.
[12] A. Ketabi, A. M. Ranjbar, and R. Feuillet, “Analysis and control of temporary overvoltages forautomated restoration planning,” IEEE Transactions on Power Delivery, vol. 17, no. 4, pp. 1121–1127,2002.
[13] M. M. Adibi, J. N. Borkoski, and R. J. Kafka, “Analytical tool requirements for power systemrestoration,” IEEE Transactions on Power Systems, vol. 9, no. 3, pp. 1582–1591, 1994.
[14] T. Hayashi, D. P. Roberts, K. Walve et al., “Modelling and simulation of Black Start and restoration ofan electric power system. Results of a questionnaire,” Electra, no. 131, pp. 155–169, 1990.
[15] I. Sadeghkhani and A. Ketabi, Switching Overvoltages during Restoration: Evaluation and Control UsingANN, Lambert Academic Publishing, 2012.
[16] D. Thukaram, H. P. Khincha, and S. Khandelwal, “Estimation of switching transient peakovervoltages during transmission line energization using artificial neural network,” Electric PowerSystems Research, vol. 76, no. 4, pp. 259–269, 2006.
[17] A. Ketabi and I. Sadeghkhani, Electric Power Systems Simulation Using MATLAB, Morsal Publications,2011.
[18] G. Sybille, P. Brunelle, L. Hoang, L. A. Dessaint, and K. Al-Haddad, “Theory and applicationsof power system blockset, a MATLAB/Simulink-based simulation tool for power systems,” inProceedings of the IEEE Power Engineering Society Winter Meeting, pp. 774–779, 2000.
[19] M. M. Duro, “Damping modelling in transformer energization studies for system restoration: somestandard models compared to field measurements,” in Proceedings of the IEEE Bucharest PowerTech:Innovative Ideas Toward the Electrical Grid of the Future, pp. 1–8, Bucharest, Romania, July 2009.
[20] G. Sybille, M. M. Gavrilovic, J. Belanger, and V. Q. Do, “Transformer saturation effects on EHV systemovervoltages,” IEEE Transactions on Power Apparatus and Systems, vol. 104, no. 3, pp. 671–680, 1985.
[21] I. Sadeghkhani, A. Ketabi, and R. Feuillet, “Artificial neural network based method to mitigatetemporary overvoltages,” Journal of Engineering Science and Technology Review, vol. 4, no. 2, pp. 193–200, 2011.
[22] I. Sadeghkhani, A. Ketabi, and R. Feuillet, “Study of transformer switching overvoltages duringpower system restoration using delta-bar-delta and directed random search algorithms,” InternationalJournal of Emerging Electric Power Systems, vol. 13, no. 3, pp. 1–22, 2012.
[23] Cigre Working Group, “Switching overvoltages in EHV and UHV systems with special reference toclosing and reclosing transmission lines,” Electra, no. 30, pp. 70–122, 1973.
[24] G. Morin, “Service restoration following a major failure on the hydroquebec power system,” IEEETransactions on Power Delivery, vol. 2, no. 2, pp. 454–463, 1987.
[25] S. Haykin, Neural Network: A Comprehensive Foundation, Prentice Hall, New York, NY, USA, 2ndedition, 1998.
[26] A. Karami and M. S. Mohammadi, “Radial basis function neural network for power system load-flow,” International Journal of Electrical Power and Energy Systems, vol. 30, no. 1, pp. 60–66, 2008.
[27] P. K. Dash, A. K. Pradhan, and G. Panda, “Application of minimal radial basis function neuralnetwork to distance protection,” IEEE Transactions on Power Delivery, vol. 16, no. 1, pp. 68–74, 2001.
[28] S. Wunderlich, M. M. Adibi, R. Fischl, and C. O. D. Nwankpa, “Approach to standing phase anglereduction,” IEEE Transactions on Power Systems, vol. 9, no. 1, pp. 470–478, 1994.

Submit your manuscripts athttp://www.hindawi.com
Hindawi Publishing Corporationhttp://www.hindawi.com Volume 2014
MathematicsJournal of
Hindawi Publishing Corporationhttp://www.hindawi.com Volume 2014
Mathematical Problems in Engineering
Hindawi Publishing Corporationhttp://www.hindawi.com
Differential EquationsInternational Journal of
Volume 2014
Applied MathematicsJournal of
Hindawi Publishing Corporationhttp://www.hindawi.com Volume 2014
Probability and StatisticsHindawi Publishing Corporationhttp://www.hindawi.com Volume 2014
Journal of
Hindawi Publishing Corporationhttp://www.hindawi.com Volume 2014
Mathematical PhysicsAdvances in
Complex AnalysisJournal of
Hindawi Publishing Corporationhttp://www.hindawi.com Volume 2014
OptimizationJournal of
Hindawi Publishing Corporationhttp://www.hindawi.com Volume 2014
CombinatoricsHindawi Publishing Corporationhttp://www.hindawi.com Volume 2014
International Journal of
Hindawi Publishing Corporationhttp://www.hindawi.com Volume 2014
Operations ResearchAdvances in
Journal of
Hindawi Publishing Corporationhttp://www.hindawi.com Volume 2014
Function Spaces
Abstract and Applied AnalysisHindawi Publishing Corporationhttp://www.hindawi.com Volume 2014
International Journal of Mathematics and Mathematical Sciences
Hindawi Publishing Corporationhttp://www.hindawi.com Volume 2014
The Scientific World JournalHindawi Publishing Corporation http://www.hindawi.com Volume 2014
Hindawi Publishing Corporationhttp://www.hindawi.com Volume 2014
Algebra
Discrete Dynamics in Nature and Society
Hindawi Publishing Corporationhttp://www.hindawi.com Volume 2014
Hindawi Publishing Corporationhttp://www.hindawi.com Volume 2014
Decision SciencesAdvances in
Discrete MathematicsJournal of
Hindawi Publishing Corporationhttp://www.hindawi.com
Volume 2014 Hindawi Publishing Corporationhttp://www.hindawi.com Volume 2014
Stochastic AnalysisInternational Journal of