racial gaps in labor market outcomes in the last four ... · the authors thank stephanie aaronson,...
TRANSCRIPT

Finance and Economics Discussion SeriesDivisions of Research & Statistics and Monetary Affairs
Federal Reserve Board, Washington, D.C.
Racial Gaps in Labor Market Outcomes in the Last Four Decadesand over the Business Cycle
Tomaz Cajner, Tyler Radler, David Ratner, and Ivan Vidangos
2017-071
Please cite this paper as:Cajner, Tomaz, Tyler Radler, David Ratner, and Ivan Vidangos (2017). “Racial Gaps inLabor Market Outcomes in the Last Four Decades and over the Business Cycle,” Financeand Economics Discussion Series 2017-071. Washington: Board of Governors of the FederalReserve System, https://doi.org/10.17016/FEDS.2017.071.
NOTE: Staff working papers in the Finance and Economics Discussion Series (FEDS) are preliminarymaterials circulated to stimulate discussion and critical comment. The analysis and conclusions set forthare those of the authors and do not indicate concurrence by other members of the research staff or theBoard of Governors. References in publications to the Finance and Economics Discussion Series (other thanacknowledgement) should be cleared with the author(s) to protect the tentative character of these papers.

1
Racial Gaps in Labor Market Outcomes in the Last Four Decades and over the Business Cycle
Tomaz Cajner, Tyler Radler, David Ratner, and Ivan Vidangos1
Federal Reserve Board
June 12, 2017
Abstract. We examine racial disparities in key labor market outcomes for men and women over the past four decades, with a special emphasis on their evolution over the business cycle. Blacks have substantially higher and more cyclical unemployment rates than whites, and observable characteristics can explain very little of this differential, which is importantly driven by a comparatively higher risk of job loss. In contrast, the Hispanic-white unemployment rate gap is comparatively small and is largely explained by lower educational attainment of (mostly foreign-born) Hispanics. Regarding labor force participation, the remarkably low participation rate of black men is largely unexplained by observables, is mostly driven by high labor force exit rates from employment, and has shown little improvement over the last 40 years. Furthermore, even among those who work, blacks and Hispanics are more likely than whites to work part-time schedules despite wanting to work additional hours, and the racial gaps in this involuntary part-time employment are large even after controlling for observable characteristics. Our findings also suggest that the robust recovery of the labor market in the last few years has contributed significantly to reducing the gaps that had widened dramatically as a result of the Great Recession; however, the disparities remain substantial.
1. Introduction
Labor market outcomes vary widely across demographic groups. Furthermore, these differences are highly persistent and constitute an important dimension of economic inequality. Figure 1 shows the unemployment rate, labor force participation rate, employment-to-population ratio, and involuntary part-time employment rate for males (left panels) and females (right panels) for three groups based on race/ethnicity: whites, blacks, and Hispanics.2 As is well-known (and as seen in the figure), Hispanics and even more so blacks have substantially higher unemployment rates than whites (top panels), and this is true for both males (top-left) and females (top-right). As shown in the next two panels, Hispanic males have higher participation rates, and black males lower participation rates, than white males. For females, the opposite is true—black women have a higher participation rate than white women, and Hispanic women have a lower participation rate. The employment-to-population ratio, shown in the next two panels, is equal to the product of the participation rate and one minus the unemployment rate, and therefore combines information from the participation and unemployment rates. The two bottom panels show involuntary part-time employment, also known as part-time employment for economic 1 Authors' emails: [email protected]; [email protected]; [email protected]; [email protected]. The authors thank Stephanie Aaronson, Neil Bhutta, Andrew Figura, Charles Fleischman, Ben Malin, Chris Nekarda, Michael Palumbo, John Sabelhaus, and Claudia Sahm for helpful comments and/or discussions. The analysis and conclusions set forth are those of the authors and do not indicate concurrence by other members of the research staff or the Federal Reserve Board. 2 The categories used here are three mutually exclusive groups: non-Hispanic whites, non-Hispanic blacks, and Hispanics. For simplicity, we will use the term “race” to encompass both race and ethnicity.

2
reasons, or PTER—an indicator concerned with the intensive, rather than the extensive, margin of employment, expressed as a percent of total employment.3 As can be seen, PTER has also tended to be higher for blacks and Hispanics than for whites (for both males and females), and it rose dramatically for Hispanics at the time of the Great Recession, and remained stubbornly high for blacks years into the recovery.
In this paper, we use micro data from the Current Population Survey (CPS) to examine the evolution of racial gaps—separately by gender—in employment, unemployment, labor force participation, and involuntary part-time employment over the past four decades (1976-2016) and over the business cycle, and explore some of the factors that explain their evolution.4 Our investigation begins by using the Oaxaca-Blinder method to decompose racial gaps in labor market outcomes into components that are explained by differences in observable characteristics—particularly age, education, marital status, and state of residence—across groups, and an unexplained component. We find that the large and persistent black-white unemployment rate gap is largely unexplained by observables. In contrast, the Hispanic-white unemployment gap—which is smaller, by comparison—is largely explained by lower educational attainment of (mostly foreign-born) Hispanics. Regarding labor force participation, the low participation rate of black men stands out, is largely unexplained by observables, and has shown little improvement over the last 40 years. As a result, the black-white male employment-to-population ratio gap—which reflects both the higher unemployment and lower participation rates of black men—is large and persistent, and is also little-explained by observables.
The paper then turns to the analysis of the underlying flows across labor force states in order to investigate the extent to which the observed differences in unemployment and participation rates across groups are driven by differences in job-losing rates versus job-finding rates, and by differences in labor force entry versus exit rates across groups. While a large part of the literature on labor market discrimination has focused on differences in hiring by race (see for example Bertrand and Mullainathan, 2004, and references therein), we find that blacks and Hispanics have particularly high job-losing rates relative to whites. Indeed, the racial gaps in the risk of job loss are the most important drivers of racial unemployment gaps and can also account for a major part of the differential cyclicality of unemployment. The labor force flows data also show that blacks among males and Hispanics among females experience disproportionately high labor force exit rates (especially from employment to nonparticipation), which signals their lower labor force attachment and in turn leads to lower labor force participation rates. In contrast, Hispanic males have above-average labor force entry rates (especially into employment), which helps explain their higher participation rates. Finally, blacks and Hispanics have more cyclical labor force entry and exit rates than whites.
3 The PTER series starts in 1994 to ensure consistency over time, as the Current Population Survey (CPS) underwent a major redesign in that year, which substantially affected measures of part-time work. 4 A large literature in labor economics has examined differences in various labor market outcomes across gender and race, often examining only two groups at a time, and mostly focusing on earnings gaps. For reviews of the literature, see, for example: Altonji and Blank (1999), Fryer (2011), and Lang and Lehmann (2012). See also Fairlie and Sundstrum (1999), Azmat, Guell, and Manning (2006), and Ritter and Taylor (2011).

3
Figure 1: Aggregate Labor Market Statistics by Group

4
The paper turns next to analyzing the degree of cyclicality of the racial gaps in unemployment and labor force participation. Specifically, we regress the racial gaps against an estimate of the aggregate output gap (an indicator of the aggregate business cycle). The black-white unemployment rate gap is strongly negatively related to the output gap, both for males and females. The estimated coefficients indicate that a 1 percentage point increase in the output gap (i.e. a stronger economy) is associated with roughly a ½ percentage point decline in the black-white unemployment rate gap, on average. For Hispanics, the relationship is also negative, but is smaller in magnitude (for both males and females). The racial gaps in the labor force participation rate exhibit some cyclicality, but substantially less than the unemployment rate gaps.
Overall, the cyclicality of the racial gaps in the unemployment rate indicates that, while all demographic groups are negatively affected by recessions, blacks and Hispanics are affected relatively more than whites (on average), for both men and women. By the same token, strong economic expansions not only “lift all boats,” but also help reduce disparities in unemployment across demographic groups. Indeed, the strong recovery of the labor market seen in the last few years appears to have contributed substantially to reducing the unemployment gaps, which had widened dramatically as a result of the Great Recession; although these gaps remain substantial.
The paper next asks whether there are meaningful differences across groups in the dynamic responses of the unemployment rate and participation rate to changes in aggregate economic activity. In particular, we estimate reduced-form Vector Autoregressions (VARs) of the unemployment rate (alternatively, the participation rate) and the aggregate output gap, separately for each demographic group, to look for differences across groups in the time it takes for the unemployment rate and participation rate to recover from a negative aggregate shock—as such differences would suggest that recessions may impact different groups at different phases of the aggregate business cycle. Our results confirm, first, that the unemployment rate is substantially more sensitive to a GDP shock for blacks and Hispanics than it is for whites. Furthermore, the effect of a negative GDP shock on the unemployment rate is especially persistent for black and Hispanic females. We also find a small (but nonzero) effect of a GDP shock on the participation rate; here, too, the effect is larger for blacks and Hispanics than for whites.
Finally, our analysis shifts to part-time employment for economic reasons (PTER, or involuntary part-time employment). Involuntary part-time employment is widely considered to be an important source of underutilization in the labor market that is not captured by either the unemployment rate or the labor force participation rate. Relative to whites of the same gender, we find that for Hispanics, education and occupation can explain a substantial portion of the discrepancy in involuntary part-time employment rates. However, substantial gaps remain for blacks and Hispanics relative to whites, even after controlling for our set of observables.
We turn then to examine the cyclicality of PTER. Involuntary part-time employment increases across demographic groups in recessions, but the incidence of involuntary part-time work was especially notable for Hispanic men and women at the trough of the Great Recession, nearing 12 percent of employment and almost double its rate before the recession. The subsequent recovery in PTER was especially slow for black men and women, peaking in 2013 rather than just after the recession as was the case with whites and Hispanics. We turn once again to labor market flows to probe the pronounced differences across groups in the cyclicality of PTER, focusing on black versus white men. The flows

5
analysis shows that PTER declined in the recovery more slowly for black males than for white males since the (net) movement from part-time to full-time work for black males was far less stable over time and was essentially non-existent from 2013 through 2016.
The rest of the paper is organized as follows. Following a brief description of our CPS data in Section 2, Section 3 turns to the Oaxaca-Blinder decompositions of racial gaps in the unemployment rate, labor force participation rate, and employment-to-population ratio. Section 4 analyzes the role of flows across labor force states in shaping these racial gaps. Section 5 examines the evolution of the racial gaps over the business cycle, as well as the dynamic response of the unemployment rate and participation rate of various demographic groups to aggregate output shocks. Section 6 turns to part-time employment for economic reasons (PTER), and Section 7 concludes.
2. Data
Our analysis is based on micro data from the Current Population Survey (CPS). The CPS is a monthly nationally representative survey of roughly 60,000 households conducted by the Bureau of Census for the Bureau of Labor Statistics (BLS). It is the survey from which official monthly statistics such as the unemployment rate, labor force participation rate, and others, are constructed.5 We use the information on race/ethnicity available in the CPS to create three mutually exclusive groups: non-Hispanic whites, non-Hispanic blacks, and Hispanics; and we break down each group further by gender.6 Our full dataset contains a total of just under 50 million individual monthly observations over the period 1976-2016. We focus on labor force status (employment, unemployment, labor force participation, and part-time employment for economic reasons, or PTER) as the key labor market outcomes of interest, and we follow the standard definitions of these variables used by the BLS. Furthermore, for the analysis of labor force flows presented in Section 4, and of PTER flows presented in Section 6, we longitudinally match individuals in the CPS in order to construct estimates of month-to-month transition probabilities among different labor market states using the matching procedure outlined in Nekarda (2009). Finally, the analysis of cyclicality of racial gaps presented in Section 5 uses estimates of the output gap constructed by the Congressional Budget Office (CBO); see CBO (2017).
Table 1 displays selected descriptive statistics for our six race-gender groups (for 4 different subperiods): the share of the adult population within each group that is prime-age (i.e. of age 25-54); the share with less than a high-school degree; the share with a college degree (or more); and the share that is married. Focusing on the latest subperiod (2007-2016), the table shows for example that Hispanic men and women are more likely to be in their prime-age years than either whites or blacks. Also, Hispanics are much more likely to lack a high-school degree, and are much less likely to have a college degree, than whites or blacks. Relative to whites, blacks are more likely to lack a high-school degree, and are less likely to have a college degree. Additionally, blacks—and especially black females—are much less likely to be married than whites or Hispanics.7
5 For details on the CPS, see the Bureau of Labor Statistics CPS site: https://www.bls.gov/cps/. 6 We drop Asians (and other smaller racial/ethnic groups) from our analysis because of their relatively small sample sizes, especially for the earlier years of the period we examine. 7 Table A1 in the Appendix shows the distribution of employed individuals across industries and occupations for each race-gender group.

6
Table 1: Selected Descriptive Statistics by Group
3. Decomposing Racial Gaps in Labor Force Status
3.1. Oaxaca-Blinder Decompositions
Labor force status differs greatly not only by gender and race/ethnicity, but also by age, educational attainment, and a slew of other observable individual characteristics. For example, prime-age individuals tend to participate in the labor force at higher rates than other age groups; and because Hispanic men are more likely to be of prime age, on average, than white men (who are more likely to be of retirement age), Hispanic men have relatively higher rates of labor force participation. Because we are interested in understanding the role that race and gender play in generating differences in labor force attachment and unemployment, a meaningful analysis must carefully control for the role of other observable characteristics.
The method we use to control for observable characteristics is the Oaxaca-Blinder (OB) decomposition. OB decomposes the difference in mean outcomes for two groups into a part that is explained by differences in observables and the remainder, or unexplained part. To fix ideas, suppose that the unemployment rates of two demographic groups, 𝐴𝐴 and 𝐵𝐵, depend on one individual characteristic, 𝑋𝑋. Group A’s unemployment rate rises (or falls) with 𝑋𝑋 at rate 𝛽𝛽𝐴𝐴, and group B’s unemployment rate rises (or falls) with 𝑋𝑋 at rate 𝛽𝛽𝐵𝐵. For example, 𝑋𝑋 could be age, and the coefficients 𝛽𝛽 would tell us how the unemployment rate varies with age for each of the two groups. Under this greatly simplified model, we can write average unemployment rates as follows:
White Black Hispanic White Black HispanicPrime-Age1976-1986 52.4 51.4 57.3 49.3 51.7 57.31987-1996 57.2 58.0 61.0 53.8 57.4 59.31997-2006 55.8 58.9 62.8 53.1 58.2 60.72007-2016 49.8 54.3 61.5 47.8 53.8 58.7
Less than High School 1976-1986 28.1 47.3 54.7 27.8 44.4 55.41987-1996 19.6 33.7 49.3 19.1 32.0 48.51997-2006 15.1 26.0 45.6 14.1 23.9 43.22007-2016 11.6 19.9 37.5 10.3 17.9 34.6
College Graduate1976-1986 19.6 7.3 7.1 13.3 7.5 5.31987-1996 24.0 10.5 8.2 18.7 10.7 7.21997-2006 27.8 13.5 9.4 24.5 15.0 9.82007-2016 31.4 16.6 11.6 30.8 19.5 13.4
Married (Spouse Present)1976-1986 65.8 46.3 59.1 59.7 34.7 54.51987-1996 62.8 41.9 53.8 56.9 29.9 50.81997-2006 60.0 40.0 51.1 55.3 28.8 49.92007-2016 56.8 36.7 47.9 53.2 26.9 45.8
Source: CPS microdata.
Period Average (Share) Male Female

7
𝑢𝑢𝐴𝐴��� = 𝛼𝛼𝐴𝐴 + 𝛽𝛽𝐴𝐴𝑋𝑋𝐴𝐴��� 𝑎𝑎𝑎𝑎𝑎𝑎 𝑢𝑢𝐵𝐵���� = 𝛼𝛼𝐵𝐵 + 𝛽𝛽𝐵𝐵𝑋𝑋𝐵𝐵����,
where variables with a bar denote the average, and 𝛼𝛼 denotes an intercept which may differ if one group’s unemployment rate is higher given their average 𝑋𝑋. The OB method then decomposes the average unemployment rate differences into an “explained” and “unexplained” component in the following way:
𝑢𝑢𝐴𝐴��� − 𝑢𝑢𝐵𝐵���� = 𝛽𝛽𝐴𝐴(𝑋𝑋𝐴𝐴��� − 𝑋𝑋𝐵𝐵����)���������"𝑒𝑒𝑒𝑒𝑒𝑒𝑒𝑒𝑒𝑒𝑒𝑒𝑒𝑒𝑒𝑒𝑒𝑒"
+ ( 𝛼𝛼𝐴𝐴 − 𝛼𝛼𝐵𝐵) + 𝑋𝑋𝐵𝐵����(𝛽𝛽𝐴𝐴 − 𝛽𝛽𝐵𝐵)�����������������"𝑢𝑢𝑒𝑒𝑒𝑒𝑒𝑒𝑒𝑒𝑒𝑒𝑒𝑒𝑒𝑒𝑒𝑒𝑒𝑒𝑒𝑒"
.
The first component of the preceding equation shows the difference in unemployment rates accounted for by the differences in means of the observable variable, which we term “explained”, following the literature.8 The second component accounts for the difference in unemployment rates determined by the wedge in the “return” to 𝑋𝑋 (i.e. the differences in the 𝛽𝛽 coefficients), or differences in the intercepts. Our OB decompositions presented in this section include the following set of controls: age, education, marital status, and state of residence.9
The literature on black-white wage differentials has often interpreted the “unexplained” component as reflecting discrimination in the labor market. We emphasize that this need not be the case and that caution must be exercised in interpreting the results from OB decompositions. For example, the unexplained component could reflect the effect of omitted control variables (i.e. other factors determining labor market outcomes that vary systematically across groups but that are not measured in the survey), rather than discrimination. On the other hand, even some of the differences in the control variables, and therefore in the explained component, could be the result of discrimination. In light of this last point, one might argue that age is the only variable that should be controlled for, as it is the only truly exogenous observable that is available. However, the literature on racial and gender wage gaps has typically also included education among its set of controls. Moreover, in an influential paper, Neal and Johnson (1996) argued that the racial skills gap is inadequately captured by controlling only for educational attainment, and that one should go further and additionally control for pre-market skills, as proxied for example by the Armed Forces Qualifying Test (AFQT) in the National Longitudinal Survey of Youth (NLSY79).10 In our view, the merits of including human capital measures in OB decompositions are not obvious, as gender and racial skills gaps themselves could reflect obstacles faced by some groups when investing in human capital, and these obstacles could potentially be related to the gaps present in the labor market.11 In this sense, one might actually be over-controlling by including education among 8 See, for instance, Oaxaca (1973), Blinder (1973), and Fortin, Lemieux, and Firpo (2011). 9 Our education variable has four categories (less than high school, high school graduates, some college, and college graduates) and the marital status variable has six categories (married with spouse absent, married with spouse present, separated, widowed, divorced, and never married/single). Note that we cannot control for industry or occupation here, because those variables are not reported consistently for the unemployed and individuals who are out of the labor force. We do control for industry and occupation when analyzing PTER in Section 6. We experimented with including a control for whether an individual is in a metropolitan area, but the variable had little effect and we decided to exclude it from out baseline specification. 10 Fryer (2011) and Ritter and Taylor (2011) find that pre-market skills as measured by AFQT scores have a substantially smaller effect on racial gaps in unemployment and nonemployment than on wages. 11 For example, women’s participation in the labor market might be affected by social gender norms or familial attitudes that differ across racial groups, and lower expected labor force participation might in turn influence educational attainment amongst women. Similarly, racial discrimination in the labor market can lead to income differences which in turn affect the ability of parents to invest in their children’s education.

8
variables that help explain racial and gender differences in labor market outcomes. In our analysis, we choose to follow much of the existing literature and include education in our OB decompositions, but we caution about interpretation.
Regarding marital status, we acknowledge that this variable might be influenced by labor market outcomes, or that both marital status and labor market outcomes might be caused by a third unobserved characteristic (for instance, time spent in prison). That said, marital status can also affect decisions to participate in the labor market due to household income considerations and we therefore include it among our controls; although here too, we caution about interpretation. Finally, we control for an individual’s state of residence, with the rationale that there may be persistent differences across states in population composition or labor market institutions, and that business cycles can have differential effects across states, especially in those with differing racial makeup.
In our analysis below, we use standard linear regression methods to estimate the coefficients and carry out the OB decompositions separately by year, for the period 1976-2016. The next subsections present our empirical findings.
3.1.1. Unemployment rate
Figure 2 shows the OB decomposition of the unemployment rate gaps (or differentials) for four pairs of groups: black vs. white males (top-left panel), black vs. white females (top-right), Hispanic vs. white males (bottom-left), and Hispanic vs. white females (bottom-right). We focus on differentials (as opposed to ratios) in unemployment rates between groups, because differentials (say, between groups A and B) are additive across labor market states; for example:
𝐸𝐸𝐸𝐸𝐸𝐸𝐸𝐸𝑡𝑡𝐴𝐴 − 𝐸𝐸𝐸𝐸𝐸𝐸𝐸𝐸𝑡𝑡𝐵𝐵 = (𝐿𝐿𝐿𝐿𝐸𝐸𝐿𝐿𝑡𝑡𝐴𝐴 − 𝐿𝐿𝐿𝐿𝐸𝐸𝐿𝐿𝑡𝑡𝐵𝐵)(1 −𝑈𝑈𝐿𝐿𝑡𝑡𝐵𝐵) − (𝑈𝑈𝐿𝐿𝑡𝑡𝐴𝐴 − 𝑈𝑈𝐿𝐿𝑡𝑡𝐵𝐵)𝐿𝐿𝐿𝐿𝐸𝐸𝐿𝐿𝑡𝑡𝐴𝐴,
where EPOP stands for the employment-to-population ratio, LFPR for the labor force participation rate, and UR for the unemployment rate.12
In all panels, the black line plots the total or “raw” gap, which is just the differential (in percentage points) of the unemployment rates of the two relevant groups. These gaps are decomposed into various components as described in the previous subsection.13
12 By contrast, ratios (i.e. relative differences) between groups are not additive, which can muddle the interpretation of results. Moreover, it is possible for, say, the relative unemployment rate gap (differential) to improve, even as the absolute unemployment rate gap as well as the relative and absolute EPOP gap deteriorate, while keeping the LFPR gap unchanged (indeed, something analogous occurred to the black-white gaps during the Great Recession). We therefore prefer to focus our analysis on absolute differences in outcomes between groups. 13 In this paper, all comparisons are across racial groups, but within the same gender. As we show later, racial gaps in labor market outcomes differ substantially by gender and thus ignoring the gender dimension would mask some important aspects of racial gaps.

9
Figure 2: Unemployment Rate Gaps
Starting with the black-white male and female gaps (the two top panels in Figure 2), the large blue area in the figures (which represents the unexplained component) indicates that differences in observable characteristics explain remarkably little of the black-white unemployment rate gaps. Moreover, the magnitude of the unexplained male black-white gap (top-left) has changed relatively little, on net, over the past four decades: it was 6 percentage points in 1976 and it has slowly edged down (on net) to 4 percentage points in 2016. The unexplained female black-white gap (top-right) has declined a bit more over this period—from more than 6 percentage points in 1976 to about 3 percentage points in 2016—with most of the decline taking place in the 1990s, when the labor market is generally viewed as having been very tight.14 The unexplained gap (and therefore also the raw gap, shown by the black line) also appears to vary substantially over the business cycle. We will return to the question of cyclicality in Section 5.
Moving to the Hispanic-white gaps (the two bottom panels), we see that for Hispanics—in contrast to blacks—an important part of the gap in unemployment rates is explained by differences in educational attainment (the green area). Indeed, for Hispanic males, the unexplained gap has virtually disappeared in recent years, and nearly all of the remaining raw gap (about 1 percentage point in 2016) is explained by differences in education. For Hispanic women, the unexplained gap (less than 1 percentage point in 2016) has narrowed somewhat, on net, over the period studied; and, in recent years, the unexplained
14 The welfare reform of 1996 could have played a role, too.

10
component and the part explained by differences in education have been about equally important. Furthermore, note that for both Hispanic males and females, observables other than education play a relatively small role.
To explore the role of education a bit further, we return to Table 1. As can be seen in the table, in 1976-1986 blacks and Hispanics lagged whites substantially in educational attainment: for example, for men, both blacks and Hispanics had a much larger share of individuals with no high-school degree (47.3 and 54.7 percent, respectively) than white males (28.1 percent). At the other end of the education spectrum, black and Hispanic men had a much lower share of college graduates (7.3 and 7.1 percent) than whites (19.6 percent). Over time, blacks have narrowed these gaps a fair bit—especially the no-high-school-degree gap (19.9 percent for black men vs. 11.6 percent for white men in 2007-2016); which largely explains the diminishing role of education in the black-white unemployment rate gaps seen in Figure 2. In sharp contrast, the Hispanic-white educational attainment gap has remained wide, contributing importantly to the unemployment rate gap in Figure 2 (for example, 37.5 percent of Hispanic men had no high-school degree in 2007-2016). As it turns out, the Hispanic-white education gap is driven to a large extent by inflows of Hispanic immigrants, who tend to have relatively low levels of education. For example, in 2012-2016 the share of those without a high school degree was 45 percent among foreign-born Hispanics but only 24 percent among native Hispanics (not shown in the table).
3.1.2. Labor force participation rate
Figure 3 shows OB decompositions for racial gaps in the labor force participation rate. As noted in the Introduction, black men have a lower participation rate than white men (by about 5 percentage points), while black women have a slightly higher participation rate than white women (see the black lines in Figure 3).15 For both males and females, differences in educational attainment serve to lower participation rates of blacks relative to whites; while differences in the age distribution raise participation rates of blacks relative to whites. Interestingly, the low marriage rates among blacks can account for a noticeable portion of participation rate gaps as well by depressing the black-white male gap and increasing the black-white female gap. Controlling for all observables (the blue area), the unexplained black-white participation rate gap for men is negative, substantial (about 5 percentage points), and persistent. For women, the unexplained black-white gap has always been smaller than for men, and more recently it has essentially vanished.
Moving to the Hispanic-white gap, we already noted that Hispanic men have a higher participation rate than white men (by about 8 percentage points in 2016), while Hispanic women used to have a lower participation rate than white women, but the gap has nearly disappeared in recent years. The role of observables is similar to the case of the black-white gaps (but larger in magnitude): differences in education (the green bars) partly account for the lower participation rates of Hispanics relative to whites, while differences in age (the orange bars) partly account for the higher participation rates of Hispanics relative to whites. Controlling for differences in observables (the blue area), the positive gap
15 Goldin (1977) and Boustan and Collins (2013) document that black women historically had much higher labor force participation rates than white women, which could be related to racial differences in stigma associated with women’s work and cultural norms rooted in slavery.

11
for males has been growing over time, and was about 4 percentage points in 2016. For females, the negative gap has been shrinking, and was only about -2 percentage points in 2016.
Figure 3: Participation Rate Gaps
Finally, Table 2 shows the distribution of reasons reported by individuals between 25 and 49 years of age for being out of the labor force (constructed from the CPS microdata).16 “Prime-age” women display a much higher propensity to be out of the labor force in order to take care of house or family than “prime-age” men, with some interesting differences by race. In particular, Hispanic women are almost twice as likely as white women to take care of house or family (25.7 and 14.2 percent, respectively), while black women have a substantially lower propensity to be out of the labor force due to house or family obligations (only 9.4 percent). This variation could reflect cultural differences, or differences in household incomes, and is likely related to investment in education (for example, low educated women are more likely to stay out of the labor force to take care of house or family; Hispanic women have on average lower educational attainment than white and black women as illustrated by the green bars in Figure 3). Among “prime-age” men, reported disability is the most important reason to stay out of the labor force and this reason is particularly prominent among black men.
16 The table is restricted to ages 25-49 because the survey question used to construct the reasons for being out of the labor force is consistently asked in the CPS only of individuals who are no older than 49. Here, we will refer to this group, loosely, as "prime age" (which is usually defined as 25-54 year olds).

12
Table 2: Reasons for Being out of the Labor Force (percent of population by group)
3.1.3. Employment-to-Population Ratio
Figure 4 shows the corresponding OB decompositions for racial gaps in employment-to-population ratios. As already noted, the employment-to-population ratio is the product of the participation rate and one minus the unemployment rate. Consequently, the decompositions in Figure 4 are essentially the (weighted) sum of the decompositions already seen in Figures 2 and 3. The magnitude of the black-white male gap is particularly striking, and reflects both the higher unemployment rate and lower participation rate of black men. Moreover, as seen in the figure, this gap is not explained by observables and has changed relatively little in the last 40 years. That said, it is also interesting to note that, despite this, the gap has narrowed some in the last few years and it is currently at its lowest level (about 7 percentage points) in this 40-year period.
Figure 4: Employment-to-Population Ratio Gaps
White Black Hispanic White Black Hispanic
Taking care of house or family 1.5 2.9 1.6 14.2 9.4 25.7Disabled 4.5 8.5 3.5 4.5 7.6 3.4In school 1.5 2.4 1.4 1.7 2.2 2.0Other 2.4 3.6 2.3 2.1 2.5 1.7
Memo: In the labor force 90.1 82.6 91.3 77.5 78.3 67.3
Note: data are averages in 2016 for individuals with 25-49 years.
Male Female

13
4. Labor Force Flows
In order to gain a better understanding of factors driving the racial differences in unemployment and labor force participation rates, we construct and examine measures of underlying labor force flows. Specifically, we follow the procedure described in Nekarda (2009) to longitudinally match individuals interviewed in the CPS in order to compute their month-to-month transition probabilities among different labor market states.17 These transition probabilities then help us assess the extent to which the observed differences in unemployment rates across racial groups are driven by the rates at which individuals in different groups lose their jobs versus the rates at which they find jobs. Similarly, we investigate the differences across groups in labor force entry and exit rates for shaping the observed gaps in labor force participation.
To start, Table 3 reports average values of labor force transition probabilities between employment (E), unemployment (U), and nonparticipation (N) for the period 1994-2016.18 As can be seen in the table, blacks and Hispanics have particularly high job-losing (employment-to-unemployment) rates relative to whites, while the relative differences in the job-finding (unemployment-to-employment) rates appear less pronounced. The labor force flows data also show that blacks among males and Hispanics among females experience disproportionately high labor force exit (especially employment-to-nonparticipation) rates, which signals their lower labor force attachment and in turn leads to lower labor force participation rates. In contrast, Hispanic males have above-average labor force entry rates to employment (nonparticipation-to-employment transition rates), which helps explain their high participation rates. In what follows, we systematically quantify how these differences in labor force transition probabilities translate into differences in unemployment and labor force participation rates.
Table 3: Labor Force Transition Probabilities by Race and Gender (percent, monthly)
17 In this section, we use CPS data from 1994 onwards; after the significant CPS redesign. 18 Annual time-series for the period 1976-2016 are shown in Appendix 2.
White Black Hispanic White Black HispanicEU (employment to unemployment) 1.2 2.3 2.2 1.0 1.7 1.7UE (unemployment to employment) 25.6 18.2 28.4 25.0 17.2 20.4EN (employment to nonparticipation) 2.1 3.4 2.5 3.1 3.7 4.8NE (nonparticipation to employment) 4.6 4.9 7.5 3.8 4.5 5.1UN (unemployment to nonparticipation) 18.5 24.8 19.5 24.5 28.7 31.7NU (nonparticipation to unemployment) 2.4 5.1 5.1 1.7 4.0 3.3
Memo: unemployment rate 5.1 11.8 7.7 4.6 10.1 8.6Memo: labor force participation rate 72.6 66.5 78.6 59.2 61.1 56.1
Note: data are averages 1994-2016.
Male Female

14
4.1 Labor Force Flows Decomposition: Unemployment Rate
As shown by Shimer (2012), labor force transition rates between employment (E), unemployment (U), and nonparticipation (N) can be used to calculate a steady-state approximation of the unemployment rate:
𝑢𝑢𝑡𝑡∗ =𝐸𝐸𝐸𝐸𝑡𝑡𝐸𝐸𝑈𝑈𝑡𝑡 + 𝐸𝐸𝐸𝐸𝑡𝑡𝐸𝐸𝑈𝑈𝑡𝑡 + 𝐸𝐸𝑈𝑈𝑡𝑡𝐸𝐸𝑈𝑈𝑡𝑡
𝐸𝐸𝐸𝐸𝑡𝑡𝐸𝐸𝑈𝑈𝑡𝑡 + 𝐸𝐸𝐸𝐸𝑡𝑡𝐸𝐸𝑈𝑈𝑡𝑡 + 𝐸𝐸𝑈𝑈𝑡𝑡𝐸𝐸𝑈𝑈𝑡𝑡 + 𝑈𝑈𝐸𝐸𝑡𝑡𝐸𝐸𝐸𝐸𝑡𝑡 + 𝐸𝐸𝑈𝑈𝑡𝑡𝑈𝑈𝐸𝐸𝑡𝑡 + 𝐸𝐸𝐸𝐸𝑡𝑡𝑈𝑈𝐸𝐸𝑡𝑡.
The above steady-state approximation matches the evolution of the unemployment rate by race in the data reasonably well. To assess the contribution of each flow for explaining the differences in racial unemployment gaps, we perform the following exercise: we keep the rest of the flows at the level for whites and set only the flow we are examining at the observed level for each racial group (as before, we calculate the results separately by gender). For example, if we set the EU transition rate at the level observed for black males and keep the rest of the flows at the levels observed for white males, this counterfactual will tell us the contribution of the white-black male EU transition rate differential to the observed white-black male unemployment differential:
𝑢𝑢𝑡𝑡𝐸𝐸𝐸𝐸,𝑐𝑐𝑐𝑐𝑢𝑢𝑒𝑒𝑡𝑡𝑒𝑒𝑐𝑐𝑐𝑐𝑒𝑒𝑐𝑐𝑡𝑡𝑢𝑢𝑒𝑒𝑒𝑒 =
𝐸𝐸𝐸𝐸�𝑡𝑡𝐸𝐸𝑈𝑈� 𝑡𝑡 + 𝐸𝐸𝐸𝐸�𝑡𝑡𝐸𝐸𝑈𝑈𝑡𝑡 + 𝐸𝐸𝑈𝑈� 𝑡𝑡𝐸𝐸𝑈𝑈𝑡𝑡𝐸𝐸𝐸𝐸�𝑡𝑡𝐸𝐸𝑈𝑈� 𝑡𝑡 + 𝐸𝐸𝐸𝐸�𝑡𝑡𝐸𝐸𝑈𝑈𝑡𝑡 + 𝐸𝐸𝑈𝑈� 𝑡𝑡𝐸𝐸𝑈𝑈𝑡𝑡 + 𝑈𝑈𝐸𝐸�𝑡𝑡𝐸𝐸𝐸𝐸�𝑡𝑡 + 𝐸𝐸𝑈𝑈� 𝑡𝑡𝑈𝑈𝐸𝐸�𝑡𝑡 + 𝐸𝐸𝐸𝐸�𝑡𝑡𝑈𝑈𝐸𝐸�𝑡𝑡
,
𝑢𝑢𝑡𝑡𝐸𝐸𝐸𝐸,𝑐𝑐𝑐𝑐𝑒𝑒𝑡𝑡𝑐𝑐𝑒𝑒𝑐𝑐𝑢𝑢𝑡𝑡𝑒𝑒𝑐𝑐𝑒𝑒 = 𝑢𝑢𝑡𝑡
𝐸𝐸𝐸𝐸,𝑐𝑐𝑐𝑐𝑢𝑢𝑒𝑒𝑡𝑡𝑒𝑒𝑐𝑐𝑐𝑐𝑒𝑒𝑐𝑐𝑡𝑡𝑢𝑢𝑒𝑒𝑒𝑒 − 𝑢𝑢�𝑡𝑡∗,
where 𝑋𝑋𝑋𝑋�𝑡𝑡 denotes the transition rate between labor force states X and Y for the base group (white males in this example), 𝐸𝐸𝑈𝑈𝑡𝑡 denotes the EU transition rate for the analyzed group (black males), and 𝑢𝑢�𝑡𝑡∗ is the steady-state unemployment rate approximation for the base group (white males). Because of the nonlinearities in the steady-state approximation equation, the above flow decomposition is not exact and will thus yield a remaining cross-term, defined as:
𝑢𝑢𝑡𝑡𝑐𝑐𝑐𝑐𝑐𝑐𝑐𝑐𝑐𝑐−𝑡𝑡𝑒𝑒𝑐𝑐𝑡𝑡 𝑐𝑐𝑐𝑐𝑒𝑒𝑡𝑡𝑐𝑐𝑒𝑒𝑐𝑐𝑢𝑢𝑡𝑡𝑒𝑒𝑐𝑐𝑒𝑒 = (𝑢𝑢𝑡𝑡∗ − 𝑢𝑢�𝑡𝑡∗) −�𝑢𝑢𝑡𝑡𝑋𝑋𝑋𝑋,𝑐𝑐𝑐𝑐𝑒𝑒𝑡𝑡𝑐𝑐𝑒𝑒𝑐𝑐𝑢𝑢𝑡𝑡𝑒𝑒𝑐𝑐𝑒𝑒 .
We calculate the contribution of each flow to the raw unemployment rate differential in each year during 1994-2016.
The results of the flows decomposition of the racial unemployment rate gaps are summarized in Figure 5, which plots the contribution of UE, EU, net NE (NE minus EN), and net NU (NU minus UN) flows as well as the contribution of the remaining cross-term. With the exception of Hispanic males, it is notable that all flows contribute positively to the unemployment rate gaps. However, consistent with the differentials in average flows as presented earlier in Table 3, the job-separation rate (EU, orange bars) appears to be the most important driver of racial unemployment rate gaps and it also accounts importantly for increases in these gaps during recessions. One exception is the black-white unemployment rate gap for women, which is importantly affected by the net NU flow (pink bars); black women have a much higher probability of NU transitions compared to white women, while the UN probability differs little among these two groups (Table 3). The job-finding rate (UE, blue bars) can account for comparatively little in explaining racial unemployment rate gaps; indeed, Hispanic men even have a slightly higher probability of finding a job than white men, which helps narrow a touch their unemployment rate gap relative to white men.

15
Figure 5: Flows Decomposition of the Unemployment Rate Gaps
4.2 Labor Force Flows Decomposition: Labor Force Participation Rate
Labor force transition probabilities can also be used to calculate the steady-state approximation of the labor force participation rate (see Shimer, 2012):
𝑙𝑙𝑙𝑙𝑙𝑙𝑙𝑙𝑡𝑡∗ =𝐸𝐸𝐸𝐸𝑡𝑡𝐸𝐸𝑈𝑈𝑡𝑡 + 𝐸𝐸𝐸𝐸𝑡𝑡𝐸𝐸𝑈𝑈𝑡𝑡 + 𝐸𝐸𝑈𝑈𝑡𝑡𝐸𝐸𝑈𝑈𝑡𝑡 + 𝑈𝑈𝐸𝐸𝑡𝑡𝐸𝐸𝐸𝐸𝑡𝑡 + 𝐸𝐸𝑈𝑈𝑡𝑡𝑈𝑈𝐸𝐸𝑡𝑡 + 𝐸𝐸𝐸𝐸𝑡𝑡𝑈𝑈𝐸𝐸𝑡𝑡
𝐸𝐸𝐸𝐸𝑡𝑡𝐸𝐸𝑈𝑈𝑡𝑡 + 𝐸𝐸𝐸𝐸𝑡𝑡𝐸𝐸𝑈𝑈𝑡𝑡 + 𝐸𝐸𝑈𝑈𝑡𝑡𝐸𝐸𝑈𝑈𝑡𝑡 + 𝑈𝑈𝐸𝐸𝑡𝑡𝐸𝐸𝐸𝐸𝑡𝑡 + 𝐸𝐸𝑈𝑈𝑡𝑡𝑈𝑈𝐸𝐸𝑡𝑡 + 𝐸𝐸𝐸𝐸𝑡𝑡𝑈𝑈𝐸𝐸𝑡𝑡 + 𝐸𝐸𝑈𝑈𝑡𝑡𝑈𝑈𝐸𝐸𝑡𝑡 + 𝑈𝑈𝐸𝐸𝑡𝑡𝐸𝐸𝐸𝐸𝑡𝑡 + 𝑈𝑈𝐸𝐸𝑡𝑡𝐸𝐸𝐸𝐸𝑡𝑡.
Using this equation, we calculate analogous counterfactuals and flows decompositions of the racial labor force participation rate gaps. The results are presented in Figure 6, which plots the contribution of NE, EN, UN, NU, net UE (UE minus EU) flows, as well as the contribution of the remaining cross-term. The decomposition shows that disproportionately high labor force exit from employment (EN, orange bars) for black males can account for their lower labor force attachment and lower labor force participation rates. In contrast, Hispanic males benefit from relatively high labor force entry rates through employment (NE, blue bars), which helps explain their high participation rates. Finally, labor force entry and exit rates appear to push up somewhat the participation rates of blacks and Hispanics relative to whites in good economic times, although the effect is limited.

16
Figure 6: Flows Decomposition of the Labor Force Participation Rate Gaps
4.3 Labor Force Flows and Observables
In section 3 we examined how much observable characteristics contribute to racial unemployment and labor force participation rate gaps, while in this section we analyzed how labor force flows can account for these gaps. Obviously, the two approaches are not unrelated. In Appendix 3, we provide OB decompositions of labor force flows and also calculate flows decompositions of the unexplained racial unemployment and labor force participation rate gaps. The results are intuitive: lower educational attainment (especially among Hispanics) contributes to higher EU transition rates and thus higher unemployment rates. Similarly, given that blacks and Hispanics are younger than whites, age contributes to their higher labor force entry transition rates. That said, observables cannot explain the entire differentials in labor force transition probabilities and the flows decomposition of the unexplained racial unemployment and participation rate gaps qualitatively resembles the decompositions shown in the previous two subsections.

17
5. Cyclicality of Racial Gaps in Labor Force Status
This section turns to the question of the differential sensitivity of the unemployment and participation rates across demographic groups to the aggregate business cycle. To examine this, we first look at how the racial gaps presented in Section 3 are related to the business cycle, and we then examine the dynamic response of the racial gaps in the unemployment rate and participation rate to negative shocks in aggregate output using a Vector Autoregression (VAR) framework.
5.1. Cyclicality of Unemployment Rate and Participation Rate Gaps
As previously noted, both the raw and unexplained (by observable characteristics) unemployment rate gaps in Figure 2 appear to be countercyclical: they widen in recessions and narrow in expansions. To explore this relationship further, in this section we regress the unemployment rate gaps from Figure 2 against an estimate of the aggregate output gap (i.e. the deviation of Gross Domestic Product (GDP) from potential GDP, expressed as a percent of potential GDP)—a standard measure of the state of the business cycle. We use the estimates of the output gap produced by the Congressional Budget Office (CBO).19 The estimated coefficients on the output gap variable are reported in Table 4. Confirming the visual impression from Figure 2, the black-white unemployment rate gaps are strongly negatively related to the output gap, for both males and females. The estimated coefficients indicate that a 1 percentage point increase in the output gap (i.e. a stronger economy) is associated with roughly a ½ percentage point decline in the black-white unemployment rate gap. The relationship is a little larger for the raw unemployment rate gap (Panel A) than for its unexplained component (Panel B). For Hispanics, the relationship is also negative, but is smaller in magnitude for both males and females (and is not statistically different from zero for the unexplained gap).
Overall, the cyclicality of the racial gaps in the unemployment rate indicates that, while all demographic groups are negatively affected by recessions, blacks and Hispanics are affected relatively more than whites (on average), for both men and women. By the same token, strong economic expansions appear to not just “lift all boats,” but also help reduce disparities in unemployment across demographic groups. Interestingly, as seen in Figure 2, the male black-white unexplained unemployment rate gap, which climbed to 8 percentage points in the wake of the Great Recession, subsequently fell to about 4 percentage points in 2016—its lowest level in four decades. The unemployment rate gaps (raw and unexplained) for the other groups were also at relatively low levels (by historical standards) in 2016, after widening markedly around 2008-2011. Indeed, the strong recovery of the labor market seen in the last few years appears to have contributed substantially to reducing these unemployment rate gaps—which had widened dramatically as a result of the Great Recession. That said, despite their narrowing in recent years, the gaps remain substantial.
19 See Congressional Budget Office (2017).

18
Table 4: Cyclicality of Unemployment Rate Gaps
Compared to the unemployment rate gaps, visual inspection of Figure 3 suggests a much lower degree of cyclicality in the participation rate gaps. This is confirmed by Table 5, which reports estimated coefficients from regressions of the participation rate gap on the aggregate output gap, similar to those previously reported in Table 4 for the unemployment rate gap. As can be seen, the estimated coefficients are small and, in most cases, not statistically different from zero.
Table 5: Cyclicality of Participation Rate Gaps
5.2. Dynamic Responses of Unemployment Rate and Participation Rate
The previous subsection showed that the unemployment rate and participation rate of different demographic groups have a substantially different degree of sensitivity to the business cycle. This subsection goes one step further to examine whether there are meaningful differences across groups in the dynamics of the response of these labor market outcomes to changes in aggregate economic activity.
Male Female Male FemaleBlack-White Black-White Hispanic-White Hispanic-White
Gap Gap Gap Gap
-0.65*** -0.38** -0.31*** -0.21**(0.11) (0.15) (0.10) (0.09)
-0.44*** -0.29* -0.07 -0.09(0.09) (0.15) (0.07) (0.08)
* p<0.10, ** p<0.05, *** p<0.01
Panel A - Dependent Variable: Raw Unemployment Rate Gaps
Panel B - Dependent Variable: Unexplained Unemployment Rate Gaps
Reported coefficients are coefficients on the GDP gap. Standard errors are in parentheses.
Male Female Male FemaleBlack-White Black-White Hispanic-White Hispanic-White
Gap Gap Gap Gap
0.01 0.24*** -0.02 -0.09(0.07) (0.09) (0.16) (0.14)
-0.03 0.10 -0.06 -0.16(0.06) (0.10) (0.15) (0.18)
* p<0.10, ** p<0.05, *** p<0.01
Panel A - Dependent Variable: Raw Participation Rate Gaps
Panel B - Dependent Variable: Unexplained Participation Rate Gaps
Reported coefficients are coefficients on the GDP gap. Standard errors are in parentheses.

19
In particular, we study whether there are significant differences in the time it takes for the unemployment rate and participation rate of different groups to recover from a negative aggregate shock, which would suggest that economic recessions may impact groups differently at different points of the business cycle.
To draw out the dynamic correlations between GDP and labor market outcomes, we estimate the following reduced-form Vector Autoregression (VAR) of length 𝐿𝐿 (eight quarters), separately for each demographic group 𝑔𝑔 relative to whites of the same gender, as we have done above:
�𝑍𝑍𝑔𝑔𝑡𝑡
𝐺𝐺𝐺𝐺𝐸𝐸𝐺𝐺𝐴𝐴𝐸𝐸𝑡𝑡� = � 𝛼𝛼
𝑧𝑧
𝛼𝛼𝑔𝑔𝑒𝑒𝑒𝑒� + �𝐴𝐴(𝑗𝑗) �𝑍𝑍𝑔𝑔,𝑡𝑡−𝑗𝑗
𝐺𝐺𝐺𝐺𝐸𝐸𝐺𝐺𝐴𝐴𝐸𝐸𝑡𝑡−𝑗𝑗�
𝐿𝐿
𝑗𝑗=1
+ �𝜀𝜀𝑔𝑔𝑡𝑡𝑧𝑧
𝜀𝜀𝑔𝑔𝑡𝑡𝑔𝑔𝑒𝑒𝑒𝑒�,
where 𝐴𝐴(𝑗𝑗) are coefficient vectors for lags 𝑗𝑗 = 1, … , 𝐿𝐿; and where Zgt is the gap between either the unemployment or labor force participation rate of group g and whites of the same gender.20 We trace out the estimated impulse response of the unemployment rate and participation rate to a 1 percentage point negative shock to the GDP gap (𝜀𝜀𝑔𝑔𝑡𝑡
𝑔𝑔𝑒𝑒𝑒𝑒) for the four labor market outcome gaps. Figure 7 shows the resulting impulse responses for the unemployment rate gaps.21 The impulse responses echo the results presented in Table 4: the cyclical response of the unemployment rate is larger for blacks and Hispanics than for whites. For instance, the peak increase in the unemployment rate for black men in excess of that for white men (the top-left panel) is roughly ½ percentage point. Indeed, the relative difference in the amplitude of the unemployment rate responses for all groups, relative to whites of the same gender, is strikingly similar.
After reaching its peak, the unemployment rate gap remains persistently elevated for some time for all groups. For instance, for black men, the lower bound of the confidence interval reaches zero (when the unemployment rate gap is no longer statistically significant) after 2½ years. The recovery in the unemployment rate is slowest for black females, however, with the unemployment rate gap remaining statistically significant (and the point estimate at nearly ¼ percentage point) through almost four years. While the unemployment rate gaps peak after about five quarters for black men and women, the responses are slightly less persistent for Hispanics, which reach their peak at about three quarters after the shock. In addition, the unemployment rate gap for Hispanic men is no longer statistically indistinguishable from zero after about seven quarters, a slightly faster recovery than seen in the impulse responses for other groups.22
20 We impose the restriction that the lags of the labor market outcome gap, 𝑍𝑍𝑔𝑔𝑡𝑡, do not feedback to the GDP gap by constraining the relevant coefficients in the matrix 𝐴𝐴 to equal zero. The estimated impulses responses without the restriction are qualitatively similar. We also include a set of quarter dummy variables in the estimated system to control parsimoniously for any seasonal patterns in the labor market outcome gaps. 21 We show the impulse response for the labor force participation rate gaps in the appendix (Appendix 5, Figure A13), as the results did not suggest statistically significant dynamic responses for most groups (similar to the results in Table 5 above). 22 In Appendix 5 (Figure A14) we also present results for a similar exercise that uses only the unexplained component (from the Oaxaca-Blinder decomposition) of the unemployment rate gap. For this purpose, we construct quarterly unexplained components of the gaps for group i by assuming that the unexplained share of a quarterly gap is
constant within a year: 𝑈𝑈𝐿𝐿𝐺𝐺𝐴𝐴𝐸𝐸𝑞𝑞𝑒𝑒 = �𝑈𝑈𝐿𝐿𝑞𝑞𝑒𝑒 − 𝑈𝑈𝐿𝐿𝑞𝑞𝑤𝑤� ∗ (𝐸𝐸𝑒𝑒𝑒𝑒𝑒𝑒𝑒𝑒𝑒𝑒𝑒𝑒𝑒𝑒𝑒𝑒𝑒𝑒𝑒𝑒𝑎𝑎𝑖𝑖
𝑇𝑇𝑐𝑐𝑡𝑡𝑒𝑒𝑒𝑒 𝐺𝐺𝑒𝑒𝑒𝑒𝑎𝑎𝑖𝑖). As can be seen in the appendix, the cyclical

20
Figure 7: Unemployment Rate Racial Gap Response to GDP Gap Shock
6. Part-Time for Economic Reasons (PTER)
We next look at another labor market outcome that reflects the intensive, rather than extensive, margin of employment: part-time employment for economic reasons (PTER).23 This indicator has received a great deal of attention in recent years because, while the unemployment rate declined steadily over the course of the recovery from the Great Recession, PTER was much slower to recover, and many analysts pointed to elevated involuntary part-time employment as a source of continued weakness in the labor market even as other indicators returned towards their pre-recession levels. (See Valetta, Bengali, and van der List (2015) for more detail on the determinants of PTER.)
responses for black males, black females, and Hispanic females are quite similar to those constructed using the total (raw) gaps, although slightly muted. There does not appear to be much of an effect for Hispanic males.
23 The BLS defines persons working part-time for economic reasons as a subset of those working part-time (i.e. 1 to 34 hours). The subset is defined as those reporting an economic reason for part-time employment, such as slack work or unfavorable business conditions, inability to find full-time work, or seasonal declines in demand. As already noted in the Introduction, the CPS survey underwent a major redesign in 1994, which substantially affected measures of part-time work. To ensure consistency over time in the measure of PTER, we restrict the sample to 1994-2016 for this part of the analysis.

21
As can be seen in Figure 1 (bottom panels), perhaps the most striking feature of PTER during the Great Recession was the dramatic increase experienced by Hispanics (both men and women). The PTER gap (relative to whites of the same gender, the black lines in Figure 8) soared to 7 percentage points for Hispanic men and to 6 percentage points for Hispanic women—substantially more than the increase in the black-white PTER gaps. Figure 8 follows our methodology from Section 3 and decomposes the PTER gaps using the OB method.24 As can be seen in the figure, observables (age, education, industry, occupation, state of residence, and marital status) can explain much of the Hispanic-white PTER gaps, as well as some of the increase during the Great Recession. That said, the unexplained part has also played some role for both the Hispanic-white and the black-white PTER gaps.
Figure 8: Part-time for Economic Reasons Gaps
Our analysis of PTER by race also sheds light on the different cyclicality of labor market outcomes across demographic groups. While PTER for all groups rose substantially during the previous recession, for white and Hispanic men, the rates of PTER began to decline immediately following the end of the recession in 2009 (both for the raw gap or the demographically-controlled unexplained gap). For black men, however, involuntary part-time employment rose substantially through 2013 and only started to recover during the strong labor market expansion in 2014-2015. As a consequence, the black-white male PTER gap (the top-
24 The OB regressions here include, in addition to the covariates included in our previous regressions, controls for industry and occupation.

22
left panel of Figure 8), reached about 2½ percentage points in 2013—even after controlling for observables (the blue bars).
In Section 4, we documented that differences across groups in labor force flows can leave an important imprint on the unemployment rate and participation rate gaps. Here we examine labor force flows to shed light on the differences in the cyclicality of PTER, focusing on black vs. white men, following the methodology in Cajner et al. (2014). In particular, we decompose the change in PTER into the contribution of workers moving between involuntary part-time employment and other labor market states, such as unemployment or nonparticipation. For example, the blue bars in Figure 9 show the year-over-year change in PTER accounted for by a net movement into PTER from full-time employment; this flow was substantially positive during the recession as hours were cut and what were full-time jobs became involuntarily part-time.25
What caused the dramatically different patterns in post-recession recovery in involuntary part-time work for black vs. white men? The main culprit appears to be that black men did not reliably transition back into full-time employment from PTER after the recession. For white men, the picture is much more stable; every year after the recession, part-time workers transitioned, on net, back into full-time employment. For black men, the return to full-time work essentially stalled in 2013, so that the total stock of black men working PTER stalled as well and remains substantially elevated.
Figure 9: Decomposition of White and Black Male PTER
7. Concluding Remarks
In this paper, we examine the evolution of racial gaps in employment, unemployment, labor force participation, and involuntary part-time employment, for both men and women, over the past four decades, as well as the evolution of these gaps over the business cycle. We find that over this period, blacks have experienced substantially higher and more cyclical unemployment rates than whites, and that observable characteristics are unable to explain much of this differential, which is largely driven by comparatively higher risk of job loss among blacks. In contrast, the Hispanic-white unemployment gap is 25 In Figure 9, the black line shows the level of PTER workers, in thousands. The blue bars depict the contribution of the (net) transitions between full-time employment and PTER employment to the change in the number of PTER workers. The orange bars depict the contribution of all other transitions to the change in the number of PTER workers.

23
comparatively smaller and can be largely explained by lower educational attainment of (mostly foreign-born) Hispanics. Furthermore, we find that the low participation rate of black men is largely unexplained by observables, is driven by high labor force exit rates from employment, and has shown little improvement over the last 40 years. Furthermore, even among those who work, blacks and Hispanics are more likely than whites to work part-time schedules despite wanting to work additional hours, and the racial gaps in this involuntary part-time employment are considerable even after controlling for observable characteristics.
Of course, one possible reason for the inability of observables to explain more of the racial gaps in labor market outcomes is that the set of control variables available in the CPS is imperfect. Indeed, the existing literature has found that the racial skills gap is inadequately captured by measures of educational attainment only; for example, in a seminal paper, Neal and Johnson (1996) argued that pre-market skills, as proxied by the Armed Forces Qualifying Test (AFQT) in the National Longitudinal Survey of Youth (NLSY79), play an important role in explaining racial wage gaps. However, pre-market skills as measured by AFQT scores have been found to play a much smaller role for racial gaps in unemployment and nonemployment than for wages (Fryer 2011; Ritter and Taylor, 2011). Thus, while better understanding the factors that lead to existing racial skills gaps remains an important task for future research, it is unlikely to fully explain the gaps in the labor market outcomes examined in this paper. Moreover, racial skill gaps themselves could reflect obstacles faced by some racial groups when investing in human capital, and these obstacles could be related to the gaps present in the labor market. In this sense, our analysis might actually be “over-controlling” by including education among variables that can explain racial heterogeneity in labor market outcomes.
Another possible explanation for the large unexplained racial gaps examined in this paper is personal or institutional discrimination. While Title VII of the Civil Rights Act prohibits employers from discriminating against employees on the basis of race and sex, empirical evidence suggests that at least some discrimination is present in the labor market (Darity and Mason, 1998). For example, an influential study by Bertrand and Mullainathan (2004) sent fictitious resumes to help-wanted ads in Boston and Chicago during 2001 and 2002, and found that resumes with randomly assigned names with relatively high prevalence among whites received 50 percent higher callback for interviews than identical resumes with names with relatively high occurrence among African Americans.
Yet another factor that is likely to play a role, at least for black-white male gaps, is incarceration. As is well-known, incarceration rates in the United States are much higher than in other advanced economies, and are particularly elevated among black men. For example, at the onset of the Great Recession, an estimated 8 percent of black men of ages between 18 and 64 were in prison, compared to about 1 percent for whites, and 2¾ percent for Hispanics (Pew Charitable Trusts, 2010). Not surprisingly, research has shown that incarceration reduces the future labor force participation and employment prospects of the affected population; see Holzer, Offner, and Sorensen (2005), and references therein.
At any rate, regardless of the causal origins of the large racial gaps present in the labor market, our analysis suggests that disadvantaged groups (e.g. groups with higher average unemployment rates) are even more negatively affected by recessions than other groups; and that strong economic expansions help reduce the gaps across demographic groups. Indeed, the robust recovery of the labor market in the last few years appears to have contributed significantly to reducing the economic disparities that had widened dramatically as a result of the Great Recession. That said, the disparities remain substantial.

24
References
Altonji, Joseph G. and Rebecca M. Blank (1999): “Race and Gender in the Labor Market,” Handbook of Labor Economics, vol. 3, ch. 48, pp. 3143-3259.
Azmat, Ghazala, Maia Güell, and Alan Manning (2006): “Gender Gaps in Unemployment Rates in OECD Countries,” Journal of Labor Economics, vol. 24(1), pp. 1-37.
Bertrand, Marianne and Sendhil Mullainathan (2004): “Are Emily and Greg More Employable Than Lakisha and Jamal? A Field Experiment on Labor Market Discrimination," American Economic Review, vol. 94(4), pp. 991-1013.
Blinder, Alan S. (1973): “Wage Discrimination: Reduced Form and Structural Estimates,” The Journal of Human Resources, vol. 8(4), pp. 436-455.
Boustan, Leah Platt, and William J. Collins (2013): “The Origins and Persistence of Black-White Differences in Women’s Labor Force Participation,” NBER Working Paper No. 19040.
Cajner, Tomaz, Dennis Mawhirter, Christopher Nekarda, and David Ratner. (2014). “Why is Involuntary Part-Time Work Elevated?” FEDS Notes, Federal Reserve Board, April 14.
Congressional Budget Office (2017): “The Budget and Economic Outlook: 2017 to 2027,” available at: https://www.cbo.gov/publication/52370.
Darity, William A. Jr. and Patrick L. Mason (1998): “Evidence on Discrimination in Employment: Codes of Color, Codes of Gender,” The Journal of Economic Perspectives, vol. 12(2), pp. 63-90.
Fairlie, Robert W. and William A. Sundstrum (1999): "The Emergence, Persistence, and Recent Widening of the Racial Unemployment Gap," ILR Review, vol. 52(2), pp. 252-270.
Fortin, Nicole, Thomas Lemieux, and Sergio Firpo (2011): “Decomposition Methods in Economics,” Handbook of Labor Economics, vol. 4a, ch. 1, pp. 1-102.
Fryer, Roland G. Jr. (2011): “Racial Inequality in the 21st Century: The Declining Significance of Discrimination,” Handbook of Labor Economics, vol. 4b, ch. 10, pp. 855-971.
Goldin, Claudia (1977): “Female Labor Force Participation: The Origin of Black and White Differences, 1870 and 1880,” The Journal of Economic History, vol. 37(1), pp. 87-108.
Holzer, Harry, Paul Offner, and Elaine Sorensen (2005): “Declining Employment among Young Black Less-Educated Men: The Role of Incarceration and Child Support,” Journal of Policy Analysis and Management, Vol. 24, No. 2, pp. 329-350.
Lang, Kevin and Jee-Yeon K. Lehmann (2012): “Racial Discrimination in the Labor Market: Theory and Empirics,” Journal of Economic Literature, vol. 50(4), pp. 1-48.
Neal, Derek A. and William R. Johnson (1996): “The Role of Pre-Market Factors in Black-White Wage Differences,” Journal of Political Economy, vol. 104, pp. 869-895.
Nekarda, Christopher J. (2009): “A Longitudinal Analysis of the Current Population Survey: Assessing the Cyclical Bias of Geographic Mobility,” working Paper, accessible online at chrisnekarda.com.

25
Oaxaca, Ronald (1973): “Male-Female Wage Differentials in Urban Labor Markets,” International Economic Review, vol. 14(3), pp. 693-709.
The Pew Charitable Trusts (2010): “Collateral Costs: Incarceration’s Effect on Economic Mobility.” Washington, DC: The Pew Charitable Trusts.
Ritter, Joseph A. and Lowell J. Taylor (2011): “Racial Disparity in Unemployment,” The Review of Economics and Statistics, vol. 93(1), pp. 30-42.
Shimer, Robert (2012): “Reassessing the Ins and Outs of Unemployment,” Review of Economic Dynamics, vol. 15(2), pp. 127-148.
Valetta, Robert G., Leila Bengali, and Catherine van der List (2015). “Cyclical and Market Determinants of Involuntary Part-Time Employment,” Federal Reserve Bank of San Francisco Working Paper 2015-19.

26
Appendix 1. Industry and Composition by Race and Gender
Table A1: Industry and Occupation Composition (Shares)
Industry White Black Hispanic White Black Hispanic White Black Hispanic White Black HispanicAgriculture, Forestry, & Fisheries 5.1 1.7 4.0 0.7 7.1 2.1 3.4 1.6 1.6 0.2 7.3 1.6Mining 1.5 0.3 0.5 0.2 1.3 0.3 1.1 0.2 0.5 0.1 1.0 0.1Construction 10.1 1.3 8.3 0.4 10.3 0.6 11.3 1.6 6.3 0.6 19.0 1.2Nondurable Manufacturing 8.7 7.4 10.4 9.2 10.3 14.3 4.8 2.9 5.5 2.8 5.1 4.4Durable Manufacturing 16.4 7.3 16.9 7.0 16.7 10.4 10.1 3.5 7.5 2.7 7.3 3.5Transportation, Communications, & Other Public Utilities 9.1 4.0 12.6 5.3 7.9 3.6 9.2 3.5 14.9 5.4 9.0 3.8Wholesale Trade 5.5 2.7 3.7 1.1 4.4 2.7 3.7 1.7 2.9 0.9 3.4 1.8Retail Trade 14.1 21.1 11.9 11.8 15.8 17.5 15.4 18.0 18.0 17.0 19.2 22.8Finance, Insurance, & Real Estate 4.7 8.4 3.5 6.0 3.5 7.0 6.3 8.3 4.4 6.6 3.6 6.4Business & Repair Services 4.4 2.9 4.9 2.6 5.7 3.0 8.2 5.2 9.1 5.6 8.5 7.6Personal Services 1.9 7.0 3.0 12.8 3.0 10.0 1.3 4.0 2.6 4.1 2.3 7.9Entertainment & Recreation Services 1.2 1.1 1.2 0.6 1.3 0.8 2.4 2.2 2.1 1.3 1.8 1.7Professional & Related Services 12.4 31.0 13.0 36.1 8.8 24.1 17.6 43.2 18.3 45.5 9.3 33.3Public Administration 4.9 3.7 6.1 6.3 3.9 3.8 5.2 4.2 6.5 7.2 3.1 3.7OccupationManagement, Business, Science, & Arts 1.3 1.0 0.6 0.8 0.6 0.7 2.6 3.3 1.7 2.8 1.1 1.9Business Operations Specialists 1.8 1.2 0.6 0.8 0.8 0.8 2.5 3.0 1.5 2.5 0.9 1.7Financial Specialists 1.3 0.6 0.5 0.4 0.4 0.3 4.5 1.5 2.7 1.3 1.5 0.6Computer & Mathematical 4.0 0.3 1.0 0.1 1.4 0.2 3.6 0.6 1.4 0.2 1.2 0.3Architecture & Engineering 0.9 0.2 0.5 0.2 0.5 0.2 0.7 0.1 0.5 0.1 0.3 0.1Technicians 1.7 0.8 0.8 0.5 0.7 0.4 1.2 1.1 0.6 0.5 0.4 0.5Life, Physical, & Social Science 1.1 1.1 1.1 2.0 0.6 1.2 1.4 2.4 2.2 3.6 0.7 2.0Community & Social Services 1.2 0.3 0.3 0.1 0.2 0.2 1.7 1.7 0.6 1.0 0.4 0.9Legal 3.1 7.9 1.7 7.1 1.2 5.1 4.0 11.9 2.9 7.9 1.6 6.8Education, Training, & Library 1.9 1.7 0.9 0.5 1.0 0.9 2.7 2.6 1.6 0.9 1.3 1.3Arts, Design, Entertainment, Sports, & Media 2.2 6.3 1.1 5.3 1.2 2.8 3.3 10.7 2.5 8.7 1.4 4.6Healthcare Practitioners & Technical 0.3 3.0 1.1 7.1 0.4 3.1 0.5 3.9 1.5 9.6 0.5 5.3Healthcare Support 2.8 0.4 3.6 0.6 1.8 0.4 3.8 0.9 5.7 2.4 2.7 1.0Protective Service 2.9 7.9 4.1 7.4 6.1 6.9 4.2 6.8 6.7 6.4 8.6 9.8Food Preparation & Serving 4.2 2.8 10.4 13.5 7.7 7.9 3.8 2.2 6.4 4.2 9.3 10.3Building & Grounds Cleaning & Maintenance 1.0 5.6 1.4 3.9 1.1 4.7 1.5 5.9 2.6 7.1 1.4 7.4Personal Care & Service 10.7 13.2 3.8 6.7 5.5 10.1 13.4 12.7 9.2 11.9 8.3 13.0Sales & Related 6.6 32.6 8.1 24.6 6.1 26.2 6.7 22.8 10.4 20.4 6.9 20.2Office & Administrative Support 2.0 0.9 3.2 0.6 5.4 1.8 0.9 0.3 0.5 0.2 2.8 1.1Farming, Fishing, & Forestry 10.7 0.3 9.5 0.2 11.5 0.2 10.1 0.3 6.3 0.2 19.0 0.5Construction 0.5 0.0 0.2 0.0 0.6 0.0 0.3 0.0 0.1 0.0 0.4 0.0Extraction 8.6 0.3 5.6 0.3 7.4 0.3 7.8 0.3 5.5 0.3 6.5 0.3Installation, Maintenance, & Repair 16.7 9.5 19.2 14.7 22.9 23.2 8.7 3.0 9.4 4.5 10.4 6.8Production 12.5 2.2 20.8 2.5 14.9 2.4 9.9 1.9 17.6 3.2 12.8 3.5Note. Shares constructed using IPUMS crosswalks.
Males Females2007-2016
FemalesMales1976-1985

27
Appendix 2. Labor Force Flows by Race and Gender
Figure A1: UE, EU, and EN Flows Male Female
Figure A2: UN, NE, and NU Flows

28
Appendix 3. Oaxaca-Blinder Decompositions of Labor Force Flows
Figure A3: Employment-to-Unemployment Transition Rate Gaps
Figure A4: Unemployment-to-Employment Transition Rate Gaps

29
Figure A5: Employment-to-Nonparticipation Transition Rate Gaps
Figure A6: Nonparticipation-to-Employment Transition Rate Gaps
30
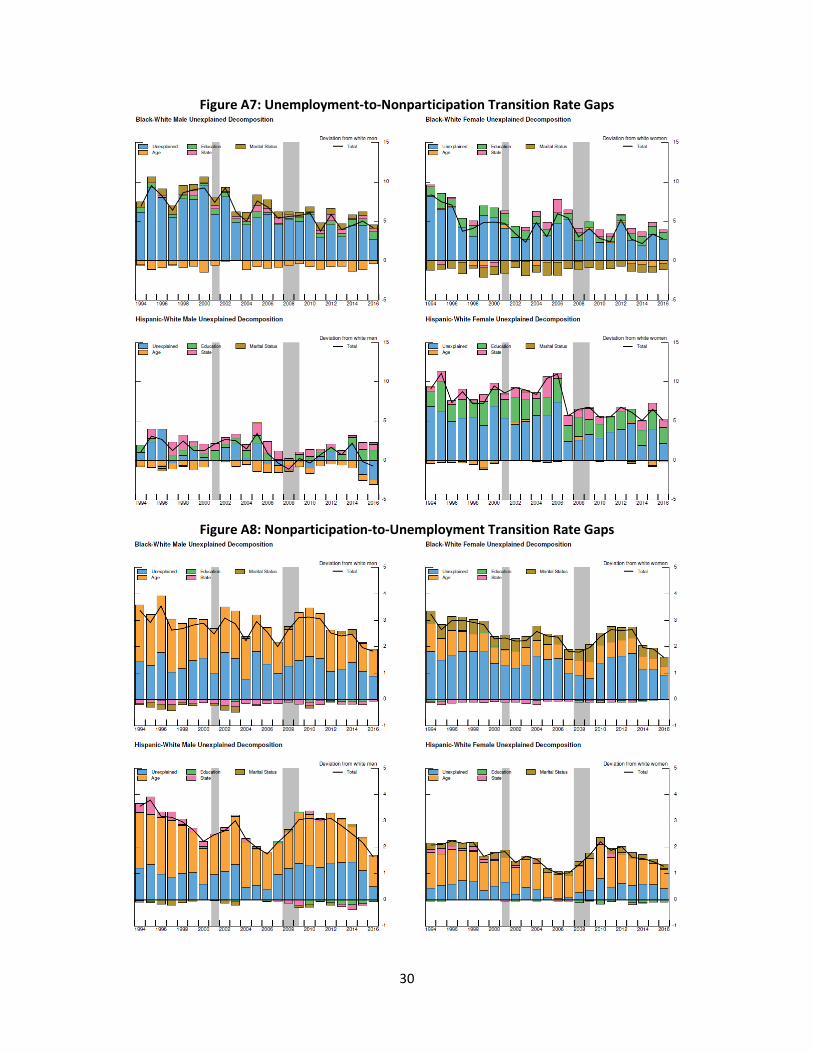
Figure A7: Unemployment-to-Nonparticipation Transition Rate Gaps
Figure A8: Nonparticipation-to-Unemployment Transition Rate Gaps
31
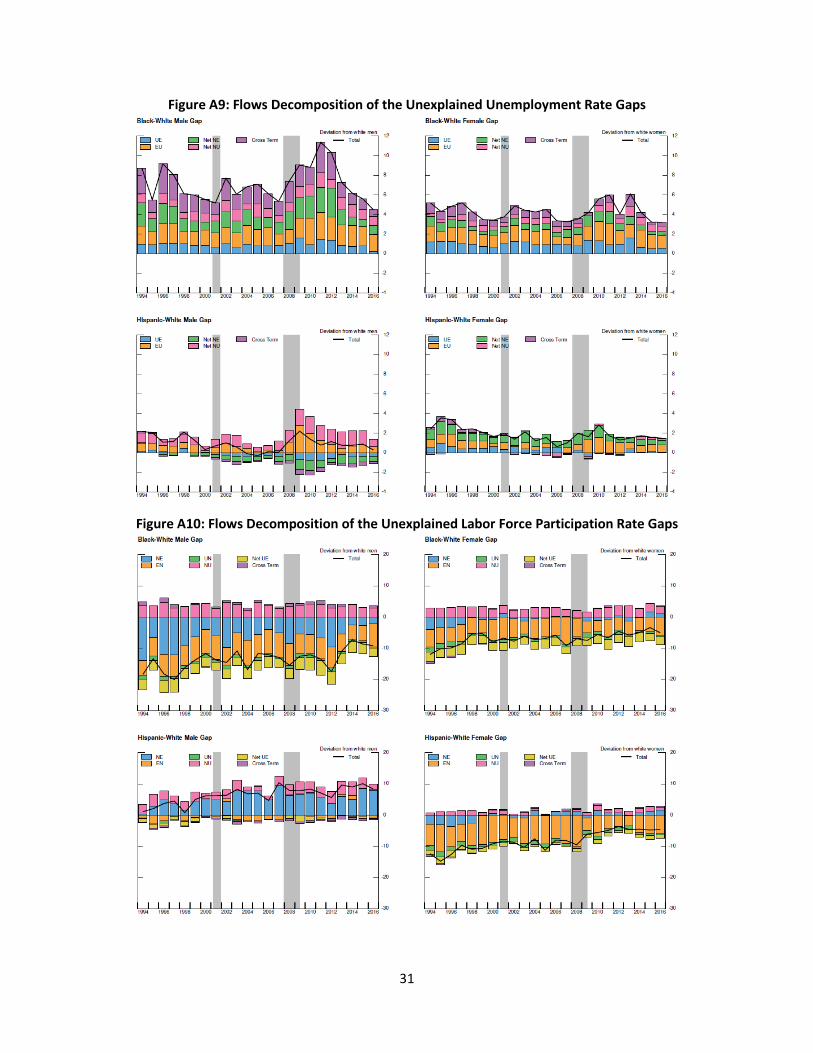
Figure A9: Flows Decomposition of the Unexplained Unemployment Rate Gaps
Figure A10: Flows Decomposition of the Unexplained Labor Force Participation Rate Gaps

32
Appendix 4. Oaxaca-Blinder Decompositions of Labor Force Flows Controlling for Industry/Occupation
Figure A11: Employment-to-Unemployment Transition Rate Gaps
Figure A12: Employment-to-Nonparticipation Transition Rate Gaps

33
Appendix 5. Dynamic Responses of Unemployment Rate and Participation Rate Gaps
Figure A13: Participation Rate Gap – Response to -1 pp Shock to GDP Gap
Figure A14: Unemployment Rate Gap Unexplained Component – Response to -1 pp Shock to GDP Gap