race, religion and equalities: a report on the 2009–10 ... citizen survey 2011 race... · 5...
TRANSCRIPT

Race, Religion and Equalities: A report on the 2009–10 Citizenship Survey

© Crown copyright, 2011 Copyright in the typographical arrangement rests with the Crown.
You may re-use this information (not including logos) free of charge in any format or medium, under the terms of the Open Government Licence. To view this licence, visit http://www.nationalarchives.gov.uk/doc/open-government-licence/ or write to the Information Policy Team, The National Archives, Kew, London TW9 4DU, or e-mail: [email protected].
This document/publication is also available on our website at www.communities.gov.uk Any enquiries regarding this document/publication should be sent to us at: Department for Communities and Local Government Eland House Bressenden Place London SW1E 5DU Telephone: 030 3444 0000 December, 2011 ISBN: 978-1-4098-3295-9

2
Acknowledgements
First and foremost our thanks go to all the respondents who gave up their time to take part in this survey. Colleagues at Ipsos MORI and TNS-BMRB who have made a significant contribution to this project include Kathryn Gallop (Ipsos MORI), Kully Kaur-Ballagan (Ipsos MORI), Pamela Bremner (Ipsos MORI), Patten Smith (Ipsos MORI), Keith Bolling (TNS-BMRB), Tim Hanson (TNS-BMRB), Sam Sullivan (TNS-BMRB) and Rebecca Hamlyn (TNS-BMRB). We would also like to thank those in the Operations Department and Data Delivery teams who have contributed to the project, in particular the many interviewers and wider Field Team who have worked on this survey. Finally, we would like to pay special thanks to Suzanne Cooper and her team at DCLG. In particular: Farzana Bari, Karen Cave, Allan Cox, Kate Millward, Philippa Robinson Reannan Rottier, Helen Smith, and Elaine Wedlock. Information on the Citizenship Survey and associated publications are available from the DCLG website: www.communities.gov.uk The responsible analyst is: Robert Rutherfoord Communities and Local Government 5th Floor, Eland House Bressenden Place London SW1E 5DU
Email: [email protected]

3
CONTENTS Acknowledgements…………………................... inside front cover
Executive Summary…………………...……………….................... 5
1 Introduction……………..……………………………………… 13
2 Religion and religious practice …...................................... 18Profile of religion and religious practice........................................ 19Whether religion affects everyday life........................................... 23Religious prejudice....................................................................... 27Government protection for religious groups................................. 31Whether people feel able to practise their religion freely............. 37Conclusions …………………………………………………............. 40List of tables ……………………………………………………....... 42
3 Racial prejudice .................................................................. 44Perceptions of racial prejudice.............................................. ....... 45Conclusions ……………………………………………………......... 51List of tables ……………………………………………………........ 52
4 Racial and religious harassment ...................................... 53Overview of harassment measures: headline and trend.............. 54Perceptions of racial or religious harassment in the local area.... 55Fear of being physically attacked due to ethnicity or religion....... 61Personal experience of harassment due to ethnicity or religion... 66
Nature and cause of harassment................................................. 70 Conclusions …………………………………………………….......... 74 List of tables ……………………………………………………......... 75
5 Equalities ............................................................................. 76Perceptions of how public services treat people from different races............................................................................................ 77Experiences of religious discrimination........................................ 93Experiences of workplace discrimination..................................... 96Conclusions ……………………………………………………......... 101

4
List of tables ……………………………………………………........ 103
6 Overall Conclusions: Race , Religion and Equalities...... 105
Annex A: Methodology .……………………………………………. 107
Annex B: Multivariate Outputs ……………………...................... 110
Annex C: Definitions and terms ……………………...…………... 119

5
Executive summary Introduction
• This summary presents findings from the 2009-10 Citizenship Survey, the
sixth in a series of surveys carried out previously in 2001, 2003, 2005, 2007-08, and 2008-09.
• The Citizenship Survey is designed to provide evidence on a range of important policy areas including cohesion, community empowerment, race equality, volunteering and charitable giving. Evidence from the Survey is used both by the Department for Communities and Local Government and other government departments to inform and develop policy. In March 2008, the Citizenship survey was given National Statistics status.
• In March 2011 it was announced that the Citizenship Survey would be
discontinued. Fieldwork therefore concluded in March 2011. These reports are the final outputs from the 2009-10 wave of the survey. There will be no further topic reports produced from the survey, though regular statistical releases have been published. Datasets for 2009-10 and 2010-11 will be lodged in the ESRC data archive in due course
• The Survey is based on a nationally representative sample of approximately 10,000 adults in England and Wales with additional boosts of around 5,000 adults from ethnic minority groups and 1,200 Muslim adults. Face-to-face fieldwork was carried out with respondents from April 2009 to March 2010 by interviewers from Ipsos MORI and TNS-BMRB.
• This summary reports on findings on the topic of race, religion and equalities. Other published reports, available on the Department for Communities and Local Government website, cover “Community Action in England: a report on the 2009-10 Citizenship Survey” and “Community Spirit in England: A report on the 2009-10 Citizenship Survey”.
• This report covers England and Wales to reflect government policy responsibilities in this area.
• This report covers the following topics:
Religion: religious affiliation, the extent to which people from different religions define themselves as practising their religion, and the experiences of those who practise a religion: whether they feel able to do so freely and the extent to which it influences their everyday life. Views on religious prejudice and the extent to which people feel the Government protects different religions are also explored.
Race: views on the extent of increased racial prejudice and the
groups thought to be subject to increased prejudice.

6
Racial and religious harassment: perceptions of the prevalence of such harassment in local areas; fear about harassment on the grounds of race or religion, and actual experience of harassment on these grounds.
• Equalities: perceptions of racial discrimination by public service
organisations, whether people feel they would be treated differently to other races by key public services; experiences of religious discrimination by key public services; experiences of workplace discrimination on different grounds, including race, religion, gender and age.
Key findings
o The proportion of people who identified their religion as Christian fell
steadily between 2005 and 2009-10. This was associated with a corresponding increase in the proportion of people that did not identify with any religion.
o Christian people were much less likely than all other main religions to say
that they practised their religion, while Muslim people were most likely to practise. The proportion of Muslim people who saw themselves as actively practising their religion increased between 2005 and 2009-10, and this rise was particularly pronounced among younger Muslim people.
o The proportion of people who felt that religious prejudice had increased over the previous five years fell between 2007-08 and 2009-10 from 62 per cent to 46 per cent. This pattern was observed across nearly all religious groups. Correspondingly, the proportion of people who felt that Government offered about the right level of protection to religious groups rose over this same time period. People who were Muslim, Hindu and Sikh were more positive than Christian people on both of these attitudinal measures.
o As in previous surveys, Muslim people were regarded by the population in general as the group most likely to encounter religious prejudice. However, in line with the overall trend, the proportion of people who felt that Muslims were the target of increased prejudice fell between 2007-08 and 2009-10.
o The proportion of people who felt that racial prejudice had been increasing in the previous five years fell between 2007-08 and 2009-10 from 56 per cent to 47 per cent, mirroring the trend for views on religious prejudice.
o While Muslim people, Asian people and Eastern Europeans continued to be the groups most identified as being the target of increased racial prejudice, the proportion of people who cited these groups as subject to increased racial prejudice fell between 2007-08 and 2009-10.
o Seven per cent of people perceived harassment on grounds of race or religion as a problem in their local area, nine per cent of people were

7
worried about being the victim of this, and four per cent of people had actually experienced such harassment.
o Experiences of harassment were considerably higher among all ethnic minority groups compared with White people, and higher among key minority religious groups than among Christians.
o Where harassment had been experienced, the nature of this was
predominantly verbal as opposed to physical, and people mainly reported that it was their skin colour rather than their ethnic origin or religion that was the incitement for the attack.
o Perceptions of racial discrimination by key public service organisations (such as social housing departments and the police) ranged from 4 per cent to 22 per cent. These levels fell overall and across most of the organisations considered between 2008-09 and 2009-10. The overall decline continued a downward trend observed since 2003.
o Members of ethnic minority groups however - particularly those who were Black African, Black Caribbean or mixed race – were considerably more likely than White people to feel that they would be discriminated against in favour of other races by public services. In line with the overall trend, there was a decline on this measure observed among nearly all ethnic groups between 2008-09 and 2009-10.
o The prevalence of religious discrimination by different public service organisations was low overall, cited by between zero and one per cent of people, although reported rates of discrimination were higher among people who were Muslim, Hindu or Sikh and from “other” religions compared to Christians1.
o Overall rates of experience of workplace discrimination, both in terms of perceived discrimination when seeking employment (7%), and in respect to being promoted (6%), remained unchanged on 2008-09 levels. Black African and Black Caribbean people were considerably more likely than most other ethnic groups to cite workplace discrimination on the grounds of race or colour. Religion and religious practice
o The majority of people said that they were Christian, although this
proportion has fallen over time, from 77 per cent in 2005 to 70 per cent in 2009-10. The proportion of people that did not identify with any religion rose from 15 per cent to 21 per cent in this period. In 2009-10,
1 Whilst the question on racial discrimination by public sector organisations asked people how they perceived they would be treated in relation to other races, the question on religious discrimination by public sector organisations asked people whether any of these organisations had ever discriminated against them because of their religion. See: http://www.communities.gov.uk/documents/communities/pdf/1703713.pdf

8
four per cent of people said they were Muslim, two per cent were Hindu, and one per cent was Sikh.
o Christian people (33%) were much less likely than all other main religions
(79% of Muslim, 74% of Sikh, and 70% of Hindu people) to say that they practised their religion. The proportion of Muslim people who practised their religion increased over time (from 73% in 2005 to 79% in 2009-10), and this rise was particularly evident in the younger (16-29) age group (from 68% to 80%).
o Of those with a religion, a third (33%) said that religion influenced their
everyday life in terms of where they lived, worked, their friends or where they sent (or would send) their children to school. Muslim and Sikh people were more likely than Christian people to say that religion influenced where they lived, their workplace and their friends.
o Multivariate analysis identified however, that when other factors were
controlled for, religion per se did not predict the influence of religion on everyday life. Instead practice of religion and perceived importance of religion to a person’s identity were more important predictors.
o Just under half (46%) of people thought that there was more religious
prejudice today than five years ago, and Christian people (47%) were more likely to think this than all other major religious groups (between 26% and 39%). The proportion of people perceiving an increase in religious prejudice fell between 2007-08 and 2009-10 from 62 per cent to 46 per cent.
o Muslim people continued to be seen as the group most likely to be the
target of increased religious prejudice. The proportion of all people who cited Muslims in this way fell from 54 per cent in 2007-08 to 37 per cent in 2009-10.
o Forty three per cent of people considered that Government gave the right
amount of protection to religious groups, a year-on-year increase since 2007-08 when 35 per cent thought this. Twenty seven per cent of people said they thought Government gave too little protection to religious groups, whilst 24 per cent said they felt the Government gave religious groups too much protection.
o Muslim people were the group that people were most likely to cite as
receiving both too much (18%) and too little (10%) protection, a decline on the proportions found in 2007-08 (21% and 17% respectively). The proportion of Muslim people who felt that they themselves received too little protection declined markedly in this period, from 42 per cent in 2007-08 to 25 per cent in 2009-10.
o Six per cent of people with a religion considered that they could not fully
practise their religion with freedom. Racial Prejudice

9
• Just under half (47%) of people thought that there was more racial
prejudice today than five years ago. Longer-term trend data revealed that perceptions of increased racial prejudice rose between 2001 and 2007-08 (from 43% to 56%), and then fell between 2007-08 and 2009-10 (from 56% to 47%).
• White people (50%) were more likely to believe that racial prejudice had risen than all other ethnic groups (between 19% and 31%) although the decrease in the overall proportion of people who thought this between 2007-08 and 2009-10 was reflected among almost all ethnic groups.
• “Muslim people” (17%), “Asian people” (15%) and “Eastern European people” (12%) were the groups most likely to be identified as subject to increased racial prejudice. However, in line with the overall trend, a smaller proportion of people believed these groups would be subject to increased racial prejudice than did so in 2007-08.
• The identification of particular groups as being the object of increased racial prejudice varied by ethnic group. For example White people (18%) and mixed race people (17%) were more likely than all other ethnic groups (between 7% and 13%) to mention Muslim people as the object of increased racial prejudice. Racial and religious harassment
• In 2009-10, seven per cent of people felt that racial or religious
harassment was a problem in their local area and nine per cent of people were worried about being attacked for these reasons.
• Levels of concern about being attacked on the grounds of skin
colour, race or religion were higher across all ethnic minority groups when compared with White people. Concern was particularly high among Black African (32%), Indian (29%) and Other Asian (29%) people.
• Eight per cent of Christian people feared attack due to skin colour, race
or religion. Among people from other religious groups, this was considerably higher, especially for Hindu (33%), Muslim (26%) and Sikh (26%) people.
• Multivariate analysis found that, after controlling for a range of factors, the
likelihood of a person worrying about being attacked on the grounds of their skin colour, race or religion was heightened among the following subgroups: Black African or Pakistani people; people born outside the UK; those living in an area regarded as non-cohesive; and those who had personally experienced racial or religious harassment.
• Four per cent of people had personally experienced harassment due
to their skin colour, ethnicity or religion in the previous two years.

10
Compared with White people (2%), experience of harassment was higher for members of all ethnic minority groups, ranging from 10 per cent of Bangladeshi people to 18 per cent of Black African people. Between 2008-09 and 2009-10, the proportion of people who had experienced this type of harassment did however decrease among many ethnic groups.
• Multivariate analysis found that, after controlling for a range of factors, the
likelihood of having experienced racial or religious harassment was heightened among the following subgroups: men who were Asian, Black or from Chinese or other ethnic groups; people born outside the UK, and those who lived in an area regarded as non-cohesive or where racial/religious harassment was regarded as a problem.
• The nature of harassment that most people reported was verbal (73%),
while smaller proportions mentioned damage to property, threats, and physical attack. The majority of people who had experienced this type of harassment believed it was due to their skin colour (67%), while 38 per cent said it was due to their ethnic origin and 18 per cent mentioned their religion.
• Muslim people (48%) were more likely than Christian people (14%) to
say that the harassment was incited by religion; and Black people (92%) were more likely than White people (61%) to cite their skin colour as a cause of the harassment they had experienced.
Equalities
• Between 2003 and 2009-10, the proportion of people who felt that public
service organisations would treat them differently to other races (either better or worse) fell from 55 per cent to 35 per cent.
• Black Caribbean people (37%) were notably more likely than White
people (22%) to think they would be treated worse than other races by at least one of eight public services asked about. Conversely, people who were Pakistani (19%), from “other” ethnic groups (15%) or from other Asian groups (13%) were less likely than White people to think they would be treated worse than other races on this measure.
• Social housing services and criminal justice organisations (especially
the police) were regarded as the public service organisations most likely to be discriminatory. Twenty two per cent and 17 per cent of people viewed social housing services and the police respectively, as services that would treat them differently to other races.
• Among people who had used social housing services, White people
(26%) were considerably more likely than all other ethnic groups (between 4% and 13%) to feel that these services would favour other races over themselves. However, among people who had had contact with criminal justice organisations, White people were less likely (7%) than nearly all

11
ethnic minority groups to think that these organisations would discriminate against them.
• Ethnic variation aside, multivariate analysis revealed some common
predictors associated with people’s propensity to feel discriminated against in favour of other races both by social housing and criminal justice services. These predictors were: people who were less likely to feel they belonged to their neighbourhood or to Britain, people who favoured reduced levels of immigration, and those who distrusted either the police or parliament.
• People’s experience of religious discrimination by public service
organisations was low overall, at two per cent, although rates of discrimination were higher among people who were Muslim (10%), Hindu (4%), Sikh (5%) or from “other” religions (5%), when compared with Christians (1%).
• Seven per cent of people who had looked for work as an employee in the
previous five years said they had experienced discrimination when seeking employment; six per cent of people who had worked as an employee in this period said they had been discriminated against regarding a promotion. Both of these measures were unchanged on 2008-09 levels. Rates of perceived workplace discrimination on the grounds of race or colour were particularly high among people who were Black African and Black Caribbean.
Overall conclusions The purpose of this report was to present the survey findings on people’s religious practice, their experience and views of religious and racial prejudice and discrimination, to uncover the factors related to these key measures, and to chart their progress over time. The profile of religious affiliation in 2009-10 followed a continuing trend. Thus, while Christianity remained the most prevalent faith in England and Wales, between 2005 and 2009-10 there was a steady decrease in the proportion of people who identified themselves as Christian. As in previous years, Christian people were much less likely than all other main religions to say that they practised their religion, while Muslim people were most likely to practise their religion. In line with previous survey years, the 2009-10 data identified a number of differences by ethnic group and religion in terms of attitudes towards, and experience of, racial and religious prejudice and discrimination. In terms of general perceptions of levels of racial and religious prejudice, people from minority religions and ethnic groups were generally more positive in their views than Christians and White people respectively. Thus, people from non-Christian religions, and especially Muslim people, were generally more positive than Christian people in their views on the level of religious prejudice in Britain,

12
and the extent to which Government protects people from different religions. Likewise, people from non-white ethnic groups were more positive than White people in terms of their views on the level of racial prejudice in Britain. When people focussed on their own circumstances however, minority groups often cited greater levels of experience of discrimination and prejudice. For example, compared with Christian people, Muslim and Sikh people reported greater levels of religious discrimination, and were more likely to feel that they could not practise their religion freely. In addition, compared with White people, rates of reported racial discrimination by criminal justice services were higher for Black African, Black Caribbean and mixed race people. The only exception to this pattern was for perceived racial discrimination by social housing services, where White people continued to report greater levels of discrimination than other ethnic groups. Minority religious and ethnic groups were also more likely than their respective Christian or White counterparts to perceive that racial or religious harassment was a problem in their local area, to be concerned about this, or to report actual experience of it. Multivariate analysis indicated however, that ethnicity and religion were not the only factors that explained increased levels of experience and/or concern about racial or religious harassment. The type of area in which people lived was also relevant. For example, living in an area of high deprivation, an area with low levels of perceived cohesion, or one where most other residents did not share the same ethnic group as the respondent, were all predictors of people being concerned about harassment in their local area and of whether people had actually experienced such harassment. Levels of workplace discrimination were relatively unchanged on previous years. Consistent with the findings noted for discrimination by public sector organisations, Black African and Black Caribbean people were considerably more likely than most other ethnic groups to cite workplace discrimination on the grounds of race or colour. Despite these differences by race and religion, the 2009-10 survey revealed a consistent pattern of positive longer-term change in perceptions of overall racial and religious prejudice. Whilst there were still some areas of concern, such as that just under half of people felt that both racial and religious prejudice had increased over the previous five years, the 2009-10 data continued the improvement observed on several key measures between 2007-08 and 2009-10. Declines observed in the proportion of people who: • felt that religious prejudice was on the increase; • felt that racial prejudice was on the increase; • felt that Government gave either too much or too little protection to religious
groups; and who • thought that public services discriminated on the grounds of race (this trend
has been evident since 2003). The positive shifts over time noted above were generally observed across all ethnic and religious groups, and were often most pronounced among minority groups.

13
Chapter 1
Introduction
1.1 This report presents the findings from the 2009-10 Citizenship Survey. This is the sixth in a series of surveys carried out previously in 2001, 2003, 2005, 2007-08, and 2008-09. In 2007 the Citizenship Survey moved to a continuous design with key indicators made available every quarter (by way of a statistical release), and in March 2008, it was awarded National Statistics status.
1.2 The Citizenship Survey is designed to provide evidence on a range of
important policy areas including cohesion, community empowerment, race equality, volunteering and charitable giving. Evidence from the Survey is used both by the Department for Communities and Local Government and a number of other government departments to inform and develop policy. It is also used widely by charities and voluntary sector organisations, and academics. The anonymised dataset is publicly available from the Economic and Social Research Council (ESRC) data archive (http://www.data-archive.ac.uk/)
1.3 The Survey contains questions about a number of topics which include:
views about the local area; fear of crime; local services; volunteering and charitable giving; civil renewal; racial and religious prejudice and discrimination; identity and values; interactions with people from different backgrounds; and violent extremism. It also collects socio-demographic data. The 2009-10 Citizenship Survey questionnaire can be found at: http://www.communities.gov.uk/publications/corporate/statistics/citizenshipsurvey200910questions
1.4 The Survey is based on a nationally representative sample of
approximately 10,000 adults in England and Wales with an additional sample of around 5,000 adults from ethnic minority groups and a further boost of around 1,200 Muslim adults. Face-to-face fieldwork was carried out with respondents from April 2009 to March 2010 by interviewers from Ipsos MORI and TNS-BMRB. Further information about the Citizenship Survey methods is available from the Technical Report, which can be found at http://www.communities.gov.uk/publications/corporate/statistics/ citizenshipsurvey200910technical

14
1.5 A series of three topic reports have been produced which set out the 2009-10 Survey findings2.
• Community Action in England: a report on the 2009-10 Citizenship
Survey This report looks at civic engagement that people take part in (civic activism, civic participation, and civic consultation). It also explores subjective empowerment - whether people feel they can influence decisions. The report also covers the subject of volunteering and charitable giving.
• Community Spirit in England: a report on the 2009-10 Citizenship Survey This report looks at how people feel about their communities (for example, whether they enjoy living in their communities, and how strongly they feel they belong to them). It also explores the extent to which people feel they get on with people from different backgrounds, and how and where people mix with each other.
• Race, religion and equalities in England and Wales: a report on the 2009-10 Citizenship Survey This, the current report, charts key measures such as religious affiliation and practice, views on religious and racial prejudice, harassment due to race or religion, levels of discrimination by public services, and levels of workplace discrimination.
1.6 This report looks at a number of different areas. Specifically, it covers:
Religion and religious practice: religious affiliation, the extent to which people from different religions define themselves as practising their religion, and the experiences of those who practise a religion: whether they feel able to do so freely and the extent to which it influences their everyday life. Views on religious prejudice and the extent to which people feel the Government protects different religions are also explored.
Race: views on the extent of racial prejudice, and groups thought to be
subject to increased prejudice. Racial and religious harassment: perceptions of local prevalence; fear
about harassment, and actual experience of harassment on these grounds.
• Equalities: perceptions of racial discrimination by public service organisations; whether people feel they would be treated differently to other races and, if so, which races they feel would be treated better than them; experience of religious discrimination; and experiences of workplace discrimination on different grounds, including race, religion, gender and age.
2 In a change to annual reporting in previous years, ‘Community Action in England’ covers topics previously covered by the 2008-09 ‘Volunteering and Charitable Giving’ report and the 2008-09 ‘Empowered Communities’ report. ‘Community Spirit in England’ covers topics previously covered by the 2008-09 ‘Community Cohesion’ report. The ‘Race, Religion and Equalities’ report remains largely unchanged.

15
1.6 The analysis in this report covers England and Wales, in order to reflect government policy responsibilities in this area.
1.7 Each chapter begins with a summary of the key findings followed by text and charts describing these findings in more detail, including key trends. Each chapter also includes conclusions at the end. Whilst the supporting data tables are published separately (see http://www.communities.gov.uk/communities/research/citizenshipsurvey/recentreports/), the tables underpinning each chapter are referenced at the end of that chapter. An overall summary of the survey methodology is provided in Annex A. There is also a separate technical report giving details of the methodology in full3. Annex B contains output from the multivariate analysis, and Annex C contains a glossary of terms used in the report.
Analysis in this report 1.8 Figures presented in this report have been weighted to ensure they
represent the population. All percentage differences or changes reported on in the text, such as between sub-groups or over time, are statistically significant at the 95 per cent level, i.e. we can be 95 per cent certain that the differences exist in the general population rather than having occurred due to sampling variation. Reporting on ethnicity, religion and country of birth (or variables derived from these variables) includes the ‘boost’ samples, which produce more accurate estimates on these categories than the ‘core’ sample. For more detail please refer to Annex A.
1.9 Much of the analysis in this report is presented as tables or charts which give percentages or frequencies based on two categories: e.g. age and response to a survey question. It is therefore bivariate analysis. For example, in this report, we note that there is a significant relationship between religion and experience of harassment, with Hindu, Muslim and Sikh people being the most likely of all religious groups to have experienced harassment. Where the report states that the two variables have a relationship, this is what is meant.
1.10 However, bivariate analysis can sometimes result in overestimating the
strength of the relationship between two variables, as it cannot take into account the possibility that the two variables might interact with other variables. For example, while we note that particular religious groups are most likely to have experienced harassment, it could be that once we take into account another factor, such as age or ethnicity, the relationship between religious affiliation and harassment might change, or even disappear.
1.11 Therefore, as well as testing associations between pairs of variables for
statistical significance4 a series of multivariate analyses was carried out on key variables of interest. This type of analysis looks at the pattern of
3 http://www.communities.gov.uk/publications/corporate/statistics/ citizenshipsurvey200910technical 4 Statistical significance means that a relationship or difference between the variables is unlikely to have occurred by chance. A full explanation of statistical significance is given in Annex C.

16
relationships between several variables simultaneously. The benefit of multivariate analysis over bivariate analysis is that it allows us to better estimate the true relationship between groups of variables and outcomes of interest as it controls for any interactions between variables when calculating the strength of the relationship between each variable and the key outcome of interest.
1.12 For this report, a number of multivariate logistic regression models were
therefore run to examine associations between particular variables and selected outcomes. The outcomes that were selected were chosen because they were of potential policy interest. Each model explored which variables (including demographics, socio-demographics, attitudes and behaviours) were important in predicting a particular outcome after controlling for the possible influence of a range of factors. This type of analysis is also able to show the relative magnitude of different variables in terms of their importance in predicting the key outcome. The identified variables are often referred to in the report as predictors.
1.13 The output from logistic regression analysis used in these reports is the
odds ratio. Odds are a simple way of representing the likelihood or probability of observing an outcome of interest for a respondent, given knowledge of certain characteristics i.e. predictor variables. An odds ratio compares the probability of an outcome or behaviour occurring if a respondent falls into one category of a predictor variable (e.g. Hindu people feeling that their religion affects their everyday life) with the probability of the same outcome or behaviour occurring for respondents who fall into another category of the same variable (e.g. Christian people feeling that their religion affects their everyday life), after other variables in the model are controlled for. In calculating odds ratios, a reference category is selected for each variable as the category of that variable against which the odds for all other categories of that variable are compared. A fuller explanation of how odds ratios are calculated is detailed in Annex B.
1.14 An example of how odds ratios are set out is illustrated in Figure 1.1. In
this case the outcome variable is the perception that racial or religious harassment is a very or fairly big problem in the local area i.e. the outcome we were trying to predict was whether someone held this view.
1.15 In this example, shown in Figure 1.1, the reference category for the age
variable is shown in italics, and is those aged 16-19. The odds for the other categories within this variable (i.e. for older age groups) are compared with the odds for the reference category to produce the odds ratio. If the odds ratio is less than 1, it means that the odds (of believing that racial or religious harassment is a problem in their local area) are lower for this category than they are for the reference category. If the odds ratio is greater than 1, then the odds of holding this perception are higher for this category than for the reference category.
1.16 Thus, in the example illustrated in Figure 1.1, we can see that those in all
age categories older than age 19 had odds ratios below 1 and therefore had lower odds of believing that harassment was a problem than those aged 16-19. People aged 75+ had the lowest odds, almost a fifth (0.2) of the odds of those aged 16-19. Looking at another example, those who got

17
most of their news or current affairs information from local newspapers had higher odds (1.8) of believing that harassment was a problem locally than those who did not get their information from any source (the reference category).
Figure 1.1: Variables significantly related to a person’s perception that racial or religious harassment is a very or fairly big problem in their local area Demographics Variable Categories identified as
significant compared with reference category
Direction of odds (odds ratio)
Age 16-19 25-34 35-49 50-64 65-74 75+
Lower (0.6) Lower (0.6) Lower (0.4) Lower (0.4) Lower (0.2)
Attitudes & behaviours Main source of news or current affairs
None Tabloid paper Local paper
Lower (0.4) Higher (1.8)
1.17 Throughout the report, the findings from each of the logistic regression models are set out in a table similar to Figure 1.1, and are followed by interpretative text. All variables presented in the tables were found to be significant at the five per cent level although the text focuses only on the variables considered of most interest in relation to the outcome under consideration5,6.
1.18 A summary of the outputs for each model is given at the end of the report in Annex B, whilst the full model outputs can be found at: http://www.communities.gov.uk/communities/research/citizenshipsurvey/recentreports/. Annex B also contains a more detailed background and explanation of the processes used in the multivariate analyses for this report.
5 A five per cent level of significance implies that there is only a five per cent chance (1 in 20) that a significant relationship found in the survey data is not actually true. This is the standard level at which most survey data are tested for significance. An alternative way of looking at this test is to say that the significant relationship we have found in the data has a 95 per cent chance of being true in the population as a whole. 6 Each model was conducted in two stages. Firstly, a “demographics only” model was run; secondly, the significant demographics identified through the first run together with an agreed list of non-demographic variables were included in the second and final model run. Neither model on its own provides a comprehensive picture; therefore the models consider the outcome from each stage of the model to help explore the range of predictors found to be statistically significant.

18
Chapter 2 Religion and Religious Practice Chapter summary
o The majority of people said that they were Christian, although this proportion fell over
time from 77 per cent in 2005 to 70 per cent in 2009-10. The proportion that did not identify with any religion rose from 15 per cent to 21 per cent (Paragraphs 2.2-2.3).
o Christian people (33%) were less likely than all other main religions (79% of Muslim, 74% of Sikh, and 70% of Hindu people) to say that they practised their religion. The proportion of Muslim people who practised their religion increased over time (from 73% in 2005 to 79% in 2009-10), and this rise was particularly pronounced in the younger (16-29) age group (from 68% to 80%) (Paragraphs 2.4, 2.5, 2.14).
o Of those with a religion, a third (33%) said that religion influenced their everyday life
in terms of where they lived, worked, their friends or where they sent (or would send) their children to school. Muslim and Sikh people were more likely than Christian people to say that religion influenced where they lived, their workplace and their friends (Paragraphs 2.16, 2.19).
o Multivariate analysis identified however, that when other factors were controlled for,
religion per se did not predict the influence of religion on everyday life. Instead, practice of religion and perceived importance of religion to a person’s identity were more important predictors (Paragraph 2.24).
o Just under half (46%) of people thought that there was more religious prejudice today
than five years ago, and Christian people (47%) were more likely to think this than all other major religious groups (between 26% and 39%). The proportion of people perceiving an increase in religious prejudice fell between 2007-08 and 2009-10 from 62 per cent to 46 per cent (Paragraphs 2.31- 2.32).
o While Muslim people continued to be seen as the group most likely to be the target
of increased religious prejudice, the proportion of all people who cited Muslims in this way fell from 54 per cent in 2007-08 to 37 per cent in 2009-10. (Paragraphs 2.34-2.35)
o Forty three per cent of people considered that Government gave the right amount of
protection to religious groups, a year-on-year increase since 2007-08 when 35 per cent thought this (Paragraph 2.40).
o Muslim people were the group that people were most likely to cite as receiving
both too much (18%) and too little (10%) protection, a decline on the proportions found in 2007-08 (21% and 17% respectively). The proportion of Muslim people who felt that they themselves received too little protection declined markedly in this period (from 42% in 2007-08 to 25% in 2009-10) (Paragraphs 2.44-2.46).
o Six per cent of people with a religion considered that they could not fully practise their
religion with freedom (Paragraph 2.55).

19
Profile of religion and religious practice
2.1 The Citizenship survey asked people to identify what their religion was
regardless of whether or not they were practising it at the time. People were then asked whether they considered themselves to be actively practising their religion.
Headline and trend
2.2 In 2009-10 a large majority (79%) affiliated themselves with a religion, with
the Christian faith (70%) being the most prevalent. Other religions were much less prevalent: four per cent of people said they were Muslim, two per cent said they were Hindu, and one per cent said that they were Sikh. ‘Other’ religions accounted for two per cent of people.
2.3 While the balance between the different religions was similar over time, the
longer-term trend data since 2005 show a declining proportion identifying themselves as Christian (from 77% in 2005 to 70% in 2009-10) and a correspondingly increasing proportion stating that they did not identify with any religion (from 15% to 21%). The changes between 2008-09 and 2009-10 in these two respects were also significant, whilst there were no changes in this period for other religions aside from a decline in the proportion who identified with an “other” religion (from 3% to 2%) (Figure 2.1, Table A.1).
† Jewish included in “other” religion due to small numbers; * denotes < 0.5%
†
Base: Core sample, England and Wales. (2005: 9,653; 2007-8: 9,324; 2008-9: 9,313; 2009-10: 9,287)
77
3 1 3
15
74
4 3
16
72
4 1 1 3
18
70
4 1 2
21
1 2 2 20
10
20
30
40
50
60
70
80
90
100
Christian Muslim Hindu Sikh Buddhist Otherreligion
Noreligion
2005 2007-8 2008-9 2009-10
Per cent
Figure 2.1 Religious affiliation of respondents: 2005 to 2009-10
* * * *

20
2.4 Overall, 37% of people with a religious affiliation saw themselves as actively practising their religion, although this varied by religion. Whilst the majority of people identified themselves as Christian, this group were notably less likely than all other main religions to be actively practising their religion (33%). Muslim people (79%) were more likely than all other religions apart from Sikhs (74%) to report that they practised their religion. A high proportion of Hindus (70%) also practised their religion (Figure 2.2, Table B.1).
2.5 Between 2005 and 2009-10, there was an increase in the proportion of
Muslim people (from 73 per cent to 79 per cent), Christian people (from 31% to 33%), and people from “other” religions (from 47 per cent to 57 per cent) who said that they were actively practising their religion, whilst there were no changes among other religions.
2.6 Between 2008-09 and 2009-10, there were no changes in the proportions of
people from any religion who said they were practising their religion7 (Figure 2.2, Table B.1a).
Base: Combined sample, England and Wales, Christian (2005: 9,236; 2007-08: 8,921; 2008-09: 9,021; 2009-10: 8,614), Muslim (2005: 1,491; 2007-08: 1,781; 2008-09: 2,134; 2009-10: 3,796), Hindu (2005: 708; 2007-08: 755; 2008-09: 900; 2009-10: 687), Sikh (2005: 366; 2007-08: 340; 2008-09: 355; 2009-10: 359), Buddhist (2005: 104; 2007-08: 129; 2008-09: 153; 2009-10: 125), Other religion (2005: 446; 2007-08: 436; 2008-09: 437; 200910: 310)
31
73 71
60
47
31
76
66
49
32
80
7066 66
51
33
7974
59 57
73 7070 70
0
10
20
30
40
50
60
70
80
90
100
Christian Muslim Hindu Sikh Buddhist Otherreligion
2005 2007-8 2008-9 2009-10
Per cent
Figure 2.2 Proportions of different religions who practise their religion: 2005 to 2009/10
†
† Jewish included in “other” religion due to small numbers 7 Whilst the changes between 2008-09 and 2009-10 in the proportions of people from Sikh, Buddhist and “other” religions may look substantial, they were not significant due to small base counts.

21
Religious affiliation by ethnicity 2.7 The following discussion relates to religious affiliation, including considering
those who were practising and non-practising. There were some clear patterns of religious affiliation within particular ethnic groups. Three-quarters (74%) of White people identified themselves as being Christian, with a further 23 per cent reporting no religious affiliation.
2.8 Three quarters (74%) of Black people were Christian, and a further 14 per
cent said they were Muslim. At a more detailed level, although Black people from both Caribbean and African descent were predominantly Christian (78% and 71% respectively), a quarter (24%) of Black-African people were Muslim, while 14% of Black-Caribbean people had no religion.
2.9 Almost all Asian people (98%) identified themselves with a religion. Just
over half of Asian people were Muslim (51%), whilst a further quarter (23%) said they were Hindu, and 12 per cent said they were Sikh. There was considerable variation when considering ethnicity in greater detail: whilst almost all Pakistani (96%) and Bangladeshi (85%) people identified themselves as Muslim, there was more diverse religious affiliation amongst Indian people: almost half were Hindus (47%), 28 per cent were Sikhs, and just 14 per cent were Muslims.
2.10 Over half (55%) of mixed race people said they were Christian while one in
ten (10%) were Muslim, and almost a third (29%) stated no religious affiliation. A fifth (21%) of Chinese people said they were Christian, 17 per cent said they were Buddhist, whilst almost half (49%) said they were not affiliated to any religion (Figure 2.3, Table A.2).
Figure 2.3 Religious affiliation by ethnicity 2009-10
Base: Combined sample, England and Wales (White: 8,593; Asian: 4,185; Black: 2,057; Mixed race: 463; Chinese: 179; Other: 619)
Per cent
74
8
74
55
21
34
51
14
10
43
23
7
12
17
4
2
3
5
13
3
23
2
8
29
49
8
2
0 20 40 60 80 100
White
Asian
Black
Mixed race
Chinese
Other ethnic group
Christian Muslim Hindu Sikh Buddhist Other religion No religion†
† Jewish included in “other” religion due to small numbers

22
Religious affiliation and practice by gender and age 2.11 At an overall level, women were more likely than men to have a religious
affiliation (82% compared with 76%) (Table A.2a). 2.12 Furthermore, among those with a religion, women (43%) were more likely
than men (31%) to practise their religion, and this gender difference was generally replicated across the different religions: for example, amongst Christians, 39 per cent of women were practising compared with 26 per cent of men, and amongst Hindu people, 78 per cent of women were practising compared with 64 per cent of men (Figure 2.4, Table B.2).
2.13 Across the main religious groups, younger people (those aged 16-29)
tended to have a lower propensity to practise their religion than older people (those aged over 50). This trend was most evident among Christian people, with 23 per cent of 16-29 year old Christians practising their religion compared with 40% of Christians aged over 50. The same pattern was also evident among Hindu and Sikh people. However, this pattern was not observed among Muslim people where approximately eight in ten people practised their religion across all age bands (78% to 81%) (Table B.3).
Figure 2.4 Proportions of people practising different religions by gender : 2009-10
64
59
79
78
83
39
43
46
59
70
64
76
26
31
0 20 40 60 80 100
"Other" religion
Buddhist
Sikh
Hindu
Muslim
Christian
All religions WomenMen
Per centBase: Combined sample, England and Wales, All (men: 3,237,women: 4,233) Christian (men: 3,664, women 4,950), Muslim (men: 1,969, women: 1,827), Sikh (men: 199, women: 160), Buddhist (men: 60, women: 65), Hindu (men: 364, women: 323), Other (men: 135, women: 137)
† Jewish included in “other” religion due to small numbers

23
2.14 As discussed in paragraph 2.5 an increasing proportion of Muslim people have, over time, defined themselves as actively practising their religion. This increase was mainly concentrated in the younger age group. In 2005, 68 per cent of Muslim people aged 16-29 defined themselves as practising their religion, rising to 80 per cent in 2009-10. However, most of this increase occurred before 2008-09, and there was no significant change between 2008-09 (78%) and 2009-10 (80%) (Table B.3a).
Whether religion affects everyday life 2.15 People who affiliated themselves with a religion were asked to what extent
they felt it affected four aspects of their everyday life:
• where they lived; • where they worked; • who their friends were; and • what school they sent (or would send) their children to.
Headline and trend
2.16 A third (33%) of people with a religion said that religion affected their
everyday life in at least one of these ways. Choice of school was the factor most likely to be influenced by religion (27% of all people with a religion said that it affected what school they sent or would send their children to), while 17 per cent of those with a religion said it affected where they lived, 13 per cent said it affected their circle of friends, and 10 per cent said it affected where they worked.
2.17 The proportion of people saying that religion affected their life in any of these
four ways fell between 2008-09 and 2009-10 (from 37% to 33%), and was also lower in 2009-10 than in 2007-08 when it was 38 per cent (Figure 2.5, Table C.2.)

24
32
17
14
10
38
30
18
14
10
37
27
17
13
10
33
0 20 40 60
2007-082008-092009-10
What school you send/sent/ would send your children to
Who your friends are
Per cent
Where you live
Figure 2.5 Proportion of people who say that their religion affects aspects of their everyday life: 2007-00 and 2009-10
Where you work
Base: Core sample, England and Wales. Respondents who have a religion, 2007-08 (where you live; 7,501; Where you work; 5,507; Who your friends are;
7,540; What school 6,185; any of above 7,933); 2008-09 (where you live; 7,420; Where you work; 5,574; Who your friends are; 7,472; What school 6,265; any of above 7,797); 2009-10 (where you live; 7,021; Where you work; 5,049; Who your friends are; 7,109; What school 5,713; any of above: 7,474)
Any of the above
2.18 Since both 2007-08 and 2008-09, the only one of these four measures to have shown a significant change was the proportion of people who said that religion affected (or would affect) their choice of school, which fell year-on-year from 32 per cent in 2007-08 to 30 per cent in 2008-09 and then to 27 per cent in 2009-10.
Religious affiliation and how religion affects everyday life 2.19 In terms of the choice of area in which they lived, their friends, and place of
work, Muslim and Sikh people stood out as being more likely than Christian people to be influenced by their religion. For example, 33 per cent of Muslim and 32 per cent of Sikh people said that their religion affected where they lived compared with 16 per cent of Christian respondents. Similar differences existed for where people worked and their choice of friends.
2.20 However, the relationship between religion and whether it affected
choice of school followed a different pattern. Christian people were more likely than all other religious groups, with the exception of those reporting they belonged to “other” religions, to say that their religion affected (or would affect) their choice of school for their children. Thus, while 27 per cent of Christian people said that religion affected their choice of school, these levels fell to 22 per cent of Muslim, 20 per cent of Sikh and 12 per cent of both Buddhist and Hindu people (Table C.6).

25
Multivariate analysis on whether religion affects everyday life
2.21 In order to look at the range of socio-demographic and other factors associated with propensity to say that religion affects everyday life, a summary measure was constructed based on all who said that religion affected where they lived, where they worked or who their friends were. The overall proportion of people who said that religion affected their everyday life in any of the above three ways was 22 per cent. Choice of school was not included in the summary measure given that its relationship with religion followed a different pattern to the other three measures (see paragraph 2.20 above).
2.22 Logistic regression was carried out to look at the socio-demographic and
attitudinal factors that predicted whether or not religion influenced people’s everyday life (as defined in paragraph 2. 21 above) after controlling for the possible influence of a range of other factors. Sections 1.8 to 1.18 provide further details of this multivariate approach and its interpretation while Annex B (Model 1) contains details of the methods including all factors controlled for.
2.23 Figure 2.6 shows the associations that were found to be significant in the
multivariate analysis. Significant associations in comparison to the reference category are noted, and the odds ratios indicate the magnitude of effect.
Figure 2.6: Model 1: Variables significantly related to perception that religion affects everyday life (where you live, where you work, who you friends are) Demographics Variable Categories identified as significant
compared with reference category Direction of odds (odds ratio)
Ethnic group White people Pakistani people Other ethnic group
Higher (1.6) Higher (1.8)
Highest qualification Degree No qualifications
Lower (0.7)
Gender by practice of religion
Non-practising men Practising men Practising women Non-practising women
Higher (2.1) Higher (1.6) Lower (0.8)
Tenure Have mortgage/part-ownership Other tenure**
Higher (1.9)
Attitudes and behaviours Whether mix socially with people from different backgrounds in private places*
Do not mix Do mix
Higher (1.2)
Importance of religion to sense of self Not important Very/quite important
Higher (2.2)
Extent of problem of racial or religious harassment in local area
Not a problem at all Very/fairy big problem Not a big problem
Higher (1.8) Higher (1.2)
Views on levels of immigration into Britain
Remain the same A lot less Can’t decide
Lower (0.7) Lower (0.6)
Proportion of friends with same religion as self
All the same Less than half Claim no faith group No friends/Don’t know
Lower (0.6) Lower (0.5) Lower (0.5)
* As opposed to public places i.e. in own home, friends’ homes or groups or clubs person belongs to ** This refers to people who do not own and are not buying or renting e.g. squatters, living rent-free

26
The key findings were as follows: 2.24 Paragraph 2.19 demonstrated that there was variation across religious
groups in the extent to which religion affected different aspects of peoples’ lives. However, multivariate analysis showed that, once a range of factors were controlled for, religious affiliation per se did not predict whether or not religion impacted on people’s everyday life. Instead, it would appear that the practice of, and importance of, religion were more important predictors of this8. This is evidenced by the finding that people who practised their religion had a higher likelihood than non-practising people to report that religion affected everyday life; the likelihood of religion affecting everyday life was also greater for those who said that religion was important to their sense of identity compared to those who said that it was not important.
2.25 Related to the above findings, the interaction between practise of religion
and gender was also relevant. Men who practised their religion had the greatest odds of religion having an impact on their everyday life. See also 2.29 below.
2.26 Ethnicity was a further predictor of religion impacting on everyday life.
Compared with White people, the odds of this were increased for Pakistani people and people from an “other” ethnic minority group.
2.27 The multivariate analysis also showed that attitudes and behaviour relating to integration were associated with religion influencing everyday life. Those who did not mix privately with people from different ethnic groups and who supported a reduction in levels of immigration had a lower propensity to report that religion had an impact on their everyday life than those who did mix with people from different ethnic groups and who thought that immigration levels should remain unchanged, respectively.
2.28 Finally, those who felt racial and religious harassment was a very or
fairly big problem in their local area had almost twice the odds of religion impacting on their everyday life than those who did not consider this to be a problem at all.
Relationship between religion affecting everyday life and religious practice/gender
2.29 Further to the findings highlighted in paragraph 2.25 above, figure 2.7
illustrates the bivariate relationship between religion affecting everyday life and gender within practice of religion (Figure 2.7, Table C.7).
8 It is worth noting that Muslim and Sikh people - the two groups who were most likely to say that religion affected their work, friends and residence – were also the most likely to be practising their religion (paragraph 2.4)

27
Religious prejudice
2.30 People were asked whether they thought there was more, less, or about
the same level of religious prejudice today as there was five years ago. People who said that there was either more or less religious prejudice were asked a follow-up question to determine which religious groups they thought faced more or less prejudice.
Headline and trend
2.31 Just under half (46%) of people thought that there was more religious
prejudice today than there was five years ago. This continued a pattern of improvement observed since 2007-08 when 62 per cent thought this, falling to 52 per cent in 2008-09 before reaching this new low. The decrease observed between 2008-09 and 2009-10 was accompanied by a rise in the proportion who said there was “about the same” level of religious prejudice as there was five years ago (from 29% to 35%), whilst there was no change in the proportion who felt there was “less” prejudice than there was 5 years ago (9% in both years) (Table D.1, Figure 2.8).
† Jewish included in “other” religion due to small numbers
29
25
21
39
25
20
15
32
12
8
6
15
10
6
6
12
0 10 20 30 40 50
Practising menPractising womenNon-practising menNon-practising women
Religion affects who your friends are
Per cent
Religion affects where you live
Figure 2.7 Proportion of people who say that their religion affects aspects of their everyday life (where you live, your friends, where you work) by whether practising their religion within gender 2009-10
Religion affects where you work
Base: Core sample, England and Wales (Practising men: 3,342; Practising women: 4,488; Non-practising men: 3,049; Non-practising women: 3,012)
Any of the above (Religion affects everyday life summary measure)

28
2.32 Amongst different religious groups, Christian people (47%) were more likely
than Muslim (39%), Sikh (37%), Buddhist (35%) and Hindu (26%) people to consider that religious prejudice was higher than it was five years ago. People with no religion (45%) were as likely as Christian people (47%) to consider that there had been a rise in religious prejudice.
2.33 Between 2008-09 and 2009-10, the decrease in the proportion of people
who believed that religious prejudice had increased in the past five years was represented across all the main religious groups, as well as amongst those who said they had no religion; the only exception was among people from “other “religions, amongst whom there was no change in the proportion who believed that religious prejudice had increased (Figure 2.9, Table D.2a).
Figure 2.8 Proportion who feel there is more religious prejudice today compared with five years ago, by religion: 2008-9 & 2009-10
45
52
26
35
37
39
47
52
52
35
53
48
49
53
0 20 40 60 80 100
No religion
"Other" religion
Hindu
Buddhist
Sikh
Muslim
Christian 2009-102008-09
Per centBase: Combined sample, England and Wales, Christian (2008-09: 9,023; 2009-10: 8,618), Muslim (2008-09: 2,135; 2009-10: 3,802), Sikh (2008-09: 355; 2009-10: 359), Buddhist (2008-09: 153; 2009-10: 125), Hindu (2008-09: 902; 2009-10: 688), Other (2008-09: 438; 2009-10: 311), No religion (2008-09: 1,871; 2009-10: 2,197)
†

29
Groups perceived to be experiencing more prejudice 2.34 People who thought there was more religious prejudice today than there
was five years ago (46%) were asked which groups they felt there was more prejudice against. Muslim people were mentioned far more frequently than any other group, cited by 83 per cent of those who felt that religious prejudice was higher than five years ago. A further 12 per cent cited Christians as being the target of increased prejudice, and less than five percent cited any other named religion (Table E.1).
2.35 Whilst 83 per cent of people who believed that religious prejudice had
increased cited Muslims as the group who had experienced this, the proportion of all people who believed that Muslim people had been the subject of increased religious prejudice was 37 per cent9. This proportion had decreased from 54 per cent in 2007-08 and 45 per cent in 2008-09, following an earlier increase between 2005 and 2007-08 from 46 per cent to 54 per cent.
9 Calculating the figure based on the total sample differs from the approach in previous reports which only looked at the proportion based on all who felt there was increased prejudice, as quoted in paragraph 2.34. However, the revised approach used here allows trends to be viewed more accurately, and the larger sample sizes allow changes over time to be detected with greater precision.
Figure 2.9 Proportion who feel there is more religious prejudice today compared with five years ago, by religion: 2008-9 & 2009-10
45
52
26
35
37
39
47
52
52
35
53
48
49
53
0 20 40 60 80 100
No religion
"Other" religion
Hindu
Buddhist
Sikh
Muslim
Christian 2009-102008-09
Per centBase: Combined sample, England and Wales, Christian (2008-09: 9,023; 2009-10: 8,618), Muslim (2008-09: 2,135; 2009-10: 3,802), Sikh (2008-09: 355; 2009-10: 359), Buddhist (2008-09: 153; 2009-10: 125), Hindu (2008-09: 902; 2009-10: 688), Other (2008-09: 438; 2009-10: 311), No religion (2008-09: 1,871; 2009-10: 2,197)
†

30
2.36 Consistent with the finding observed in paragraph 2.34, when this measure is based on all people, other groups were again much less likely than Muslims to be cited as being the target of increased prejudice: for example six per cent of people mentioned Christians, and negligible proportions of people mentioned Sikhs (2%), Jews (1%), or Hindus (1%), as groups experiencing increased religious prejudice.
2.37 In line with the decrease between 2008-09 and 2009-10 in the proportion of
all people citing Muslims as experiencing increased prejudice, there were also declines in the proportions of all people citing Jews and Hindus as being associated with increased religious prejudice, though there was no change in the proportion of people identifying Christians or Sikh people as being subject to increased religious prejudice during this period (6% for Christians in each year and 2% for Sikhs in each year) (Figure 2.10, Table E.1a).
* denotes < 0.5%
Groups perceived to be experiencing more prejudice by religion 2.38 Analysis by religion showed the extent to which different religions cited
their own religion as being the target of increased religious prejudice. In general, with the exception of Sikh people, there were no differences between the proportions of the other main religions (i.e. Christian, Muslim, Hindu, and Buddhist) citing their own religion compared with people overall. For example 37 per cent of all Muslim people regarded Muslims as being the subject of increased prejudice over the past five years, the same proportion as all people (37%); and six per cent of Christian people
Base: Core sample, England and Wales (2005: 9,691; 2007-8: 9,336; 2008-9: 9,335; 2009-10: 9,305)
46
4 3 4
54
63 3
45
62 2 2 3
37
61 2
44 3 31
0
10
20
30
40
50
60
70
Muslims Christians Jews Hindus Sikhs Religionsgenerally
2005 2007-8 2008-9 2009-10
Per cent
Figure 2.10 Groups perceived to be experiencing more religious prejudice now than five years ago : 2005 to 2009-10
*

31
regarded Christians as the subject of increased prejudice, which was the same as all people (6%). However, Sikh people were more likely (5%) than people overall (2%) to cite their own religion as subject to increased prejudice (Table E.1a).
Government protection for religious groups
2.39 People were asked if they thought the extent to which the Government
protected the rights of people belonging to different religions was too little, about right or too much. People who thought that the Government gave too little or too much protection were asked which religions they thought this applied to.
Headline and trend
2.40 Overall, 43 per cent of people considered that Government gave the right
amount of protection to religious groups. This represented an increase on 2008-09, when 39 per cent of people thought this. Furthermore, this increase indicated a rising trend since 2007- 08 when 35 per cent of people thought this. In line with this, between 2008-09 and 2009-10, the proportion who thought Government gave too much protection to religious groups fell from 26 per cent to 24 per cent, though the proportion who felt that government gave too little protection remained unchanged (Figure 2.11, Table G.1).
Figure 2.11 Perceptions of how much Government is doing to protect rights of people belonging to different religions: 2007-08 to 2009-10
Base: Core sample, England and Wales (2007-08: 9,323; 2008-09: 9,315; 2009-10: 9,301)
Per cent
27
27
30
43
39
35
24
26
26
6
9
8
0 20 40 60 80 100
2009-10
2008-09
2007-08
Too little Right amount Too much Don't know

32
Perception of Government protection for religious groups by religion 2.41 In comparison with Christian people, Muslim, Hindu and Sikh people
were more positive in their views on the Government’s protection of religious rights. Focussing on the proportion who thought the level of protection offered by Government was about right, 68 per cent of Hindu and 60 per cent of both Sikh and Muslim people thought this compared with 41% of Christian people. Conversely, Christian people (25%) were more likely than people who were Muslim (3%), Hindu (7%) or Sikh (10%) to believe that Government was doing too much to protect religious rights. (Table G.4, Figure 2.12).
† Jewish included in “other” religion due to small numbers
Religious groups perceived to be receiving too much and too little protection
2.42 People who thought that the Government gave too little or too much
protection to the rights of people with different religions were asked a follow-up question to determine which religious group or groups they were thinking of when they gave this response.
2.43 Muslim people were most frequently mentioned both by those who
thought religious rights were protected too much (77%) and by those who thought that religious rights were protected too little (39%) (Table H.1).
2.44 The proportion of all people who believed that Muslim people were
receiving too much protection was 18 per cent, while 10 per cent of all
Figure 2.12 Perceptions of how much Government is doing to protect rights of people belonging to different religions, by religion: 2009-10
Base: Combined sample, England and Wales (Christian: 8,616; Muslim: 3,802; Hindu: 688; Sikh: 357; Buddhist: 125; Other religion: 311; No religion: 2,197)
Per cent
25
26
22
27
19
32
27
42
45
47
60
68
60
41
25
23
23
10
7
3
25
8
6
8
3
6
4
6
0 20 40 60 80 100
No religion
Other religion
Buddhist
Sikh
Hindu
Muslim
Christian
Too little Right amount Too much Don't know
†

33
people believed that Muslims received too little protection10. Other religions were less likely to be associated with perceptions of too much or too little protection, although seven per cent of people believed that Christian people received too little protection, and seven per cent thought this of religions generally (Figure 2.13, Table H.1a).
2.45 Whilst Muslims were the religious group most likely to be cited as receiving
too much or too little protection, the proportion of people believing that Muslim people received too little protection declined year-on-year over the previous three years, from 17 per cent in 2007-08 to 13 per cent in 2008-09, and to 10 per cent in 2009-10. Furthermore, there was also a decrease between 2008-09 and 2009-10 in the proportion of people who believed that Muslim people received too much protection (from 21% in 2008-09 to 18% in 2009-10). There were no changes over time with respect to views on government protection for other religions (Figure 2.14, Table H.1a).
10 This differs from the approach in previous reports which only looked at the proportion based on all those who felt that Government gave too much or too little protection, as quoted in paragraph 2.43. However, calculating this figure based on the total sample enables trends to be viewed more accurately and the larger sample sizes mean that changes over time can be detected with greater precision.
Figure 2.13 Religious groups whose rights are perceived to be protected too muchand too little: 2009-2010
Base: Core sample, England and Wales (9,305)
7
7
1
1
1
10
5
2
1
2
1
18
*
*
0 5 10 15 20 25 30
Religions generally
Christians(generally)
Sikhs
Buddhists
Hindus
Jews
Muslims
Too Little
Too much
Per cent

34
2.46 Muslim people were more likely than average to believe that Muslims
received too little protection (25% of all Muslim people compared with 10% of people overall). However, there was a clear decline in the proportion of all Muslim people who believed they received too little protection, from 42 per cent in 2007-08 to 33 per cent in 2008-09, and to 25 per cent in 2009-10. This reflects the more general positive trend described in paragraph 2.40 above (Table H.1a).
Multivariate analysis on the characteristics of those who believed that Muslim people receive too much protection11
2.47 As Muslim people were, by far, the single largest religious group perceived
to be receiving too much government protection, logistic regression was carried out to explore the socio-demographic and attitudinal factors that predicted whether or not someone held this view after controlling for the possible influence of a range of other factors. Sections 1.8 to 1.18 provide further details of this multivariate approach and its interpretation while Annex B (Model 2) contains details of the methods including the factors controlled for in the analysis.
2.48 Figure 2.15 shows the associations that were found to be significant in the
multivariate analysis. Significant associations in comparison to the reference category are highlighted, and the odds ratios indicate the magnitude of effect.
11 It was not possible to perform a similar analysis on the proportion feeling that Muslims receive too little protection due to low sample sizes
Base: Core sample, England and Wales (2007-08: 9,336; 2008-09: 9,335; 2009-10: 9,305)
17
21
13
21
10
18
0
5
10
15
20
25
30
Too little Too much
2007-8 2008-9 2009-10
Per cent
Figure 2.14 Percent who believe Muslims receive too much and too little protection: 2007-08 to 2009-10

35
Figure 2.15: Model 2: Variables significantly related to the perception that Muslims receive too much Government protection Demographics Variable Categories identified as
significant compared with reference category
Direction of odds (odds ratio)
Ethnic group* White people Indian Pakistani Other Asian Black Caribbean
Lower (0.5) Lower (0.3) Lower (0.5) Lower (0.7)
Religion* Christian people Muslim
Lower (0.2)
Region London North East Yorkshire & Humberside South East South West Wales
Higher (1.6) Higher (1.6) Higher (1.5) Higher (1.5) Higher (1.9)
Socio-economic group Managerial & professional Routine occupations Full-time students
Lower (0.8) Lower (0.5)
Gender by age Men 16-24 Women 75+
Lower (0.6)
Highest qualification Degree Higher education below degree
Higher (1.4)
Attitudes and behaviours Trust in police and/or parliament
Trust in both A level of distrust in either
Higher (1.6)
Satisfaction with life as a whole
Very satisfied Neither satisfied nor dissatisfied
Higher (1.4)
Attitudes towards mixing between different ethnic/religious groups in local area
Should mix more Should mix less Don’t know
Higher (2.0) Higher (1.2)
Views on levels of immigration into Britain
Remain the same A lot/a little more A little less A lot less
Higher (1.8) Higher (1.6) Higher (4.0)
Main source of news or current affairs
None Broadsheet paper Tabloid paper TV/radio
Higher (1.4) Higher (1.3) Higher (1.2)
* See paragraph 2.49

36
The key findings were as follows: 2.49 When only demographics were included in the model, religion and ethnic
group were found to be significant in explaining the belief that Muslim people received too much protection, with Muslim people and people from the main Asian ethnic groups (Indian, Pakistani and “other” Asians) having a lower likelihood of holding this view compared with Christian people and White people respectively. However, once non-demographic variables were also included in the model, these variables were no longer statistically significant12.
2.50 The interaction of age and gender was found to be a significant predictor
of the belief that Muslim people receive too much protection. Compared with younger men aged 16-24, women aged 75+ had a lower likelihood of holding this belief.
2.51 Region was a further predictor of this belief, with the likelihood of believing
that Muslims receive too much protection raised for those living outside of London (in particular Wales, North East and Yorkshire and Humberside) compared with those resident in London.
2.52 Certain attitudinal characteristics were found to predict the viewpoint that
Muslim people received too much protection - in particular there was an association between attitudes towards integration and support for this view. Thus, this attitude was heightened among those who felt that people in their local area from different ethnic and religious backgrounds should mix less (compared with those who felt that people should mix more) and among those who believed that immigration should be reduced a lot (compared with those who believed it should remain the same).
2.53 There was also an increased propensity to hold this view among those who
accessed current affairs from either broadsheet or tabloid newspapers, or via the TV or radio, compared with those who those did not access news from any source.
2.54 Finally, distrust in the police or parliament also predicted this belief, with
the likelihood of believing that Muslims received too much protection increased for those who distrusted either of these institutions compared with those who trusted both.
12 The model was conducted in two stages. Firstly, a “demographics only” model was run; secondly, the significant demographics identified through the first run together with an agreed list of non-demographic variables were included in the second and final model run. Neither model on its own provides a comprehensive picture, and it is therefore worth reviewing the outcome from each stage of the model to help explore the range of predictors found to be statistically significant. Full details are provided in Annex B.

37
Whether people feel able to practise their religion freely
Headline and trend 2.55 People who said that they actively practised a religion (37%) were asked
whether they felt able to do so freely in Britain. Overall, 93 per cent of those who practised a religion said that this was the case, which was unchanged from 2007-08 or 2008-09 (both 94%). Six per cent of people felt they could not fully practice their religion with freedom: two per cent did not feel free to practise their religion, while the remaining four per cent felt only partly able to freely practise their religion (Table F.1).
2.56 Compared with Christian people (6%), the proportion who felt unable to
freely practise their religion was higher for Muslim (10%) people and those from “other” religions (15%) (Figure 2.16, Table F.2).
† Jewish included in “other” religion due to small numbers
Figure 2.16 Proportion of people who actively practise a religion who do not feel fully able to practise their religion by religious affiliation : 2009-10
3
2
3
1
3
2
2
12
1
9
5
7
4
4
0 5 10 15 20
"Other" religion
Buddhist
Sikh
Hindu
Muslim
Christian
All religions
Not able to freely practise Only partly able to freely practise
Per centBase: Combined sample, England and Wales (Christian: 3,654, Muslim: 3,130; Hindu: 505; Sikh: 267; Buddhist: 74; Other religion: 190

38
Multivariate analysis on the characteristics of those who perceived they were unable to freely practise their religion
2.57 Logistic regression was carried out to look at the socio-demographic and
attitudinal factors that predicted whether or not someone felt they were not fully able to practise their religion after controlling for the possible influence of a range of other factors. Sections 1.8 to 1.18 provide further details of this multivariate approach and its interpretation while Annex B (Model 3) contains details of the methods including the factors controlled for in the analysis.
2.58 Figure 2.17 shows the associations that were found to be significant in the
multivariate analysis. Significant associations in comparison to the reference category are highlighted, and the odds ratios indicate the magnitude of effect.
Figure 2.17: Model 3: Variables significantly related to a person’s perception that their religion cannot be freely practised Demographics Variable Categories identified as
significant compared with reference category
Direction of odds (odds ratio)
Religion Christian Muslim Other religion
Higher (1.7) Higher (2.2)
Attitudes and behaviours Level of agreement that people from different backgrounds get on well in local area
Definitely agree Definitely disagree
Higher (2.5)
Whether mix socially with people from different backgrounds in public places
Do not mix Do mix
Higher (1.8)
Level of agreement that residents in local area respect differences between people
Do not disagree Disagree
Higher (1.6)
Whether personally experienced harassment due to ethnic origin or religion
No Yes
Higher (2.0)
The key findings were as follows: 2.59 The only demographic variable found to be significant in predicting whether
people felt they were unable to freely practise their religion was religious affiliation itself. Compared with Christian people, the odds of holding this viewpoint increased for Muslim people, and those from an “other” religion. See also, however, paragraph 2.56 for discussion on the bivariate relationship between religious affiliation and perceptions regarding freedom to practise that religion.

39
2.60 How people felt about the cohesiveness of their local area was clearly related to a feeling of not being fully able to practise a religion. Thus, people who disagreed that people from different ethnic backgrounds got on well in their local area had 2.5 times the odds of those who agreed with this statement to feel unable to freely practise their religion. In addition, those who felt that ethnic differences between people were not respected in their local area had 1.6 times the odds of those who felt that these differences were respected (or who said that no ethnic differences existed) to say that they could not freely practise their religion.
2.61 The findings also suggested that personal experience had a role to play in
attitudes towards ease of practising religion. Experience of harassment due to skin colour, ethnicity or religion was strongly related to a person feeling that they could not fully practise their religion: those with experience of such harassment had twice the odds of feeling unable to fully practise their religion than those with no such experience.

40
Conclusions The longer-term trend data revealed some shifts in religious affiliation and practice over time. Whilst the majority of people said they were Christian, this proportion fell between 2005 and 2009-10, with a corresponding increase in the proportion that did not identify with any religion. The practise of religion was more concentrated in some religions than others. People who said they were Christian were notably less likely than people from other religions to say that they practised their religion. Muslim people were the most likely to report that they practised their religion, although high proportions of Hindu and Sikh people also practised their religion. The proportion of Muslim people who saw themselves as actively practising their religion increased between 2005 and 2009-10, and further analysis by age revealed that this rise was particularly pronounced among younger Muslim people aged 16-29. Around a fifth of people who identified with a religion said that religion shaped their everyday life in terms of where they lived, where they worked or their choice of friends; these lifestyle choices were particularly prevalent for Muslim and Sikh people. However, multivariate analysis indicated that, after controlling for a range of variables, religious commitment was more important in explaining this attribute than religious affiliation. Although almost half of people felt that religious prejudice had been increasing, there were clear positive shifts over time in terms of perceptions of religious prejudice and the level of protection offered by Government to people from different religious groups. The proportion of people who felt that religious prejudice had been increasing in the previous five years fell steeply between 2007-08 and 2009-10, and this fall was observed across nearly all religious groups indicating a generic trend. Complementing this trend, the proportion who felt that Government offered about the right level of protection rose over this same time period. It was notable that people who were Muslim, Hindu and Sikh were more positive than Christian people on both of these attitudinal measures. While Muslim people were regarded as the religious group most likely to encounter religious prejudice, and also most likely to be offered too little Government protection as a religious group, there were apparent positive shifts between 2007-08 and 2009-10 in views on this issue. Thus, both the proportion of all people who felt that Muslims were the target of increased prejudice, and the proportion who felt that Muslims received too little protection, fell between 2007-08 and 2009-10. Perhaps more importantly, Muslim people themselves were far more positive about the level of protection offered to their own religion in 2009-10 than they were two years previously, although they were still more likely than other people to believe they received too little government protection. Multivariate analysis identified attitudinal measures that were associated with views on the levels of protection offered to different religious groups.

41
For example, those who considered that mixing between members of different religions and races should be reduced in their local area, had an increased likelihood of perceiving that Muslims received too much Government protection. Whilst there were positive shifts in perceptions regarding religious prejudice and the level of Government protection for religious groups between 2007-08 and 2009-10, there was no reduction in the proportion of people with a religion who said that they did not feel fully able to practise their religion. While the proportion of people who thought this remained low, it should be noted that, compared with Christian people, the proportion who felt that they could not fully practise their religion was higher for Muslim, Sikh and people from “other” religions. As with views on government protection for religious groups, further analysis identified attitudinal measures relating to whether people felt free to practise their religion. For example, those who considered that the area in which they lived was not cohesive, or that they had personally experienced harassment due to race or religion, had a greater likelihood than those with the counter stance in each case, to cite problems with feeling unable to practise their religion.

42
List of tables Table reference and name A.1: Religious affiliation of respondents, 2005 to 2009-10 A.2: Religious affiliation of respondents, by ethnicity A.2a: Religious affiliation of respondents, by gender B.1: Proportions of people practising different religions, by religion B.1a: Proportions of people practising different religions, by religion, 2005 to
2009-10 B.2: Proportions of people practising different religions, by gender within
religion B.3: Proportions of people practising different religions, by age within religion B.3a: Proportions of people practising different religions, by age within religion,
2005 to 2009-10 C.1: The extent to which religion affects certain aspects of day-to-day life, by
religion and whether respondents actively practise a religion, 2007-08 to 2009-10
C.2: The extent to which religion affects certain aspects off day-to-day life, by ethno-religious group
C.3: The extent to which religion affects certain aspects of day-to-day life, by country of birth
C.4: The extent to which religion affects certain aspects of day-to-day life, by gender
C.5: The extent to which religion affects certain aspects of day-to-day life, by socio-economic group
C.6: The extent to which religion affects certain aspects of day-to-day life, by age within religion
C.7 The extent to which religion affects certain aspects of day-to-day life (where you live, who your friends are, where you work), gender within practise of religion
D.1: Perceptions of religious prejudice today compared to five years ago, 2005 to 2009-10
D.2: Perceptions of religious prejudice today compared to five years ago, by religion
D.2a: Proportions of people who feel there is more religious prejudice today compared to five years ago, by religion, 2008-09 to 2009-10
D.3: Perceptions of religious prejudice today compared to five years ago, by gender
D.4: Perceptions of religious prejudice today compared to five years ago, by age D.5: Perceptions of religious prejudice today compared to five years ago, by
ethno-religious group D.5a: Proportion of people who feel there is more religious prejudice today
compared to five years ago, by ethno-religious group, 2008-09 to 2009-10 D.6: Perceptions of religious prejudice today compared to five years ago, by
country of birth D.7: Perceptions of religious prejudice today compared to five years ago, by
socio-economic group E.1: Groups who would experience more religious prejudice today compared to
five years ago, by religion, 2008-09 to 2009-10

43
E.1a: Groups who would experience more religious prejudice today compared to five years ago based on all respondents, by religion, 2005 to 2009-10
E.2: Groups who would experience less religious prejudice today compared to five years ago, by religion, 2008-09 to 2009-10
F.1: Percentage of people that actively practise a religion that feel they are able to practise their religion freely, 2007-08 to 2009-10
F.2: Percentage of people that actively practise a religion that feel they are able to practise their religion freely, by religion
F.3: Percentage of people that actively practise a religion that feel they are able to practise their religion freely, by ethno-religious group
F.4: Percentage of people that actively practise a religion that feel they are able to practise their religion freely, by age within religion
F.5: Percentage of people that actively practise a religion that feel they are able to practise their religion freely, by country of birth
G.1: Perceptions of the level of protection the Government gives to the rights of people belonging to different religions, 2007-08 to 2009-10
G.2: Perceptions of the level of protection the Government gives to the rights of people belonging to different religions, by age
G.3: Perceptions of the level of protection the Government gives to the rights of people belonging to different religions, by socio-economic group
G.4: Perceptions of the level of protection the Government gives to the rights of people belonging to different religions, by religion
G.5: Perceptions of the level of protection the Government gives to the rights of people belonging to different religions, by ethno-religious group
G.6: Perceptions of the level of protection the Government gives to the rights of people belonging to different religions, by country of birth
H.1: Religious groups whose rights are perceived to be protected too much and too little, by religion, 2007-08 to 2009-10
H.1a: Religious groups whose rights are perceived to be protected too much and too little based on all respondents, by religion, 2007-08 to 2009-10

44
Chapter 3
Racial Prejudice
Chapter summary
• Just under half (47%) of people thought that there was more racial prejudice today than five years ago. Longer-term trend data revealed that perceptions of increased racial prejudice rose between 2001 and 2007-08 (from 43% to 56%), and then fell between 2007-08 and 2009-10 (from 56% to 47%) (Paragraphs 3.2 to 3.3).
• White people (50%) were more likely to believe that racial prejudice had risen than all other ethnic groups (between 19% and 31%), although the decrease in the overall proportion of people who thought this between 2007-08 and 2009-10 was reflected among almost all ethnic groups (Paragraphs 3.4 to 3.6).
• “Muslim people” (17%), “Asian people” (15%) and “Eastern European people” (12%) were the groups most likely to be identified as subject to increased racial prejudice. However, in line with the overall trend, a smaller proportion of people believed these groups would be subject to increased racial prejudice than did so in 2007-08 (Paragraphs 3.8 to 3.11).
• The identification of particular groups as being the object of increased racial prejudice varied by ethnic group. For example White people (18%) and mixed race people (17%) were more likely than all other ethnic groups (between 7% and 13%) to mention Muslim people as the object of increased racial prejudice (Paragraph 3.12).

45
Perceptions of racial prejudice 3.1 Survey respondents were asked whether they thought there was more,
less, or about the same level of racial prejudice in Britain today as there was five years ago. People who said that there was either more or less racial prejudice were asked a follow-up question to determine which ethnic groups they thought faced more or less prejudice.
Headline and trend
3.2 Just under half (47%) of people thought that there was more racial
prejudice today than there was five years ago, which represented a decrease on 2008-09 levels when 50 per cent of people believed this. Conversely, there was an increase in those believing levels of racial prejudice had remained the same (from 28% to 32%). It is interesting to note that the proportion of people who believed there was more racial prejudice over the previous five years was the same as the proportion of people believing there was more religious prejudice over this period (46%); see paragraph 2.31.
3.3 Between 2001 and 2007-08, the proportion of people who believed that
racial prejudice had increased rose from 43 per cent to 56 per cent. However, the 2009-10 figure indicated a declining trend in levels of perception of increased racial prejudice since 2007-08, from 56 per cent to 47 per cent. The decrease observed between 2007-08 and 2009-10 was compensated for by a rise in the proportion who said there was “about the same” level of racial prejudice as there was five years ago (from 25% in 2007-08 to 32% in 2009-10). These changes mirror those observed on perceptions of religious prejudice (paragraph 2.31). (Figure 3.1, Table I.1a).
Figure 3.1 Perceptions of change in racial prejudice over the last 5 years: 2001 to 2009-10
Per cent
17 17 16 11 14 14
33 30 3025
28 32
43 47 4856 50 47
7 6 6 8 8 7
0
10
20
30
40
50
60
70
80
90
100
2001 2003 2005 2007-08 2008-09 2009-10
Less Same amount More Don't know
Base: Core sample in England and Wales (2001: 10,015, 2003: 9,482, 2005; 9,671, 2007-08: 9,333, 2008-09: 9,331, 2009-10: 9,304)

46
Perceptions of change in racial prejudice by ethnicity 3.4 As in previous years, White people were considerably more likely than
other ethnic groups to consider that racial prejudice had increased over the previous five years. Fifty per cent of White people believed this compared with 31 per cent of mixed race people, 28 per cent of Asian people, 22 per cent of Black people and 19 per cent of people in the “Chinese or Other” category.
3.5 Reflecting the overall trend, between 2008-09 and 2009-10 there were falls
in the proportions of White, Asian and “Chinese or Other” ethnic groups who believed that racial prejudice had increased. However, the proportion of Black and mixed race people who thought that racial prejudice had increased was unchanged.
3.6 The overall trend over time on this measure, as described in paragraph 3.3
above, was also reflected amongst White and Asian people, where the proportion who thought racial prejudice had increased rose between 2001 and 2007-08, and then fell between 2007-08 and 2009-10. The longer-term time trend in views among other ethnic groups was less clear cut, although there were consistent falls between 2007-08 and 2009-10 among all ethnic groups with the exception of mixed race people13 (Figure 3.2, Table I.1a).
13 The observed fall between 2007-08 and 2009-10 for mixed race people was not significant due to low sample bases

47
Perceptions of change in racial prejudice by age, country of birth, gender and ethno-religious group
3.7 As in previous years, perceptions of an increase in racial prejudice:
• rose by age from 37 per cent of those aged 16-29 thinking racial
prejudice was higher, rising to 48 per cent of 30-49 year olds, and 53 per cent of those aged 50 or above;
• were higher among those born in the UK (51%) than those born outside the UK (26%);
• were higher among females (49%) compared with males (45%); • were higher among Christian people (50%) than among Muslim
people (29%), Hindu Indian people (25%), Sikh Indian people (28%) and those from “other” ethno-religious groups (37%).
For a full documentation of breakdowns by demographic subgroup, see Tables J.1 to J.6.
Base: Combined sample, England and Wales, White (2001: 9,358; 2003: 8,747; 2005: 8,909; 2007-8: 8,553; 2008-9: 8,486; 2009-10: 8,612), Asian (2001: 3,263; 2003: 2,664; 2005: 2,511; 2007-08: 2,763; 2008-09: 3,147; 2009-10: 4,190), Black (2001: 1,852; 2003: 1,679; 2005: 1,580; 2007-08: 1,674; 2008-09: 1,886; 2009-10: 2,065), Mixed race (2001: 380; 2003: 338; 2005: 478; 2007-08: 486; 2008-09: 570; 2009-10: 463), Chinese or other (2001: 614; 2003: 611; 2005: 556; 2007-08: 607; 2008-09: 812; 2009-10: 799)
44
33
25
3228
49
32 30
22
50
35
22
33 32
58
36
25
53
32
22
3027
50
2831
192025
36
22
0
10
20
30
40
50
60
70
80
90
100
White Asian Black Mixed race Chinese or other
2001 2003 2005 2007-08 2008-9 2009-10
Per cent
Figure 3.2 Proportions of people saying there is more racial prejudice today compared with five years ago by ethnicity in 2001 to 2009-10

48
Groups perceived to be experiencing more racial prejudice 3.8 People who thought there was more racial prejudice today than there was
five years ago were asked which groups they felt there was more prejudice against. As in 2008-09, the three groups mentioned most frequently by those who believed there was an increase in racial prejudice were Muslim people (cited by 38% of people); Asian people (cited by 32%); and Eastern Europeans (cited by 27%)14 (Table K.1).
3.9 Whilst respectively 38 per cent, 32 percent and 27 per cent of people who
believed that racial prejudice had increased respectively cited Muslims, Asian people and Eastern Europeans as being the subject of increased prejudice, the proportion of all people who believed that these groups had been the target of increased racial prejudice were: Muslims (17%), Asian people (15%) and East Europeans (12%)15.
3.10 Between 2008-09 and 2009-10, there were decreases in the proportions of
all people believing the following groups to be the subject of increased prejudice: Asian people (from 19% to 15%); Eastern Europeans (from 16% to 12%); and Black people (from 10% to 6%). Conversely, an increase was observed in the proportion of all people believing asylum seekers/ refugees to be the subject of increased racial prejudice (from 6% to 8%), whilst those citing “new immigrants” remained unchanged at eight per cent. There were no changes in the levels citing other groups, including Muslims.
3.11 Mirroring the overall trend for perceptions of increased racial prejudice
(paragraph 3.3) there was a rising trend between 2005 and 2007-08 in mentions by all people of Muslims, Eastern Europeans, new immigrants and Black people, followed by a declining trend between 2007-08 and 2009-10 among all groups with the exception of asylum seekers/refugees (Figure 3.3, Table K.1b).
14 People were not given any prompts, to avoid leading their answers, and interviewers coded their responses into a concealed on-screen list. This list of groups was designed to cover the wide range of answers obtained, and so includes racial and religious groups, as well as generic groups such as “new immigrants” and “Eastern Europeans”. 15 Calculating the figure based on the total sample differs from the approach in previous reports which only looked at the proportion based on all who felt there was increased prejudice, as quoted in paragraph 3.8. However, the revised approach used here enables trends to be viewed more accurately, and the larger sample sizes allow changes over time to be detected with greater precision.

49
Base: Core sample, England and Wales. (2005: 9,961; 2007-8: 9,336; 2008-9: 9,335; 2009-10: 9,305)
1820
14
7 8
2421
9 9
18 1916
68
10
1715
8 866 7
16
12
0
5
10
15
20
25
30
35
40
2005 2007-08 2008-09 2009-10
Per cent
Figure 3.3 Groups perceived to be experiencing more racial prejudice now than five years ago: 2007-08 to 2009-10
“Muslims” “Asian people”
“EasternEuropeans”
“Asylumseekers/
Refugees”
“New immigrants”
“Black people”
3.12 Looking at the extent to which different ethnic groups cited particular
groups as experiencing increased racial prejudice, there were some clear variations. Muslim and Asian people tended to be the groups most commonly cited by all of the main ethnic groups. However, Eastern Europeans were particularly highlighted by White people (13%), and Black people were most likely to cite Black people as subject to increased racial prejudice (9%)16 (Figure 3.4, Table K.1a).
16 The difference between the proportion of Mixed Race people and White people mentioning Black people is not significant.

50
Base: Combined sample, England and Wales. (White: 8,614; Asian: 4,191; Black: 2,069; Mixed race: 463; Chinese or other: 799)
18
13
17
9
1513
5
13
35
9
3
6
3
9
3
8
23
7
2
8
3 3
6
3
7
13
89
0
5
10
15
20
25
30
White Asian Black Mixed race Chinese orother
Muslims Asian people Eastern EuropeansBlack people Asylum seeker/refugees New immigrants
Per cent
Figure 3.4 Groups perceived to be the target of increased racial prejudice compared with five years ago by ethnicity: 2009-10

51
Conclusions The longer-term trend data reveal a pattern of rise and fall in perceptions of racial prejudice, with opinions of prejudice rising between 2001 and 2007-08 to reach a peak before falling away again between 2007-08 and 2009-10. In 2009-10, just under half of the population regarded racial prejudice to have increased over the previous five years. Changes in perceptions of racial prejudice between 2007-08 and 2009-10 mirrored those observed in perceptions of religious prejudice, suggesting this may be part of a broader shift in perceptions about prejudice. As with religious prejudice, racial prejudice was more likely to be perceived as increasing by White people than people from other ethnic groups, although the decline in this view over time was reflected across nearly all ethnic groups. “Muslims”, “Asian people” and “Eastern Europeans” continued to be the groups highlighted most frequently as the target of increased racial prejudice, although the overall proportion of people who cited these groups fell between 2007-08 and 2009-10, in line with the wider trend.

52
List of tables Table reference and name I.1a: Proportion of respondents saying that there is now more racial prejudice than
five years ago, by ethnicity (5 main ethnic groups), 2001 to 2009-10 I.1b Proportion of respondents saying that there is now more racial prejudice than
five years ago, by ethnicity, 2007-08 to 2009-10 J.1: Perceptions of racial prejudice compared to five years ago, by age within
ethnicity J.2: Perceptions of racial prejudice compared to five years ago, by gender within
ethnicity J.3: Perceptions of racial prejudice compared to five years ago, by country of birth
within ethnicity J.4: Perceptions of racial prejudice compared to five years ago, by highest
qualification level J.5: Perceptions of racial prejudice compared to five years ago, by socio-
economic group J.6: Perceptions of racial prejudice compared to five years ago, by ethno-religious
group K.1: Groups who experience more racial prejudice now than five years ago, by
ethnicity, 2007-08 to 2009-10 K.1a: Groups who experience more racial prejudice now than five years ago
based on all respondents, by ethnicity K.1b: Groups who experience more racial prejudice now than five years ago
based on all respondents, by ethnicity, 2005 to 2009-10 K.2: Groups who experience less racial prejudice now than five years ago, by
ethnicity, 2007-08 to 2009-10

53
Chapter 4 Racial and Religious harassment
Chapter summary
• In 2009-10, seven per cent of people felt that racial or religious harassment was a
problem in their local area and nine per cent of people were worried about being attacked for these reasons (Paragraph 4.3).
• Levels of concern about being attacked on the grounds of skin colour, race or
religion was higher across all ethnic minority groups when compared with White people. Concern was particularly high among Black African (32%), Indian (29%) and Other Asian (29%) people (Paragraph 4.21).
• Eight per cent of Christian people feared attack due to skin colour, race or religion.
Among people from other religious groups, this was considerably higher, especially for Hindu (33%), Muslim (26%) and Sikh (26%) people (Paragraph 4.22).
• Multivariate analysis found that, after controlling for a range of factors, the likelihood of a
person being worried about being attacked on the grounds of their skin colour, race or religion was heightened among the following subgroups: Black African or Pakistani people; people born outside the UK; people living in an area regarded as non-cohesive; and those who had personally experienced racial or religious harassment (Paragraphs 4.23 to 4.30).
• Four per cent of people had personally experienced harassment due to their skin
colour, ethnicity or religion in the previous two years. Compared with White people (2%), experience of harassment was higher for members of all ethnic minority groups, ranging from 10 per cent of Bangladeshi people to 18 per cent of Black African people. Between 2008-09 and 2009-10, the proportion of people who had experienced this type of harassment did however decrease among many ethnic groups (Paragraphs 4.32-4.34).
• Multivariate analysis found that, after controlling for a range of factors, the likelihood of
having experienced racial or religious harassment was heightened among the following subgroups: men who were Asian, Black or from Chinese or other ethnic groups; people born outside the UK; and those who lived in an area regarded as non-cohesive or where racial/religious harassment was regarded as a problem (Paragraphs 4.39 to 4.43).
• The nature of harassment that most people reported was verbal (73%), while smaller
proportions mentioned damage to property, threats, and physical attack. The majority of people who had experienced this type of harassment believed it was due to their skin colour (67%), while 38 per cent said it was due to their ethnic origin, and 18 per cent mentioned their religion (Paragraphs 4.45-4.46).
• Muslim people (48%) were more likely than Christian people (14%) to say that the
harassment was incited by religion; and Black people (92%) were more likely than White people (61%) to cite their skin colour as a cause of the harassment they experienced (Paragraphs 4.47-4.48).

54
Overview of harassment measures: headline and trend
4.1 This Chapter focuses on three measures which captured perceptions and experiences of racial and religious harassment:
• whether people felt that racial or religious harassment was a
problem in their local area; • whether people were personally worried about being attacked due to
their skin colour, ethnic origin or religion; • whether people had actually experienced any harassment because
of their skin colour, ethnic origin or religion. 4.2 Detailed reporting of these questions is provided in the reminder of this
section. However, this chapter begins with an overview of the headline and trend figures.
4.3 In 2009-10, seven per cent of people felt that racial or religious harassment
was a problem in their local area, nine per cent of people were worried about being attacked on these grounds, and four per cent of people had experienced harassment due to their skin colour, ethnic origin or religion in the previous two years.
4.4 Between 2008-09 and 2009-10, the proportion of people who felt that racial
or religious harassment was a problem in their local area fell from nine per cent to seven per cent, while the proportion worried about being attacked due to their race or religion fell from eleven per cent to nine per cent. There has been no clear trend in these measures since these questions were first asked in 2007-08, when levels were eight per cent and ten per cent respectively.
4.5 The proportion of people that had actually experienced racial or religious
harassment in the previous two years decreased from five per cent to four per cent between 2008-09 and 2009-1017 (Figure 4.1, Tables U.1, T.1 and V.1).
17 This question was introduced to the questionnaire in 2008-09 so no longer term trends are available.

55
Perceptions of racial or religious harassment in the local area Headline and trend
4.6 People were asked how much of a problem they considered racial or
religious harassment to be in their local area, even if this didn’t affect them personally. The majority of people (93%) either did not perceive this to be a very big problem or did not consider this to be a problem at all. Only one per cent of people considered it a “very big” problem, with six per cent saying it was a “fairly big” problem.
4.7 Compared with 2008-09, a slight fall in the proportion of people considering
this to be a problem was observed (as noted in paragraph 4.4 above). Looking at the figures in more detail, the principal change observed between 2008-09 and 2009-10 was an increase in the proportion who felt that this was “not a problem at all” in their local area, increasing from 52 to 62 per cent. Responses observed in 2009-10 were largely unchanged on those observed in 2007-08 (Figure 4.2, Table U.1).
* Question was not asked before 2008-09
Figure 4.1 Perception, fear and experience of harassment due to skin colour, ethnicity or religion: 2009-10
89
7
1011
9
54
0
10
20
2007-08
2008-09
2009-10
2007-08
2008-09
2009-10
2008-09
2009-10
Per c
ent
Base: Core sample, England and Wales. % who think racial or religious harassment is problem in local area (2007-08: 8,590; 2008-09: 8,657; 2009-10: 8,828).% who are worried about being attacked (2007-08: 9,286; 2008-09: 9,264; 2009-10: 9,264). % who have personally experienced harassment (2008-09: 9,326;2009-10: 9,300)
% who think racial or religious harassment in local area is a “problem”
% who are worried about being attacked due to race or religion
% who have personally experienced racial or religious harassment*

56
Figure 4.2 Proportion of people who feel that racial or religious harassment is a problem in their local area: 2007-08 to 2009-10
Base: Core sample, England and Wales (2007-08: 8,590; 2008-09: 8,657; 2009-10: 8,828) Per cent
1
2
2
6
7
6
31
39
30
62
52
61
0 20 40 60 80 100
2009-10
2008-09
2007-08
Very big Fairly big Not very big Not a problem at all
Perceptions of racial or religious harassment in the local area by religion, ethnic group, and gender within ethnic group
4.8 Perceptions of problems in the local area related to racial or religious
harassment varied by religion. Compared with Christian people (6%), perceptions of such problems were higher for people who were Muslim (17%), Sikh (14%), Hindu (13%), from “other” religions (14%) or with no religious affiliation (9%) (Figure 4.3, Table U.4a).

57
Figure 4.3 Proportion who feel that racial or religious harassment is a problem in their local area by religion: 2009-10
1
2
1
1
4
2
5
1
5
8
13
10
10
12
5
10
0 5 10 15 20
All
No religion
Other religion
Buddhist
Sikh
Hindu
Muslim
Christian
Very big problem Fairly big problem
Per cent
Base: Core sample, England and Wales, All (8,828); Combined sample, England and Wales, Christian (8,182), Muslim (3,675), Hindu (669), Sikh (350), Other religion (290), No religion (2,036)
6
17
13
14
10
7
14
9
4.9 There was also variation on this measure by ethnic group. Compared
with White people (7%), perceptions of problems on the grounds of race or religion were higher among people who were Asian (15%), Black (17%), mixed race (16%) and from “other” ethnic groups (12%). While there was a gender difference in perceptions of racial and religious harassment in the local area (8% of women compared with 6% of men), the gender differential was more pronounced among Asian (20% of women compared to 12% of men) and “other” ethnic groups (19% of women compared with 7% of men) (Tables U.4b, U.5, Figure 4.4).
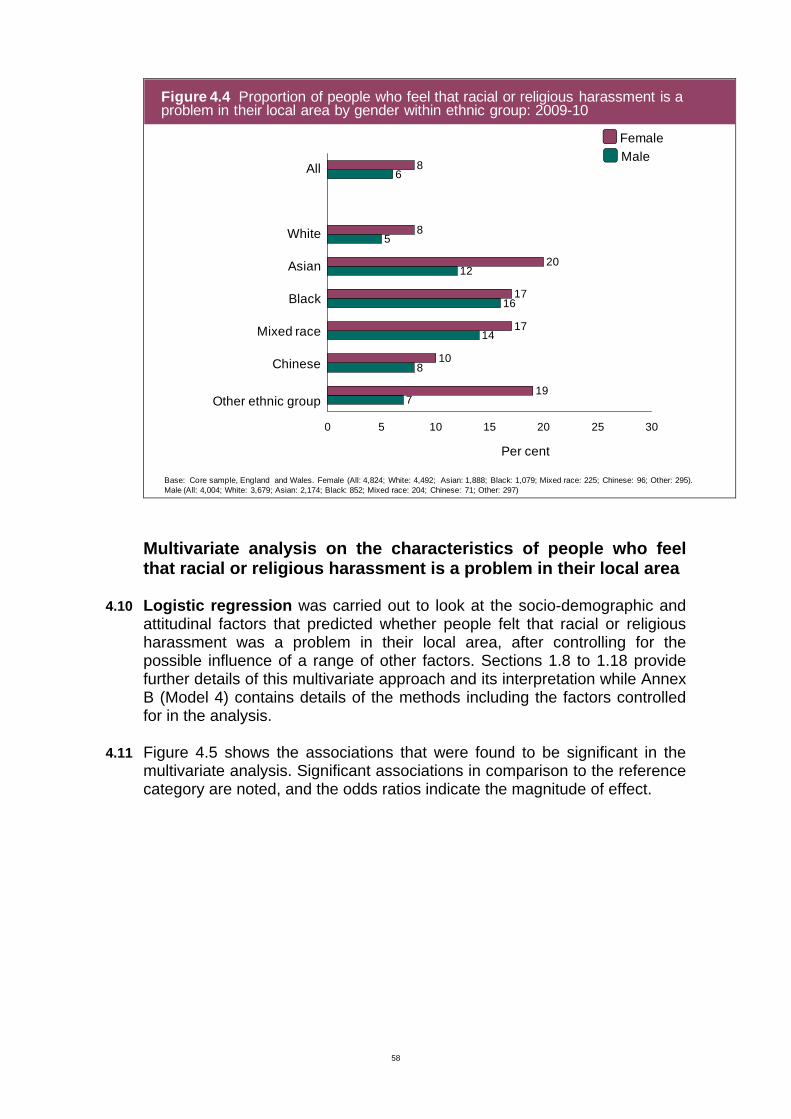
58
Base: Core sample, England and Wales. Female (All: 4,824; White: 4,492; Asian: 1,888; Black: 1,079; Mixed race: 225; Chinese: 96; Other: 295).Male (All: 4,004; White: 3,679; Asian: 2,174; Black: 852; Mixed race: 204; Chinese: 71; Other: 297)
7
8
14
16
12
5
6
19
10
17
17
20
8
8
0 5 10 15 20 25 30
Chinese
Mixed race
Asian
White
FemaleMale
Per cent
Black
Figure 4.4 Proportion of people who feel that racial or religious harassment is a problem in their local area by gender within ethnic group: 2009-10
Other ethnic group
All
Multivariate analysis on the characteristics of people who feel that racial or religious harassment is a problem in their local area
4.10 Logistic regression was carried out to look at the socio-demographic and
attitudinal factors that predicted whether people felt that racial or religious harassment was a problem in their local area, after controlling for the possible influence of a range of other factors. Sections 1.8 to 1.18 provide further details of this multivariate approach and its interpretation while Annex B (Model 4) contains details of the methods including the factors controlled for in the analysis.
4.11 Figure 4.5 shows the associations that were found to be significant in the
multivariate analysis. Significant associations in comparison to the reference category are noted, and the odds ratios indicate the magnitude of effect.

59
Figure 4.5: Model 4: Variables significantly related to a person’s perception that racial or religious harassment is a very or fairly big problem in their local area Demographics Variable Categories identified as
significant compared with reference category
Direction of odds (odds ratio)
Region* London North West South West
Lower (0.6) Lower (0.5)
Location (urban/rural) Urban Rural
Lower (0.5)
Index of Multiple deprivation decile18 First decile (least deprived areas) Sixth decile Eight decile Ninth decile Tenth decile (most deprived areas)
Higher (1.8) Higher (1.8) Higher (2.3) Higher (3.0)
Age 16-19 25-34 35-49 50-64 65-74 75+
Lower (0.6) Lower (0.6) Lower (0.4) Lower (0.4) Lower (0.2)
Gender by ethnicity White males White females Asian females
Higher (1.5) Higher (2.2)
Limiting long-term illness or disability No Yes
Higher (1.5)
Attitudes and behaviours Whether mix socially with people from different backgrounds in public places
Do not mix Do mix
Higher (1.6)
Level of agreement that people from different backgrounds get on well in local area
Definitely agree Tend to disagree Definitely disagree
Higher (2.3) Higher (4.9)
Level of agreement that residents in local area respect differences between people
Do not disagree Disagree
Higher (3.5)
Whether personally experienced harassment due to ethnic origin or religion
No Yes
Higher (4.6)
Enjoy living in neighbourhood Yes definitely To some extent No
Higher (1.3) Higher (1.5)
Proportion of people in local area same ethnicity as self
All the same About a half
Higher (1.6)
Attitudes towards mixing between different ethnic/religious groups in local area
Should mix more Mix enough Don’t know
Lower (0.7) Lower (0.6)
Main source of news or current affairs None Tabloid paper Local paper
Lower (0.4) Higher (1.8)
* See paragraph 4.12
18 See Annex C Glossary of terms for more information about this Index
60
The key findings are as follows: 4.12 Two key area characteristics were found to be associated with the
perception that racial or religious harassment was a problem in the local area, namely area deprivation and whether the area was urban or rural. Thus, the chances of perceiving a problem were greater for those living in areas of high as opposed to low deprivation, and were lower for those living in rural as opposed to urban areas. Before non-demographic variables were included in the model, region also appeared to be significant19, though no clear picture emerged regarding this, with lower odds of racial or religious harassment in the South West and North West than in London.
4.13 Gender within ethnic group was further associated with perceptions of
racial and religious harassment in the local area. Both White and Asian women had an enhanced likelihood compared with White males to hold this view. See also Figure 4.4 and paragraph 4.9, which illustrate the bivariate relationship between perceptions of racial or religious harassment and gender within ethnic group.
4.14 Age was a further predictor of the perception that racial/religious harassment
was a problem in the local area. Compared with the odds of those aged 16-19, the odds of all other, older, age groups having this perception decreased across age categories such that the odds of someone aged 75+ holding this view was only a fifth the odds of someone aged 16-19.
4.15 Attitudes that indicated a lack of integration in the community strongly
predicted perceptions about racial or religious harassment in the local area. For example, someone who definitely disagreed that people from different backgrounds got on well in their local area had around five times the odds of believing that racial or religious harassment was a problem in their local area than those who definitely agreed with this. Similarly, those who disagreed that ethnic differences between people in the local area were respected had three and half times the odds of someone who agreed with this to perceive problems related to racial or religious harassment.
4.16 Personal experience of racial or religious harassment was a very
powerful predictor of views on problems related to racial or religious harassment in the local area. Thus, those with personal experience of harassment had four and half times the odds of perceiving problems of this nature in their local area than those who had never experienced any such harassment.
4.17 Dissatisfaction with the neighbourhood was associated with perceptions
of racial/religious harassment. Those who did not enjoy living in the neighbourhood, or who only enjoyed it to some extent, had a greater likelihood of perceiving such problems than those who enjoyed living in their area.
19 The model was conducted in two stages. Firstly, a “demographics only” model was run; secondly, the significant demographics identified through the first run together with an agreed list of non-demographic variables were included in the second and final model run. Neither model on its own provides a comprehensive picture, and it is therefore worth reviewing the outcome from each stage of the model to help explore the range of predictors found to be statistically significant. Full details are provided in Annex B.

61
4.18 Attitudes on this measure were also related to people’s main source of
news or current affairs, with those accessing their news and current affairs mainly through local papers having almost twice the odds of reporting problems in their local area than those who did not access any news; conversely those who read a tabloid newspaper were less likely to perceive problems compared with those who didn’t access any news.
4.19 Finally, propensity to believe that there was a problem with racial or religious
harassment in the area was lower among those who felt that people in their local area mixed enough compared with those who felt that people should mix more in the locality. Fear of being physically attacked due to ethnicity or religion Headline and trend
4.20 People were asked how worried they were about being attacked because
of their skin colour, ethnic origin or religion. Nine per cent of people said that they were worried, comprising two per cent who said that they were “very worried” and seven per cent who said that they were “fairly worried”. As noted in paragraph 4.4 above, this represents a small decline since 2008-09, when 11 per cent were worried about being attacked due to their colour, ethnic origin or religion. There was a notable increase between 2008-09 and 2009-10 in the proportion of people who were “not at all worried” about being attacked, from 54 per cent to 63 per cent, and a decrease in the proportion of people who said they were “not very worried” (from 36% to 28%) (Figure 4.6, Table T.1).
Figure 4.6 Proportion of people who are worried about physically attacked due to their skin colour, ethnic origin or religion: 2007-08 to 2009-10
Base: Core sample, England and Wales (2007-08: 9,286; 2008-09: 9,264; 2009-10: 9,264)
Per cent
2
3
3
7
8
7
28
36
31
63
54
59
0 20 40 60 80 100
2009-10
2008-09
2007-08
Very worried Fairly worried Not very worried Not at all worried

62
Fear of being physically attacked due to skin colour, ethnicity or religion, by ethnic group and religion
4.21 This section focuses on the combined proportions of those saying that they
were either very or fairly worried about being attacked due to their skin colour, ethnicity or religion. As with perceptions of racial or religious harassment in the local area, fear of attack on these grounds varied by ethnic group and religion. While fear of attack was higher among all ethnic minority groups when compared with White people, rates of concern were particularly high among Black African (32%), Indian (29%), and other Asian people (29%) (Figure 4.7, Table T.2).
4.22 There was also variation on this measure by religion. Compared with
Christian people (8%), people who were Hindu (33%), Muslim (26%), Sikh (26%) Buddhist (19%) or from “other” religions (14%) were more likely to be worried about being attacked due to skin colour, ethnic group or religion (Figure 4.8, Table T.3a).
Figure 4.7 Proportion who feel worried about being attacked due to skin colour, ethnic group or religion by ethnic group: 2009-10
8
16
20
21
24
25
26
29
29
32
0 10 20 30 40 50
White
Mixed race
Chinese
Black Caribbean
Bangladeshi
Other ethnic group
Pakistani
Indian
Other Asian
Black African
Per centBase: Combined sample, England and Wales, Black African (2009-10: 1,083), Asian Other (2009-10: 461), Asian Indian (2009-10: 1,318), Asian Pakistani (2009-10: 1,727), Other ethnic (2009-10: 616), Asian Bangladeshi (2009-10: 667), Black Caribbean (2009-10: 923), Chinese (2009-10: 179). Mixed race (2009-10: 463), White (2009-10: 8,576)

63
Multivariate analysis on perception of being worried about attack because of skin colour, ethnic origin or religion
4.23 Logistic regression was carried out to look at the socio-demographic and attitudinal factors that predicted whether someone was either very or fairly worried about being attacked due to their skin colour, ethnicity or religion after controlling for the possible influence of a range of other factors. Sections 1.8 to 1.18 provide further details of this multivariate approach and its interpretation while Annex B (Model 5) contains details of the methods including the factors controlled for in the analysis.
4.24 Figure 4.9 shows the associations that were found to be significant in the
multivariate analysis. Significant associations in comparison to the reference category are noted, and the odds ratios indicate the magnitude of effect.
Figure 4.8 Proportion who feel worried about being attacked due to skin colour, ethnic group or religion by religion: 2009-10
7
8
14
19
26
26
33
0 10 20 30 40 50
No religion
Christian
Other religion
Buddhist
Sikh
Muslim
Hindu
Per cent
Base: Combined sample, England and Wales, Christian (2009-10: 8,580), Muslim ( 2009-10: 3,790), Hindu (2009-10: 685), Sikh (2009-10: 356), Buddhist (2009-10: 123); Other religion (2009-10: 310), No religion (2009-10: 2,188)

64
Figure 4.9: Model 5: Variables significantly related to perception of being very or fairly worried about beingattacked due to skin colour, ethnicity or religion Demographics Variable Categories identified as significant
compared with reference category Direction of odds(odds ratio)
Index of Multiple deprivation decile* First decile (least deprived areas) Ninth decile
Higher (1.5)
Religion** Christian Hindu
Higher (1.9)
Location (urban/rural) Urban Rural
Lower (0.6)
Region London North East North West South East
Lower (0.6) Lower (0.5) Lower (0.6)
Ethnic group White people Pakistani people Black African people
Higher (1.6) Higher (2.3)
Limiting long-term illness or disability No Yes
Higher (1.3)
Whether born in the UK/Time in the UK Born in the UK Not born in UK, resident < 5 years
Higher (2.1)
Highest qualification Degree No qualifications Qualifications not known
Higher (2.3) Higher (2.0)
Socio-economic group Managerial & professional Intermediate occupations Lower supervisory & technical/Semi-routine Not stated
Higher (1.3) Higher (1.7) Higher (4.1)
Attitudes and behaviours Level of agreement that people from different backgrounds get on well in local area
Definitely agree Tend to disagree
Higher (1.8)
Level agreement that residents in local area respect differences between people
Do not disagree Disagree
Higher (1.5)
Whether personally experienced harassment due to ethnic origin or religion
No Yes
Higher (3.1)
Enjoy living in neighbourhood Yes definitely To some extent No
Higher (1.2) Higher (1.6)
Proportion of people in local area with same ethnicity as self
All the same About a half Less than half
Higher (1.8) Higher (1.4)
Attitudes towards mixing between different ethnic/religious groups in local area
Should mix more Mix enough Don’t know
Lower (0.8) Lower (0.8)
Main language English Not English
Higher (1.4)
Importance of religion to sense of self Not important Very/quite Important
Higher (1.6)
Views on levels of immigration into Britain Remain the same Reduced a lot
Higher (1.4)
Main source of news or current affairs None Local paper
Higher (1.9)
* See paragraph 4.25 ** See paragraph 4.28

65
The key findings were as follows: 4.25 Many of the area-based demographics found to be significant predictors in
the model relating to perceptions of harassment in the local area (see Model 4, Figure 4.5) were also found to be significant in predicting fear of harassment. For example, the chances of fearing attack due to skin colour, ethnicity or religion were lower for those living in rural compared with urban areas, and were lower for those living in the North East, North West and South East than for those living in London. However, it should be noted that deprivation was not found to be significant after controlling for non-demographic variables20.
4.26 As in the previous model, ethnic group was found to be a predictor of
concern of attack due to ethnicity or religion. The odds of fearing attack were raised for Pakistani and Black African people when compared with White people. See also Figure 4.7 and paragraph 4.21 which explore the bivariate relationship between fear of attack and ethnicity.
4.27 A further predictor of concern about attack on ethnic or religious grounds
was place of birth. Those who were not born in the UK and who had been resident in the UK for less than five years, had around twice the odds of fearing attack than those born in the UK. Perhaps connected with this finding was the fact that the odds of fear of attack were higher among those for whom English was not their main language, compared with those for whom it was.
4.28 While religion was not found to be significant after controlling for non-
demographic variables21, when only controlling for demographic variables, Hindu people had almost twice the odds of fearing attack due to ethnicity or religion compared with Christian people. See also Figure 4.8 and paragraph 4.22, which explore the bivariate relationship between fear of attack and religion.
4.29 Two other demographic characteristics were found to be associated with
concerns of attack due to skin colour, ethnicity or religion, namely socio-economic group and level of qualifications. The odds of fearing attack were higher for those in two of the lower socio-economic groups compared with those in managerial professions, and were also higher for those who lacked qualifications or for whom qualifications were unknown, compared with those who held a degree.
4.30 Finally, the multivariate analysis indicated a number of themes that were
similar to those found when multivariate analysis explored people’s perceptions about racial and religious harassment in their local area (see discussion of Model 4, paragraphs 4.12- 4.19). These included an indication
20 The model was conducted in two stages. Firstly, a “demographics only” model was run; secondly, the significant demographics identified through the first run together with an agreed list of non-demographic variables were included in the second and final model run. Neither model on its own provides a comprehensive picture, and it is therefore worth reviewing the outcome from each stage of the model to help explore the range of predictors found to be statistically significant. Full details are provided in Annex B. 21 See footnote above

66
of heightened fear of attack due to skin colour, ethnicity or religion among those who:
• disagreed that that they lived in an area where people from different
backgrounds got on well, compared with those who agreed with this; • disagreed that ethnic differences were respected in their local area
compared with those who agreed with this; • had had personal experience of racial or religious harassment
compared with those who had not (odds were three times as much) and; • read a local newspaper compared with those who didn’t identify any main
source of news or current affairs.
Personal experience of harassment due to ethnicity or religion Headline and trend
4.31 People were asked if they had, in the last two years, personally
experienced harassment because of their skin colour, ethnic origin or religion. Harassment was defined as experience of verbal harassment, physical attack, damage to property or threats. People who had had this experience were asked what form this harassment took and whether it was due to skin colour, ethnic group or religion.
4.32 As noted in paragraph 4.5, four per cent of people reported that they had
experienced harassment due to their skin colour, ethnic origin or religion, a slight fall on the level reported in 2008-09 (5%).
4.33 The proportion of people who said that they had experienced harassment
due to race or religion was higher among people in all ethnic minority groups (between 10% and 18%) than among White people (2%).
4.34 Between 2008-09 and 2009-10, the proportion of people saying they had
experienced harassment due to their skin colour, ethnic origin or religion decreased within the following ethnic groups: Pakistani people (from 20% to 13%); Indian people (from 16% to 12%); Bangladeshi people (from 18% to 10%); “other” ethnic groups (from 16% to 12%) and among White people (from 3% to 2%). There were no significant changes observed among the remaining ethnic groups (Figure 4.10, Table V.1; also Table 83, 2008-09).

67
4.35 There was also variation in the proportion of people experiencing
harassment due to ethnicity or religion by religious affiliation. Compared with Christian people (3%), people who were Sikh (13%), Muslim (12%) or Hindu (11%) were more likely to have experienced harassment of this nature.
4.36 A decline in the prevalence of harassment due to skin colour, ethnicity or
religion between 2008-09 and 2009-10 was observed amongst Muslim people (from 18% to 12%) and Hindu people (from 16% to 11%)22 (Figure 4.11 Table V.2; also Table 85, 2008-09).
22 Note that the observed decrease among Sikh people is not statistically significant due to low base sizes
Base: Combined sample, England and Wales. Black African (2008-09: 966; 2009-10: 1,088); Other Asian (2008-09: 252; 2009-10: 465); Chinese (2008-09: 183; 2009-10: 178); Mixed race (2008-09: 570; 2009-10: 463); Black Caribbean (2008-09: 873; 2009-10: 928); Pakistani (2008-09: 986; 2009-10: 1,733); Indian (2008-09: 1,548; 2009-10: 1,320); Other (2008-09: 621; 2009-10: 620); Bangladeshi (2008-09: 353; 2009-10: 668); White (2008-09: 8,484; 2009-10: 8,609).
2
10
12
13
13
15
16
17
18
3
18
20
11
17
17
22
15
1216
16
0 5 10 15 20 25 30
White
Bangladeshi
Other ethnic group
Indian
Pakistani
Black Caribbean
Mixed race
Chinese
Other Asian
Black African
2008-092009-10
Figure 4.10: Proportion of people who have experienced harassment in past two years due to skin colour, ethnic origin or religion by ethnicity: 2008-09 & 2009-10
Per cent

68
Base: Combined sample, England and Wales. Sikh (2008-09: 354; 2009-10: 359); Muslim (2008-08: 2,131; 2009-10: 3,799); Hindu (2008-09: 899; 2009-10: 687); Buddhist (2008-09: 152; 2009-10: 125); Other religion (2008-09: 437; 2009-10: 311); No religion (2008-09: 1,868; 2009-10: 2,196); Christian (2008-09: 9,015; 2009-10: 8,613).
3
3
7
11
12
13
3
3
16
18
18
57
6
0 5 10 15 20 25 30
Christian
No religion
Other religion
Buddhist
Hindu
Muslim
Sikh
2008-092009-10
Figure 4.11: Proportion of people who have experienced harassment in past two years due to skin colour, ethnic origin or religion by religion: 2008-09 & 2009-10
Per cent
Multivariate analysis on experience of harassment because of skin colour, ethnic origin or religion
4.37 Logistic regression was carried out to look at the socio-demographic and attitudinal factors that predicted whether someone reported having experienced harassment due to their skin colour, ethnicity or religion after controlling for the influence of a range of other factors. Sections 1.8 to 1.18 provide further details of this multivariate approach and its interpretation while Annex B (Model 6) contains details of the methods including the factors controlled for in the analysis.
4.38 Figure 4.12 shows the associations that were found to be significant in the
multivariate analysis. Significant associations in comparison to the reference category are noted, and the odds ratios indicate the magnitude of effect.

69
Figure 4.12: Model 6: Variables significantly related to experience of harassment due to skin colour, ethnic origin or religion Demographics Variable Categories identified as
significant compared with reference category
Direction of odds (odds ratio)
Age 16-19 65-74 75+
Lower (0.4) Lower (0.3)
Whether born in the UK/Time in the UK
Born in UK Not born in UK, resident 5+years
Higher (1.6)
Gender by ethnicity White males Asian females Asian males Black males Chinese/other ethnic group males
Higher (1.6) Higher (2.3) Higher (3.0) Higher (2.5)
Attitudes and behaviour Level of agreement that people from different backgrounds get on well in local area
Definitely agree Tend to agree Tend to disagree Definitely disagree Don’t know All same background
Higher (1.5) Higher (2.4) Higher (2.5) Lower (0.2) Higher (2.8)
Level of agreement that residents in local area respect ethnic differences between people
Do not disagree Disagree
Higher (1.7)
Importance of religion to sense of self
Not important Very/Quite important
Higher (1.5)
Extent of problem of racial or religious harassment in local area
Not a problem at all Very/fairly big problem Not a big problem
Higher (9.4) Higher (2.8)
Proportion of people in local area with same ethnicity as self
All the same About a half Less than half
Higher (2.2) Higher (3.5)
The key findings were as follows: 4.39 Age was found to be significant in predicting experience of racial or religious
harassment. Thus people aged 65-74 and 75+ had less than half of the odds of people aged 16-19 to have experienced harassment on these grounds.
4.40 As noted in Figure 4.10/paragraph 4.33, ethnic group was associated with
incidence of harassment, although the multivariate analysis found that gender within ethnic group was a predictor of harassment. The odds of Black men having experienced harassment was three times that of the odds of white men, while the odds were also raised for Asian men and women, and for men from Chinese or “other” ethnic groups, when compared with White men.
4.41 Birth outside the UK was a positive predictor of harassment due to race or
religion, with those born outside the UK but resident in the UK for at least five years having a greater chance of reporting experience of harassment compared those who were UK-born.

70
4.42 Those who said that religion was very or quite important to their sense of
identity also had an enhanced likelihood of experiencing harassment compared those who do not consider this important.
4.43 Finally, as with the previous two models, views relating to local cohesion
were associated with people reporting personal experience of harassment due to race or religion. The strongest predictor was a perception that problems of racial or religious harassment existed in the local area. Where people perceived that this type of harassment was a very” or “fairly” big problem in their area, the odds of them having experienced harassment were nearly ten times those of people who did not perceive any problems of this nature. People who disagreed or tended to disagree that people in the local area got on well, or that differences between ethnic groups were respected, also had a higher likelihood of having experienced harassment compared with people who agreed with each of these statements. Finally, where people considered themselves to live in an area where they were a minority, the likelihood of them reporting personal experience of harassment was raised. Thus those who reported that half or less than half of the people in their local area were from the same ethnic group as themselves had a higher chance of citing harassment than those who said that they lived in an area where everyone was from the same ethnic group as themselves.
Nature and cause of harassment
4.44 People who said they had experienced harassment due to their skin colour, ethnic origin or religion in the last two years were asked two further questions to establish the nature and cause of this. Firstly, they were first asked what type of harassment they experienced (for example verbal harassment or a physical attack); secondly they were asked what they considered the cause of the harassment was23.
4.45 In 2009-10, the majority of people who had experienced harassment due to their skin colour, ethnic origin or religion said that the nature of that harassment had been verbal (73%). Twenty three per cent said they had suffered damage to their property and 22 per cent reported threats, while 16 per cent said they had experienced physical attack24. The types of harassment experienced by those who had reported an incidence of this had not changed significantly since 2008-09 (Table W.1).
4.46 Among those experiencing harassment due to their skin colour, ethnic origin
or religion, 67 per cent of people attributed the cause to their skin colour, while 38 per cent attributed it to their ethnic origin, and 18 per cent of people perceived it to be due to their religion (Figure 4.13, Table W.2).
23 The question on perceived cause of harassment was new in 2009-10. 24 Note that people could cite more than one type of harassment and more than one perceived cause.

71
Figure 4.13: Nature and perceived cause of harassment among those experiencing harassment due to their skin colour, ethnic origin or religion in the two years previously: 2008-09 and 2009-10
70
29
2217
73
23 2216
67
38
18
0
10
20
30
40
50
60
70
80
Verbal Damageto
property
Threats Physical Skincolour
Ethnicorigin
Religion
Per
cen
t
Base: Core sample, England and Wales. All who experienced harassment in last two years due to skin colour, ethnic origin or religion (372 for type of harassment in 2008-09 and 278 for type of harassment in 2009-10; 222 for cause of harassment in 2009-10)
Nature of harassment Cause of harassment
2009-102008-09
4.47 A closer look at the perceived reasons for harassment found that some
reasons varied by religion and ethnic group25. Skin colour was the most commonly cited cause of harassment for all religious groups, and this did not vary by religion26. Most strikingly, when compared with Christian people (14%), people who were Muslim (48%) were considerably more likely to cite religion as a cause for the harassment they had experienced (Figure 4.14, Table W.2a).
25 This analysis was restricted to the three largest religious groups (Christian, Muslim and Hindu) and the four largest ethnic groups (White, Asian, Black, Mixed race) due to sample size limitations. 26 Although differences by religion may look sizeable, small base sizes mean that they are not statistically significant.

72
4.48 Skin colour was more likely to be cited as a cause of harassment by Black
people who had experienced harassment (92%) compared with White people (61%) who had experienced this. Ethnic origin however, was less likely to be cited by Black people than by White people as a cause of experienced harassment (18% compared to 34%). Furthermore, Asian people (30%) were more likely to cite religion as a cause of harassment compared with White people (17%).27 (Figure 4.15, Table W.2b).
27 Although other differences by ethnic group may look sizeable, small base sizes mean that they are not statistically significant.
Base: Combined sample, England and Wales, Christian (319); Hindu (74); Muslim (389).
65
75
34
47
148
48
61
41
0
10
20
30
40
50
60
70
80
90
100
Christian Hindu Muslim
Skin colour Ethnic origin Religion
Per cent
Figure 4.14: Cause of harassment among those experiencing harassment due to skin colour, ethnicity or religion in the two years prior to 2009-10 by religion

73
Base: Combined sample, England and Wales, White (132); Asian (439); Black (221). Mixed race (62);
61
7265
34
44
17
30
9 6
92
41
18
0
10
20
30
40
50
60
70
80
90
100
White Asian Black Mixed race
Skin colour Ethnic origin Religion
Per cent
Figure 4.15: Cause of harassment among those experiencing harassment due to skin colour, ethnicity or religion in the two years prior to 2009-10 by ethnic group

74
Conclusions Almost one in ten people were concerned about being the victim of racial or religious harassment, whilst seven per cent of people felt that this type of harassment was a problem in their local area. These figures were considerably raised, however, among ethnic minority groups. Between 2008-09 and 2009-10 there were small declines in each of these measures, although these do not appear to be part of a longer-term trend (where data were available to allow this assessment). Multivariate analysis revealed a number of factors associated with people’s propensity to view harassment as a problem in their local area, or to personally fear this. The two models revealed the following common factors, though to different degrees, as predictors of these perceptions: living in an area of high deprivation; living in an area perceived to have low levels of cohesion; and previous experience of racial or religious harassment. In fact, perhaps not surprisingly, personal experience of harassment was a strong predictor of people’s perceptions of the prevalence of such harassment and of their fear of it, once a range of other factors were accounted for. Whilst rates of actual experience of harassment were four per cent overall, they were considerably higher among all ethnic minority groups compared with White people. Although there was a small decline in experience of harassment between 2008-09 and 2009-10, it was found that declines were particularly steep among Pakistani and Bangladeshi people, although the absence of data before 2008-09 means that it is unclear whether this was part of a longer time trend. Where harassment had been experienced, the nature of this was predominantly verbal as opposed to physical, and people mainly reported their skin colour (rather than their ethnic origin or religion) as the perceived incitement for the attack. Perceived reasons for incitement varied by ethnic group and religion, suggesting that different groups feel vulnerable for different reasons. For example, Black people were more likely than other ethnic groups to cite their skin colour as the incentive, while Muslim people were more likely than other religious groups to cite their religion as the cause.

75
List of tables Table reference and name T.1: Proportion of people who are worried about being physically attacked due to
their skin colour, ethnic origin, or religion, 2007-08 to 2009-10 T.2: Proportion of people who are worried about being physically attacked
because of their skin colour, ethnic origin, or religion, by age within ethnicity T.3: Proportion of people who are worried about being physically attacked
because of their skin colour, ethnic origin, or religion, by ethno-religious group
T.3a Proportion of people who are worried about being physically attacked because of their skin colour, ethnic origin, or religion, by religion
T.4: Proportion of people who are worried about being physically attacked because of their skin colour, ethnic origin, or religion, by gender within ethnicity
T.5: Proportion of people who are worried about being physically attacked because of their skin colour, ethnic origin, or religion, by country of birth within ethnicity
U.1: Perceptions of how big a problem racial or religious harassment is in the respondent’s area, 2007-08 to 2009-10
U.2: Perceptions of how big a problem racial or religious harassment is in the respondent’s area, by age within ethnicity
U.3: Perceptions of how big a problem racial or religious harassment is in the respondent’s area, by country of birth within ethnicity
U.4: Perceptions of how big a problem racial or religious harassment is in the respondent’s area, by ethno-religious group
U.4a Perceptions of how big a problem racial or religious harassment is in the respondent’s area, by religion
U.4b Perceptions of how big a problem racial or religious harassment is in the respondent’s area, by ethnicity
U.5: Perceptions of how big a problem racial or religious harassment is in the respondent’s area, by gender within ethnicity
U.6: Perceptions of how big a problem racial or religious harassment is in the respondent’s area, by Index of Multiple Deprivation
U.7: Perceptions of how big a problem racial or religious harassment is in the respondent’s area, by type of area
U.8: Perceptions of how big a problem racial or religious harassment is in the respondent’s area, by region
V.1: Experiences of harassment because of skin colour, ethnic origin, or religion, by ethnicity
V.2: Experiences of harassment because of skin colour, ethnic origin, or religion, by religion
W.1: Type of harassment experienced because of skin colour, ethnic origin, or religion, 2008-09 to 2009-10
W.2: Cause of harassment among those who have experienced this in the past two years
W.2a: Cause of harassment among those who have experienced this in the past two years, by religion
W.2b: Cause of harassment among those who have experienced this in the past two years, by ethnicity

76
Chapter 5 Equalities
Chapter summary
• Between 2003 and 2009-10, the proportion of people who felt that public service
organisations would treat them differently to other races (either better or worse), fell from 55 per cent to 35 per cent (Paragraph 5.3).
• Black Caribbean people (37%) were notably more likely than White people
(22%) to think they would be treated worse than other races by at least one of eight public services asked about. Conversely, people who were Pakistani (19%), from “other” ethnic groups (15%) or from other Asian groups (13%) were less likely than White people to think they would be treated worse than other races by one of these public service organisations (Paragraph 5.10).
• Social housing and criminal justice organisations (especially the police) were
regarded as the public sector services most likely to be discriminatory. Twenty two per cent and 17 per cent of people respectively, viewed social housing services and the police as services that would treat them differently to other races (Paragraph 5.6).
• Among people who had used social housing services, White people (26%) were considerably more likely than all other ethnic groups (between 4% and 13%) to feel that these services would favour other races over themselves. However, among people who had had contact with criminal justice organisations, White people were less likely (7%) than nearly all other ethnic groups to think that these agencies would discriminate against them on grounds of race (Paragraphs 5.17, 5.30).
• Ethnic variation aside, multivariate analysis revealed some common predictors
associated with people’s propensity to feel discriminated against in favour of other races both by social housing and criminal justice services. These predictors were: people less likely to feel they belonged to their neighbourhood or to Britain, people who favoured reduced levels of immigration, and those who distrusted either the police or parliament (Paragraphs 5.20-5.27; 5.33-5.39).
• Peoples’ experience of religious discrimination by public service organisations was
relatively low overall, at two per cent, although reported rates of discrimination were higher among people who were Muslim (10%), Hindu (4%), and Sikh (5%) or from “other” religions (5%) compared to Christians (1%) (Paragraph 5.46-5.47).
• Seven per cent of people who had looked for employment in the previous five years
said they had experienced discrimination when seeking employment; and six per cent of those who had worked as an employee in this period said they had been discriminated against regarding a promotion. Both of these measures were unchanged on 2008-09 levels. Rates of perceived workplace discrimination on the grounds of race or colour were particularly high among people who were Black African and Black Caribbean (Paragraph 5.51, 5.59-5.60).

77
This chapter covers a number of measures related to how people feel they either would be, or have been, treated by different public services on account of their race or religion. The chapter also covers workplace discrimination according to race and religion, and other characteristics such as age, gender, and illness/disability.
Perceptions of how public services treat people from different races Headline and trend
5.1 People were asked whether, as a member of the public, they thought they
would be treated better, worse, or about the same as people of other races by a range of public service organisations. The question was asked of everyone, regardless of whether people had had any direct contact with that organisation. The following public services were asked about28:
• A council housing department or housing association • A local school • A local doctor’s surgery • The courts (Magistrates’ and Crown Courts) • The Crown Prosecution Service • The police • The Prison Service • The Probation Service
5.2 Focussing first on the overall picture, Figure 5.1 shows the proportion of
people who felt they would be treated differently to other races by at least one of these eight public service organisations over time. The proportion who felt they would be treated better than other races, and the proportion who felt they would be treated worse than other races, are also shown. Overall, 35 per cent of people considered that they would be treated differently to other races, with 23 per cent who thought they would be treated worse than other races, and 17 per cent who thought they would be treated better.
5.3 Since 2003 the proportion of people who felt that public service
organisations would treat them differently to other races (either better or worse) declined. Between 2003 and 2009-10, the rate of perceived racial discrimination on this measure fell steeply from 55 per cent to 35 per cent, and in the context of this longer-term trend the decline between 2008-09 and 2009-10 from 46 per cent to 35 per cent was particularly notable.
5.4 In line with the overall trend noted above, the proportion of people who felt they would be treated better than other races by at least one of the eight public organisations fell appreciably over time from 40 per cent in 2001
28 The survey also covered perceived treatment by local councils and private landlords and the responses in relation to these services are included in table L.1. However, they have been excluded from the analyses in this section which focus on the eight key public service organisations.

78
to 17 per cent in 2009-10. Between 2008-09 and 2009-10 this proportion fell from 25 per cent to 17 per cent. In terms of the proportion who felt they would be treated worse than other races by at least one of these bodies, the trend over time was less clear-cut, increasing between 2001 and 2007-08 (from 23% to 30%), and then declining again between 2007-08 and 2009-10 (from 30% to 23%). Between 2008-09 and 2009-10 the proportion that felt that at least one of these organisations would treat them less favourably than other races fell from 29 per cent to 23 per cent (Figure 5.1, Table L.1b).
Figure 5.1: Proportion of people who expect to be treated worse or better than other races by at least one of eight key public service organisations in 2001 to 2009-10
2328 28 30 29
23
40 38
3328
25
17
48
5551
4846
35
0
10
20
30
40
50
60
2001 2003 2005 2007-08 2008-09 2009-10
Treated worse Treated better Treated differently (worse or better)
Per
cen
t
Base: Core sample, England and Wales (2001: 9,179; 2003: 9,486; 2005: 9,691; 2007-08: 9,331; 2008-09: 9,330; 2009-10: 9,304)
5.5 Figure 5.2 below shows the proportion who felt that they would receive
differential treatment by each of the eight public service organisations asked about, either in terms of being treated better or worse than people of other races.
5.6 Council housing departments or housing associations were regarded as the public service organisations most likely to discriminate on grounds of race, with 22% of people saying they would anticipate differential treatment compared with other races, by these services, in 2009-10. The five criminal justice system organisations were regarded as the next most likely to discriminate on grounds of race and, of these five, the police were regarded as the most discriminatory on this measure, with 17 per cent of people saying that the police would treat them differently to other races. Much smaller proportions of people regarded local schools (6%) or doctors (4%) as likely to provide differential treatment on grounds of race.
5.7 Where discrimination on the grounds of race was perceived, for most
organisations this was fairly equally split in terms of the proportions feeling they would be treated either better or worse than other races. For council housing departments or housing associations, there was a notably higher

79
proportion who felt that these organisations would treat them worse (18%) in relation to other races than would treat them better (4%) (Figure 5.2, Table L.1).
Figure 5.2: Proportion of people who expect to be treated better or worse than other races by public service organisations: 2009-10
2
3
3
5
5
3
6
18
2
3
4
4
5
8
11
4
0 5 10 15 20 25 30
Doctor's surgery
Local school
Probation Service
Crown ProsecutionService
Courts
Prison Service
Police
Housing dept
Expect to be treated better than other racesExpect to be treated worse than other races
Per centBase: Core sample, England and Wales (2009-10: 9,304)
22
17
11
10
9
8
6
4
5.8 In line with the overall decrease in the proportion of people citing any one of
these services as treating them differently from 2008-09 to 2009-10, perceived levels of discrimination among all public service organisations, with the exception of doctors' surgeries, fell between 2008-09 and 2009-10. The most prominent decreases were observed on perceived levels of discrimination by council housing departments and housing associations (which fell from 28% to 22%); the police (from 22% to 17%); and the prison service (from 15% to 11%) (Figure 5.3, Table L.1).

80
Perceptions of racial discrimination by at least one public service organisation, by ethnicity
5.9 As noted in paragraph 5.2, overall, 23 per cent of people thought that at
least one of the eight key public service organisations29 would treat them worse than other races, while 17 per cent thought that they would be treated better by at least one of these services.
5.10 There was clear variation by ethnic group regarding the proportion who
thought they would be treated worse than other races by at least one of the eight public service organisations. Compared with White people (22%), people who were Black Caribbean (37%) were more likely to think that would be treated worse than other races on this measure30. In fact Black Caribbean people were more likely than all other ethnic groups to perceive racial discrimination by at least one public service organisation. Conversely, people who were Pakistani (19%), from “other” ethnic groups (15%) or from other Asian groups (13%) were less likely than White people to think they would be treated worse than other races by at least one public service organisation.
29 Para 5.1 lists the eight public service organisations in question. 30 Observed differences between Mixed race people and White people, and Black Caribbean people and White people, are not statistically significant, due to low base counts.
Figure 5.3: Proportion of people who expect to be treated differently to other races (better or worse) by public service organisations: 2008-09 & 2009-10
4
6
8
9
10
11
17
22
4
7
10
11
12
15
22
28
0 10 20 30 40 50 60
Doctor's surgery
Local school
Probation Service
Crown ProsecutionService
Courts
Prison Service
Police
Housing dept
2008-092009-10
Per centBase: Core sample, England and Wales (2008-09: 9,330; 2009-10: 9,304)
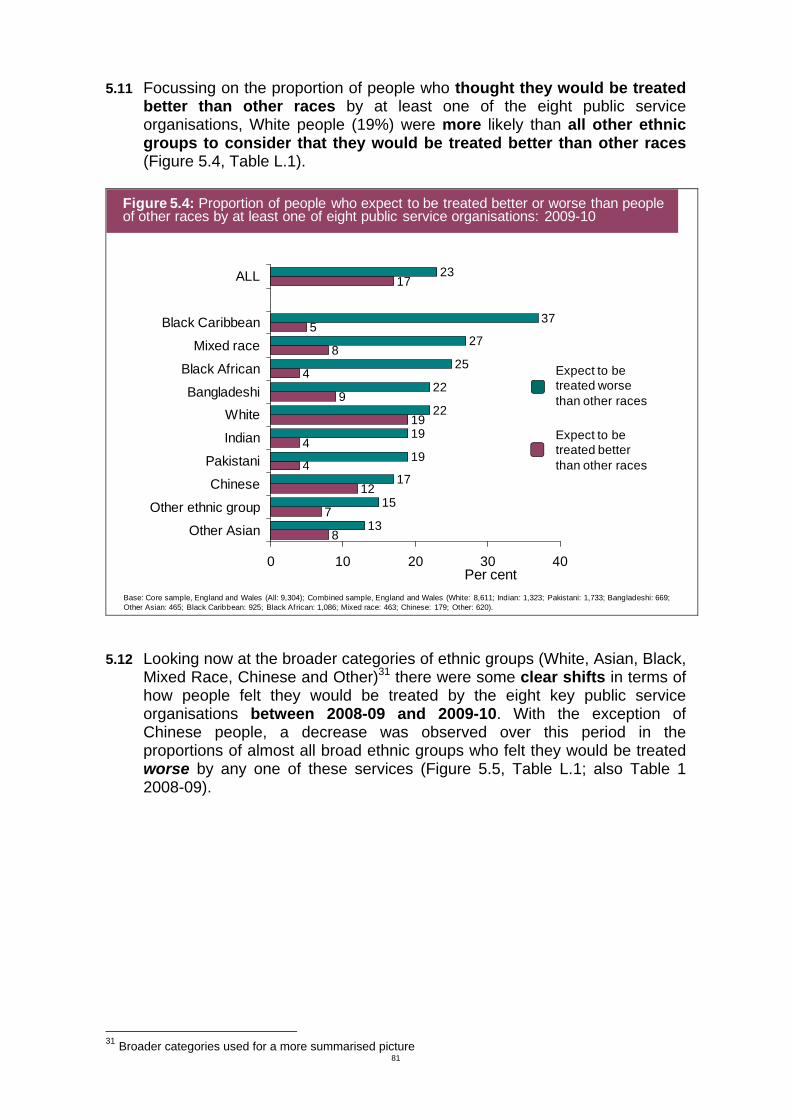
81
5.11 Focussing on the proportion of people who thought they would be treated better than other races by at least one of the eight public service organisations, White people (19%) were more likely than all other ethnic groups to consider that they would be treated better than other races (Figure 5.4, Table L.1).
Base: Core sample, England and Wales (All: 9,304); Combined sample, England and Wales (White: 8,611; Indian: 1,323; Pakistani: 1,733; Bangladeshi: 669; Other Asian: 465; Black Caribbean: 925; Black African: 1,086; Mixed race: 463; Chinese: 179; Other: 620).
8
7
4
4
19
9
4
8
5
17
13
15
19
22
22
25
27
37
23
12
19
17
0 10 20 30 40
Other Asian
Other ethnic group
Chinese
Pakistani
Indian
WhiteBangladeshi
Black African
Mixed race
Black Caribbean
ALL
Figure 5.4: Proportion of people who expect to be treated better or worse than people of other races by at least one of eight public service organisations: 2009-10
Per cent
Expect to be treated worse than other races
Expect to be treated better than other races
5.12 Looking now at the broader categories of ethnic groups (White, Asian, Black,
Mixed Race, Chinese and Other)31 there were some clear shifts in terms of how people felt they would be treated by the eight key public service organisations between 2008-09 and 2009-10. With the exception of Chinese people, a decrease was observed over this period in the proportions of almost all broad ethnic groups who felt they would be treated worse by any one of these services (Figure 5.5, Table L.1; also Table 1 2008-09).
31 Broader categories used for a more summarised picture

82
5.13 Looking at the proportion of people who felt they would be treated better by
any of the eight key public services, the trend by ethnic group between 2008-09 and 2009-10 was less clear cut. In 2009-10, White and mixed race people were less likely than in 2008-09 to consider that they would be treated better by any of these organisations32 (Figure 5.6, Table L.1; see also Table 1, 2008-09).
32 The difference over time among Chinese people was not significant due to low base counts
Figure 5.5 Proportion of people who expect to be treated WORSE than other races by at least one of eight key public service organisations by ethnic group: 2008-09 to 2009-10
29
24
3740
182122
18
3027
1715
0
10
20
30
40
2008-09 2009-10
Per
cen
t
White Asian Black Mixed race Chinese Other
Base: Combined sample, England and Wales. White (2008-09: 8,485; 2009-10: 8,611), Asian (2008-09: 3,147; 2009-10: 4,190); Black (2008-09: 1,884; 2009-10: 2,064), Mixed race (2008-09: 570; 2009-10: 463), Chinese (2008-09: 185; 2009-10: 179), Other (2008-09: 627; 2009-10: 620)

83
Perceptions of racial discrimination by social housing services33 and criminal justice system organisations
5.14 In order to achieve a greater depth of understanding about people who were most likely to regard organisations as providing differential treatment to races other than their own, further analysis was carried out for the two organisations/groups of organisations that were perceived as most discriminatory on the grounds of race. Further analysis focussed on the following two groups:
• people who thought that they would be treated worse than other races
by a council housing department or housing association; • people who thought that they would be treated worse than other races
by any one of the five criminal justice system organisations, namely: the courts, Crown Prosecution Service, Police, Prison Service and Probation Service.
33 This term is used throughout this section to refer to council housing departments and housing associations.
Figure 5.6 Proportion of people who expect to be treated BETTER than other races by at least one of eight key public service organisations by ethnic group: 2008-09 to 2009-10
28
53
14
7 7
19
5 5
8
12
7
0
10
20
30
2008-09 2009-10
Per
cen
t
Base: Combined sample, England and Wales. White (2008-09: 8,485; 2009-10: 8,611), Asian (2008-09: 3,147; 2009-10: 4,190); Black (2008-09: 1,884; 2009-10: 2,064), Mixed race (2008-09: 570; 2009-10: 463), Chinese (2008-09: 185; 2009-10: 179), Other (2008-09: 627; 2009-10: 620)
White Asian Black Mixed race Chinese Other

84
Perceptions of racial discrimination by social housing services 5.15 Whilst the majority of people thought that they would be treated the
same as other races by social housing services, 22 per cent thought that these services would treat them differently to people of other races: 18 per cent of people thought they would be treated worse, and four per cent thought they would be treated better, than other races.
5.16 People who had had direct contact with these housing services over the past five years were more likely than those who had not contacted them in this period to feel that they would be treated worse than other races. Almost a quarter (23%) of people who had had direct contact with these housing services considered that they would be treated worse than other races compared with 17 per cent of people with no such contact (Figure 5.7, Table L1.a).
Figure 5.7: Proportion of people who expect to be treated better or worse than other races by council housing department or housing association by whether used this service in previous five years: 2009-10
Base: Core sample, England and Wales (9,304); All in contact with service (1,772); All not in contact with service (7,529)
Per cent
17
23
18
68
69
68
4
4
4
11
4
10
0 20 40 60 80 100
No contact inpast 5 years
Have contactedservice in past 5
years
ALL
Worse Same Better Don't know
5.17 Among those who had had contact with these social housing services in the previous five years, there was variation by ethnic group in the proportions who thought they would be treated worse than other races. Furthermore, this variation differed from the overall pattern noted in paragraph 5.10/ Figure 5.4, for the eight public service organisations overall. Whilst Black Caribbean people were more likely than all other ethnic groups to feel they would be treated worse by at least one public service organisation, it was White people who were more likely than people from all other ethnic groups to feel that they would be discriminated against by housing services in favour of other races (Figure 5.8, Table M.4).

85
4
5
8
9
10
10
13
26
23
6
0 5 10 15 20 25 30 35
Pakistani
Other Asian
Mixed race
Black African
Bangladeshi
Chinese/Other
Indian
Black Caribbean
White
ALL
Figure 5.8: Proportion of people who have contacted council housing or housing association services in the past five years who expect to be treated WORSE than other races by ethnicity : 2009-10
Per centBase: Combined sample, England and Wales. All (1,772), White (1,592), Indian (187), Pakistani (306), Bangladeshi (222), Other Asian (121), Black Caribbean (334), Black African (470), Mixed race (159), Chinese/Other (214)
Multivariate analysis to identify the characteristics of people who perceived that social housing services would treat them worse than other races
5.18 Logistic regression was carried out to look at the socio-demographic and
attitudinal factors that predicted a feeling among those who had contacted social housing services that they would be treated worse than other races by these services after controlling for a range of other factors. Sections 1.8 to 1.18 provide further details of this multivariate approach and its interpretation while Annex B (Model 7) contains details of the methods including the factors controlled for in the analysis.
5.19 Figure 5.9 shows the associations that were found to be significant in the
multivariate analysis. Significant associations in comparison to the reference category are noted, and the odds ratios indicate the magnitude of effect.

86
Figure 5.9: Model 7: Variables significantly related to perception among those who had had contact with such services that council housing department/housing associations treat them worse than other races Variable Categories identified as
significant compared with reference category
Direction of odds (odds ratio)
Demographics Ethnic group† White
Black Asian Mixed/Chinese/Other
Lower (0.5) Lower (0.3) Lower (0.3)
Region London North West West Midlands
Lower (0.4) Lower (0.4)
Living as single or couple Single Living as a couple
Higher (1.7)
Age 16-19 65-74 75+
Lower (0.2) Lower (0.1)
Highest qualification Degree Higher Education below degree level A level or equivalent GCSE grades A-C or equivalent GCSE grades D-E or equivalent Foreign and other qualifications No qualifications Qualifications not known
Higher (3.0) Higher (2.0) Higher (3.1) Higher (3.4) Higher (3.2) Higher (3.1) Higher (15.9)
Attitudes and behaviours Views on levels of immigration into Britain should be
Remain the same A lot less
Higher (4.2)
How strongly feel you belong to neighbourhood
Very strongly Fairly strongly Not very strongly Not at all strongly
Higher (1.7) Higher (2.1) Higher (2.7)
Extent of problem of racial or religious harassment in local area
Not a big problem at all Very/fairly big problem Not a big problem
Higher (2.3) Higher (1.6)
Trust in police and/or parliament Trust in both A level of distrust in either
Higher (2.0)
† Categories combined in this variable due to low sample sizes

87
The key findings are as follows: 5.20 Ethnicity was associated with people’s perceptions that housing services
would treat them worse than other races.. Compared with White people, people from all broad ethnic minority groups had a much lower likelihood of perceiving that housing services would treat them worse than other races. For details on the bivariate relationship between this perception and ethnicity, see paragraph 5.17/Figure 5.8.
5.21 Region was a further predictor of views on race discrimination by housing
services: compared with those living in London, those living in the North West and West Midlands had less then half the odds of perceiving that they would be treated worse than other races.
5.22 Age was also found to predict this perception, with declining odds by age of
perceiving that housing services discriminated in favour of other races. Thus, compared with people aged 16-19, people aged 65+ had considerably lower odds of holding this perception.
5.23 Compared with single people, those living in a couple had a higher
likelihood of feeling that social housing services would treat them worse than other races.
5.24 Qualifications were also relevant in predicting feelings of racial
discrimination by housing services. Compared with respondents holding a degree or higher, those with all levels of qualifications below degree level had considerably higher odds of believing that housing departments would treat them worse than other races.
5.25 Views relating to the local area were also found to be associated with
feelings of racial discrimination by housing departments. Those who had a weaker sense of belonging to their neighbourhood had higher odds of perceiving racial discrimination by social housing services than those who said they belonged strongly to their neighbourhood. In addition, compared with service users who perceived no problems related to racial and religious harassment in their local area, those who thought this was a very or fairly big problem had higher odds of perceiving racial discrimination by social housing services.
5.26 Attitudes towards the level of immigration in Britain were also related to
perceived discrimination by social housing services. Compared with the odds of service users who felt that immigration levels should remain the same, those who thought that the level of immigration should be reduced a lot had four times the odds of thinking that housing services would treat then worse than other races.
5.27 Finally, a level of distrust in either the police or parliament was found to
predict a feeling of being treated worse than other races by social housing services. Compared with those who trusted both the police and parliament, those who distrusted either institution had twice the odds of believing that they would be treated worse than other races.

88
Perceptions of racial discrimination by Criminal Justice System organisations
5.28 The proportion of people that had contacted at least one of the five criminal
justice system services who rated one of the services they had used as treating them worse than other races, was eight per cent34.
5.29 As with social housing services, people who had come into contact with
each of the individual criminal justice system services (with the exception of the Prison service35) were generally more likely than those who hadn't to feel that they would be treated worse than other races by these organisations. For example, 11 per cent of those who had had direct contact with the Probation Service thought that this service would treat them worse than other races, compared with three per cent of people who had not had any contact with this service (Figure 5.10, Table L.1a).
Figure 5.10: Proportion of people who expect to be treated worse than other races by criminal justice system organisations by whether used each service: 2009-10
3
5
5
3
5
11
11
9
8
8
8
0 5 10 15
Probation Service
Crown Prosecution Service
Courts
Prison Service
Police
At least one of the five criminaljustice services
Had contact with criminal justice services in last 5 yearsNo contact with criminal justice services in last 5 years
Per centBase: Core sample, England and Wales. Users of at least one criminal justice service organisation (3,001); Police: users (2,691), non-users (6,610); Prison Service: users (145), non-users (9,156); Courts : users (733), non-users (8,568); Crown Prosecution Service: users (200),non-users (9,101); Probation Service: users (135), non-users (9,166).
†
34 There is no overall figure for people who had not contacted criminal justice system organisations, as there is for social housing services (Figure 5.7). This is because the criminal justice system measure is based on a composite statistic combining the five different criminal justice organisations (i.e. the Police, the Prison Service, the Courts, the Crown Prosecution Service, and the Probation Service), and while it is possible to calculate the proportion who rated any service they had contacted as treating them worse, there is no equivalent statistic for those who had not contacted any of the five organisations. 35 Difference not significant due to low base size
† On this combined measure, the base for those who have had contact with criminal justice services in the last 5 years is all who have come into contact with any of the five criminal justice services, and the proportion refers to all who said that at least one service they had used would treat them worse than other races.

89
5.30 Among those who had had contact with any of these criminal justice system services in the previous five years, there was variation by ethnic group in the proportion who thought they would be treated worse than other races by any of these organisations. White people (7%) were less likely than people from all ethnic minority groups, with the exception of “Other Asian” and “Chinese or other” ethnic groups, to think that they would be treated worse than other races by criminal justice services they had contacted. Black Caribbean people (34%) were more likely than all other ethnic groups (with the exception of Black African) to believe they would face racial discrimination by at least one of these agencies36 (Figure 5.11, Table M.5).
7
11
16
19
20
25
28
34
8
13
0 5 10 15 20 25 30 35 40
White
Chinese/Other
Other Asian
Bangladeshi
Indian
Pakistani
Black African
Mixed race
Black Caribbean
ALL
Figure 5.11: Proportion of people who expect to be treated WORSE than other races by criminal justice organisations they have used by ethnicity: 2009-10
Per centBase: Combined sample, England and Wales. All (3,001), White (2,807), Indian (309), Pakistani (439), Bangladeshi (163), Other Asian (115), Black Caribbean (274), Black African (276), Mixed race (175), Chinese/Other (191)
*
36 Other apparent differences may not be significant due to small base sizes

90
Multivariate analysis to identify the characteristics of people who perceived that criminal justice system organisations would treat them worse than other races
5.31 Logistic regression was carried out to look at the socio-demographic and
attitudinal factors that predicted a feeling among those who had contacted criminal justice system services that they would be treated worse than other races by at least one of the services they had contacted after controlling for a range of other factors. Sections 1.8 to 1.18 provide further details of this multivariate approach and its interpretation while Annex B (Model 8) contains details of the methods including the factors controlled for in the analysis.
5.32 Figure 5.12 shows the associations that were found to be significant in the
multivariate analysis. Significant associations in comparison to the reference category are noted, and the odds ratios indicate the magnitude of effect.
Figure 5.12: Model 8: Variables significantly related to perception among people that they would be treated worse than other races by at least one criminal justice service they had had contact with: based on all who had had contact with at least one of the five main criminal justice system services Variable Categories identified as
significant compared with reference category
Direction of odds (odds ratio)
Demographics Ethnic group White
Indian Pakistani Bangladeshi Other Asian Black Caribbean Black African Mixed race Other
Higher (4.5) Higher (4.4) Higher (3.1) Higher (3.4) Higher (10.5) Higher (8.2) Higher (5.0) Higher (3.0)
Gender Men Women
Lower (0.6)
Highest qualification Degree GCSE grades D-E
Higher (2.1)
Attitudes and behaviours Views on levels of immigration into Britain
Remain the same A little less A lot less
Lower (0.4) Higher (1.8)
How strongly feel you belong to Britain Very strongly Not at all strongly
Higher (2.7)
Level of agreement that people from different backgrounds get on well in local area
Definitely agree Definitely disagree
Higher (3.9)
Trust in police and/or parliament Trust in both A level of distrust in either
Higher (2.5)
Whether personally experienced harassment due to skin colour, ethnic origin or religion
No Yes
Higher (1.8)

91
The key findings are as follows: 5.33 Ethnicity was identified as a powerful predictor of perceptions of racial
discrimination by criminal justice system services. Compared with White people, members of all ethnic minority groups (with the sole exception of Chinese people) had considerably higher odds of believing that they would be treated worse than other races by criminal justice organisations. Each of these ethnic minority groups had at least three times the odds of White people to hold this view, with Black Caribbean people having over ten times the odds of White people of believing that criminal justice services would treat them worse than other races. For details on the bivariate relationship between racial discrimination by criminal justice organisations and ethnicity, refer to paragraph 5.30/Figure 5.11.
5.34 Gender: Women who had had contact with at least one criminal justice
organisation had a slightly lower likelihood than men of considering that such organisations would treat them worse than other races.
5.35 Qualifications were also related to a person’s perception that criminal
justice services would treat them worse than other races, with those educated to lower grade GCSE level more likely to perceive discrimination on this measure than those educated to degree level. However, as there were no significant relationships observed across other educational categories, there is no clear picture regarding the association between qualifications and perceptions of discrimination by criminal justice organisations.
5.36 A feeling of not belonging to Britain was a further predictor of this belief.
Compared with those who felt a strong belonging to Britain, those who did not feel they belonged at all had a much greater likelihood of perceiving racial discrimination by criminal justice organisations.
5.37 Attitudes towards cohesion in the local community were also found to
predict a person’s perception that criminal justice organisations would treat them worse than other races. Those who disagreed strongly with the view that people in the local area from different backgrounds got on well had considerably higher odds of thinking that criminal justice organisations would treat them worse than other races than those who agreed with this.
5.38 A level of distrust in either police or parliament also predicted whether
respondents held the belief that criminal justice organisations would treat them unfairly compared with other races. Thus, those who had a level of distrust in either of these institutions had over twice the odds of thinking this than those who trusted both.
5.39 Finally, personal experience of harassment on the grounds of skin
colour, ethnic origin or religion was also found to predict views on discriminatory treatment by criminal justice organisations, with those who had directly experienced such harassment being more likely to feel they would be treated worse than other races by criminal justice services, than those who had not experienced this.

92
Groups perceived to receive preferential treatment by public service organisations Headline and trend
5.40 People who said that they would be treated worse than other races by any of
ten37 public service organisations were asked which groups they thought would be treated better than them. This question was asked unprompted to avoid leading people’s responses, and people could mention as many groups as they liked.
5.41 The groups mentioned varied considerably according to the ethnicity
of the respondent. White people were most likely to cite “Asian people” (43%) and “Black people” (28%) as the groups which would receive preferential treatment over themselves. Between a fifth and a quarter of White people mentioned other groups such as “new immigrants” (25%), “Eastern Europeans” (24%), “asylum seekers” (23%) and “Muslims” (20%).
5.42 Black people (81%) and Asian people (77%) however, mainly cited “White
people” as the race they thought would be treated better than them. Compared with White people, Asian and Black people were considerably less likely to mention any other group. For example, “new immigrants”, “Eastern Europeans”, “asylum seekers” and “Muslims” were mentioned very infrequently by Black and Asian people (between 2% and 6%) (Figure 5.13, Table N.1).
37 In addition to the eight key measures discussed in the previous sections of this chapter, respondents were also asked about perceived differential treatment by two further organisations: local council and private landlords. These were not included in previous sections as they did not form part of the eight key organisations which were used as the basis for the summary measure in all previous reports.

93
Note: Percentages can sum to more than 100 as respondents could mention more than one group
Experiences of religious discrimination Headline and trend
5.43 Survey respondents were presented with a list of ten (mainly) public service
organisations and asked whether any had ever discriminated against them because of their religion. The list was as follows:
• A council housing department or housing association • A local school • A local doctor’s surgery • The courts (Magistrates’ and Crown Courts) • The Crown Prosecution Service • The police • The Prison Service • The Probation Service • The local council • A private landlord
Figure 5.13: Groups perceived to be treated better than respondent by ethnic group: 2009-10
6
2
2
3
5
13
81
5
3
2
3
7
10
77
20
23
24
25
28
43
3
0 20 40 60 80
White peopleAsian peopleBlack people
Per centBase: Combined sample, England and Wales. All who think they would be treated worse than other races by at least one of ten public services (White people: 1,907; Asian people: 765; Black people: 613)
“White people”
“Asian people”
“Black people”
“New immigrants”
“East Europeans”
“Asylum seekers”
“Muslims”

94
5.44 Two per cent of people said that they had been discriminated against by at least one of the above organisations due to their religion; this was the same level as in 2008-0938. Over the longer-term, the proportion of people who said they had experienced religious discrimination by any of these organisations had decreased slightly between 2007-08 and 2008-09, from 3 per cent to 2 per cent, whilst 2009-10 levels were unchanged on 2005 levels (also 2%) (Figure 5.14, Table P.1).
Figure 5.14: Proportion of people who feel they have been discriminated against because of religion by at least one public service organisation in 2005 to 2009-10
2
3
2 2
0
2
4
6
2005 2007-08 2008-09 2009-10
All respondents
Per
cen
t
Base: Core sample, England and Wales (2005: 9,662; 2007-08: 9,323; 2008-09: 9,326; 2009-10: 9,289). 5.45 The organisations most commonly cited by respondents as being
discriminatory towards them due to their religion were local schools (1%) and the police (1%). For all other organisations, less than 0.5 per cent of respondents said they had been discriminated against because of their religion, while for the Probation Service the level was zero per cent (Table Q.1).
38 The figures in 2008-09 are not directly comparable with previous years. This is because previous survey questionnaires used a slightly longer list of twelve organisations in the prompt, also including local hospital and immigration authorities. Less than one per cent of people mentioned discrimination by either of these organisations in 2008-09.

95
Experience of religious discrimination by religion 5.46 In line with overall levels of religious discrimination, two per cent of those
with a religious affiliation said that they had experienced discrimination by a public service organisation due to their religion.
5.47 Although the overall prevalence of religious discrimination was very low,
levels of reported discrimination were higher among people affiliated with some religions compared to others. Compared with Christian people (1%), people who were Muslim (10%), Hindu (4%), Sikh (5%) or from “other” religions (5%) reported higher levels of discrimination due to their religion.
5.48 In line with the overall reduction in the proportion of people who cited
religious discrimination by public service organisations, the prevalence of discrimination between 2008-09 and 2009-10 fell slightly among Christian people (from 2% to 1%). There were no changes in levels of discrimination among other religious groups39 (Figure 5.15, Table P.1).
Figure 5.15: Proportion of people who say they have ever experienced discrimination due to their religion by religious group: 2008-09 & 2009-10
2
5
1
5
4
10
1
3
5
3
8
6
12
2
0 5 10 15 20
All religions
"Other" religion
Buddhist
Sikh
Hindu
Muslim
Christian
2008-092009-10
Per centBase: Combined sample, England and Wales. Christian (2008-09: 9,020; 2009-10: 8,603); Muslim (2008-09: 2,129; 2009-10: 3,787); Hindu (2008-09: 902; 2009-10: 683); Sikh (2008-09: 355; 2009-10: 358); Buddhist (2008-09: 153; 2009-10: 125); Other religion (2008-09: 438; 2009-10: 311 ); All religions (2008-09: 12,997; 2009-10: 13,687); No religion (2008-09: 1,868; 2009-10: 2,195)
5.49 There were few differences by religion in the proportions of different religious groups who cited religious discrimination by any one of the ten organisations asked about. It was however evident that Muslims (6%) were more likely than people who were Christian (< 0.5%), Hindu (3%), Buddhist (1%) or from an “other” religion (1%) to report religious discrimination by the police (Table Q.1).
39 Although the apparent falls among those affiliated to other religions follow this same trend, these falls are not significant on account of relatively low base sizes

96
Experiences of workplace discrimination Headline and trend
5.50 People who had either worked as an employee or who had looked for work
as an employee over the previous five years were asked if they had been discriminated against when being refused or turned down for a job during this period. Furthermore, people who had worked as an employee in the previous five years were also asked if they thought they had been discriminated against at work with regard to a promotion or a move to a better job. People who felt they had been discriminated against on either count were asked their reasons for this discrimination, including whether it was due to their gender, age, race, religion or other possible factors.
5.51 Overall, seven per cent of people who had worked or looked for work as an
employee in the past five years said that they had been discriminated against when applying for a job; and six per cent who had worked as an employee in this period said that they had been discriminated against regarding a promotion. There was no change in these levels from those reported in 2008-09.
Reasons for being discriminated against in employment
5.52 People who felt they had experienced discrimination, either through being
refused a job or for a promotion, were shown a card and asked if they felt it was for any of the reasons shown40.
5.53 Of all people who had worked or looked for work as an employee, three per cent said they had been turned down for a job due to their age, two per cent said they had been turned down due to their race, and one per cent mentioned each of the following: their gender; their colour; a disability or long-term illness; where they lived; and 'other' reasons. Discrimination on grounds of religion or belief, or due to sexual orientation, were cited by less than 0.5 per cent of people.
5.54 When asked reasons for discrimination regarding promotion, two per cent of
employees mentioned gender and age, whilst one per cent mentioned race, colour, and “other” reasons. All other reasons were mentioned by less than 0.5 per cent of employees (Figure 5.16, Table S.1).
40 These were: your gender, your age, your race, your religion or beliefs, your colour, your disability or long-term lasting illness, your sexual orientation, where you live, or an ‘other factor.

97
Figure 5.16: Reasons for being refused a job and for being treated unfairly regarding a promotion
1
2
2
1
2
3
1
1
1
1
1
1
0 1 2 3 4 5
Don't know
Other reason
Where you live
Sexual orientation
Disability/Illness
Colour
Religion or beliefs
Race
Age
Gender
Refused a job
Discriminated againstregarding promotion
Per centBase: Core sample, England and Wales (Refused a job: 5,776; Promotion: 5,619)
*
**
*
*
**
*
* denotes < 0.5% 5.55 The proportions of people citing different reasons for being refused a job,
and being discriminated against regarding a promotion, were largely unchanged between 2008-09 and 2009-10 (Table S.1).
5.56 The next section focuses in more detail on the reasons people cited when asked why they felt they had been discriminated against when seeking employment and regarding promotion, in the previous five years. It focuses on discrimination due to gender, race or colour, age, and disability or illness. Other reasons are not explored, primarily due to sample size limitations.
Discrimination on the basis of gender 5.57 Overall, one per cent of people who had looked for work cited gender
as a reason for being discriminated against when refused a job; and two per cent of employees cited gender as a factor in being discriminated against regarding a promotion. Males and females were equally likely to cite gender as a reason for discrimination in relation to being refused a job (in both cases 1%), while female employees were slightly more likely than male employees to cite gender as a reason for discrimination regarding promotion (2% of females compared with 1% of males) (Table S.3).

98
Discrimination on the basis of race or colour 5.58 Overall, two per cent of people cited either race or colour as a factor in
discrimination when being refused a job, while one per cent of people felt this was a factor in their being discriminated against regarding a promotion.
5.59 Compared with White respondents (1%), members of all other ethnic
minority groups (between 4% and 14%) were more likely to cite discrimination on the basis of their race or colour when being turned down for a job. Notably, compared with most other groups (with the exception of mixed race and Chinese people), rates of discrimination on the grounds of race or colour were highest among people who were Black African (14%) and Black Caribbean (13%) (Figure 5.17, Table S.9).
Base: People who had worked as employees or applied for a job in last five years. ‘All’ bar based on core sample, England and Wales (5,776). Other bars based on combined sample, England and Wales (White: 5,280; Indian: 879; Pakistani: 977; Bangladeshi: 392; Other Asian: 318: Black Caribbean: 640; Black African: 763; Mixed race: 341; Chinese: 122; Other : 379)
1
4
6
7
7
8
11
13
14
2
6
0 5 10 15 20
White
Other ethnic group
Bangladeshi
Indian
Chinese
Other AsianPakistani
Mixed race
Black Caribbean
Black African
ALL
Figure 5.17: Proportion who have worked/looked for work in past five years who say that they have been discriminated against when APPLYING for a job due to race or colour by ethnicity: 2009-10
Per cent
5.60 There was a similar ethnic differential in relation to the proportions of
different groups who felt discriminated against on the grounds of their race or colour with regards to being promoted at work. Compared with White respondents (1%), people who were Black African (12%), Black Caribbean (12%), Indian (6%), mixed race (4%) and other Asian (4%) were more likely to cite experience of discrimination regarding a promotion on the basis of their race or colour. As with discrimination experienced when seeking employment, rates of discrimination on the grounds of race or colour were higher among people who were Black African (12%) and Black Caribbean (12%) when compared with all other ethnic groups apart from Chinese people (Figure 5.18, Table S.9).

99
Base: People who had worked as employees in last five years. ‘All’ bar based on core sample, England and Wales (5,619). Other bars based on combined sample, England and Wales (White: 5,144; Indian: 841; Pakistani: 917; Bangladeshi: 359; Other Asian: 305: Black Caribbean: 595; Black African: 709; Mixed race: 315; Chinese: 117; Other : 358)
1
3
4
4
4
6
6
12
12
1
3
0 5 10 15 20
White
Other ethnic group
Bangladeshi
Other Asian
Pakistani
Mixed raceIndian
Chinese
Black Caribbean
Black African
ALL
Figure 5.18: Proportion who have worked as an employee in past five years who say that they have been discriminated against regarding a PROMOTION due to race or colour by ethnicity: 2009-10
Per cent
Discrimination on the basis of age 5.61 Overall, three per cent of people cited age as a reason for discrimination
when being refused a job and two per cent cited age as a reason for discrimination regarding promotion.
5.62 Compared with those aged 16-24 (5%), people aged 24-34 (1%) and 35-49
(2%) were less likely to cite age as a factor behind discrimination when applying for a job, while those aged 50+ were as likely as those aged 16-24 to cite this. This suggests that age discrimination in terms of applying for a job affects those at the younger and older extremes of the working age range. There were no significant differences across age groups in the proportions of people reporting discrimination regarding a promotion due to age (Figure 5.19, Table S.4).

100
Base: People who had worked as employees or applied for a job in last f ive years. Core sample, England and Wales: All (5,776); 16-24 (604); 25-34 (1,132); 35-49 (2,076); 50+ (1,964)
4
2
5
3
1
0 5 10 15 20
50+
35-49
25-34
16-24
ALL
Figure 5.19: Proportion who have worked/looked for work in past five years who say that they have been discriminated against when APPLYING for a job due to age by age group: 2009-10
Per cent
Discrimination on the basis of illness/disability
5.63 Overall, one per cent of people cited illness or disability as a reason for
feeling discriminated against when refused a job, while less than 0.5 per cent reported that a long-standing limiting illness or disability was a reason for discrimination regarding a promotion.
5.64 People who had a long-standing illness or disability were more likely to cite this as a factor behind discrimination both when applying for a job and regarding a promotion. Five per cent of people who had a long-standing limiting illness or disability cited this as a reason for discrimination when being turned down for a job, compared with less than 0.5 per cent of people who did not have an illness or disability. A similar pattern existed for discrimination regarding promotion, with three per cent of those with a long-standing illness or disability citing this type of discrimination compared with less than 0.5 per cent of those without a long-standing illness or disability (Table S.6).

101
Conclusions Perceptions of racial discrimination by key public service organisations (such as social housing departments, the police, and other criminal justice system organisations) fell between 2003 and 2009-10. Of the eight different public service organisations asked about, those associated with the greatest levels of perceived racial discrimination were social housing services and the police, although levels of perceived discrimination by these services had fallen over the previous year, in line with the broader trend. Detailed analysis in this chapter focussed on people’s perceptions about racial discrimination on the part of two public service organisations - social housing services and criminal justice organisations. There was notable variation across the two types of service: while White people were considerably more likely than all other ethnic groups to feel that housing services would favour other races over themselves, they were considerably less likely than nearly all ethnic minority groups to think that criminal justice service organisations would discriminate against them. Black Caribbean people were more likely than nearly all other ethnic groups to believe that criminal justice organisations would treat them worse than people of other races. Ethnic variation aside, multivariate analysis revealed some common factors associated with people’s propensity to think that these two sets of organisations would treat them unfairly compared with other races. Thus people who did not feel they strongly belonged to their neighbourhood or to Britain, those who favoured reduced levels of immigration, and people who distrusted either the police or parliament were all more likely to regard these organisations as likely to treat them worse than other races. People living as a couple, were also more likely to feel that social housing services would treat them less fairly than people of other races. Factors relating to harassment on the grounds of race or religion also appeared relevant to these two issues, with those who considered such harassment to be a problem in their local area being more likely to regard social housing services as likely to treat them worse than other races. Furthermore, people who had actually experienced harassment due to their skin colour, ethnicity or religion were more likely to report Criminal Justice Services as likely to discriminate against them. Compared with perceived racial discrimination, the overall rate of actual experience of religious discrimination by public sector organisations was low (two percent overall). Reported discrimination on grounds of religion however, was notably higher among Muslim people, Sikhs and Hindus than amongst Christian people. Finally, overall rates of experience of workplace discrimination, both in terms of perceived discrimination when applying for a job (7%), and with regards to being promoted (6%), remained unchanged on 2008-09 levels. Black Caribbean and Black African people were considerably more likely than

102
most other ethnic groups to cite discrimination in the workplace on the grounds of race or colour. As Black Caribbean people were also more likely than most other ethnic groups to cite racial discrimination by criminal justice service organisations, this would suggest a wider sense of injustice and experience of racial discrimination among members of this ethnic group.

103
List of tables Table reference and name L.1: Expectations of treatment by public service organisations compared to people
of other races, by ethnicity, 2008-09 to 2009-10 L.1a: Expectations of treatment by six public service organisations compared to
people of other races, by whether had contact with this service in the previous five years
L.1b Proportion of people expecting to be treated worse or better than other races by at least one of eight key public service organisations1 in 2001, 2003, 2005, 2007-08, 2008-09 and 2009-10
M.1: Proportion of people expecting to be treated worse than other races, by organisation and gender within ethnicity
M.2: Proportion of people expecting to be treated worse than other races, by organisation and age within ethnicity
M.3: Proportion of people expecting to be treated worse than other races, by organisation and country of birth within ethnicity
M.4: Proportion of people who had had contact with council housing departments or housing associations who expect to be treated worse than other races by these organisations, by ethnicity
M.5 Proportion of people who had had contact with criminal justice organisations and who expected to be treated worse than other races by any of these organisations, by ethnicity
N.1: Groups who would be treated better than respondent by at least one public service organisation, by ethnicity
P.1: Proportion of people who feel they have been discriminated against because of religion by at least one public service organisation, by religion, 2005 to 2009-10
P.2: Proportion of people who feel they have been discriminated against because of religion by at least one public service organisation, by religion and whether practising or non-practising
P.3: Proportion of people who feel they have been discriminated against because of religion by at least one public service organisation, by ethno-religious group
P.4: Proportion of people who feel they have been discriminated against because of religion by at least one public service organisation, by gender within religion
P.5: Proportion of people who feel they have been discriminated against because of religion by at least one public service organisation, by age within religion
P.6: Proportion of people who feel they have been discriminated against because of religion by at least one public service organisation, by country of birth
Q.1: Organisations from which respondents experienced discrimination because of their religion, by religion
Q.2: Organisations from which respondents experienced discrimination because of their religion, by ethno-religious group
R.1: Proportion of people who have been discriminated against when refused a job and discriminated against with regards promotion, 2003 to 2009-10
S.1: Reasons for being discriminated against when refused a job and discriminated against with regards to promotion, 2008-09 to 2009-10
S.2: Reasons for being discriminated against when refused a job and discriminated against with regards to promotion, by ethnicity

104
S.3: Reasons for being discriminated against when refused a job and discriminated against with regards to promotion, by gender
S.4: Reasons for being discriminated against when refused a job and discriminated against with regards to promotion, by age (four categories)
S.5: Reasons for being discriminated against when refused a job and discriminated against with regards to promotion, by age (two categories)
S.6: Reasons for being discriminated against when refused a job and discriminated against with regards to promotion, by whether the respondent has a long-term limiting illness or disability
S.7: Reasons for being discriminated against when refused a job and discriminated against with regards to promotion, by religion
S.8: Reasons for being discriminated against when refused a job and discriminated against with regards to promotion, by sexual orientation
S.9: Proportion of people who have worked/ looked for work in the past five years who say that they have been discriminated against when applying for a job or with regards to a promotion due to race or colour, by ethnicity

105
Chapter 6 Overall Conclusions: Race, Religion and Equalities The purpose of this report was to present the survey findings on people’s religious practice, their experience and views of religious and racial prejudice and discrimination, to uncover the factors related to these key measures, and to chart their progress over time. The profile of religious affiliation in 2009-10 followed a continuing trend. Thus, while Christianity remained the most prevalent faith in England and Wales, between 2005 and 2009-10 there was a steady decrease in the proportion of people who identified themselves as Christian. As in previous years, Christian people were much less likely than all other main religions to say that they practised their religion, while Muslim people were most likely to practise their religion. In line with previous survey years, the 2009-10 data identified a number of differences by ethnic group and religion in terms of attitudes towards, and experience of, racial and religious prejudice and discrimination. In terms of general perceptions of levels of racial and religious prejudice, people from minority religions and ethnic groups were generally more positive in their views than Christians and White people respectively. Thus, people from non-Christian religions, and especially Muslim people, were generally more positive than Christian people in their views on the level of religious prejudice in Britain, and the extent to which Government protects people from different religions. Likewise, people from non-white ethnic groups were more positive than White people in terms of their views on the level of racial prejudice in Britain. When people focussed on their own circumstances however, minority groups often cited greater levels of experience of discrimination and prejudice. For example, compared with Christian people, Muslim and Sikh people reported greater levels of religious discrimination, and were more likely to feel that they could not practise their religion freely. In addition, compared with White people, rates of reported racial discrimination by criminal justice services were higher for Black African, Black Caribbean and mixed race people. The only exception to this pattern was for perceived racial discrimination by social housing services, where White people continued to report greater levels of discrimination than other ethnic groups. Minority religious and ethnic groups were also more likely than their respective Christian or White counterparts to perceive that racial or religious harassment was a problem in their local area, to be concerned about this, or to report actual experience of it. Multivariate analysis indicated however, that ethnicity and religion were not the only factors that explained increased levels of experience and/or

106
concern about racial or religious harassment. The type of area in which people lived was also relevant. For example, living in an area of high deprivation, an area with low levels of perceived cohesion, or one where most other residents did not share the same ethnic group as the respondent, were all predictors of people being concerned about harassment in their local area and of whether people had actually experienced such harassment. Levels of workplace discrimination were relatively unchanged on previous years. Consistent with the findings noted for discrimination by public sector organisations, Black African and Black Caribbean people were considerably more likely than most other ethnic groups to cite workplace discrimination on the grounds of race or colour. Despite these differences by race and religion, the 2009-10 survey revealed a consistent pattern of positive longer-term change in perceptions of overall racial and religious prejudice. Whilst there were still some areas of concern, such as that just under half of people felt that both racial and religious prejudice had increased over the previous five years, the 2009-10 data continued the improvement observed on several key measures between 2007-08 and 2009-10. Declines were observed in the proportion of people who: • felt that religious prejudice was on the increase; • felt that racial prejudice was on the increase; • felt that Government gave either too much or too little protection to religious
groups; and who • thought that public services discriminated on the grounds of race (this trend
has been evident since 2003). The positive shifts over time noted above were generally observed across all ethnic and religious groups, and were often most pronounced among minority groups.

107
Annex A Methodology This annex summarises the key elements of the methodology used in carrying out the survey, with a particular focus on the analysis of the data undertaken for this report. For a fuller description of the research methodology, please see the Technical Report for the 2009-10 survey, which is available from the Citizenship Survey pages of the Department for Communities and Local Government website: http://www.communities.gov.uk/publications/corporate/statistics/citizenshipsurvey200910technical Sample
The survey sample comprised a core sample, an ethnic minority boost and a Muslim boost.
The core sample comprised a representative sample of people aged 16 and over in England and Wales (though this report includes only respondents in England). Respondents for this sample were selected via random selection of postal addresses (using the Postcode Address File). At each selected address, an interview was attempted with one person aged 16 or over. Where there was more than one person aged 16 or over living at an address a random method was used to select the respondent. In 2009-10, 9,305 interviews were yielded by the core sample.
The boost sample comprised an additional sample of ethnic minority respondents aged 16 and over, achieved through focused enumeration screening in areas with a relatively low density of the ethnic minority population (defined as areas where ethnic minorities accounted for less than 18% of the population), and direct screening in areas with a higher density (18% or more) ethnic minority population. As with the core sample, an interview was attempted at each address where eligible respondents were identified. The combined focused enumeration and direct screening approaches yielded 4,540 interviews in the ethnic minority boost sample.
The Muslim boost sample comprised an additional sample of Muslim respondents aged 16 and over, achieved through direct screening using the addresses issued as part of the high density ethnic minority boost sample (see above). Where no ethnic minority respondents were identified at these addresses, households were then screened for the presence of Muslim residents. Those who were eligible were selected in the same way as other survey respondents. In addition, direct screening was carried out in areas in areas in which at least 2.5% of the population was Muslim. This approach yielded 1,555 interviews in the Muslim boost sample.

108
The core sample gives the most accurate estimates relating to the population as a whole, and is therefore used for the majority of the analysis in this report. Adding the ethnic minority and Muslim boost samples to the ‘core’ sample produces what is referred to as the ‘combined’ sample. This combined sample provides larger numbers of respondents within ethnic and religious sub-groups, and is therefore used for analysis which splits the sample by ethnic and religious group, or country of birth41. The larger number of ethnic minority respondents in the combined sample means that it results in more precise estimates for analysis by ethnicity, religion or country of birth. However, tables which are split by ethnic or religious sub-group also contain a row or column of data for the total population which is based on the core sample (‘All’), as this represents a more accurate base for this purpose.
Questionnaire and fieldwork The survey was carried out via Computer Assisted Personal Interviewing (CAPI), with fieldwork conducted from April 2009 to March 2010. The questionnaire covered peoples’ views of their local area, social networks, fear of crime, local services, volunteering and charitable giving, involvement in civil engagement activities, racial and religious prejudice and discrimination, identity and values, interactions with people from different backgrounds, attitudes towards violent extremism, and questions on peoples’ experiences of the economic downturn. The questionnaire also gathered information on respondent characteristics and household composition.
Area-based data
The data used in the analysis for this report include information gathered during the survey and area-based indicators, which were added subsequently, based on where the respondent lived. These include indicators such as the density of the ethnic minority households in a local area, an area deprivation indicator, and region. A full definition of these indicators is given in Annex C.
Weighting To correct for different chances of selection due to the number of people living at an address and different rates of response among different population groups, weights were calculated which were applied to the data during the analysis. All estimates (percentages and means) cited in this report are based on weighted data. The actual number of respondents upon which estimates are based, are unweighted (referred to as ‘Respondents’ in the tables).
41 Country of birth is closely associated with ethnicity; this is why analysis by this variable is calculated using the combined sample.

109
Confidence intervals and significance
As with all sample surveys, the estimates given in this report represent the mid-point of a range given by their confidence intervals, which indicate the range within which there is a high probability that the true population value falls. The standard errors for key survey estimates, which can be used to calculate confidence intervals, are given in the Citizenship Study 2009-10 Technical Report.
All differences commented on in this report are statistically significant at the 95 per cent level. This means that there is a 95 per cent chance that the observed difference has arisen due to a true difference in the population, rather than due to random variation in survey samples. The statistical significance of bivariate relationships shown in this report can be checked using the Ready Reckoner developed for use with the Citizenship Survey data and published together with the tables for each report: http://www.communities.gov.uk/communities/research/citizenshipsurvey/recentreports/
Calculation of data on reasons for being discriminated against with regards to a promotion
The 2005 figure for this question is not directly comparable to the 2003, 2007-08 and 2008-09 figures due to a routing error in the 2005 survey. This error meant that the question was not asked to people who had been in employment in the past 5 years but were no longer employees (with the exception of those who were now self-employed). These people should have been asked this question and were included in 2003, 2007-08 and 2008-09 surveys, so are subsequently included for the 2003, 2007-08 and 2008-09 figures but not for 2005. Please note the 2003 figures presented in this report were calculated on a different basis to those reported in the 2005 Race and faith topic report (this different methodology was used in order to make the 2003 figures comparable to the 2005 figures

110
Annex B Multivariate outputs For a definition of terms highlighted in bold, please refer to the “Glossary of terms” used in multivariate analysis at the end of this section. Introduction Logistic regression, a form of multivariate analysis, was used in a number of places throughout this report to investigate socio-demographic and attitudinal factors that are associated with different outcome variables, after controlling for the possible influence of a range of factors. This type of multivariate analysis (as opposed to bivariate analysis) enables us to better estimate the relationship between individual socio-demographic variables (such as ethnicity) and outcomes of interest (such as experience of racial or religious harassment) by controlling for the possible influence of other characteristics (such as age, gender, or religion) when calculating the strength of the relationship between the variable and the outcome (i.e. ethnicity and experience of harassment in this example). In this way, we can identify the key factors which are significantly associated with a key outcome after controlling for other variables. The outcome variables that were selected for logistic regression in this report were chosen because they were of particular interest. Multivariate analysis for this report explored what variables were associated with (or could predict) whether someone:
• felt that religion affected their everyday life; • believed that Muslims received too much Government protection; • felt they were unable to practise their religion freely; • felt that racial or religious harassment was a problem in their local area; • was worried about being attacked due to their skin colour, ethnicity or
religion; • had experienced racial or religious harassment; • felt that public services (housing and criminal justice services) would treat
them worse than other races; In some cases, it was not possible to run multivariate analysis on key variables due to sample size limitations.

111
Method In each case, the modelling was undertaken in two stages, using SPSS software. The first stage (Stage 1) involved running the model using demographic variables only, and the second stage (Stage 2) then investigated the further effect of including non-demographic variables such as attitudes and behaviours, after “locking in” to the model those demographic variables which were found to be statistically significant at the first stage. If these demographic variables initially found to be significant had not been “locked” into the model, then some key demographic associations might have been “masked” by associations with some of the non-demographic variables – in other words we would be in danger of inflating the importance of some of the non-demographics in explaining the outcome of interest. For this reason, outputs from both of these stages of the model were used in our interpretation, and any demographic variables identified as statistically significant but then no longer found to be so once non-demographic variables were included in the model, have been highlighted as such in the output. Each of the two stages outlined above, was run in two steps (a and b). At each step, the model was first run using the standard regression module of SPSS (step a), and then the model with these significant variables only was re-run using the complex samples module in SPSS (step b). This approach allowed elements of the sample design (such as clustering, weighting and stratification) to be taken into consideration. At this step b, within each stage, the model was further refined by dropping any variables that were no longer found to be statistically significant. Thus, essentially the process of running each model involved four steps as summarised below. • Step 1a: First, a “demographics only” model was run in the standard SPSS
regression module using a backwards stepwise42 approach to determine those variables that were statistically significant.
• Step 1b: The above process was repeated using the complex samples module. Any variables no longer found to be statistically significant were dropped.
• Step 2a: At this stage, the significant demographics from the first block were
entered and locked into the model, while a backwards stepwise procedure was used to identify those non-demographic variables which were statistically significant once the demographics were controlled for. This model was run using the standard regression module of SPSS.
• Step 2b: Finally, the model was re-run using the complex samples module. Any variables no longer found to be statistically significant were dropped.
Models were run on the full sample (including sample boosts) for respondents in England and Wales, and weighted data were used.
42 “Backward stepwise” means that all the variables were entered into the model at the outset and then eliminated in an iterative process until only the ones that were statistically significant remained. See also the Glossary at the end of this section.

112
Statistical significance Throughout these steps, statistical significance was set at the 95 per cent level (p value < 0.05). Missing values For the demographic and non-demographic variables entered into the model, in most cases, missing values (e.g. don’t know, not applicable) were allocated to agreed categories. Where the missing value category was sufficiently large it was retained as a separate code within the variable; otherwise the missing values were combined with either the modal category or another suitable category. Selection of predictor variables As noted above, logistic regression aims to identify whether and to what extent various socio-demographic and attitudinal factors help explain key outcome measures. These variables are referred to here, and elsewhere in this report, as predictor variables. A standard group of predictor variables was identified, which included key demographics such as age, gender, ethnicity and religion. Further predictor variables were selected from the non-demographic variables depending on their relevance to the outcome variable. The choice of predictor variables in each case was based on a number of criteria including: findings from previous reports in the series; particular hypotheses that had been identified as of interest; and variables linked to policy interest. Where there was collinearity (a strong correlation) between two predictor variables, only one was chosen to be entered. The variables selected for each model are summarised in Table B.1. The key for Figure B.1 is provided at the end of the table. Index of Multiple Deprivation In order to look at the relationship between deprivation and key survey outcomes across England and Wales we needed to use the respective indices of multiple deprivation (the English Indices of Deprivation 2007 and the Welsh Index of Deprivation 2008). While the two sets of indices measure similar domains, there are some differences in how they are calculated, and there is no agreed or straightforward way of combining the indices. We opted for an approach which classified the respondents on the decile of multiple deprivation of the Lower Layer Super Output Area in which they lived, derived from the ranking within each country. Thus when we interpret the results we can say that respondents who reside in, for example, the 10% most deprived Lower Super Output Areas (LSOAs) in their country have a higher/lower likelihood to exhibit an outcome than respondents who fall into the 10% least deprived LSOAs in their country. It is not correct to assume that ranks are directly comparable between countries.

113
Figure B.1: Outcome variable and predictor variables entered into each model, with significant predictor variables highlighted Model Model 1 Model 2 Model 3 Model 4 Model 5 Model 6 Model 7 Outcome variable Perception that
religion affects everyday life
Perception that Muslims receive too much Government protection of their rights
Person’s perception that their religion cannot be freely practised
Perception that racial or religious harassment is a very or fairly big problem in the local area
Whether people are very or fairly worried about being attacked due to skin colour, ethnicity or religion
Whether people have experienced harassment due to skin colour, ethnicity or religion
Perception amousers that sochousing servicwould treat theworse than othraces
Base All with a religion (n=13,903)
All (n=16,060) All who practise a religion (n=7,830)
All (n=15,355) All (n=16,070) All (n=16,129) All used theservices (n=3,623)
Demographic variables entered at first stage Region X X X X X X X Location (Urban/rural) X X X X X X X Index of Multiple Deprivation decile X X X X X X Tenure X X X X X Length of time in neighbourhood X X X X X X X Legal marital status X Living as single or couple X X X X X Presence of child in home X X X X X X X Socio-economic group (NS-SEC, self) X X X X X X X Limiting long-term illness or disability X X X X Age X X X X X Gender X X X X Ethnic group X X X X X X X Gender by age X X Gender by ethnicity X X X Highest qualification X X X X X X X Religion X X X X X X X Whether practising religion X X Gender by practise of religion X X X X Whether born in UK/time in UK X X X X X X X Whether parents UK-born X X X Non-demographic variables entered at second stage Main language - English X X X X X X How strongly feel you belong to neighbourhood
X X X X X X
How strongly feel you belong to Britain X Enjoy living in neighbourhood X X X X X Level of agreement that people from different backgrounds get on well in local area
X X X X
X X
Trust in police and/or parliament X X X

114
Figure B.1: Outcome variable and predictor variables entered into each model, with significant predictor variables highlighted (continued) Model Model 1 Model 2 Model 3 Model 4 Model 5 Model 6 Model 7 Outcome variable Perception that
religion affects everyday life
Perception that Muslims receive too much Government protection of their rights
Person’s perception that their religion cannot be freely practised
Perception that racial or religious harassment is a very or fairly big problem in the local area
Whether people are very or fairly worried about being attacked due to skin colour, ethnicity or religion
Whether people have experienced harassment due to skin colour, ethnicity or religion
Perception amousers that sochousing servicwould treat theworse than othraces
Base All with a religion (n=13,903)
All (n=16,060) All who practise a religion (n=7,830)
All (n=15,355) All (n=16,070) All (n=16,129) All used theservices (n=3,623)
Whether mix socially with people from different backgrounds in private
X X X X X X
As above – mixing in public X X X X X Main source of news or current affairs X X X X X Satisfaction with life as a whole X X Importance of ethnicity to sense of self X X X X Importance of religion to sense of self X X X X X X Proportion of friends with same ethnicity as self
X X X X
Proportion of people in local area with same ethnicity as self
X X X X
Level of agreement that residents in local area respect differences between people
X X X X X
Proportion of friends same religion as self
X X X
Extent of problem of racial or religious harassment in local area
X X X X X
Attitude towards mixing between different ethnic/religious groups in local area
X X X X X X X
View on level of immigration into Britain X X X X X X X Whether personally experienced harassment due to ethnic origin or religion
X X X X
Civic participation X X X X
KEY: X Entered but not found to be significant X Entered and found to be significant in final model X Demographic variables entered, found to be significant at first stage, but not significant at second stage

Detailed statistics for each model
The tables in the link below indicate the detailed statistics for each model, which are provided in summary form in the main text. Models are numbered 1 to 8 and correspond with the labelling used in the main text. Regression output for Models 1 to 8 has been published in files alongside this report. Each table contains the predictor variables which were identified as significant in the final model. Some brief notes on interpretation are provided below. Odds ratios and reference categories As noted in Chapter 1, a key output that can be calculated from logistic regression analysis is the odds ratio. Odds are a simple way of representing the likelihood of an outcome occurring (the probability). An odds ratio compares the probability of observing an outcome (e.g. people feeling that their religion affects their everyday life) for one category of a predictor variable (e.g. Hindu people) with the probability of the same outcome occurring in another category of the same variable (e.g. Christian people) after controlling for other predictor variables in the model. For each predictor variable, a category is selected to be a reference category. The reference category is selected as the baseline odds against which the odds of all other categories of that variable are compared in order to calculate the odds ratio. The reference group is usually selected on pragmatic grounds: in non-ordinal variables such as ethnicity or religion, the reference category is generally the modal category. For an ordinal variable the reference category is generally at either end of the scale, e.g. for the deprivation variable, the reference category might be people living in the 10 per cent least deprived areas, as illustrated in the above example; and for education the reference category might be “Degree or higher”, as the highest level of qualification. Reference categories for particular variables may vary by model, depending on any sample size limitations. An odds ratio of greater than one implies an increased probability for the outcome to be met for one particular group compared with the reference category, whereas an odds ratio of less than one implies a decreased probability for the outcome to be met for that particular group compared with the reference category. For example, the outputs from Model 1 showed that Pakistani people had just over one and a half times the odds of White people of saying that religion affected their everyday life, while practising men had twice the odds of non-practising men of saying this. Conversely, in this same model, the odds of someone with no qualifications of saying that religion affected their everyday life were around 7/10ths or 0.7 times the odds of someone who had a degree of saying this. In the attached output for each model, the reference categories are indicated by the categories at the bottom of the list of categories for each variable. Odds ratios which are statistically significant at 95% (p < 0.05) are indicated with a single asterix (*), while those significant at 99% (p < 0.01) are indicated by **. Glossary of terms used in multivariate analysis

116
Terms are presented in alphabetical order. Backwards stepwise procedure Backward stepwise regression is where the analysis begins with a full or saturated model (i.e. includes all the potential predictor variables). In order to produce the most simplified model, for each of interpretation, variables are then dropped from the model in an iterative process. At each step, the model without the dropped variable is compared against the model with the variable. This comparison tests whether the revised model fits the data as well as the previous model. When no more variables can be dropped from the model, the analysis has been completed. Bivariate analysis This simple form of analysis focuses on associations between pairs of variables without taking into account the role or influence of other variables. Typically such analysis might explore how a change in one variable (for example, religion) is associated with a change in another variable or outcome of interest (e.g. whether people have experienced harassment due to race or religion). For example, in this report, we note that there is a significant relationship between religion and experience of such harassment, with Hindu, Muslim and Sikh people being the most likely of all religious groups to have experienced harassment Collinearity (Multi) Collinearity means that two or more independent (predictor) variables are highly correlated. (Multi) Collinearity can result in estimated coefficients having large standard errors. It is thus preferable to include only one of a group of highly correlated variables in the analysis. Complex samples Module (SPSS) Many samples in general population surveys are based on a complex sample design (e.g. a design that involves stratification, clustering and unequal probabilities of selection) rather than a simple random sample. The Complex Samples module of SPSS allows the specifications of a complex design to be incorporated into data analysis, thus ensuring more accurate estimates. Demographic variable (or socio-demographic variable) Variables based on population characteristics such gender, race, age, disability, educational attainment, working status, income etc.

117
Logistic regression A common form of multivariate analysis where the aim is to predict the presence or absence of a binary outcome in the variable of interest. Variables of interest can be recoded, if necessary, to create a binary outcome. Examples of binary outcome variables used for the multivariate analysis in this report are “whether people feel that religion affects their everyday life” (yes/no) and “whether people have experienced racial or religious harassment” (yes/no). Logistic regression aims to find the best predictors of a binary event occurring, after the possible influence of a range of factors has been accounted for, thus eliminating variables whose observed bivariate association with the outcome variable may lie simply in their close association with other predictor variables. Multivariate analysis Analysis that explores the relationships between more than two variables simultaneously. Logistic regression is one example of multivariate analysis. Non-demographic variables Variables based on opinions, attitudes or behaviours. Non-ordinal variables (also known as nominal variables) A non-ordinal variable is one that has two or more categories, but there is no intrinsic ordering to the categories. For example, gender, religion and ethnicity all have two or more categories but there is no agreed way to order these from e.g. “highest” to “lowest”. Odds Odds are a simple way of representing the likelihood or probability of an outcome or event occurring. The odds of an event occurring is calculated as the ratio of the probability of an event occurring to the probability of an event not occurring. Odds ratio An odds ratio compares the odds of an outcome of interest occurring in one category of a predictor variable (e.g. Hindu people feeling that their religion affects their everyday life) with the odds of the same outcome occurring for respondents who fall into another category (the reference category) of the same variable (e.g. Christian people feeling that their religion affects their everyday life). This allows interpretation of the direction of likelihood of the outcome as well as the magnitude of how much more or less likely the event is when comparing two characteristics, given that other factors are kept the same. Ordinal variable An ordinal variable is a categorical variable where there is a is a clear ordering or ranking of the categories from e.g. “low” to “high” or from “high” to “low”. Examples in this report include age group, education, and deprivation.

118
Outcome variables (also referred to as dependent variables) The outcome variable in logistic regression refers to the attribute, behaviour or perception that regression analysis tries to explain (or predict) in terms of its relationships with predictor variables that have been entered into a model. In this report, the outcome variables selected were those of most interest. For example, outcomes in this report include: whether people feel that religion affects their everyday life and whether people have experienced racial or religious harassment. Predictor variables (also referred to as independent variables) A predictor variable is one that can be used to help predict the value of an outcome variable in logistic regression. For example if the outcome is that someone has experienced racial or religious harassment, then one might hypothesise that gender, age, ethnicity, and religion might help predict this outcome. Thus, these variables would be included in the initial model as potential predictor variables. p-value The p-value, used in tests of statistical significance, represents an indication of the reliability of a statistical result. Specifically, it expresses the probability that an observed test statistic has arisen due to chance, as a result of sampling variation. The higher the p-value, the less we can believe that the observed relationship between variables in the sample is a reliable indicator of the relationship between these variables in the population. The standard threshold set for statistical significance is a p-value of < 0.05 which indicates that there is a lower than 5% probability that the relationships between the variables found in the sample have occurred by chance. See also statistical significance. Statistical significance As the survey uses responses from a random sample to estimate responses from the population, differences between estimates from successive years or between sub-groups may occur by chance due to sampling variation. Tests of statistical significance are used to identify which differences are sufficiently large for us to conclude that they are unlikely to have occurred by chance. This enables us to be reasonably confident that differences exist in the wider population. In this report, tests at the five per cent significance level have been applied (p-value < 0.05). This is the level at which there is only a five per cent probability of an observed difference being solely due to chance and a 95% probability that the observed relationship exists in the population.

119
Annex C Definitions and terms See Annex B for a separate list of definitions of terms used in multivariate analysis.
All minority ethnic groups
Results from this survey combine the 16-point census classification into 11, 5 or 2 summary groups. All non-white ethnic groups are included in the 2-group classification as ‘all minority ethnic groups’.
Area characteristics
A range of area based indicators including region, Index of Multiple Deprivation and urban/rural.
Charitable giving
Giving money to charity
Civic activism Involvement in either direct decision-making about local services or issues, or in the actual provision of these services by taking on a role such as a local councillor, school governor or magistrate.
Civic consultation
Active engagement in consultation about local services or issues through activities such as attending a consultation group or completing a questionnaire about these services.
Civic engagement
Any civic participation, civic activism or civic consultation activities.
Civic participation
Engaging in one of the following activities: • contacting a local councillor, Member of Parliament, Member of the Greater London Assembly or National Assembly for Wales; • contacting a police official working for a local council, central Government, Greater London Assembly or National Assembly for Wales; • attending a public meeting or rally; • taking part in a public demonstration or protest; or • signing a petition.
Combined sample
The full sample of 16,140 people interviewed in the 2009-10 survey, including the core and ethnic minority and Muslim boost samples (see Annex A for further details).
Community cohesion
The Citizenship Survey measures cohesion by whether people feel that people from different backgrounds get on well together in their local area.
Computer assisted personal
The survey questionnaire is driven by a computer program that determines the questions, range and structure of permissible answers, and provides instruction to the interviewer to assist them

120
interview in delivering the survey appropriately.
Core sample
The core sample of 9,305 people interviewed in 2009-10 (see Annex A for further details).
Criminal Justice Service organisations
These are: the police, prisons, the courts, the Crown Prosecution Service, and the probation service.
Economically inactive
People who are neither in employment or unemployment. This includes those looking after a home or retired or permanently unable to work.
Ethno-religious group
A derived measure combining ethnicity and religion.
Formal volunteering
Giving unpaid help through groups, clubs or organisations to benefit other people or the environment.
Harassment
People were asked if they had personally experienced harassment because of their skin colour, ethnic origin or religion in the last two years. Harassment was defined as experience of verbal harassment, physical attack, damage to property and threats. Those with personal experience were asked what form this harassment took and whether it was due to their skin colour, ethnic group or religion.
Index of Multiple Deprivation
The index was developed by Communities and Local Government and combines a number of indicators which cover income, employment, health and disability, education, skills and training, housing and access to services into a single deprivation score for each area. The measure used in this report is based on the 2007 summary IMD index – see http://www.communities.gov.uk/publications/communities/indiciesdeprivation07 for further details. The index is calculated differently for Welsh areas compared with English areas.
Informal volunteering
Giving unpaid help as an individual to people who are not relatives.
Integration (attitudes and behaviour relating to)
Results/ information based on a range of variables relating to peoples’ attitudes towards mixing with members of different ethnic and religious groups.
Local area Area within 15-20 minutes walking distance of respondent’s home.
Long-term limiting illness or disability
Respondents who report a long-standing illness, disability or infirmity.
Meaningful Defined as ‘mixing with people on a personal level by having

121
interaction informal conversations with them at, for example, the shops, your work or a child’s school, as well as meeting up with people to socialise’. However, it excludes ‘situations where you’ve interacted with people for work or business, for example just to buy something’.
Private mixing Defined as mixing with people from different ethnic or religious groups in a private place: your home or their home or at a group, club or organisation you belong to.
Public mixing Defined as mixing with people from different ethnic or religious groups in a public place: work, school or college, a child's crèche, nursery or school, a pub, club, café or restaurant, the shops, or public buildings.
Region A spatial administrative division of England and Wales, comprising nine regions in England (North East, North West, Yorkshire and the Humber, East Midlands, West Midlands, East of England, London, South West and South East) and Wales.
Regular volunteering
Defined as involvement at least once a month over the year before interview.
Respondent religion
Analysis by religion uses answers to the question ‘What is your religion even if you are not currently practising?’ in order to define respondents’ religion. This means that respondents are defined as belonging to a religion with which they identify, but do not necessarily actively practice. Respondents who said that they had a religion were then also asked ‘Do you consider that you are actively practising your religion?’ The answers to this question are used to compare those who said they were practicing a religion with those who said they were not.
Sample size The number of people interviewed for the survey. In 2009-10 this was 9,305 core interviews with an additional 6,835 interviews from ethnic minority and Muslim boost samples, resulting in a total 16,140 interviews (see Annex A for further details).
Sexual identity People were asked which of the following best describes their sexual identity: heterosexual/straight, gay or lesbian, bisexual, other or if they would prefer not to say. People who said ‘other’ that they ‘preferred not to say’ or ‘don’t know’ were excluded from analysis by sexual identity.
Socio-economic group
An occupationally-based measure derived from the National Statistics Socio-economic classification (NS-SEC). See http://www.ons.gov.uk/about-statistics/classifications/current/ns-sec/index.html for further details.
Statistical significance
Because the survey uses responses from a random sample to estimate responses from the population, differences between estimates from successive years and between sub-groups may

122
occur by chance due to sampling variation. Tests of statistical significance are used to identify which differences are unlikely to have occurred by chance; thus we can be reasonably confident that differences exist in the wider population. In these reports, tests at the five per cent significance levels have been applied. This is the level at which there is only a five per cent probability of an observed difference being solely due to chance) and a 95 per cent probability that the observed relationship exists in the population. All reported differences are statistically significant to the 95 per cent level, unless otherwise stated.
Unemployed Measure based on the International Labour Organisation (ILO) definition which counts as unemployed those who are without a job, are available to start work in the next two weeks, who want a job and have been seeking a job in the last four weeks or are waiting to start a job already obtained.
Urban/rural Areas are classified as urban if the settlement is above 20 hectares, the land use is urban in character and the population count is 10,000 or over.
Users of public service organisations
Defined as people who had used a particular public service organisation in the last five years as a member of the public.
Weighting The data are weighted to ensure that the reported findings are representative of the population of England and Wales. Further details on the weighting process are included in the Citizenship 2009/10 Technical Report.
Workplace discrimination
Based on whether people had been discriminated against when refused or turned down for a job or with regard to a promotion or move to a better position in the last five years.