rabbit food task (a.rei.12) - achieve · task: rabbit food target common core ... animal science;...
TRANSCRIPT
1
This task was developed by high school and postsecondary mathematics and agriculture sciences educators, and validated by content experts in the Common Core State Standards in mathematics and the National Career Clusters Knowledge & Skills Statements. It was developed with the purpose of demonstrating how the Common Core and CTE Knowledge & Skills Statements can be integrated into classroom learning – and to provide classroom teachers with a truly authentic task for either mathematics or CTE courses.
TASK: RABBIT FOOD TARGET COMMON CORE STATE STANDARD(S) IN MATHEMATICS: A.CED.2 Create equations in two or more variables to represent relationships between quantities; graph equations on coordinate axes with labels and scales.*
A.CED.3 Represent constraints by equations or inequalities, and by systems of equations and/or inequalities, and interpret solutions as viable or nonviable options in a modeling context.*
A.REI.12 Graph solutions to a linear inequality in two variables as a half-plane and graph the solution set to a system of linear inequalities in two variables as the intersection of the corresponding half-planes.
N.Q.1 Use units as a way to understand problems and to guide the solution of multi-step problems; choose and interpret units consistently in formulas; choose and interpret the scale and the origin in graphs and data displays.*
N.Q.3 Choose a level of accuracy appropriate to limitations on measurement when reporting quantities.*
TARGET STANDARDS FOR MATHEMATICAL PRACTICES MP.1 Make sense of problems and persevere in solving them.
MP.2 Reason abstractly and quantitatively.
MP.4 Model with mathematics.
MP.6 Attend to precision.
TARGET COMMON CORE STATE STANDARD(S) IN ELA/LITERACY: RST.9-10.1 Cite specific textual evidence to support analysis of science and technical texts, attending to the precise details of explanations or descriptions.
RST.9-10.3 Follow precisely a complex multi-step procedure when carrying out experiments, taking measurements, or performing technical tasks, attending to special cases or exceptions defined in the text.
RST.9-10.5 Analyze the structure of the relationships among concepts in a text, including relationships among key terms (e.g., force, friction, reaction force, energy).
RST.9-10.7 Translate quantitative or technical information expressed in words in a text into visual form (e.g., a table or chart) and translate information expressed visually or mathematically (e.g., in an equation) into words.
TARGET CAREER AND TECHNICAL EDUCATION (CTE) KNOWLEDGE & SKILLS STATEMENTS: AGPA01.02.01 Execute key processes related to food product development and enhancement.
AGPA01.03 Plan, implement, manage, and/or provide services associated with the preservation and packaging of food and
food products to prepare products for distribution.
AGPC01.03.03 Analyze feedstuffs and the animal nutrient requirement and determine if the ration is adequate.
RECOMMENDED MATHEMATICS COURSE(S): Algebra 1 or Geometry; Integrated Math I or II; Animal Science; Agribusiness Management; Food Science
ADDITIONAL INSTRUCTIONS: This task can be completed in one day and may be used as a formative or summative assessment. Graphing utility may or may not be helpful. Having students graph the linear equations on graph paper may be an important part of the assessment/learning experience.
* Modeling standards appear throughout the CCSS high school standards and are indicated by a star symbol (*).

2
About the Common Core State Standards in Mathematics The Common Core State Standards (CCSS) for Mathematics are organized by grade level in grades K–8. At the high school level, the standards are organized by conceptual category (number and quantity, algebra, functions, geometry, and probability and statistics), showing the body of knowledge students should learn in each category to be college and career ready, and to be prepared to study more advanced mathematics. The Standards for Mathematical Practice describe ways in which developing student practitioners of the discipline of mathematics increasingly ought to engage with the subject matter as they grow in mathematical maturity and expertise throughout the elementary, middle and high school years. www.corestandards.org
About the Common Core State Standards in English Language Arts/Literacy The Common Core State Standards (CCSS) for ELA/Literacy are organized by grade level in grades K–8. At the high school level, the standards are organized by 9-10 and 11-12 grade bands. Across K-12 there are four major strands: Reading, Writing, Speaking and Listening, and Language. The CCSS also include Standards for Literacy in History/Social Studies, Science, and Technical Subjects, with content-specific (Reading and Writing) literacy standards provided for grades 6-8, 9-10, and 11-12, to demonstrate that literacy needs to be taught and nurtured across all subjects. www.corestandards.org
About the Career Cluster Knowledge and Skill Statements As an organizing tool for curriculum design and instruction, Career Clusters™ provide the essential knowledge and skills for the 16 Career Clusters™ and their Career Pathways. It also functions as a useful guide in developing programs of study bridging secondary and postsecondary curriculum and for creating individual student plans of study for a complete range of career options. As such, it helps students discover their interests and their passions, and empowers them to choose the educational pathway that can lead to success in high school, college and career. http://www.careertech.org/career-clusters/resources/clusters/agriculture.html. Although not included in this template, all Clusters and Pathways have Foundational Academic Expectations and Essential Knowledge & Skills Statements, which, in some cases, overlap with the Common Core State Standards.
KEY TERMS Fat/Carbohydrate/Protein ratio Optimum price or cost Graphing constraints Feasible region
3
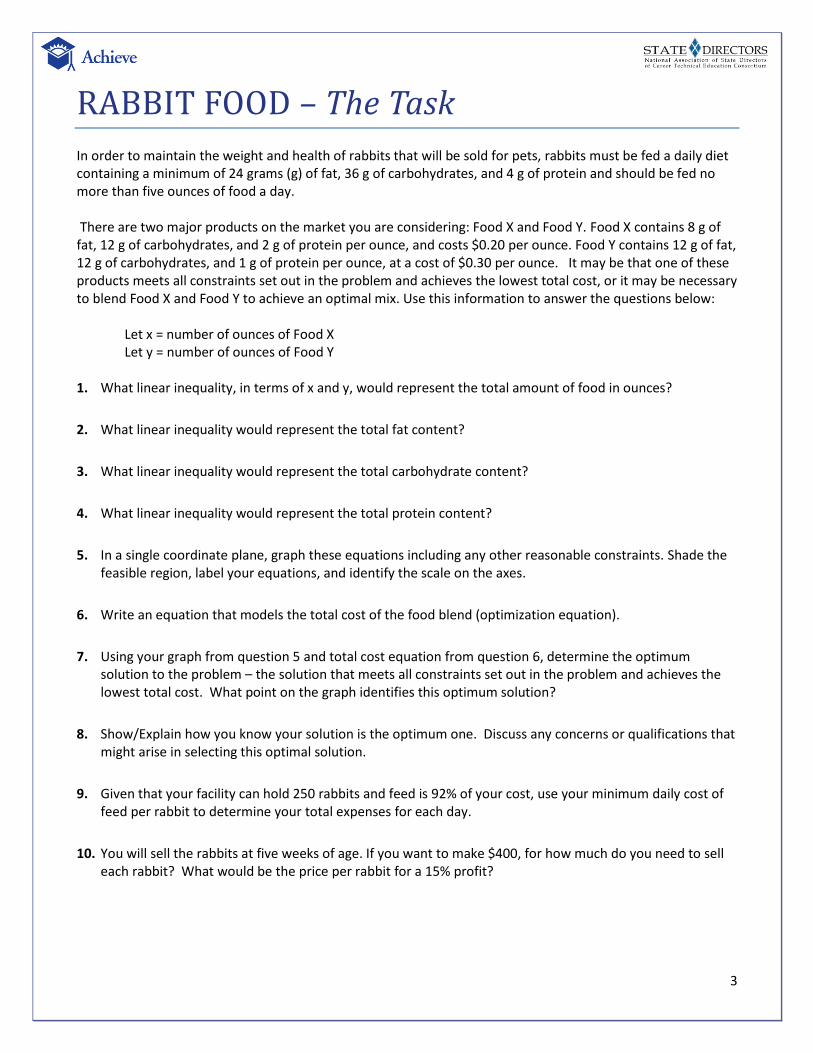
RABBIT FOOD – The Task In order to maintain the weight and health of rabbits that will be sold for pets, rabbits must be fed a daily diet containing a minimum of 24 grams (g) of fat, 36 g of carbohydrates, and 4 g of protein and should be fed no more than five ounces of food a day. There are two major products on the market you are considering: Food X and Food Y. Food X contains 8 g of fat, 12 g of carbohydrates, and 2 g of protein per ounce, and costs $0.20 per ounce. Food Y contains 12 g of fat, 12 g of carbohydrates, and 1 g of protein per ounce, at a cost of $0.30 per ounce. It may be that one of these products meets all constraints set out in the problem and achieves the lowest total cost, or it may be necessary to blend Food X and Food Y to achieve an optimal mix. Use this information to answer the questions below: Let x = number of ounces of Food X Let y = number of ounces of Food Y 1. What linear inequality, in terms of x and y, would represent the total amount of food in ounces?
2. What linear inequality would represent the total fat content?
3. What linear inequality would represent the total carbohydrate content?
4. What linear inequality would represent the total protein content?
5. In a single coordinate plane, graph these equations including any other reasonable constraints. Shade the feasible region, label your equations, and identify the scale on the axes.
6. Write an equation that models the total cost of the food blend (optimization equation).
7. Using your graph from question 5 and total cost equation from question 6, determine the optimum solution to the problem – the solution that meets all constraints set out in the problem and achieves the lowest total cost. What point on the graph identifies this optimum solution?
8. Show/Explain how you know your solution is the optimum one. Discuss any concerns or qualifications that might arise in selecting this optimal solution.
9. Given that your facility can hold 250 rabbits and feed is 92% of your cost, use your minimum daily cost of feed per rabbit to determine your total expenses for each day.
10. You will sell the rabbits at five weeks of age. If you want to make $400, for how much do you need to sell each rabbit? What would be the price per rabbit for a 15% profit?

4
RABBIT FOOD – Possible Solution(s)
Since there cannot be negative amounts of food, the first two constraints are: x > 0 and y > 0. The other constraints come from total ounces of food, and grams of fat, carbohydrates, and protein per ounce.
1. Total ounces of food: x + y ≤ 5 or y ≤ - x + 5 2. Fat content: 8x + 12y ≥ 24 or y ≥ -(2/3) x + 2 3. Carbohydrate content: 12x + 12y ≥ 36 or y ≥ - x + 3 4. Protein content: 2x + y ≥ 4 or y ≥ -2x +4 5.
6. The equation that models total cost of the food blend is the cost relation: C = 0.2x + 0.3y. 7. At any place in the shaded area the fat/carb/protein requirements are met. All feasible solutions to the problem are contained in the shaded region. To find the optimum solution, substitute the coordinate pairs at the intersections of the boundaries into the objective function (total cost equation) and compare the total cost:
Where y = -x + 5 intersects x = 0 and y = 0: (5, 0) and (0, 5)
Where y = - 2x + 4 intersects x = 0: (0, 4)
Where y = - x + 3 intersects y = 0: (3, 0)
Where y = - 2x + 4 intersects y = - x + 3: (1, 2)
Point 0.2x + 0.3y = Total cost
(0, 5) 0.2(0) + 0.3(5) = $1.50
(5, 0) 0.2(5) + 0.3(0) = $1.00
(0, 4) 0.2(0) + 0.3(4) = $1.20
(3, 0) 0.2(3) + 0.3(0) = $0.60
(1, 2) 0.2(1) + 0.3(2) = $0.80

5
The minimum cost will be 3 ounces of Food X and 0 ounces of Food Y, corresponding to coordinate point (3,0) for a total cost of $0.60 per ounce. 8. At the point (3, 0) we find the minimum cost. All other intersection points have a larger total cost than (3, 0). The fat/carb/protein ratio for 3 oz of Food X would be 24/36/6, which falls within the constraints of the requirements (a minimum of 24/36/4). While 3 ounces of food is only 60% of the maximum total amount of food recommended, it is assumed that it is adequate since the problem specifies no clear minimum for the number of ounces a rabbit should eat each day. This might, however, be a consideration if experience shows the caloric intake to be insufficient for rabbits to thrive. 9. 250 rabbits times $0.60 per day = $150.00 per day (daily cost for rabbit food). $150 = 92% of X 150 / 0.92 = $163.04
The total daily expense for raising the rabbits is $163.04 10. 5 weeks = 7 x 6 days = 35 days Expenses for five weeks = 35($163.04) = $5706.40
$400 profit: Total revenue would need to be $5706.40 + $400 = $6106.40 Divide total revenue by the number of rabbits: $6106.40/ 250 = $24.43 price per rabbit 15% profit: Using the revenue (R)/profit formula:
15.0%1540.5706$
40.5706$
R
R – $5706.40 = 0.15($5706.40) = $855.96 R = $855.96+ $5706.40 = $6562.36
Now divide the total revenue by the number of rabbits: $6562.36 / 250 = $26.25 price per rabbit
6
RABBIT FOOD – Possible Extensions The extensions below represent potential ways in which mathematics and/or CTE teachers can build on the task above. All of the extensions are optional and can be used in the classroom, as homework assignments, and/or as long-term interdisciplinary projects. 1. You decide that it may be to your advantage, and the advantage of other rabbit farmers, to create a new
off-the-shelf food product that exactly meets the minimum requirements for fat, carbohydrates, and protein. Describe the steps you will need to go through, and the issues you will need to consider, as you examine this alternative.
2. Collect data from other rabbit farmers to determine what food products they are now using for their rabbits and the costs associated with their choices. Determine whether or not they are receptive to a new food product and what the cost would need to be for you to have a marketable product.
3. Research the average costs of pet rabbits in your community. How do your rabbits compare, price-wise? Describe a few way in which you can bring down your prices, other than adjusting the rabbits’ food intake.
20
‘
75 ‘
7
RABBIT FOOD – Appendix: Alignment Ratings
The rating system used in the following charts is as follows:
3 EXCELLENT ALIGNMENT:
The content/performance of the task is clearly consistent with the content/performance of the Common Core State Standard.
2 GOOD ALIGNMENT:
The task is consistent with important elements of the content/performance of the CCSS statement, but part of the CCSS is not addressed.
1 WEAK ALIGNMENT:
There is a partial alignment between the task and the CCSS, however important elements of the CCSS are not addressed in the task.
N/A: For Mathematical Practices a content rating does not apply.
In the charts C = Content Rating and P = Performance Rating
COLOR KEY Black = Part of CCSS/K&S Statement
aligned to task Gray = Part of CCSS/K&S Statement not
aligned to task
8
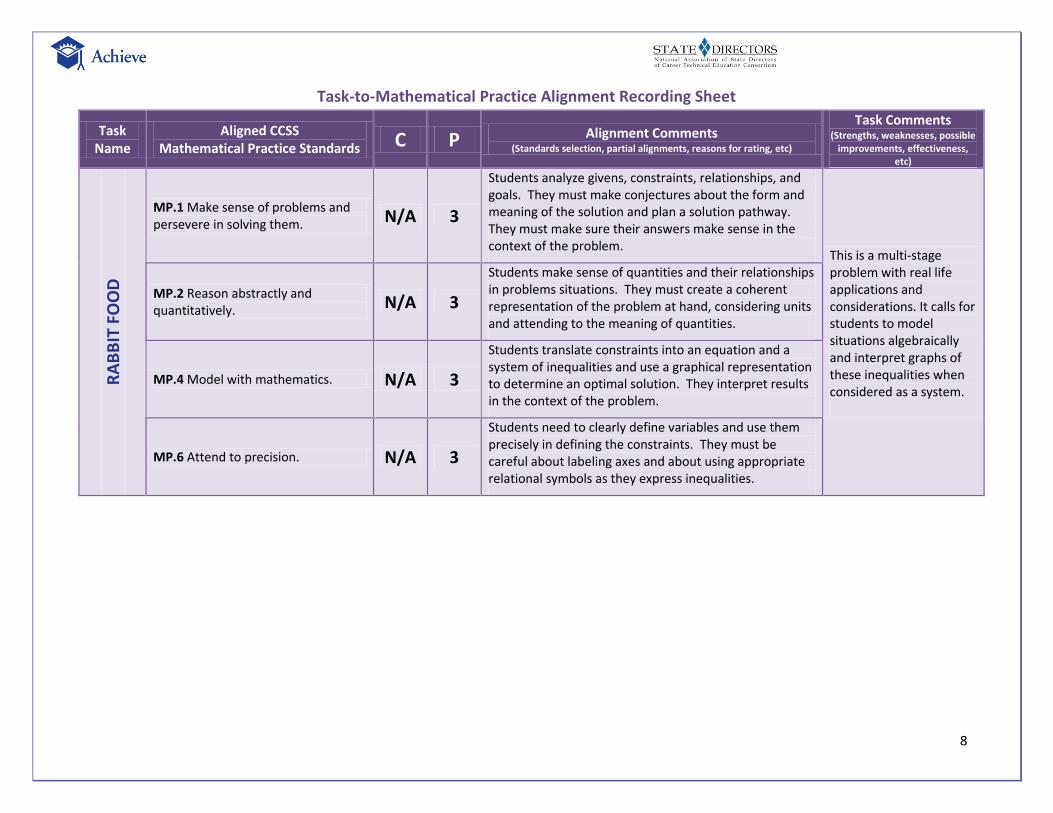
Task-to-Mathematical Practice Alignment Recording Sheet
Task Name
Aligned CCSS Mathematical Practice Standards C P Alignment Comments
(Standards selection, partial alignments, reasons for rating, etc)
Task Comments (Strengths, weaknesses, possible
improvements, effectiveness, etc)
RA
BB
IT F
OO
D
MP.1 Make sense of problems and persevere in solving them. N/A 3
Students analyze givens, constraints, relationships, and goals. They must make conjectures about the form and meaning of the solution and plan a solution pathway. They must make sure their answers make sense in the context of the problem.
This is a multi-stage problem with real life applications and considerations. It calls for students to model situations algebraically and interpret graphs of these inequalities when considered as a system.
MP.2 Reason abstractly and quantitatively. N/A 3
Students make sense of quantities and their relationships in problems situations. They must create a coherent representation of the problem at hand, considering units and attending to the meaning of quantities.
MP.4 Model with mathematics. N/A 3
Students translate constraints into an equation and a system of inequalities and use a graphical representation to determine an optimal solution. They interpret results in the context of the problem.
MP.6 Attend to precision. N/A 3
Students need to clearly define variables and use them precisely in defining the constraints. They must be careful about labeling axes and about using appropriate relational symbols as they express inequalities.
9
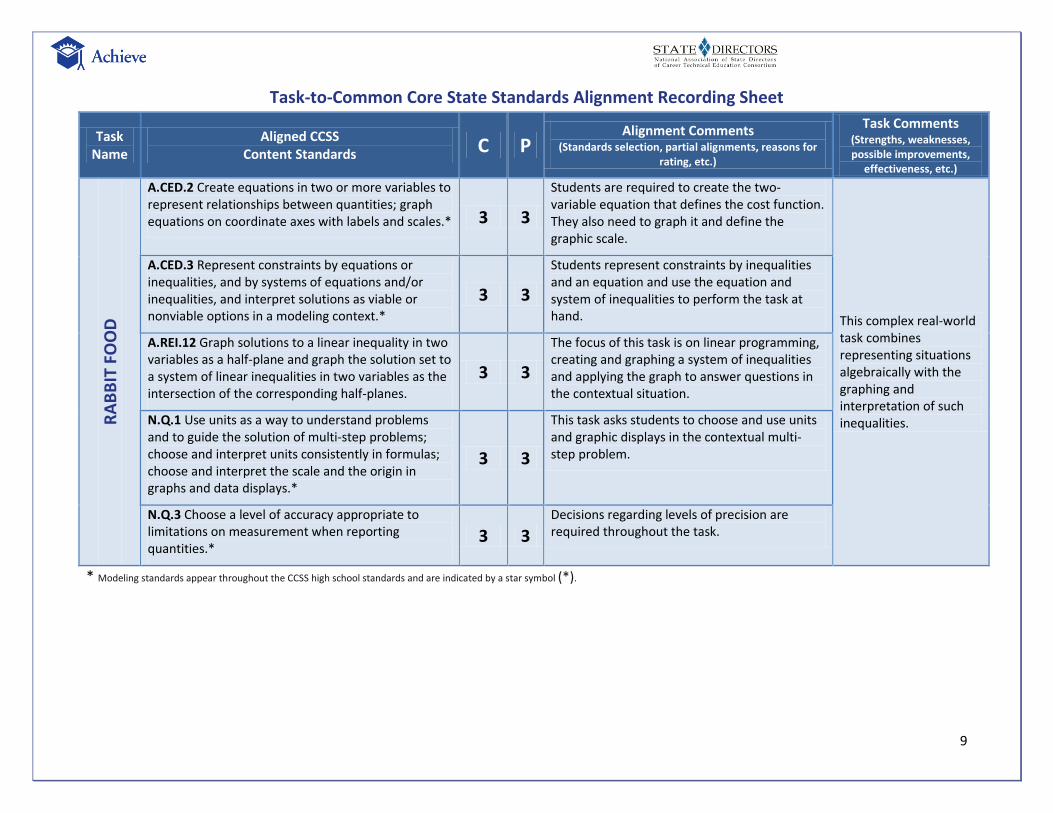
Task-to-Common Core State Standards Alignment Recording Sheet
Task Name
Aligned CCSS Content Standards C P
Alignment Comments (Standards selection, partial alignments, reasons for
rating, etc.)
Task Comments (Strengths, weaknesses, possible improvements,
effectiveness, etc.)
RA
BB
IT F
OO
D
A.CED.2 Create equations in two or more variables to represent relationships between quantities; graph equations on coordinate axes with labels and scales.* 3 3
Students are required to create the two-variable equation that defines the cost function. They also need to graph it and define the graphic scale.
This complex real-world task combines representing situations algebraically with the graphing and interpretation of such inequalities.
A.CED.3 Represent constraints by equations or inequalities, and by systems of equations and/or inequalities, and interpret solutions as viable or nonviable options in a modeling context.*
3 3
Students represent constraints by inequalities and an equation and use the equation and system of inequalities to perform the task at hand.
A.REI.12 Graph solutions to a linear inequality in two variables as a half-plane and graph the solution set to a system of linear inequalities in two variables as the intersection of the corresponding half-planes.
3 3
The focus of this task is on linear programming, creating and graphing a system of inequalities and applying the graph to answer questions in the contextual situation.
N.Q.1 Use units as a way to understand problems and to guide the solution of multi-step problems; choose and interpret units consistently in formulas; choose and interpret the scale and the origin in graphs and data displays.*
3 3
This task asks students to choose and use units and graphic displays in the contextual multi-step problem.
N.Q.3 Choose a level of accuracy appropriate to limitations on measurement when reporting quantities.*
3 3 Decisions regarding levels of precision are required throughout the task.
* Modeling standards appear throughout the CCSS high school standards and are indicated by a star symbol (*).

10
Task-to-National Career Cluster Knowledge & Skills Statements Alignment Recording Sheet Task
Name Aligned National Career Cluster Knowledge &
Skills Statements C P Alignment Comments Task Comments
RA
BB
IT F
OO
D
AGPA01.02.01 Execute key processes related to food product development and enhancement.
2 2
The task requires students to comply with specific standards for feeding rabbits. Students must identify an optimal blend for the food, while minimizing cost.
Overall, the task uses the application of raising rabbits to demonstrate the mathematical calculations involved in determining an outcome.
AGPA01.03 Plan, implement, manage, and/or provide services associated with the preservation and packaging of food and food products to prepare products for distribution. 1 2
The task requires students to plan and manage tasks associated with food products due to the parameters set for a healthy rabbit diet and the constraints imposed by the two food products available for blending. The task does not relate clearly to preservation, packaging or distribution.
AGPC01.03.03 Analyze feedstuffs and the animal nutrient requirement and determine if the ration is adequate. 2 1
The task provides the nutrient requirement and the feedstuffs for the animals, but provides an opportunity to calculate adequate nutritional needs and incorporates cost evaluation.