search.jsp?r=19870018010 2018-03 … will reach 2,400 gb. the data volume expected in the seven...
TRANSCRIPT
https://ntrs.nasa.gov/search.jsp?R=19870018010 2018-06-05T08:44:35+00:00Z

NASA Technical Memorandum 87826
Mass Storage Systems for Data Transport in the Early Space Station Era 1992-1998
Edited by Richard Carper and John Dalton Goddard Space Flight Center Greenbelt, Maryland
Mike Healey, Linda Kempster, and John Martin Computer Technology Associates, Inc. Lanham, Maryland
Fred McCaleb, Stanley Sobieski, and John Sos Goddard Space Fligbt Center Greedelt, Maryland
National Aeronautics and Space Administration
Scientific and Technical Information Office
1987

EXECUTIVE SUMMARY
NASA recognizes there will be a data storage problem resulting from the data volumes and data rates to be produced by the increasingly sophisticated payloads scheduled to become operational during the Space Station (SS) era. The magnitude of the data storage problem, possible system architectures, and potential technology solutions are documented in this report.
BACKGROUND
History indicates that NASA received an average of 1 gigabyte (GB) of data from spacecraft each day during 1985; by the mid-l990s, daily volumes from space-based payloads will reach 2,400 GB. The data volume expected in the seven years from 1992 through 1998 is 5,300,000 GB (5300 terabytes (TB)). Operation of data capture recorders will have to increase from 1 - 2 Megabits per second (Mbps) to 100 - 300 Mbps. The diverse problems associated with this tremendous growth rate will require careful study and analysis.
A Mass Data Storage Study Team was formed in April 1986 at the NASA Goddard Space Flight Center to assess and document the storage requirements and conceptual archectural options associated with receiving, transporting, processing, and delivering SS data. The team was tasked to determine what technology developments, if any, would have to be funded or sponsored in order to perform the required ground system activities.
MISSION MODEL REQUIREMENTS MIX
In order to size the data storage requirements, a mission model was developed that represented the major contributors to data volume and data rate problems. This mission model is portrayed at a high level in Figure 1. The 17 instruments listed are scheduled for launch at different times. The horizontal lines indicate how each instrument is associated with one of five planned spacecraft, and the column headings portray the different processing centers for the data.
The selected instrument mix generated the full range of NASA storage subsystem requirements between receipt of data on earth and final delivery to the customer. The following overview of the resulting requirements mix will be followed by a discussion of potential storage subsystem solutions.
Data Rates
Data produced by the instruments will seldom equal the full capacity of the communication channel. Spacecraft may transmit at selectable data rates as necessary, or may use "fill data" to fully occupy the assigned channel capacity. Four of the spacecraft identified above - SS, Eos POP#l, Eos POP#2, and ESA POP - are planned to each have a KSA link of up to 300 Mbps capacity. In 1992 and 1993, the 300 Mbps rate will come from the SS. In 1994, Eos POP #1 and #2 will be activated, generating an additional 600 Mbps for a potential total rate of 900 Mbps. The ESA POP will come online in 1995 to push the potential rate to 1200 Mbps. The years from 1995 to 1998 show no additional links being utilized. The peak rate, and the associated volumes, must be captured at a ground terminal.
iii

1904 A s 0
STO ss I 1994 1 992 sx ’ 1 so2 AN
I 1 9 9 7 Sumor
us COP
1992
I I I I Figure 1 Mission Model
Table 1 describes the peak and average rates for the years where a large change is projected. The table also shows the total peak and average data rates that must be handled by each processing center after the initial fill data is removed and after rate buffering is performed at the ground terminal.
Storage Volumes
Table 2 for the years 1992, 1994, and 1996. These numbers represent the volumes of data delivered to the three identified processing centers (GSFC, JSC, and JPL) after the initial removal of fill data.
The data rates identified in Table 1 will produce the daily data volumes shown in
POTENTIAL SOLUTIONS FOR TEMPORARY STORAGE SUBSYSTEMS
Storage requirements were addressed from a functional viewpoint, rather than from an instrument, satellite, or mission viewpoint. A range of possible architectures was studied to identify the required characteristics of temporary storage subsystems. Three categories of subsystems have been identified which could satisfy the requirements of any of the selected architecture options.
1. Fast Access Subsystems in this category could satisfy all of the temporary storage requirements,
but it is unlikely that a single configuration would be a practical solution in all cases. Temporary storage subsystems would be used to ingest the 300 Mbps serial data streams as they are received (or perhaps after initial removal of fill data), to provide short-term (eight- hour) protection against data loss because of failures in data distribution or subsequent data processing. These subsystems also would be used for online working storage (six-hour) required in the processing area where data is sorted, time ordered, annotated, and assembled for delivery to subsequent processing centers. The assembled data could be delivered at a rate different from the rate at which the data was received (rate conversion).
i v

-_-_-__ -_--_-- _------ ----- MRIR Eos POP 21.00 1 .00 SEASAR ESAPOP 200.00 0.23 AS0 ss 50.00 0.67 STO ss 10.00 0.25 HST FF 1.02 0.21 LASA-B ESAPOP 1 .00 0.75 MODIS EosPOP 5 .00 1 .00 VIS Eos POP 2.00 1 .00 TIMS Eos POP 29.00 0.10 AXAF USCOP 0.06 0.21 SIRTF USCOP 2.00 0.21 AT ss 3 .00 0.50 _______I________-_-_____-__-_
GSFC TOTAL AVERAGE DATA RATE GSFC TOTAL PEAK DATA RATE
----_- ____-- ------ 21.00
50.00 10.00 2.50 10.00 1.02 0.21 1.02
5.00 2.00
29.00 0.06 2.00 3 .00
---__- -__--- _--_-- 2.71
11.02 123.08
-_---- 21.00
33.33 2.50 0.21
5.00 2.00 2.90 0.01 0.42 1.50
68.88 ___---
-__--_ 21 .00
200.00 50.00 10.00 1.02 1 .oo 5.00 2.00
29 .00 0.06 2.00 3.00 _-----
324.08
------ 21.00 46.00 33.33 2.50 0.21 0.75 5 .00 2.00 2.90 0.01 0.42 1.50
115.63 _-_--_
Tabk 2 Daily Volumer at M l p Pmccsshg Ccnkra
sP= processillg Year Instrument Vehicle Location
1992 1994 1996
360 27 27 2 2
54 22 31
--- 227 497 360 27 2 8
54 22 31
0.14 5
16
1249 ----
V
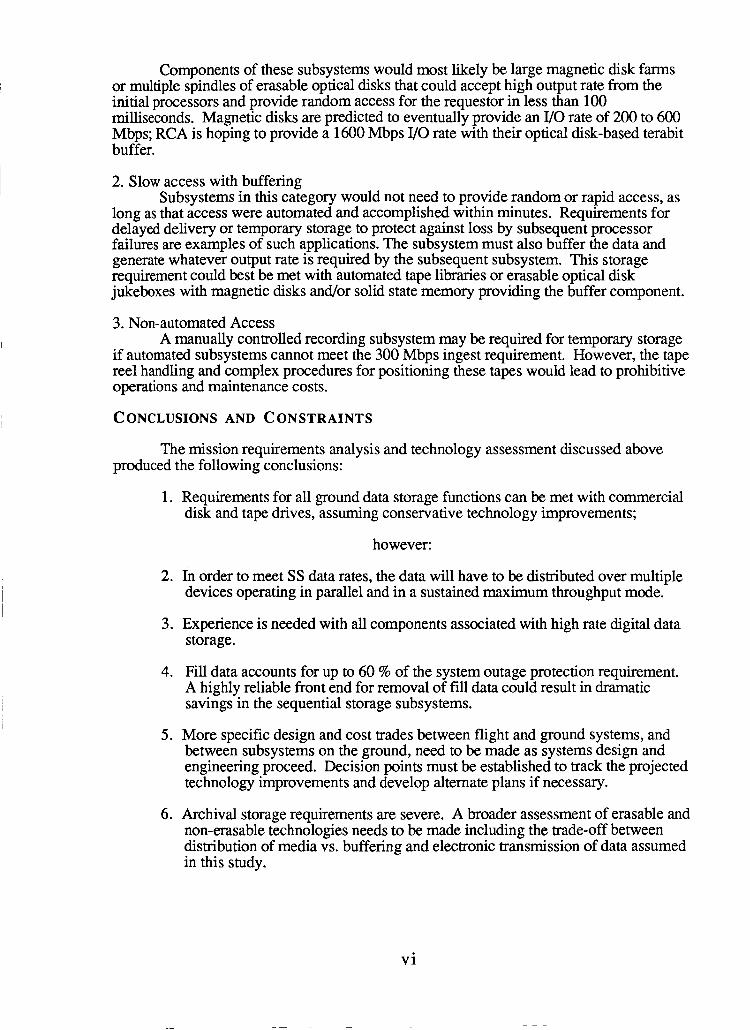
Components of these subsystems would most likely be large magnetic disk farms or multiple spindles of erasable optical disks that could accept high output rate from the initial processors and provide random access for the requestor in less than 100 milliseconds. Magnetic disks are predicted to eventually provide an VO rate of 200 to 600 Mbps; RCA is hoping to provide a 1600 Mbps VO rate with their optical disk-based terabit buffer.
2. Slow access with buffering
long as that access were automated and accomplished within minutes. Requirements for delayed delivery or temporary storage to protect against loss by subsequent processor failures are examples of such applications. The subsystem must also buffer the data and generate whatever output rate is required by the subsequent subsystem. This storage requirement could best be met with automated tape libraries or erasable optical disk jukeboxes with magnetic disks and/or solid state memory providing the buffer component.
3. Non-automated Access A manually controlled recording subsystem may be required for temporary storage
if automated subsystems cannot meet the 300 Mbps ingest requirement. However, the tape reel handling and complex procedures for positioning these tapes would lead to prohibitive operations and maintenance costs.
Subsystems in this category would not need to provide random or rapid access, as
CONCLUSIONS AND CONSTRAINTS
The mission requirements analysis and technology assessment discussed above
1. Requirements for all ground data storage functions can be met with commercial
produced the following conclusions:
disk and tape drives, assuming conservative technology improvements;
however:
2. In order to meet SS data rates, the data will have to be distributed over multiple devices operating in parallel and in a sustained maximum throughput mode.
3. Experience is needed with all components associated with high rate digital data storage.
4. Fill data accounts for up to 60 % of the system outage protection requirement. A highly reliable front end for removal of fill data could result in dramatic savings in the sequential storage subsystems.
5 . More specific design and cost trades between flight and ground systems, and between subsystems on the ground, need to be made as systems design and engineering proceed. Decision points must be established to track the projected technology improvements and develop alternate plans if necessary.
6. Archival storage requirements are severe. A broader assessment of erasable and non-erasable technologies needs to be made including the trade-off between distribution of media vs. buffering and electronic transmission of data assumed in this study.
v i
CONTENTS
... EXECUTIVE SUMMARY ................................................................... ui Background ............................................................................ i~
Potential Solutions for Temporary Storage Subsystems ......................... iv Conclusions and Constraints ........................................................ vi
...
... Mission Model Requirements Mix .................................................. m
I . INTRODUCTION ..................................................................... 1 Why a Mass Data Storage Study Team ............................................. 1 Scope of the Mass Data Storage Study ............................................. 2 Methodology Utilized by the Mass Storage Study Team ......................... 2 Organization of This Document ..................................................... 2
II . REQUIREMENTS .................................................................... 4 Sources of Requirements ........................................................... 4 Mission Model Used ................................................................ 5 Concept of 90% Availability .................................................... 17 Data Rates and Volumes ............................................................ 20
III . ARCHITECTURES ................................................................... 21 Transport System Functions ....................................................... 21 System Concepts .................................................................... 22 Range of Architecture Options ..................................................... 25 Derived Requirements for Storage Subsystems .................................. 33
Iv . TECHNOLOGY ....................................................................... 35 Storage Subsystem Capabilities .................................................... 35 How Technology Meets Storage Requirements ................................... 38 Potential Solutions Summary ........................................................ 45
V . KEY ISSUES .......................................................................... 47
VI . RECOMMENDED ACTIONS ....................................................... 48 Continue Technology Plan ......................................................... 48 Apply Results to Specific Data System Designs ................................. 48 NASA Should Maintain a Focused R&D Program .............................. 49 Develop End-to-End System Strategy ............................................. 49 Perform Analysis of Archival Needs .............................................. 49
APPENDIX I: MASS STORAGE COMMI'ITEE MEMBERS ............................... 50 APPENDIX II: REQUIREMENTS TABLES SPREADSHEET FORMULAS ............... 53 APPENDIX III: STORAGE SUBSYSTEM DETAILED REQUIREMENT DERIVATION .. 68
vii
CONTENTS (Cont'd)
APPENDIX IV: STORAGE SUBSYSTEMSUMMARYREQUIREMENTS ................ 81 APPENDIX V: RATES. VOLUMES. FILL TIMES OF CANDIDATE SYSTEMS ......... 85 APPENDIX VI: OPTICAL DISK SYSTEMS: MANUFACTURJ2RS AND CANIDATE
SYSTEMS ................................................................... 88 APPENDIX VII: LEONARD LAUB PROJECTIONS SUMMARY .......................... 91 APPENDIX VIII: INFORMATION SOURCES .............................................. 96 APPENDIX IX: BIBLIOGRAPHY ............................................................ 97 APPENDIX X: GLOSSARY ................................................................. 99
1 . 2 . 3 . 4 . 5 . 6 . 7 . 8 . 9 .
10 . 11 . 12 . 13 . 14 . 15 . 16 . 17 . 18 . 19 .
I 20 .
I
I 1 . i 2 . ~
3 . 4 .
I 5 . ! 6 . I 7 .
8 . 9 .
10 . 11 . 12 . 13 .
I I 14 . I I I 1
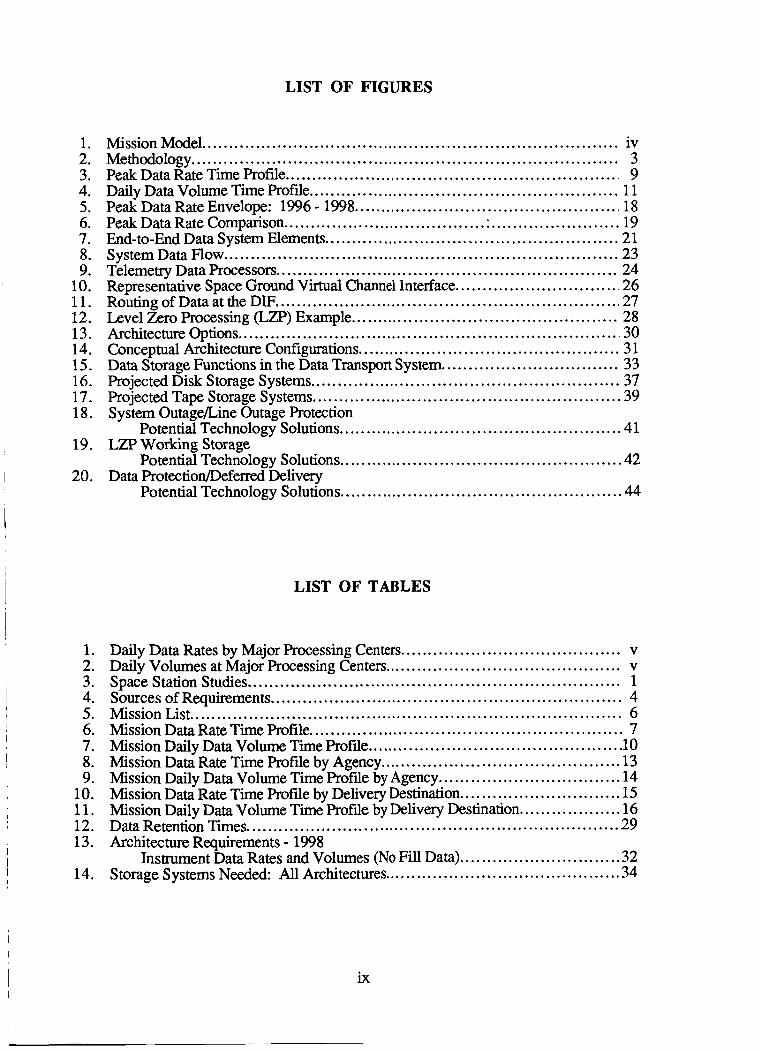
LIST OF FIGURES
Mission Model .............................................................................. iv Methodology ................................................................................ 3 Peak Data Rate Time ProNe ............................................................... 9 Daily Data Volume Time Profile .......................................................... 11 Peak Data Rate Envelope: 1996 - 1998 .................................................. 18 Peak Data Rate Comparison ...................................... : ........................ 19 End-to-End Data System Elements ....................................................... 21 System Data Flow .......................................................................... 23 Telemetry Data Processors ................................................................ 24 Representative Space Ground Virtual Channel Interface ............................... 26 Routing of Data at the DIF ................................................................. 27 Level Zero Processing (LZP) Example .................................................. 28 Architecture Options ........................................................................ 30
Data Storage Functions in the Data Transport System ................................. 33
System Outagebine Outage Protection
LZP Working Storage
Data ProtectionDeferred Delivery
Conceptual Architecture Configurations ................................................. 31
Projected Disk Storage Systems .......................................................... 37 Projected Tape Storage Systems .......................................................... 39
Potential Technology Solutions ..................................................... 41
Potential Technology Solutions ..................................................... 42
Potential Technology Solutions ..................................................... 44
LIST OF TABLES
Daily Data Rates by Major Processing Centers ......................................... v Daily Volumes at Major Processing Centers ............................................ v Space Station Studies ...................................................................... 1 Sources of Requirements .................................................................. 4 MssionList ................................................................................. 6 Mission Data Rate Time Profile ........................................................... 7 Mission Daily Data Volume Time Profile ................................................ 10 Mission Data Rate Time Profile by Agency ............................................. 13 Mission Daily Data Volume Time Profile by Agency .................................. 14 Mission Data Rate Time Profie by Delivery Destination .............................. 15 Mission Daily Data Volume Time Profile by Delivery Destination ................... 16 Data Retention Times ...................................................................... 29 Architecture Requirements - 1998
Instrument Data Rates and Volumes (No Fill Data) .............................. 32 Storage Systems Needed All Architectures ............................................ 34
. .
ix
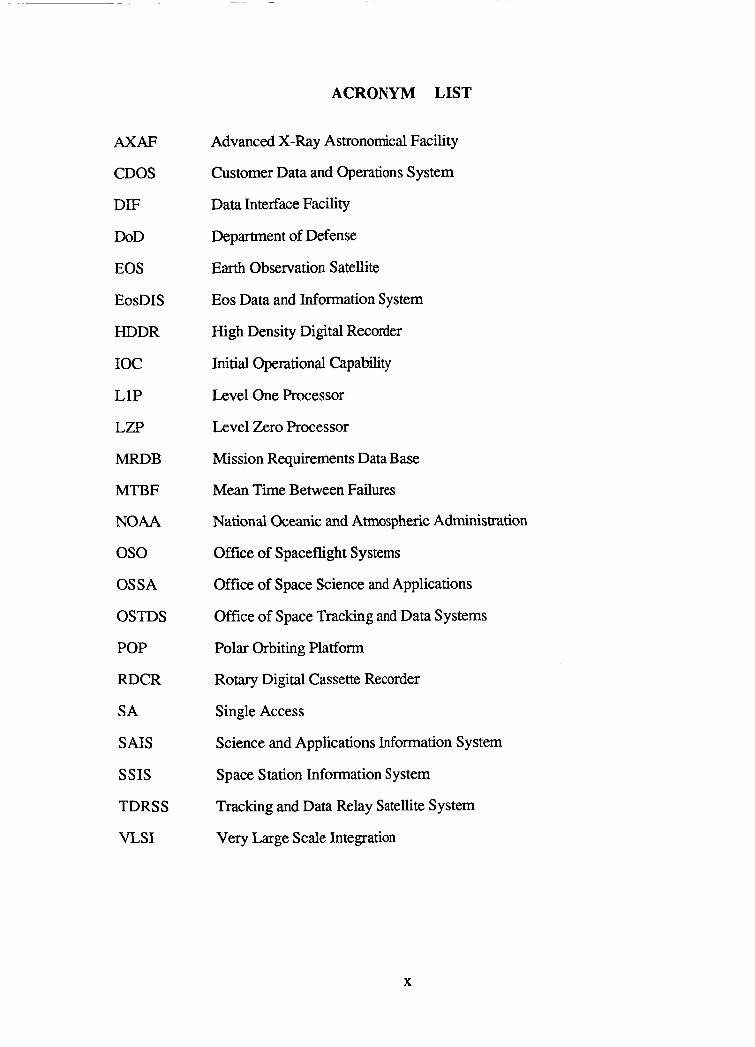
ACRONYM LIST
AXAF
CDOS
DIF
DOD
EOS
EosDIS
HDDR
IOC
L1P
LZP
MRDB
MTBF
NOAA
os0 OSSA
OSTDS
POP
RDCR
SA
SAIS
SSIS
TDRSS
VLSI
Advanced X-Ray Astronomical Facility
Customer Data and Operations System
Data Interface Facility
Department of Defense
Earth Observation Satellite
Eos Data and Information System
High Density Digital Recorder
Initial Operational Capability
Level One Processor
Level Zero Processor
Mission Requirements Data Base
Mean Time Between Failures
National Oceanic and Atmospheric Administration
Office of Spaceflight Systems
Office of Space Science and Applications
Office of Space Tracking and Data Systems
Polar Orbiting Platform
Rotary Digital Cassette Recorder
Single Access
Science and Applications Information System
Space Station Information System
Tracking and Data Relay Satellite System
Very Large Scale Integration
X

I. INTRODUCTION
W H Y A MASS DATA STORAGE STUDY TEAM
Several independent studies, associated with planning for the Space Station (SS) era, have emphasized that there will be a large increase in data volume transmitted from NASA spacecraft. Some studies suggested that the data volume expected during the mid- 1990's could so far exceed the capacity of available data storage subsystems that the cost of merely recording this data would be prohibitive. Consequently, a Mass Storage Study Team was formed at Goddard Space Flight Center (GSFC) in April 1986 to assess the magnitude of the data storage problem and recommend to NASA Management any initiatives that could be undertaken to ameliorate foreseen difficulties.
In 1985, NASA received an average of 1 gigabyte (GB) of data each day; by the mid-l990's, daily volumes from space-based payloads will reach 2400 GB. The data volume expected to be received at the ground terminals in the seven years from 1992 through 1998 is 5,300,000 GB (5300 terabytes (TB)). For comparison, the National Space Science Data Center (NSSDC) has collected less than 5 TB of data in the 29 years from 1958 through 1986. The comparisons of daily data volume and storage needs indicate that today's NASA information system equipment will be inadequate for tomorrow's requirements.
Although numerous SS data handling and transmission studies have identified storage technology and cost as critical issues, none of these studies indicated how commercial storage technology could meet NASA specifications. These studies, such as those listed in Table 3, included on-board storage problems for which there were no commercial solutions available. Recommendations made by the various groups concerning the storage technology NASA should develop or sponsor were contradictory. It was also unclear to what extent industry research efforts and commercial products ameliorate the technical and cost concerns.
1
Table 3 Space Station Studies
ReDort Title Contract Number Contractor
Space Station Data System Analysis/Architecture Study
NAS5-28082 NAS9- 17 132
Space Station Definition and Preliminary
Alternative Mass Storage Approaches for the Ground Data Management System
NAS5-29300 Design,Work Package 3 NAS5-29400
d a
MDAC TRW
GE RCA
Lockheed
Mass Stwage, Technology and Application d a MDAC
The GSFC Director of Mission Operations and Data Systems tasked a small team of NASA and contractor personnel, led by the Chief of the Systems Management Office, to analyze past studies and validate growth expectations. The team (see Appendix I) was made responsible for recommending initiatives to be undertaken by NASA management to assure that mass data storage requirements of the SS era could be satisfied.
1

SCOPE OF T H E MASS DATA STORAGE STUDY
The scope of the study was bounded by the input to the Tracking and Data Relay Satellite (TDRSS) ground terminal on the one end, and delivery of data to high-level user processing on the other.
The ultimate objective of the study was to formulate recommendations for selecting and/or sponsoring mass storage technology of the future, within the constraints of essential elements. The study:
Emphasized institutional ground data transport and processing, particularly those data handling and transport functions that have been the responsibility of NASA's Office of Space Tracking and Data Systems (OSTDS).
Addressed the interface to higher-level user processing
Assumed the on-board data buffering approach for data storage on the spacecraft would not change to simplify requirements on the ground system.
METHODOLOGY UTILIZED BY THE MASS STORAGE STUDY TEAM
The team initiated parallel work activities to collect and study available information on mission requirements, ground system architectures, and storage system technologies, as illustrated in Figure 2. The requirements task provided the basic input to the architecture task in terms of mission instrument data rates, data retention times, and resulting data volumes. In the architecture task, ground system architecture configuration alternatives were formulated, and related assumptions were made. The requirements were then mapped onto the architectures to determine the required storage subsystem's input/output (YO) rates and storage capacities, key issues, and architecture implementation contstraints. In the technology task, applicable storage technologies were identified and characterized in terms of key attributes: volume capacity, VO rate, access time, and type of access (see Appendix V). Projected performance increases were assessed and future products were considered for use in meeting mission requirements following a four-year development phase. The results of the three initial tasks were integrated and analyzed to determine how the available or projected storage technologies could support the storage requirements. While these tasks were being completed, Leonard Laub, an independent consultant, was retained to provide commercial subsystem expertise. After appropriate material had been analyzed, iterated as necessary, and integrated, the conclusions were evaluated for suitability, and recommendations to NASA management were developed, as documented in this technical memorandum.
ORGANIZATION OF THIS DOCUMENT
This report documents the research conducted by the Mass Storage Study Team from May 1986 to October 1986. The following sections will summarize the work completed by the requirements, architecture, and technology tasks groups. The Requirements section explains the mission model and how it was used to project the future mass storage requirements. The Architecture section describes the selected conceptual architecture options that could support the data loads entering the NASA ground systems during the lWO's, and how these options could be used to integrate workload requirements with storage functions found at each processing node in the ground system. The Technology section identifies potential solutions to mass storage demands of the future and the device subsystems that could support the requirements for each storage function. The Key Issues section highlights the key assumptions that were made and how management changes may alter the findings. The Recommended Actions section summarizes the recommended actions to be undertaken by NASA management in response to the mass storage
2
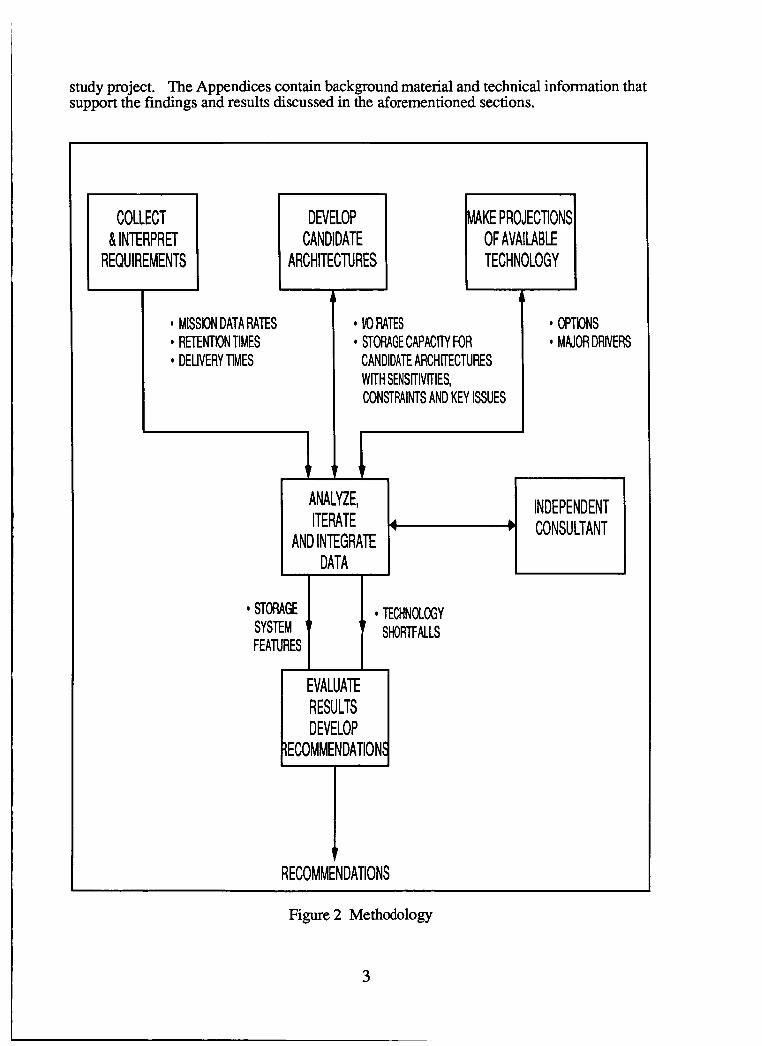
study project. The Appendices contain background material and technical information that support the findings and results discussed in the aforementioned sections.
MAKE PROJECTIONS OF AVAILABLE TECHNOLOGY
COLLECT &INTERPRET
REQUIREMENTS
ANALYZE, ITERATE
AND INTEGRATE DATA
I
INDEPENDENT 4 CONSULTANT
MISSION DATA RATES * RETENTION TIMES * DELIVERY TIMES
EVALUATE RESULTS DEVELOP
IECOMMENDATIONS
DEVELOP CANDIDATE
ARCHITECTURES
J-
I I
* VOMTES STORAGE CAPACITY FOR CANDIDATE ARCHITECTURES WIT" SENSITIVITIES, CONSTRAINTS AND KEY ISSUES
OPTIONS MAJOR DRIVERS
* TECHNOLOGY SHORTFALLS
FEATURES
t RECOMMENDATIONS
Figure 2 Methodology
3

11. REQUIREMENTS
The projected mission requirements were analyzed to produce a simplified mission model that could be used to predict data storage requirements at critical locations in NASA ground systems operating after 1992. The methods used for that analysis and the conclusions reached for the years of 1992 - 1998 have been summarized in this section. A statistical load-leveling technique was used to provide a more realistic estimate of the system workload requirements than simply summing the peak data rates of all instruments. Where requirements were incomplete, assumptions were made. These assumptions have been identified in this report and have been tested to determine whether small changes in assumptions would significantly affect the conclusions. Some assumptions affected the construction of, and input to, the missiordintrument data requirements spreadsheet tables, appearing in the Mission Model subsection. The entries and cell formulas in the seven spreadsheet tables of that section are reviewed and discussed in more detail in Appendix II.
SOURCES OF REQUIREMENTS
The mission model in this section was developed with data obtained from the sources listed in Table 4. There does not appear to be a single NASA mission model that is accepted by all organizations. The requirements description presented here reflects the contents of the reference sources. When there was a conflict between sources, the team selected the value to be used.
Table 4 Sources of Requirements
SOURCE DATE NASA Mission Requirements Database (MRDB) May 1986
Eos Project Requirements May 1986
Office of Space Science and Applications Mission Model June 1986
Space Station Functional Requirements Envelope ( Dr. W. Raney ) April 1986
Two sections of the NASA Mission Requirements Database (MRDB) contain data that was used to develop the mass storage mission model in this section. The Flights section lists the launch and flight schedules of missions. The DatdCommunications section lists the key characteristics of the communications links and the transmission paths of the mission instruments, including station-to-ground and platform-to-ground. The key attributes of a mission instrument found in the Data/Communications section includes the instrument generation rate (kilobits per second), the transmission duration (hrs), the transmission frequency (per 24 hrs), and the delivery time (hrs) deadline of the data at the delivery location.
The Earth Observing System (Eos) project requirements analysis was reviewed to gather information about the high rate remote sensing instruments that will be placed on the three Eos polar orbiting platforms (POPS) in the 1990's. The Eos requirements report identifies the assignment of instruments to a POP and lists the sponsor agency (NASA,
4

NOAA, etc.) of each instrument. It also validates the peak data rates and duty cycles of the Eos instruments.
The Office of Space Science and Applications (OSSA) Mission Plan describes the OSSA Initial Operations Capability (IOC) candidate missions and payloads for the scientific and applications uses of the SS and its associated platforms. The plan also summarizes missions considered for IOC (the years 1992 - 1994), for 1994 - 2000, and beyond the year 2000. It was a valuable document for verifying the completeness and accuracy of the mass storage requirements analysis. The OSSA Mission Plan contains information about the co-orbiting platforms (COPS) and their associated payloads, which other reports do not have.
The Space Functional Requirements Envelope provides details about audiohide0 (AN) data rates and volumes, and profiles their variable growth through the years 1992 - 1998. The Requirements Envelope was developed by Dr. William P. Raney and is appropriately called the "Raney Model". It was the sole information source for developing the AfV data rates and volumes in the mass storage mission model.
MISSION MODEL USED
The mass storage mission model was devised to describe the data loads that the NASA ground systems will experience in the period 1992 - 1998. The contents of the mission model were derived from the information sources discussed in the previous section. The mission model is made up of a mission list (Table 5), the associated rate and volume tables (Tables 6 and 7), and the probability table of peak rates (Figure 5). The mission model included the requirements of primary impact on data storage issues: data rates, data volumes, data delivery times, and data retention periods. The requirements were produced
rates averaged over a 24-hour period, and daily aggregate data volumes. Different groupings of requirements showed the data load in three ways: totaled for all instruments, sorted by sponsoring agency, and sorted by location where data packet processing is expected to be performed.
I in tabular and graphical form, showing data rates generated by individual instruments, data
5

Table 5 Mission List
Peak Duty Average Data Cycle Data Launch
AudioNideo SS Variable 1.00 Variable 1992
Instrument Spacecraft Rate(Mbps1 P(T) Rate(MhgS1 b
AS0 AT STO Sensor HST
SEASAR Spectr MODIS M R m VIS SAR HIRIS TIMS AXAF SIRTF
LASA-B
ss ss ss ss FF ESA POP ESA POP ESA POP Eos POP #1 Eos POP #1 Eos POP #2 Eos POP #2 Eos POP #1 Eos POP #1 U.S. COP U.S. COP
50.00 3.00
10.00 120.00
1.02 1 .oo
200.00 2.00 5.00
2 1 .oo 2.00
300.00 160.00 29.00 0.06 2.00
0.67 0.50 0.25 0.15 0.21 0.75 0.23 0.23 1 .oo 1 .oo 1 .oo 0.23 0.10 0.10 0.21 0.21
33.33 1 S O 2.50
18.00 0.2 1 0.75
46.00 0.46 5.00
21.00 2.00
69.00 16.00 2.90 0.01 0.42
1994 1994 1992 1997 1992 1995 1995 1998 1994 1994 1994 1996 1994 1994 1993 1994
Number of Spacec raft (incl Basel I22543
L 1994
c E93 2
1992 3 A J J U
Mission List
The list contains only those missions that generate large data volumes and, therefore, contribute significantly to the total data rate and data volume loads on the NASA systems. Specifically, the missions listed in Table 5, with the exception of AXAF, are the only S S era instruments that have peak data rates of 1 megabit per second (Mbps) or greater. The addition of other small data volume instruments to the mission list does not significantly change the mission model values.
Only U.S. non-DoD payloads were included in the mission list. This may change when the future requirements of international partners in space programs are better defined and understood. The U.S. payloads in the mission model are limited to those that send NASA or NOAA return link transmissions. Mission instruments on the shuttle were excluded, because of their short duration of seven days or less, as were operational and computer-to-computer communication traffic data, which consistently fell in the low volume category.
Peak and Average Data Rates
Table 6, Mission Data Rate Time Profile, contains information about peak and average data rates for major instruments supported by the NASA data system. Instruments and their corresponding data rates are sorted by their space vehicle/mission assignment.
6

0 - F r c
- 0
3 - 1 Y
o m 0 0 m m - c v d m 0c?""
CI
8
m '9 - m m
m d m (v
\9
II II II
II II
7
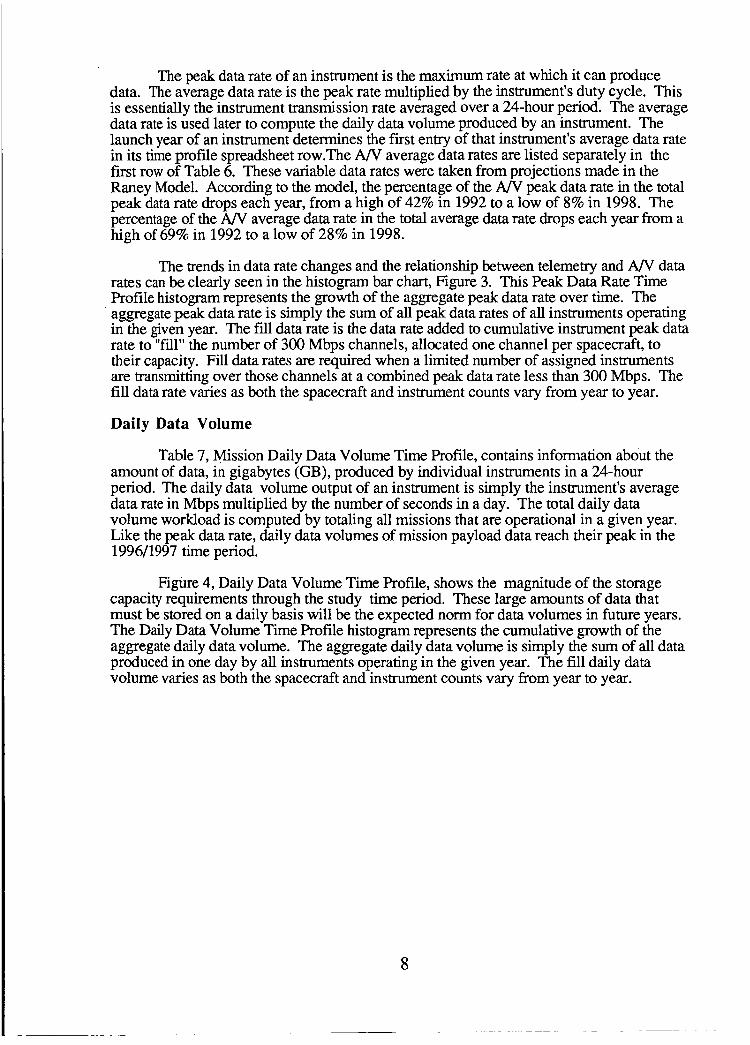
The peak data rate of an instrument is the maximum rate at which it can produce data. The average data rate is the peak rate multiplied by the instrument's duty cycle. This is essentially the instrument transmission rate averaged over a 24-hour period. The average data rate is used later to compute the daily data volume produced by an instrument. The launch year of an instrument determines the first entry of that instrument's average data rate in its time profile spreadsheet row.The A/V average data rates are listed separately in the first row of Table 6. These variable data rates were taken from projections made in the Raney Model. According to the model, the percentage of the A/V peak data rate in the total peak data rate drops each year, from a high of 42% in 1992 to a low of 8% in 1998. The percentage of the A/V average data rate in the total average data rate drops each year from a high of 69% in 1992 to a low of 28% in 1998.
The trends in data rate changes and the relationship between telemetry and A/V data rates can be clearly seen in the histogram bar chart, Figure 3. This Peak Data Rate Time Profile histogram represents the growth of the aggregate peak data rate over time. The aggregate peak data rate is simply the sum of all peak data rates of all instruments operating in the given year. The fill data rate is the data rate added to cumulative instrument peak data rate to "fill" the number of 300 Mbps channels, allocated one channel per spacecraft, to their capacity. Fill data rates are required when a limited number of assigned instruments are transmitting over those channels at a combined peak data rate less than 300 Mbps. The fill data rate varies as both the spacecraft and instrument counts vary from year to year.
Daily Data Volume
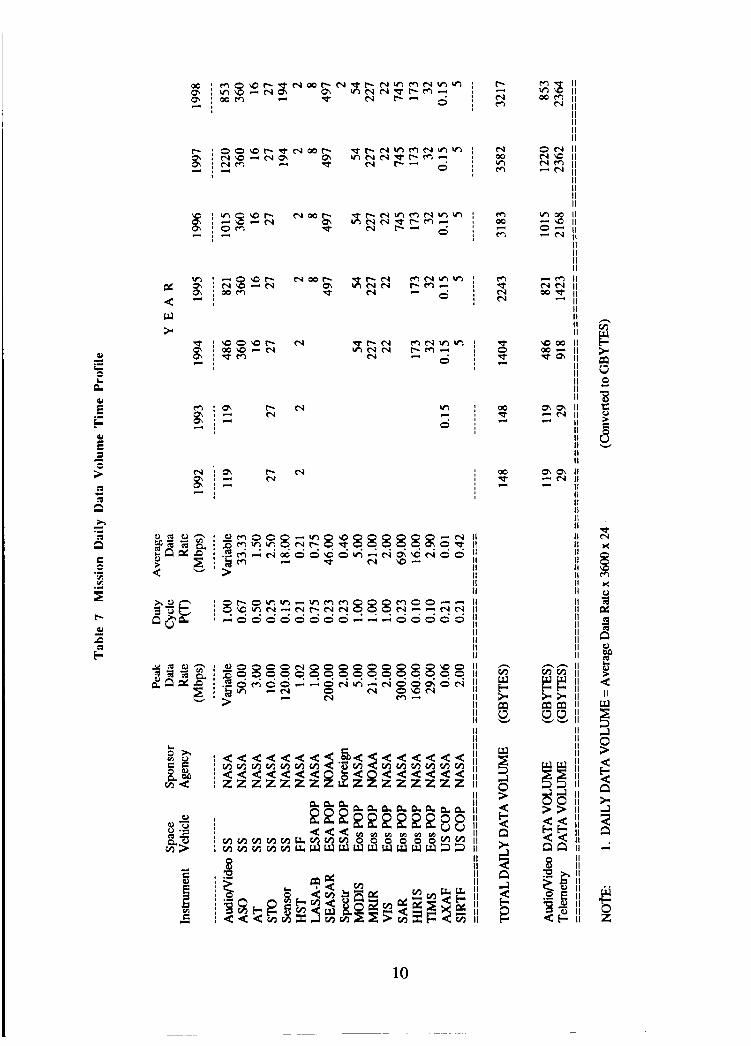
Table 7, Mission Daily Data Volume Time Profile, contains information about the amount of data, in gigabytes (GB), produced by individual instruments in a 24-hour period. The daily data volume output of an instrument is simply the instrument's average data rate in Mbps multiplied by the number of seconds in a day. The total daily data volume workload is computed by totaling all missions that are operational in a given year. Like the peak data rate, daily data volumes of mission payload data reach their peak in the 1996/1997 time period.
Figure 4, Daily Data Volume Time Profile, shows the magnitude of the storage capacity requirements through the study time period. These large amounts of data that must be stored on a daily basis will be the expected norm for data volumes in future years. The Daily Data Volume Time Profile histogram represents the cumulative growth of the aggregate daily data volume. The aggregate daily data volume is simply the sum of all data produced in one day by all instruments operating in the given year. The fill daily data volume varies as both the spacecraft and instrument counts vary from year to year.
8

DATA RATE
1992 1993 1994 1995 Y E A R
Figure 3 Peak Data Rate Time
L L 1996 1997 1998
= Fill
= AudioNideo
= Telemetry
Profile
9
c i c
; Z S % . o m
ii II II
N o o r - m d
N
II II II I1 II
m #
0
N r- z N
N r- 2 CI
II II I1 I1 I1 I1 II II II II II II II II II II
II II II II
10

TOTAL VOLUME (TBYTES)
6
5
4
3
2
1
0
1
1 9 9 2 1993 1994 1995 1 9 9 6 1 9 9 7 1 9 9 8 Y E A R
= Fill
= AudioNideo
= Telemetry Figure 4 Daily Data Volume Time Profile
1 1
Agency Data Rates and Volumes
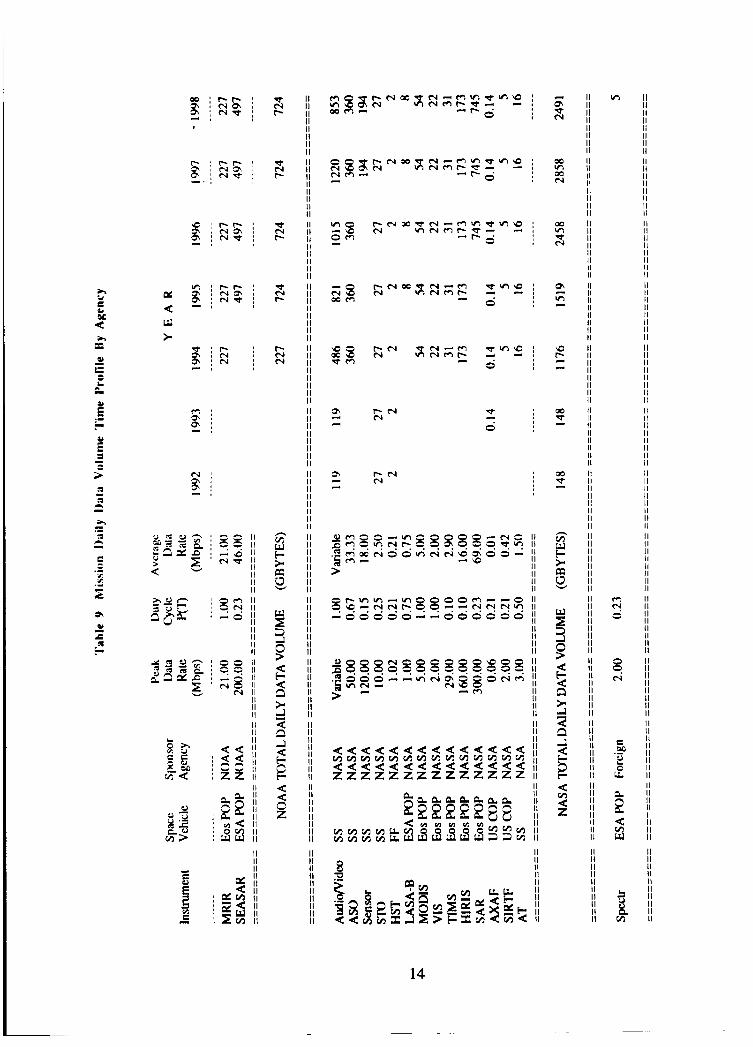
Tables 8 and 9 contain information about agency data rates and data volumes. These tables contain the same information as the tables preceding them, but the data is sorted and subtotaled by the major sponsoring agency.
Delivery Destination Data Rates and Volumes
delivered to various Level-0 Processor (LZP) centers. These tables contain the key numbers for identifying the storage and processing requirements at specific LZP locations. The data rates and data volumes are sorted and subtotaled by LZP location. These tables assume a distributed architecture for all data processing functions. The list of LZP locations here represents the best estimate for assignment and installation of one LZP to each of the NASA space centers where level zero processing is likely to take place.
Tables 10 and 11 contain information about data rates and data volumes to be
12

Y 4 w h
h u E s e! h I
-. Q,
s CI
p! 3 CI s E
E
- .- 2 2 .-
0 0
- -w N b
9 9
0 0
N b
0 2 -
- ,
g j e ,
II I1
c % 2 ' g % c c
m <
0 -
c.10 \"?
0 -
N O ?-? : -
I ? 1 - d
I I >
13
II I1 II II I1 II II II
II II II II II
P N hl
P N N
Phl hl
z 0
II I1 II II II II II /I II II
II I1 II II
14

X a 2
k - m m '9 I
Y a w +
0 z - 8 2
- I
0 -
N O ,?c!
- 8
E .- 7 0 -
N O ,c! Y
l a .L
ET
ij II 2
15

Y -2 w ).
b, 0
II II
s Q o - ~ o o o o c 1 o : 0 0 o o 0 0 8 g g ~ g g I I @ZBI + o ~ o e c m ( v m o ( v m
B ( v II II ' m o m - (v
II II
II
II II II
II II II I1 I1 II I1 II II II I1 II II II II II
ii II II II II
16

Probable Peak Data Rate
Tables 5 through 11 list data requirements by mission, with no reference to the fact that not all missions will transmit data at the same time. Conventionally, estimates of the expected data load entering a ground system are calculated by summing the peak data rates of all instruments transmitting data, regardless of the scheduling procedures in effect. Probability theory provides an alternative method for approximating the true requirements placed on the information system. This approach is valid as long as all instruments used in the mission model will operate independently. There are two key concepts in this approach.
The instrument data transmissions, in the long term, are independent, random events because of variable orbits and changing mission complements.
The probability of transmission by any single instrument is the percentage of time that instrument is expected to transmit, i.e., its transmission frequency or duty cycle.
Different combinations of missions would produce different probabilities of simultaneous transmission at a peak data rate that would equal the sum of the individual transmission rates. The joint probability of those combinations of missions that would produce the largest possible data rate was plotted in Figure 5. Smaller peak rates with the same duty cycle can be found by calculating the joint probability of different instruments, but those points fall beneath the line drawn from point to point on the graph. This figure, therefore, represents the limiting values of instantaneous data rate from all sources in the mission model used for this study.
The Peak Data Rate Envelope chart can be used to determine, in a probabilistic
peak rate slightly in excess of lo00 Mbps, but for two thirds of the time, the data rate would actually be less than 200 Mbps, according to Figure 5.
I sense, the peak data rate produced by this mission data rate profile. Table 5 displays a total
CONCEPT OF 90% AVAILABILITY
Ninety percent availability describes a ground system that has adequate capacity to support 90% of the return link data access requests, without transmission schedule adjustment. The remaining 10% of the data access requests would require schedule adjustments to ensure that the ground system data ingest rate capacity is never exceeded. Consequently, even though data transmissions for some instruments must be shifted in time, there would be no loss of data.
The 90% availability method uses a statistical approach to calculate the data rate entering the ground system and size the capability of that ground system to process anticipated loads. It produces a peak data rate estimate that is greater than the average peak rate of all instruments and less than the simple cumulative peak rate of all instruments transmitting at the same time. Neither of these extreme peak rate estimates represents a realistic, accurate estimate of the true expected system data input rate.
To achieve 90% availability, the system must be capable of handling the largest peak rate that could occur (P(T)>. 10 in Figure 5). This special treatment of a complex issue produces results consistent with availability estimates found in NASA's Space Network Ten Year Plan. Figure 6 compares the 90% availability and the 100% availability peak rates over time.
1 7

Peak Data Rate
800 W P S )
700
600
500
400
300
200
100
0 .10 .20 .30 .40 .SO .60 .70 ,80 .90 1.00
P(T) - Probability of Occurrence
With AudioNideo - Without AudiolVideo
Figure 5 Peak Data Rate Envelope
18

DATA RATE (Mbps)
1200-
I
1000- I
800 - I
600 - I
400 - I
200 - I
0 1992 1993 1994 1995 1996 1997 1998
Y E A R = Fill
AudioNideo 90% 100% = Telemetry Avai l a b i I it y Availability
Figure 6 Peak Data Rate Comparison
19

DATA RATES AND VOLUMES
The entire mission model was used to filter and extract the limited data rate and volume values needed to complete the architecture task. The measurements of primary importance were:
Data ingest rate at the ground terminal Aggregate data arrival rate at each ground system processor Total daily data volume flowing to each processor Aggregate data rate exiting each processor
The maximum rate and volume values are found during the years 1996 - 1998. For a "worst-case scenario" approach, these maximum values were selected to size the storage requirements of each architecture option formulated in the architecture task. Average data rates, and daily data volumes, exclude associated fill rates and volumes. The 1998 90% availability peak data rate, excluding the fill data rate, is 457 Mbps. This rate was viewed as the expected ingest data rate at entry to the NASA ground system and was used to size the storage requirements of the telemetry channel processor in the architecture task (See Figures 13 and 14).
assignment. Within each assignment, the rates and volumes are totaled to calculate the load on the capacity and VO rates of the storage devices.
Data rates and data volumes were segregated by instrument data packet processor
20

111. ARCHITECTURES
FLIGHT , TRANSPORT SYSTEMS SYSTEM
The objective of the architecture analysis was to derive storage subsystem capacities and transfer rates required to support different possible architectures. This required that system concepts be understood and a range of possible architectures be determined before storage subsystem requirements could be derived. In the architecture task, the project team:
, HIGH-LEVEL ~ ARCHIVE PROCESSING
Defined the elements that constitute an architecture
Formulated alternative architectures
Quantified I/O and storage capacity requirements for a set of candidate architectures
Identified key issues and constraints imposed on the storage devices by the architectures
Since the ultimate objective of this work was to formulate recommendations to NASA management concerning future data storage system technology, the task was constrained to address only those elements essential to data recording systems. Specific ally:
Only data storage issues were addressed, trade-offs between processing and communications were not considered.
Data storage subsystems were not designed, only requirements for these subsystems were determined.
Emphasis was placed on the data storage systems of greatest concern to the GSFC MO&DSD; flight systems and data archiving were considered as peripheral issues.
TRANSPORT SYSTEM FUNCTIONS
Figure 7 is a high-level schematic representation of an end-to-end system utilized for the collection and processing of payload data. This representation was developed to aid in focusing on data storage subsystem considerations and specifically excluded those elements of the end-to-end system that had negligible impact on data storage. This included end-to-end system functions such as payload control, system performance monitoring, and user interface to the system.
Note: This is that part of the end-to-end system which handles return link payload telemetry data.
Figure 7 End-to-End Data System Elements
21

The transport system provides the connectivity between the flight data system and the high-level processing performed by recipients of that data. Ideally, data delivered by the transport system should be a complete and accurate representation of the data produced by the payload. Data received may be a combination of real-time and stored playback data, may contain errors or gaps, and may be intermingled with data from other payloads; therefore, the tasks performed by the transport system include:
b
b
b
b
b
b
b
b
b
b
b
b
Data Capture Frame Synchronization Channel Separation Data Staging Data Routing Packet Separation Playback Data Reversal Data Time-Ordering Rate Conversion Overlap Removal Data Sorting Data Gap Annotation
The transport system is pictured in Figure 8, which shows the major functions performed. (Note that the functions do not have a one-to-one correspondence with the above task list.) The data storage subsystem capabilities to support these functions are the primary emphases of this technical memorandum.
SYSTEM CONCEPTS
Five classes of data processed by the ground system were identified. These classes were:
Computer-to-computer transfer
Audio (voice) data Video data Operationaldata
Payload and spacecraft telemetry data
The telemetry data was categorized as high rate or low rate data depending on the payload characteristics. Since computer-to-computer transfer and operational data were judged to be a small fraction of the telemetry data volume, the frst and last classes of data were ignored for this study. In sizing technology requirements, the committee decided that handling A/V in random access memory was unreasonable and would place an unnecessary burden on these storage systems. Only line outage protection recording accounted for A/V volumes and rates.
Within the end-to-end system, telemetry processing was allocated to three types of processors, the first two existing within the data transport system. The types of processors shown in Figure 9, were named according to the primary function each performed. The Telemetry Channel Processor separated the return-link signal into individual telemetry channels, as defined by the transfer frame synchronization code applied by the spacecraft. The Data Packet Processor separated individual return-link telemetry channels into data packets, grouped these packets by payload, and arranged the packets into an order corresponding to that generated by the payload. The Information File Processor, using groups of payload packets and any needed ancillary data, performed application processing to produce meaningful data sets. Primary emphasis in this study was placed on the first
22

1
t
23

Telemetry Channel
Processor (W
* Data Capture
* Frame Synchronization
* Channel Separation
* Data Staging
* Rate Conversion
* Data Routing
Data Information
Processor Processor Packet File
(UP) (L1 P)
* Packet Separation
* Playback Data Reversal
* Data Time Ordering
* Overlap Removal
* Data Sorting
* Data Gap Annotation
* Data Routing
Figure 9 Telemetry Data Processors
24
* Application Processing
* Data Archive
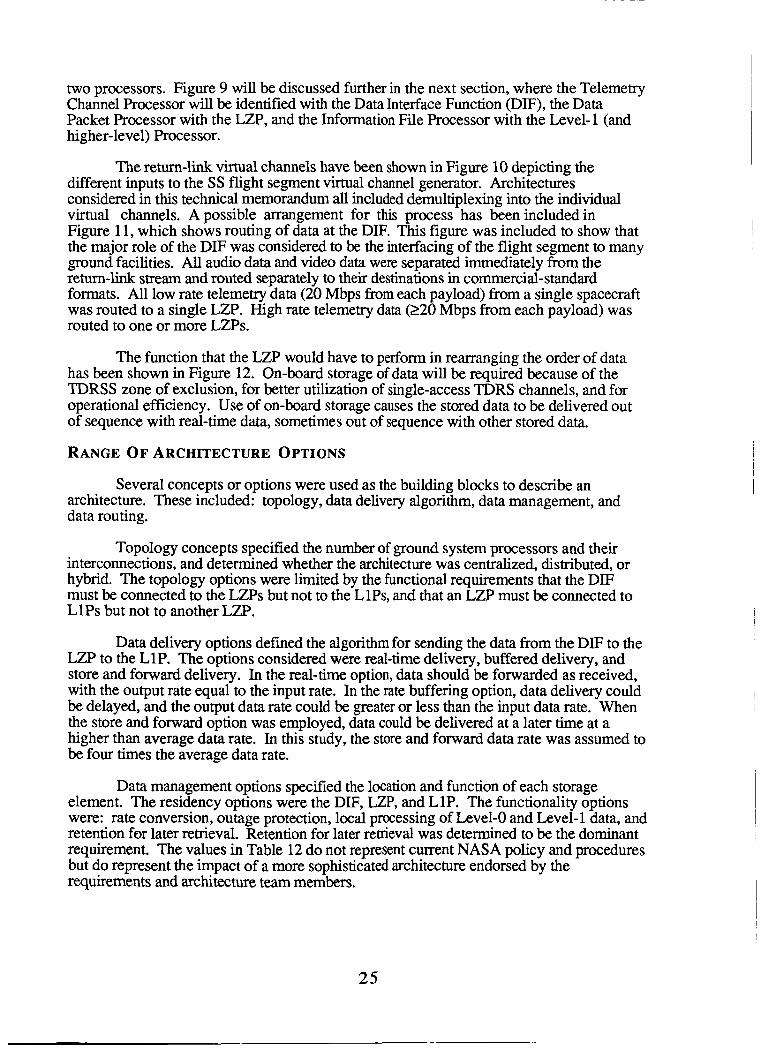
two processors. Figure 9 will be discussed further in the next section, where the Telemetry Channel Processor will be identified with the Data Interface Function (DIF), the Data Packet Processor with the LZP, and the Information File Processor with the Level- 1 (and higher-level) Processor.
The return-link virtual channels have been shown in Figure 10 depicting the different inputs to the SS flight segment virtual channel generator. Architectures considered in this technical memorandum all included demultiplexing into the individual virtual channels. A possible arrangement for this process has been included in Figure 11, which shows routing of data at the DIF. This figure was included to show that the major role of the DIF was considered to be the interfacing of the flight segment to many ground facilities. All audio data and video data were separated immediately from the return-link stream and routed separately to their destinations in commercial-standard formats. All low rate telemetry data (20 Mbps from each payload) from a single spacecraft was routed to a single LZP. High rate telemetry data (220 Mbps from each payload) was routed to one or more LZPs.
The function that the LZP would have to perform in rearranging the order of data has been shown in Figure 12. On-board storage of data will be required because of the TDRSS zone of exclusion, for better utilization of single-access TDRS channels, and for operational efficiency. Use of on-board storage causes the stored data to be delivered out of sequence with real-time data, sometimes out of sequence with other stored data.
RANGE OF ARCHITECTURE OPTIONS
Several concepts or options were used as the building blocks to describe an architecture. These included: topology, data delivery algorithm, data management, and data routing.
Topology concepts specified the number of ground system processors and their interconnections, and determined whether the architecture was centralized, distributed, or hybrid. The topology options were limited by the functional requirements that the DIF must be connected to the LZPs but not to the LlPs, and that an LZP must be connected to LlPs but not to another LZP.
Data delivery options defined the algorithm for sending the data from the DIF to the LZP to the L1P. The options considered were real-time delivery, buffered delivery, and store and forward delivery. In the real-time option, data should be forwarded as received, with the output rate equal to the input rate. In the rate buffering option, data delivery could be delayed, and the output data rate could be greater or less than the input data rate. When the store and forward option was employed, data could be delivered at a later time at a higher than average data rate. In this study, the store and forward data rate was assumed to be four times the average data rate.
Data management options specified the location and function of each storage element. The residency options were the DIF, LZP, and L1P. The functionality options were: rate conversion, outage protection, local processing of Level-0 and Level- 1 data, and retention for later retrieval. Retention for later retrieval was determined to be the dominant requirement. The values in Table 12 do not represent current NASA policy and procedures but do represent the impact of a more sophisticated architecture endorsed by the requirements and architecture team members.
25

WW RATE (> 10 MBPS)
FIXE0 LENQTH I
0 CHANNEL
0 0
0
(> 10 MBPS) UNSTRUCNREO (em s m )
'
I - VDEO -1 I VQEO
VQEO VDEO VDEO
V M O
- MULTIREXER
4
I I VDEO -
0 \ 0 MULTIPLEXER
AUDIO AUDIO AUDIO
I
Figure 10 Representative Space Ground Virtual Channel Interface
26

L
r I
m
rc 0
27

USE OF ON-BOARD STORAGE IS REQUIRED BECAUSE OF THE TDRS ZONE OF EXCLUSION, FOR BETTER UTILIZATION OF SINGLE ACCESS TDRS CHANNELS, AND FOR OPERATIONAL EFFICIENCY.
USE OF ON-BOARD STORAGE CAUSES THE STORED
REAL-TIME DATA, SOMETIMES OUT OF SEQUENCE
CURRENT ON-BOARD STORAGE DEVICES, BACK-
DATA TO BE DELIVERED OUT OF SEQUENCE WITH
WITH OTHER STORED DATA, AND, USING MOST
WARDS..
THUS, DATA WHICH CAME OUT OF THE CUSTOMERS INSTRUMENT LIKE THIS:
I TH IS-I S-A-STEADY-STR EAM-OF-DATA-FROM-TH E-INSTRU M ENT I
NOW LOOKS LIKE THIS IN THE GROUND SYSTEM (NOT EVEN CONSIDERING MULTIPLEXING AND DEMULTIPLEXING):
OVERLAPPING DATA
MUST BE USED TO FILL H7 3 +
Figure 12 Level Zero Processing (LZP) Example
28

Table 12 Data Retention Times
HIGH RATE DATA LOW RATE? DATA (220 Mbps) (<20 Mbps)
Data Protection 2 Days 7 Days
Deferred Delivery 8 Hours 4 Days
Routing options specify how the data could be forwarded from the DIF to the LZP(s) to the LlP(s). For example, data from an LZP to the L1P could be routed by data rate classification: high rate data could be routed to selected LlPs, and low rate data routed to a single LZP. Alternatively, data could be routed by mission instrument. If the DIF and LZP were co-located, they could share the same storage devices, provided the data were stored using appropriate data identification.
The architecture group examined a large number of candidate architectures, which included various combinations of the options listed above. On closer examination, the different architectures were found to be variations of the three basic architectures listed in Figure 13. The Centralized DIF with Distributed LZPs architecture segregates the data received at the White Sands ground terminal into data streams intended for each LZP. The "broadcast mode" architecture distributes all data received at the White Sands ground terninal to each remote location, with each location selecting an appropriate subset of the data and discarding the rest. The "fully centralized'' architecture performs all DIF and LZP functions at the White Sands ground terminal for all data. These three architectures were selected for detailed study, as storage technologies supporting these architectures would also support the demands of any data transport system design that is eventually implemented.
The processor configurations for each selected architecture options are illustrated in Figure 14. Table 13 is the source of the 1998 data rates and volumes mapped to those architecture configurations with the exception of the 457 Mbps rate coming from TDRS. This rate is the 90% availability rate illustrated in Figure 6. In each configuration diagram, the data rate entering the LZP is the aggregate peak rate calculated as the sum total of all peak data rates of all instruments assigned to that LZP. The data rate exiting the LZP is the product of a burst factor and the total of the average data rates of all instruments assigned to that LZP. The burst factor is used for the operational reason that none of these LZPs transmits data to its LlPs continuously but does so in bursts. In these architecture options, a burst factor of 4 is used, meaning that 24 hours of data can be transmitted in 6 hours.
The total daily data volume received and processed by an LZP, as depicted in the diagrams, is the sum of the daily data volumes of all instruments assigned to that LZP. The daily data volume of an instrument was calculated as the product of the instrument's average data rate, in Mbps, the number of seconds in a 24-hour day, and a factor to convert Megabits to GB (SO00 Mb = 1 GB).
29
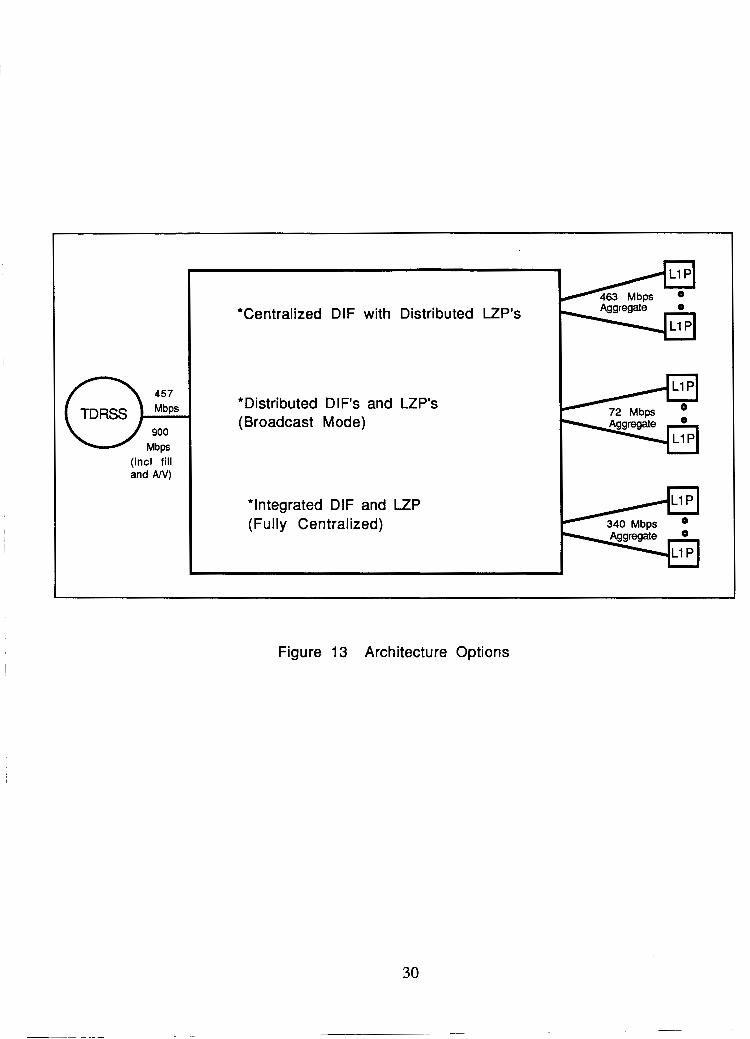
(incl fill and AN)
*Centralized DIF with Distributed LZP's
*Distributed DIF's and LZP's (Broadcast Mode)
*Integrated DIF and LZP (Fully Centralized)
. U
. 4 .
Figure 13 Architecture Options
30

CENTRALIZED DIF WITH DISTRIBUTED LZPs
79 Mbps
Mbps
853 GByte6
(lncl f i l l and NV)
Audio Video
A
(Incl f i l l and AN)
(lncl fill .and AN)
LZP
DIF
920 GBytes 460 Mbps
A 72 Mbps
DISTRIBUTED DIFs AND LZPs
INTEGRATED DIF AND LZP nfl 2345 GByles
Figure 14 Conceptual Architecture Configurations
31

II II I1 II I I II II I1 II I I II II II II II II
II II II II II I I II II II
II II II II II II II
d 3c c
Q 3
a" II I I I1 II I1 II II II II II II II I I II
II II
II II
g I1
II I1
I1 I1
I f II 8 I1 II j II I1 c1 II II - II II
II I1 II II II I1 I I II II II
II II II II
h Y h
v rJ
II II II II
II II II II II II II II II II II 11 II I1 II II I I II
11 II II II I1 I1 I1 I1 I1
ii ii II II II I I
II II I1 II II I1 11 I 1 11 I 1
II I I
II I1 II II II II II II I I 11 II II I I II II II II II II I 1 II II II II II II II II II II II II II I I
II II I1 II II 11 II II II II I1 II II I1 I1 II I1 1 1 I1 II II II I1 II II II I1 II II II II II II
m
0 v
C C
E 0
.- d
d
2 8 Pi
3 a" ii i i
II I I II II II II II II II II
x .- 0
h s CA
II
II 3
O a Z N
v) * - 1
32

DERIVED REQUIREMENTS FOR STORAGE SUBSYSTEMS
The six data storage functions found at each major processing node in the data transport ground system are illustrated in Figure 15. Definitions of these storage functions can be found in the glossary of terms, Appendix X, at the end of the report. The mapping of the six functions onto each architecture configuration was the fxst step taken to derive a complete picture of all storage subsystems' requirements. The specific system architecture determined whether or not several of the data storage functions could be provided by a single data storage subsystem.
I PROCESSOR
(DIF or LZP)
SYSTEM OUTAGE
PROTECTION STORAGE
b RealTime
LINE OUTAGE PROTECTION
I
Non-Real Time
CONVERSION
DEFERRED DELIVERY
Figure 15 Data Storage Functions in the Data Transport System
The requirements for each of the six generic storage functions were examined for each architecture, using each target year's data rates and volumes. To analyze the storage needs for the different architectures, detailed tables, showing storage requirements for all storage functions at each node of the ground system, were developed (see Appendix In). The storage needs, expressed as the storage device transfer rate and storage capacity, for the following combinations of storage function and architecture option can be read from the tables. The combinations are:
Line Outage Protection or System Outage Protection for any architecture option
Working Storage at the DIF for the Centralized Dif with Distributed LZPs.
33
Working Storage at the LZP and Rate Conversion for any architecture option
Data Protection at the DIF and System Outage Protection at the LZP for the Centralized Dif with Distributed LZPs
Data Protection at the LZP and Deferred Delivery for any architecture option
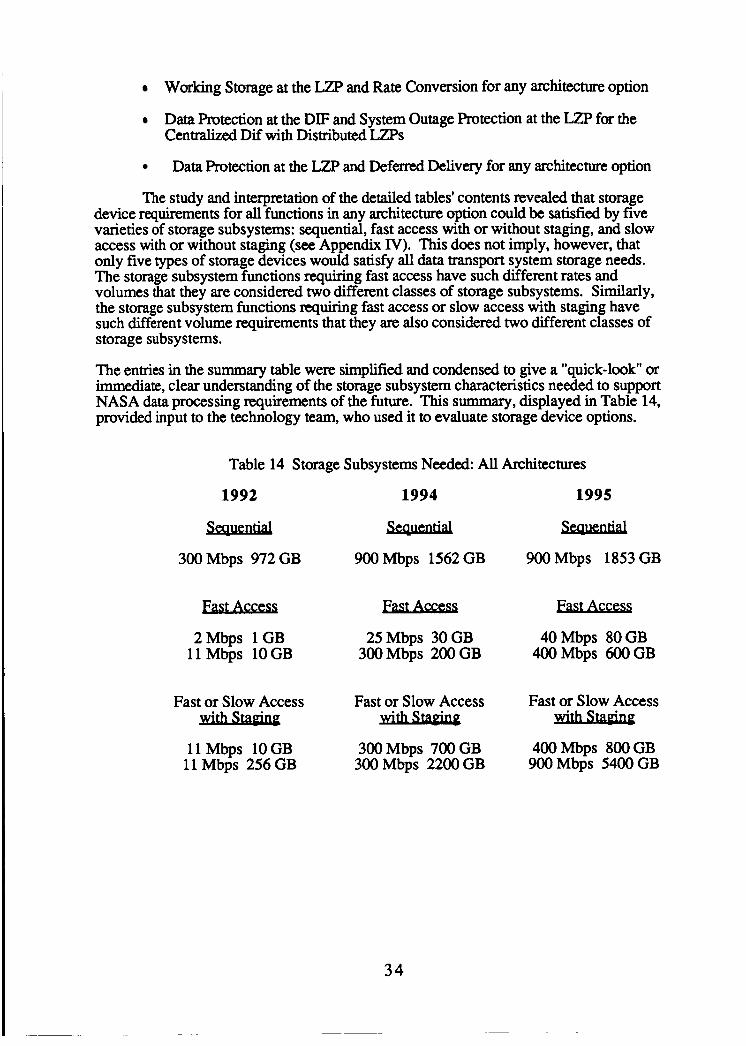
The study and interpretation of the detailed tables' contents revealed that storage device requirements for all functions in any architecture option could be satisfied by five varieties of storage subsystems: sequential, fast access with or without staging, and slow access with or without staging (see Appendix IV). This does not imply, however, that only five types of storage devices would satisfy all data transport system storage needs. The storage subsystem functions requiring fast access have such different rates and volumes that they are considered two different classes of storage subsystems. Similarly, the storage subsystem functions requiring fast access or slow access with staging have such different volume requirements that they are also considered two different classes of storage subsystems.
The entries in the summary table were simplified and condensed to give a "quick-look' or immediate, clear understanding of the storage subsystem characteristics needed to support NASA data processing requirements of the future. This summary, displayed in Table 14, provided input to the technology team, who used it to evaluate storage device options.
Table 14 Storage Subsystems Needed: All Architectures
1992 1994 1995
Seauentlal Seauential Seauential 300Mbps 972GB 900Mbps 1562GB 900Mbps 1853GB
2Mbps 1GB 25Mbps 30GB 40Mbps 80GB 11 Mbps 10GB 300 Mbps 200 GB 4OOMbps 600GB
Fast or Slow Access Fast or Slow Access Fast or Slow Access
11 Mbps 10GB 300Mbps 700GB 4OOMbps 800GB 11 Mbps 256 GB 300Mbps 2200GB 900Mbps 5400GB
Wlth Staglne
3 4

IV. TECHNOLOGY
The technology team's goal was to determine whether or not commercial products would be available in time to meet the SS era mass storage requirements identified in the mission model. If not, R&D funds would have to be designated for the development of required components.
The technology team gathered information about currently available commercial products and interviewed industry contacts to further understand the type of products under development and on the drawing board (see Appendix VIII). A nationally-known consultant, Leonard Laub of Vision Three, Inc., spent a day gathering input on requirements and architecture studies and educating the Mass Data Storage Study Team on current and emerging technology. He then wrote a report concerning the projected mission requirements and the potential commercial system equipment configurations that could meet those requirements. A summary of his projections is in Appendix VII.
The technology team subsequently identified general types of storage subsystems to meet the data processing requirements mapped out by the architecture team. Diagrams and descriptions of these solutions are presented in the following sections.
STORAGE SUBSYSTEM CHARACTERISTICS
The storage requirements from the mission model and architecture options were categorized by access and capacity characteristics. The three categories explored were:
High VO rate/High volume capacity, for System/Line Outage Protection Fast access, for Level-0 Working S toragemate Conversion Slow access with staging (buffering), for Data Protection/Deferred Delivery
The medium associated with high VO rate/high volume capacity storage could be either magnetic tape, or erasable optical tape, or clusters of magnetic or optical disks. Fast access requirements could be met with clusters of magnetic or optical disks. Autochangers, such as tape cassette libraries or disk jukeboxes, were proposed as the most functional for meeting requirements that could be staged. These autochangers could use magnetic disk as buffering devices to accommodate digital video cassettes, optical disks, or optical tapes.
Projected technology trends and available product announcements gathered from public sources or vendor interviews were used to predict future commercial and R&D storage subsystems that would meet the general range of requirements in each of the three identified categories.
Because the years 1992,1994, and 1996 displayed the most significant change in projected mission model storage requirements, options were identified for each of these years. A four-year margin was assumed between a product's projected availability and its integration into an operational system. If a single device could not meet the requirements, storage subsystems consisting of multiple drives and synchronizing controllers were considered. The number of storage subsystem devices was consistantly doubled to allow for software and file management overhead.
35

Disk Systems
There are many different classes of commercial rotating disk data storage devices. Magnetic disks range from 3.5 inch microfloppy removable media to 14 inch fixed media. Current optical disk drives support removable write-once media in 3.5,5.25,8, 10, 12, and 14 inch sizes (see Appendix VI for other characteristics evaluated). The projections shown in Figure 16 are limited to high end, fixed erasable media falling into four basic groups:
Conventional magnetic disk (single active head)
Parallel transfer magnetic disk
Projected erasable optical winchesters (single active head multiple fixed media surfaces)
Parallel transfer optical buffers (erasable fixed media, multiple synchronized active heads)
The following four paragraphs explain each of these groups in more detail.
The range of projections for the conventional high performance magnetic disk drives is represented by the shaded area in the lower left comer of Figure 16. Projections are based on information from industry contacts and are augmented by Leonard Laub's analysis. Analysis of current performance levels indicates that packing density is driven by technology availability and that data rates are driven primarily by the IBM channel rate. The projected 1998 data rate is therefore highly dependent on IBMs supporting 200 Mbps data channels, whereas storage volume per spindle depends on technological advances.
Parallel transfer magnetic disk systems, represented by the checked area at the left of the diagram, are aimed at satisfying the high data rate requirements of several unique markets, primarily involving supercomputer applications and image processing. The storage density of these devices should be identical to conventional magnetic disk systems. Data rates in the gigabit-per-second range should be achieved by simultaneously writing and reading data with multiple synchronized heads. The only limits to achievable data rates are the number of platters per spindle and the number of supportable heads per surface that can be reasonably supported. Because heads are synchronized and data is spread over multiple surfaces, access to small blocks of data can suffer.
Projected erasable optical disk systems, represented in the lower center of the diagram, are configured like conventional Winchester magnetic disks and could potentially have similar performance parameters. The storage capacity of the optical disk media is two to ten times greater than conventional magnetic disks. If current transfer rates of erasable optical media match magnetic disks, this type of device may eventually replace the high end of that market. Currently, however, only IBM has even hinted at plans to build such a device for internal main memory, and it would be risky to depend on availability for the early 1990's.
The RCA terabit buffer, pictured at the top center of the diagram, is a prime example of the potential of applying parallel transfer technology to spindles of fixed erasable optical disk media. Commercial versions of such devices will probably lag behind commercial optical disk winchesters, but it is likely that such devices will be built to satisfy the demands of the supercomputer and image processing markets.
36

l e I
37

Tape Systems
The tape recording technology projections were divided into two broad groups - high performance magnetic tape devices and optical tape recording devices. These two groups will be discussed in the following paragraphs.
The high performance magnetic tape devices include a variety of current and projected commercial and Military Specified products but does not include devices with rates less than 200 Mbps. Because of the many parameters affecting the selected performance quantifiers, and because devices falling in all of these categories were capable of meeting basic line outage requirements, magnetic tape projections are shown as a single triangular area on Figure 17. These devices utilize both scanning (rotary or helical) head and fured (longitudinal) head recording techniques. The associated media packages range fiom 19 mm digital video cassettes to 14 inch reels of two inch wide tape. Ampex and Kodak's Datatape division have each proposed one to two gigabit-per-second devices, but they have no plans to build them without government funding. The magnetic tape technology with the most desirable characteristics appears to be the digital video tape cassette systems being designed to the SMPTE D1 or ANSI D1 standards. These systems have the potential to meet a large proportion of the high YO ratehigh volume capacity requirements.
Optical tape projections are more uncertain. The diagram displays only two points: CREO, a non-erasable commercial system which is supposed to be available around 1990; and the proposed RCA erasable optical tape system, which is highly dependent on millions of dollars of government funding and is based on unproven scanning and tracking techniques. Even if both these projects were funded, there is only a 20% probability of having a space-qualified system by IOC. A third company, &Data, is developing a non- erasable commercial optical tape system in Denmark. The low transfer rate of 1.6 Mbps and the low unit volume of 6 GB were incompatible with the scale on the diagram.
HOW TECHNOLOGY MEETS STORAGE REQUIREMENTS
The systems analysis focused on identifying candidate technology solutions, not on selecting the best solution in terms of performance and life cycle cost; nor did it address the issues of operability, maintainability, or manageability. This study concentrated on three parameters key to meeting the mission model requirements, and it did not emphasize other subsystem features such as head seek times or media formatting techniques. The parameters considered were data transfer rate, data capacity per mounted media unit, and access time. Access time was used to group tape, disk, and automated library devices into the three categories of requirements mentioned previously: high YO ratehigh volume capacity, fast access to working storage, and slow access with staging.
System Outage/Line Outage Protection
The requirements for this function were discussed in the Transport System Functions subsection (page 21). Data stored, including fill, must be held for eight hours. Receiving sites must be capable of simultaneously capturing three TDRSS links. This last requirement drives the peak record playback rate to 900 Mbps and becomes a challenging threshold for recording technology. Note: To some extent, each TDRS link could be handled independently, and some partitioning of the 900 Mbps rate among devices is possible. Storage subsystem design, however, must also provide for simultaneous capture of new data while playing back previously captured data.
3 8

Y 0 U a
W n
39

Three classes of data storage devices appeared to be sufficiently mature to satisfy outage protection requirements in the 1992 - 1998 time frame: reel-to-reel high density digital recorders (HDDR), 19 mm digital video cassettes, and erasable optical disks. The next three paragraphs discuss these technologies, and Figure 18 relates these subsystems to the requirements. (Note that the media count on the associated diagrams does not allow for breakage.)
The reel-to-reel HDDRs, with either longitudinal or rotary recordplayback formats, are currently available. As illustrated, three Ampex helical scan HDDRs can meet the basic requirements through 1998. At least six drives would be required on an operatonal system because of redundancy and manual tape handling requirements.
The 19 mm digital video cassette devices are currently being adapted for use in high performance digital data capture applications. Media capacities range from 25-125 GB per unit depending on tape length and recording methodology. An automated library holding 100 to 600 cassettes could store tens of terabytes of data. These units are projected to support 100- or 400-Mbps drives and be available by 1990. An example of this projected subsystem is the Sony D1M 100 library. As shown in the diagram, a single library with three 400-Mbps drives could meet all of the basic 1994 - 1998 requirements. Two libraries with four drives each could easily meet all operational requirements.
RCA has demonstrated the technology to implement a non-erasable optical disk jukebox with a data transfer rate of 150 Mbps. For this subsystem to be practical for line outage protection, 14 inch erasable media, with signal to noise and sensitivity characteristics similar to current non-erasable media, must become readily available from more than a single source. High data rate read/write/erase heads must be adapted to erasable media drives. NASA funding would be required to assure availability by the early 1990's. If a similar device were to be commercially developed and available by 1990, it would require two to four jukeboxes with two drives each to handle the 1994 - 1998 requirements . LZP Working Storage
LZP requirements are as follows: data is stored on line for six hours, random access must be accomplished in less than 100 ms, LZP functions such as time reordering must be implemented in a cost-effective manner, and (in some architectures) a separate rate conversion requirement of two-hour storage with rapid random access must be met. In order to test the technology options, only the six-hour working storage requirement is addressed. This study assumed that AfV data would not be handled in the working storage area. It was also assumed that the rate buffering requirements fell within the LZP technology bounds.
Fixed erasable disk storage systems were judged as most appropriate to meet the LZP working storage requirements. Devices utilizing either magnetic or erasable optical media were considered. Solid state devices are the only other type of memory technology being seriously pursued by industry that would allow sufficiently rapid random access to meet this requirement. This option was eliminated because, even with a factor of 10 increase in storage density, more than 500,000 chips would be required to create a 500 GB storage capacity. The technology committee determined that a totally solid state system would be too costly to implement and maintain. The two most promising fixed media systems are discussed below and compared in Figure 19.
40

I
41

42

Conventional magnetic disk drives have shown a steady increase in performance and are predicted to improve well into the 1990's. Disk farms, composed of currently available commercial drives, could easily handle the 1992 requirement (15 to 20 IBM 3380E or equivalent spindles -- not shown in the diagram). Meeting the 1994 requirements with the current 3380 technology requires a disk farm of 70 to 80 drives; it also requires controllers capable of effectively synchronizing multiple spindles to achieve required peak data rates. Trading up to projected 1992 equipment, 1996 - 1998 requirements could be met with 50 or 60 spindles of projected 1992 drives with appropriate synchronizing controllers. This requirement could also be met utilizing strings of parallel transfer magnetic disk drives such as the projected 1990 IBIS. If the current price differential between convential drives and parallel transfer drives dose not decrease, however, it appears that the development of synchronizing controllers will result in a cheaper storage system.
The availability of erasable optical disk systems, oriented toward computer working storage, hinges on the availability of reliable long lasting media. Leonard h u b predicted that media development schedules should allow for implementation of commercial devices of this type by 1992. No specifications are available, but an effort is rumored to be taking place at IBM to develop a drive with an 80 GB capacity and a peak data rate compatible with the 96 Mbps IBM channel rate projected for that era. Ten to fifteen spindles of such a device could meet the 1996 - 1998 requirements. This requirement could also be met by developing a custom erasable optical disk system such as the RCA "terabit buffer". Although such a system would reduce the number of devices, from 60 or more to approximately 10, estimated development costs, operational costs, and development risks are all considerably higher than for solutions utilizing commercially available storage devices.
Data ProtectiodDeferred Delivery
The high-level requirements for data protection and deferred delivery are as follows: the data received at greater than 20 Mbps must be stored for two days, the data received at less than 20 Mbps must be stored for seven days, access to the data should be automated and accomplished within minutes, and the system must be capable of accepting sustained data rates at least four times the average ingest rate.
The devices best suited for meeting these requirements seemed to be the automated tape libraries or the erasable optical disk jukeboxes. Fast access staging buffers would be required to efficiently interface either of these device types to the LZP and networked communication links. These subsystems are described below and compared in Figure 20.
The Kodak RDCR 33 1 is an example of a currently available digital tape cassette library. This unit accommodates up to three 100 Mbps drives and 32 cassettes storing 27.5 GB each. A library unit like this could easily handle the 1992 and 1994 requirements with a maximum of 6 libraries and 192 cassettes, as indicated in the diagram. To support this subsystem, appropriate controllers would have to distribute high rate channel data to multiple drives. A simpler solution to the 1994 - 1998 requirements could be the projected Sony D1M 100 library. This device could be configured with four 400 Mbps drives and accommodate 100 cassettes with a unit capacity of 57 GB. As indicated on the diagram, even the 1998 requirement could be satisfied with two of these units and a full complement of cassettes. Because the peak physical channel data rate of 300 Mbps is less than the input/output capacity of a single drive, synchronizing drives or breaking data streams into multiple lower rate streams would not be required.
4 3

L E
44

Jukeboxes of erasable optical disks could also be used to fulfill the data protection/deferred delivery requirements, but it would be risky to count on commercial availability of high performance devices of this type before the early 1990s. Current erasable systems are being demonstrated in the 5.25 inch size using magneto-optic technology. The diagram indicates that ten devices with characteristics similar to the current RCA jukeboxes (but utilizing 150 Mbps read/write stations and erasable media) could meet the 1998 requirement.
POTENTIAL SOLUTIONS SUMMARY
Storage technologies either already available as commercial products or being developed for use in future products, have the potential to fulfill all ground transport system needs. The commitment of the government and the video entertainment industry to the development of high data rate digital tape cassette systems should assure availability of automated sequential storage systems capable of fulfilling requirements for line outage protection and deferred delivery. The requirement for working storage for processing systems (LZP, L1P) and random access rate buffering can be met with projected commercial parallel magnetic disk technology, or conventional "single head active" drives with synchronizing controllers. Optical technologies also have the potential to fulfill all of the requirements, however, industry's current pace of development does not appear to match SS timelines. The development of custom optical storage systems for ground transport was judged to be more expensive and more risky than development of the systems technology to enable use of commercial magnetic disk drives.
Thus, the major challenge to meeting ground transport system storage needs appears to be development of appropriate controller and file management technology to utilize commercial magnetic disk drives in a configuration meeting the random access working storage and rate conversion requirements beyond 1992. For 1996 and beyond, a random access data storage subsystem providing approximately one Tl3 of raw storage capacity and capable of simultaneously handling four 300 Mbps channels (two input and two output) plus several lower rate channels is required. As shown in Figure 19, sustainable throughput should be in the 500 Mbps range. Conventional disk farm configurations cannot meet these requirements.
I
As indicated above, several alternatives were considered for meeting these requirements. NASA could support development of: a high performance parallel transfer erasable optical disk buffer, such as RCAs proposed terabit buffer; a disk farm configured using parallel transfer magnetic disk drives; or, a disk farm of conventional disk drives configured with synchronized controllers.
Analysis of these options and the emerging capability to economically design and manufacture custom VLSI components led to the conclusion that synchronization conventional magnetic disk drives could potentially be the cheapest and most operationally attractive option. However, several risks were noted:
1) The development curve for magnetic disk drives could be leveling out. A disk farm comprising 400 to loo0 current technology drives would be required to meet the 1996 storage capacity requirement. The projection that this type of system would be the most economical was based on meeting the requirement with less than 100 drives, requiring a minimum of a factor of 4 improvement in packing density by 1992. However, all indications are that a factor of 4 improvement in packing density will be easily achieved.
2) The probability of a drive failure in a large disk farm may be too high at current drive mean time between failures (MTBFs) to avoid unacceptable data losses. Improved drive
45

reliability andlor error management schemes capable of recontructing all of the data on any one drive may be required.
3 ) File management of data spread across many drives could become excessively complex limiting attainable throughput to unacceptable levels.
4) The conversion of controller technologies and central processing units to peripheral channel standards (SMD-E to PI for example) could make upgrading from one generation of drives to another, difficult and expensive.
46

V. KEY ISSUES
The potential solutions were based on assumptions that can be influenced by future management decisions. These assumptions included selecting the most severe subsystem requirements for the architecture alternatives, using data retention times that would generate very large volumes to be stored, and not changing current on-board storage plans. These assumptions may be questioned or changed, and the analysis methodology used in this study should allow such changes to be translated into corresponding storage subsystems and technologies. The following paragraphs discuss how a change in these assumptions might alter the final conclusions.
The selection of system architecture will affect the amount of management needed for different volumes and data rates. The selection of a distributed or centralized architecture would have a drastic effect on the total system storage requirement; a fully centralized architecture, however, would result in consolidating data storage into a single facility on a large scale and consequently might increase the operational complexity of the centralized system.
The current plans to drive TDRS SA channels only at the full bandwidth rate of 300 Mbps. will require capturing and recording fill data and storing large data volumes. This requirement will increase the system outagehe outage protection volume by 50 - 1800%, and drive the high VO ratehigh volume capacity recording requirement while reducing the processing efficiency. The projected LZP requirement for high-speed, high-volume direct access working storage is driven by the need to resequence playback data received out of time order from on-board tape recorders. Sufficient on-board disk storage could reduce or eliminate this requirement, but rate conversion for utilization of lower cost communication links would then emerge as the driver. The data rate would be comparable, but the storage requirrement would drop 50%. In order to reduce the LZP function, an on-board storage facility for high-rate instruments, with characteristics like the RCA terabit buffer, would be required.
I I
The assumption that data must be stored for up to seven days, to provide data protection for users, drives the requirements for tape or disk autochangers. The processed data will be kept long enough to assure receipt by the user or to avoid the requirement for real-time user data processing operations.
k
41

VI. RECOMMENDED ACTIONS
Three teams worked in parallel to develop the previous sections on requirements, architecture, and technology. The entire mass storage committee identified the following actions required to meet the projected storage reqirement.
CONTINUE TECHNOLOGY PLAN
The timely availability of predicted systems depends on involvement with the vendors and other industry leaders. NASA mission requirements should be interwoven with industry's product development plans.
The lack of standards in emerging technologies reduces component interchangeability. Removable media must be readily available and compatible with multiple drives. The standardization of functional system components can be promoted by management's taking an active role in standards committee functions.
The life cycle cost estimates for disk farms supporting multiple commercial drives augmented by customized controllers have not been established. The controller technology and the extent or cost of modifications to the controllers have not been examined. NASA management should consider trade-offs between a commercial system, possibly more risky, and a customized system specially developed to NASA specifications.
Interface requirements must be established in order to support system expansion. Various subsystems will be required to meet the total end-to-end ground-based system requirements; standardized interface protocols will allow modular growth and ensure system transparency.
APPLY RESULTS T o SPECIFIC DATA SYSTEM DESIGNS
The study focused on functions performed primarily at the DIF and the LZP, but it did not consider the on-board or levels one, two, three, or four processing facilities. Each of these facilities is a critical link in the overall end-to-end information processing system. Decisions concerning the structure, location, equipment, communication links, and interface protocols for the DIF and the LZP will have far-reaching effects on the other processing facilities, as well as on the associated efforts such as SSIS, SAIS, CDOS, and EosDIS.
The cost of storage vs. the cost of communication lines and processing capacity must be studied. Far less storage would be required if more data were processed and transmitted in real time, but the communication and processing costs would increase tremendously. These two costs must be compared and a trade-off analysis performed.
Milestones should be established at points when NASA must determine whether commercial vendors will produce systems having the capability to meet identified needs. These decision points should allow enough time to implement alternative plans.
A wide variety of compatable technology choices must be made that can evolve as requirements change. The initial subsystems must be selected to accommodate projected sy s tem development.
48

NASA SHOULD MAINTAIN A FOCUSED R&D PROGRAM
Because of the complexity of the subsystems addressed, a focused R&D program is needed to support the complementary hardware/software development. Controllers will have to be developed to handle the high data rate input to multiple devices and multiple media. The synchronized multiple diskhpe systems may drive both network technologies and protocol standards. Research by commercial manufacturers in this area could result in the modeling or prototyping of new controller elements.
Experience is needed in the application of new technologies such as erasable optical disk and digital video tape. As standards have not yet been developed, feedback from NASA experience could ensure that products are available to meet space system requirements. For instance, there are a number of ways to format optical disks and by understanding the alternatives, NASA may be able to influence standards committees and recommend one procedure over another. Experience is also needed in the interface, formats, and operational aspects of using digital video tape for telemetry data storage.
DEVELOP END-TO-END SYSTEM STRATEGY
On-board storage systems will have a major impact on the volume and rate of data sent to the ground. On-board random access storage buffers could properly sequence pre- transmission data and reduce the ground-level storage and processing requirements.
Several other alternatives would reduce the magnitude of the storage problem. The removal of fill data before the system outage recording would reduce the system outage protection requirement from 1900 GB to 1200 GB in 1996. In 1992, this may be even more critical because the system outage protection requirement would drop from loo0 GB to 50 GB.
The Level-0 working storage would also be affected by the trade-off between media readwrite rates and the cost of communication lines. With more processing done in real time, storage costs go down but communication costs increase.
PERFORM ANALYSIS OF ARCHIVAL NEEDS
Archival requirements were excluded from the study. OSSA should consider performing a similar study of archival storage. Non-erasable optical disks and high- volume optical tapes should be investigated and their performance characteristics projected into the 1990's.
Erasable-media technologies are emerging to support a variety of data recording functions. These should be evaluated as a necessary complement to the archive requirements. Coordination is requireed between the OSTDS transpoet system and the OSSA science data management system to maximize component compatibility at recording, storage, and distribution nodes of the end-to-end system.
Note: The organizational name for the Office of Space Tracking and Data Systems (OSTDS) recently has been changed to the Office of Spaceflight Operations (OSO.) The acronym "OSTDS" was retained in this document.
49

APPENDIX I
MASS STORAGE COMMITTEE MEMBERS
John Sos Code 502
Chairman Systems Management Office
Ron Felice Code 500 Mission Operations and Data Systems Directorate
Richard Carper Code 502
Chairman: Requirements, Architecture Systems Management Office
John Lyon Code 502 Systems Management Office
James Michael Code 502 Systems Management Office
Chairman: Technology Data Systems Technology Division
John Dalton Code 520
David Howell Code 521 Data Systems Development Branch
Fred McCaleb Code 521
Technology Data Systems Development Branch
Edward Connell Code 522
Technology Data Systems Application Branch
Stanely Sobieski Code 530
Requirements, Architecture Networks Division
Michael Mahoney Code 560 Information Processing Division
Don Tinari, Retired Code 562
Technology Operations Management Branch
Gabriel Toth Code 562
Technology Operations Management Branch
Gene Smith Code 563
Requirements, Architecture Mission Support Systems Branch
Tom Ratliff Code 735 Flight Data Systems Branch
Technology B&C/562.2 Bendix Contractor for Facility Management
Kermit Way
50
Michael Healy Requirements, Architecture CTA Computer Technology Associates, Contractor
Linda Kempster Technology
John Martin Requirements, Architecture
CTA Computer Technology Associates, Contractor
CTA Computer Technology Associates, Contractor
Steve Talabac Architecture CTA Computer Technology Associates, Contractor
David Walters Architecture CTA Computer Technology Associates, Contractor
Clyde Dehng MITRE/NASA HQ-SEG
Pierre Portmann MTI'RENASA HQ-TX
51

APPENDIX I1
REQUIREMENTS’ TABLES: SPREADSHEET FORMULAS
This appendix contains listings of the cell formulas used in the seven spreadsheet tables presented in the Requirements section, of this report. An extract of each spreadsheet and the cell formulas associated with it are shown. The opposite page, facing the spreadsheet extract, contains some supplemental discussion explaining the technical detail and contruction of the total spreadsheet table.
All spreadsheet tables in the mass storage report were created with Lotus 1-2-3 on an IBM-compatible microcomputer. However, they could have been produced using any acceptable spreadsheet software product, such as EXCEL on the Apple computer. In fact, to print the spreadsheets in final form for this report, all PC Lotus 1-2-3 spreadsheet files were transferred to an Apple Macintosh, converted to EXCEL files and then printed on an Apple Laserwriter.
In most cases, the cell formulas shown are either the exact Lotus 1-2-3 formula specification or a close representation of the 1-2-3 formula. Otherwise, when a sequence of two or more math operations are used to calculate one cell entry, the cell formula is described in words. Describing the cell contents in words should give a better understanding of what the more complex cell entries really mean.
repeated together in all of the spreadsheet tables but the last one. The Instrument column lists all the major SS Era instruments that will have the greatest impact on data storage requirements. The Space Vehicle column identifies the spacecraft which will carry each respective instrument.
The first two spreadsheet columns, the Instrument and Space Vehicle columns, are
53
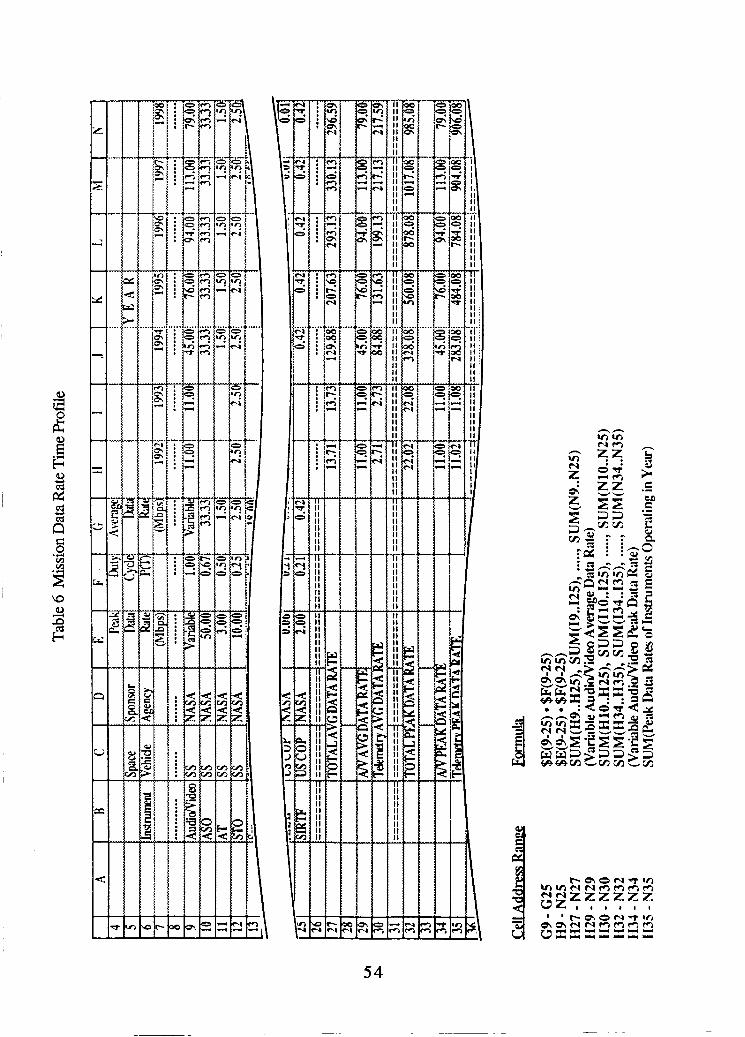
R
54

This spreadsheet was constructed in three sections: the instrument characteristics in cells B4 through G25, the instrument operating years and the corresponding average data rates in cells H7 through N25, and the data rate totals calculated in cells €327 through N35. The characteristics of all major instruments (transmitting at 1 Mbps or greater) were input to the spreadsheet from cells B9 through F25. The spreadsheet groups all the instruments together and sorts them by the space vehicles that cany them.
The space vehicle codes are: S S - Space Station, FF - Free Flyer, Eos POP - Earth Observing System Polar Orbiting Platform, US COP - United States Co-orbiting Platform, ESA POP - European Space Agency Polar Orbiting Platform.
The instrument peak data rates and duty cycles were taken from the Master Records Data Base (MRDB). Since the A/V data transmissions have a 100% duty cycle, the AN peak data rate and average data rate are equal. The data rate values, however, vary from year to year.
The average data rate of each instrument is computed by multiplying its peak data rate by its duty cycle (the proportion of time the instrument is transmitting in a 24 hour period). The average data rates are (1) listed in a single column, from cells G9 through G26, and (2) repeated in the years an instnunent is operational, commencing with the launch year. The f i t data rate entry in a row under a given year heading marks the first year an instrument is operational and sending data to the ground station . The variable A/V data rates require special handling in the spreadsheet. Each unique A/V data rate value in each year is entered in each cell independent of the others.
The data rate totals summary is divided into two parts: the average data rate totals by year in cells H27 through N30, and the peak data rate totals by year in cells H32 through N35. Double dashed lines separate the average data rate summary from the peak data rate summary. The cell values for the peak data rate totals were used to produce the histogram bars in Figure 2.2- 1, the Peak Data Rate Time Profile.
1
55
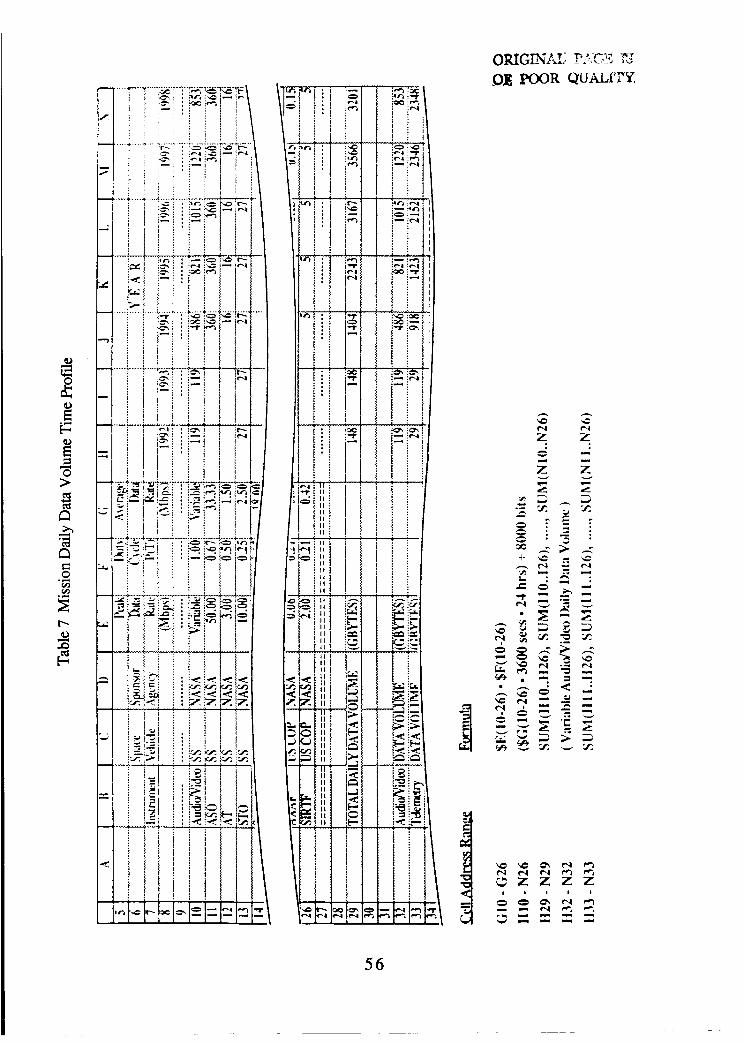
56
7 I I I I I I I
I I I I I I I
I I I I I
I I
7
a -

This spreadsheet was constructed in three sections: the instruments' attributes in cells B5 through G26,' the instruments' daily data volumes by year in cells H8 through N26, and the daily data volume totals in cells H29 through N33. The characteristics of all major instruments (transmitting at 1 Mbps or greater) were input to the spreadsheet from cells B 10 through F26. The spreadsheet groups all the instruments together and sorts them by the space vehicles that carry them. The first daily data volume entry in a row under a given year heading marks the first year an instrument is operational and sending data to the ground station . The variable A/V data rates and their associated daily data volumes require special handing in the spreadsheet. Each daily data volume value in each year is entered in each cell independent of the others.
The daily data volume formula computes the amount of data produced by the instruments in GB per day. The daily data volume figures are first computed in bits per day. This is done by multiplying the average data rate in Mbps by the number of seconds in a day (3600 secs 24 hours). Then, this result is converted to GB per day by dividing megabits per day by 8000 megabits per GB. The daily data volume values are rounded to the nearest whole GB using the Lotus 1-2-3 / Format Range command, with the decimal places parameter set equal to zero.
The daily data volume totals summary is divided into two parts: the combined daily data volume totals by year in cells H29 through N29, and the daily data volumes separated into A N and telemetry categories and totaled by year in cells H32 through N33. The cell values for the A N and telemetry data volume totals were used to produce the histogram bars in Figure 2.2-2, the Daily Data Volume Time Profiie.
57

7 N P I I 1 I 1 l l
I1 II II II II I 1 ' :
TT
!h I I I I I I
Ti- l l
II
II II II
'TT I1 I1 I I I
5 8

In this spreadsheet, the instruments are sorted and segregated by sponsor agency (NASA or NOAA, in this case). The data transmission rates are tabulated separately for each of the sponsor agencies. The first data rate entry in a row under a given year heading marks the first year an instrument is operational and sending data to the ground station. The variable A/V data rates in Row 18 require special handling in the spreadsheet. Each unique A/V data rate value in each year is entered in each cell independent of the others.
The same methods which were used in the preceding data rate spreadsheet to calculate the individual instrument's average data rate and data rate totals are used in this spreadsheet. The data rate totals are summed for all instruments sponsored by one of the listed agencies. The total peak data rates in rows 15 and 35 are simply the sum of the peak data rates of instruments sponsored by the designated agency, NOAA and NASA, respectively. Double dashed lines separate the sponsor agencies' data rate summaries. The cell formulas used for the data rate summary of the first agency, NOAA, are repeated in the summary sections of the other agencies.
5 9

H- I
-
-
I
-
I
I I I I I I I I I I I I I I I I I I I I I I I I
I I I I I I I I I I I I I I I
I I I I I I I I I I
I
-
i
-
I
I
- 1
-
60

In this spreadsheet, the instruments are sorted and segregated by sponsor agency (NASA or NOAA, in this case). The daily data volumes are tabulated separately for each of the sponsor agencies. The first daily data volume entry in a row under a given year heading marks the first year an instrument is operational and sending data to the ground station. The variable A/V daily data volumes in Row 18 require special handling in the spreadsheet. Each unique A/V data volume value in each year is entered in each cell independent of the others.
The daily data volume totals are summed for all instruments sponsored by one of the listed agencies. Double dashed lines separate the sponsor agencies' daily data volume summaries. The daily data volume values are rounded to the nearest whole GB using the Lotus 1-2-3 / Format Range command, with the decimal places parameter set equal to zero. The cell formulas used for the daily data volume summary of the first agency, NOAA, are repeated in the summary sections of the other agencies.
6 1

?
r I I I I
I I I I I I I I
!.
r I I I I I- I I I I I I I
I I I I I I I
r
r I I I I I I I
I I I I I
I
r I I I
I 'i I I I I I I
II II I 1 ll II II II
ii
iT II I 1 ll II I 1 I I I I I I I I1
c
tl I1 I8
I I'
I' I I
- 4 * -
6 2

This spreadsheet sorts the instruments by the data delivery destination at the LZP level, otherwise known as the data packet processor location. Double dashed lines separate the Delivery Destination, or LZP Location, data rate summaries. The cell formulas used for the data rate summary of the first LZP Location, GSFC, are repeated in the summary sections of the other LZP locations. The first data rate entry in a row under a given year heading marks the first year an instrument is operational and sending data to the ground station . The variable A/V data rates in Row 29 require special handling in the spreadsheet. Each unique A/V data rate value in each year is entered in each cell independent of the others.
The LZP Location abbreviations are: GSFC - the Goddard Space Flight Center at Greenbelt, MD; JSC - the Johnson Space Center at Houston, TX; and JPL - the Jet Propulsion Laboratory at Pasadena, CA.
The total peak data rates in rows 25 and 34 are simply the sum of the peak data rates of instruments assigned to the designated LZP. The JSC Total Peak Data Rate in row 34, when the Sensor Lab is transmitting, is calculated by combining the peak rates of the Sensor instrument and the A/V instruments together. The JSC Total Peak Data Rate changes from year to year by the amount that the A/V data rate varies.
63

1 I I
I I I I
I I I
I
r
I;
I1 I1
I I1 I1 I1
II
n , I I I
I
I I
n 1 1
1
1 I I
1
I I
1
I
I
1 I I I
a
I I I I I
.. h 3
c!
64
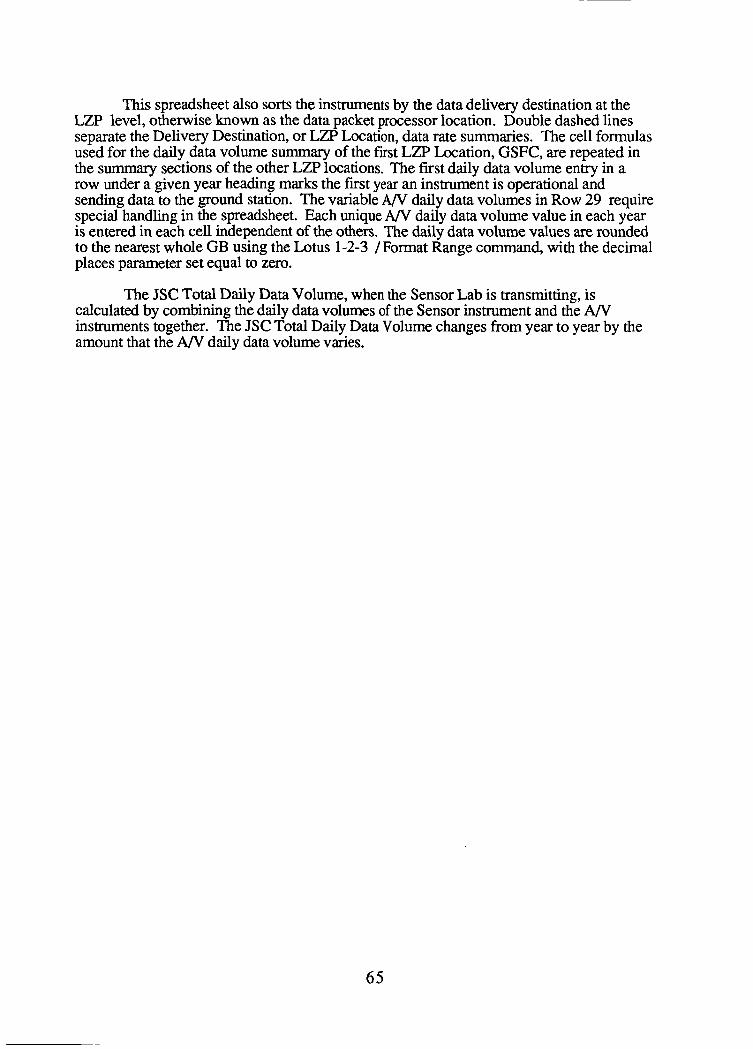
This spreadsheet also sorts the instruments by the data delivery destination at the LZP level, otherwise known as the data packet processor location. Double dashed lines separate the Delivery Destination, or LZP Location, data rate summaries. The cell formulas used for the daily data volume summary of the fist LZP Location, GSFC, are repeated in the summary sections of the other LZP locations. The frst daily data volume entry in a row under a given year heading marks the first year an instrument is operational and sending data to the ground station. The variable A/V daily data volumes in Row 29 require special handling in the spreadsheet. Each unique A/V daily data volume value in each year is entered in each cell independent of the others. The daily data volume values are rounded to the nearest whole GB using the Lotus 1-2-3 / Format Range command, with the decimal places parameter set equal to zero.
The JSC Total Daily Data Volume, when the Sensor Lab is transmitting, is calculated by combining the daily data volumes of the Sensor instrument and the A/V instruments together. The JSC Total Daily Data Volume changes from year to year by the amount that the AN daily data volume varies.
65
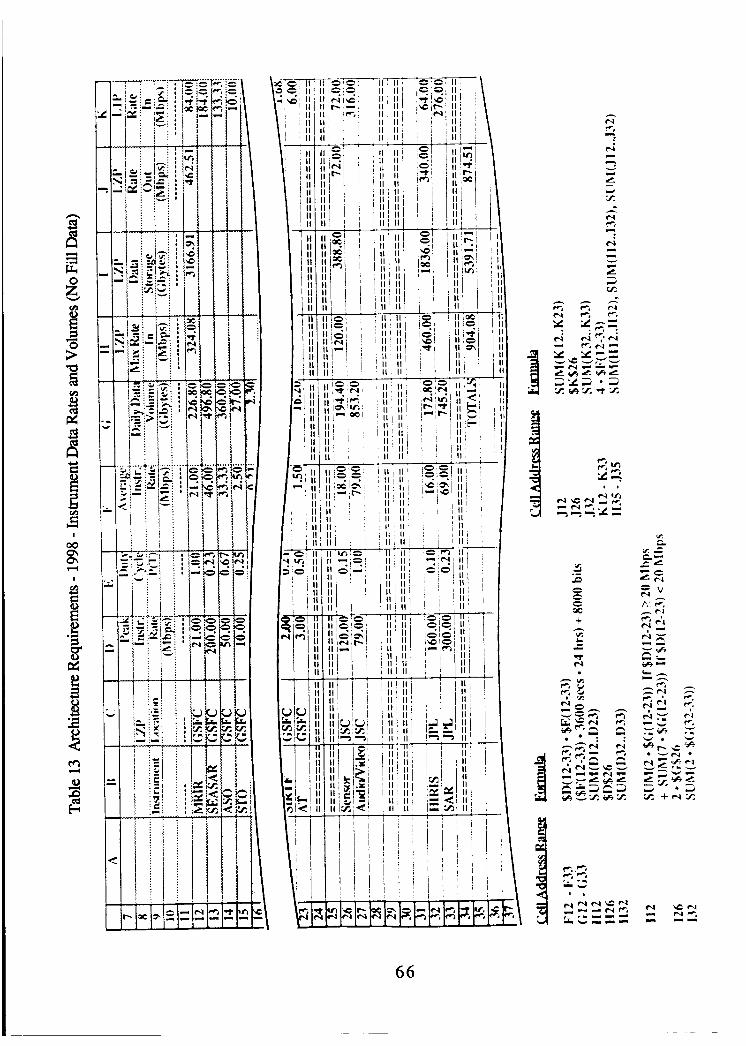
- I I I I
II II II
I1 II II II II II II I I
n
-
1 1 ; II I I , II
i l l II ! 1 1 ' II I I I . II , I1 II
I1 II I I ! II + II ~ I 1 II , I1 I I ' I I
- 1 - ~ ! ! ! !
6 6

This spreadsheet was used to compute the data rates and data storage capacities at each data packet processor or LZP. Like the preceding two spreadsheets, the instruments are sorted by the data delivery destination at the LZP level.
The first five columns, B through G, contain the same entries which appear in the other spreadsheets. Columns H through K contain the key information on the LZP storage requirements, including transfer rates and storage capacities. Columns H, I, and J list the subtotals of data rates and volumes for each LZP location. Double dashed lines separate the LZP detail.
The sequence, in which the column cell values are calculated, is different than a normal left to right sequence. The L1P data rates, in column K, are calculated first. Since each instrument is assigned its own L1P for its unique, dedicated "information file processing", the corresponding L1P Rate In is calculated by multiplying the instrument's average data rate by a "burst factor", in this case a factor of four. This implies that 24 hours worth of an instrument's data will actually be sent to its L1P in a total of 6 hours. The L1P Rate In values, subtotaled for their respective LZP, give an equivalent LZP Rate Out measurement, listed in column J.
The data storage capacity for each LZP, appearing in column I, is calculated by combing the results of two alternate formulas. The data from instruments with peak data rates of 20 Mbps or greater will be stored for two days at the LZP and data from the other instruments will be stored for seven days. Hence, the daily data volumes of high rate (2 20 Mbps) instruments are multiplied by 2 and then summed; and the daily data volume of low rate (c 20 Mbps) instruments multiplied by 7 and then summed. The results for each category of instrument are then combined to produce the total LZP Data Storage capacity.
The LZP Max Rate In, listed in column H, is simply the sum of the peak data rates of instruments assigned to that LZP. A/V data will be stored apart from the JSC mass storage system. Consequently, the JSC LZP Max Rate In, or the required data transfer rate, is the Sensor Lab peak data rate.
67

APPENDIX I11
STORAGE SUBSYSTEM DETAILED REQUIREMENTS DERIVATION
This appendix contains the detailed tables produced while developing and analyzing the storage subsystem derived requirements. The conclusions drawn from this analysis have been summarized in Appendix IV and the Derived Requirements For Storage Subsystems subection of the main document.
Requirements for each of the storage subsystems identified in Figure 14 were derived by considering the critical parameters which could affect each subsystem. The magnitude of the problem of deriving requirements for each identified subsystem for each architecture for each target year (a potential total of 90 sites of storage subsystem requirements), and the desire to apply a consistent approach to each derivation, led to developing an algorithm for the process. This algorithm is shown in 5 tables found on pages 69 through 7 1, one table for each architecture. It was recognized that each architecture did not require every type of storage subsystem. For example, the subsystem used for data protection also could be used for the function of line outage protection. Where a separate subsystem clearly would not be needed, the requirements were marked NIA.
The meaning of most terms used in the tables on pages 69 through 7 1 is self- evident. The term "SN Rate" refers to the rate as received from the TDRSS, that would include data and fill. The term "Data Rate" refers to the rate after removal of transfer frames containing only fill. Within the SIZE column, the terms "High" and "Low" refer to payload data streams having an average data rate of greater than 20 Mbps or 20 Mbps or lower. The ACCESS TIME column refers to the amount of time permitted to respond to requests for data, regardless of the volume of data requested. The READ RATE column refers to the rate of delivering the requested data once delivery has been initiated. The USERS column refers to the number of independent and possibly simultaneous requests for data. A user could be an application program within the storage subsystem's local facility, or a user could be a person or system at a remote facility requesting data. Data rates with a horizontal bar above them denote an average data rate.
From the algorithms developed in the tables on pages 69 through 7 1, data on rates was taken from Tables 6-1 1 of the main document for each of the target years. This produced the data in the tables on pages 72 through 80.
68

n
I
I n
I I I I I I I I I I I I I
? z I I I a 1
5 z --
i z
I I I I I I
I I
I
I I I I I I I I
n
n -
i 0 '
( D ' --- I
--
a t
I I I
I I I
--- I I
I -
: &
69

1 E 8 0 ? : = :
c 8 .o, : I .
a
z : . I
- 0 --- n I I I
----- I I I
a I
Y
I I I Y I - .
I
--- I I
I I a
I I I - ,
I
70

II I1
' d : z
71
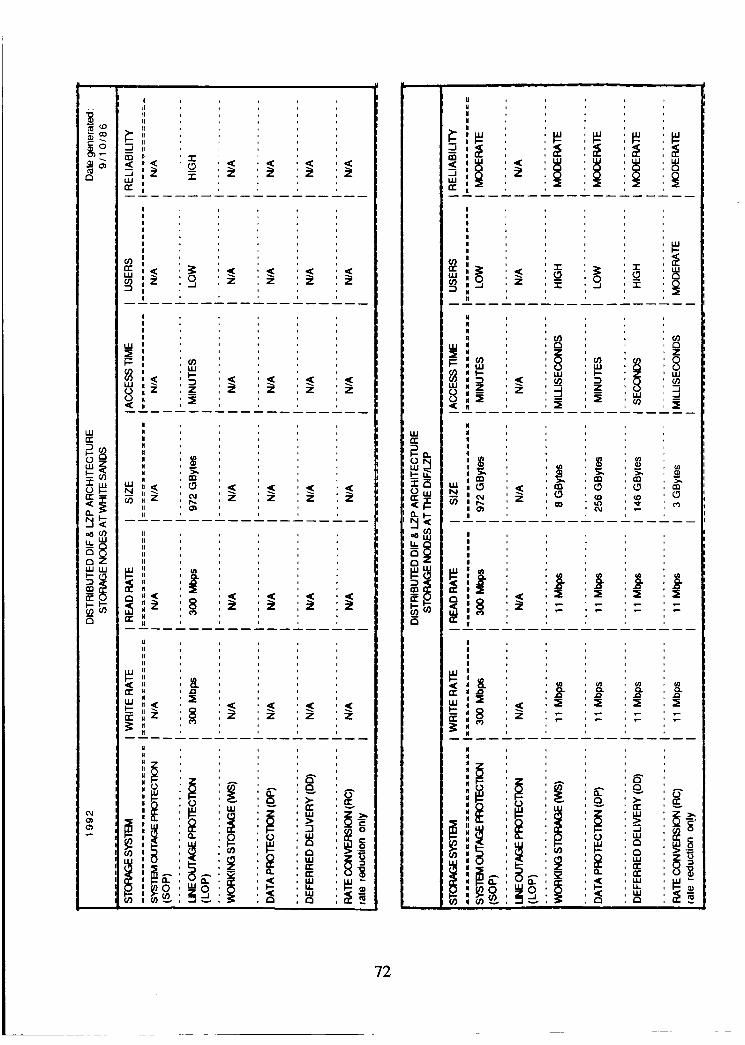
i l i l il , a : t
II II Y I1 I1 I1 I1
'i : Z
:i , z 'i : z 'i : z
11 I1 11 II I1
U II II
72
I Y I 8
Y n
Y I I
llz :

11 I1
i s
73

I1 I1 I1 I1
74

: = 'L2 ' I is
I
U Y n
f z w 0 0
I I
' v ) : I : 2 I
'i : z 'i : Z
I I I
I I
.------ I
75

H
: 2 : %
I I I I I I I
2 ; in = :
76
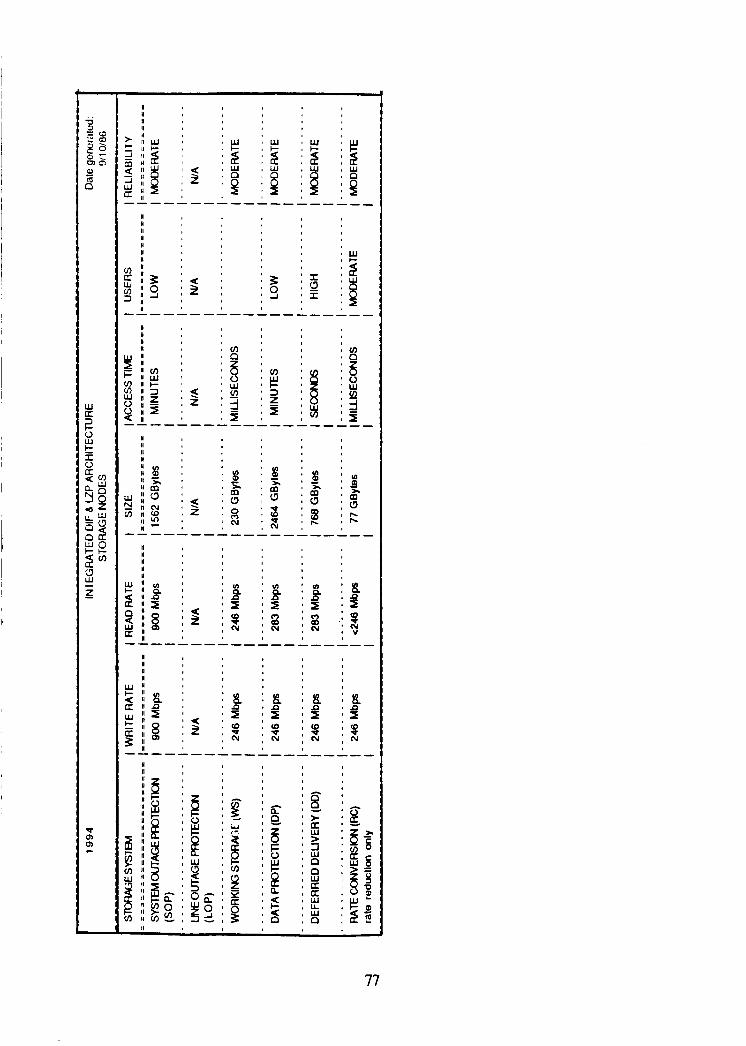
> c i m U A iu U
-
Y w U
I Y U
77

'i : z ' 5 : z 'i : z 'i : z
I I I I I
Y i
' a : P 11
: v : s
78

I I I
------------------- I I I I I
------------------- I I I I
I
I I I I I I I
I I I
I I
79

80

APPENDIX IV
STORAGE SUBSYSTEM SUMMARY REQUIREMENTS
The tables in this section summarize data developed in Appendix ID. The data in the tables on pages 72 through 80 was condensed into the tables on pages 82 through 84, showing a summary of requirements for each of the target years. The data in the tables on pages 82 through 84 was further condensed into the data shown in Table 14 of the main document.
8 1

I I
82
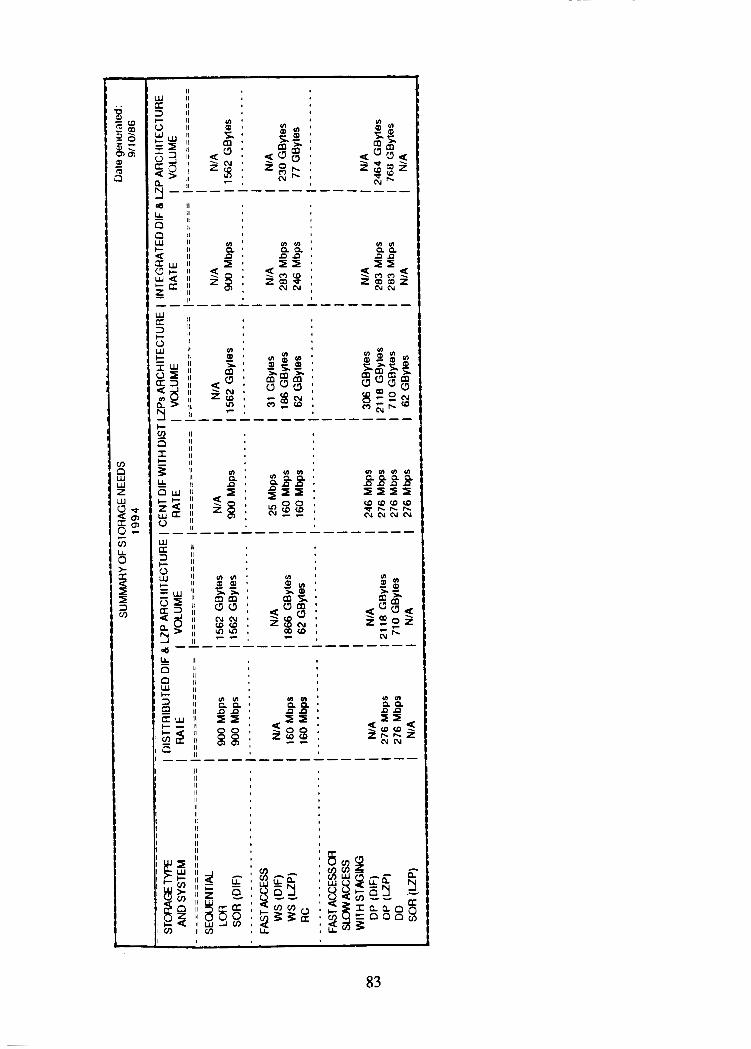
w = II 2 II
& II 0 '1
0 II
II I1 II II II II II II
I

II I1 II I1 II II IL II II II II
84

APPENDIX V
RATES, VOLUMES AND FILL TIMES OF CANDIDATE SYSTEMS (As of 10/86)
WRITE ONCE TRANSFER SYSTEMS RATES
WPS)
RANDOM ACCESS
A. Hitachi OD 141-Library 3.5 Single drive
B. 12” OD 120-Library (90) 48 12” media
C. RCA OD 68-Library 100 128-Library
D. Kodak OD 1 5 0 - L i b ~ (88) 8
E. RCAOD68-Library (89) 300 128-Library (89)
SEOUENTIAL ACCESS
F. DocData Opt Tape (88) 1.6
G. CREO Opt Tape (89) 24
MEDIA UNIT FILL
VOLUME TIME (GW (mS1
2.6 1.6
10 .46
10.4 .23
6.8 1 9
10.4 .08
6 8.3
loo0 92.5
LIBRARY UNIT COST
VOLUME (GB)
367
1200
707 1330
1020
707 1330
750
-I-
Vol(GB) x 8000 = Vol(Mb) / Rate(Mbps) / Sec per hour (3600) = Fill time in hour
The number in front of “library” indicates the number of single media robotically addressed. (LL? Indicates Leonard Laub as the information source. (Year) Indicates predicted system availability. Systems without dates are currently available.
FILL /MBm TIME OR (ms) /SYSTEM
233 $400K $7SK
55 $.09/MB $200 EA
15.5 $2M 29.3 NA
280 NA
5.2 $2M 9.8 NA
1,041 NA
--- $200K
85

RATES, VOLUMES AND FILL TIMES OF CANDIDATE SYSTEMS (cont'd)
ERASABLE TRANSFER SYSTEMS RATES
W P S )
RANDO M SINGLE DRIVES
R-A. Ampex 149
R-B. IBIS 96
R-C. CDC 24
R-D. IBM 3380E (87) 48
R-E. Solid State (90) 800
R-F. IBIS (90) 600
R-G. IBM OD Buffer (92) 96
R-H. RCA Tb Buffer (92) 1600
R-I. IBM 3380 (92) (LL) 96
R-J. 5.25" M/OOD (92) (LL) 20
R-K. OS1 OD (92) (LL) 48
R-L. IBM 3380 (98) (LL) 192
RANDOM LIBRARY UNITS
R-M. 12" M/O OD 141-Library (89) 3.5
R-N. RCA OD 68-Library (90) 150 128-Library (90) 14" media (3M. PDO, Kodak) 14" media (Celanese)
R-0. 12" M/O OD 14 l-Library (92) (LL) 48
(As of 10/86)
MEDIA UNIT
VOLUME (GB)
0.8
1.4
.86
5
0.6
9
80
125
20
2
10
40
2.6
10
10
FILL TIME 0
0.6
1.8
5.4
13.8
0.1
1.8
108
10.2
27.6
12
27.6
27.6
96
9
27.6
LIBRARY UNIT
367 23 1
680 10 1280 18.8
1410 64.6
Vol(GB) x 8000 = Vol(Mb) / Rate(Mips) / S e c per min (60) = Fill time in minutes
The number in front of "library" indicates the number of single media robotically addressed. (LL) Indicates Leonard h u b as the information source. (Year) Indicates predicted system availability. Systems without dates are currently available.
COST
myTE OR
/SYSTEM
NA
$100K
$12K
$20/MB
NA
NA
$200K
$2.5M
$2.50/MB
$.M/MB
NA
$1.25/MB
$I/MB
$2M NA
$lo00 EA $200 EA
NA
86

RATES, VOLUMES AND FILL TIMES OF CANDIDATE SYSTEMS (cont'd) (As of 10186)
ERASABLE MEDIA UNIT
TRANSFER FILL SYSTEMS RATES VOLUME TIME
W P S )
SEOUENTL4.L: REEL-TO-REEL
S-A. RCA HDDR 400
S-B. Ampex HDDR 320
S-C. Ampex (88) 106
S-D. Kodak Datatape 60(90) 450
S-E. RCA Opt Tape Sys (92) 1600 Optical tape reel (LL)
S -F. RCA Dig Video Cassettes 200
S-G. KodakRDCRcaS~ette~ 100
S-H. Honeywell VLDS (87) (LL) 32 Honeywell Cassette unit
S-I. VHS Cartridge (88) 100
S-J. Hitachi HDTV (88) (LL) 100
S-K. Sony DVR-1000 (88 (LL) 216
S-L. Sony DVR-1000 (90) (LL) 400
S-M. Kodak D?TR Std Video Cassette (90) 400
(GB)
125
lo00
573
37.5
2500
125
27.5
5.2
3.8
50
123
115
96
(HRS)
0.7
6.9
11.9
0.2
3.4
1.4
0.6
0.4
0.1
1.1
1.3
0.6
0.5
LIBRARY UNIT COST FILL /MBYTE
(GB) (HRS) /SYSTEM VOLUME TIME OR
$1M
$1M
$400K
$1.2M
$5M $500 EA
$100K
NA
$44K $50 EA
$11 EA
NA
$120K
$250K
NA
SEOUENTIAL: LIBRARY UNITS AND MULTIPJ .E SYNCHONEOUS DRIVFS
S-N. Kodak RDCR 331 (32 Tapes) 3@100=300 27.5 2 880 6.5 $5M
S - 0 . Honeywell VLDS
S-P. Sony D1M 100-
600-Libmy (89) (LL) 5 @32=160 5.2 .07 3120 42.9 $500K
Library (90) (LL) 4 @400-1600 57.5 .OS 5750 7.9 $SoOK
S-Q. Kodak JBX-200 (60 tapes) (90) 200 96 0.5 57600 633.6 NA
The number in front of "library" indicates the number of single media robotically addressed. (LL) Indicates Leonard h u b as the information source. (Year) Indicates predicted system availability. Systems without dates ate currently available.
87
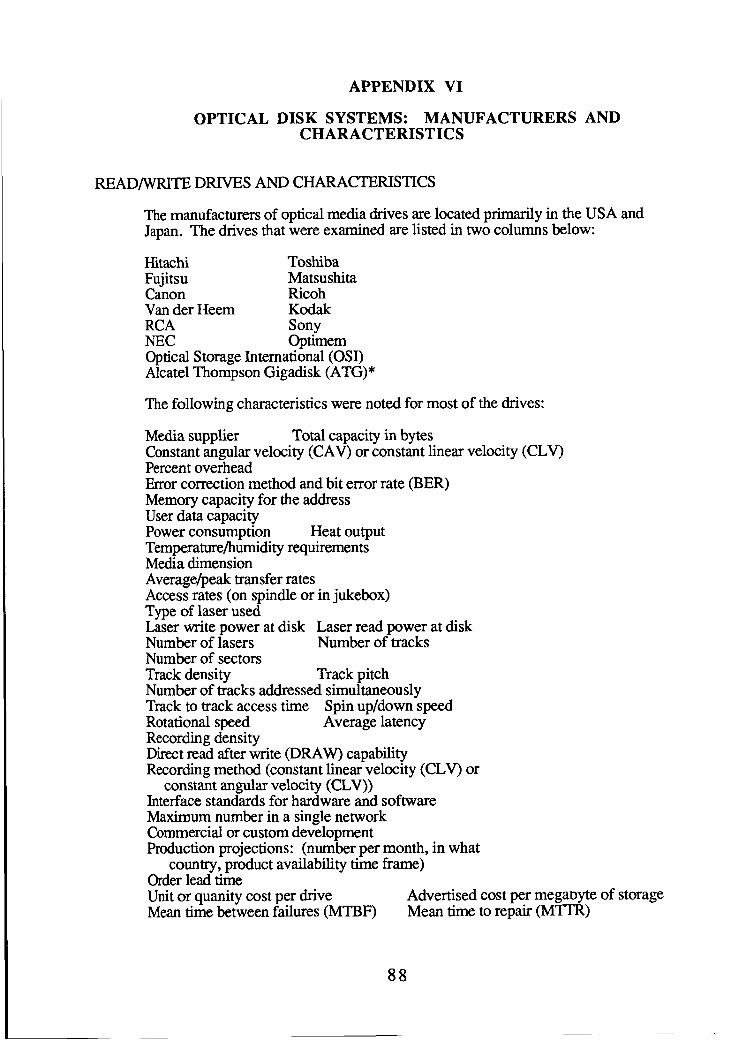
APPENDIX VI
OPTICAL DISK SYSTEMS: MANUFACTURERS AND CHARACTERISTICS
READ- DRIVES AND CHARACTERISTICS
The manufacturers of optical media drives are located primarily in the USA and Japan. The drives that were examined are listed in two columns below:
Hitachi Toshiba Fujitsu Matsushita Canon Ricoh Van der Heem Kodak RCA Sony NEC Optimem Optical Storage International (OSI) Alcatel Thompson Gigadisk (ATG)*
The following characteristics were noted for most of the drives:
Media supplier Constant angular velocity (CAV) or constant linear velocity (CLV) Percent overhead Error correction method and bit error rate (BER) Memory capacity for the address User data capacity Power consumption Heat output Temperature/humidity requirements Media dimension Average/peak transfer rates Access rates (on spindle or in jukebox) Type of laser used Laser write power at disk Laser read power at disk Number of lasers Number of tracks Number of sectors Track density Track pitch Number of tracks addressed simultaneously Track to track access time Spin up/down speed Rotational speed Average latency Recording density Direct read after write (DRAW) capability Recording method (constant linear velocity (CLV) or
constant angular velocity (CLV)) Interface standards for hardware and software Maximum number in a single network Commercial or custom development Production projections: (number per month, in what
Order lead time Unit or quanity cost per drive Mean time between failures (MTBF)
Total capacity in bytes
country, product availability time frame)
Advertised cost per megaDyte of storage Mean time to repair (Mm)
I 8 8

OPTICAL DISK MANUFACTURERS
There are several manufacturers of non-erasable optical disks that were evaluated. Those manufacturers who made 8,12, or 14 inch diameter disks are listed in the following two columns:
Philips/Dupont Optical (PDO) RCA Ricoh Hitachi Sumitomo os1 Toshiba Diacel Chemical Diacel USA Optimem Pioneer ATG* Kodak 3M
The characteristics associated with most of the disks are listed below:
Diameter Number of recording sides Pre-grooved disks: number of sectors and tracks, spiral or concentric tracks, track
density/pitch Substrate material If the medium is changed by bubble formation or
pit formation The life time before and after recording Media archivability BER acceptability Error correction code used Producion projection: ( part number and name,
Cost per disk by unit/in quantity Cost per megabyte MTBF andMTTR
availability, plant capacity, lead time)
There are many companies experimenting with erasable disks in the 5.25 inch size. This size would not accommodate Space Station needs but it is important to note the number of companies working to deliver this medium. Sony and Canon had looked at 8 inch and 12 inch but are not currently persuing that size disk. The primary difference between these companies is the manner in which data will be written, erased, and rewritten. The components of the disk substrate determine the erasable techniques. Companies developing polycarbonate-based magneto-optic erasable disks are: Kyocera, Asahi Chemical, BASF, TDK, Toshiba, and Verbatim (3.5 inch). Diacel Chemical, 3M, Matsushita, Mitsubishi, Hatachi-Maxell, Sumitorno Metal and Mining, Sumitorno Bakelite (epoxy-based), and Sumitomo Chemical are developing additional magneto-optic media. Kitachi is developing a phase change medium. Optical Data Incorporated is developing a polymer-dye medium, but TDK abandoned this substrate because the data did not last after they erased the disk several thousand times.
ATG declared banlcruptcy 4486. *
89

DISK LIBRARY SYSTEMS
There are numerous vendors who either manufacture entire systems or purchase the
NEC Cannon Toshiba Philips RCA 3M Infodetics Kodak TAB Cygnet DOCumatiC Access/OSI Interfile Mitsubishi FileNet Fujitsu Hitachi Integrated Automation AT&T Aquidneck Fuji Laserdata Minolta Ricoh Integrated Software Systems Computime Computer Services
components to deliver and support entire systems. A list of these vendors follows:
The characteristics identified for most of the systems are shown below:
Which jukebox supports the system number of picker arms number of supportable drive units total number of disks supportable
tradeoff between number of drives and number of disks Number of jukeboxes that can be networked Byte capacity of the jukeboxlsystem Access time from a spinning disk or from a disk in the jukebox Compatible software/hardware interfaces Environmental rquirements/constraints Power consumption levels Production potential: (time-frame availability,
Unit or quanity cost MTBF andM'ITR Other special features
lead time, where available, plant capacity)
90

APPENDIX VI1
LEONARD LAUB PROJECTIONS SUMMARY
Leonard Laub of Vision Three, Inc., was hired as a consultant because of his expertise in mass storage systems and his familiarity with the companies planning and developing the next-generation hardware and fiiware. Following this summary is an address list for companies from which current brochures may be obtained.
His research primarily supported findings reported in previous NASA studies that were used to develop the briefing book. This summary highlights the technological projections that he made concerning magnetic and optical storage. To aid cross- referencing, the titles in this summary are the same as those in Laubs original document.
BACKGROUND
NASA currently routes all communication data between commercial, scientific, and military payloads and their owners through a ground-based node. This involves a massive processing effort to remove formatting data and to demultiplex the data stream into virtual channels for each user. As more satellites and payloads are launched, the processing and routing job will increase tremendously.
Laub’s predictions concern the probable cost and performance characteristics of emerging commercial storage systems and subsystems that could handle the calculated increase.
TECHNOLOGIES TO BE PURSUED BY NASA I
In this section, Laub presented three general technologies to be considered magnetic storage, optical disk, and optical tape. The projections concerning these technologies are reviewed in the following paragraphs.
1 Magnetic Storage
Magnetic media are supreme for not only computer data storage but also for professional and consumer video and audio recording and distribution. Because of the tremendous commercial value of any improvement, there has been a steady, rapid rise in the performance of magnetic recording systems in the past several decades. A few growth projections are covered in the following sections,
Magnetic Disk
The following table is extrapolated from Laubs projected IBM 3380E magnetic disk development:
YW: 1992 1997 Rate (per spindle): 96 Mbps 192 Mbps Volume (per spindle): 20 GB 40 GB Cost (1986 Dollars) : $2.50/MB $1.25/MB
roughly as the square root of areal density (azimuthal density times radial density). This Laub explained his theory by relating that over the long term, the data rate goes up
91

reflects the dependence of the data rate on azimuthal density (bits per inch) but not on radial density (tracks per inch); it implies that the data rate goes up by a factor of 1.4 (the square root of 2) every 2.4 years. It is eleven years from 198 1 (introduction of the IBM 3380, the first disk drive operating at 24 Mbps), to 1992. That is 4.6 intervals of 2.4 years each. 1.4 raised to the 4.6 power gives a factor of 5. Data transfer rates of IBM disk drives usually match current block multiplexer channel rates, which will probably continue to be raised by factors of 2 (48 Mbps channels are about to be introduced). The probable 1992 data rate is thus two doublings of today's rate: 96 Mbps.
1992 is eight years after the 1984 introduction of the 3380E. Eight years provide 3.3 doublings of areal density, and hence capacity per 14 inch platter. Raising 2 to the 3.3 power gives a factor of 10, but it is prudent to expect straight doublings of the capacity in successive products, leading to a factor of 8. The probable 1997 data rate is 2.5 GB times 8: 192Mbps.
Magnetic Tape
Because of the need for interchange standards, magnetic tape technology is evolving faster than the mainstream commercial data storage equipment based on it. The volumetric density of IBM 3480 cartridges is .l that of the Honeywell VLDS which is scheduled for production in mid-1987. The device stores 5.2 GB of user data in a VHS videotape cassette, transfers data continuously at either 16 or 32 Mbps, and should cost $44,000 per drive.
Kodak's Datatape division has modified a Robert Bosch BCN videotape transport to produce their RDCR (Rotary Digital Cassette Recorder) that transfers data at 100 Mbps, stores 28 GB per cassette, and costs about $300,000.
Commercial autochangers for videocassettes, used for automating TV stations or cable networks, hold multiple drives and anywhere from 32 to 600 cassettes. The projected modification of these autochangers could result in mass storage facilities if the drives are instrumentation recorders based on forthcoming digital videotape recorders. Sony expects to start selling its DVR-1000 in the fall of 1987 for $120,000. This machine uses the CCIR 601 4:2:2 component digital video encoding, which produces a continuous data rate of 216 Mbps and has a maximum storage capacity of 125 GB on the D-1 cassette format.
By 1988, Sony expects to store over 3 GB of well-corrected data on forthcoming rotary-head digital audio tape recorder cassettes. This is the same areal density as in the D- 1 cassette products and will probably mark a plateau of commercial achievement lasting at least five years. Because of this five year estimation, the D-1 products in this report represent the magnetic tape technology acquirable through 1992.
Beginning in mid-1988, Sony expects to sell a general-purpose instrumentation recorder, based on the DVR-1000, for $250,000. The data rate will range between 15 and 250 Mbps but could reach 400 Mbps.
Optical Disk
Optical disk products are just beginning to emerge from the technology-driven era in which their direct descent from the videodisc was evident. Write-once optical disks and drives are now beginning to play an important role in the commercial data storage market, but their properties make them functionally suitable only for archives. The last phase of this emergence will probably be erasable disks (currently being demonstrated in the 5.25
92

inch size). The media being tested require either a two-pass process for overwriting (magneto-optic layers) or replacement of the media every thousand or million overwrites (dye-polymer and phase change substrates). When media production standards have been established and erasable media are supporting elements of the data storage industry, it should be possible to use them interchangeably with magnetic buffers.
Compared to futed magnetic disk media, whose least expensive example (the Maxtor 250 ME3 5.25 inch drive for $2500 in OEM (original equipment manufacturer) quantities) is priced at $10 per MB, most current optical drives cost $4 per ME3 in OEM quantities. It is anticipated that in five or six years, there could be a full order of magnitude difference in drive price per megabyte between optical and magnetic media.
Improvements in laser power and optics performance (expected within the next five years), along with laser wavelength reduction (which could take ten years), will enable linear velocity to be raised. This will improve the marking rate and the storage density. If the spot density is cut in half, the areal density increases by four. These effects can increase the data rate by up to 16 times; they can increase data capacity by four and reduce rotational latency by two--all with no change in media characteristics or channel code efficiency. Most current writable drives store less than one bit per mark, but experimental systems have shown eight or more bits per mark, even with mark sizes well below one micrometer. A summary of optical disk performance characteristics is included in Appendix V, which lists the data rates and storage volumes of candidate systems.
Jukeboxes for Archiving
To take advantage of the cost benefits of random access archival media, jukeboxes have been developed to hold between 16 and 200 disks. This means 10% of the stored data is on line and the rest is 10-30 seconds away. Present jukeboxes, based on 12 inch drives, run below $1 per megabyte. Projected costs for the jukeboxes using 5.25 inch drives are about $0.20 per megabyte. It is unlikely that individual jukeboxes will get much faster or will contain many more disks per picker arm than present models. Most systems need to increase the number of drives per jukebox in order to increase the amount of spinning storage and decrease the access time for multiple users.
Erasable Optical Disks for Buffers
It is estimated that 1992-era large commercial drives supporting a directly- overwritable erasable optical medium would cost approximately $5000 per drive, and would have a platter capacity of 10 GB and a transfer rate of 40 Mbps. Compared with a similar 1992-era magnetic implementation of the buffer, the optical implementation covers one-sixth the floor space and costs about one-fourth the amount.
Several media technologies under development show promise of meeting this functional buffer need. Phase change media are simple to make, simple to read, and require very little additional complexity in the drive. Unfortunately, they cannot seem to endure more than 'kame number of thousand writehead cycles." Although they are still experimental, dye-polymer media are very attractive in the long term, with a promise of low manufacturing costs and high product uniformity. Magneto-optic media are difficult to make, require more precise focusing mechanisms, and have a potential to corrode. In spite of this, they are in pilot production by several large f m s . Their endurance limit has not been reached, and they are more sensitive than dye-polymer media.
93
RCA's Terabit Buffer Proposal
RCA proposes to build a spindle carrying twelve aluminum, 14 inch magneto-optic erasable disks. This machine is projected to store 125 GB (1 terabit) of data and to transfer data at 1600 Mbps. The transfer rate would be accomplished by recording eight parallel tracks simultaneously on each surface, and by having a head record on twelve platters simultaneously. Logically, this assembly could be treated as twelve separate drives, each storing 10 GB, transferring data at 136 Mbps, and averaging 267 milliseconds for radial access.
The RCA proposal emphasizes high rate serial data recording over rapid random access. The approach to head positioning is severely compromised by the great moving mass contemplated. The multitrack-parallel format requires special laser arrays and lenses, resulting in a high cost per drive. Despite these aspects of the machine, NASA may decide to support the development of the terabit buffer because it is intended to evolve from a land- based system to a 21st Century space-based system. Verifying the performance of the machine on the ground before putting it in space has a great deal of practical value.
Optical Tape
Optical tape should achieve two to three orders of magnitude improvement in volumetric density over optical disk by wrapping a lot of recording surface area around a hub in a long, skinny band. Current optical tape programs concentrate on write-once media to support data archiving as their presumed primary application.
One company presently well into product development is Creo Electronics. They expect to show a working prototype of their 1 TB optical tape drive in 1987. This product uses a mechanical scanner to lay marks across the 1 inch tape, and it transfers data in or out at 24 Mbps. Data is addressed absolutely in 128 kilobyte blocks over the entire reel. The price per drive is anticipated to be $200,000.
100 - 1600 Mbps. The rate depends on how many of the 16 laser arrays are actively recording. The capacity is approximately 2.5 TI3 per 11.5 inch diameter, 7000 foot-long reel of tape with all 16 arrays active.
As the optical tape scanners improve, it should be possible to have optical tape's areal density keep pace with that of optical disk. Without any current market push to develop optical tape systems, however, they may not be available within NASA's timeframe. Some companies are experimenting with flexible optical disk media, and the tape system developers may be able to benefit from this research.
RCA is also proposing a high-performance optical tape with a data rate range of
94

VENDOR ADDRESS LIST
Asaca Corporation, 12509 Beatrice St., Los Angeles, CA 90066, (213-827-7144) (Videocart cassette autochanger)
Bell & Howell and Robert Bosch, P.O. Box 15068, Salt Lake City, Utah, 841 15 (80 1-972-80OO)
Datatape Inc., 7921 Jones Branch Blvd., Suite 275, McLean, VA 22102 (703-790-8930)
Fujitsu Storage Products Division, 3055 Orchard Dr., San Jose, CA 95134-2017 (408-946-8777)
Honeywell Test Instruments Division, P.O. Box 5227, Denver, CO 80217-5227 (303-773-4700)
Kodak Mass Memory Division, 343 State Street, Rochester, NY 14650 (7 16-724-7570)
Odetics, 1515 South Manchester Avenue, Anaheim, CA 92802 (7 14-758-0100) (manufacturer of cassette autochanger)
RCA Communication & Information Systems Division, Camden, NJ 08102 (609-338-3000)
Sony Communication Products Co., 1600 Queen Anne Road, Teaneck, NJ 07666 (201-833-5220)
Sony, Optical Storage Technology, Information Products Division, Sony Corp. of America, Sony Drive, Park Ridge, NJ 07656 (201-930-6025)
95

APPENDIX VI11
INFORMATION SOURCES
Information gathered from previous mass storage studies was augmented by brochures gathered from numerous vendors and contacts throughout the optical disk industry. Most of the information exchange took place at conferences listed below:
4-84
6-84
12-84
5-85
10-85
3-86
4-86
6-86
6-86
10-86
Association for Image and Information Management (AIIM) National Conference, Chicago, IL
International Management Congress (IMC) Forum Update, Chicago, IL
Integrated Automation Management Conference , Alameda, CA
Institute for Graphic Communication (IGC): Document Based Optical Mass Memory Systems, Monterey, CA
IGC: Electronic Imaging Conference, Boston, MA
Rothchild Conference: Optical Storage of Documents and Images, Washington D.C.
Federal Office Systems Exposition, Washington D.C.
Optical Memory Technology Review, National Bureau of Standards, Gaithersburg, MD
Rothchild Conference: Optical Storage for Large Systems, New York, NY
IMC: Infomatics 86, Toronto, Canada
96

APPENDIX IX
BIBLIOGRAPHY
Computer Technology Associates, Inc. (1985). AudioIVideo Data Storage. Briefing Exhibits, Lanham, MD: Author.
Computer Technology Associates, Inc. (1985). Space Station Ground Data Management System: User Data Distribution Architectures. Briefing Exhibits, Lanham, MD: Author.
Computer Technology Associates, Inc. (1985). Space Station Key Data Access Technologies. Executive Summary, Lanham, MD: Author.
Computer Technology Associates, Inc. (1985). Video and Audio Ground Data Management for Space Station. Briefing Exhibits, Lanham, MD: Author.
de Long, Clyde. (1986). Quick Look at High Data Rate Recorder Development (Technical Letter). Washington, D.C.: MITRE Corporation.
Gechman, Marvin. (1985). Alternative Mass Storage Approaches for the Ground Data Management System. San Jose, CA: Lockheed Corporation.
Kalil, F. (1984). Storage Technology State-of-the-Art. Washington, D.C.: NASA Headquarters.
Kalil, F. (1985). Ground Recording System for the Space Station Era Ad Hoc Working Group. Washington, D.C.: NASA Headquarters.
Laub, Leonard. (1986). Mass Data Storage for Telecommunications in the Next Decade (A report to Computer Technology Associates and NASA Goddard Space Flight Center). Los Angeles, CA: Vision Three, Inc.
Mallinson, J.C. (1984). The Next Decade In Magnetic Recording. Redwood City, CA: Ampex Corporation.
McCaleb, Fred. (1986). Data Storage Technology, Greenbelt, MD: Mission Operations and Data Systems Directorate, Goddard Space Flight Center.
Miller, Stephen W. (1985). "The Future of Mass Storage Systems". Computer, July 1985, pp 6-22.
National Aeronautics and Space Administration, (1986). Customer Data and Operations System Presentation to MO&DS Directorate. Greenbelt, MD: Mission Operations and Data Systems Directorate, Goddard Space Flight Center.
National Aeronautics and Space Administration. (1986). Mission Requirements and Network Support Forecast. Greenbelt, MD: Flight Mission Support Office, Goddard Space Flight Center.
National Aeronautics and Space Administration. (1985). OSSA Mission Planfor the IOC Time Frame of the Space Station Complex. Washington, D.C.: Office of Space Science and Applications, NASA Headquarters.
97
National Aeronautics and Space Administration. (1986). Space Stahon Program Definition and Requirements Document (PDRD) (a.k.a. SATS:attached payloads). Houston, TX: Johnson Spaceflight Center.
National Aeronautics and Space Administration. (1986). NASA Data Intelface Facility: Concept Definition. Greenbelt, MD: Mission Operations and Data Systems Directorate, Goddard Space Flight Center.
National Aeronautics and Space Administration. (1984). Requirements for the Space Telescope Data Archive and Distribution Service (STIDADS). Greenbelt, MD: Data Systems Technical Division, Goddard Space Flight Center.
ON. (1985). Earth Observing Systems (Eos) Communications Architecture Study. Rockville, MD: Author.
Petruzelli, J.D. (1984). Wideband Recording. Presentation Exhibits, Griffiss AFB, NY: Rome Air Development Center.
RCA Digital Communications and Recording Systems. (1986). NASA Mass Storage Systems: Digital Data Storage for 1990’s. Camden, NJ: RCA Communication and Information Systems Division.
RCA Government Systems Division. (1984). Preliminary Study for TDRSS BackendlData Capture System for Space Station Era. Camden, NJ: RCA Government Communications Systems.
Sobieski, Stanley. (1986). New Initiative: Optical Disk Data BufSer Development. Greenbelt, MD: Mission Operations and Data Systems Directorate, Goddard Space Flight Center.
Weller, H.W. (1986). Summary of Optical Disk Systems. College Park, MD: Ford Aerospace and Communications Corporation.
Wood, T. (1984). Super High-Bandwidth Recorder-I2(SHBR) As A Mass Storage Device. Redwood City, CA: Ampex Corporation.
98

APPENDIX X
GLOSSARY
ABALATION
the metal film, heated by a laser, rolling back from the center of the light spot, forming a rim around the mark on the media.
The removal of surface material due to heating. In laser disk technology, it refers to
ACCESS TIME
quoted access times usually refer only to the positioning time for the radial actuator, neglecting servo settling and rotational latency; average access times for disk drives usually describe a radial motion of one-third of full stroke.
The time to get to a specific location in or on a memory device. For disk drives,
BER (Bit Error Rate)
erroneous bit is found. The BER is expressed as the number of binary digits (bits) encountered before one
BUBBLE
The presence of bubbles reflects light away from the reading optics, thereby creating a contrast to the bubble-free areas of the media surface.
In optical memory, bubbles are formed by a laser recording on an optical medium.
CARTRIDGE
medium is kept for protection. Some disks are read through a window in the cartridge while others are removed from the protective casing for access.
CAV (Constant Angular Velocity)
taken to scan a track is the same at dl radii.
In optical technology, an enclosure, generally of plastic, in which an optical
Describes a disk that spins at the same rotational speed and ensures that the time
CLV (Constant Linear Velocity)
the relative velocity between the light spot and the track is maintained at a constant velocity, resulting in a constant linear density.
Describes a disk that turns more slowly when outer radii are being scanned so that
CURIE POINT RECORDING
magneto-optic disk, writing is accomplished by bringing the temperature up to the Curie point so that a weak magnetic field can magnetize the heated spot.
DP (DATA PROTECTION)
is certain those data have been properly processed by the recipient of the data; protects against loss of data due to failures within the recipient's system.
DD (DEFERRED DELIVERY)
able to accept it.
Above the Curie temperature, material loses any magnetization it had. On a
Temporary storage at the output of a Data Transport System Processing node until it
Temporary storage of data until the recipient (outside the Data Transport System) is
99

ERASABLE MEDIA The following are several substrates being manufactured to support erasable media.
DYE-POLYMER - A medium created by carrying a highly-absorbent dye in
MAGNETO-OPTIC - A medium where information is stored by local a polymer binder.
magnetization, using a focused light beam to produce local heating and consequent reduction of coercivity so that a moderately strong, poorly localized magnetic field can flip the state of a high coercivity.
amorphous and microcrystalline states. PHASE CHANGE - An optical storage medium that can be flipped between
ERROR CORRECTION CODE
and corrected. A scheme for digital representation of information, that allows errors to be detected
GIGA A prefix meaning one billion and abbreviated "G".
INTERLEAVING
error burst to be turned, after de-interleaving, into many short bursts which can be individually corrected by the error correcting code in use.
The process of breaking up and reordering blocks of data, which causes a long
LASER A device that emits a highly-coherent beam of light. The following are several
different types used in optical recording. GALLIUM ARSENIDE - The material (aluminum gallium arsenide) of
which most infrared-emitting continuous wave injection lasers are made. GAS LASER - A laser in which the light beam is generated within a gas-
filled tube. GAUSSIAN BEAM - A light beam whose intensity cross section is
commonly produced by lasers operating in the lowest order transverse mode; therefore, all light coming from the laser goes in the same direction.
INJECTION LASER - A laser in which the light is generated within a layer in a heterostructure formed of a crystalline semiconductor such as gallium arsenide.
LATENCY
rotate to the desired location along a circular track. A component of the delay in access to data which comes from waiting for a disk to
LOP (LINE OUTAGE PROTECTION)
protects against the loss of data due to failure of non-availability of the output. Temporary storage of data at the output of one node of the Data Transport System;
MCLV (Modified Constant Linear Velocity)
spins at a constant angular velocity, but that velocity is different for each band. Describes a disk where the tracks are divided into bands. Within a band, the disk
MEGA A prefx meaning one million and abbreviated "M".
100

OPTICAL DISK
of the following layers.
intended to keep dust and scratches out of contact with, and out of focus relative to, the actual information-bearing (sensitive) layer.
is recorded.
sensitive layer which fills in and covers up imperfections in the substrate.
layers.
A dense medium used for the storage of digital data. The disk is normally made up
OVERCOAT - A transparent protective layer for optical recording media,
SENSITIVE LAYER - The layer (single or multiple) on which information
SUBBING LAYER - A layer above the substrate and directly below the
SUBSTRATE - The glass, plastic, or aluminum disk that supports all other
OVERHEAD The amount of storage or other resources used to accomplish some task.
PACKET
instrument or subsystem. A self-contained, self-identifying, self-describing logical unit of data from a single
PIT
optical media. Broadly used to refer to data-carrying rimless troughs formed by laser recording on
PRE-GROOVING The practice of molding, casting, or otherwise producing a physical guidance
pattern which can be found on the optical medium by the tracking servo of the drive.
RC (RATE CONVERSION)
transmission bandwidth between terrestrial nodes of the Data Transport System, or between the Data Transport System and the recipient; change may be either up or down in bit rate.
Buffering of data while changing the data stream bit rate to efficiently use data
REED-SOLOMON CODE
and are especially powerful when data are organized into long bursts and errors come in bursts .
An algebraic block code used for error correction. The codes employ redundancy
SERVOMECHANISM A combination of detector and actuator that continuously follows some variable
quantity. For optical recording, a FOCUS SERVO and TRACKING SERVO keep the reading andor writing light spot focused on the sensitive layer in spite of imperfections or externally imposed shock and vibration.
SOP (SYSTEM OUTAGE PROTECTION) Temporary storage of the incoming data stream until it is certain the data have been
properly processed and stored at the output of that part of the system; protects against loss of data due to failure within the system node.
TERA A prefut meaning one trillion and abbreviated "T".
101

TRANSFER RATE
writing rate of a storage peripheral.
WS (WORKING STORAGE)
supports the processing functions of that node of the Data Transport System.
The rate at which data are transferred to or from a device, primarily the reading or
Buffering for data manipulation within the process that the system is performing;
102

Report Documentation Page
1. Report No.
NASA TM-87826
2. Government Accession No. 3. Recipient's Catalog No.
4. Title and Subtitle
Mass Storage Systems for Data Transport in the Early Space Station Era 1992-1998
Richard Carper, John Dalton, Mike Healey, Linda Kempster, John Martin, Fred McCaleb, Stanley Sobieski, and John Sos, Editors
5. Report Date
July 1987 6. Performing Organization Code
87B0343 t 10. Work Unit No.
7. Author(s)
9. Performing Organization Name and Address 11. Contract or Grant No.
Goddard Space Flight Center Greenbelt, Maryland 20771
13. Type of Report and Period Covered
502 8. Performing Organization Report No.
12. Sponsoring Agency Name and Address
National Aeronautics and Space Administration Washington, D.C. 20546-0001
17. Key Words (Suggested by Author(s))
Capture, Process, Store High Rate, High Volume Space Data, Magnetic Data Storage, Optical Data Storage
Technical Memorandum 14. Sponsoring Agency Code c
18. Distribution Statement
Unclassified - Unlimited
15. Supplementary Notes
Richard Carper, John Dalton, Fred McCaleb, Stanley Sobieski, and John S o s :
Mike Healey, Linda Kempster, and John Martin: Computer Technology Associates, Goddard Space Flight Center, Greenbelt, Maryland.
Inc., Lanham, Maryland. 16. Abstract NASA's Space Station Program will provide a vehicle to deploy an unprecedented number of data producing experiments and operational devices. rates are expected to be in the 500 megabit per second range and the daily data volume could reach 2.4 terabytes. Such startling requirements inspired an internal NASA study to determine if economically viable data storage solutions are likely tc be available to support the Ground Data Transport segment of the NASA data system. To derive the requirements for data storage subsystems, several alternative data transport architectures were identified with different degrees of decentralization. Data storage operations at each subsystem were categorized based on access time ant retrieval functions, and reduced to the following types of subsystems: First out (FIFO) storage, fast random access storage, and slow access with staging. The study showed that industry-funded magnetic and optical storage technology has a reasonable probability of meeting these requirements. There are, however, system-level issues that need to be addressed in the near term.
Peak down-link data
First in
19. Security Classif. (of this report) 20. Security Classif. (of this page) 21. No. of pages 22. Price
Unclassified Unclassified 114 A06