r 2015 - bank of the republic · jel codes: j24, m53 ... de analizar múltiples resultados. se...
TRANSCRIPT

- Bogotá - Colombia - Bogotá - Colombia - Bogotá - Colombia - Bogotá - Colombia - Bogotá - Colombia - Bogotá - Colombia - Bogotá - Colombia - Bogotá - Colombia - B

1
Long Term Impacts of Vouchers for Vocational Training:
Experimental Evidence for Colombia
Orazio Attanasio, University College London, NBER and IFS
Arlen Guarín
, Carlos Medina
, Banco de la República de Colombia
Costas Meghir, Yale University, NBER and IFS
Abstract
We use experimental data of a training program in 2005 in Colombia. We find that even up to
ten years ahead, the JeA program had a positive and significant effect on the probability to work
in the formal sector, and to work for a large firm. Applicants in the treatment group also
contributed more months to social security during the analyzed period. Earnings of treated
applicants were 11.8% higher in the whole sample, and they made larger contributions to social
security. We also present non parametric bounds showing that for some percentiles of the sample
of women, there are positive and nearly significant effects of the program. Thus, the effects of
the program would have been capitalized both in increases in the likelihood of being formal, and
increases in productivity. We also present evidence that the estimated program effects on the
likelihood of working for the formal sector, the likelihood of working for a large firm, and the
earnings in the formal sector, are not an artifact of analyzing multiple outcomes.
We also find those in the treatment group have 0.315 more years of education, and have a
probability of graduating from high school 10 percent higher than the control group. We find no
significant effect on the probability of attending college or any school program, nor on fertility
decisions, marital status or some dimensions of assortative mating. Among applicants matching
to the census of the poorest population, we find that beneficiaries are more likely to participate in
the labor market, to be employed, and to be enrolled in a private health insurance at the time of
the survey.
Finally, we find that the benefits of the JeA program are higher than it costs, leading to an
internal rate of return of at least 22.1 percent.
Keywords: Vocational Training, Human Capital, Skills, Occupational Choice, Labor Productivity
JEL Codes: J24, M53
We thank Ana María Iregui and participants at an internal seminar at Banco de la República and at the CEDE of
Universidad de los Andes for their comments. We are grateful to the Ministry of Health and Social Protection and
the Department of National Planning for providing us access to the PILA and SISBEN datasets. All errors are the
responsibility of the authors. The series Borradores de Economía is published by the Economic Studies Department
at the Banco de la República (Central Bank of Colombia). The works published are provisional, and their authors
are fully responsible for the opinions expressed in them, as well as for possible mistakes. The contents of the works
published do not compromise Banco de la República or its Board of Directors. [email protected]

2
Resumen
Con base en datos experimentales de un programa de formación para el trabajo implementado en
2005 Colombia, se encuentra que aun diez años después, el programa JeA tuvo un efecto positivo
y significativo en la probabilidad de trabajar en el sector formal, y de trabajar en una firma
grande. Los aplicantes en el grupo beneficiarios también contribuyeron más meses a seguridad
social durante el período analizado. Los ingresos de los aplicantes beneficiarios fueron 11.8%
más altos en el total de la muestra, e hicieron mayores contribuciones a la seguridad social.
También presentamos cotas no paramétricas que muestran que para algunos percentiles de la
muestra de mujeres, hay efectos positivos y cercanamente significativos del programa, por lo
cual, los efectos del programa habrían sido capitalizados tanto en incrementos en la probabilidad
de ser formales, como en la productividad. También se presenta evidencia de que los efectos
estimados del programa en la probabilidad de trabajar para el sector formal, en la probabilidad de
trabajar para una firma grande, y en los mayores ingresos en el sector formal, no son un artefacto
de analizar múltiples resultados.
Se encuentra que los beneficiarios tienen 0.315 años adicionales de educación, y tienen una
probabilidad de graduarse de bachillerato 10% mayor. No se encuentran efectos significativos en
la probabilidad de asistir a la universidad o cualquier otro programa académico, en decisiones de
fertilidad, estado civil u otras dimensiones de segregación marital. Entre los aplicantes que se
observaron en el censo de la población más pobre, se encuentra que los beneficiarios tienen
mayor probabilidad de participar en el mercado laboral, de estar ocupados, y de tener seguro de
salud privado al momento de la encuesta.
Finalmente, se encuentra que los beneficios del programa JeA son mayores que sus costos,
implicando tasas de retorno de al menos un 22.1%.
Keywords: Formación para el Trabajo, Capital Humano, Habilidades, Elección Ocupacional,
Productividad Laboral

3
I. Introduction
Developing skills and participating in the formal labor market is a central policy concern in
developing countries. The issue acquires particular importance once we recognize that a well-
functioning economy, which can attract investment and promote growth, requires individuals
with sufficient levels of skills and work readiness (see, for instance, OECD 2012). Moreover,
unskilled youth have particularly low labor market attachment and are vulnerable to poverty.
According to Székely (2011), 20% of Colombian youths 15-18 years old were not in education,
employment, or training by 2005, while Guarín and Medina (2015) show that in Colombian
cities like Medellín, the same figure is as high as 44% for youth 16-20 years old. With these
central issues in mind, on the wake of the worst recession after WWII Colombia experienced in
1999-2000, the Colombian Government implemented an important youth training program called
Jovenes en Acción (JeA).1 The program, which was operated between 2001 and 2005, combined
classroom training with an internship and was offered to individuals who were pre-screened by
private-sector training institutions, of which some were for-profit and some were not. These
institutions designed the content of the courses and were responsible to find firms operating in
the formal labor market that would accept the youths for the required internships; this
mechanism provided clear incentives, as payments were linked to the completion of both the
class room and the internship component.
To evaluate the program, a randomized trial was carried out and analyzed by Attanasio, Kugler
and Meghir (2011) (AKM henceforth). They found that the program benefited mainly women,
1 See Gaviria and Núñez (2002), Barrera and Corchuelo (2003), Medina and Núñez (2005), Sarmiento and others
(2007), and Fedesarrollo (2009, 2010), among others for issues relating to training in Colombia.

4
increasing their employment, their participation in the formal sector and their earnings. Under
the most conservative scenario the internal rate of return of the program for women was
calculated to be 21.6%. For men however, there was no discernible effect other than a shift to the
formal sector. This in itself is important however, because the formal sector offers numerous
benefits and because firms that operate in the formal sector tend to be higher productivity (see
Meghir, Narita and Robin, 2015), which might lead possibly to further training and professional
opportunities.
Informality is a major issue around the world and in Latin America in particular. Perry et al.
(2007) present figures showing that the share of the labor force not covered by a pension scheme
in Latin American countries is about four times as large as it is in advanced countries, while the
share of labor force self-employed is about twice as large. According to Medina et al. (2013),
Cárdenas and Mejía (2007), and López (2010), since the mid 1980s informality (based on the
ILO definition) has fluctuated in Colombia from 53% to 60% and is particularly high among the
young (see Saavedra and Medina, 2013), at a time which is important for laying the foundations
of a productive career.
Ten years have passed since the JeA experiment and the program itself ended. An important
question, given the promising short run impacts found by AKM, is whether the program had any
long-term effects. This question is particularly salient given the effects the program had on
participation in the formal labor market: given the importance of informality in Latin America
and in Colombia specifically, programs that can reduce informality in the long run are likely to
be very valuable from both a growth and a welfare point of view.
5
Although there are other experimental studies evaluating job training programs implemented in
Latin American countries, there is no one to our knowledge that had assessed their effect beyond
a three years horizon.2 We are in the extremely fortunate position to be able to link into the
experimental sample administrative information on whether workers are employed in the formal
sector and if so what their earnings are. This allows us to evaluate whether the program achieved
one of its longer-term aims, namely to increase attachment to the formal sector. Moreover, the
earnings data, albeit censored, allows us to estimate bounds on the treatment effects on
underlying productivity. Finally, additional administrative data allow us to look at a variety of
additional outcomes.
Thus, in this paper, we merge the experimental data of the Colombia’s JeA evaluation collected
in 2005 with social and labor market administrative records collected between July 2008 and
June 2014, which we describe in detail below. We then use the resulting data to assess its impact
on a variety of outcomes.
We find that the JeA program had a positive and significant effect on the probability to work in
the formal sector, and those applicants in the treatment group contributed more months to social
security during the analyzed period. Beneficiaries of the JeA program were also more likely to
work for a large firm. Formal earnings of treated applicants were 11.8 percent higher in the
whole sample, and they made larger contributions to social security. We also find that for the
whole sample of applicants, those in the treatment group have 0.24 more years of education. The
long run effects of the program are stronger for women than for men, consistently with the
evidence in AKM about the short run impacts. For women we also find some suggestive
2 Card, Ibarrarán, Regalia, Rosas and Soares (2011), and Ibarrarán, Ripani, Taboada, Villa and Garcia (2014)
provide experimental results for the short-term, while Alzúa, Cruces and Lopez (2014) present experimental
evidence three years after graduation.
6
evidence that the program improved their productivity (in addition to improve their chances of
working in the formal sector).
The rest of the paper is organized as follow: we first provide, in Section 2, information on the
background of the JeA program. In Section 3, we describe the data used in the paper and provide
some descriptive statistics of it. In Section 4, we present the estimated effects of the program
and, in Section 5, its cost-benefit analysis. Section 6 concludes.
II. The Intervention
The Jóvenes en Acción program was a training program for urban young unemployed that was
implemented in the early 2000s in Colombia as part of a wider strategy called Red de Apoyo
Social, aimed at providing a safety net for the poorest sectors of the population after the crisis
that hit the country in the late 1990s.3 It was initially funded with a USD$70 million loan from
the Inter-American Development Bank, and was targeted to unemployed youths 18 to 25, who
belonged to the poorest population classified in the two lowest levels of a score, called SISBEN,
which is used in Colombia to target all welfare programs.4 As DNP (2000b) highlights,
unemployment rates of youths between 18 and 25 years of age of the ten largest metropolitan
areas, living in the first and second lowest deciles of the income distribution, at the turn of the
3 The Colombian crisis of the late 1990s is described by Medina, Núñez and Tamayo (2013). The first program of
the Red de Apoyo Social was created by means of the CONPES policy document Number 3075 of March 15, 2000
(DNP, 2000a), and was aimed at generating employment for the poorest, while program Jóvenes en Acción was
simultaneously created with program Familias en Acción, by the CONPES policy document 3081 of June 28, 2000
(DNP, 2000b), with a budget for both programs of USD$426 million, USD$320 million of which were to be
provided by The World Bank and the Inter-American Development Bank. 4 SISBEN is the acronym in Spanish for Information System for Beneficiaries Selection, and it is composed of six
levels built with the quality of life SISBEN score, used in Colombia to target public subsidies. To apply to the
program, individuals were additionally required to have a valid id, and if the applicant a mother of children under
seven years of age, she must present an official document to prove her maternity. Applicants that had previously
taken training courses at SENA or any training institution were also eligible to Jóvenes en Acción.

7
Millennium were 62.8 percent and 52.8 percent respectively. The program was implemented in
the seven main cities of the country: Bogotá, Medellín, Cali, Barranquilla, Bucaramanga,
Manizales and Cartagena. According to FIP and DNP (2001), by 2001, the program planned to
enroll about 100,000 students in these cities between 2001 and 2003. According to AKM,
however, it actually began to enroll them in 2002, and, by 2005, it had enrolled 80,000 students.
The program’s goal, which we describe in more detail in Appendix A, was to increase the
employability of the young beneficiaries and provide them support for building was what called
by the program, their project of life. More specifically, its objectives were: (i) to develop the
youths’ occupational skills, so to increase their likelihood to become employed and improve
their performance at work, (ii) to promote the private supply of relevant job training programs
for poor youths, and (iii) to put productive poor youths and training institutions closer to firms.
Jóvenes en Acción essentially consisted of training courses designed and provided by private
institutions, known as ECAP, after the Spanish acronym for training institutions. Each course
was expected to train about 30 unemployed youths selected amongst eligible applicants. The
course had to have three main components: (i) classroom training; (ii) on-the-job training; and
(iii) the youth’s project of life (FIP and DNP, 2001). The aim was to develop occupational skills,
social skills and broader career objectives. The program also included a small stipend of about
USD$2.20 per day for trainees without children under seven years of age, and to about
USD$3.00 per day for women with children under seven.5
5 Transfers to women with children under seven year of age were not contingent on the number of their children
under seven, and were paid weekly per day in which beneficiaries had attended their courses during their classes,
and biweekly, after they completed their training, during their training period. See FIP and DNP (2001), DNP (2008,
2002), and AKM. Beneficiaries were also covered by personal accidents insurance, and by civil liability insurance,
8
The training institutions designing and offering the courses could be for profit or not for profit
and they had to satisfy certain criteria, listed in Appendix A. AKM report that 43 percent of
them were for profit. In 2005 there were 114 ECAPs offering 441 courses to 26,615 trainees,
with their instructors teaching about 7.6 hours per day.6
A unique feature of the program was that the ECAPs were paid a relatively small amount if a
youth completed only the classroom component. A substantial fraction of the overall payment,
instead, was conditioned on the student completing the apprenticeship with the participating
firms in a timely fashion (see FIP and DNP, 2001). Moreover, the ECAPs would receive
additional payments if the beneficiaries were hired by the firms that trained them. To the
government, the total cost of the program is the sum of the cost of the course, plus the
maintenance transfers disbursed during the six months (See FIP and DNP, 2001). This incentive
scheme, which stressed the need to identify skills for which a demand was present in the labor
market, was one of the most innovative characteristics of the program, especially compared to
the training programs operated since 1957 at SENA, Colombia’s government institution
providing training, which often did not relate to the demand for specific skills in the labor market
(See Saavedra and Medina, 2013).
III. Data
In our empirical analysis, we use two types of data. First, we use the evaluation survey of
program applicants that was collected at the start of the program and used in AKM to estimate
the short run impact of the program. Second, we use two administrative data sources to follow
but not health insurance, as most of the beneficiaries were likely to be covered by the non-contributory health
system that insures the poorest Colombians. 6 40 percent of the beneficiaries were from Bogotá, 18 percent from Medellín, 16 percent from Cali, 11 percent from
Barranquilla, 7 percent from Bucaramanga, 5 percent from Cartagena, and 2 percent from Manizales. The total
amount invested was US$22 Millions (See Ministerio de la Protección Social, 2005)

9
the respondents in the evaluation survey several years after the completion of the intervention. In
this section, we describe the two data sources and discuss the selection criteria used in the
analysis, starting with the evaluation data.
1. Experimental Data of the Jóvenes en Acción Program
For the purpose of evaluating the intervention, the ECAPs selected up to 50% more applicants
than the places available for the courses. 30 of the selected applicant were then randomly
assigned to the course while the others were used as a control group. The evaluation survey is
described in AKM and is a random sample of the universe of applicants and consists of about
50% treated and 50% control subjects although this was not achieved for each training center.7
Here we stress that this design maintains a selection role for the ECAPS, which can be important
for the impact of the intervention. It should be remembered that the ECAPS had strong
incentives to select individuals that would complete the entire program.
Appendix Table A1 shows descriptive information and results on the balance of the evaluation
sample. Both for women and men, the sample is well balanced. Nonetheless, when we pool
students of both genders, we find that beneficiaries are slightly more educated.
2. Administrative Records
The data sources that we use in this paper to estimate the program’s long run effects, consist of
two different administrative datasets, known as SISPRO dataset and the SISBEN survey, (from
their Spanish acronyms).
(i) The SISPRO Data
7 The sample was stratified to insure it would be balanced by city and gender.

10
The SISPRO contains information from the Unified Register of Contributions, known as PILA
from its Spanish acronym, which is the national information system used by firms to file the
mandatory contributions to health, pensions and disability insurance they pay for their
employees. Firms must report each month the amount contributed for each one of their
employees. The Ministry of Social Protection has universal coverage of all the monthly
contributions in the country since July 2008. Thus, this data provides us with the possibility of
following up the individuals in the evaluation survey and constructing a longitudinal database
with monthly frequency from July 2008 to December 2014. Since the PILA contains the monthly
census of all contributions in the country, individuals in the evaluation database that were not
found in the PILA register are assumed to be out of work, unemployed, or working in the
informal labor market. The structure of the data also allows us to observe individuals entering
and exiting the formal labor market.
(ii) The SISBEN survey
Virtually all social programs in Colombia are targeted through the so called SISBEN index. This
index is constructed as a weighted average of a number of household level variables.8
Information on the variables used to construct the score is collected with a survey, which is
routinely administered to about the 60% poorest segment of the population in Colombia.9 In our
analysis, we use the surveys collected between mid 2009 and early 2015. We then match, using a
variety of methods and information sources, the data from the evaluation survey with the
SISBEN data. We therefore construct a long-run follow up with the matched applicants’, and
8 The formula to compute the index and the variables that enter the index are not publicly known. Moreover, the
components of the SISBEN and their weight are periodically updated. 9 The SISBEN survey began to be collected in 1992 by all Colombian municipalities, and after its collection,
whenever any household wanted its information to be updated, it had to require it to its municipal Department of
Planning, in charge of the local SISBEN administration. The SISBEN was updated for first time for the whole
country between 2003 and 2005, and the second time it was updated was between 2009 and 2010. Since the first
time it was updated, its records became much more reliable and its score much less manipulable (See Bottia et al.,
2012).
11
their households’ characteristics, at the date their surveys were collected. Since this survey is a
census of the poorest population, applicants that were not matched to it are assumed to belong to
the upper income levels of the population.
An individual can, in principle, be in both administrative data and many indeed are. However, it
is clear that the two data sources are somewhat complementary: somebody with a formal
employment and high earnings will be found in the PILA data sets but will be, ceteris paribus
less likely to be in the SISBEN data base. Conversely, people in the SISBEN data, as they are
being targeted by welfare programs are less likely to be in PILA.
IV. Descriptive Statistics
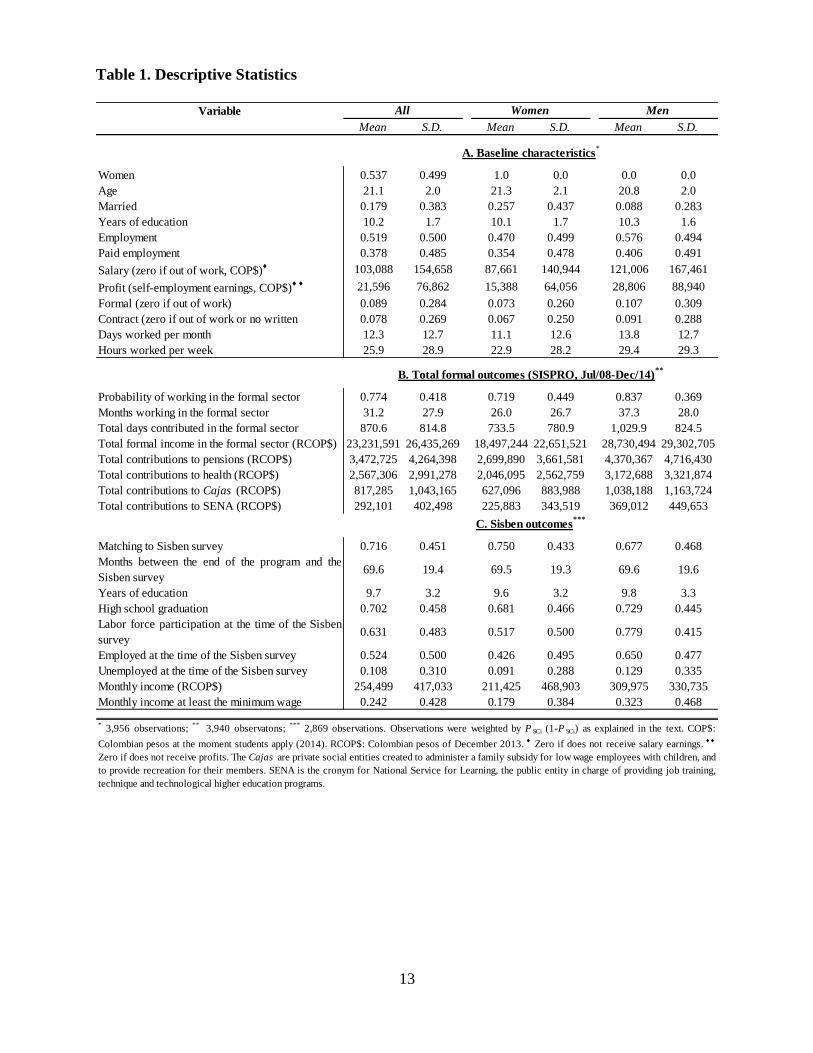
In Table 1, we present some descriptive statistics based on the baseline information of applicants,
and also based on their follow-up information from SISPRO and SISBEN. Our baseline
information includes 3,956 applicants, 54% of whom are women. In Panel A, we notice that at
the moment they applied to the program, they were on average 21 years old, 18 percent were
married with an average of 10 years of education. 52% of applicants were employed and 38% of
the total were wage earners. Their average earnings were COP$103 thousands (at December
2013 pesos). Only 8.9% worked in the formal sector, 7.8% had a written contract, and they
worked an average of 12.3 days per month and 25.9 hours per week. Men were less likely to be
married, and more likely to be working, and in particular, to be wage earners, with higher
earnings, more formal and more likely with a written contract. Finally, they worked more days
per month and hours per week (Table 1, Panel A).
In panel B of table 1, we notice that 77% of applicants matched at least one month with the PILA
between July of 2008 and December of 2014, and on average, they matched 31.2 months in that

12
period and contributed for an average of 870 days. In the whole period, they earned an average
of COP$23 millions of December 2013 in the formal sector (COP$297 thousand per month), and
contributed an average of COP$3.5, COP$2.6, COP$0.8 and COP$0.3 millions to pensions,
health, Cajas and SENA respectively. Men were more likely to be formal and to earn and
contribute more.
Finally, in panel C, we report outcomes that were extracted from the SISBEN database. About
71% of the applicants were matched in to SISBEN, with the matching rate being higher for
males than females. Those observed in SISBEN, had, when they were surveyed, an average
education slightly lower than the average of all applicants at baseline, which is natural since the
SISBEN survey only includes the poorest. Of those observed in the SISBEN survey, 70% had
graduated from high school, 63.1% participated in the labor market, 52.4% were employed and
10.8% unemployed. Their monthly income was COP$254 thousand, and the income of 24% of
them was above the minimum wage (Table 1, Panel C).
We now present more information on outcomes related to formal employment, in particular, the
average earnings of the applicants, the average earnings of applicants matched to PILA, and the
likelihood of matching to the PILA survey. Individuals are assumed to be matched to the PILA if
they hold a formal job. Figure 1 shows the average (formal) earnings of applicants, including
both treated and control samples. Earnings of individual not matched in the PILA (and hence, out
of work, unemployed, or informal) are set to zero. The sample is weighted, by PSCi (1-PSCi),
where PSCi is the population probability, taken from administrative records, that an applicant i,
that applied to course C, at site S, be offered a place. These weights will be used throughout,
including in the estimation of the effects.
13
Table 1. Descriptive Statistics
Variable
Mean S.D. Mean S.D. Mean S.D.
Women 0.537 0.499 1.0 0.0 0.0 0.0
Age 21.1 2.0 21.3 2.1 20.8 2.0
Married 0.179 0.383 0.257 0.437 0.088 0.283
Years of education 10.2 1.7 10.1 1.7 10.3 1.6
Employment 0.519 0.500 0.470 0.499 0.576 0.494
Paid employment 0.378 0.485 0.354 0.478 0.406 0.491
Salary (zero if out of work, COP$) 103,088 154,658 87,661 140,944 121,006 167,461
Profit (self-employment earnings, COP$) 21,596 76,862 15,388 64,056 28,806 88,940
Formal (zero if out of work) 0.089 0.284 0.073 0.260 0.107 0.309
Contract (zero if out of work or no written 0.078 0.269 0.067 0.250 0.091 0.288
Days worked per month 12.3 12.7 11.1 12.6 13.8 12.7
Hours worked per week 25.9 28.9 22.9 28.2 29.4 29.3
Probability of working in the formal sector 0.774 0.418 0.719 0.449 0.837 0.369
Months working in the formal sector 31.2 27.9 26.0 26.7 37.3 28.0
Total days contributed in the formal sector 870.6 814.8 733.5 780.9 1,029.9 824.5
Total formal income in the formal sector (RCOP$) 23,231,591 26,435,269 18,497,244 22,651,521 28,730,494 29,302,705
Total contributions to pensions (RCOP$) 3,472,725 4,264,398 2,699,890 3,661,581 4,370,367 4,716,430
Total contributions to health (RCOP$) 2,567,306 2,991,278 2,046,095 2,562,759 3,172,688 3,321,874
Total contributions to Cajas (RCOP$) 817,285 1,043,165 627,096 883,988 1,038,188 1,163,724
Total contributions to SENA (RCOP$) 292,101 402,498 225,883 343,519 369,012 449,653
Matching to Sisben survey 0.716 0.451 0.750 0.433 0.677 0.468
Months between the end of the program and the
Sisben survey69.6 19.4 69.5 19.3 69.6 19.6
Years of education 9.7 3.2 9.6 3.2 9.8 3.3
High school graduation 0.702 0.458 0.681 0.466 0.729 0.445
Labor force participation at the time of the Sisben
survey0.631 0.483 0.517 0.500 0.779 0.415
Employed at the time of the Sisben survey 0.524 0.500 0.426 0.495 0.650 0.477
Unemployed at the time of the Sisben survey 0.108 0.310 0.091 0.288 0.129 0.335
Monthly income (RCOP$) 254,499 417,033 211,425 468,903 309,975 330,735
Monthly income at least the minimum wage 0.242 0.428 0.179 0.384 0.323 0.468
*3,956 observations;
**3,940 observatons;
***2,869 observations. Observations were weighted by P SCi (1-P SCi) as explained in the text. COP$:
Colombian pesos at the moment students apply (2014). RCOP$: Colombian pesos of December 2013.
Zero if does not receive salary earnings.
Zero if does not receive profits. The Cajas are private social entities created to administer a family subsidy for low wage employees with children, and
to provide recreation for their members. SENA is the cronym for National Service for Learning, the public entity in charge of providing job training,
technique and technological higher education programs.
All Women Men
A. Baseline characteristics*
B. Total formal outcomes (SISPRO, Jul/08-Dec/14)**
C. Sisben outcomes***

14
Figure 1. Evolution of Formal Average Earnings of Applicants (COP$ of December 2013)
There is a clear gap in favor of beneficiaries of the JeA program, which is slightly increasing
over time. The figure gives a first view of the estimates we present later of the effect the program
on formal earnings, arising partly from a higher likelihood of being a formal employee, that is, of
matching to PILA, and, possibly, from increases in productivity.
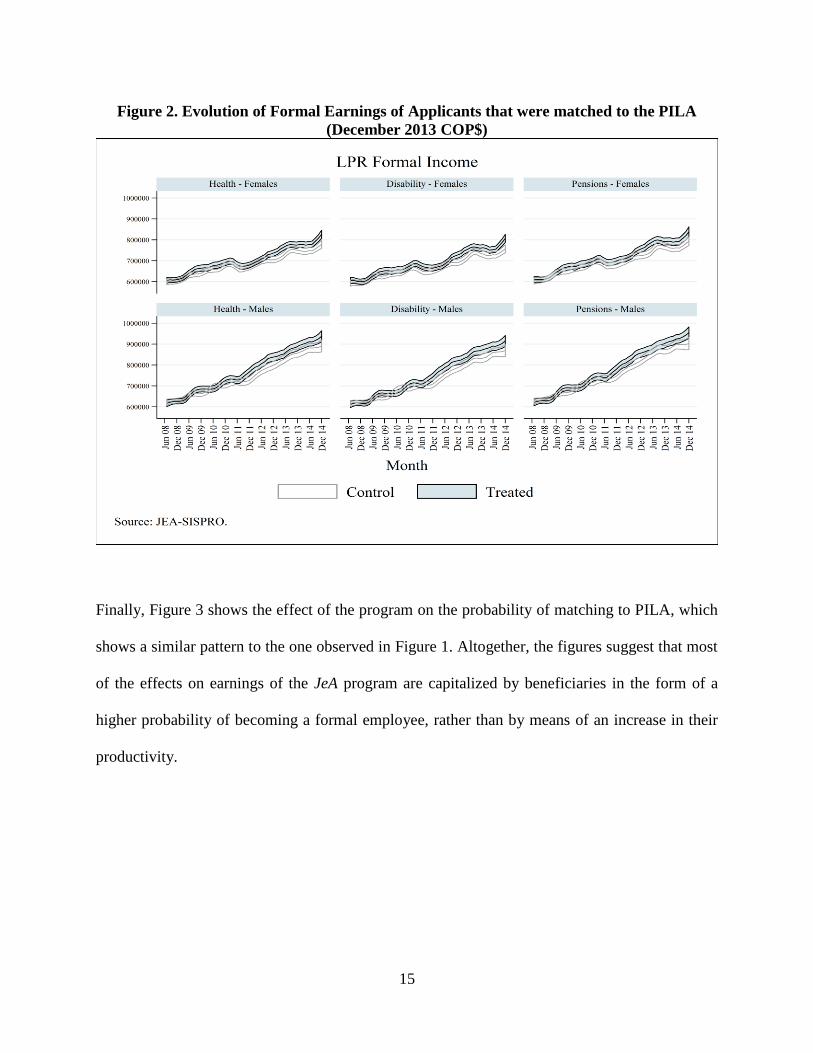
Figure 2 shows the mean earnings only of applicants who were matched to PILA. Until 2011, we
do not observe significant differences between individuals who were treated and those who were
not. However, starting in 2011, we find an increasing gap in favor of the beneficiaries. The gap is
larger for men than for women. It should be remembered, however, that this is a self-selected
sample, an issue we will address later by the estimating non-parametric bounds of the effect on
productivity.
15
Figure 2. Evolution of Formal Earnings of Applicants that were matched to the PILA
(December 2013 COP$)
Finally, Figure 3 shows the effect of the program on the probability of matching to PILA, which
shows a similar pattern to the one observed in Figure 1. Altogether, the figures suggest that most
of the effects on earnings of the JeA program are capitalized by beneficiaries in the form of a
higher probability of becoming a formal employee, rather than by means of an increase in their
productivity.

16
Figure 3. Match rates to formal employment data by Treatment Status, Gender and Type
of Contribution
V. Program Effects
To estimate the long term impacts of the program we use the following model:
𝑌𝑖𝑗 = 𝛼𝐷𝑖 + 𝑋𝑖𝛽 + 𝑆𝐶𝑗 + 𝜀𝑖𝑗
Where Yij is the outcome of person i in site and course j, Di is the treatment indicator, and it is
equal to 0 if the applicant was randomly denied a place in course j, or 1 if he was randomly
offered a place in it, Xi is a vector of characteristics of the applicants at baseline, such as gender,
initial employment and experience, education and so on. Considering that randomization in the
experimental design took place at the course level, we include SCj, a site-by-course fixed effect,
which allows us to interpret our parameter of interest () as the weighted average of the program
1

17
effects across all courses. Finally, ij is a random error term. In all of our estimates below we
compute robust standard errors, clustered at the site-by-course level, and whenever we use panel
data, we cluster them at the applicant level.
We present estimates of the “intent to treat” effect, that is, the mean effect of the offer of
treatment. However, since compliance among applicants is 97%, our estimates should not differ
substantially from the average treatment effect in this population. We weigh each applicant by
PSCi (1-PSCi), where PSCi is the population probability, taken from administrative records, that an
applicant i, that applied to course C, at site S, be offered a place. While we report the results
obtained using this weighting scheme, we also compute unweighted estimates, which are
available on request. Weighing does not make any substantial difference to our results or
conclusions because the probabilities do not vary much.
1. Effects of the Jóvenes en Acción on participation in the Formal Labor Market
We use the PILA data for each month between July 2008 and December 2014 to track
individuals in the formal market. When an individual is not recorded in the dataset they are either
unemployed or working in the informal market. We focus on three outcome variables: whether
an individual is working in a formal job in any one month, whether they are working in a large
formal firm, and their earnings. These are set to zero for those who do not appear in the
administrative data set (PILA).
The results for the whole sample are reported in Table 2, while results by gender are shown in
Table 3. We include training center fixed effects and we report stepdown p-values computed
using the procedure derived by Romano-Wolf (2005) adjusting for multiple testing in groups. So
in Table 2 the p-values are adjusted for testing the three outcomes in that Table. In Table 3 the R-
W p-values account for testing of all 6 outcomes reported there. All levels of significance (and
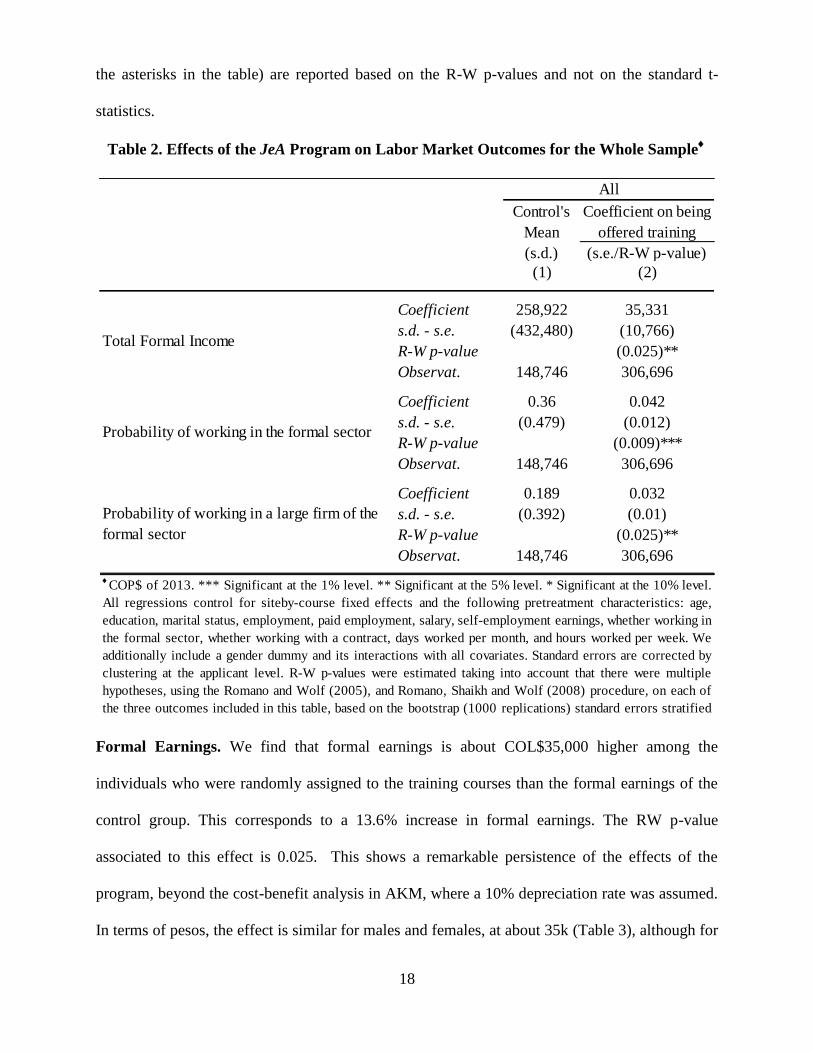
18
the asterisks in the table) are reported based on the R-W p-values and not on the standard t-
statistics.
Table 2. Effects of the JeA Program on Labor Market Outcomes for the Whole Sample
Formal Earnings. We find that formal earnings is about COL$35,000 higher among the
individuals who were randomly assigned to the training courses than the formal earnings of the
control group. This corresponds to a 13.6% increase in formal earnings. The RW p-value
associated to this effect is 0.025. This shows a remarkable persistence of the effects of the
program, beyond the cost-benefit analysis in AKM, where a 10% depreciation rate was assumed.
In terms of pesos, the effect is similar for males and females, at about 35k (Table 3), although for
Control's
Mean
(s.d.) (s.e./R-W p-value)
(1) (2)
Coefficient 258,922 35,331
s.d. - s.e. (432,480) (10,766)
R-W p-value (0.025)**
Observat. 148,746 306,696
Coefficient 0.36 0.042
s.d. - s.e. (0.479) (0.012)
R-W p-value (0.009)***
Observat. 148,746 306,696
Coefficient 0.189 0.032
s.d. - s.e. (0.392) (0.01)
R-W p-value (0.025)**
Observat. 148,746 306,696
All
Coefficient on being
offered training
Total Formal Income
Probability of working in the formal sector
Probability of working in a large firm of the
formal sector
COP$ of 2013. *** Significant at the 1% level. ** Significant at the 5% level. * Significant at the 10% level.
All regressions control for siteby-course fixed effects and the following pretreatment characteristics: age,
education, marital status, employment, paid employment, salary, self-employment earnings, whether working in
the formal sector, whether working with a contract, days worked per month, and hours worked per week. We
additionally include a gender dummy and its interactions with all covariates. Standard errors are corrected by
clustering at the applicant level. R-W p-values were estimated taking into account that there were multiple
hypotheses, using the Romano and Wolf (2005), and Romano, Shaikh and Wolf (2008) procedure, on each of
the three outcomes included in this table, based on the bootstrap (1000 replications) standard errors stratified
by city, gender and treatment status.

19
women it represents a higher percentage increase: female earnings in the control group are
COL$200,000, while those for males are COL$327,000. Thus the respective percentage
increases are 17.5% for females and 10.7% for males. Once we control for multiple testing the
female effect is significant at the 6.5% level, while the male effect is insignificant.
Table 3. Effects of the JeA Program on Labor Market Outcomes by gender
Probability of working in the formal sector. The probability of working in the formal sector is
increased by 4 percentage points as a result of the program (Table 2). This effect is significant at
the 1% level (RW p-value=0.009). When we look at the same impacts separately for women and
men, in Table 3, we find that for females the probability of being a formal employee increases by
5 percentage points (RW p-value of 0.052). For males, the point estimate is similar and the t-
statistic is 1.89, but the adjusted RW p-value is 0.25 and is therefore not statistically different
from zero. Participants in JeA worked on average 3.33 months longer in the formal sector, quite
precisely estimated with a standard error of 1.19.
Control's
Mean
Control's
Mean
(s.d.) (s.e./R-W p-value) (s.d.) (s.e./R-W p-value)
(3) (4) (5) (6)
Coefficient 200,103 35,495 327,673 35,126
s.d. - s.e. (366,562) (12,421) (489,732) (18,597)
R-W p-value (0.065)* (0.251)
Observat. 81,588 165,750 67,158 140,946
Coefficient 0.29 0.047 0.43 0.036
s.d. - s.e. (0.453) (0.015) (0.496) (0.019)
R-W p-value (0.052)* (0.251)
Observat. 81,588 165,750 67,158 140,946
Coefficient 0.146 0.038 0.240 0.025
s.d. - s.e. (0.353) (0.013) (0.427) (0.016)
R-W p-value (0.065)* (0.251)
Observat. 81,588 165,750 67,158 140,946
Women Men
Coefficient on being
offered training
Coefficient on being
offered training
Total Formal Income
Probability of working in the
formal sector
Probability of working in a
large firm of the formal sector
COP$ of 2013. *** Significant at the 1% level. ** Significant at the 5% level. * Significant at the 10% level. All regressions control for
siteby-course fixed effects and the following pretreatment characteristics: age, education, marital status, employment, paid employment,
salary, self-employment earnings, whether working in the formal sector, whether working with a contract, days worked per month, and hours
worked per week. Standard errors are corrected by clustering at the applicant level. R-W p-values were estimated taking into account that there
were multiple hypotheses, using the Romano and Wolf (2005), and Romano, Shaikh and Wolf (2008) procedure, on each of the three
outcomes included in this table, based on the bootstrap (1000 replications) standard errors stratified by city, gender and treatment status.
20
Probability of working in a large firm. Finally, we consider the probability of working for a
large firm as an additional outcome variable. Large firms often offer better career prospects
through promotion opportunities and may be a proxy for higher quality jobs. We find that the
proportion of those working in large formal firms increases by 3.2pp (p-value 0.025). Breaking
down the impact by gender we find a 3.8pp effect for women (p-value 0.065). For men the effect
is 2.5pp and totally insignificant.
Bounding the effects on productivity.
The estimated effects point to a strong and persistent effect of the program on working in the
formal sector, which is reflected both in the participation and in the earnings measures. However
this does not necessarily imply that the trainees have become more productive. This is not an
issue that can be assessed experimentally simply because we only observe earnings conditional
on working in the formal sector; in other words comparing the formal earnings of those who
went through the program to the formal earnings of those who did not, as pointed out in AKM is
subject to selection bias, because of the effect of the program on formality. Trainees who select
into the formal sector are likely to be very different from controls who select into the same
sector.
One possibility is to bound the effects on earnings, following an approach similar to that
used by AKM. To sharpen the bounds they relied only on a monotonicity assumption, i.e. that
participating in training could not discourage work. However they had to deal with a selection
problem less severe than what we are facing, as missing earnings were confined to non-
workers. In contrast to this study, they also observed the earnings of those with jobs in the
informal sector. Therefore, to get tighter bounds in our context, we impose stronger restrictions
as in Angrist et al. (2006).

21
In particular, we assume that the training program could not lead to a decline in earnings,
Y1it ≥ Y0it, where the first subscript is 1 for those allocated to treatment and 0 for those not.10
This
is not an innocuous assumption because it states that lost experience from participating in
training has either negligible effects or is dominated by the effects of training. Now, define 𝑇1𝑖𝑡
to be a dummy for whether an individual i works in the formal sector when allocated to training.
Similarly 𝑇0𝑖𝑡 is a dummy for whether an individual i works in the formal sector when not
allocated to training. We assume that T1it ≥ T0it, which is the monotonicity assumption of Imbens
and Angrist (1995).11
Define 𝑞0(𝜃) to be the -quantile of the distribution of Y0, and 𝑞1(𝜃) the -
quantile of the distribution of Y1. Finally, T is an indicator of formality and D is the
randomization defining allocation to treatment. Angrist et al. (2006) show that
𝐸[𝑌𝑇|𝐷 = 1, 𝑌𝑇 > 𝑞1(𝜃)] − 𝐸[𝑌𝑇|𝐷 = 0, 𝑌𝑇 > 𝑞0(𝜃)]
≥ 𝐸[𝑌1 − 𝑌0|𝑌0 > 𝑞0(𝜃), 𝑇0 = 1]
≥ 𝐸[𝑌𝑇|𝐷 = 1, 𝑌𝑇 > 𝑞0(𝜃)] − 𝐸[𝑌𝑇|𝐷 = 0, 𝑌𝑇 > 𝑞0(𝜃)] = ∆𝐿𝐵 (2)
We can further tighten the bounds by exploiting the fact that in our experimental setting the
vector (Y1it, Y0it, T1it, T0it, Xit-1) is independent of Di, where Xit-1 is the vector of baseline
characteristics as in Lee (2009). In this case, we can derive bounds conditional on X and then
average over X’s distribution among formal workers who were not treated. Thus the lower bound
takes the form
∆𝑋𝐿𝐵= 𝐸[𝑌𝑇|𝐷 = 1, 𝑌𝑇 > 𝑞0(𝜃), 𝑋] − 𝐸[𝑌𝑇|𝐷 = 0, 𝑌𝑇 > 𝑞0(𝜃), 𝑋]
∆0𝐿𝐵= ∫ ∆𝑋
𝐿𝐵𝑑𝐹(𝑋) (3)
where F(X) is the distribution function of X conditional on D = 0 and T = 1. The upper bound is
computed in a similar fashion.
10
This is the monotone treatment response assumption used by Manski (1997). 11
See Angrist et al. (2006) and Lee (2009).

22
In Panel A of Table 4, we show the estimated bounds by demographic group obtained using
equation (2), based on the applicants’ formal earnings, as reported when they contributed to
health, disability, pensions, from which we take the maximum. We estimate lower and upper
bounds at different percentile levels. First, including all control individuals matched to PILA
(65th
percentile), and then, including only those on top of the 75th
, and 85th
income percentiles.
The table shows that, for women, the upper bound of the impact of the JeA program on earnings
is positive, significantly different from zero and large. It is particularly high at the 65th
and the
85th
percentiles: the shape of the impacts is U-shaped, with a minimum at the 75th
percentile,
both in absolute and percentage terms. For men, the story is very different: the upper bounds on
the impacts are much smaller and never significantly different from zero. For the overall sample,
the impact reflects the pattern of the impact of women, except that the minimum is at the 75th
percentile. As for the lower bounds, they are never significantly different from zero. In the case
of men, all point estimates of the lower bound are actually negative.
In panel B, we also condition on the specific ECAP individuals attended, and compute bounds
based on equation (3). In this case, we still find positive and significant upper bounds, although
their point estimates are smaller than those in Panel A. The lower bounds are higher than those in
Panel A, and at the 65th
percentile the lower bound is significantly positive for women at the
10%. For men, again, we find much smaller impacts and, again, all lower bounds are negative
and, in the case of the 85th
percentile, significantly different from zero. The point estimate of the
upper bounds in the 85th
percentile is negative (although not significantly so).12
12
We do observe that the JeA effect increases with time: the estimates in table 4 imply a relative increase in earnings
for women of 9.2%, but when we get the lower bound estimate using only 2014 data, its relative effect becomes
14.1%.

23
We summarize the evidence from the bounds by saying that there is some suggestive evidence
that the program might have improved the productivity in the formal sector of the female youths
who received it. The increase in formal earnings for men, instead, seems to be completely driven
by the increasing formality, rather than by an increase in productivity.
Table 4. Effects of the JeA Program on Monthly Earnings
:
Non Parametric Bounds
2. Effects on Contributions to Social Security
Finally, we present evidence on the contribution records of these formal workers as an additional
way of corroborating the increase in participation in formal sector. Thus, Table 5 presents the
estimated effects of the JeA program on the amounts of taxes and contributions paid by
Quantile
Control's
Mean
Above
Quantile
Lower
Bound Upper Bound
Control's
Mean
Above
Quantile
Lower
Bound Upper Bound
Control's
Mean
Above
Quantile
Lower
Bound
Upper
Bound
(s.d.) (s.e.) (s.e.) (s.d.) (s.e.) (s.e.) (s.d.) (s.e.) (s.e.)
(1) (4) (5) (4) (5) (6) (7) (8) (9)
Coefficient 870,516 -692 83,944 805,764 40,608 145,958 898,712 -10,660 25,771
s.d./s.e. (509,807) (21,082) (24,391)*** (403,162) (43,540) (55,876)*** (502,691) (22,776) (23,965)
Observat. 22,287 49,499 43,490 2,446 5,375 4,473 20,811 46,149 43,420
Coefficient 905,076 -11,685 20,812 804,914 5,916 67,707 970,221 -21,075 29,936
s.d./s.e. (468,833) (17,567) (18,093) (389,965) (22,924) (25,130)*** (530,596) (25,233) (25803)
Observat. 32,682 73,250 69,512 13,928 31,223 27,609 17,419 38,696 35,714
Coefficient 1,006,858 -8,757 52,317 885,504 -8,110 68,455 1,140,161 -52,418 2,873
s.d./s.e. (514,132) (20,239) (20,894)** (398,431) (26,577) (26,297)*** (607,104) (31,281)* (32,095)
Observat. 23,704 52,695 47,285 12,206 27,719 24,523 11,048 24,374 22,225
Coefficient 864,401 10,184 47,412 812,833 63,050 69,147 913,270 -16,068 11,100
s.d./s.e. (454,766) (22,951) (24,155)** (331,536) (38,271)* (38,508)* (478,105) (26,060) (27,247)
Observat. 16,158 34,760 32,950 2,878 6,125 6,016 10,972 23,681 22,900
Coefficient 885,538 -9,641 38,047 822,628 17,512 50,590 978,988 -35,994 18,732
s.d./s.e. (460,342) (17,561) (18,335)** (377,964) (25,079) (25,705)** (527,786) (25,260) (25,232)
Observat. 24,811 55,562 50,909 6,970 15,050 13,828 12,205 27,326 25,029
Coefficient 981,321 -21,118 44,992 868,164 19,585 76,748 1,082,236 -68,002 -212
s.d./s.e. (516,827) (18,588) (20,195)** (384,323) (24,020) (25,373)*** (604,895) (28,112)** (29,301)
Observat. 21,676 50,089 43,161 9,293 20,511 17,952 10,355 24,663 20,620
85th perc.
B. Bounds conditioning on type of course
65th perc.
75th perc.
85th perc.
COP$ of 2013.
***Significant at the 1% level.
**Significant at the 5% level.
*Significant at the 10% level. All regressions control for siteby-course fixed effects and the
following pretreatment characteristics: age, education, marital status, employment, paid employment, salary, self-employment earnings, whether working in the formal
sector, whether working with a contract, days worked per month, and hours worked per week. Standard errors are corrected by clustering at the applicant level.
All Women Men
A. Bounds
65th perc.
75th perc.

24
applicants. As with the results reported in Table 4, we find significant and positive effects on
contributions, overall and for women, but not for men. Finally, in Table B.1 in the appendix we
document the effect of the program on a number of other outcomes, including education. We
find no significant effect on these.
Table 5. Effects of the JeA Program on Contributions to Social Security
Control's
Mean
Control's
Mean
Control's
Mean
(s.d.) (s.e./p-value) (s.d.) (s.e./p-value) (s.d.) (s.e./p-value)
(1) (2) (3) (4) (5) (6)
Coefficient 38,525 5,491 29,086 5,198 49,558 5,857
s.d. - s.e. (69,149) (1,982) (59,921) (2,251) (77,124) (3,463)
R-W p-value (0.021)** (0.097)* (0.163)
Observat. 148,746 306,696 81,588 165,750 67,158 140,946
Coefficient 28,684 3,780 22,159 3,761 36,311 3,805
s.d. - s.e. (49,695) (1,402) (42,196) (1,573) (56,277) (2,469)
R-W p-value (0.024)** (0.080)* (0.190)
Observat. 148,746 306,696 81,588 165,750 67,158 140,946
Coefficient 9,019 1,270 6,696 1,223 11,735 1,330
s.d. - s.e. (17,043) (483) (14,261) (541) (19,456) (851)
R-W p-value (0.024)** (0.097)* (0.190)
Observat. 148,746 306,696 81,588 165,750 67,158 140,946
Coefficient 3,212 437 2,379 439 4,184 434
s.d. - s.e. (7,090) (191) (5,871) (215) (8,184) (336)
R-W p-value (0.026)** (0.129) (0.212)
Observat. 148,746 306,696 81,588 165,750 67,158 140,946
* $COP of 2013. All regressions control for siteby-course fixed effects. The regressions in columns 2, 4 and 6 control for the
following pretreatment characteristics: age, education, marital status, employment, paid employment, salary, self-employment
earnings, whether working in the formal sector, whether working with a contract, days worked per month, and hours worked per
week. Column 2 additionally includes gender and its interactions with all covariates. R-W p-values were estimated taking into
account that there were multiple hypotheses, using the Romano and Wolf (2005), and Romano, Shaikh and Wolf (2008), on each of
the three outcomes included in this table, based on the bootstrap standard errors stratified by city, gender and treatment status. The
Cajas are private social entities created to administer a family subsidy for low wage employees with children, and to provide
recreation for their members. SENA is the acronym for National Service for Learning, the public entity in charge of providing job
training, technique and technological higher education programs.
Panel A Panel B
Pensions
Health
Cajas
SENA
All Women Men
Coefficient on
being offered
training
Coefficient on
being offered
training
Coefficient on
being offered
training

25
VI. Cost-Benefit
Table 6 presents a simple cost-benefit analysis focusing on women where we find significant
effects of the program. We find that the average formal earnings of control applicant women is
COP$200,100, or US$100.1 Our estimated premium for women, attributable to the JeA program
is 17.7 percent in our case. Allowing for a program cost of COP$1.6 millions that includes the
direct costs of operating the program, a maintenance allowance, and the loss of tenure, the
internal rate of return is 29.5 percent, similar to the one calculated by AKM.
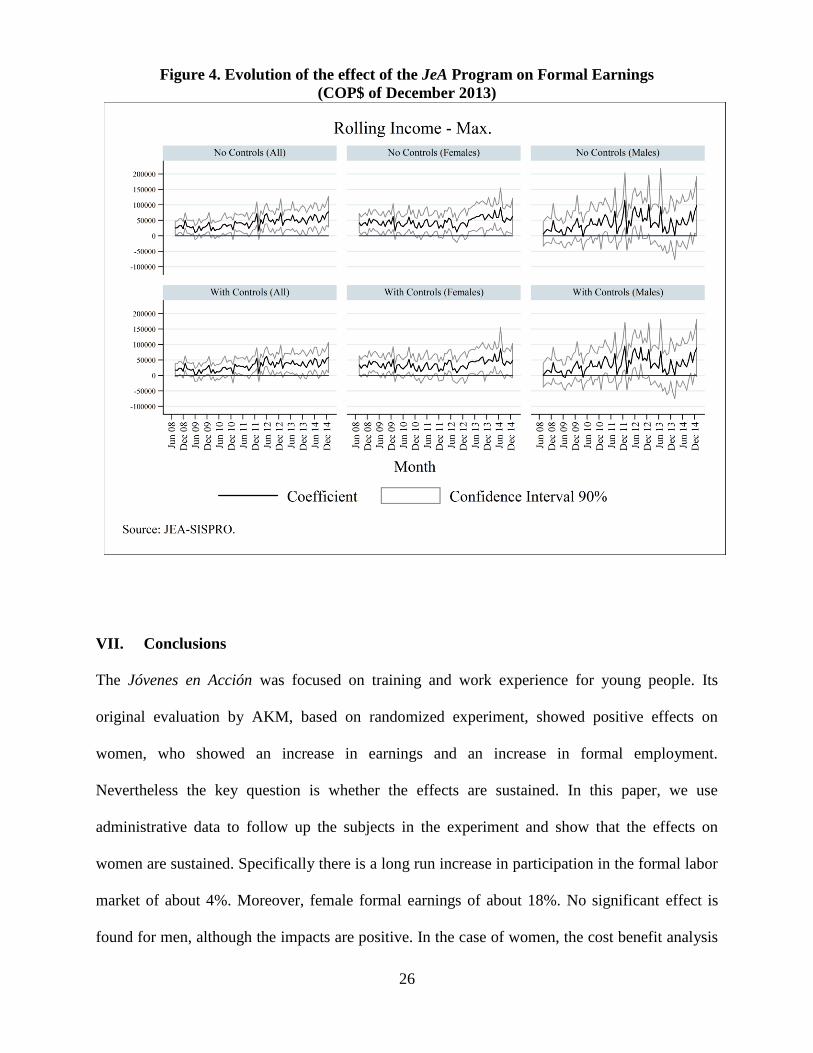
As seen in Figure 4, the gains are stable over time: the effects of this program seem to be
permanent. However, even if we allow for a 6% depreciation annually we still obtain an internal
rate of return of 20%
Table 6. Cost-Benefit Analysis
All Women All Women
Benefits
Control's Monthly Earnings 258.9 200.1 129.5 100.1
Monthly Gains in Earnings 35.3**
35.5**
17.7 17.7
Relative Gain vs Control 13.6% 17.7% 13.6% 17.7%
Net Present Value of Benefits
Monthly Rate 0.5% 6,421 6,451 3,211 3,226
Monthly Decrease in Gains 0.5% 3,512 3,529 1,756 1,764
Costs*
1,624 1,624 812 812
Direct Cost 1,500 1,500 750 750
Loss of Tenure 124 124 62 62
Benefit-Cost
Monthly Rate 0.5% 4,797 4,827 2,399 2,414
Monthly Decrease in Gains 0.5% 1,888 1,905 944 952
Annual IRR
Monthly Rate 0.5% 29.5% 29.6% 29.5% 29.6%
Monthly Decrease in Gains 0.5% 22.1% 22.2% 22.1% 22.2%* Source: Attanasio et al. (2011). ** Significant at the 5% level.
COP$000 of 2013 US$
26
Figure 4. Evolution of the effect of the JeA Program on Formal Earnings
(COP$ of December 2013)
VII. Conclusions
The Jóvenes en Acción was focused on training and work experience for young people. Its
original evaluation by AKM, based on randomized experiment, showed positive effects on
women, who showed an increase in earnings and an increase in formal employment.
Nevertheless the key question is whether the effects are sustained. In this paper, we use
administrative data to follow up the subjects in the experiment and show that the effects on
women are sustained. Specifically there is a long run increase in participation in the formal labor
market of about 4%. Moreover, female formal earnings of about 18%. No significant effect is
found for men, although the impacts are positive. In the case of women, the cost benefit analysis

27
with no skill depreciation attributes a 29% internal rate of return. We also bounded the effect on
productivity and at least for women these do not include zero indicating an improvement there as
well (although the lower bound is not significantly different from zero).
By all accounts this has been a successful program with sustained effects. Given the importance
for growth of reducing the size of the informal sector and moving people into the formal one the
lessons learnt from this program should be replicated. Evidence on the relative importance of the
classroom component vis a vis the work experience one would be very useful. Our belief is that
the combination of the two contributed to the success of the program.

28
References
Alzúa, María Laura; Cruces, Guillermo and López, Carolina (2014) “Youth Training Programs
Beyond Employment. Experimental Evidence from Argentina” CEDLAS Working Paper
No. 177, Universidad Nacional de la Plata, January.
Angrist, Joshua; Bettinger, Eric and Kremer, Michael (2006) “Long-Term Educational
Consequences of Secondary School Vouchers: Evidence from Administrative Records in
Colombia” American Economic Review, American Economic Association, vol. 96(3),
pages 847-862, June.
Attanasio, Orazio; Kugler, Adriana and Meghir, Costas (2011) “Subsidizing Vocational Training
for Disadvantaged Youth in Colombia: Evidence from a Randomized Trial” American
Economic Journal: Applied Economics 3, (July): 188–220.
Barrera, Felipe and Corchuelo, Alejandra (2003) “SENA’s returns: A re-evaluation” mimeo.
Black, Sandra E.; Devereux, Paul J. and Salvanes, Kjell G. (2008) “Staying in the Classroom and
Out of the Maternity Ward? The Effect of Compulsory Schooling Laws on Teenage
Births” The Economic Journal, 118 (July), pages 1025–1054.
Bottia, Martha; Cardona-Sosa, Lina and Medina, Carlos (2012) “El SISBEN como Mecanismo
de Focalización Individual del Régimen Subsidiado en Salud en Colombia: Ventajas y
Limitaciones” Revista de Economía del Rosario, Universidad del Rosario.
Breierova, Lucia and Duflo, Esther (2004) “The Impact of Education on Fertility and Child
Mortality: Do Fathers Matter Less than Mothers?” NBER Working Paper No. 10513.
Card, David, Pablo Ibarrarán, Ferdinando Regalia, David Rosas, and Yuri Soares (2011) “The
Labor Market Impacts of Youth Training in the Dominican Republic” Journal of Labor
Economics, 29 ( 2 ) : 267–300.

29
Card, David, and Daniel Sullivan (1988) “Measuring the Effect of Subsidized Training Programs
on Movements In and Out of Employment” Econometrica, 56 ( 3 ) : 497–530.
Cárdenas, Mauricio and Mejía, Carolina (2007) “Informalidad en Colombia: Nueva Evidencia”
Documentos de Trabajo, Fedesarrollo.
Chicoine, Luke E. (2012) “Education and Fertility: Evidence from a Policy Change in Kenya”
IZA Discussion Paper No. 6778, August.
Couch, Kenneth A. (1992) “New Evidence on the Long-Term Effects of Employment Training
Programs” Journal of Labor Economics, Vol. 10, No. 4 (Oct., 1992), pp. 380-388
Cygan-Rehm, Kamila and Maeder, Miriam (2013) “The Effects of Education on Fertility
Evidence from a Compulsory Schooling Reform” Labour Economics, Vol.: 25, Issue: C,
pages 35-48.
Departamento Nacional de Planeación (2008) “Subprograma Jóvenes en Acción: Consultoría
para la Evaluación de Impacto del Subprograma Jóvenes en Acción” Serie Evaluación
de Políticas Públicas No. 9.
Departamento Nacional de Planeación (2002) “Consultoría para la evaluación de impacto del
Subprograma Jóvenes en Acción – Capacitación Laboral de Jóvenes Desempleados de
Bajos Recursos de la Red de Apoyo Social, 1280-OCCO”, Call for Proposals.
Departamento Nacional de Planeación (2000a) “Plan Colombia, Red de Apoyo Social:
Programa Manos a la Obra. Componentes: Proyectos Comunitarios y Vías Para la Paz”
CONPES Policy Document No. 3075, March 15.
Departamento Nacional de Planeación (2000b) “Plan Colombia, Red de Apoyo Social:
Programas de Subsidios Condicionados y Capacitación Laboral de Jóvenes
Desempleados de Bajos Recursos” CONPES Policy Document No. 3081, June 28.

30
Duflo, Esther; Dupas, Pascaline and Kremer, Michael (2012) “Education, HIV and Early
Fertility: Experimental Evidence from Kenya” Unpublished manuscript, Stanford
University.
Fedesarrollo (2009) “Evaluación de impacto de tres programas y línea de base de un programa
del Servicio Nacional de Aprendizaje” Informe de Evaluación.
Fedesarrollo (2010) “Evaluación del impacto del programa jóvenes rurales emprendedores del
Servicio Nacional de Aprendizaje” Informe de Evaluación.
Fondo de Inversión para la Paz, FIP, and Departamento Nacional de Planeación, DNP (2001)
“Red de Apoyo Social, Subprograma Jóvenes en Acción”, Operative Manual, August.
Gaviria, Alejandro and Nuñez, Jairo (2002) “Evaluating the Impact of SENA on Earnings and
Employment” Archivos de Economía - Departamento Nacional de Planeación. 33.
General Accounting Office (1996) “Job Training Partnership Act: Long-term Earnings and
Employment Outcomes” Washington, DC: General Accounting Office.
Grönqvist, Hans and Hall, Caroline (2013) Education Policy and Early Fertility: Lessons from an
Expansion of Upper Secondary Schooling” Economics of Education Review, Vol. 37,
Issue: C, pages: 13-33.
Guarín, Arlen and Medina, Carlos (2015) “Jóvenes que ni Estudian ni Trabajan, y Jóvenes que
Delinquen: el Caso de Medellín” Revista Observar No. 31, Comfama, January.
Hotz, V. Joseph; Imbens, Guido W. and Klerman, Jacob A. (2006) “Evaluating the Differential
Effects of Alternative Welfare-to-Work Training Components: A Re-Analysis of the
California GAIN Program” Journal of Labor Economics 24, no. 3:521–66.
Ibarrarán, P.; Ripani, L.; Taboada, B.; Villa, J. and Garcia, B. (2014) “Life Skills, Employability
and Training for Disadvantaged Youth: Evidence from a Randomized Evaluation
Design” IZA Journal of Labor and Development 3 (10).
31
Komura, Mizuki (2013) “Fertility and Endogenous Gender Bargaining Power” Journal of
Population Economics, Vol. 26, Issue (Month): 3 (July), pages: 943-961.
Lee, David (2009) “Training, Wages, and Sample Selection: Estimating Sharp Bounds on
Treatment Effects” Review of Economic Studies 76(3), 1071-1102.
López, Hugo (2010) “El Mercado Laboral Colombiano: Tendencias de Largo Plazo y
Sugerencias de Política” Borradores de Economía No. 606.
Medina, Carlos and Núñez, Jairo (2005) “The Impact of Public and Private Job Training in
Colombia” Banco Interamericano de Desarrollo (BID). No. 189.
Medina, Carlos; Núñez, Jairo and Tamayo, Jorge (2013) “The Unemployment Subsidy Program
in Colombia: An Assessment” Borradores de Economía 750, Banco de la Republica.
Meghir, C. R. Narita and J.M. Robin, 2015 “Wages and Informality in Developing Countries”,
American Economic Review, April
Ministerio de la Protección Social (2005) “Informe de Actividades 2004-2005 al Congreso de la
República” July.
OECD (2012) “Education at a Glance 2012: Highlights” OECD Publishing.
http://dx.doi.org/10.1787/eag_highlights-2012-en
Perry, Guillermo; Maloney, William; Arias, Omar; Fajnzylber, Pablo; Mason, Andrew and
Saavedra-Chanduvi, Jaime (2007) “Informality Exit and Exclusion” The World Bank.
Romano, J.P. & Wolf, M. (2005) “Stepwise Multiple Testing as Formalized Data Snooping”
Econometrica 73, 1237–1282.
Romano, J.P.; Shaikh, A.M. & Wolf, M. (2008) “Formalized Data Snooping Based On
Generalized Error Rates” Econometric Theory, 24, 404-447.
Saavedra, Juan E. and Medina, Carlos (2013) “Formación para el Trabajo en Colombia” En: A.
Montenegro and M. Meléndez (editors) Equidad y Movilidad Social: Diagnósticos y

32
Propuestas para la Transformación de la Sociedad Colombiana. Uniandes Editorial. In
Press.
Sarmiento, Alfredo; González, Jorge; Álvarez, Sandra; Mercado, Darwin; Alonso, Carlos and
Plazas, Elsa (2007) “Evaluación del Impacto del SENA en el Capital Social” Informe de
Evaluación.
Schochet, Peter, Sheena McConnell, and John Burghardt. 2003. National Job Corps Study:
Findings using administrative earnings records data. Washington, DC: Mathematica.
Székely, Miguel (2011) “Jóvenes que ni Estudian ni Trabajan: un Riesgo para la Cohesión Social
en América Latina” mimeo, June.
Varanasi, Nalina (2009) “Intrahousehold Bargaining and Fertility” mimeo, March.
Appendix A. Jovenes en Acción
Institutions interested in offering the program could be national or international, formally
established, having as one of its social goals the provision of job training programs, with the
required infrastructure, technique expertise, experience, and economic solvency that could allow
it to provide a high quality program, and appropriately manage the public economic resources of
the program. Institutions could be private, public or mixed, and among the public they could be
different to the SENA, provided that their public resources were not used to provide the Jóvenes
en Acción program, so that they had no advantage with respect to their private competitors.
The ECAPs did not receive any payment if a student dropped out before completing at least 20
of the coursework (although the students could be replaced by other), they received 30% of the
fee if the student completed less than 80 percent of the coursework, 40% if the student finished
the coursework but did not complete the ‘on-the-job’ training component, 45% if the student
started the on the job training with a delay but did not fully finish it, 50% if the student started on

33
time (within 5 working days) as a trainee but did not fully finish the course, between 80 and 90%
if the student is started with a delay fully finish it, and 100% if the student started as a trainee on
time and completed the course fully.
Moreover, the ECAPs would receive additional payments if the beneficiaries were hired by the
firms that trained them: in this case, and provided their employment was in a field related to the
classes they received, on a contract of at least six months, the ECAP would receive the stipend
not cashed by the beneficiaries.

34
Table A1. Personal Characteristics and Treatment Status
Control
mean
Treatment-
control
difference
(p-value)
Control
mean
Treatment-
control
difference
(p-value)
Control
mean
Treatment-
control
difference
(p-value)
Employoment 0.513 0.008 0.459 0.015 0.564 0.016
(>0.5) (>0.5) (>0.5)
Paid Employment 0.362 0.022 0.341 0.019 0.378 0.038
(>0.5) (>0.5) (>0.5)
Contract 0.079 -0.001 0.056 0.015 0.100 -0.012
(>0.5) (>0.5) (>0.5)
Formal 0.078 0.014 0.054 0.026 0.108 -0.001
(>0.5) (>0.5) (>0.5)
Wage and salary earnings 104,215 -1532 86,376 1749 123,202 -2982
(>0.5) (>0.5) (>0.5)
Self-employment earnings 23,011 -1924 12,920 3359 34,688 -7985
(>0.5) (>0.5) (>0.5)
Tenure 3.34 0.679 2.71 1.189 3.39 1.034
(>0.5) (>0.5) (>0.5)
Days workep per month 12.32 0.006 10.83 0.311 13.76 0.057
(>0.5) (>0.5) (>0.5)
Hours worked per month 25.35 0.788 21.82 1.498 28.61 1.106
(>0.5) (>0.5) (>0.5)
Education 9.99 0.257 9.92 0.226 10.08 0.29
(0.005)*** (0,356) (>0.5)
Age 21.28 -0.254 21.51 -0.286 20.90 -0.083
(0,127) (0,490) (0,166)
Married 0.197 -0.024 0.267 -0.013 0.116 -0.038
(>0.5) (>0.5) (>0.5)
Observations
Notes: The table reports the difference in each variable between the treatment and control groups,
controlling for site-by-course fixed effects. The p-values were estimated taking into account that there
were multiple hypotheses, using the Romano and Wolf (2005), and Romano, Shaikh and Wolf (2008),
on each of the 12 baseline variables, based on the bootstrap standard errors stratified by city, gender and
treatment status.
*** Significant at the 1 percent level. ** Significant at the 5 percent level. * Significant at the 10
percent level.
3,940 2,128 1,812
All Women Men

35
Appendix 1
Program details
The first component was expected to last between 280 and 350 hours and was focused both on
the development of basic abilities for becoming employed (independent of the specific field), and
the development of occupation specific skills. The former objective was pursued by providing
the youths with basic social abilities and developing their soft skills: teaching them to be
proactive, resourceful and open to feedback; improving their verbal and written communication
skills; their analytic, deductive and daily work problems solving skills; by encouraging them to
assimilate and understand their job’s organizational environment; by developing teamwork
skills, etc. The latter goal was pursued by providing training in the specific field of their interest,
including the expertise in the use of equipment and tools, didactic material, and the procurement
of services; products or services production, etc.
The second component consisted of three months of on-the-job training, and was about 480
hours long, conditional on the labor schedule of the specific firms in which the youths were
trained. The training institutions, ECAPs, when designing the training courses, they had to
identify participating employers that would take the young trainees on an apprenticeship basis.
The ECAPS also wrote a training plan to facilitate the completion in the firm of the training
process that began in their classrooms. It also includes an assessment of the youths’ performance
in terms of their achievements, agreed upon by the firm, the ECAP, and the youth.
The third component, the project of life, pursued the youths’ comprehensive human
development, orienting them towards a positive visualization of their abilities, personal and work
perspectives; providing them with tools for decision-making. It encouraged the youths to reflect

36
on their work, their imminent insertion in the labor force, and its meaning with respect to their
future labor market perspectives, helping them build their labor identity. This component took
place all through the six months of the intervention (See FIP and DNP, 2001, Annex 7).

37
Appendix B Further Outcomes
Table B1. Effects of the JeA Program on Education and Labor Outcomes
(SISBEN
dataset)
Control's
Mean
Control's
Mean
Control's
Mean
(s.d.) (s.e./R-W p-value) (s.d.) (s.e./R-W p-value) (s.d.) (s.e./R-W p-value)
(1) (2) (3) (4) (5) (6)
Coefficient 0.731 -0.019 0.775 -0.023 0.679 -0.014
s.d. - s.e. (0.444) (0.019) (0.418) (0.024) (0.467) (0.03)
Observat. 1,907 3,932 1,046 2,125 861 1,807
Coefficient 9.192 0.328 9.169 0.290 9.224 0.383
s.d. - s.e. (3.539) (0.143) (3.53) (0.184) (3.555) (0.227)
R-W p-value (0.152) (>0.3) (>0.3)
Observat. 1,401 2,863 828 1,649 573 1,214
Coefficient 0.638 0.036 0.643 0.018 0.632 0.062
s.d. - s.e. (0.481) (0.02) (0.479) (0.027) (0.483) (0.029)
R-W p-value (0.256) (>0.3) (>0.3)
Observat. 1,401 2,863 828 1,649 573 1,214
Coefficient 0.574 0.047 0.458 0.031 0.728 0.071
s.d. - s.e. (0.495) (0.023) (0.499) (0.03) (0.446) (0.033)
R-W p-value (0.230) (>0.3) (>0.3)
Observat. 1,401 2,863 828 1,649 573 1,214
Coefficient 0.466 0.048 0.360 0.038 0.607 0.062
s.d. - s.e. (0.499) (0.023) (0.48) (0.029) (0.489) (0.037)
R-W p-value (0.230) (>0.3) (>0.3)
Observat. 1,401 2,863 828 1,649 573 1,214
Coefficient 0.233 0.038 0.238 0.040 0.227 0.036
s.d. - s.e. (0.423) (0.021) (0.426) (0.028) (0.419) (0.031)
R-W p-value (0.256) (>0.3) (>0.3)
Observat. 1,401 2,863 828 1,649 573 1,214
Coefficient 213,205 23,053 182,301 -9,836 254,403 70,861
s.d. - s.e. (376,774) (16,453) (444,528) (22,320) (254,958) (23,355)
R-W p-value (0.256) (>0.3) (0.057)*
Observat. 1,401 2,863 828 1,649 573 1,214
Probability of
Matching
All Women Men
Coefficient on being
offered training
Coefficient on being
offered training
Coefficient on being
offered training
Private Health
insurance1
Monthly Income*
* $COP of 2013. All regressions control for siteby-course fixed effects and the following pretreatment characteristics: age, education, marital status, employment, paid
employment, salary, self-employment earnings, whether working in the formal sector, whether working with a contract, days worked per month, and hours worked per week.
Column 2 additionally includes gender and its interactions with all covariates. Standard errors are corrected by clustering at the applicant level. R-W p-values were
estimated taking into account that there were multiple hypotheses, using the Romano and Wolf (2005), and Romano, Shaikh and Wolf (2008) procedure, on each of the
three outcomes included in this table, based on the bootstrap (1000 replications) standard errors stratified by city, gender and treatment status.
Panel A Panel B
Years of Education
High School
Graduation
Labor Force
Participation at the
Time of the Survey
Employed at the
Time of the Survey

ogotá -