r-1frequency es at 10 hz (incomplete tetanus) have reported delayed trabecular bone and . 68 ....
TRANSCRIPT

R-1
Title page 1
Category: Original Article 2
3
Title: Low-Frequency Electrical Stimulation of Denervated Skeletal Muscle Retards 4
Muscle And Trabecular Bone Loss In Aged Rats. 5
6
Hiroyuki Tamaki1, 2, Kengo Yotani2, Futoshi Ogita2, Keishi Hayao1, Hikari Kirimto3, 7
Hideaki Onishi1, Norikatsu Kasuga4, Noriaki Yamamoto1, 5 8
9
1Institute for Human Movement and Medical Sciences, Niigata University of Health and 10
Welfare, Japan 11
2National Institute of Fitness and Sports in Kanoya, Japan 12
3Department of Sensorimotor Neuroscience, Hiroshima University, Japan 13
4Aichi University of Education, Japan 14
5Niigata Rehabilitation Hospital, Japan 15
16
Correspondence to: Hiroyuki Tamaki Ph.D., 17
National Institute of Fitness and Sports in Kanoya, 18
1 Shiromizu, Kanoya, 981-2393, Japan. 19
E-mail: [email protected] 20
21
Keywords: disuse, osteopenia, muscle force, micro computed tomography 22
23
R-2
Abstract 24
Electrical stimulation (ES)-induced muscle contraction has multiple effects; however, 25
mechano-responsiveness of bone tissue declines with age. Here, we investigated whether 26
daily low-frequency ES-induced muscle contraction treatment reduces muscle and bone 27
loss and ameliorates bone fragility in early-stage disuse musculoskeletal atrophy in aged 28
rats. Twenty-seven-month-old male rats were assigned to age-matched groups comprising 29
the control (CON), sciatic nerve denervation (DN), or DN with direct low-frequency ES 30
(DN+ES) groups. The structural and mechanical properties of the trabecular and cortical 31
bone of the tibiae, and the morphological and functional properties of the tibialis anterior 32
(TA) muscles were assessed one week after DN. ES-induced muscle contraction force 33
mitigated denervation-induced muscle and trabecular bone loss and deterioration of the 34
mechanical properties of the tibia mid-diaphysis, such as the stiffness, but not the 35
maximal load, in aged rats. The TA muscle in the DN+ES group showed significant 36
improvement in the myofiber cross-sectional area and muscle force relative to the DN 37
group. These results suggest that low-frequency ES-induced muscle contraction treatment 38
retards trabecular bone and muscle loss in aged rats in early-stage disuse musculoskeletal 39
atrophy, and has beneficial effects on the functional properties of denervated skeletal 40
muscle. 41
Keywords: disuse, osteopenia, muscle force, micro computed tomography 42
43

R-3
Introduction 44
Bone atrophy is characterized by a reduction in muscle and bone volume and bone 45
mineral density (BMD) and alterations in trabecular and cortical bone architecture. Age-46
related and disuse-induced alterations to structural and material properties result in 47
decreased mechanical bone strength and an increased risk of bone fracture. Electrical 48
stimulation (ES) has been utilized for patients as a therapeutic intervention and a 49
functional substitute for voluntary muscle contractions, and has been explored as a means 50
of counteracting the skeletal muscle atrophy that occurs as a result of various clinical 51
conditions, such as spinal cord injury, aging, and disuse [1, 2]. In experimental animals, 52
ES has been shown to help limit DN-induced muscle atrophy and improve muscle force 53
and recovery. The skeletal muscles of aged rats also have a greater capability for 54
maintaining mass and force generation [3]. However, other studies have generated 55
contradictory results [4, 5]. Thus, the effects of ES on skeletal muscles may depend on 56
the atrophy model and the ES parameters, particularly the intensity, frequency and 57
duration of stimulation. We previously assessed beneficial stimulation intensities and 58
frequencies of ES, based on the structural recovery of individual skeletal muscles after 59
DN, and found that direct ES with 16 mA at 10 Hz retarded denervated muscle atrophy 60
and upregulated the mRNA expression of insulin-like growth factor-1 (IGF-1) [6]. 61
The maintenance of muscle volume is also a significant factor in maintaining bone 62
volume and strength, because muscles are responsible for generating the force that drives 63
beneficial mechanical stress on bone in vivo, in the form of physical exercise. In a disuse 64
animal model, frequency-dependent muscle stimulation (20–100 Hz) for four weeks 65
inhibited trabecular bone loss in the disused rat femur [7]. Recent studies using low-66
frequency ES at 10 Hz (incomplete tetanus) have reported delayed trabecular bone and 67
muscle loss during the early stages of musculoskeletal atrophy in denervated rats [8, 9]. 68

R-4
In addition, the positive effects of 10 Hz ES-induced muscle contraction on trabecular 69
bone and bone strength may be partly due to the activation of mechanosensors and the 70
dentin matrix protein 1 (DMP1) production of osteocytes in bone tissue in young rats [9, 71
10]. Osteocytes are the principal mechanosensory cells in bone tissue, and aging and 72
disuse contribute to increases in osteocyte apoptosis and decreases in osteocyte density 73
[11]. Thus, bone in adult and aged rats appears to be less sensitive to mechanical loading 74
than the growing bone of young rats. 75
Compared with young adult rats, the bones of aged rats have an equal or greater cortical 76
area and width, with a lower trabecular bone volume, thickness, and BMD [12]. These 77
changes in geometry and material properties may affect bone mechanical properties, and 78
the effects of hind limb disuse in adult rats reportedly occur more slowly at the tissue 79
level. The mechano-responsiveness of the periosteal and endocortical surfaces are 80
significantly smaller in adult and aged tibiae than in young tibiae [13]. Furthermore, 81
substantial structural and functional decreases occur in the number of motor units, and 82
the number of denervated fibers in skeletal muscles increases with age. The increased 83
number of denervated muscle fibers in aged age results in a decreased contractile ability 84
to generate the muscle force that induces mechanical bone loading. Therefore, in light of 85
these previous studies that have reported differences in bone and skeletal muscle tissue 86
between young and aged rats, little is known about whether ES-induced muscle 87
contraction treatment would also be beneficial in skeletally-mature, aged rats. 88
Furthermore, muscle and trabecular bone loss and their morphological changes 89
commence in the first week after denervation. Reportedly, early therapeutic intervention 90
effectively attenuates the loss of muscle mass and bone strength [10]. Thus, these reports 91
support the concept of early therapeutic intervention to ameliorate muscle and bone 92
atrophy and the associated potentially irreversible deterioration of trabecular architecture 93

R-5
in the early stages of disuse. We hypothesized that daily low-frequency ES-induced 94
muscle force treatment would effectively reduce trabecular bone loss, providing that a 95
certain amount of muscle mass to function as a force generator is retained in the early 96
stages of disuse atrophy in aged rats. Yet, it remains unclear whether this type of ES 97
treatment would have a positive effect on the mechanical properties of cortical bone and 98
its determinant factors in early-stage disuse atrophy in aged rats. Thus, the aim of this 99
study was to investigate whether the daily low-frequency ES-induced muscle contraction 100
treatment that reduces muscle and bone loss and ameliorates bone fragility, in early-stage 101
disuse musculoskeletal atrophy in young rats, would also have beneficial effects in 102
reducing these properties in the denervated TA muscles and tibiae of aged rats. The 103
mechanical properties of the tibia cortical bone in relation to maximal load, stiffness, and 104
elastic modulus were also assessed. 105
106
Materials and Methods 107
Animals and experimental protocol 108
Twenty-four male Fischer 344 rats (CLEA, Tokyo, Japan) were housed in standard 109
cages under a constant temperature (23 ± 2°C), humidity (55% ± 5%), and in 12 h light-110
dark cycles. The rats had free access to CE-2 rodent chow (CLEA) and water. At 27 111
months of age, the rats were randomly assigned to one of the following groups: the age-112
matched control group (CON); the sciatic denervation group (DN); or the DN + direct 113
electrical stimulation group (DN+ES). The sample size (n = 8/group) was calculated with 114
reference to trabecular bone fraction (BV/TV) data from previous studies in our 115
laboratory, using the following formula [10, 14] 116
n = (r+1)/r × σ2 (Zα/2 + Zβ)2 /∆2, (1) 117
where r is the ratio of the larger group to the smaller group, σ is the standard deviation, ∆ 118

R-6
is the effect size, α = 0.05, β = 0.2 (for 80% power with 95% confidence), Zα/2 = 1.96, and 119
Zβ = 0.84. 120
The rats in the DN groups were anesthetized by inhalation of 2%–2.5% isoflurane in 121
air with a flow of 2 L/minute. An incision was made at the skin covering the left buttock, 122
and the sciatic nerve was exposed, then frozen with a stainless steel rod cooled in liquid 123
nitrogen [8, 10, 15]. The incision was then closed with sutures, and each animal was kept 124
in a standard cage. A complete lack of active movement at the ankle and toe was observed 125
on the denervated side after nerve freezing. To confirm the efficacy of denervation, 126
evoked electromyography (EMG) was recorded from the denervated tibialis anterior (TA) 127
muscle with ES at a location proximal to the freezing site of the sciatic nerve at the end 128
of the experiments [9, 10]. No EMG recordings were observed in the denervated TA 129
(Figure 1). The rats in the ES groups were administered with direct muscle ES for one 130
week, commencing the day after DN surgery. All procedures were approved by the 131
Animal Committee of the National Institute of Fitness and Sports and the Animal 132
Committee of Niigata University of Health and Welfare. 133
Direct ES procedures and evoked muscle contraction force measurement 134
The stimulation protocol was delivered as described previously [8-10]. The day after 135
surgery, the left TA muscles of the DN+ES rats under isoflurane inhalation anesthesia 136
(2%–2.5%) were percutaneously electrically stimulated. Bipolar silver surface electrodes 137
(3 mm diameter) were attached to the shaved anterior surface of the rat’s left leg. Direct 138
muscle stimulation was applied using an electrostimulator and isolator (SEM-4201, SS-139
201, Nihon Kohden, Tokyo, Japan) for 30 minutes a day, 6 days a week, for 1 week, at an 140
intensity of 16 mA, with a 10 Hz frequency, and a pulse width of 250 μs. The ES regimen 141
was carried out with 2 s of stimulation followed by a 6 s rest. Although this did not cause 142
a maximal contraction [8] in denervated TA muscle, it evoked visible toe flexion. The rats 143

R-7
in the CON and DN group were also anesthetized with isoflurane inhalation (2%–2.5%) 144
for the same time period as the ES rats. One week after denervation, the isometric 145
contraction force in TA muscle was measured under the same stimulus conditions as the 146
daily ES regimen to determine the mechanical factors evoked by direct ES, as previously 147
described (n = 8/group) [8, 9]. Briefly, the lower limbs of rats under inhalational 148
anesthesia were secured and stabilized on the working platform with restraining bars and 149
pins at the knee and ankle joints. The distal tendon of the TA was attached to an isometric 150
transducer (TB-654T, Nihon Kohden) that was secured with a 4-0 silk suture on a three-151
dimensional (3D) drive precision stage. The muscle tension signal was sampled at 2 kHz 152
through a PowerLab 8SP A/D converter (ADInstruments, Nagoya, Japan). 153
Bone strain measurements 154
To check the tibia strains during ES of the same stimulus condition as the daily ES 155
regimen, strain gages (KFG-3-120, Kyowa, Tokyo, Japan) were attached in longitudinal 156
alignment to the center of medial surface at the proximal/middle site of right tibiae of four 157
rats, under isoflurane inhalation anesthesia. After removing the soft tissue on the bonding 158
site, the bone surface was degraded, dried and the gage was bonded with cyanoacrylate 159
instantaneous adhesive (CC-33A, Kyowa) pressing the strain gage covered with the 160
polyethylene sheet for approximately 1 minute. Strain signals were processed using an 161
amplifier (Four Assist, Tokyo, Japan) and data were collected at 2 kHz with a PowerLab 162
8SP A/D converter (ADInstruments). Peak strains and maximum and minimum strain 163
rates during ES treatment were measured using Chart 7 software (ADInstruments). 164
Tissue preparation 165
The tibiae and TA muscles were harvested from rats anesthetized with sodium 166
pentobarbital (50 mg/kg, i.p.) at the end of the experiment. The TA muscles were weighed, 167
and samples were mounted on a piece of cork with OCT compound and frozen in 168

R-8
isopentane cooled in liquid nitrogen for histological analyses. Samples were stored at 169
−80°C until use. TA muscle weight (MW) was normalized by body weight (BW), and is 170
expressed as the ratio of MW/BW. The tibiae were individually wrapped in saline soaked 171
gauze and stored at −20°C until micro-CT analysis and bone biomechanical testing was 172
performed. 173
Microcomputed tomography (micro-CT) 174
The tibial bone microarchitecture was measured using a SkyScan 1076 high-resolution 175
micro-CT scanner (SkyScan, Kontich, Belgium). Details regarding the micro-CT scanner 176
and analysis software used in this study have been described previously [8-10]. Briefly, 177
tibia bone scanning was performed using a source voltage/current of 70 kV/141 μA, with 178
a 1 mm aluminum filter to reduce beam hardening. Scans were made with a rotation step 179
of 0.6° through to 180° and a pixel size of 17.67 μm. The 3D microstructural image data 180
were reconstructed and morphometric parameters were calculated using the NRecon and 181
CT Analyzer software (SkyScan, Figure 2). Trabecular bone within the proximal tibiae 182
and cortical bone at the tibial midshaft were extracted by semi-automatically drawing 183
interactive polygons on two-dimensional (2D) sections. The volume of interest (VOI) 184
started at a distance of 2 mm from the lower end of the growth plate and extended distally 185
for 114 cross sections (height = 2 mm). The VOI comprised only trabecular bone and the 186
marrow cavity. To analyze tibial cortical bone, the VOI was positioned in the region 187
starting 9 mm proximal to the tibia-fibula junction for 2 mm towards the midshaft. The 188
following parameters were measured according to the guidelines and nomenclature 189
proposed by the American Society for Bone and Mineral Research [16]: trabecular bone 190
volume fraction (BV/TV, %), trabecular number (Tb.N, 1/mm), trabecular thickness 191
(Tb.Th, mm), trabecular spacing (Tb.Sp, mm), connection density (Conn.D, 1/mm3), total 192
tissue volume (TV, mm3), cortical bone fraction (Ct.Ar/Tt.Ar, %), and cortical porosity 193
R-9
(Ct.Po, as Po.V/Ct.V, %). The second moment of area (I, mm4), which is a measure of the 194
efficiency of a cross-sectional shape to resist bending caused by loading, was calculated 195
using the following formula [17]: I = π/64 × (D1D23 – d1d2
3), where D1 is the right-left 196
(RL) outer diameter (mm), D2 is the anteroposterior (AP) outer diameter (mm), d1 is the 197
RL inner diameter (mm), and d2 is the AP inner diameter (mm). The estimated mineral 198
density of the cortical bone tissue was determined based on the linear correlation between 199
the CT attenuation coefficient and bone mineral density (BMD) [18]. To calibrate the 200
volumetric BMD of each bone specimen, two hydroxyapatite phantoms (0.25 and 0.75 201
g/cm3 HA BMD phantoms, SkyScan) were used, following the manufacturer’s 202
instructions (bone mineral density calibration in SkyScan CT-analyzer, SkyScan). 203
Biomechanical testing 204
The mechanical properties of the maximum load (N), stiffness (S; N/mm), and elastic 205
modulus (Em; N/mm2) of the tibiae were determined by the three-point bending test using 206
an EZ-SX mechanical testing device (Shimadzu, Tokyo, Japan), as described previously 207
[10]. Briefly, the tibia was placed on supports (anterior surface down) that were spaced at 208
a distance of 20 mm, and then loaded to failure at a constant displacement rate of 1 209
mm/min. Load-deformation data were recorded on a computer, and the following 210
mechanical parameters were calculated from the load-deformation curves using 211
Trapezium X software (Shimadzu). Stiffness was calculated as the slope of the elastic 212
deformation of the bone, i.e., the slope of the linear segment of the force-deformation 213
curve. The elastic modulus was derived as [17] Em = 1/48 × L3 × S/I, where L is the 214
distance between the two supports, and I is the second moment of area. 215
Immunohistochemistry and image analysis 216
The TA muscle samples were cut into 10 µm cross sections at −20°C with a cryostat 217
(CM3050S, Leica, Germany) and mounted on silanized slides for immunohistochemical 218
R-10
staining. After air-drying at room temperature and fixing with ice-cold 4% 219
paraformaldehyde for 15 min, sections were blocked at room temperature for 1 h with 220
10% normal goat serum (NGS) and 1% Triton X-100 in PBS, then washed twice in PBS 221
for 5 min. Next, sections were incubated in 5% NGS and 0.3% Triton X-100 in PBS for 222
16–20 h at 4°C with a primary antibody against laminin as a marker for basement 223
membrane integrity (1:200 dilution, Abcam, Tokyo, Japan). The sections were washed 224
several times with PBS, incubated with an appropriate secondary antibody (Alexa Fluor 225
568 goat anti-rabbit IgG, 1:500 dilution, Abcam), diluted with PBS containing 5% NS 226
and 0.1% Triton X-100 for 1 h at room temperature, and finally mounted with Vectashield 227
mounting medium. Images of TA muscle sections were obtained using a fluorescent light 228
microscope (BX60; Olympus, Tokyo, Japan) and a charge-coupled device (CCD) camera 229
(DP73; Olympus, Tokyo, Japan). Digital images at 200-fold magnification were used to 230
determine the cross-sectional area of the muscle fibers (FCSA) in each TA muscle. The 231
FCSAs of at least 100 fibers in each muscle were measured using Image-Pro Premier 232
software (Media Cybernetics). 233
Statistical analysis 234
All data are expressed as the mean ± standard deviation. Data sets were analyzed using 235
one-way analysis of variance (ANOVA) followed by either Tukey’s post hoc test or the 236
Kruskal-Wallis test followed by a Steel-Dwass multiple comparisons test (Ekuseru-237
Toukei 2015 software for Windows, Social Survey Research Information Co., Ltd., Tokyo, 238
Japan), depending on the normality of the data distribution. Significance levels were set 239
at P < 0.05. 240
241
Results 242
Muscle weight, ES-evoked muscle contraction force and bone strain 243

R-11
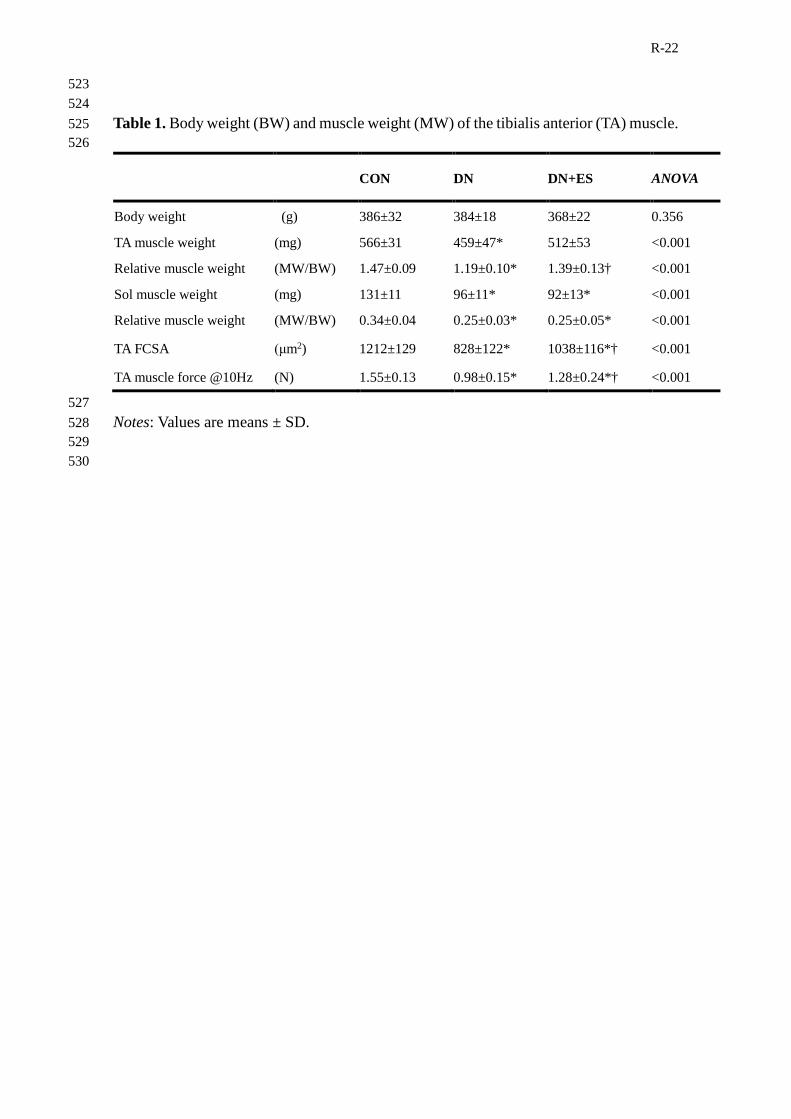
The TA and soleus (Sol) muscle weights significantly decreased after denervation (P < 244
0.05). Relative TA muscle weights were significantly lower in the DN group compared 245
with the CON group (P < 0.05), and were significantly higher in the DN+ES group 246
compared with the DN group (P < 0.05). The relative Sol muscle weight was significantly 247
lower (P < 0.05) in the DN and DN+ES groups than in the CON group, but no significant 248
difference was observed between the DN and DN+ES groups. The cross-sectional area of 249
the TA muscle fibers (FCSA) and the muscle contraction force evoked by direct ES at 10 250
Hz were significantly smaller in the DN and DN+ES groups than in the CON group, and 251
were also smaller in the DN group compared with the DN+ES group (P < 0.05, Table 1, 252
Figure 3). Peak strain of the tibia during direct ES treatment at 10 Hz was 64 ± 10 µε. 253
Maximum and minimum strain rates were 7420 ± 3838 µε/s and −5534 ± 1732 µε/s, 254
respectively. 255
Bone micro-CT analysis 256
Figure 4 shows typical 3D reconstructed micro-CT images of the proximal tibial 257
metaphyseal trabecular bone in aged rats. Denervation resulted in a significantly smaller 258
trabecular bone volume fraction (BV/TV), a reduced trabecular thickness (Tb.Th), 259
trabecular number (Tb.N), and connectivity density (Conn.D), and increased trabecular 260
separation (Tb.Sp) in the DN compared with the CON group (P < 0.05; Table 2, Figure 261
4). The BV/TV, Tb.Th, and Tb.N were significantly higher in the DN+ES group than in 262
the DN group (P < 0.05), but not the Tb.Sp and Conn.D. Morphological analysis of the 263
tibia mid-diaphysis from micro-CT images showed that the tissue volume, cortical bone 264
fraction, cortical porosity, and second moment of area did not differ between the groups 265
(Table 2). CT-estimated BMD in the metaphyseal cortical bone tissue was 3% lower in 266
the DN group than in the CON group, and 5% higher in the DN+ES group than in the DN 267
group. However, we did not find any significant differences in BMD between groups. 268

R-12
Bone biomechanical analysis 269
Table 3 shows the results of the mechanical property analysis of the tibia mid-diaphysis 270
(Figure 5). DN-induced disuse resulted in reduced maximal load (15%, P = 0.06), 271
stiffness (24%, P < 0.05), and elastic modulus (33%, P < 0.05) compared with the CON 272
group. The maximal load (P = 0.13), stiffness (P < 0.05), and the elastic modulus (P = 273
0.31) were 2%, 23%, and 21% higher in the DN+ES group than in the DN group, 274
respectively (Table 3), but neither the maximal load nor elastic modulus differed 275
significantly. 276
277
Discussion 278
The current study presents new data on the effects of low-frequency direct ES in the 279
early stages of disuse atrophy in the denervated TA muscles and tibiae of aged rats. The 280
present findings show that ES-induced muscle contraction force mitigates denervation-281
induced muscle and trabecular bone loss and deterioration of the mechanical properties 282
(e.g., the stiffness, but not the maximal load and elastic modulus) of the tibia mid-283
diaphysis in the early stages of disuse atrophy in aged rats. 284
Electrical muscle stimulation affects muscle and bone tissue through various pathways, 285
including the mechanical, circulatory, and humoral pathways. Furthermore, the effects of 286
ES seem to be dependent on the stimulation paradigm, including the intensity, frequency, 287
number of stimuli, and duration of the intervention [3, 5, 19-21] ; contradictory reports of 288
the positive and negative effects of ES-induced muscle contraction on disuse osteopenia 289
and muscle loss appear to be due to different ES regimens. In general, relatively high 290
intensities or frequencies of ES are likely to have greater effects on muscle atrophy and 291
bone loss in early-stage DN-induced disuse, due to the higher muscle tension caused by 292
the increased recruitment of muscle fibers and/or the summation of twitch contractions, 293

R-13
thereby possibly producing adequate mechanical stimuli to bone. Dynamic muscle 294
stimulation with mid- and high-frequency ES regimens (20, 50, and 100 Hz) for 10 min 295
per day for four weeks inhibits trabecular bone loss in the femur (bone volume fraction, 296
trabecular number, trabecular separation, and connection density), as determined by 3D 297
micro-CT analysis in a suspension disuse model of adult rats [7]. Interestingly, the 298
converse has been reported where ES from 1 Hz to 100 Hz generates various nonlinear 299
bone stresses and fluid pressure in bone, and that maximal bone strain is observed with 300
ES at 10 Hz, which mitigates bone loss [22]. Therefore, repetitive twitch muscle 301
contractions might also generate beneficial bone mechanical stress. Previous research 302
using relatively small muscle tensions elicited by ES at 10 Hz, which does not cause 303
tetanic muscle contraction, showed delayed muscle loss in combination with ongoing 304
trabecular bone loss during the early stage of musculoskeletal atrophy due to disuse in 305
young rats [8, 23]. We applied daily ES at a frequency of 10 Hz for 2 s followed by a 6 s 306
rest, which was repeated for 225 cycles over a period of 30 min. Although this level of 307
ES caused very little twitch contraction summation [8], it is estimated that daily ES 308
treatment would supply 4500 instances of mechanical stimuli per day to the bone. In the 309
present study, this type of ES also had positive effects on reducing trabecular bone volume 310
loss and preventing deterioration of trabecular bone architecture in early-stage disuse 311
musculoskeletal atrophy in aged rats. 312
The mechanical effects of ES-induced muscle contractions are essential for the 313
maintenance of bone mass and strength, which are achieved through the cooperative 314
functions of osteocytes, osteoblasts, and osteoclasts. Although the mechanisms of the 315
effects of ES on reducing DN-induced trabecular bone loss are still unknown, osteocytes 316
are the principal mechanosensor cells in bone tissue, and may be involved in generating 317
the effects observed in response to low-frequency ES-induced muscle contraction 318

R-14
treatment. In a previous study, this type of ES-induced muscle force reduced both 319
trabecular bone loss and the decreases in osteoid and osteocyte numbers embedded in the 320
osteoid area that typically occur following denervation [9]. Additionally, streptomycin 321
treatment did not induce bone loss, but attenuated the effects of ES-induced muscle 322
contractions on reducing disused bone loss in young and aged rats [9, 24]. Streptomycin 323
treatment also resulted in an approximately 70%−90% reduction in the bone anabolic 324
response to ES-induced muscle contractions. Streptomycin is a potent blocker of stretch-325
activated ion channels, and stretch-activated ion channels are found in osteoblasts and 326
osteocytes. The resulting osteoblastic osteogenesis that is maintained by low-frequency 327
ES-induced muscle contractions may be caused, in part, by activation of the 328
mechanosensors in bone tissue. Thus, the mechanical loading induced by low-frequency 329
ES-induced muscle contractions may have a major influence on the mass and structure of 330
trabecular bone tissue in young and aged rats. 331
In the present study, our data indicated that low-frequency ES, which does not cause 332
tetanic muscle contraction, also retards trabecular bone loss and structural changes in the 333
early stages of disuse atrophy in aged rats. However, bone strength and the BMD in the 334
cortical bone were not altered by the daily ES-induced muscle contraction treatment 335
regime in aged rats. It has been reported that some differences in metabolic profile and 336
mechano-responsiveness depend on age and bone tissue type, such as whether the bone 337
is trabecular or cortical. First, trabecular bone, with its large surface area, has higher 338
turnover than cortical bone [25]. Trabecular bone is also a type of bone tissue that 339
responds quickly to external factors such as exercise training, and is more metabolically 340
active than cortical bone [26]. At the tissue level, the effects of unloading in the adult rat 341
occur more slowly compared with young rats, and the mechano-responsiveness of the 342
periosteal and endocortical surfaces of cortical bone are approximately 3−11 times 343

R-15
smaller in adult and aged tibiae than in young tibiae [13]. Moreover, aging and disuse 344
have been associated with increased osteocyte apoptosis and decreased osteocyte density, 345
which is notable because osteocytes are the principal mechanosensory cells of bone tissue 346
[11]. Osteocyte apoptosis is reportedly a critical determinant of bone strength, and 347
increased osteocyte apoptosis is a common feature in conditions of increased bone 348
fragility [27]. Therefore, could be speculated that the smaller and more gradual effects of 349
ES-induced muscle contraction treatment, which may occur through mechanosensor 350
activation in bone tissue, would be observed in cortical bone in aged rats. In fact, although 351
ES-induced muscle contractions had positive effects on the BMD and bone strength 352
(maximal load) of cortical bone in young rats in our previous study, it did not elicit the 353
same results in aged rats in the present study. 354
The effects of ES on muscle tissue showed that using a low-frequency ES regimen (10 355
Hz, 8 and 16 mA, 30 min/day, for 1 and 3 weeks) in denervated TA muscle retards the 356
atrophy of denervated muscle in young rats [6, 10]. Reportedly, low-frequency ES (10 357
Hz) also induced the increase in the FCSA in type IIa fibers of adult and aged TA muscle 358
and the number of satellite cells at 1 day, up to 10 days [28, 29]. Satellite cell content is 359
likely to decrease after denervation and also with age; the lower regenerative potential of 360
aged muscles is correlated with declines in satellite cell function. Reportedly, age-related 361
type II muscle fiber atrophy is accompanied by a specific decline in the satellite cell 362
content of type II muscle fibers [30]. Comparatively, increased satellite cell differentiation 363
is correlated with preserved muscle function (muscle force production) in response to 364
electrical stimulation after sciatic nerve injury [31]. Using the same low-frequency ES 365
conditions (10 Hz, 16 mA, 30 min/day, for one week), the present study demonstrated 366
that intervention with direct ES treatment reduces DN-induced decreases in muscle 367
weight, FCSA, and the muscle contraction force of fast-type dominant TA muscles. 368

R-16
Therefore, low-frequency ES treatment may also have a beneficial effect on muscle disuse 369
atrophy, which is possibly related to the maintenance of satellite cells in aged rats. 370
Moreover, muscle mass is also an important factor influencing the stimulation delivered 371
to the bone tissue through ES-induced muscle contractions. 372
The present study has several limitations. First, it is a cross-sectional analysis, and our 373
results observed in aged rats do not reflect longitudinal change over time. We recognize 374
that our results might not be applicable to growing rats undergoing rapid skeletal 375
remodeling; however, the results in the present study can be compared with the results in 376
our previous study using young rats, which was performed using the same protocol as the 377
present study. Secondly, we did not determine the parameters of possible mechanisms that 378
may explain the effects of ES on the reduction of bone loss due to disuse. Thus, further 379
studies are required to elucidate such mechanisms. Although dynamic histomorphometry 380
analyses would increase our understanding of bone formation and bone resorption, the 381
main objective of this study was to assess the effects of low-frequency ES-induced muscle 382
contraction treatment on reducing muscle and bone loss and ameliorating bone fragility 383
in early-stage disuse musculoskeletal atrophy in aged rats. To our knowledge, this is the 384
first study to assess the effects of low-frequency ES-induced muscle contraction on the 385
trabecular bone volume, mechanical properties, and architecture of cortical bone, and the 386
morphological and functional properties of denervated muscles in the early stages of 387
disuse musculoskeletal atrophy in aged rats. Our results may give new and more 388
information about the use of ES in denervation situation and osteopenia. 389
In conclusion, the present study demonstrated that low-frequency ES-induced muscle 390
contraction force retards trabecular bone loss and structural changes, but has little to no 391
impact on cortical bone strength in the early stages of disuse atrophy in aged rats. Also, 392
daily application of low-frequency ES intervention reduces denervation-induced muscle 393

R-17
loss and force deficits. The daily ES-induced muscle contraction treatment, which was 394
previously shown to have beneficial effects in young rats, serves the dual purpose of 395
reducing muscle loss and disuse osteopenia in aged rats. 396
397
Conflict of interest: 398
All authors declare no conflicts of interest. 399
400
Acknowledgments 401
This study was supported in part by a Grant-in-Aid for Scientific Research from the 402
Japan Society for the Promotion of Science (KAKENHI Grant nos. JP16K13021, 403
JP17H02181, and JP17H02125). We thank S. J. Win, PhD, from Edanz Group 404
(www.edanzediting.com/ac) for editing a draft of this manuscript. 405
406
407

R-18
References 408
1. Kern H, Salmons S, Mayr W, Rossini K, Carraro U. Recovery of long-term denervated human 409 muscles induced by electrical stimulation. Muscle Nerve 2005;31: 98-101. 410 2. Modlin M, Forstner C, Hofer C, Mayr W, Richter W, Carraro U, Protasi F, Kern H. Electrical 411 stimulation of denervated muscles: first results of a clinical study. Artif Organs 2005;29: 203-6. 412 3. Dow DE, Dennis RG, Faulkner JA. Electrical stimulation attenuates denervation and age-related 413 atrophy in extensor digitorum longus muscles of old rats. J Gerontol A Biol Sci Med Sci 2005;60: 416-24. 414 4. Dow DE, Cederna PS, Hassett CA, Dennis RG, Faulkner JA. Electrical stimulation prior to 415 delayed reinnervation does not enhance recovery in muscles of rats. Restor Neurol Neurosci 2007;25: 601-416 10. 417 5. Gigo-Benato D, Russo TL, Geuna S, Domingues NR, Salvini TF, Parizotto NA. Electrical 418 stimulation impairs early functional recovery and accentuates skeletal muscle atrophy after sciatic nerve 419 crush injury in rats. Muscle Nerve 2010;41: 685-93. 420 6. Tomori K, Ohta Y, Nishizawa T, Tamaki H, Takekura H. Low-intensity electrical stimulation 421 ameliorates disruption of transverse tubules and neuromuscular junctional architecture in denervated rat 422 skeletal muscle fibers. J Muscle Res Cell Motil 2010;31: 195-205. 423 7. Lam H, Qin YX. The effects of frequency-dependent dynamic muscle stimulation on inhibition 424 of trabecular bone loss in a disuse model. Bone 2008;43: 1093-100. 425 8. Tamaki H, Tomori K, Yotani K, Ogita F, Sugawara K, Kirimoto H, Onishi H, Yamamoto N, 426 Kasuga N. Electrical stimulation of denervated rat skeletal muscle retards trabecular bone loss in early 427 stages of disuse musculoskeletal atrophy. J Musculoskelet Neuronal Interact 2014;14: 220-8. 428 9. Tamaki H, Yotani K, Ogita F, Sugawara K, Kirimoto H, Onishi H, Kasuga N, Yamamoto N. 429 Effect of electrical stimulation-induced muscle force and streptomycin treatment on muscle and trabecular 430 bone mass in early-stage disuse musculoskeletal atrophy. J Musculoskelet Neuronal Interact 2015;15: 270-431 8. 432 10. Tamaki H, Yotani K, Ogita F, Hayao K, Nakagawa K, Sugawara K, Kirimoto H, Onishi H, 433 Kasuga N, Yamamoto N. Electrical Stimulation of Denervated Rat Skeletal Muscle Ameliorates Bone 434 Fragility and Muscle Loss in Early-Stage Disuse Musculoskeletal Atrophy. Calcif Tissue Int 2017;100: 435 420-430. 436 11. Manolagas SC. Birth and death of bone cells: basic regulatory mechanisms and implications for 437 the pathogenesis and treatment of osteoporosis. Endocr Rev 2000;21: 115-37. 438 12. Uppuganti S, Granke M, Makowski AJ, Does MD, Nyman JS. Age-related changes in the 439 fracture resistance of male Fischer F344 rat bone. Bone 2016;83: 220-32. 440 13. Birkhold AI, Razi H, Duda GN, Weinkamer R, Checa S, Willie BM. The Periosteal Bone Surface 441 is Less Mechano-Responsive than the Endocortical. Sci Rep 2016;6: 23480. 442 14. Kerckhofs G, Durand M, Vangoitsenhoven R, Marin C, Van der Schueren B, Carmeliet G, Luyten 443 FP, Geris L, Vandamme K. Changes in bone macro- and microstructure in diabetic obese mice revealed by 444 high resolution microfocus X-ray computed tomography. Sci Rep 2016;6: 35517. 445 15. Takekura H, Tamaki H, Nishizawa T, Kasuga N. Plasticity of the transverse tubules following 446 denervation and subsequent reinnervation in rat slow and fast muscle fibres. J Muscle Res Cell Motil 447 2003;24: 439-51. 448 16. Bouxsein ML, Boyd SK, Christiansen BA, Guldberg RE, Jepsen KJ, Muller R. Guidelines for 449 assessment of bone microstructure in rodents using micro-computed tomography. J Bone Miner Res 450 2010;25: 1468-86. 451 17. Iwamoto J, Takeda T, Katsumata T, Tanaka T, Ichimura S, Toyama Y. Effect of etidronate on 452 bone in orchidectomized and sciatic neurectomized adult rats. Bone 2002;30: 360-7. 453 18. Brouwers JE, van Rietbergen B, Huiskes R, Ito K. Effects of PTH treatment on tibial bone of 454 ovariectomized rats assessed by in vivo micro-CT. Osteoporos Int 2009;20: 1823-35. 455 19. Midura RJ, Dillman CJ, Grabiner MD. Low amplitude, high frequency strains imposed by 456

R-19 electrically stimulated skeletal muscle retards the development of osteopenia in the tibiae of hindlimb 457 suspended rats. Med Eng Phys 2005;27: 285-93. 458 20. Mohr T, Podenphant J, Biering-Sorensen F, Galbo H, Thamsborg G, Kjaer M. Increased bone 459 mineral density after prolonged electrically induced cycle training of paralyzed limbs in spinal cord injured 460 man. Calcif Tissue Int 1997;61: 22-5. 461 21. Tanaka SM, Yorozuya Y, Takatsu D. Random Electromyostimulation Promotes Osteogenesis and 462 the Mechanical Properties of Rat Bones. Ann Biomed Eng 2017;45: 2837-2846. 463 22. Qin YX, Lam H, Ferreri S, Rubin C. Dynamic skeletal muscle stimulation and its potential in 464 bone adaptation. J Musculoskelet Neuronal Interact 2010;10: 12-24. 465 23. Tamaki H, Yotani K, Ogita F, Kirimoto H, Onishi H, Kasuga N. Bone loss due to disuse and 466 electrical muscle stimulation. J Phys Fitness Sports Med 2016;5: 267-73. 467 24. Tamaki H, Yotani K, Ogita F, Hayao K, Tamakoshi K, Takahashi H, Tsubaki A, Kirimoto H, 468 Onishi H, Kasuga N, Yamamoto N. Streptomycin attenuates the effects of electrical stimulation-induced 469 muscle contraction on reducing trabecular bone loss in the early stages of disuse in old rats. 2017 Annual 470 Meeting of American Society for Bone and Mineral Research 2017: S123. 471 25. Parfitt AM. Misconceptions (2): turnover is always higher in cancellous than in cortical bone. 472 Bone 2002;30: 807-9. 473 26. Warner SE, Shea JE, Miller SC, Shaw JM. Adaptations in cortical and trabecular bone in 474 response to mechanical loading with and without weight bearing. Calcif Tissue Int 2006;79: 395-403. 475 27. Aguirre JI, Plotkin LI, Stewart SA, Weinstein RS, Parfitt AM, Manolagas SC, Bellido T. 476 Osteocyte apoptosis is induced by weightlessness in mice and precedes osteoclast recruitment and bone 477 loss. J Bone Miner Res 2006;21: 605-15. 478 28. Martins KJ, Murdoch GK, Shu Y, Harris RL, Gallo M, Dixon WT, Foxcroft GR, Gordon T, 479 Putman CT. Satellite cell ablation attenuates short-term fast-to-slow fibre type transformations in rat fast-480 twitch skeletal muscle. Pflugers Arch 2009;458: 325-35. 481 29. Putman CT, Sultan KR, Wassmer T, Bamford JA, Skorjanc D, Pette D. Fiber-type transitions and 482 satellite cell activation in low-frequency-stimulated muscles of young and aging rats. J Gerontol A Biol Sci 483 Med Sci 2001;56: B510-9. 484 30. Verdijk LB, Snijders T, Drost M, Delhaas T, Kadi F, van Loon LJ. Satellite cells in human skeletal 485 muscle; from birth to old age. Age (Dordr) 2014;36: 545-7. 486 31. Xing H, Zhou M, Assinck P, Liu N. Electrical stimulation influences satellite cell differentiation 487 after sciatic nerve crush injury in rats. Muscle Nerve 2015;51: 400-11. 488
489

R-20
Table titles and Figure captions 490
Table 1. Body weight (BW) and muscle weight (MW) of the tibialis anterior (TA) muscle. 491
Notes: Values are means ± SD. 492
493
Table 2. The 3D microstructural properties of mid-tibial diaphyseal cortical bone, and 494
bone mineral density (BMD). Notes: Values are means ± SD. *P < 0.05, versus CON. †P 495
< 0.05, versus DN. 496
497
Table 3. Mechanical properties of the mid-tibial diaphyseal cortical bone. Notes: Values 498
are means ± SD. *P < 0.05, versus CON. †P < 0.05, versus DN. 499
500
Figure 1. Intramuscular and surface EMG recordings from the denervated TA muscles 501
during sciatic nerve stimulation after 1 week of denervation. 502
503
Figure 2. 3D images of the tibia. Trabecular bone at the metaphyseal section and cortical 504
bone at the mid-diaphysis of the tibia were evaluated using micro-CT. 505
506
Figure 3. Immunofluorescence photomicrographs of tibialis anterior (TA) muscles for 507
laminin (red) in the CON (A), DN (B), and DN+ES (C) groups, and quantification of 508
mean myofiber cross-sectional area (FCSA) (D) and muscle force (E). Bar 50 μm. *P < 509
0.05 vs. CON; †P < 0.05 vs. DN. (CON, control; DN, sciatic nerve denervation; DN+ES, 510
sciatic nerve denervation + electrical stimulation). 511
512
Figure 4. 3D images of trabecular bone at the analysis site of the tibiae (A), and the 513
trabecular bone volume fraction (BV/TV, B), trabecular thickness (Tb.Th, C), trabecular 514

R-21
number (Tb.N, D), connectivity density (Conn.D, E), and increased trabecular separation 515
(Tb.Sp, F). *P < 0.05 vs. CON; †P < 0.05 vs. DN. 516
517
Figure 5. Representative 3D images of the tibia mid-diaphysis from micro-CT (upper 518
panel) and representations of the load-displacement curves from CON, DN, and DN+ES 519
rat tibiae loaded by three-point bending (lower panel). (CON, control; DN, sciatic nerve 520
denervation; DN+ES, sciatic nerve denervation + electrical stimulation). 521
522
R-22 523 524 Table 1. Body weight (BW) and muscle weight (MW) of the tibialis anterior (TA) muscle. 525 526
CON DN DN+ES ANOVA
Body weight (g) 386±32 384±18 368±22 0.356
TA muscle weight (mg) 566±31 459±47* 512±53 <0.001
Relative muscle weight (MW/BW) 1.47±0.09 1.19±0.10* 1.39±0.13† <0.001
Sol muscle weight (mg) 131±11 96±11* 92±13* <0.001
Relative muscle weight (MW/BW) 0.34±0.04 0.25±0.03* 0.25±0.05* <0.001
TA FCSA (μm2) 1212±129 828±122* 1038±116*† <0.001
TA muscle force @10Hz (N) 1.55±0.13 0.98±0.15* 1.28±0.24*† <0.001
527 Notes: Values are means ± SD. 528 529 530
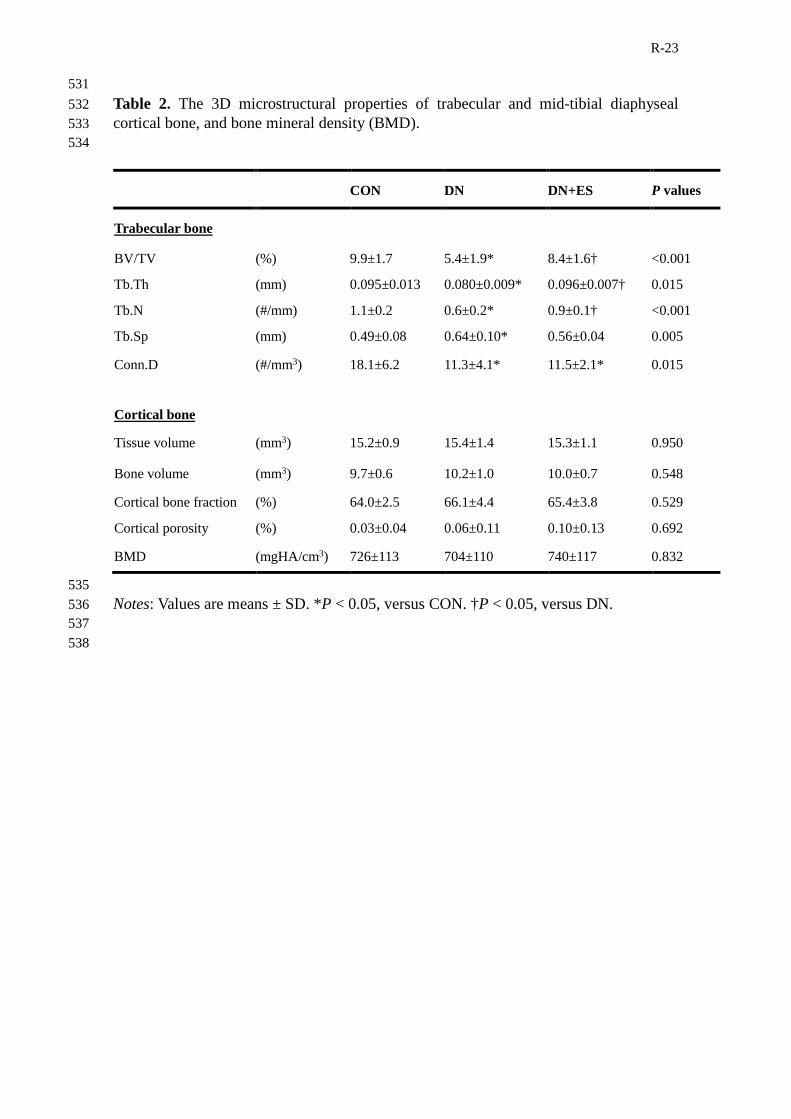
R-23 531 Table 2. The 3D microstructural properties of trabecular and mid-tibial diaphyseal 532 cortical bone, and bone mineral density (BMD). 533 534
535 Notes: Values are means ± SD. *P < 0.05, versus CON. †P < 0.05, versus DN. 536 537 538
CON DN DN+ES P values
Trabecular bone
BV/TV (%) 9.9±1.7 5.4±1.9* 8.4±1.6† <0.001
Tb.Th (mm) 0.095±0.013 0.080±0.009* 0.096±0.007† 0.015
Tb.N (#/mm) 1.1±0.2 0.6±0.2* 0.9±0.1† <0.001
Tb.Sp (mm) 0.49±0.08 0.64±0.10* 0.56±0.04 0.005
Conn.D (#/mm3) 18.1±6.2 11.3±4.1* 11.5±2.1* 0.015
Cortical bone
Tissue volume (mm3) 15.2±0.9 15.4±1.4 15.3±1.1 0.950
Bone volume (mm3) 9.7±0.6 10.2±1.0 10.0±0.7 0.548
Cortical bone fraction (%) 64.0±2.5 66.1±4.4 65.4±3.8 0.529
Cortical porosity (%) 0.03±0.04 0.06±0.11 0.10±0.13 0.692
BMD (mgHA/cm3) 726±113 704±110 740±117 0.832
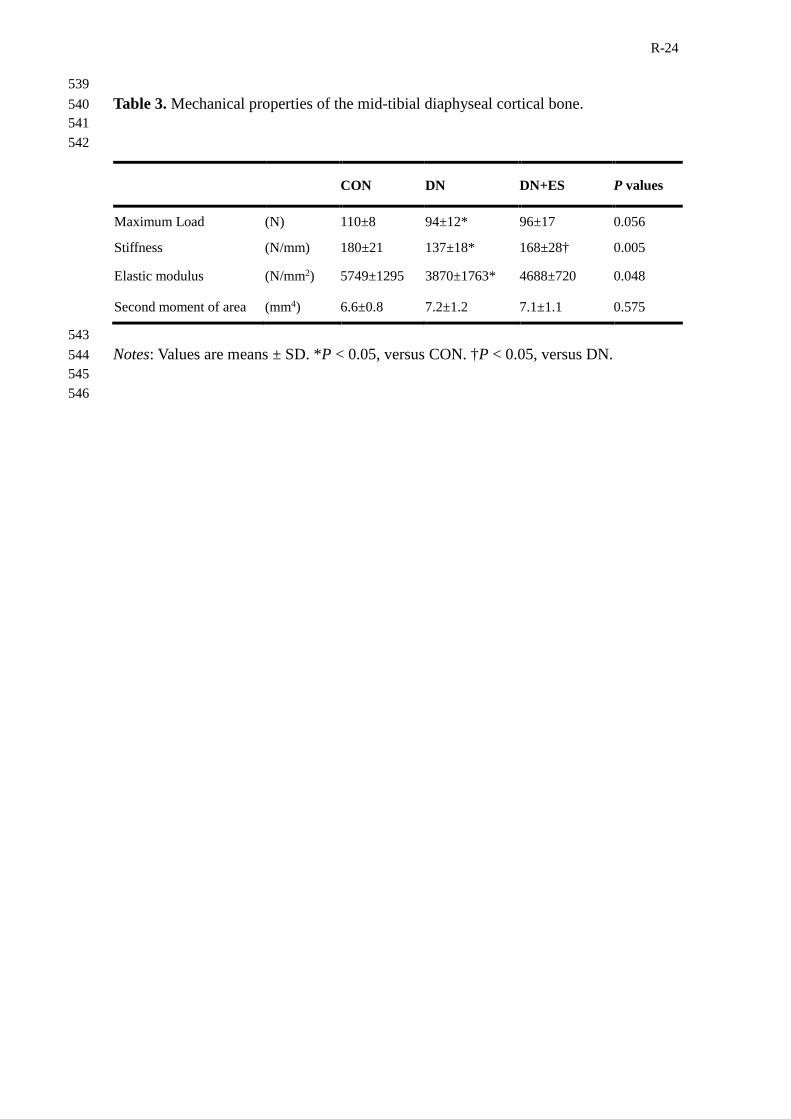
R-24 539 Table 3. Mechanical properties of the mid-tibial diaphyseal cortical bone. 540 541 542
543 Notes: Values are means ± SD. *P < 0.05, versus CON. †P < 0.05, versus DN. 544 545 546
CON DN DN+ES P values
Maximum Load (N) 110±8 94±12* 96±17 0.056
Stiffness (N/mm) 180±21 137±18* 168±28† 0.005
Elastic modulus (N/mm2) 5749±1295 3870±1763* 4688±720 0.048
Second moment of area (mm4) 6.6±0.8 7.2±1.2 7.1±1.1 0.575

R-25 547 548
549
550 Figure 1. Intramuscular and surface EMG recordings from the denervated TA muscles 551 during sciatic nerve stimulation after 1 week of denervation. 552 553 554
R-26 555 556
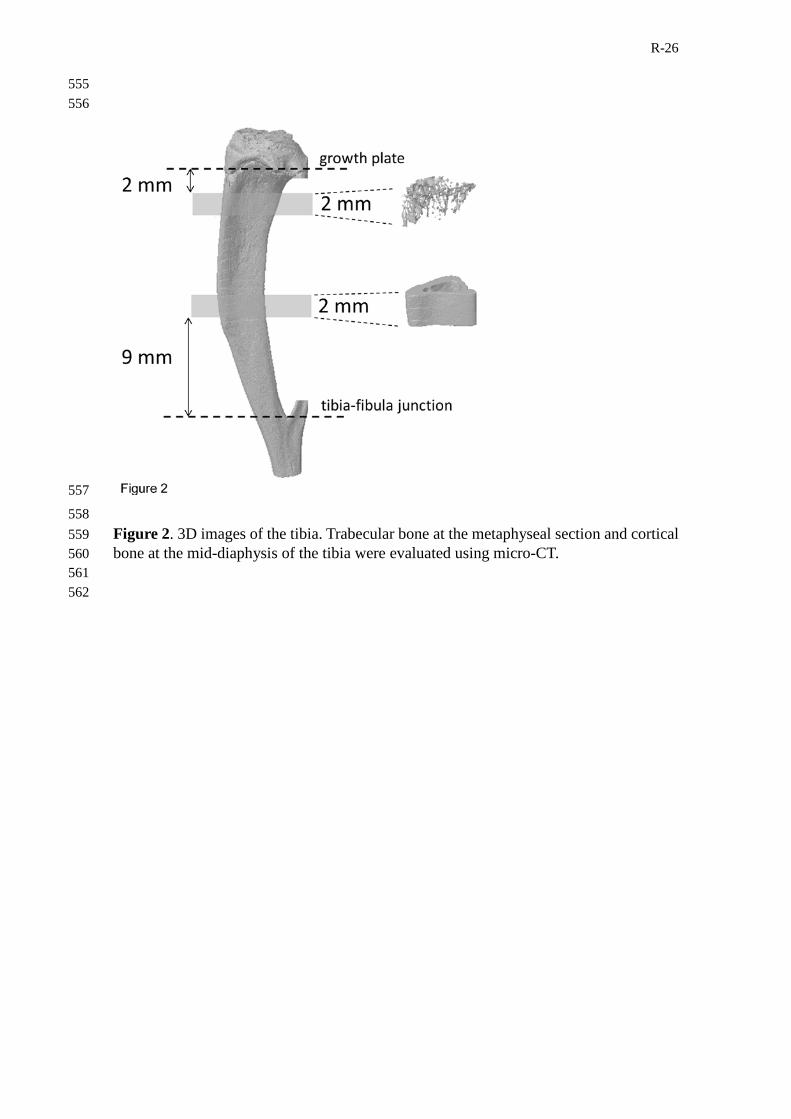
557
558 Figure 2. 3D images of the tibia. Trabecular bone at the metaphyseal section and cortical 559 bone at the mid-diaphysis of the tibia were evaluated using micro-CT. 560 561 562

R-27 563 564
565
566 567
Figure 3. Immunofluorescence photomicrographs of tibialis anterior (TA) muscles for 568
laminin (red) in the CON (A), DN (B), and DN+ES (C) groups, and quantification of 569
mean myofiber cross-sectional area (FCSA) (D) and muscle force (E). Bar 50 μm. *P < 570
0.05 vs. CON; †P < 0.05 vs. DN. (CON, control; DN, sciatic nerve denervation; DN+ES, 571
sciatic nerve denervation + electrical stimulation). 572
573 574

R-28 575
576 577
Figure 4. 3D images of trabecular bone at the analysis site of the tibiae (A), and the 578
trabecular bone volume fraction (BV/TV, B), trabecular thickness (Tb.Th, C), trabecular 579
number (Tb.N, D), connectivity density (Conn.D, E), and increased trabecular separation 580
(Tb.Sp, F). *P < 0.05 vs. CON; †P < 0.05 vs. DN. 581
582 583

R-29 584 585
586 587
Figure 5. Representative 3D images of the tibia mid-diaphysis from micro-CT (upper 588
panel) and representations of the load-displacement curves from CON, DN, and DN+ES 589
rat tibiae loaded by three-point bending (lower panel). (CON, control; DN, sciatic nerve 590
denervation; DN+ES, sciatic nerve denervation + electrical stimulation). 591
592 593