qut digital repository: user satisfaction: an overarching measure of enterprise system success...
TRANSCRIPT

QUT Digital Repository: http://eprints.qut.edu.au/
Sedera, Darshana and Tan, Felix (2005) User Satisfaction: An Overarching Measure of Enterprise System Success. In: Pacific Asia Conference on Information Systems, 7-10 July, Bangkok, Thailand.
© Copyright 2005 Darshana Sedera and Felix Tan
PACIS Proceedings
PACIS 2005 Proceedings
Association for Information Systems Year
User Satisfaction: An Overarching
Measure of Enterprise System Success
Darshana Sedera∗ Felix Tan†
∗Queensland University of Technology†Queensland University of Technology
This paper is posted at AIS Electronic Library (AISeL).
http://aisel.aisnet.org/pacis2005/80
963
User Satisfaction: An Overarching Measure of Enterprise System Success
Darshana Sedera
School of Information Systems Queensland University of Technology
Brisbane, Australia [email protected]
Felix Ter Chian Tan School of Information Systems
Queensland University of Technology Brisbane, Australia [email protected]
Abstract
User Satisfaction is one of the most extensively used dimensions for Information Systems (IS) success evaluation with a large body of literature and standardized instruments of User Satisfaction. Despite the extensive literature on User Satisfaction, there exist much controversy over the measures of User Satisfaction and the adequacy of User Satisfaction measures to gauge the level of success in complex, contemporary IS. Recent studies in IS have suggested treating User Satisfaction as an overarching construct of success, rather than a measure of success. Further perplexity is introduced over the alleged overlaps between User Satisfaction measures and the measures of IS success (e.g. system quality, information quality) suggested in the literature. The following study attempts to clarify the aforementioned confusions by gathering data from 310 Enterprise System users and analyzing 16 User Satisfaction instruments. The statistical analysis of the 310 responses and the content analysis of the 16 instruments suggest the appropriateness of treating User Satisfaction as an overarching measure of success rather a dimension of success. Keywords: User Satisfaction, Enterprise Systems, Information System Success Introduction
Information Systems (IS) investments are under increasing scrutiny and pressure to justify their value and contribution to the productivity, quality and competitiveness of organizations. The importance of assessing the value of IS, underpins key issues reported by organizational executives around the world (Ball and Harris 1982; Dickson et al. 1984; Brancheau and Whetherbe 1987). Despite the substantial investments made by organizations around the world in Enterprise Systems (ES1), systematic attempts to measure their success have been few (e.g. Davis 1989; Baer 1999; Deloitte Consulting 2000; Knowles et al. 2000; Shang and Seddon 2000; Sedera, et al. 2001). The impacts resulting from ES are arguably difficult to measure. An Enterprise System entails many users ranging from top executives to data entry operators; many applications that span the organization; and a diversity of capabilities and functionality. These contemporary IS characteristics (along with other issues discussed in the literature review
1 In this paper, the terms ERP, Enterprise Resource Planning and the more contemporary, Enterprise Systems (ES), are used interchangeably. See Klaus, et al. (2000). "What Is ERP?" Information Systems Frontiers 2(2): 141-162. for in depth discussion on ‘What is ERP?’

964
section) suggest that existing models of IS success (that were developed for a more traditional IS context) may not be entirely appropriate for measuring ES success.
User Satisfaction is possibly the most extensively used single measure for IS evaluation (e.g. Doll and Torkzadeh 1988; Igbaria and Nachman 1990; DeLone and McLean 1992; Gatian 1994; Etezadi-Amoli and Farhoomand 1996; Igbaria and Tan 1997). There exist several widely cited studies and standard instruments that measure User Satisfaction (e.g. Bailey and Pearson 1983; Baroudi and Orlikowski 1988; Doll and Torkzadeh 1988). Early User Satisfaction constructs (e.g. User Information Satisfaction - Bailey and Pearson 1983) have been found to mix measures of multiple dimensions of success (e.g. System Quality and Individual Impact) rather than ‘Satisfaction’ in isolation. The lack of agreement of the treatment of User Satisfaction dimension has led to inconsistent and perplexing results in IS evaluations.
This paper attempts to minimize the confusion of the employment of User Satisfaction as a construct of IS success by gathering and analyzing data from 310 responses from twenty-seven Australian State Government Agencies that implemented SAP R/3 in the late 1990s and analyzing 16 User Satisfaction instruments.
Impacts
SurveyMapping
Opera-tionalize
Impacts
A Priori
Model
Round 2
Survey
Instrument
WeightsSurvey
Weights
DescriptiveStatistics
Cleaned &
Described
Data
ModelTesting
Validated
Model
Literature
Review
Models &
Frame-
works
Model Building(the exploratory survey)
Model Testing(the confirmatory survey)
Round 1
Survey
Instrument
Co
nte
nt
An
aly
sis
Mapping
ES
Success
Items
Literature
ReviewDistillation
Content Analysis
Preliminary
Satisfaction
Items
Final
Satisfaction
Items
Measures
of
Satisfaction
Measures
of
Success
Analysis
Sta
tisti
cal A
naly
sis
Impacts
SurveyMapping
Opera-tionalize
Impacts
A Priori
Model
Round 2
Survey
Instrument
WeightsSurvey
Weights
DescriptiveStatistics
Cleaned &
Described
Data
ModelTesting
Validated
Model
Literature
Review
Models &
Frame-
works
Model Building(the exploratory survey)
Model Testing(the confirmatory survey)
Round 1
Survey
Instrument
Co
nte
nt
An
aly
sis
Mapping
ES
Success
Items
Literature
ReviewDistillation
Content Analysis
Preliminary
Satisfaction
Items
Final
Satisfaction
Items
Measures
of
Satisfaction
Measures
of
Success
Analysis
Sta
tisti
cal A
naly
sis
Figure 1: Research Design
The remainder of the paper proceeds as follows. First, a review of related literature is provided with a brief overview of IS success models and the usage, limitations and issues of User Satisfaction instruments. 16 of these instruments and their survey items were identified and extracted for the purpose of content analysis. Next the paper introduces and discusses the research methodology employed in the study which consists of two main phases: content analysis and statistical analysis, as depicted in Figure 1. The results of the content analysis, which essentially identifies the possible overlaps between IS Success and User Satisfaction, and the statistical evidence for treating User Satisfaction as an overarching measure is depicted next. The paper concludes with the summary findings, where the non-appropriateness of treating User Satisfaction as a dimension of IS success is discussed.
965
Literature Review
Models and Measures of IS Success Research assessing the success of Information Systems (IS) has been ongoing for nearly three decades (e.g. King and Rodriguez 1978; Rolefson 1978; Martin 1979; Myers et al. 1998). However, the scope and approach of these IS success evaluation studies has varied greatly, with little consensus on measures of IS success, thus complicating comparison of results across studies and confounding the establishment of a cumulative research tradition. The Delone and McLean (1992) IS success model is one of the most widely cited (Myers et al. 1998; Heo and Han 2003). Based on the work of Shannon and Weaver (1963) and Mason (1978), Delone and McLean proposed an IS success model that reflects the systematic combination of previously reported individual measures. The model is an attempt to represent the interdependent, process nature of six IS success constructs; (1) System Quality, (2) Information Quality, (3) Use, (4) User Satisfaction, (5) Individual Impact, and (6) Organizational Impact. While it is unclear whether the process paths proposed by Delone and McLean (1992) were originally intended to suggest causality, many researchers have sought to test these as causal paths and have found them to be broadly valid (e.g. Seddon and Kiew 1994; Rai et al. 2002). According to Seddon and Kiew (1994) and Myers et al. (1998), the main contributions Delone and McLean make to our understanding of IS evaluation are: (1) the constructs of the model provide a classification for the many IS evaluation measures reported in the prior literature, (2) their approach begins to identify relevant stakeholder groups in the process of evaluation, and (3) they suggest a model of interdependencies amongst the constructs. Myers et al (1998) bring together the Delone and McLean dimensions of IS success, with the notion of a contingency framework as developed by Saunders and Jones (1992). Rigorous research into ES success and benefits is sparse. Shang and Seddon (2000) introduced one of few existing ES benefits frameworks after completing in-depth case studies of four Australian utility companies. The Shang and Seddon framework classifies potential ERP benefits into 21 lower level measures organized around 5 main categories: Operational benefits, Managerial benefits, Strategic benefits, IT infrastructure benefits and Organizational benefits. Their framework has yet to be operationalised2. User Satisfaction as a dimension of Information System success User Satisfaction – defined as the “sum of one’s feeling’s or attitudes toward a variety of factors affecting that situation in a given situation” (Bailey and Pearson 1983) - is possibly the most extensively used single measure for IS evaluation (e.g. Delone and McLean, 1992; Doll and Torkzadeh, 1988; Etezadi-Amili and Farhoomand, 1996; Igbaria and Nachman, 1990; Igbaria and Tan, 1997; Gatian, 1994), with several widely cited studies and standard instruments3 that
2 Other frameworks that were considered but found to be less suitable include MIT’90s IT impacts framework by Allen, and Scott Morton (1994) and Balanced Scorecard by Kaplan and Norton (1992). 3 Instruments that rely on user Satisfaction, usage, user-involvement and user acceptance in measuring information system success are termed Satisfaction measurement instruments in this study.
966
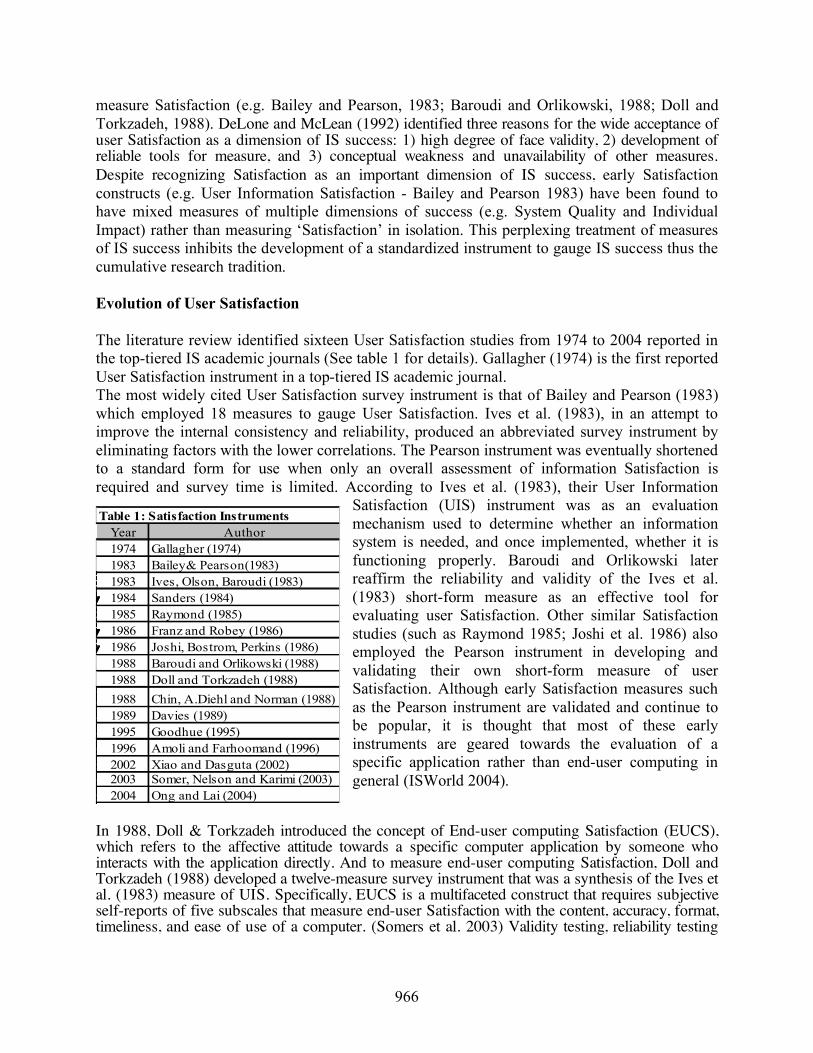
measure Satisfaction (e.g. Bailey and Pearson, 1983; Baroudi and Orlikowski, 1988; Doll and Torkzadeh, 1988). DeLone and McLean (1992) identified three reasons for the wide acceptance of user Satisfaction as a dimension of IS success: 1) high degree of face validity, 2) development of reliable tools for measure, and 3) conceptual weakness and unavailability of other measures. Despite recognizing Satisfaction as an important dimension of IS success, early Satisfaction constructs (e.g. User Information Satisfaction - Bailey and Pearson 1983) have been found to have mixed measures of multiple dimensions of success (e.g. System Quality and Individual Impact) rather than measuring ‘Satisfaction’ in isolation. This perplexing treatment of measures of IS success inhibits the development of a standardized instrument to gauge IS success thus the cumulative research tradition. Evolution of User Satisfaction The literature review identified sixteen User Satisfaction studies from 1974 to 2004 reported in the top-tiered IS academic journals (See table 1 for details). Gallagher (1974) is the first reported User Satisfaction instrument in a top-tiered IS academic journal. The most widely cited User Satisfaction survey instrument is that of Bailey and Pearson (1983) which employed 18 measures to gauge User Satisfaction. Ives et al. (1983), in an attempt to improve the internal consistency and reliability, produced an abbreviated survey instrument by eliminating factors with the lower correlations. The Pearson instrument was eventually shortened to a standard form for use when only an overall assessment of information Satisfaction is required and survey time is limited. According to Ives et al. (1983), their User Information
Satisfaction (UIS) instrument was as an evaluation mechanism used to determine whether an information system is needed, and once implemented, whether it is functioning properly. Baroudi and Orlikowski later reaffirm the reliability and validity of the Ives et al. (1983) short-form measure as an effective tool for evaluating user Satisfaction. Other similar Satisfaction studies (such as Raymond 1985; Joshi et al. 1986) also employed the Pearson instrument in developing and validating their own short-form measure of user Satisfaction. Although early Satisfaction measures such as the Pearson instrument are validated and continue to be popular, it is thought that most of these early instruments are geared towards the evaluation of a specific application rather than end-user computing in general (ISWorld 2004).
In 1988, Doll & Torkzadeh introduced the concept of End-user computing Satisfaction (EUCS), which refers to the affective attitude towards a specific computer application by someone who interacts with the application directly. And to measure end-user computing Satisfaction, Doll and Torkzadeh (1988) developed a twelve-measure survey instrument that was a synthesis of the Ives et al. (1983) measure of UIS. Specifically, EUCS is a multifaceted construct that requires subjective self-reports of five subscales that measure end-user Satisfaction with the content, accuracy, format, timeliness, and ease of use of a computer. (Somers et al. 2003) Validity testing, reliability testing
Year Author
1974 Gallagher (1974)
1983 Bailey& Pearson(1983)
1983 Ives, Olson, Baroudi (1983)
1984 Sanders (1984)
1985 Raymond (1985)
1986 Franz and Robey (1986)
1986 Joshi, Bostrom, Perkins (1986)
1988 Baroudi and Orlikowski (1988)
1988 Doll and Torkzadeh (1988)
1988 Chin, A.Diehl and Norman (1988)
1989 Davies (1989)
1995 Goodhue (1995)
1996 Amoli and Farhoomand (1996)
2002 Xiao and Dasguta (2002)
2003 Somer, Nelson and Karimi (2003)
2004 Ong and Lai (2004)
Table 1: Satisfaction Instruments
967
and confirmatory factor analysis of the EUCS instrument were conducted in other studies such as the Xiao and Dasgupta research in 2002 and Somers, Nelson and Karimi’s study in 2003. The Issues with Satisfaction Instruments Though Ives et al. (1983)’s User Information Satisfaction (UIS) measure and Doll and Torkzadeh's End-User Computing Satisfaction (EUCS) measure continue to be popular in gauging IS success, common consensus with the usage of the Satisfaction dimension and instruments is partial. Apart from the ancillary issues4 associated with the usage of Satisfaction construct in gauging IS success, the main issues in Satisfaction instruments: the treatment of user Satisfaction as a dimension of IS success remains unrequited. Early Satisfaction constructs (e.g. User Information Satisfaction - Bailey and Pearson 1983) have been found to mix measures of multiple dimensions of success (e.g. Quality and Impact) rather than ‘Satisfaction’. Not surprisingly, many survey items used in prior ‘Satisfaction-only’ studies were analyzed during operationalisation of this study model, and found to readily map into other constructs (e.g. System Quality, Information Quality). Melone (1990) introduces the notion that, though previously introduced instruments produce valid evaluations of IS effectiveness, there is no clear relationship established between system effectiveness and user Satisfaction (Melone, 1990). This view is consistent with the findings of Teo and Wong (1998), who, having studied the impact of IT investment and performance impact measures, concluded that Satisfaction was not a distinct dimension. Seddon (1997) asserts that the User Satisfaction measure is by definition, a measure of the net benefits perceived by the information system's stakeholders (individuals, groups of individuals, management of organizations, and society) and maintains that previously introduced user Satisfaction measures do not adequately measure this idealized construct. Furthermore, Rai et al. (2002) state that user Satisfaction in prior studies is been measured indirectly through Information Quality, System Quality and other variables in prior studies. Research methodology The research design, depicted in figure 1 illustrates two autonomously-associated phases: a content analysis and a statistical analysis. The content analysis was designed to identify the possible overlaps between the previously used Satisfaction survey items and the IS success measures. The content analysis: The content analysis consist of 1) identification of IS success and user Satisfaction surveys and associated survey items, 2) a distillation of appropriate IS success and user Satisfaction items and 3) a rigorous mapping of measures of User Satisfaction into the IS success measures to identify the possible overlaps between the two constructs (IS Success and Satisfaction). The literature review (summary reported next) identified 149 IS success instruments and 16 Satisfaction instruments. The 149 IS success instruments revealed 88 unique5 IS success measures and were arranged under the dimensions of the Delone and McLean (1992)
4 E.g. potential confusion between the organizational and the individual measures of Satisfaction, standardized treatment of multiple respondent cohorts 5 The 149 instruments and the 88 unique survey items are available upon request
968
IS success model (Information Quality, System Quality, Individual Impact, Organizational Impact and Use)6. The 16 Satisfaction instruments revealed a total of 282 measures7. In the next phase of the content analysis – distillation - all redundant IS success and user Satisfaction items were removed to generate a standardized set of items for the content analysis. The distillation process of the measures resulted 188 user Satisfaction items suitable for the mapping exercise. This research employs the text content analysis8 opposed to other types of content analyses9 reported by (Krippendorff 1980). Statistical Analysis: As depicted in Figure 1, the Statistical Analysis phase of the research design consists of two surveys. The dual survey approach similar to that proposed by (MacKenzie and House 1979) consisting of an exploratory ‘inventory’ survey to identify the salient success dimension and measures (model building), which are subsequently the focus of a second confirmatory ‘weights’ survey, for evaluating model validity (model testing). The data for both surveys were gathered from 27 public sector organizations in Queensland, Australia that had implemented SAP R/3 in the second half of the 1990s. It should be noted that the focus of this paper is not focused on the validity of the model derived; rather it focuses on the implications of the analysis on the treatment of User Satisfaction. For details of the Enterprise Systems Success Measurement model, please refer to (Gable et al. 2003; Sedera and Gable 2004).
Data Analysis This section discusses content and statistical analysis completed in this research. The discussion herein begins with the content analysis of the mapping of user Satisfaction measures on the IS-success dimensions: Individual Impact (II), Organizational Impact (OI), System Quality (SQ) and Information Quality (IQ). Content Analysis: As discussed earlier, the content analysis began with an exhaustive collection of 282 Satisfaction items and 120 information system success measures. Careful synthesis of these items resulted in 192 and 88 mutually exclusive, unique measures of Satisfaction and IS success respectively. In order to identify whether there are overlaps between the measures of IS success and User Satisfaction, the 192 measures were mapped into the corresponding measures of IS success. During the mapping exercise the researchers experienced uncertainties and a series of workshops were held between researchers resulting an agreement of items above Kippendorf’s (1980) inter-coder reliability of 70%10.
6 It should be noted that items pertained to SATISFACTION and the USE dimensions were dropped before the mapping exercise. The USE dimension was reported inappropriate for mandatory IS and the SATISFACTION dimension was dropped to avoid overlaps in the mapping exercise. 7 The 16 instruments and the 282 survey items are available upon request 8 The advantages of the text content analysis 1) the method is unobtrusive or not made obvious, 2) it is context sensitive and able to process symbolic forms, 3) it can cope with large volumes of data and the data generated by content analyses can quickly exceed what a single analyst can do (Krippendorf, 1980) 9 Other alternatives for text analysis were considered for this study, including 1) grounded theory (Glaser & Strauss, 1967) and 2) narrative analysis (Manning & Cullum-Swan, 1994). Grounded theory does not fit as a theoretical framework already exists and narrative analysis was not adopted, as the structure of documents to be analyzed is not in the form of stories or metaphors as required by the method. 10 Inter-coder reliability is the widely used term for the extent to which independent coders evaluate a characteristic of a message or artifact and reach the same conclusion. Coefficients of .90 or greater are nearly always acceptable,
969
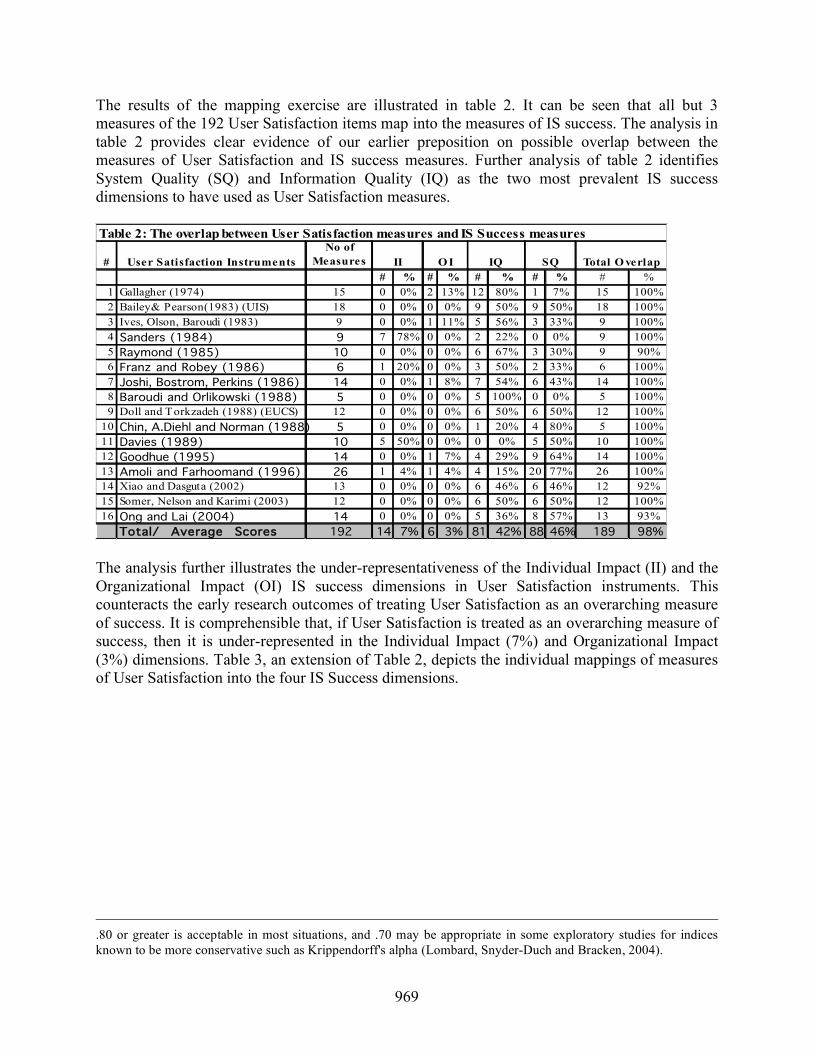
The results of the mapping exercise are illustrated in table 2. It can be seen that all but 3 measures of the 192 User Satisfaction items map into the measures of IS success. The analysis in table 2 provides clear evidence of our earlier preposition on possible overlap between the measures of User Satisfaction and IS success measures. Further analysis of table 2 identifies System Quality (SQ) and Information Quality (IQ) as the two most prevalent IS success dimensions to have used as User Satisfaction measures.
# User Satisfaction Instruments
No of
Measures
# % # % # % # % # %
1 Gallagher (1974) 15 0 0% 2 13% 12 80% 1 7% 15 100%
2 Bailey& Pearson(1983) (UIS) 18 0 0% 0 0% 9 50% 9 50% 18 100%
3 Ives, Olson, Baroudi (1983) 9 0 0% 1 11% 5 56% 3 33% 9 100%
4 Sanders (1984) 9 7 78% 0 0% 2 22% 0 0% 9 100%
5 Raymond (1985) 10 0 0% 0 0% 6 67% 3 30% 9 90%
6 Franz and Robey (1986) 6 1 20% 0 0% 3 50% 2 33% 6 100%
7 Joshi, Bostrom, Perkins (1986) 14 0 0% 1 8% 7 54% 6 43% 14 100%
8 Baroudi and Orlikowski (1988) 5 0 0% 0 0% 5 100% 0 0% 5 100%
9 Doll and Torkzadeh (1988) (EUCS) 12 0 0% 0 0% 6 50% 6 50% 12 100%
10 Chin, A.Diehl and Norman (1988) 5 0 0% 0 0% 1 20% 4 80% 5 100%
11 Davies (1989) 10 5 50% 0 0% 0 0% 5 50% 10 100%
12 Goodhue (1995) 14 0 0% 1 7% 4 29% 9 64% 14 100%
13 Amoli and Farhoomand (1996) 26 1 4% 1 4% 4 15% 20 77% 26 100%
14 Xiao and Dasguta (2002) 13 0 0% 0 0% 6 46% 6 46% 12 92%
15 Somer, Nelson and Karimi (2003) 12 0 0% 0 0% 6 50% 6 50% 12 100%
16 Ong and Lai (2004) 14 0 0% 0 0% 5 36% 8 57% 13 93%
Total/ Average Scores 192 14 7% 6 3% 81 42% 88 46% 189 98%
Total O verlap
Table 2: The overlap between User Satisfaction measures and IS Success measures
II IQ SQO I
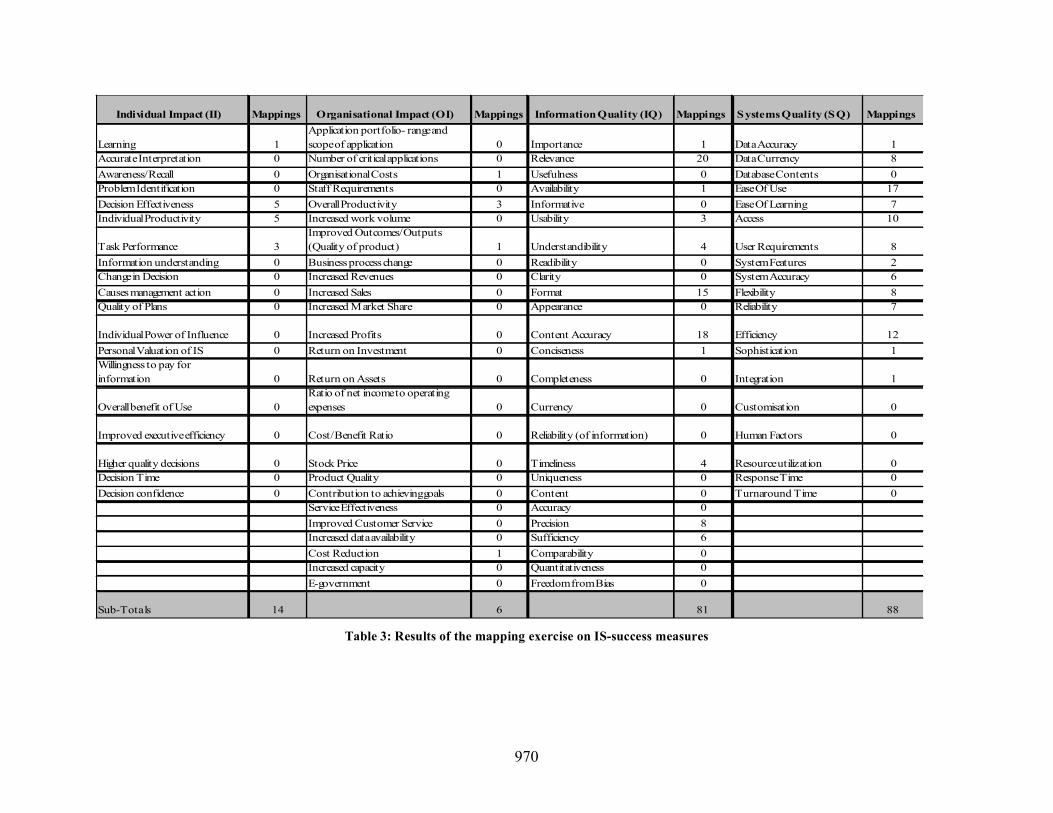
The analysis further illustrates the under-representativeness of the Individual Impact (II) and the Organizational Impact (OI) IS success dimensions in User Satisfaction instruments. This counteracts the early research outcomes of treating User Satisfaction as an overarching measure of success. It is comprehensible that, if User Satisfaction is treated as an overarching measure of success, then it is under-represented in the Individual Impact (7%) and Organizational Impact (3%) dimensions. Table 3, an extension of Table 2, depicts the individual mappings of measures of User Satisfaction into the four IS Success dimensions.
.80 or greater is acceptable in most situations, and .70 may be appropriate in some exploratory studies for indices known to be more conservative such as Krippendorff's alpha (Lombard, Snyder-Duch and Bracken, 2004).
970
Individual Impact (II) Mappings Organisational Impact (OI) Mappings Information Quality (IQ) Mappings Systems Quality (SQ) Mappings
Learning 1
Application portfolio- range and
scope of application 0 Importance 1 Data Accuracy 1
Accurate Interpretation 0 Number of critical applications 0 Relevance 20 Data Currency 8
Awareness/ Recall 0 Organisational Costs 1 Usefulness 0 Database Contents 0
Problem Identification 0 Staff Requirements 0 Availability 1 Ease Of Use 17
Decision Effectiveness 5 Overall Productivity 3 Informative 0 Ease Of Learning 7
Individual Productivity 5 Increased work volume 0 Usability 3 Access 10
Task Performance 3
Improved Outcomes/ Outputs
(Quality of product) 1 Understandibility 4 User Requirements 8
Information understanding 0 Business process change 0 Readibility 0 System Features 2
Change in Decision 0 Increased Revenues 0 Clarity 0 System Accuracy 6
Causes management action 0 Increased Sales 0 Format 15 Flexibility 8
Quality of Plans 0 Increased Market Share 0 Appearance 0 Reliability 7
Individual Power of Influence 0 Increased Profits 0 Content Accuracy 18 Efficiency 12
Personal Valuation of IS 0 Return on Investment 0 Conciseness 1 Sophistication 1
Willingness to pay for
information 0 Return on Assets 0 Completeness 0 Integration 1
Overall benefit of Use 0
Ratio of net income to operating
expenses 0 Currency 0 Customisation 0
Improved executive efficiency 0 Cost/ Benefit Ratio 0 Reliability (of information) 0 Human Factors 0
Higher quality decisions 0 Stock Price 0 Timeliness 4 Resource utilization 0
Decision Time 0 Product Quality 0 Uniqueness 0 Response Time 0
Decision confidence 0 Contribution to achieving goals 0 Content 0 Turnaround Time 0
Service Effectiveness 0 Accuracy 0
Improved Customer Service 0 Precision 8
Increased data availability 0 Sufficiency 6
Cost Reduction 1 Comparability 0
Increased capacity 0 Quantitativeness 0
E-government 0 Freedom from Bias 0
Sub-Totals 14 6 81 88 Table 3: Results of the mapping exercise on IS-success measures
971
Of the results depicted in table 3 above, it can be seen that the most prevalent ES success measures used in User Satisfaction studies include: 1) Information Relevance (20 citations), Content Accuracy (18 citations), Ease of Use (17 citations), Format (15 citations), System Efficiency (12 citations) and Access to the System (10 citations). The analysis of the User Satisfaction measures lead to the identification of 3 unique User Satisfaction measures: 1) Satisfaction with the system (Xiao and Dasgupta, 2002), 2) Overall Satisfaction (Ong and Lai 2004) and 3) Enjoyment with the system (Raymond 1985). The researchers created a new Satisfaction question based on the directions of Delone and Mclean (1991) to gauge the Information Satisfaction (similar to the Satisfaction with the system). These four measures - treated as unique Satisfaction measures - were added to the derivation of the a priori ES success model discussed below. However, as indicated previously, the User Satisfaction construct was included in the a priori model with some trepidation. Statistical Analysis: The Enterprise Systems (ES) Success Measurement Model derived here is the first comprehensive empirical, quantitative assessment of ES success reported in the academic press (Gable et al. 2003; Sedera and Gable 2004). The ES success measurement model was derived from a three-round survey analyzing 600 responses11. The final validated study model employed 27 measures of ES success arranged under four dimensions: information quality, system quality, individual impact and organizational impact (Gable at al. 2003). This model was validated for multiple employment cohorts, (strategic managers, business managers, operations staff and technical personal) and multiple organizational sizes (small and large organizations). The 88 items of IS success identified and employed in the content analysis were curtailed in the final weights survey instrument and was designed to operationalize 41 measures representing Information Quality, System Quality, Individual Impact and Organizational Impact (See discussion in Gable Sedera and Chan 2003). Where possible, corresponding question items were drawn from previously validated instruments, and adapted to the current study context and the respondent cohorts. Items were scored on a seven-point likert scale with the end values (1) ‘Strongly disagree’ and (7) ‘Strongly Agree’, and the middle value (4) ‘Neutral’. The draft survey instrument was pilot tested with a selected sample of staff of the Queensland Government Treasury Department. Feedback from the pilot round respondents resulted in minor modifications to survey items. Dissemination of the survey instrument was through a (i) Web survey facility, and (ii) MS Word instrument attached to email. Three hundred and ten valid responses were received (9 were not included in the analysis due to missing data or perceived frivolity).
Following the weights survey, the study model and related instrument items were tested for construct and criterion validity and reliability. The 41 items were included in an exploratory factor analysis. In order to attain a more interpretable and parsimonious factor solution, of the 15 System Quality items and 10 Information Quality items, 6 and 4 items were dropped respectively. The inclusion of the User Satisfaction items in the main factor analysis had them 11 The impacts and weights surveys received 447 responses. Sedera and Gable (2004) gathered additional 153 new responses to test the ES success measurement model using confirmatory statistical analyses. The latter survey did not employ User Satisfaction items and thus will not be discussed here.
972
loading along with the System Quality items. This was not surprising considering that System Quality was the first factor extracted, explaining a full 50% of the model variance (both before and after ultimately excluding the User Satisfaction items)12. Given our earlier reservations and discussion of the content analysis regarding the User Satisfaction construct, it thus appeared logical that the User Satisfaction items load on that factor which explained most of the factor model variance. On the basis of our proposition that User Satisfaction is not a dimension of success, we excluded the User Satisfaction items from the exploratory factor analysis, which resulted in a clean and logical four factor solution (Gable, Sedera and Chan, 2003), with all items loading as anticipated explaining 67% of model variance, with all factors having Cronbach Alphas >0.9.
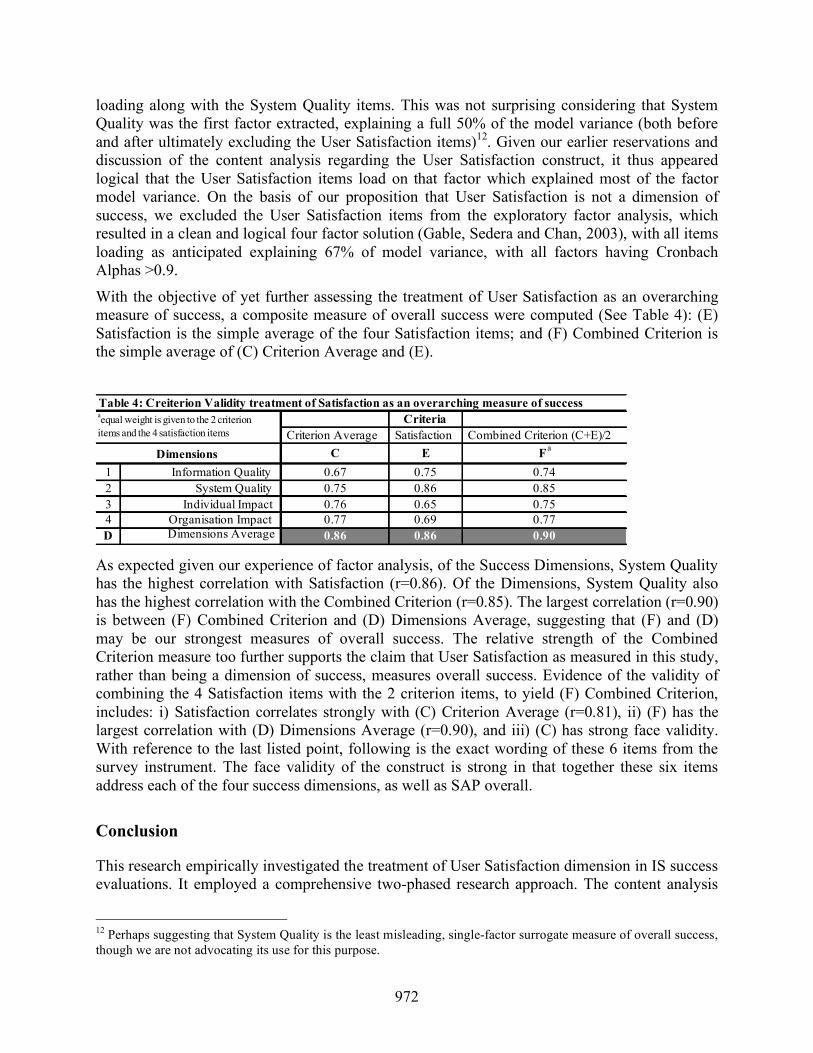
With the objective of yet further assessing the treatment of User Satisfaction as an overarching measure of success, a composite measure of overall success were computed (See Table 4): (E) Satisfaction is the simple average of the four Satisfaction items; and (F) Combined Criterion is the simple average of (C) Criterion Average and (E).
Criteria
Criterion Average Satisfaction Combined Criterion (C+E)/2
C E Fa
1 Information Quality 0.67 0.75 0.74
2 System Quality 0.75 0.86 0.85
3 Individual Impact 0.76 0.65 0.75
4 Organisation Impact 0.77 0.69 0.77
D Dimensions Average 0.86 0.86 0.90
Dimensions
aequal weight is given to the 2 criterion
items and the 4 satisfaction items
Table 4: Creiterion Validity treatment of Satisfaction as an overarching measure of success
As expected given our experience of factor analysis, of the Success Dimensions, System Quality has the highest correlation with Satisfaction (r=0.86). Of the Dimensions, System Quality also has the highest correlation with the Combined Criterion (r=0.85). The largest correlation (r=0.90) is between (F) Combined Criterion and (D) Dimensions Average, suggesting that (F) and (D) may be our strongest measures of overall success. The relative strength of the Combined Criterion measure too further supports the claim that User Satisfaction as measured in this study, rather than being a dimension of success, measures overall success. Evidence of the validity of combining the 4 Satisfaction items with the 2 criterion items, to yield (F) Combined Criterion, includes: i) Satisfaction correlates strongly with (C) Criterion Average (r=0.81), ii) (F) has the largest correlation with (D) Dimensions Average (r=0.90), and iii) (C) has strong face validity. With reference to the last listed point, following is the exact wording of these 6 items from the survey instrument. The face validity of the construct is strong in that together these six items address each of the four success dimensions, as well as SAP overall. Conclusion
This research empirically investigated the treatment of User Satisfaction dimension in IS success evaluations. It employed a comprehensive two-phased research approach. The content analysis
12 Perhaps suggesting that System Quality is the least misleading, single-factor surrogate measure of overall success, though we are not advocating its use for this purpose.
973
of the study analyzed 88 IS success measures and 192 User Satisfaction measures. Furthermore, data was gathered from 310 respondents representing 27 organizations for an empirical investigation. The content analysis identified significant overlaps between prior User Satisfaction instruments and the measures of IS success, illustrating that User Satisfaction dimension, given a complete set of IS success measures, is redundant. The inclusion of redundant success dimensions and measures to gauge IS success may lead to perplexing results and will hinder the application of these findings. The content analysis identified three broad User Satisfaction measures that may be treated as overarching measures of IS success. The three measures, together with another newly created measure, were included in to the empirical investigation. The initial exploratory factor analysis conducted with the 310 data, resulted in a four factor solution with User Satisfaction loading with the factor that had the highest variance (System Quality). It provided further evidence of the inappropriateness of treating User Satisfaction as a dimension of IS success. Further investigation using criterion validity revealed the appropriateness of treating User Satisfaction as an overarching measure of IS success, rather than a dimension of IS success. Given past IS success studies have lacked theoretical grounding and the selection of model dimensions and measures, this study provides guidelines on the selection and the appropriateness of the existing, popular IS success dimensions.
References
Allen, T. J., and Morton, M. S. Information Technology and the Corporation of the 1990's, Oxford University Press, New York, 1994. Amoli, J.E., and Farhoomand, A.F “A Structural Model of End User Computing Satisfaction and
User Performance,” Information & Management, (30), 1996, pp. 65-73 Baer, T. "Finding Value In All The Right Places," Manufacturing Systems (17:11), 1999, pp. 28. Bailey, J. E., and Pearson S. W. "Development of a Tool for Measuring and Analyzing Computer
User Satisfaction," Management Science (29:5) 1983, pp. 530-545. Ball, L., and Harris, R. "SMIS Members: A Membership Analysis," MIS Quarterly (6:1), 1982,
pp. 19-38. Baroudi, J. J., and Orlikowski, W. J. "A Short-Form Measure Of User Information Satisfaction:
A Psychometric Evaluation And Notes On Use," Journal of Management Information Systems (4:4), 1988, pp. 44-59.
Brancheau, J., and Whetherbe, J. "Key Issues In Information Technology Management," MIS Quarterly (11:1), 1987, pp. 23-45.
Chin, J.P., A.Diehl, V., and Norman, K.L. “Development of an Instrument measuring User Satisfaction of Human-Computer Interface”, Department of Psychology, University of Maryland, College Park, USA, (88:4), 1988, pp. 213-218
Davis, F. D. "Perceived Usefulness, Perceived Ease Of Use, And User Acceptance Of Information Technology," MIS Quarterly (13:3), 1989, pp. 319-340.
Deloitte Consulting, "ERP's Second Wave: Maximizing The Value of ERP-Enabled Processes," 2000 (available online at http://www.dc.com/Insights/research/cross_ind/erp_second_wave_global.asp?pageaction=printable).
DeLone, W. H., and McLean, E. R. "Information Systems Success: The Quest For The Dependent Variable." Information Systems Research (3:1), 1992, pp. 60-95.
974
Dickson, G., Leitheiser, R. L., Nechis, M., and Wetherbe, J. "Key information systems issues for the 1980's." MIS Quarterly (8:3), 1984, pp. 135-148.
Doll, W. J., and Torkzadeh, G. "The Measurement of End-User Computing Satisfaction," MIS Quarterly (12:2), 1988, pp. 259-274.
Etezadi-Amoli, J., and Farhoomand, A. F. "A Structural Model of End User Computing Satisfaction and User Performance," Information & Management (30:2), 1996, pp. 65-73.
Franz, C. R., and Robey, D. “Organizational Context, User Involvement, and Usefulness of Information Systems,” Decision Science, (17:3), 1986, pp. 329-356
Gable, G., Sedera, D., and Chan, T. "Enterprise Systems Success: A Measurement Model," Proceedings of the 24th International Conference on Information Systems, Seattle, Washington, Association for Information Systems, 2003.
Gallagher, C. A. “Perceptions of the value of a Management Information System,” Acad. Management, (17:1), 1974.
Gatian, A. W. "Is User Satisfaction a Valid Measure of System Effectiveness," Information and Management (26:3), 1994, pp. 119-131.
Goodhue, D.L. "Task-Technology Fit and Individual Performance," MIS Quarterly, (19:2), 1995, pp.213-236
Heo, J., and Han, I. "Performance Measure of Information Systems (IS) In Evolving Computing Environments: An Empirical Investigation." Information & Management (40:4), 2003, pp. 243-256.
Igbaria, M., and Nachman, S. A. "Correlates of User Satisfaction With End User Computing: An Exploratory Study," Information and Management (19:2), 1990, pp. 73-82.
Igbaria, M., and Tan, M. "The Consequences of Information Technology Acceptance on Subsequent Individual Performance," Information and Management (32:3), 1997, pp. 113-121.
ISWorld, "Information Systems Effectiveness: User Satisfaction, Association for Information Systems," 2004, (available online at http://business.clemson.edu/ISE/html/user_satisfaction.html)
Ives, B., Olson, M. H., and Baroudi, J. J. "The Measurement Of User Information Satisfaction," Communications of the ACM (26:10), 1983, pp. 785-793.
Joshi, K., Bostrom, R. P., Perkins, W.C. "Some New Factors Influencing User Information Satisfaction: Implications For Systems Professionals," Proceedings of The 22nd Annual Computer Personnel Research Conference, Calgary, Canada, (86), 1986, pp. 27-42.
Kaplan, R. S., and Norton, D. P. "The Balanced Scorecard - Measures That Drive Performance," Harvard Business Review (70:1), 1992, pp. 71-79.
King, W. R. and Rodriguez, J. I. "Evaluating Management Information Systems," MIS Quarterly (2:3), 1978, pp. 43-51.
Klaus, H., Rosemann, M., and Gable, G. "What Is ERP?" Information Systems Frontiers (2:2), 2000, pp. 141-162.
Knowles, H., Fotos, S., and Henry, N. "Q&A from the Internet: Implementing SAP," The Controllers Update (184), 2000, pp. 3-4.
Krippendorff, K. Content Analysis: An Introduction to its Methodology, Beverly Hills, CA, Sage, 1980.
Lombard, M, Snyder-Duch, J. and Bracken, ‘Practical resources for assessing and reporting intercoder reliability in content analysis research projects,’ Mass Media &
975
Communication, Temple University, Philadelphia, PA, 2004, (available online at http://www.temple.edu/mmc/reliability/)
MacKenzie, K. D. and House, R. "Paradigm Development in the Social Sciences," Research in Organizations: Issues and Controversies, R. T. Mowday and R. M. Steers (eds), Goodyear Publishing, Santa Monica, CA, 1979, pp. 22-38.
Manning, P., and Cullum-Swan, B. Narrative, content, and Semiotic analysis. In N. Denzin and Y. Lincoln, The handbook of qualitative research. Thousand Oaks, CA, SAGE, 1994.
Martin, G. "What is the Value of Investment in Information Systems?" MIS Quarterly (3:3), 1979, pp. 5-34.
Mason, R. O. "Measuring Information Output: A Communication Systems Approach," Information & Management, (1:4), 1978, pp. 219-234.
Melone, N. P. "A Theoretical Assessment of the User-Satisfaction Construct." Management Science (36:1), 1990, pp. 76-91.
Myers, B. L., Kappelman, L. A., and Prybutok, V. R. A Comprehensive Model For Assessing The Quality And Productivity Of The Information Systems Function: Toward A Theory For Information Systems Assessment, Idea Group Publishing, Hershey, 1998, pp. 94-121.
Ong, C. S., and Lai, J. Y. "Developing an Instrument for Measuring User Satisfaction with Knowledge Management Systems," Proceedings of the 37th Hawaii International Conference on System Sciences, Big Island, Hawaii, 2004, pp. 1-10.
Rai, A., Lang, S. S. and Welker, R.B. "Assessing The Validity Of IS Success Models: An Empirical Test And Theoretical Analysis." Information Systems Research (13:1), 2002, pp. 50-69.
Raymond, L. "Organizational Characteristics and MIS Success in the Context of Small Business," MIS Quarterly (9:1), 1985, pp. 37-52.
Rolefson, J. F. "The DP Check-Up," Journal of System Management, (29:11), 1978, pp 38-48. Sanders, G. L. “MIS/DSS Success Measure,” Systems Objectives & Solutions (4), 1984, pp. 29-
34 Saunders, C. S., and Jones, J. W. "Measuring Performance of the Information Systems
Function," Journal of Management Information Systems (8:4), 1992, pp. 63-82. Seddon, P. B. "A Respecification and Extension of the DeLone and McLean Model of IS
Success." Information Systems Research (8:3), 1997, pp. 240-253. Seddon, P. B. and Kiew, M.Y. "A Partial Test and Development of the DeLone and McLean
Model of IS Success," Proceedings of the 15th International Conference on Information Systems, J.I. DeGross, S.L. Huff, and M.C. Munroe, Vancouver, Canada, 1994, pp.99-110
Sedera, D. and Gable, G. G. "A Factor and Structural Equation Analysis of the Enterprise Systems Success Measurement Model," Proceedings of the 25th International Conference on Information Systems, Washington DC, USA, 2004.
Sedera, D., Rosemann, M., Gable, G. "Using Performance Measurement Models For Benefit Realization With Enterprise Systems - The Queensland Government Approach," Proceedings of the 9th European Conference on Information Systems, S.Smithson, S. Klein, and G. J. Doukidis (eds.), Bled, Slovenia, 2001.
Shang, S. and Seddon, P. B. "A Comprehensive Framework For Classifying Benefits Of ERP Systems," Proceedings of the 6th Americas Conference on Information Systems, M. Chung (ed.), Long Beach, California, 2000, pp. 1005-1014.

976
Shannon, C. E. and Weaver, W. Mathematical Theory of Communication, University of Illinois Press, Urbana, IL, 1963.
Somers, T. M., Nelson, K., and Karimi, J. "Confirmatory Factor Analysis of the End-User Computing Satisfaction Instrument: Replication within an ERP Domain," Decision Sciences (34:3), 2003, pp. 595-621.
Strauss, A., and Corbin, J. Basics of qualitative research: Grounded theory procedures and techniques, Newbury Park, CA, Sage, 1990.
Teo, T. S. and Wong, P. K. "An Empirical Study of the Performance Impact of Computerization in the Retail Industry," Omega (26:5), 1998, pp. 611-621.
Xiao, L. and Dasgupta, S. "Measurement of User Satisfaction with Web-Based Information Systems: An Empirical Study," Proceedings of the 8th Americas Conference on Information Systems, Dallas, Texas, 2002, pp. 1149-1155.