quovadis project work package 6 – task 6.4 validation of prcen/ts 15413 (wi 343027) “methods for...
TRANSCRIPT
QUOVADIS ProjectWork Package 6 – Task 6.4
Validation of prCEN/TS 15413 (WI 343027) “Methods for the preparation of the test sample from the laboratory
sample”
Part 2 – Ruggedness testing
Aldo Giove – ENEL GEM Area Tecnica Ricerca – Brindisi (Italy)
Roma, 24 October 2007

2 /22
Devices for particle size reduction
Retsch SM 2000 Cutting Mill
Retsch SR 300 Rotor Beater Mill
Retsch ZM-1 Centrifugal Mill• Size reduction by cutting and
shearing forces
• Low speed low heating
• Final particle size depending on the grid/sieve installed; coarse to mid size cutting (order of magnitude: mm)
• Feed: soft, medium-hard, tough, elastic, fibrous materials
• Low to mid throughput
• Size reduction by hammering, impact and shear effects
• High speed some heating is developed during processing
• Final particle size depending on the grid/sieve installed; coarse to mid size cutting (order of magnitude: mm)
• Feed: soft, medium-hard; low performances on tough, elastic and fibrous materials
• Mid to high throughput
• Size reduction by high speed impact and shear effects
• High speed heating may be developed during processing, depending on the type of material
• Final particle size depending on the grid/sieve installed; mid to fine size cutting (order of magnitude: below mm)
• Feed: soft, medium-hard, brittle, fibrous materials
• Low throughput
First step Final step
or
3 /22
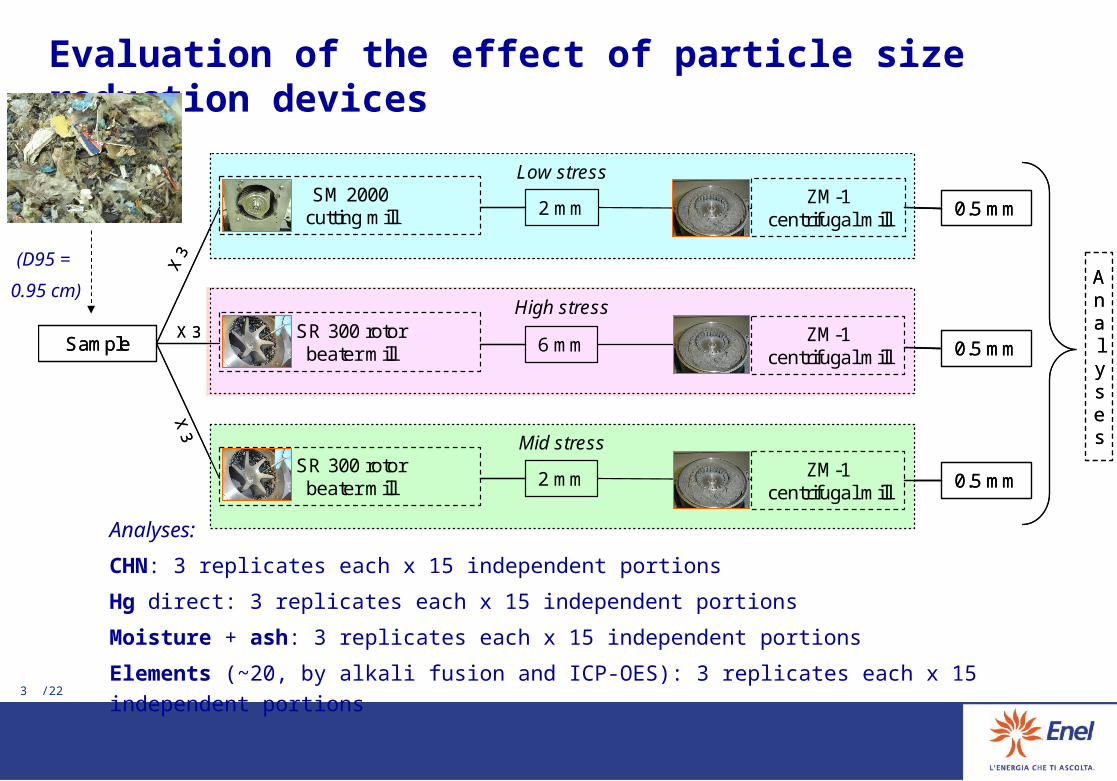
Evaluation of the effect of particle size reduction devices
Analyses:
CHN: 3 replicates each x 15 independent portions
Hg direct: 3 replicates each x 15 independent portions
Moisture + ash: 3 replicates each x 15 independent portions
Elements (~20, by alkali fusion and ICP-OES): 3 replicates each x 15 independent portions
Low stress
Mid stress
High stress
Sample
2 mmSM 2000
cutting mill
0.5 mm
0.5 mm
0.5 mm
X 3
X 3
X 3
A n a l y s e s
ZM-1 centrifugal mill
6 mmSR 300 rotorbeater mill
2 mmSR 300 rotorbeater mill
ZM-1 centrifugal mill
ZM-1 centrifugal mill
Low stress
Mid stress
High stress
Sample
2 mmSM 2000
cutting mill
0.5 mm
0.5 mm
0.5 mm
X 3
X 3
X 3
A n a l y s e s
ZM-1 centrifugal mill
6 mmSR 300 rotorbeater mill
2 mmSR 300 rotorbeater mill
ZM-1 centrifugal mill
ZM-1 centrifugal mill
(D95 =
0.95 cm)

4 /22
Sub-sampling for evaluation of ruggedness
16 sub-samples (A .. R) of about 50 g each were already been prepared from 1 kg of material (D95=0.95 cm).
Five of them (A, D, G, L, O) have previously been used for the verification of the statistical formula.
The other nine are used for evaluation of ruggedness:
B, C, E for low stress processing;
F, I, M, for mid stress processing;
P, Q, R for high stress processing.
Each sub-sample has been further divided in two aliquots for the different analytical procedures, one for CHN and Hg, the other for moisture, ash and elemental determination.
1000 g
500 g
500 g
250 g
250 g
125 g
125 g62.5 g
62.5 g
812.5 g
400 g 400 g
200 g 200 g
100 g 100 g
50 g 50 g 50 g 50 g
100 g 100 g
50 g 50 g 50 g 50 g
200 g 200 g
100 g 100 g
50 g 50 g 50 g 50 g
100 g 100 g
50 g 50 g 50 g 50 g
800 g=
A47.06
g
D49.13
g
G46.20
g
L57.18
g
I53.15 g
H M51.26
g
N O 51.75
g
P50.17 g
Q50.28 g
R43.70
g
F52.27
g
B48.1
g
C55.4
g
E35.3
g
Verification of statistical formula
LOW stress: SM2000 (2mm) ZM1 (0.5mm)
HIGH stress: SR300 (6mm) ZM1 (0.5mm)
MID stress: SR300 (2mm) ZM1 (0.5mm)

5 /22
Effect of particle size reduction device on municipal solid waste (QR-D): mass recovery rate
Recovery rate is more quantitative for cutting mill SM 2000 + centrifugal mill ZM 1 (“Low” stress
processing), while more of 15 % of the mass is lost (as dispersed dust) with the rotor beater mill SR 300 + centrifugal mill ZM 1(“Mid" but expecially “High” stress processing). Worst results have been shown by
“high” stress method.
• Definitley low stress processing shows the best recovery in both type of samples.
• The temperatures developed during Low stress treatment aren’t enought high to cause significat influences on the sample; mid- and expecially high-stress procedures could influence some volatile parameters (i.e. moisture). Low stress processing has the smallest influence on the samples characteristics.
SM 2000 - 2mm grid
ZM1 - 0.5mm grid SR 300 - 6mm grid
ZM1 - 0.5mm grid SR 300 - 2mm grid
ZM1 - 0.5mm grid
Low stress procedure
High stress procedure
Mid stress procedure
91,6185,24
75,5679,29
84,6581,18
0
10
20
30
40
50
60
70
80
90
100
Municipal solid waste(QR-D)
Demolition wood (QR-B)
rec
ov
ery
%

6 /22
0
20
40
60
80
100
120
140
Moi Ash Al Ba Ca Cr Cu Fe Hg K Mg Mn Na Si Sr Ti Zn
%R
SD
Low High Mid
Effect of particle size reduction device: macro-homogeneity on municipal solid waste sample
Analytical results performed on the different aliquots of sample have been used to evaluete the actual CV between the “macro” aliquots (homogeneity between the test portions of about 15 g each, obtained by combining results of “micro” aliquots of 1 g each).
A qualitative comparison of these values shows that for each parameter the variability between sub-sample (RSD%) is comparable and doesn’t show significant differences due to the processing.
Moi Ash Al Ba Ca Cr Cu Fe Hg K Mg Mn Na Si Sr Ti% % mg/Kg mg/Kg mg/Kg mg/Kg mg/Kg mg/Kg μg/Kg mg/Kg mg/Kg mg/Kg mg/Kg mg/Kg mg/Kg mg/Kg
AVG 2,25 14,00 20457 352,7 26954 155,1 1472,4 4198 476,8 5981 2815 109,1 3293 20164 47,0 1484RSD % 20,5 0,5 9,5 51,8 11,5 31,0 117,0 13,4 11,6 18,4 11,7 12,8 6,2 1,5 11,8 14,6
AVG 2,04 14,21 17932 299,4 23065 106,4 509,4 5134 488,3 4995 2368 97,9 3035 16919 37,5 1463RSD % 8,2 6,5 9,8 89,2 10,8 35,4 44,8 35,1 12,5 7,0 5,0 13,3 11,8 7,0 18,2 5,1
AVG 1,80 13,86 19258 504,3 25495 238,7 878,9 4647 474,5 5636 2522 104,6 3307 18532 53,3 1560RSD % 10,9 3,3 11,7 110,7 1,8 24,6 58,9 28,5 13,6 9,7 2,5 12,6 5,5 5,1 36,4 2,9
Hig
hM
idLo
w

7 /22
Effect of particle size reduction device: micro-homogeneity on municipal solid waste sample
0.0
5.0
10.0
15.0
20.0
25.0
Moi
Ash A
l
Ba
Ca Cr
Cu
Fe
Hg K
Mg
Mn
Na Si
Sr Ti
Zn
Mea
n o
f 3
RS
D%
fro
m15
rep
licat
es e
ach
Low
High
Mid
0.0
20.0
40.0
60.0
80.0
100.0
120.0
Cu
Mea
n o
f 3
RS
D%
fro
m15
rep
licat
es e
ach
Low
High
Mid
A qualitative comparison of the values shows that for each parameter the variability between test portions (RSD%) is comparable and doesn’t show significant differences due to the processing;
Copper values show extremely high
variability
Analytical results performed on the different aliquots of sample have been used to evaluete the actual CV between the “micro” aliquots (homogeneity between all the different test portions of about 1 g each)
8 /22
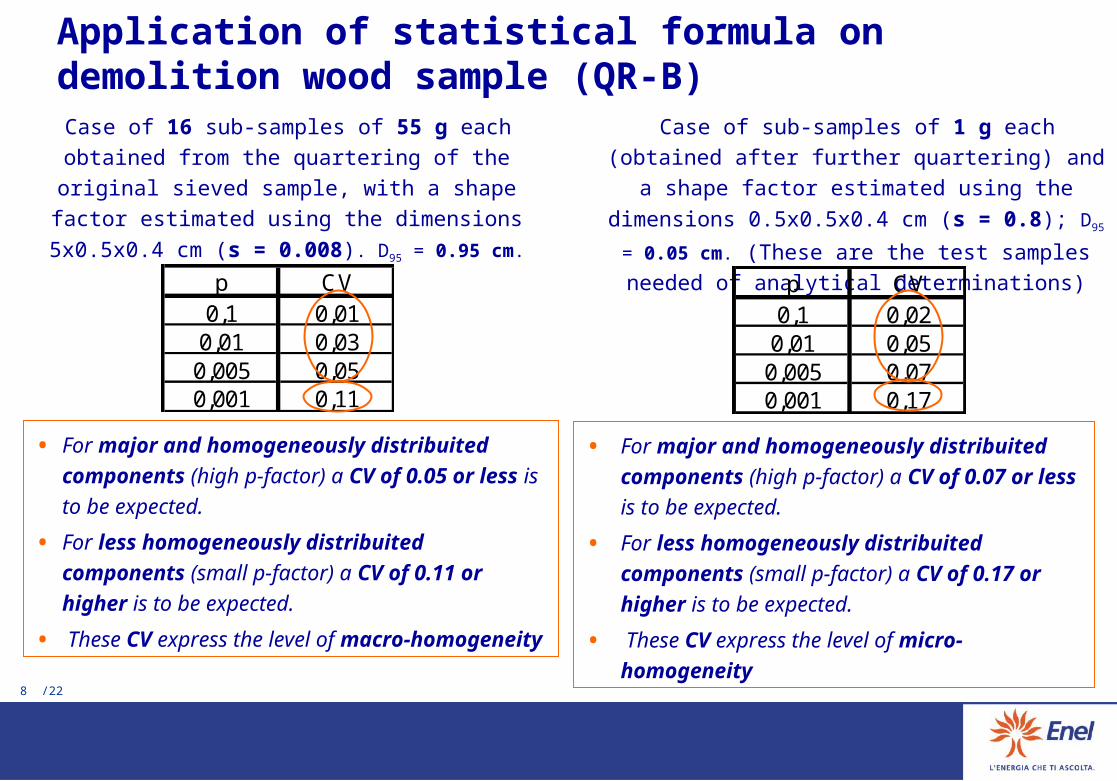
Application of statistical formula on demolition wood sample (QR-B)
Case of 16 sub-samples of 55 g each obtained from the quartering of the original sieved
sample, with a shape factor estimated using
the dimensions 5x0.5x0.4 cm (s = 0.008). D95
= 0.95 cm.
• For major and homogeneously distribuited components (high p-factor) a CV of 0.05 or less is to be expected.
• For less homogeneously distribuited components (small p-factor) a CV of 0.11 or higher is to be expected.
• These CV express the level of macro-homogeneity
p CV0,1 0,01
0,01 0,030,005 0,050,001 0,11
Case of sub-samples of 1 g each (obtained after further quartering) and a shape factor estimated using the dimensions 0.5x0.5x0.4
cm (s = 0.8); D95 = 0.05 cm. (These are the
test samples needed of analytical determinations)p CV0,1 0,02
0,01 0,050,005 0,070,001 0,17
• For major and homogeneously distribuited components (high p-factor) a CV of 0.07 or less is to be expected.
• For less homogeneously distribuited components (small p-factor) a CV of 0.17 or higher is to be expected.
• These CV express the level of micro-homogeneity

9 /22
Effect of particle size reduction device: macro-homogeneity and loss of volatiles on demolition wood sample
• For most parameters the variability is significantly affected by the processing: low stress procedure show generally lower variability compared to “high” and “mid” stress procedures.
• A notable exception regards Pb is due to a sub-sample that has a content ten times higher than all others of this element, explained by possible presence of a single “fragment” of highly contaminated wood.
RSD % macro-homogeneity
0
10
20
30
40
50
60
70
80
moi ash Al Ba Ca Cr Cu Fe K Mg Mn Na P Pb Si Ti Zn Hg
low
high
mid
moi ash Al Ba Ca Cr Cu Fe K Mg Mn Na P Pb Si Ti Zn Hg% % mg/kg mg/kg mg/kg mg/kg mg/kg mg/kg mg/kg mg/kg mg/kg mg/kg mg/kg mg/kg mg/kg mg/kg mg/kg μg/kg
AVG 7,27 1,80 334,0 98,8 1788 60,7 34,8 294,8 830,5 4588 72,5 241,6 78,5 46,2 1427 386,7 53,8 14,5RSD% 2,6 3,9 18,2 20,1 7,5 15,7 13,3 4,6 7,8 16,8 3,3 4,5 25,6 124,1 19,4 4,2 12,3 18,7AVG 6,23 1,71 221,8 68,3 1884 62,1 32,2 245,3 779,9 4882 75,0 245,5 66,1 14,3 885 316,9 56,3 11,2
RSD% 9,1 19,7 15,2 39,9 12,7 46,9 59,0 32,7 2,9 26,3 5,9 30,2 2,7 72,3 23,7 15,0 48,1 17,0AVG 6,28 2,09 277,03 117,3 2260 54,5 35,5 348,7 954,1 7004 77,5 342,3 86,3 15,4 1374 354,7 53,9 28,4
RSD% 4,7 24,3 24,4 39,0 9,5 44,0 63,2 28,0 7,5 32,9 6,5 29,1 12,8 13,3 24,4 25,3 43,0 71,3
low
high
mid
10 /22
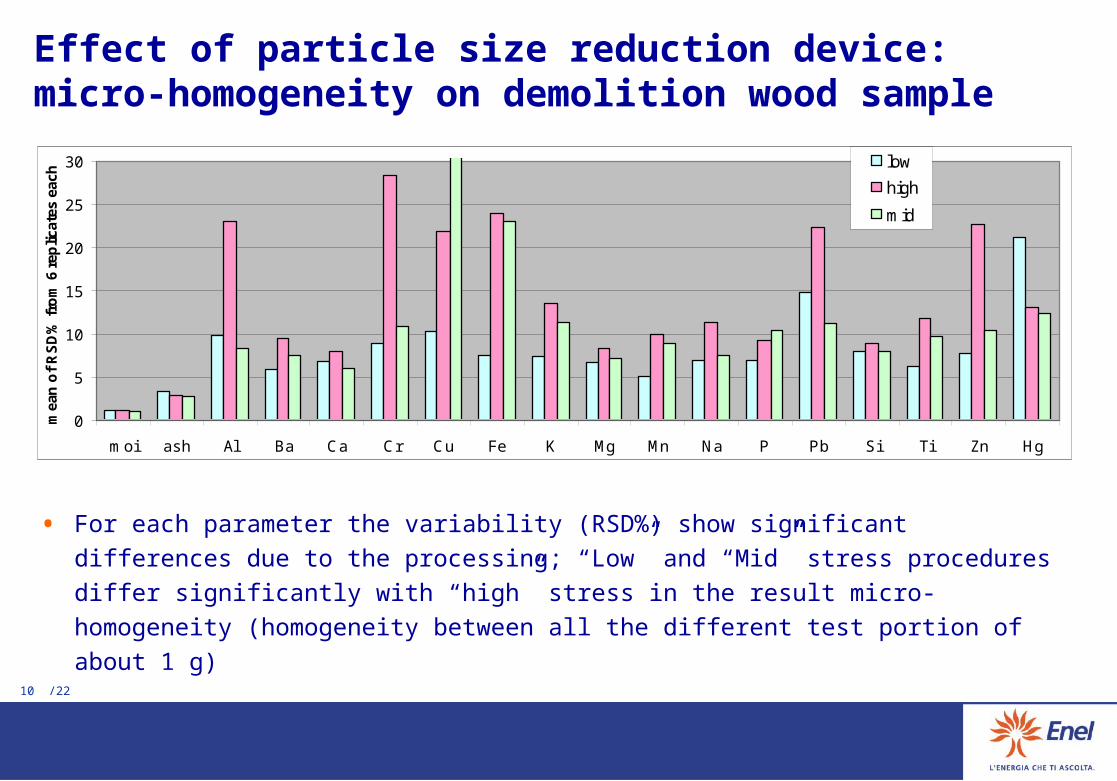
Effect of particle size reduction device:micro-homogeneity on demolition wood sample
0
5
10
15
20
25
30
moi ash Al Ba Ca Cr Cu Fe K Mg Mn Na P Pb Si Ti Zn Hg
mea
n o
f R
SD
% f
rom
6 r
eplic
ates
eac
h
low
high
mid
• For each parameter the variability (RSD%) show significant differences due to the processing; “Low” and “Mid” stress procedures differ significantly with “high” stress in the result micro-homogeneity (homogeneity between all the different test portion of about 1 g)

11 /22
Effect of particle size reduction device: loss of volatiles on demolition wood sample
Mid- and high- stress processing could lead to some loss of volatiles: moisture values are significantly different between the low-stress processed sample, (treated with cutting mill) and both other series of sample (treated with rotor beater mill)
QR-B demolition wood
0
1
2
3
4
5
6
7
8
% m
ois
ture
lowhighmid
Other parameters don’t show significant differences between low, mid and high stress treatments
12 /22
Considerations on effect of particle size reduction devices• Loss of analytes: volatile compounds (mainly moisture) can be lost due to the system used
for particle size reduction (this effect was not visible in the case of municipal solid waste, maybe due to the heterogeneity of sample that masks significant differences between the procedures). “Low stress” procedure gives higher recovery for moisture compared to the “mid” and “high-stress treatment. For all other parameters, differences between the three treatment procedures are due just to the intrinsic heterogeneity of the sample.
• Mass recovery: the “Low-stress” treatment procedure shows the best mass recovery (> 90%), while the “Mid” and “High” stress procedures perform somehow worse. This is due to the different particle size reduction technology used: the cutting mill used in the low-stress procedure develops less dust during processing compared to the rotor-beater mills, so it should be preferred when possible.
• Resulting micro-homogeneity and macro-homogeneity appear to be influenced in some way by the system used for particle size reduction (this effect was not visible in the case of municipal solid waste, maybe due to the heterogeneity of sample that masks significant differences between the procedures). Low stress procedure (cutting mill) gave slightly better results.
prCEN/TS 15413 ( upgrade to EN 15413)
The cutting mill used in the low-stress procedure shows generally better performances for particle size reduction of SRF compared to the rotor-beater mills, so it should be
preferred when possible.