quinacrine-induced autophagy in ovarian cancer triggers
TRANSCRIPT

cancers
Article
Quinacrine-Induced Autophagy in Ovarian Cancer TriggersCathepsin-L Mediated Lysosomal/Mitochondrial MembranePermeabilization and Cell Death
Prabhu Thirusangu 1,†, Christopher L. Pathoulas 1,†, Upasana Ray 1, Yinan Xiao 1,2, Julie Staub 1, Ling Jin 1,Ashwani Khurana 1 and Viji Shridhar 1,*
�����������������
Citation: Thirusangu, P.; Pathoulas,
C.L.; Ray, U.; Xiao, Y.; Staub, J.; Jin, L.;
Khurana, A.; Shridhar, V. Quinacrine-
Induced Autophagy in Ovarian
Cancer Triggers Cathepsin-L Mediated
Lysosomal/Mitochondrial Membrane
Permeabilization and Cell Death.
Cancers 2021, 13, 2004. https://
doi.org/10.3390/cancers13092004
Academic Editor:
Vanessa Soto-Cerrato
Received: 9 March 2021
Accepted: 17 April 2021
Published: 21 April 2021
Publisher’s Note: MDPI stays neutral
with regard to jurisdictional claims in
published maps and institutional affil-
iations.
Copyright: © 2021 by the authors.
Licensee MDPI, Basel, Switzerland.
This article is an open access article
distributed under the terms and
conditions of the Creative Commons
Attribution (CC BY) license (https://
creativecommons.org/licenses/by/
4.0/).
1 Department of Experimental Pathology and Medicine, Mayo Clinic, Rochester, MN 55905, USA;[email protected] (P.T.); [email protected] (C.L.P.); [email protected] (U.R.);[email protected] (Y.X.); [email protected] (J.S.); [email protected] (L.J.);[email protected] (A.K.)
2 Department of Obstetrics and Gynecology, The Second Xiangya Hospital, Central South University,Changsha 410008, China
* Correspondence: [email protected]† These authors contributed equally.
Simple Summary: Ovarian cancer (OC) is the most common cause of cancer-related deaths amongwomen worldwide, and its incidence has been increasing and has continued to prove resistant to avariety of therapeutics. This observation is principally disturbing given the amount of money investedin identifying novel therapies for this disease. A comparatively rapid and economical pipeline foridentification of novel drugs is drug repurposing. We reported earlier that the antimalarial drugQuinacrine (QC) also has anticancer activity and here we discovered that QC significantly upregulatescathepsin L (CTSL) and promoting autophagic flux in ovarian cancer. QC-induced CTSL activationpromotes lysosomal membrane permeability resulting in active CTSL release into the cytosol, whichpromotes Bid cleavage, mitochondrial membrane permeability, cytochrome-c release and cell deathin both in-vitro and in-vivo models. Therefore, QC is a promising candidate for OC treatment.
Abstract: We previously reported that the antimalarial compound quinacrine (QC) induces au-tophagy in ovarian cancer cells. In the current study, we uncovered that QC significantly upregulatescathepsin L (CTSL) but not cathepsin B and D levels, implicating the specific role of CTSL in promot-ing QC-induced autophagic flux and apoptotic cell death in OC cells. Using a Magic Red® cathepsin Lactivity assay and LysoTracker red, we discerned that QC-induced CTSL activation promotes lysoso-mal membrane permeability (LMP) resulting in the release of active CTSL into the cytosol to promoteapoptotic cell death. We found that QC-induced LMP and CTSL activation promotes Bid cleavage,mitochondrial outer membrane permeabilization (MOMP), and mitochondrial cytochrome-c release.Genetic (shRNA) and pharmacological (Z-FY(tBU)-DMK) inhibition of CTSL markedly reducesQC-induced autophagy, LMP, MOMP, apoptosis, and cell death; whereas induced overexpressionof CTSL in ovarian cancer cell lines has an opposite effect. Using recombinant CTSL, we identifiedp62/SQSTM1 as a novel substrate of CTSL, suggesting that CTSL promotes QC-induced autophagicflux. CTSL activation is specific to QC-induced autophagy since no CTSL activation is seen in ATG5knockout cells or with the anti-malarial autophagy-inhibiting drug chloroquine. Importantly, weshowed that upregulation of CTSL in QC-treated HeyA8MDR xenografts corresponds with attenua-tion of p62, upregulation of LC3BII, cytochrome-c, tBid, cleaved PARP, and caspase3. Taken together,the data suggest that QC-induced autophagy and CTSL upregulation promote a positive feedbackloop leading to excessive autophagic flux, LMP, and MOMP to promote QC-induced cell death inovarian cancer cells.
Keywords: quinacrine; autophagy; CTSL; LMP; MOMP; ovarian cancer
Cancers 2021, 13, 2004. https://doi.org/10.3390/cancers13092004 https://www.mdpi.com/journal/cancers

Cancers 2021, 13, 2004 2 of 20
1. Introduction
Ovarian cancer (OC) is the leading cause of death in women with gynecological ma-lignancy, resulting in an estimated 14,070 deaths in 2018 [1]. Although patients initiallyrespond to platinum-based therapies [2,3], a significant majority of patients are prone torelapse and poor prognosis [1,4,5]. The success rate for de novo ovarian cancer drugs fromPhase I trial to U.S. Food and Drug Administration and Likelihood of Approval was verylow (4.6%) from 2003 to 2011 [6]. Therefore, drug repurposing has developed into an attrac-tive approach for discovering new ovarian cancer therapeutics, since repurposed drugshave approved pharmaceuticals with known pharmacokinetic and safety profiles [7–9]. Theacridine derivative quinacrine (QC) has historically been used for malaria prophylaxis andtreatment but has recently been found to have new indications as an anticancer agent [10].QC has been reported to have cytotoxic potential in many different cancer types whileexhibiting limited toxicity toward normal cells [11–18]. Furthermore, QC has been shownto have multiple anticancer mechanisms and improve the cytotoxicity of other therapeuticagents (reviewed in [19]).
Previous work from our lab has shown that QC induces autophagy in OC cells andsensitizes chemoresistant cell lines to carboplatin and autophagic degradation of Skp2,which promotes p21 expression [18,20], but the molecular mechanism of QC-exhibitedautophagy is still unclear. Interestingly, recent work by the Karch group demonstrateda link between autophagic cell death and lysosomal membrane permeability (LMP) [21].Lysosomes are acidic organelles containing high amounts of hydrolytic enzymes thatare responsible for degrading macromolecules received from a variety of membrane-trafficking pathways including autophagy [22,23]. LMP releases lysosomal hydrolasesinto the cytoplasm, leading to aberrant degradation of cellular components. Importantly,the downstream pathways activated by LMP can be influenced by a variety of factorsand, while complete lysosomal rupture can lead to necrosis, partial rupture results inthe selective release of cathepsin proteases, which can induce both caspase-dependentand caspase-independent cell death [24–28]. Several cathepsin proteases that have beenimplicated in cell death include cathepsin B (CTSB), cathepsin D (CTSD), and cathepsinL (CTSL) [24]. Although cathepsins have long been thought to be unstable at neutralpH, they have been found to remain active at neutral pH for varying amounts of timeranging from minutes (cathepsin L [29]) to hours (cathepsin S [30]). Cleavage of Bidby cathepsins leads to mitochondrial outer membrane permeabilization (MOMP), andsubsequent release of cytochrome-c (cyt-c) into the cytoplasm [27,28,31] demonstrates theimportance of lysosomal–mitochondrial crosstalk in LMP-induced apoptosis [24].
Given the potential role of cathepsins, LMP, and MOMP in autophagic and apoptoticcell death, we decided to investigate the role of cathepsins in the crosstalk between LMPand MOMP in QC-induced autophagy to promote cytotoxicity. Our study revealed that QCspecifically upregulated CTSL activity (and not CTSB or D) more so in chemoresistant OCcells, warranting further examination of this phenomenon. We uncovered that QC-inducedCTSL upregulation promotes autophagic flux, LMP, and MOMP, resulting in autophagicand caspase-dependent cell death in ovarian cancer. The study findings offer new insightinto the cytotoxic mechanisms of QC and demonstrate the potential for targeting lysosomesin ovarian cancer.
2. Results2.1. QC Induces Cytotoxicity and Lysosomal Membrane Permeability (LMP) in Ovarian Cancer Cells
Given that QC is highly concentrated in lysosomes and LMP plays a role in autophagicand apoptotic cell death [21,24,32], we investigated whether QC induces LMP using Lyso-Tracker (Thermofisher, Waltham, MA, USA) red live cell stain. Initial exposure to both5 and 10 µM QC for 3, 6, 12 and 24 h in C13 and HeyA8-MDR cells showed loss of redfluorescent signal, indicating induction of LMP. QC (5 µM) was effective in inducing LMPin C13 and HeyA8-MDR cells as early as 3 and 6 h, respectively (Figure 1a,c). Figure 1b,dshows the quantitation of the red signal loss for C13 and HeyA8-MDR cells, respectively.

Cancers 2021, 13, 2004 3 of 20
Cytotoxic assessment of QC was validated by MTT assay (Methods Section 4.2), whichshowed cell viability was inhibited as early as 24 h of QC treatment at IC50 ~ 2.5–5 µM. QCshowed an enhanced sensitivity at 48 h treatment (Figure S1a,b).
Cancers 2021, 13, x 4 of 23
Figure 1. QC induces LMP by upregulating CTSL and its activity. C13 and HeyA8-MDR cells were exposed to QC at 5 µM concentration for 3, 6, 12, 24 h and labeled with LysoTracker red and Hoechst 33342, and LMP induction was assessed. Representative images of time-dependent effect of QC on LMP induction in (a) C13 cells and (b) HeyA8-MDR cells are presented. Graphical representation of QC-induced lysosomal disruption by quantifying the loss of red signal is provided for both (c) C13 and (d) HeyA8-MDR cells; (e) C13 and HeyA8-MDR cells were exposed to QC at 0, 2.5, 5, 10 µM concen-trations for 24 h and Western analysis was performed for CTSL, CTSB and CTSD expression. (f) Expression of CTSL was analyzed by q-PCR upon treatment of OV2008 and C13 cells with 5 and 10 µM QC for 24 h. (g) Western analysis of CTSL was performed under similar treatment condition and sensitization of the cells to QC treatment was estimated by Western analysis of cleaved PARP, LC3BII and p62/SQSTM1. Magic Red assay to measure CTSL activity upon QC treatment was performed in a dose-dependent manner with or without CTSL inhibitor Z-FY (tBU)-DMK in (h) C13 and (j) HeyA8-MDR cells (Scale bar 100µm and 40× magnification). (i) and (k) Fold change was calculated and plotted. Significance was ex-pressed as * p < 0.05, ** p < 0.01, *** p < 0.001. Abbreviations: CTSL: Cathepsin-L; CTSB: Cathepsin-B; CTSD: Cathepsin-D; LC3B: Light Chain 3B; PCNA: Proliferating cell nuclear antigen.
Figure 1. QC induces LMP by upregulating CTSL and its activity. C13 and HeyA8-MDR cells were exposed to QC at 5 µMconcentration for 3, 6, 12, 24 h and labeled with LysoTracker red and Hoechst 33342, and LMP induction was assessed.Representative images of time-dependent effect of QC on LMP induction in (a) C13 cells and (b) HeyA8-MDR cells arepresented. Graphical representation of QC-induced lysosomal disruption by quantifying the loss of red signal is provided forboth (c) C13 and (d) HeyA8-MDR cells; (e) C13 and HeyA8-MDR cells were exposed to QC at 0, 2.5, 5, 10 µM concentrationsfor 24 h and Western analysis was performed for CTSL, CTSB and CTSD expression. (f) Expression of CTSL was analyzed byq-PCR upon treatment of OV2008 and C13 cells with 5 and 10 µM QC for 24 h. (g) Western analysis of CTSL was performedunder similar treatment condition and sensitization of the cells to QC treatment was estimated by Western analysis ofcleaved PARP, LC3BII and p62/SQSTM1. Magic Red assay to measure CTSL activity upon QC treatment was performed ina dose-dependent manner with or without CTSL inhibitor Z-FY (tBU)-DMK in (h) C13 and (j) HeyA8-MDR cells (Scale bar100 µm and 40×magnification). (i) and (k) Fold change was calculated and plotted. Significance was expressed as * p < 0.05,** p < 0.01, *** p < 0.001. Abbreviations: CTSL: Cathepsin-L; CTSB: Cathepsin-B; CTSD: Cathepsin-D; LC3B: Light Chain 3B;PCNA: Proliferating cell nuclear antigen.

Cancers 2021, 13, 2004 4 of 20
2.2. QC Actuates CTSL Expression and Its Activity
To examine whether QC-induced LMP had an effect on lysosomal cathepsins, weanalyzed the effect of QC on CTSB, CTSD, and CTSL as these cathepsins are associated withLMP and cell death. Western blot analysis showed that in C13 and HeyA8MDR cells, QCspecifically upregulated CTSL but not CTSB or CTSD (Figure 1e and Figure S1c). q-PCR andimmunoblot analysis showed that both transcriptional (Figure 1f) and translational CTSL(>2 fold higher) were higher in the chemoresistant C13 (resistant to carboplatin/cisplatin)than in its chemo-sensitive counterpart OV2008 cells upon QC treatment (Figure 1g, panel 2and Figure S1d). C13 cells also displayed higher induction in the cleaved PARP, LC3BIIand degradation of p62/SQSTM1 compared to OV2008 cells (Figure 1g, panels 1, 5 and4, respectively).
To further validate the effect of QC on the activity of CTSL we used the Magic Red®
(ImmunoChemistry Technologies, Bloomington, IN, USA) CTSL live cell activity assay.When CTSL is active, the Magic Red substrate MR-FR2 is cleaved and the cresyl violetfluorophore will become fluorescent and, therefore, the increase in signal intensity reflectsincreased CTSL activity within the cell. A dose-dependent increase in CTSL activity wasfound upon QC treatment of C13 and HeyA8MDR cells (Figure 1h,j, panels 1–4), whichwas completely attenuated in the presence of Z-FY(tBU)-DMK (Figure 1h,j, panel 5), respec-tively. Quantification of the fold increase indicated that treatment of C13 and HeyA8MDRcells with 5 and 10 µM QC increased CTSL activity approximately 10-fold and 12-fold,respectively (Figure 1i,k), leading us to further examine the role of CTSL in QC-inducedcell death.
2.3. QC-Induced Cytotoxicity Is Mediated by CTSL Activity
To understand the role of lysosomal cathepsins in QC-mediated cytotoxicity, HeyA8-MDR cells were treated with Pepstatin A (CTSD inhibitor), CA-074Me (CTSB inhibitor)and Z-FY (tBU)-DMK (CTSL inhibitor) at indicated concentrations in the presence andabsence of 5 µM QC for 24 h and assessed by clonogenic assays, Annexin V/PI staining andWestern blot. The colony-forming ability of cells treated with 5 µM QC was significantlyinhibited compared to untreated cells (Figure 2a,d,g + QC). However, the addition of Z-FY(tBU)-DMK rescued colony formation (Figure 2g,h + QC + CTSL inhibitor), whereas theaddition of CTSD or CTSB inhibitors did not (Figure 2a,b,d,e). Consistent with these data,immunoblot also showed a reduction in cleaved PARP levels when the cells were treatedwith CTSL inhibitor in combination with QC compared to QC treatment alone (Figure 2i,lane 4 compared to lane 2). In contrast, the combination treatment of QC with CTSD andCTSB inhibitors had no effect on cleaved PARP levels (Figure 2c,f). Further validationshowed a significant reduction in the levels of cleaved caspases 9/3 when treated withCTSL inhibitor in combination with QC compared to QC alone in both C13 and HeyA8-MDR cells (Figure 2j) (for densitometry analysis refer to Figure S1e,h). Furthermore, QCtreatment alone showed an increase in Annexin V (early apoptosis) (~23.5% in C13 and~32.8% in HeyA8-MDR). However, treatment with QC in the presence of CTSL inhibitorshowed a reduction in early apoptotic events with up to ~10.4% in C13 and ~11.4% inHeyA8-MDR cells (Figure 2k). Taken together, these results demonstrated that CTSL, butnot CTSB or CTSD, mediates QC-induced cytotoxicity.

Cancers 2021, 13, 2004 5 of 20Cancers 2021, 13, x 6 of 23
Figure 2. CTSL mediates QC cytotoxicity and apoptosis. Colony-forming ability was assessed in HeyA8-MDR cells where the cells were pre-treated with cathepsin selective inhibitors (a, b) Pepstatin A (1 µM, CTSD inhibitor), (d and e) CA-074 Me (10 µM, CTSB inhibitor) and (g, h) Z-FY (tBU)-DMK (10 μM, CTSL inhibitor) and exposed with or without QC (5 µM) for 24 h followed by 10 days culture. The number of colonies were counted and plotted as mean ± standard deviation. (c,f and i) Western analysis was performed for cleaved PARP under the similar treatment conditions, respectively. (j) Levels of cleaved caspase -9/3 and cleaved PARP were assessed by immunoblot analysis upon treatment with QC in presence and absence of Z-FY (tBU)-DMK. (k) Annexin V/PI staining of C13 and HeyA8MDR cells treated with QC in absence and presence of Z-FY (tBU)-DMK for 24 h and FACS analysis showed QC-exhibited CTSL-mediated cell death, and the corre-sponding bar graph shows the percentage of Annexin-V-positive cells. Significance was expressed as *p < 0.05, **p < 0.01, ***p < 0.001. Abbreviations: QC: Quinacrine; CTSL: Cethepsin L; PARP: Poly (ADP-ribose) polymerase; PCNA: Proliferat-ing cell nuclear antigen.
Figure 2. CTSL mediates QC cytotoxicity and apoptosis. Colony-forming ability was assessed in HeyA8-MDR cells where thecells were pre-treated with cathepsin selective inhibitors (a,b) Pepstatin A (1 µM, CTSD inhibitor), (d,e) CA-074 Me (10 µM,CTSB inhibitor) and (g,h) Z-FY (tBU)-DMK (10 µM, CTSL inhibitor) and exposed with or without QC (5 µM) for 24 h followedby 10 days culture. The number of colonies were counted and plotted as mean ± standard deviation. (c,f,i) Western analysiswas performed for cleaved PARP under the similar treatment conditions, respectively. (j) Levels of cleaved caspase-9/3 andcleaved PARP were assessed by immunoblot analysis upon treatment with QC in presence and absence of Z-FY (tBU)-DMK.(k) Annexin V/PI staining of C13 and HeyA8MDR cells treated with QC in absence and presence of Z-FY (tBU)-DMK for 24 hand FACS analysis showed QC-exhibited CTSL-mediated cell death, and the corresponding bar graph shows the percentageof Annexin-V-positive cells. Significance was expressed as * p < 0.05, ** p < 0.01, *** p < 0.001. Abbreviations: QC: Quinacrine;CTSL: Cethepsin L; PARP: Poly (ADP-ribose) polymerase; PCNA: Proliferating cell nuclear antigen.
2.4. QC-Induced CTSL Activation Is Dependent on Autophagy and Vice Versa
To further support the data that QC-induced ovarian cancer cell death is dependenton autophagy, we performed FACS analysis on C13 non-targeted control transduced (NTC)and ATG5 knockdown (KD) cells after treatment with QC ± caspase inhibitor (Z-VAD-

Cancers 2021, 13, 2004 6 of 20
FMK). We found that ATG5 KD significantly attenuated QC-induced apoptosis similarto treating NTC cells with caspase inhibitor, indicating that autophagy is essential forQC-induced apoptosis (Figure 3a, 33.8% of cell death in QC treated in NTC whereasno apoptotic cell death in the presence of caspase inhibitor in NTC or ATG5 KD cells).Consistent with this data, ectopic expression of CTSL in OV2008 (low basal CTSL) showedincreased early (38.2%) and late (2.6%) apoptotic events in the presence of QC comparedto that of 24.9% and 2.4% of vector control cells, respectively. However, treatment withZ-VAD-FMK resulted in significant reduction in apoptosis (Figure 3b).
Cancers 2021, 13, x 8 of 23
Figure 3. QC promotes CTSL upregulation in an autophagy-dependent manner. (a(i)) C13 ATG5 WT and KD cells were treated with 5 µM QC in the absence and presence of caspase inhibitor Z-VAD-FMK (10 µM) for 24 h and stained with Annexin V-Pacific Blue and Propidium Iodide (PI) followed by FACS analysis to determine the early and late apoptotic events, and (ii) the bar graph depicts percentage of Annexin-V-positive/apoptotic cells. (b(i)) Similar analysis was per-formed in the OV2008 cells (vector and CTSL+/+) and (ii) the pictograph shows percentage of Annexin-V-positive cells. (c) HeyA8-MDR and (d) OVCAR5 cells were treated with QC (0, 2.5, 5 µM) in the absence and presence of autophagic inhib-itor 3MA (10 µM) and/or CQ (0, 25, 50 µM) for 24 h and immunoblot analysis was performed against CTSL, p62 and cleaved PARP proteins. Significance was expressed as * p < 0.05, ** p < 0.01, *** p < 0.001. Abbreviations: QC: Quinacrine; 3MA: 3 Methyladenine; CQ: Chloroquin; CTSL: Cathepsin L; PARP: Poly (ADP-ribose) Polymerase; p62: Ubiquitin bind-ing Protein 62 and PCNA: Proliferating Cell Nuclear Antigen.
To further confirm the induction of autophagic flux, we monitored the fluorescence of GFP-RFP-LC3B/or p62 construct in both the C13 and HeyA8 MDR cells upon treatment with QC for 24 h. The conversion of early autophagosome or p62 inclusion body into au-tolysosome was monitored by formation of green (GFP+ and RFP−) to yellow puncta (GFP+ and RFP+) and increased red puncta (GFP− and RFP+) in the cells (Figure 4a). Con-focal images of the transiently transfected GFP-RFP-LC3B/or p62 construct in C13 (Figure 4b,c) and HeyA8-MDR (Figure 4d,e) cells showed induction of autophagic flux through the formation of both yellow/orange (GFP/RFP) and increased red-RFP puncta in 5 µM
Figure 3. QC promotes CTSL upregulation in an autophagy-dependent manner. (a(i)) C13 ATG5 WT and KD cells weretreated with 5 µM QC in the absence and presence of caspase inhibitor Z-VAD-FMK (10 µM) for 24 h and stained withAnnexin V-Pacific Blue and Propidium Iodide (PI) followed by FACS analysis to determine the early and late apoptoticevents, and (ii) the bar graph depicts percentage of Annexin-V-positive/apoptotic cells. (b(i)) Similar analysis wasperformed in the OV2008 cells (vector and CTSL+/+) and (ii) the pictograph shows percentage of Annexin-V-positive cells.(c) HeyA8-MDR and (d) OVCAR5 cells were treated with QC (0, 2.5, 5 µM) in the absence and presence of autophagicinhibitor 3MA (10 µM) and/or CQ (0, 25, 50 µM) for 24 h and immunoblot analysis was performed against CTSL, p62and cleaved PARP proteins. Significance was expressed as * p < 0.05, ** p < 0.01. Abbreviations: QC: Quinacrine; 3MA: 3Methyladenine; CQ: Chloroquin; CTSL: Cathepsin L; PARP: Poly (ADP-ribose) Polymerase; p62: Ubiquitin binding Protein62 and PCNA: Proliferating Cell Nuclear Antigen.

Cancers 2021, 13, 2004 7 of 20
Given the importance of autophagy in QC-induced apoptosis and cell death, wechose to examine the role of QC-induced autophagy in promoting CTSL upregulation.Here, we proved that inhibition of autophagy pharmacologically with 3-methyladenine orchloroquine attenuates QC-induced CTSL upregulation in both HeyA8-MDR and OVCAR5cells (Figure 3c,d, Lanes 4–12, top panel), respectively. Inhibition of autophagic flux underthis treatment condition was further confirmed by restoration of p62 expression in thecells, resulting in reduced cleaved PARP (Figure 3c,d, panels 3 and 2, respectively) (fordensitometry analysis refer to Figure S2a,b).
To further confirm the induction of autophagic flux, we monitored the fluorescence ofGFP-RFP-LC3B/or p62 construct in both the C13 and HeyA8 MDR cells upon treatmentwith QC for 24 h. The conversion of early autophagosome or p62 inclusion body intoautolysosome was monitored by formation of green (GFP+ and RFP−) to yellow puncta(GFP+ and RFP+) and increased red puncta (GFP− and RFP+) in the cells (Figure 4a).Confocal images of the transiently transfected GFP-RFP-LC3B/or p62 construct in C13(Figure 4b,c) and HeyA8-MDR (Figure 4d,e) cells showed induction of autophagic fluxthrough the formation of both yellow/orange (GFP/RFP) and increased red-RFP punctain 5 µM QC-treated cells compared to the untreated cells (no autophagosome or p62autophagosomal inclusion bodies), respectively. Furthermore, OV2008 cells with ectopicexpression of CTSL transfected with GFP-RFP-LC3B/or p62 showed increased autophagicflux compared to OV2008-vector cells (Figure 4f,g, and respective graphs depict the increaseof autolysosome-RFP puncta per cell). However, knockdown of CTSL in C13 cells showedreduced formation of autophagosomal bodies even in the presence of QC (Figure 4h,i),thus confirming the role of CTSL in inducing autophagic flux.
2.5. CTSL Promotes Autophagic Flux by Degrading p62
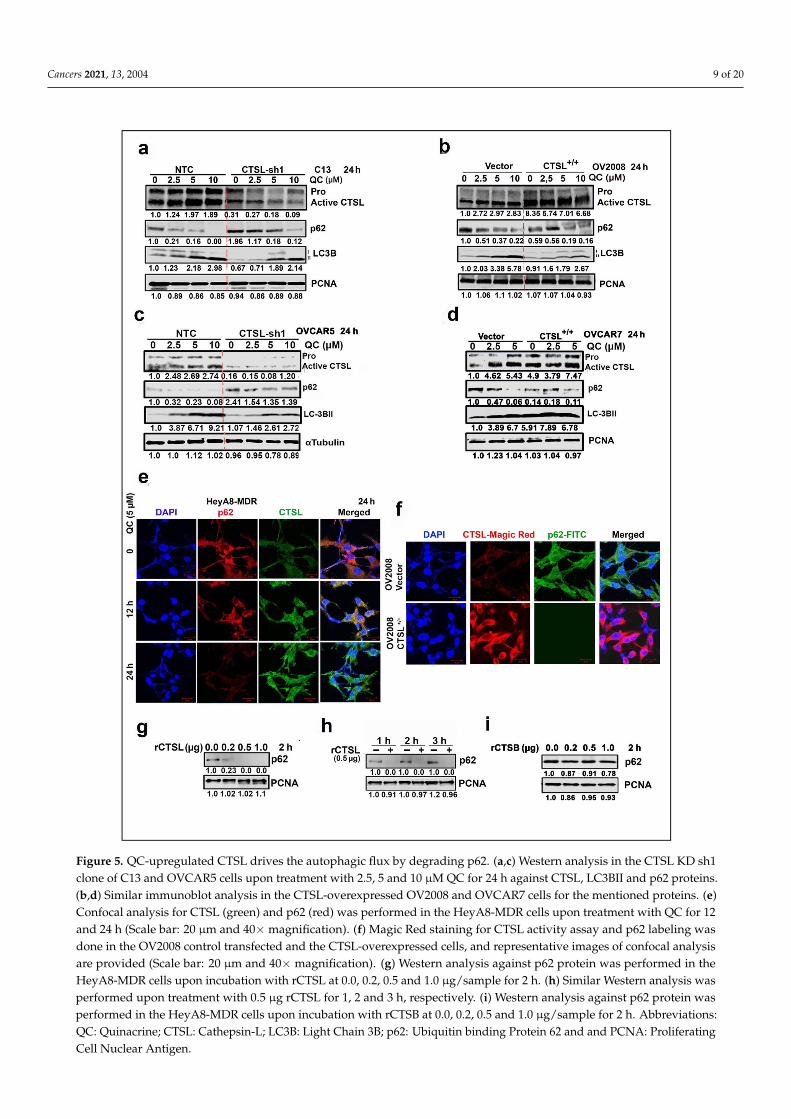
Lysosomal cathepsins play an important role in promoting autophagic flux by de-grading proteins transported to the lysosome [33], therefore we examined the effect ofCTSL knockdown and overexpression on QC-induced autophagy. For this we generatedstable CTSL KD clones of C13 and OVCAR5 cells (which have high basal CTSL expression)using two different shRNA and CTSL-overexpressing clones in OV2008 and OVCAR7 cells(which have low basal CTSL expression) and treated with 0, 2.5, 5 and 10 µM QC. Wefound that CTSL knockdown significantly decreased QC-induced LC3BII and preventeddegradation of p62 protein compared to C13-NTC cells, suggesting that CTSL knockdown(Figure 5a, top panel) impairs QC-induced autophagic flux, as evidenced by p62 and LC3Blevels (Figure 5a, panels 2 and 3) (Figure S3a,b). In contrast, overexpression of CTSL(Figure 5b, top panel) led to degradation of p62, increased LC3BII level when compared toOV2008-vector cells. Similar results were obtained with CTSL KD in high-grade serousOVCAR5 cells and in CTSL-overexpressed high-grade serous OVCAR7 cells (Figure 5c,d),respectively (for densitometric analysis refer to Figure S2c–f).

Cancers 2021, 13, 2004 8 of 20Cancers 2021, 13, x 10 of 23
Figure 4. QC augments CTSL-mediated autophagic flux. (a) Double RFP-GFP tags were fused to LC3B or p62. QC increases autolysosomes (GFP+/RFP+ or RFP+) in (b(i) and c(i)) C13 cells transiently transfected with GFP-RFP-LC3B/or p62 plas-mid, and (b(ii) and c(ii)) their respective pictographs shows quantification of GFP/RFP positive autolysosome puncta per cell in C13. QC augments autolysosomes (GFP+/RFP+ or RFP+) in (d(i) and e(i)) HeyA8-MDR cells transiently transfected with GFP-RFP-LC3B/or p62 plasmid, and (d(ii) and e(ii)) their respective pictographs shows quantification of GFP/RFP positive autolysosome puncta per cell in HeyA8-MDR. Similar analysis was performed in the (f(i) and g(i)) OV2008 cells (vector and CTSL+/+) and (h(i) and i(i)) C13 (NTC, sh1) and (f(i)–i(i)) their respective bar graphs depict quantification of
Figure 4. QC augments CTSL-mediated autophagic flux. (a) Double RFP-GFP tags were fused to LC3B or p62. QC increasesautolysosomes (GFP+/RFP+ or RFP+) in (b(i) and c(i)) C13 cells transiently transfected with GFP-RFP-LC3B/or p62 plasmid,and (b(ii) and c(ii)) their respective pictographs shows quantification of GFP/RFP positive autolysosome puncta per cell inC13. QC augments autolysosomes (GFP+/RFP+ or RFP+) in (d(i) and e(i)) HeyA8-MDR cells transiently transfected withGFP-RFP-LC3B/or p62 plasmid, and (d(ii) and e(ii)) their respective pictographs shows quantification of GFP/RFP positiveautolysosome puncta per cell in HeyA8-MDR. Similar analysis was performed in the (f(i) and g(i)) OV2008 cells (vector andCTSL+/+) and (h(i) and i(i)) C13 (NTC, sh1) and (f(i)–i(i)) their respective bar graphs depict quantification of GFP/RFPpositive autolysosome puncta per cell in OV2008 and C13 cells, respectively (scale bar 10 µm and 40× magnification).Significance was expressed as * p < 0.05, ** p < 0.01, *** p < 0.001. Abbreviations: CTSL: Cathepsin-L; LC3B: Light Chain 3B;p62: Ubiquitin binding Protein 62 and RFP/GFP: Red/green fluorescent protein.
Cancers 2021, 13, 2004 9 of 20Cancers 2021, 13, x 12 of 23
Figure 5. QC-upregulated CTSL drives the autophagic flux by degrading p62. (a,c) Western analysis in the CTSL KD sh1 clone of C13 and OVCAR5 cells upon treatment with 2.5, 5 and 10 μM QC for 24 h against CTSL, LC3BII and p62 proteins. (b,d) Similar immunoblot analysis in the CTSL-overexpressed OV2008 and OVCAR7 cells for the mentioned proteins. (e) Confocal analysis for CTSL (green) and p62 (red) was performed in the HeyA8-MDR cells upon treatment with QC for 12 and 24 h (Scale bar: 20 µm and 40× magnification). (f) Magic Red staining for CTSL activity assay and p62 labeling was done in the OV2008 control transfected and the CTSL-overexpressed cells, and representative images of confocal analysis are provided (Scale bar: 20 µm and 40× magnification). (g) Western analysis against p62 protein was performed in the
Figure 5. QC-upregulated CTSL drives the autophagic flux by degrading p62. (a,c) Western analysis in the CTSL KD sh1clone of C13 and OVCAR5 cells upon treatment with 2.5, 5 and 10 µM QC for 24 h against CTSL, LC3BII and p62 proteins.(b,d) Similar immunoblot analysis in the CTSL-overexpressed OV2008 and OVCAR7 cells for the mentioned proteins. (e)Confocal analysis for CTSL (green) and p62 (red) was performed in the HeyA8-MDR cells upon treatment with QC for 12and 24 h (Scale bar: 20 µm and 40×magnification). (f) Magic Red staining for CTSL activity assay and p62 labeling wasdone in the OV2008 control transfected and the CTSL-overexpressed cells, and representative images of confocal analysisare provided (Scale bar: 20 µm and 40× magnification). (g) Western analysis against p62 protein was performed in theHeyA8-MDR cells upon incubation with rCTSL at 0.0, 0.2, 0.5 and 1.0 µg/sample for 2 h. (h) Similar Western analysis wasperformed upon treatment with 0.5 µg rCTSL for 1, 2 and 3 h, respectively. (i) Western analysis against p62 protein wasperformed in the HeyA8-MDR cells upon incubation with rCTSB at 0.0, 0.2, 0.5 and 1.0 µg/sample for 2 h. Abbreviations:QC: Quinacrine; CTSL: Cathepsin-L; LC3B: Light Chain 3B; p62: Ubiquitin binding Protein 62 and and PCNA: ProliferatingCell Nuclear Antigen.

Cancers 2021, 13, 2004 10 of 20
To understand the regulation of p62 by CTSL, immunofluorescence analysis in HeyA8-MDR cells treated with QC showed a time-dependent increase in the CTSL expression(Figure 5e, green panels) with a reduction in cytoplasmic p62 levels (Figure 5e, red pan-els). To further validate, Magic Red was used to validate increased CTSL activity in CTSL-overexpressing OV2008 cells (Red signal) associated with significantly low levels of cytoplas-mic p62 protein compared to the vector control cells (Figure 5f, green signal). To delineatethat the degradation of p62 was directly mediated by upregulation of CTSL, whole celllysates from HeyA8-MDR cells were incubated with recombinant human CTSL and CTSBprotein in both concentration-dependent (0.0, 0.2, 0.5 and 1.0 µg/sample for 2 h) and/ortime-dependent manner (0.5 µg for 1, 2 and 3 h). Immunoblot analysis showed degradation ofp62 protein was only mediated by rCTSL in both concentration and time-dependent manner(Figure 5g,h) but not by rCTSB (Figure 5i) (for densitometry analysis refer to Figure S2g–i).
Furthermore, to evaluate CTSL-mediated p62 cleavage pattern, myc-tagged p62 wasoverexpressed in Hek293T cells, and lysates were incubated with rCTSL or rCTSB at 0.0,0.1, 0.25 µg/sample for 1 h. The results showed that in the presence of rCTSL, ectopicallyexpressed p62 was cleaved at two sites, resulting in two bands of approximately ~45 and42 KD fragments, compared to rCTSL untreated and/or with rCTSB (Figure S4a–c). CTSLhas mainly endopeptidase activity and preferentially cleaves peptide bonds Phe–Arg orArg–Arg with aromatic and hydrophobic residues [34], which supports the experimentalresults, as shown in Figure S4d. Taken together our data suggest for the first time that QCinduces a positive feedback loop where QC-induced autophagy upregulates CTSL, whichgoes on to further promote autophagic flux by degrading p62.
2.6. CTSL Mediates QC-Induced LMP, Bid Cleavage and MOMP
Autophagy and lysosomal cathepsins have previously been shown to play a role inLMP [21,35–37]. LMP induced by TNF-alpha has been shown to be dependent on CTSB [38]and the cationic amphiphilic drug resveratrol has been shown to induce LMP in cervicalcancer cells that are dependent on autophagy and CTSL [35]. Our data in Figure 1a,b clearlyindicate that QC induces LMP, therefore we hypothesized that induced upregulation ofCTSL may play a role in QC-mediated LMP. To validate the role of QC-upregulated CTSLin inducing LMP, we treated CTSL-knockdown C13 cells and CTSL-overexpressing OV2008cells with 5 µM QC for 12 and 24 h and determined the extent of LMP by analyzing the lossof LysoTracker red using confocal microscopy. Results showed that knockdown of CTSLsignificantly reduced the loss of LysoTracker red signal induced by QC (Figure S5a,b) in atime-dependent manner. In contrast, ectopic overexpression of CTSL in OV2008 cells led toa significant increase in the loss of LysoTracker red signal after QC treatment (Figure S5c,d).Collectively, these results suggested that QC-upregulated CTSL may have a critical role inQC-mediated LMP to induce the cell death.
Lysosomal cathepsins released after LMP induce MOMP and cyt-c release by cleavingthe Bcl-2 family member Bid [27]; we sought to investigate whether QC induces MOMP andthe role of CTSL in promoting the MOMP. Mitochondrial release of cyt-c into the cytoplasmindicates MOMP induction. However, to further affirm whether QC promotes MOMP,MitoTracker Red dye (Thermofisher, Waltham, USA) was used to assess mitochondrialouter membrane integrity, and QC treatment led to significant loss of MitoTracker Red staincompared to untreated C13 cells, affirming that QC induces MOMP. Interestingly, rescue ofred signal was evident where cells were treated with QC in the presence of Z-FY(tBU)-DMK(Figure 6a,b). Furthermore, we found that QC-induced MOMP was mediated by CTSLas QC treatment in CTSL KD C13 cells prevented QC-induced loss of MitoTracker Red(Figure 6c,d). To further confirm CTSL-upregulated OV2008 cells showed a significantloss of MitoTracker Red signal compared to control cells, however, treatment with CTSLinhibitor prevented the MOMP in the overexpressed cells (Figure 6e,f). Retention of redsignal was also obtained when the CTSL-overexpressed cells were treated with QC in thepresence of Z-FY(tBU)-DMK (Figure 6e,f), which confirmed the role of CTSL in mediatingQC-induced MOMP in ovarian cancer cells.

Cancers 2021, 13, 2004 11 of 20Cancers 2021, 13, x 15 of 23
Figure 6. CTSL mediates QC-induced MOMP and cleavage of Bid, caspase-3 and PARP in ovarian cancer cells. (a) C13 treated with QC (0, 5, 10 µM) in the presence and absence of Z-FY(tBU)DMK (10 µM) were labeled with Mitotracker Red and Hoechst 33342 for nuclei, and MOMP induction was assessed using confocal microscopy. Representative images are presented. (b) Quantitation of the signal is presented in a bar diagram. A similar study was performed with (c) C13 NTC
Figure 6. CTSL mediates QC-induced MOMP and cleavage of Bid, caspase-3 and PARP in ovarian cancer cells. (a) C13treated with QC (0, 5, 10 µM) in the presence and absence of Z-FY(tBU)DMK (10 µM) were labeled with Mitotracker Redand Hoechst 33342 for nuclei, and MOMP induction was assessed using confocal microscopy. Representative images are

Cancers 2021, 13, 2004 12 of 20
presented. (b) Quantitation of the signal is presented in a bar diagram. A similar study was performed with (c) C13 NTCand sh1/sh2 cells and (e) OV2008 vector transfected and CTSL-overexpressed cells upon treatment with 5 µM QC in plusor minus Z-FY(tBU)-DMK for 24 h, and representative images are given. (d,f) Graphical representation of the MOMPinduction. (g,h) Western analysis was performed in CTSL KD and NTC control transfected C13 and OVCAR5 cells upontreatment with indicated concentrations of QC for 24 h against the proteins tBid, cyt-c, cleaved caspase 3 and cleaved PARP.(i,j) Similar Western analysis was carried out for control vector and CTSL-overexpressed OV2008 and OVCAR7 cells. Scalebar 200 µm and 40× magnification and Significance was expressed as * p < 0.05, ** p < 0.01, *** p < 0.001. Abbreviations: QC:Quinacrine; CTSL: Cathepsin-L; tBid: truncated Bcl-2 family member(Bid); Cyt c: Cytochrome-c; Casp: Caspase; PARP: Poly(ADP-ribose) polymerase.
Furthermore, QC treatment of CTSL KD C13 and OVCAR 5 cells showed a significantreduction in tBid levels (a specific substrate for CTSL and apoptotic factor) and cyt-c releaseand attenuated expression levels of active caspases-3 and cleaved PARP levels (Figure 6g,h,panels 3 and 4, respectively) compared to NTC transduced cells. In contrast, overexpres-sion of CTSL in OV2008 and OVCAR7 showed increased cyt-c release accompanied bygeneration of tBid, an increase in active caspase 9/3 expression and cleaved PARP afterQC treatment, compared to vector cells (Figure 6i,j, panels 1, 2 and panels 3–5, respectively,for densitometric analysis refer to Figure S6a–d). Collectively these results supported thenotion that QC-induced CTSL promotes MOMP, leading to caspase-mediated cell death.
To further confirm the role of CTSL in QC-induced cell death, we treated the CTSL KDC13 and overexpressed OV2008 cells with QC and analyzed the effect on the anti-apoptoticand the pro-apoptotic protein markers. Immunoblot analysis showed that QC induceddegradation of the anti-apoptotic proteins Mcl1 and Bcl-w and promoted the pro-apoptoticproteins like Bim and Bad, which are impaired in CTSL KD C13 cells compared to the NTCcells (Figure S7a). Moreover, the CTSL-overexpressed OV2008 cells showed the oppositeeffect on treatment with QC for 24 h (Figure S7b), which confirmed that QC-mediatedCTSL induction promotes apoptotic cell death in ovarian cancer cells.
2.7. QC Upregulates CTSL and Promotes Ovarian Cancer Cell Death In Vivo
We previously reported that QC treatment of mouse-derived xenografts of HeyA8-MDR cells was shown to be effective in reducing tumor weight and ascitic fluid formation(Figure 7a–d in Ashwani et al. [18]) with increased formation of autophagosomes andautolysosomes, and these effects were dramatic when QC was combined with carboplatin,but QC exhibited a molecular mechanism that was still unclear. Hence, we tested four eachof control and QC-treated xenografts to check if QC treatment induced active CTSL in vivo.As shown in Figure 7a, there was a dramatic induction of CTSL upon QC treatment in vivo.This correlated with degradation of p62, upregulation of LC3BII and increase in cyt-c,cleaved Bid, caspase-3 and cleaved PARP compared to untreated tumors (for densitometryanalysis refer to Figure S6e), effectively mimicking the results we obtained in vitro. Takentogether these data provide strong evidence that CTSL mediates QC-induced autophagicand apoptotic cell death in vivo. Figure 7b shows the model figure of QC-activated CTSLpromoting autophagy-mediated LMP and MOMP-dependent cell death.

Cancers 2021, 13, 2004 13 of 20
Cancers 2021, 13, x 16 of 23
and sh1/sh2 cells and (e) OV2008 vector transfected and CTSL-overexpressed cells upon treatment with 5 µM QC in plus or minus Z-FY(tBU)-DMK for 24 h, and representative images are given. (d,f) Graphical representation of the MOMP induction. (g,h) Western analysis was performed in CTSL KD and NTC control transfected C13 and OVCAR5 cells upon treatment with indicated concentrations of QC for 24 h against the proteins tBid, cyt-c, cleaved caspase 3 and cleaved PARP. (i,j) Similar Western analysis was carried out for control vector and CTSL-overexpressed OV2008 and OVCAR7 cells. Scale bar 200 µm and 40× magnification and Significance was expressed as * p < 0.05, ** p < 0.01, *** p < 0.001. Abbre-viations: QC: Quinacrine; CTSL: Cathepsin-L; tBid: truncated Bcl-2 family member(Bid); Cyt c: Cytochrome-c; Casp: Caspase; PARP: Poly (ADP-ribose) polymerase.
2.7. QC Upregulates CTSL and Promotes Ovarian Cancer Cell Death in Vivo We previously reported that QC treatment of mouse-derived xenografts of HeyA8-
MDR cells was shown to be effective in reducing tumor weight and ascitic fluid formation (Figure 7a–d in Ashwani et al. [18]) with increased formation of autophagosomes and au-tolysosomes, and these effects were dramatic when QC was combined with carboplatin, but QC exhibited a molecular mechanism that was still unclear. Hence, we tested four each of control and QC-treated xenografts to check if QC treatment induced active CTSL in vivo. As shown in Figure 7a, there was a dramatic induction of CTSL upon QC treat-ment in vivo. This correlated with degradation of p62, upregulation of LC3BII and in-crease in cyt-c, cleaved Bid, caspase-3 and cleaved PARP compared to untreated tumors (for densitometry analysis refer to Figure S6e), effectively mimicking the results we ob-tained in vitro. Taken together these data provide strong evidence that CTSL mediates QC-induced autophagic and apoptotic cell death in vivo. Figure 7b shows the model fig-ure of QC-activated CTSL promoting autophagy-mediated LMP and MOMP-dependent cell death.
Figure 7. QC induces CTSL and suppresses tumor growth in the HeyA8-MDR xenograft model. (a) Immunoblot analysis was performed in the untreated and QC-treated HeyA8-MDR OC xenograft tumors against CTSL, p62, LC3BII, tBid, Cyt-c, cleaved PARP and cleaved caspase 3 expressions. (b) Schematic representation of the study. Abbreviations: QC: quina-crine; CTSL: Cathepsin-L; LMP: Lysosomal Membrane Permeabilization; MOMP: Mitochondrial Outer Membrane Perme-abilization; tBid: truncated Bcl-2 family member(Bid); p62- ubiquitinbinding protein 62; Cyt c: Cytochrome-c; ATG5: Au-tophagy Related 5; LC3B: Autophagy marker protein Light chain 3B; PARP: Poly (ADP-ribose) polymerase.
Figure 7. QC induces CTSL and suppresses tumor growth in the HeyA8-MDR xenograft model. (a) Immunoblot analysiswas performed in the untreated and QC-treated HeyA8-MDR OC xenograft tumors against CTSL, p62, LC3BII, tBid,Cyt-c, cleaved PARP and cleaved caspase 3 expressions. (b) Schematic representation of the study. Abbreviations: QC:quinacrine; CTSL: Cathepsin-L; LMP: Lysosomal Membrane Permeabilization; MOMP: Mitochondrial Outer MembranePermeabilization; tBid: truncated Bcl-2 family member(Bid); p62- ubiquitinbinding protein 62; Cyt c: Cytochrome-c; ATG5:Autophagy Related 5; LC3B: Autophagy marker protein Light chain 3B; PARP: Poly (ADP-ribose) polymerase.
3. Discussion
LMP can be triggered by a wide variety of stimuli including several antimalarialdrugs [35,36]. The antimalarial drugs hydroxychloroquine (HCQ) and chloroquine (CQ)increase lysosomal pH leading to lysosomal dysfunction and autophagy inhibition. Nowalthough HCQ has long been established as an autophagy inhibitor, work by the Boyateam showed that HCQ induces LMP and MOMP, resulting in hallmark autophagic andapoptotic cell death [39,40].
In the present study, we showed that QC induces autophagy, LMP, and MOMP, leadingto ovarian cancer cell death. We found that QC-induced cytotoxicity was mediated by theupregulation and activation of the cysteine protease CTSL (Figure 2a–i). Furthermore, wediscovered that CTSL mediates QC-induced autophagic and apoptotic cell death in OCcells (Figures 2j,k and 3a–e). Interestingly, a recent report highlighted that treatment withCQ and HCQ-induced LMP mediated cell death with and without cathepsin activation,respectively [39,40]. Taken together, recent work using CQ, HCQ, and our work using QChave suggested that the anticancer properties of these antimalarial drugs may be closelylinked to their ability to induce LMP (Figures 1 and 3e).
Lysosomal–mitochondrial crosstalk can play an important role in mediating cell deathfollowing LMP, as the selective release of cathepsins after LMP can promote MOMP andcyt-c release by cleaving the Bcl-2 family member Bid [27,28,31]. Therefore, after showingQC-induced LMP (Figure 1a–d) and CTSL activation (Figure 1e–k), we examined whetherCTSL mediates QC-induced apoptosis by promoting Bid cleavage, cyt-c release, and MOMP.In this study, we showed that CTSL inhibition markedly reduced QC-induced Bid cleavageto tBid, cyt-c release and MOMP, whereas ectopic expression of CTSL had the oppositeeffect (Figure 6a–j). CTSL has also been shown to degrade anti-apoptotic proteins such asXIAP, Mcl-1, Bcl-w, and Bcl-xL, leading us to analyze whether QC-induced LMP and CTSL

Cancers 2021, 13, 2004 14 of 20
activation promoted the degradation of anti-apoptotic Bcl-2 family members [31]. Here,we showed that QC promoted the degradation of Mcl-1 and Bcl-w, and inhibition of CTSLrescued anti-apoptotic protein degradation (Figure S7a,b). We further showed that CTSLknockdown or pharmacological inhibition attenuated QC-induced cleaved PARP, cleavedcaspase-3, and cleaved caspase-9 levels, which are indicators of apoptosis (Figure 3a,band Figure 6). Overall, these data confirmed that CTSL release after LMP promoted QC-induced MOMP and apoptosis and highlighted the importance of lysosomal–mitochondrialcrosstalk in QC-induced cell death.
CTSL has also been shown to promote autophagy by degrading lysosomal com-ponents, and in our previous work we showed that QC induces LC3B expression andp62 degradation, which is indicative of autophagic flux [18,20,33]. Therefore, we soughtto explore a possible connection between CTSL activation and QC-induced autophagicflux. Using recombinant CTSL, we found that ectopically expressed p62 was specificallycleaved at two sites, identifying that p62 acts as a novel substrate of CTSL (Figure 5g–i,and Figure S4b), mechanistically linking QC-induced CTSL upregulation to promote au-tophagic flux. To confirm that CTSL maintains QC-induced autophagic flux by degrad-ing p62, we treated CTSL knockdown cells with QC and analyzed LC3B and p62 levels(Figure 5a–d). We found that p62 levels were markedly increased and LC3B levels weredecreased in CTSL knockdown cells treated with QC when compared to control cells,indicating that CTSL knockdown impeded QC-induced autophagic flux (Figure 5a–h)and also that CTSL upregulation or treatment with QC increased the development of au-tolysosomes from early autophagosomes, which was evident from the GFP-RFP-LC3B/p62assay (Figure 4a–i). In contrast, it was demonstrated that CTSL expression and nucleartranslocation induced by the neurotoxin 6-OHDA is a mechanism that inhibits autophagyin SH-SY5Y neuroblastoma cells [41]. Also, in contrast to our finding, a recent reporton periodontal ligament fibroblasts showed that CTSL upregulates p62 levels [42]. Thissuggested that CTSL is capable of playing opposing roles in autophagy, depending oncellular context, and implied that more work is needed to better understand the role ofCTSL in autophagy. In addition, the induction of autophagy has previously been shownto activate various cathepsins, including CTSL [43], leading us to examine whether QC-induced autophagy was important for CTSL activation. In the present study we foundthat pharmacological shutdown of autophagy inhibited QC-induced CTSL upregulation(Figure 3c,d), indicating that QC-induced autophagy is required for QC-induced CTSLupregulation. Taken together, these data suggest that QC promotes a positive feedback loopwhere QC-induced autophagy upregulates CTSL, which further drives autophagic flux.
Importantly, OC cells have elevated CTSL levels compared to non-neoplastic tis-sues, and this elevated CTSL expression has been shown to promote ovarian cancer cellproliferation and invasion and resistance to chemotherapy [44,45], with secreted CTSLplaying a role in cancer progression [46]. Additionally, inhibiting CTSL sensitizes cellsto drugs such as doxorubicin, tamoxifen and so on [47]. In contrast, we demonstratedthat high CTSL levels sensitized ovarian cancer cells to QC treatment. We showed thatCTSL upregulation in OV2008 cells led to a marked increase in QC-induced autophagy andapoptosis, whereas CTSL KD in C13 cells decreased QC-induced autophagy and apoptosis(Figures 4–6). Therefore, differences in CTSL levels could offer a therapeutic window allow-ing QC to preferentially target ovarian cancer cells—especially those that have developedchemoresistance—while maintaining minimal overall toxicity in vivo. This is supportedby our previous work demonstrating that QC treatment sensitizes chemoresistant ovariancancer cell lines to carboplatin treatment [18]. QC intercalates into DNA [48], suggestingthat QC could directly influence CTSL expression. However, we showed that CTSL upreg-ulation appears to be mediated by QC-induced autophagy, and more work is needed toelucidate the mechanism behind QC-induced CTSL upregulation. Although the pro- andanti-oncogenic functions of CTSL appear to be context-dependent, our work suggestedthat CTSL plays a role in promoting ovarian cancer cell death upon QC treatment. Thisanti-oncogenic function of CTSL is supported by an additional study in a mouse model

Cancers 2021, 13, 2004 15 of 20
of skin carcinogenesis, and CTSL is a keratinocyte-specific tumor suppressor in a mousemodel of skin carcinogenesis as CTSL-deficient mice had increased oncogenic signalingaccompanied by aggressive tumor behavior with increased metastasis [49]. Furthermore,CTSL released by carcinoma cells has been shown to produce the angiogenesis inhibitorendostatin from collagen XVIII, raising the possibility that CTSL could act as a putativetumor suppressor by inhibiting angiogenesis [50].
Overall, QC has previously been shown to induce cytotoxicity by a variety of mecha-nisms [10,47]. Here, we demonstrated that QC cytotoxicity in ovarian cancer was mediatedby CTSL, and QC induced autophagic and apoptotic cell death by promoting LMP andMOMP (Figure 7b). Importantly, our work sheds light on the potential for repurposing theantimalarial QC in ovarian cancer treatment.
4. Materials and Methods4.1. Materials
For materials refer Table S1.
4.2. Cell Culture and Treatment
Human ovarian cancer cell lines HeyA8-MDR from MD Anderson (TX, USA), OV-CAR5, OVCAR7, C13, OV2008 and Hek293T cells from ATCC (VA, USA) were grown inRPMI media (Gibco, Waltham, MA, USA) supplemented with 10% fetal bovine serum(R&D Systems, Minneapolis, MN, USA) and 1% penicillin–streptomycin 5% CO2–95% airhumidified atmosphere at 37 ◦C and treated with QC at different concentrations (0, 2.5, 5 or10 µM) in various experiments plus or minus specific inhibitors, including 3-methyladenine,CA-074Me, Pepstatin A, Z-FY(tBU)-DMK, Z-VAD-FMK and Bafilomycin. Cell lysates wereprepared by CS lysis buffer for Western blots. All through this study, carboplatin/cisplatin-resistant C13 and HeyA8-MDR and sensitive OV2008 were used, and for the revalidationin high-grade serous OC cells, OVCAR5 and OVCAR7 cells were used. QC-inducedcytotoxicity against OC cells was determined by MTT assay.
4.3. Generations of CTSL Knockdown and Overexpressed Stable Clones
Cell lines C13 and OVCAR5 were cultured and transfected with CTSL-sh1 (TGC-CTCAGCTACTCTAACAT) sh2 (TGCCTCAGCTACTCTAACATT) and with nontargetedcontrol shRNA as control with Lipofectamine 2000 (Invitrogen, Carlsbad, CA, USA) as permanufacturer protocol. Stable clones were selected by puromycin as reported earlier [20].OV2008 and OVCAR7 cells were cultured and transfected with pcDNA3.1 control vector,and vector containing CTSL insert with Lipofectamine 2000 and stable clones were selectedand cultured using G418. C13-ATG5 KD cells was previously reported [18].
4.4. Clonogenic Assay
Clonogenic survival assays were performed as previously described [51,52]. In brief,C13 and HeyA8-MDR cells were seeded at 500 cells per well in 6-well dishes in triplicate,exposed to QC (5 µM) with plus or minus specific cathepsin inhibitors including CA-074Me(CTSB inhibitor), Pepstatin A (CTSD inhibitor) and Z-FY(tBU)-DMK (CTSL inhibitor) for24 h, rinsed with fresh medium and cultured further for 12 days. Colonies were fixedwith methanol, stained with crystal violet (0.4 g/L), counted by ImageJ-Fiji version (colonycount) and photographed.
4.5. Lysosomal Membrane Permeability/CTSL Activity Assessment
C13 and HeyA8-MDR cells were treated with 5 and 10 µM QC for 0, 3, 12, and24 h, followed by incubation with 50 nM LysoTracker® for 1 h at 37 ◦C and visualized byfluorescence microscopy. Cells grown in 24-well plates were treated with QC (0, 2.5, 5, and10 µM) alone and with or without Z-FY(tBU)-DMK (10 µM) for 24 h followed by a MagicRed® CTSL Assay according to the manufacturer’s protocol. LMP and CTSL activity levelswere analyzed by ImageJ-Fiji version.
Cancers 2021, 13, 2004 16 of 20
4.6. MOMP Assessment
To validate the QC effect on mitochondrial membrane potential, C13/C13 NTC, CTSL-sh1 and sh2 and OV2008 (EV and CTSL+/+) cells were cultured and exposed with or withoutQC at 5 or 10 µM and Z-FY(tBU)-DMK (10 µM) for 24 h, then incubated with 50 nM ofMitoTracker® Red FM for 30 min at 37 ◦C and visualized by fluorescence microscopy, andcorrected total cell fluorescence (CTCF) was obtained by Image J.
4.7. Annexin V-Pacific Blue/PI Dual Staining
The Annexin V-Pacific blue/PI dual staining assay (Life Technologies) was employedto assess the QC-mediated cell death according to the protocol provided by the manufac-turer. In brief, approximately 1 × 10⁶ parental (C13, HeyA8-MDR), CTSL KD (C13-NTC,sh1, sh2), and OV2008 (Vector, CTSL +/+) cells were grown and treated in plus or minuscombinations of QC and 10 µM specific inhibitors (Z-FY(tBU)-DMK or Z-VAD-FMK) for24 h. The cells were sorted using a flow cytometer (BD FACS Canto II) and analyzed usingCell Quest.
4.8. Degradation of Cellular p62 by rCTSL or rCTSB Analysis
To assess whether p62 was directly degraded by CTSL, 50 µg of whole cell lysatesfrom HeyA8-MDR cells were incubated with recombinant human CTSL (rCTSL) protein orrCTSB (0.0, 0.2, 0.5 and 1.0 µg/sample for 2 h or 0.5 µg for 1–3 h at room temperature) inassay buffer (50 mM MES, 5 mM DTT, 1 mM EDTA, 0.005% (w/v) Brij35, pH 6.0). Sampleswere resolved on a 12% SDS-PAGE gel followed by analysis of p62 degradation levelsby immunoblotting with the p62 antibody. Additionally, to validate CTSL-mediated p62cleavage pattern, lysates from Hek293T cells transfected with pDest-C-Myc-p62 construct(a kind gift of Prof.Terje Johansen, Department of Medical Biology, University of Tromsø,Tromsø, Norway) were incubated with rCTSL or rCTSB at 0.0, 0.1, 0.25 µg/sample in assaybuffer and p62-myc cleavage pattern was assessed by Western blot using anti-myc antibody.
4.9. RNA Isolation, cDNA Synthesis and Real-Time PCR
RNAs were extracted from OV2008 and C13 cells treated with QC at 0, 5 and 10 µMusing Qiagen RNA isolation kits following manufacturer’s instruction. About 1 µg of RNAwas reverse transcribed using the QuantiTect Reverse Transcription cDNA synthesis kit(Qiagen, Germantown, MD, USA). Quantitative real-time PCR (qRT-PCR) was carriedout using SYBR-Green PCR Master Mix (Applied Biosystems, Foster City, CA, USA) inCFX96 Real-Time PCR System (Bio-Rad, Hercules, CA, USA) as reported previously [18]by using primers synthesized from Integrated DNA Technologies (IDT). The sequences forthe genes analyzed are CTSL FP:5′-CAATCAGGAATACAGGGAAGGG-3′, CTSL RP:5′-CTGGGCTTACGGTTTTGAAAG-3′, and GAPDH FP:5′-ACATCGCTCAGACACCATG-3′
and GAPDH RP:5′-TGTAGTTGAGGTCAATGAAGGG-3′.
4.10. Animal (In Vivo) Studies
We previously reported the inhibitory efficacy of QC on HeyA8-MDR xenograftsin vivo, and the experiments were carried out under the guidelines of the InstitutionalAnimal Care and Use Committee (IACUC) at the Mayo Foundation, in accordance with ap-proved protocol (see the details [18]). In the current study, we analyzed the protein lysatesof untreated and QC-treated xenografts from the above study by Western blot analysis.
4.11. Western Blot Analysis
Western blot analysis was performed as described previously [20,53]. About 30 µg ofwhole cell lysates from cell lines or QC-treated xenografts using cell lysis buffer from cellsignaling (#9803S) were subjected to 10–15% of SDS-PAGE and transferred to nitrocellulosemembrane. Western blot analysis was performed using antibodies listed in the materialsand incubated with secondary anti-mouse, rabbit and/or goat-680 or 800 IR dyes andfinally scanned under the Odyssey Fc Imaging system (Bio-Rad, Hercules, CA, USA). The

Cancers 2021, 13, 2004 17 of 20
normalized relative expression folds were calculated using ImageJ software, and valueswere expressed as untreated versus treated to assess fold of inhibition or activation.
4.12. Confocal Imaging
The HeyA8-MDR and OV2008 (EV, CTSL+/+) cells were grown on multi-chamberedslides overnight. HeyA8-MDR cells were treated with QC at 0 and 5 µM for 24 h andOV2008 cells were exposed to Magic Red® and then cells were fixed with 100% methanol.After blocking with 1% BSA in PBS, the cells were incubated at room temperature for 1 hwith respective antibodies to p62 or CTSL and then washed three times with 1X PBS. p62was detected using rabbit anti-mouse IgG Alexa Fluor® 594 or rabbit anti-mouse IgG-FITC(Molecular Probes, Eugene, OR, USA and CTSL with Alexa Fluor®488 donkey anti-goatIgG or Magic Red® in 1% BSA. C13, HeyA8-MDR, OV2008 (EV, CTSL+/+), C13 (NTC, CTSL-sh1) cells were transfected transiently with GFP-RFP-LC3/or p62 plasmid and treatedwith or without QC for validating autophagic flux. Slides were mounted with Antifadereagent (Invitrogen, Carlsbad, CA, USA), visualized using a Zeiss-LSM 510 microscopeand corrected total cell fluorescence (CTCF) was obtained by ImageJ-Fiji software.
4.13. Statistical Analysis
Data were obtained from a minimum three independent experiments in triplicates(n = 3). All statistical analyses were performed using GraphPad Prism version 7 software(San Diego, CA, USA). Data were analyzed using t test. Values were expressed usingmean ± standard deviation (SD). Significance was expressed as * p < 0.05, ** p < 0.01,*** p < 0.001.
5. Conclusions
Quinacrine (QC), an antimalarial compound, has attracted great interest as a repur-posed anti-cancer drug due to its ability to selectively kill tumor cells. In this study, wediscovered that QC significantly upregulates cathepsin L (CTSL) but not CTSB and CTSD,implicating the specific role of CTSL in promoting QC-induced autophagic flux in ovar-ian cancer. QC-induced CTSL activation promotes LMP resulting in active CTSL releaseinto the cytosol, which promotes Bid cleavage, MOMP and cyt-c release. Knockdown ofCTSL markedly reduces QC-induced autophagy, LMP-MOMP; whereas ectopic expressionof CTSL has an opposite effect. Additionally, using recombinant CTSL, we identifiedp62/SQSTM1 as a novel substrate of CTSL. Importantly we showed that upregulationof CTSL in QC-treated HeyA8-MDR xenografts corresponds with attenuation of p62,upregulation of LC3BII, and the generation of cyt-c, tBid, cleaved caspase-3 and PARP.
Supplementary Materials: The following are available online at https://www.mdpi.com/article/10.3390/cancers13092004/s1, Table S1: Source of Materials Used, Figure S1: QC induces potentialcytotoxicity against OC cells. Figure S2. Densitometric analysis of protein expression normalizedto control protein. Figure S3: QC upregulated CTSL drives the autophagic flux by degradingp62 and cell death. Figure S4: Recombinant CTSL cleaves autophagic key cargo protein p62 inHek293T cells. Figure S5: QC induces CTSL mediated LMP. Figure S6. Densitometric analysis ofprotein expression normalized to control protein. Figure S7: QC triggered CTSL disrupts pro andantiapoptotic homeostasis in ovarian cancer cells.
Author Contributions: P.T. and A.K. performed experiments with the support of L.J., J.S. and V.S.;P.T., U.R., Y.X. and V.S. analyzed the experimental results; P.T. designed the images; V.S. supervisedthe project; C.L.P., P.T., U.R. and V.S. wrote the manuscript; and all authors participated in editing themanuscript. Correspondence and requests for materials should be addressed to V.S. All authors haveread and agreed to the published version of the manuscript.
Funding: This work was supported by grants from the Department of Defense Ovarian CancerResearch Program (W81XWH-14-OCRP-IIRA OC140298), the Minnesota Ovarian Cancer Alliance(MOCA), Department of Experimental Pathology and Laboratory, Mayo Clinic, United States, to V.S.).
Institutional Review Board Statement: Not applicable.

Cancers 2021, 13, 2004 18 of 20
Informed Consent Statement: Not applicable.
Data Availability Statement: Data are contained within the article or Supplementary Materials.
Acknowledgments: We would like to acknowledge Daniel Billadeau, Mayo Clinic, Rochester, MN,USA for providing the GFP-RFP-LC3B plasmid. We would like to acknowledge the use of theMicroscopy Core and the Flow Cytometry Facility, Mayo Clinic, Rochester, MN, USA.
Conflicts of Interest: The authors declare no conflict of interest.
References1. Siegel, R.L.; Miller, K.D.; Jemal, A. Cancer statistics, 2018. CA Cancer J. Clin. 2018, 68, 7–30. [CrossRef]2. Armstrong, D.K.; Bundy, B.; Wenzel, L.; Huang, H.Q.; Baergen, R.; Lele, S.; Copeland, L.J.; Walker, J.L.; Burger, R.A. Intraperitoneal
cisplatin and paclitaxel in ovarian cancer. N. Engl. J. Med. 2006, 354, 34–43. [CrossRef]3. Bristow, R.E.; Tomacruz, R.S.; Armstrong, D.K.; Trimble, E.L.; Montz, F.J. Survival effect of maximal cytoreductive surgery for
advanced ovarian carcinoma during the platinum era: A meta-analysis. J. Clin. Oncol. 2002, 20, 1248–1259. [CrossRef] [PubMed]4. Ushijima, K. Treatment for recurrent ovarian cancer-at first relapse. J. Oncol. 2010, 2010, 497429. [CrossRef] [PubMed]5. Agarwal, R.; Kaye, S.B. Ovarian cancer: Strategies for overcoming resistance to chemotherapy. Nat. Rev. Cancer. 2003, 3, 502–516.
[CrossRef] [PubMed]6. Hay, M.; Thomas, D.W.; Craighead, J.L.; Economides, C.; Rosenthal, J. Clinical development success rates for investigational
drugs. Nat. Biotechnol. 2014, 32, 40–51. [CrossRef] [PubMed]7. Pantziarka, P.; Bouche, G.; Meheus, L.; Sukhatme, V.; Sukhatme, V.P.; Vikas, P. The Repurposing Drugs in Oncology (ReDO)
Project. Ecancermedicalscience 2014, 8, 442. [CrossRef]8. Sleire, L.; Førde, H.E.; Netland, I.A.; Leiss, L.; Skeie, B.S.; Enger, P. Drug repurposing in cancer. Pharmacol. Res. 2017, 124, 74–91.
[CrossRef]9. Chong, C.R.; Sullivan, D.J., Jr. New uses for old drugs. Nature 2007, 448, 645–646. [CrossRef] [PubMed]10. Ehsanian, R.; Van Waes, C.; Feller, S.M. Beyond DNA binding—A review of the potential mechanisms mediating quinacrine’s
therapeutic activities in parasitic infections, inflammation, and cancers. Cell Commun. Signal. 2011, 9, 13. [CrossRef]11. Kalogera, E.; Roy, D.; Khurana, A.; Mondal, S.; Weaver, A.L.; He, X.; Dowdy, S.C.; Shridhar, V. Quinacrine in endometrial cancer:
Repurposing an old antimalarial drug. Gynecol. Oncol. 2017, 146, 187–195. [CrossRef]12. de Souza, P.L.; Castillo, M.; Myers, C.E. Enhancement of paclitaxel activity against hormone-refractory prostate cancer cells
in vitro and in vivo by quinacrine. Br. J. Cancer 1997, 75, 1593–1600. [CrossRef]13. Gurova, K.V.; Hill, J.E.; Guo, C.; Prokvolit, A.; Burdelya, L.G.; Samoylova, E.; Khodyakova, A.V.; Ganapathi, R.; Ganapathi, M.;
Tararova, N.D.; et al. Small molecules that reactivate p53 in renal cell carcinoma reveal a NF-kappaB-dependent mechanism ofp53 suppression in tumors. Proc. Natl. Acad. Sci. USA 2005, 102, 17448–17453. [CrossRef]
14. Eriksson, A.; Österroos, A.; Hassan, S.; Gullbo, J.; Rickardson, L.; Jarvius, M.; Nygren, P.; Fryknäs, M.; Höglund, M.; Larsson, R.Drug screen in patient cells suggests quinacrine to be repositioned for treatment of acute myeloid leukemia. Blood Cancer, J. 2015,5, e307. [CrossRef] [PubMed]
15. Friedman, J.; Nottingham, L.; Duggal, P.; Pernas, F.G.; Yan, B.; Yang, X.P.; Chen, Z.; Van Waes, C. Deficient TP53 expression,function, and cisplatin sensitivity are restored by quinacrine in head and neck cancer. Clin. Cancer Res. 2007, 13 Pt 1, 6568–6578.[CrossRef]
16. Dermawan, J.K.; Gurova, K.; Pink, J.; Dowlati, A.; De, S.; Narla, G.; Sharma, N.; Stark, G.R. Quinacrine overcomes resistanceto erlotinib by inhibiting FACT, NF-κB, and cell-cycle progression in non-small cell lung cancer. Mol. Cancer Ther. 2014, 13,2203–2214. [CrossRef] [PubMed]
17. Preet, R.; Mohapatra, P.; Mohanty, S.; Sahu, S.K.; Choudhuri, T.; Wyatt, M.D.; Kundu, C.N. Quinacrine has anticancer activity inbreast cancer cells through inhibition of topoisomerase activity. Int. J. Cancer 2012, 130, 1660–1670. [CrossRef] [PubMed]
18. Khurana, A.; Roy, D.; Kalogera, E.; Mondal, S.; Wen, X.; He, X.; Dowdy, S.; Shridhar, V. Quinacrine promotes autophagic celldeath and chemosensitivity in ovarian cancer and attenuates tumor growth. Oncotarget 2015, 6, 36354–36369. [CrossRef]
19. Oien, D.B.; Pathoulas, C.L.; Ray, U.; Thirusangu, P.; Kalogera, E.; Shridhar, V. Repurposing quinacrine for treatment-refractorycancer. Semin. Cancer Biol. 2019, 68, 21–30. [CrossRef]
20. Jung, D.; Khurana, A.; Roy, D.; Kalogera, E.; Bakkum-Gamez, J.; Chien, J.; Shridhar, V. Quinacrine upregulates p21/p27independent of p53 through autophagy-mediated downregulation of p62-Skp2 axis in ovarian cancer. Sci. Rep. 2018, 8, 2487.[CrossRef]
21. Karch, J.; Schips, T.G.; Maliken, B.D.; Brody, M.J.; Sargent, M.A.; Kanisicak, O.; Molkentin, J.D. Autophagic cell death is dependenton lysosomal membrane permeability through Bax and Bak. eLife 2017, 6, e30543. [CrossRef]
22. Luzio, J.P.; Pryor, P.R.; Bright, N.A. Lysosomes: Fusion and function. Nat. Rev. Mol. Cell Biol. 2007, 8, 622–632. [CrossRef][PubMed]
23. Jaishy, B.; Abel, E.D. Lipids, lysosomes, and autophagy. J. Lipid Res. 2016, 57, 1619–1635. [CrossRef] [PubMed]24. Boya, P.; Kroemer, G. Lysosomal membrane permeabilization in cell death. Oncogene 2008, 27, 6434–6451. [CrossRef] [PubMed]
Cancers 2021, 13, 2004 19 of 20
25. Serrano-Puebla, A.; Boya, P. Lysosomal membrane permeabilization in cell death: New evidence and implications for health anddisease. Ann. N. Y. Acad. Sci. 2016, 1371, 30–44. [CrossRef] [PubMed]
26. Terman, A.; Kurz, T.; Gustafsson, B.; Brunk, U.T. Lysosomal labilization. IUBMB Life 2006, 58, 531–539. [CrossRef] [PubMed]27. Stoka, V.; Turk, B.; Schendel, S.L.; Kim, T.H.; Cirman, T.; Snipas, S.J.; Ellerby, L.M.; Bredesen, D.; Freeze, H.; Abrahamson, M.; et al.
Lysosomal protease pathways to apoptosis. Cleavage of bid, not pro-caspases, is the most likely route. J. Biol. Chem. 2001, 276,3149–3157. [CrossRef]
28. Cirman, T.; Oresic, K.; Mazovec, G.D.; Turk, V.; Reed, J.C.; Myers, R.M.; Salvesen, G.S.; Turk, B. Selective disruption of lysosomesin HeLa cells triggers apoptosis mediated by cleavage of Bid by multiple papain-like lysosomal cathepsins. J. Biol. Chem. 2004,279, 3578–3587. [CrossRef]
29. Turk, B.; Dolenc, I.; Turk, V.; Bieth, J.G. Kinetics of the pH-induced inactivation of human cathepsin L. Biochemistry 1993, 32,375–380. [CrossRef]
30. Kirschke, H.; Wiederanders, B.; Brömme, D.; Rinne, A. Cathepsin S from bovine spleen. Purification, distribution, intracellularlocalization and action on proteins. Biochem. J. 1989, 264, 467–473. [CrossRef]
31. Droga-Mazovec, G.; Bojic, L.; Petelin, A.; Ivanova, S.; Romih, R.; Repnik, U.; Salvesen, G.S.; Stoka, V.; Turk, V.; Turk, B. Cysteinecathepsins trigger caspase-dependent cell death through cleavage of bid and antiapoptotic Bcl-2 homologues. J. Biol. Chem. 2008,283, 19140–19150. [CrossRef]
32. Lüllmann, H.; Lüllmann-Rauch, R.; Wassermann, O. Lipidosis induced by amphiphilic cationic drugs. Biochem. Pharmacol. 1978,27, 1103–1108. [CrossRef]
33. Dennemärker, J.; Lohmüller, T.; Müller, S.; Aguilar, S.V.; Tobin, D.J.; Peters, C.; Reinheckel, T. Impaired turnover of autophagolyso-somes in cathepsin L deficiency. Biol. Chem. 2010, 391, 913–922. [CrossRef]
34. Kirschke, H.; Cathepsin, L. Handbook of Proteolytic Enzymes, 3rd ed.; Academic Press, Elsevier: London, UK, 2013; pp. 1808–1817.35. Aits, S.; Jäättelä, M. Lysosomal cell death at a glance. J. Cell Sci. 2013, 126 Pt 9, 1905–1912. [CrossRef]36. Hsu, K.F.; Wu, C.L.; Huang, S.C.; Wu, C.M.; Hsiao, J.R.; Yo, Y.T.; Chen, Y.H.; Shiau, A.L.; Chou, C.Y. Cathepsin L mediates
resveratrol-induced autophagy and apoptotic cell death in cervical cancer cells. Autophagy 2009, 5, 451–460. [CrossRef]37. Domagala, A.; Fidyt, K.; Bobrowicz, M.; Stachura, J.; Szczygiel, K.; Firczuk, M. Typical and Atypical Inducers of Lysosomal Cell
Death: A Promising Anticancer Strategy. Int. J. Mol. Sci. 2018, 19, 2256. [CrossRef]38. Werneburg, N.W.; Guicciardi, M.E.; Bronk, S.F.; Gores, G.J. Tumor necrosis factor-alpha-associated lysosomal permeabilization is
cathepsin B dependent. Am. J. Physiol. Gastrointest. Liver Physiol. 2002, 283, G947–G956. [CrossRef]39. Boya, P.; Gonzalez-Polo, R.A.; Poncet, D.; Andreau, K.; Vieira, H.L.; Roumier, T.; Perfettini, J.L.; Kroemer, G. Mitochondrial
membrane permeabilization is a critical step of lysosome-initiated apoptosis induced by hydroxychloroquine. Oncogene 2003, 22,3927–3936. [CrossRef] [PubMed]
40. Chen, H.E.; Lin, J.F.; Lin, Y.C.; Wen, S.I.; Yang, S.C.; Tsai, T.F.; Chou, K.Y.; Hwang, I.S. Chloroquine induces lysosomal membranepermeability-mediated cell death in bladder cancer cells [Original Article]. Formos. J. Surgery 2018, 51, 133–141.
41. Li, L.; Gao, L.; Song, Y.; Qin, Z.H.; Liang, Z. Activated cathepsin L is associated with the switch from autophagy to apoptoticdeath of SH-SY5Y cells exposed to 6-hydroxydopamine. Biochem. Biophys. Res. Commun. 2016, 470, 579–585. [CrossRef] [PubMed]
42. Memmert, S.; Nogueira, A.V.B.; Damanaki, A.; Nokhbehsaim, M.; Rath-Deschner, B.; Götz, W.; Gölz, L.; Cirelli, J.A.; Till, A.; Jäger,A.; et al. Regulation of the autophagy-marker Sequestosome 1 in periodontal cells and tissues by biomechanical loading. J. Orofac.Orthop. 2020, 81, 10–21. [CrossRef]
43. Zhou, J.; Tan, S.H.; Nicolas, V.; Bauvy, C.; Yang, N.D.; Zhang, J.; Xue, Y.; Codogno, P.; Shen, H.M. Activation of lysosomal functionin the course of autophagy via mTORC1 suppression and autophagosome-lysosome fusion. Cell Res. 2013, 23, 508–523. [CrossRef][PubMed]
44. Sui, H.; Shi, C.; Yan, Z.; Wu, M. Overexpression of Cathepsin L is associated with chemoresistance and invasion of epithelialovarian cancer. Oncotarget 2016, 7, 45995–46001. [CrossRef] [PubMed]
45. Zhang, L.; Wei, L.; Shen, G.; He, B.; Gong, W.; Min, N.; Zhang, L.; Duan, Y.; Xie, J.; Luo, H.; et al. Cathepsin L is involved inproliferation and invasion of ovarian cancer cells. Mol. Med. Rep. 2015, 11, 468–474. [CrossRef] [PubMed]
46. Vidak, E.; Javoršek, U.; Vizovišek, M.; Turk, B. Cysteine Cathepsins and their Extracellular Roles: Shaping the Microenvironment.Cells 2019, 8, 264. [CrossRef] [PubMed]
47. Zheng, X.; Chu, F.; Chou, P.M.; Gallati, C.; Dier, U.; Mirkin, B.L.; Mousa, S.A.; Rebbaa, A. Cathepsin L inhibition suppresses drugresistance in vitro and in vivo: A putative mechanism. Am. J. Physiol. Cell Physiol. 2009, 296, C65–C74. [CrossRef]
48. Gurova, K. New hopes from old drugs: Revisiting DNA-binding small molecules as anticancer agents. Future Oncol. 2009, 5,1685–1704. [CrossRef]
49. Dennemärker, J.; Lohmüller, T.; Mayerle, J.; Aguilar, S.V.; Tobin, D.J.; Peters, C.; Reinheckel, T. Deficiency for the cysteine proteasecathepsin L promotes tumor progression in mouse epidermis. Oncogene 2010, 29, 1611–1621. [CrossRef]
50. Felbor, U.; Dreier, L.; Bryant, R.A.; Ploegh, H.L.; Olsen, B.R.; Mothes, W. Secreted cathepsin L generates endostatin from collagenXVIII. EMBO J. 2000, 19, 1187–1194. [CrossRef]
51. Thirusangu, P.; Vigneshwaran, V.; Ranganatha, V.L.; Vijay Avin, B.R.; Khanum, S.A.; Mahmood, R.; Jayashree, K.; Prabhakar, B.T.A tumoural angiogenic gateway blocker, Benzophenone-1B represses the HIF-1α nuclear translocation and its target geneactivation against neoplastic progression. Biochem. Pharmacol. 2017, 125, 26–40. [CrossRef]

Cancers 2021, 13, 2004 20 of 20
52. Guzmán, C.; Bagga, M.; Kaur, A.; Westermarck, J.; Abankwa, D. ColonyArea: An ImageJ plugin to automatically quantify colonyformation in clonogenic assays. PLoS ONE 2014, 9, e92444. [CrossRef] [PubMed]
53. Ray, U.; Roy Chowdhury, S.; Vasudevan, M.; Bankar, K.; Roychoudhury, S.; Roy, S.S. Gene regulatory networking reveals themolecular clue to lysophosphatidic acid-induced metabolic adaptations in ovarian cancer cells. Mol. Oncol. 2017, 11, 491–516.[CrossRef] [PubMed]