quick design guide quick tips river inflow …
TRANSCRIPT
RESEARCH POSTER PRESENTATION DESIGN © 2011
www.PosterPresentations.com
QUICK TIPS
(--THIS SECTION DOES NOT PRINT--)
This PowerPoint template requires basic PowerPoint (version
2007 or newer) skills. Below is a list of commonly asked
questions specific to this template.
If you are using an older version of PowerPoint some template
features may not work properly.
Using the template
Verifying the quality of your graphics
Go to the VIEW menu and click on ZOOM to set your preferred
magnification. This template is at 100% the size of the final
poster. All text and graphics will be printed at 100% their
size. To see what your poster will look like when printed, set
the zoom to 100% and evaluate the quality of all your
graphics before you submit your poster for printing.
Using the placeholders
To add text to this template click inside a placeholder and
type in or paste your text. To move a placeholder, click on it
once (to select it), place your cursor on its frame and your
cursor will change to this symbol: Then, click once and
drag it to its new location where you can resize it as needed.
Additional placeholders can be found on the left side of this
template.
Modifying the layout
This template has four
different column layouts.
Right-click your mouse
on the background and
click on “Layout” to see
the layout options.
The columns in the provided layouts are fixed and cannot be
moved but advanced users can modify any layout by going to
VIEW and then SLIDE MASTER.
Importing text and graphics from external sources
TEXT: Paste or type your text into a pre-existing placeholder
or drag in a new placeholder from the left side of the
template. Move it anywhere as needed.
PHOTOS: Drag in a picture placeholder, size it first, click in it
and insert a photo from the menu.
TABLES: You can copy and paste a table from an external
document onto this poster template. To adjust the way the
text fits within the cells of a table that has been pasted,
right-click on the table, click FORMAT SHAPE then click on
TEXT BOX and change the INTERNAL MARGIN values to 0.25
Modifying the color scheme
To change the color scheme of this template go to the
“Design” menu and click on “Colors”. You can choose from
the provide color combinations or you can create your own.
QUICK DESIGN GUIDE (--THIS SECTION DOES NOT PRINT--)
This PowerPoint 2007 template produces a 36”x48”
professional poster. It will save you valuable time placing
titles, subtitles, text, and graphics.
Use it to create your presentation. Then send it to
PosterPresentations.com for premium quality, same day
affordable printing.
We provide a series of online tutorials that will guide you
through the poster design process and answer your poster
production questions.
View our online tutorials at:
http://bit.ly/Poster_creation_help
(copy and paste the link into your web browser).
For assistance and to order your printed poster call
PosterPresentations.com at 1.866.649.3004
Object Placeholders
Use the placeholders provided below to add new elements to
your poster: Drag a placeholder onto the poster area, size it,
and click it to edit.
Section Header placeholder
Move this preformatted section header placeholder to the
poster area to add another section header. Use section
headers to separate topics or concepts within your
presentation.
Text placeholder
Move this preformatted text placeholder to the poster to add
a new body of text.
Picture placeholder
Move this graphic placeholder onto your poster, size it first,
and then click it to add a picture to the poster.
© 2011 PosterPresentations.com 2117 Fourth Street , Unit C Berkeley CA 94710 [email protected]
Student discounts are available on our Facebook page.
Go to PosterPresentations.com and click on the FB icon.
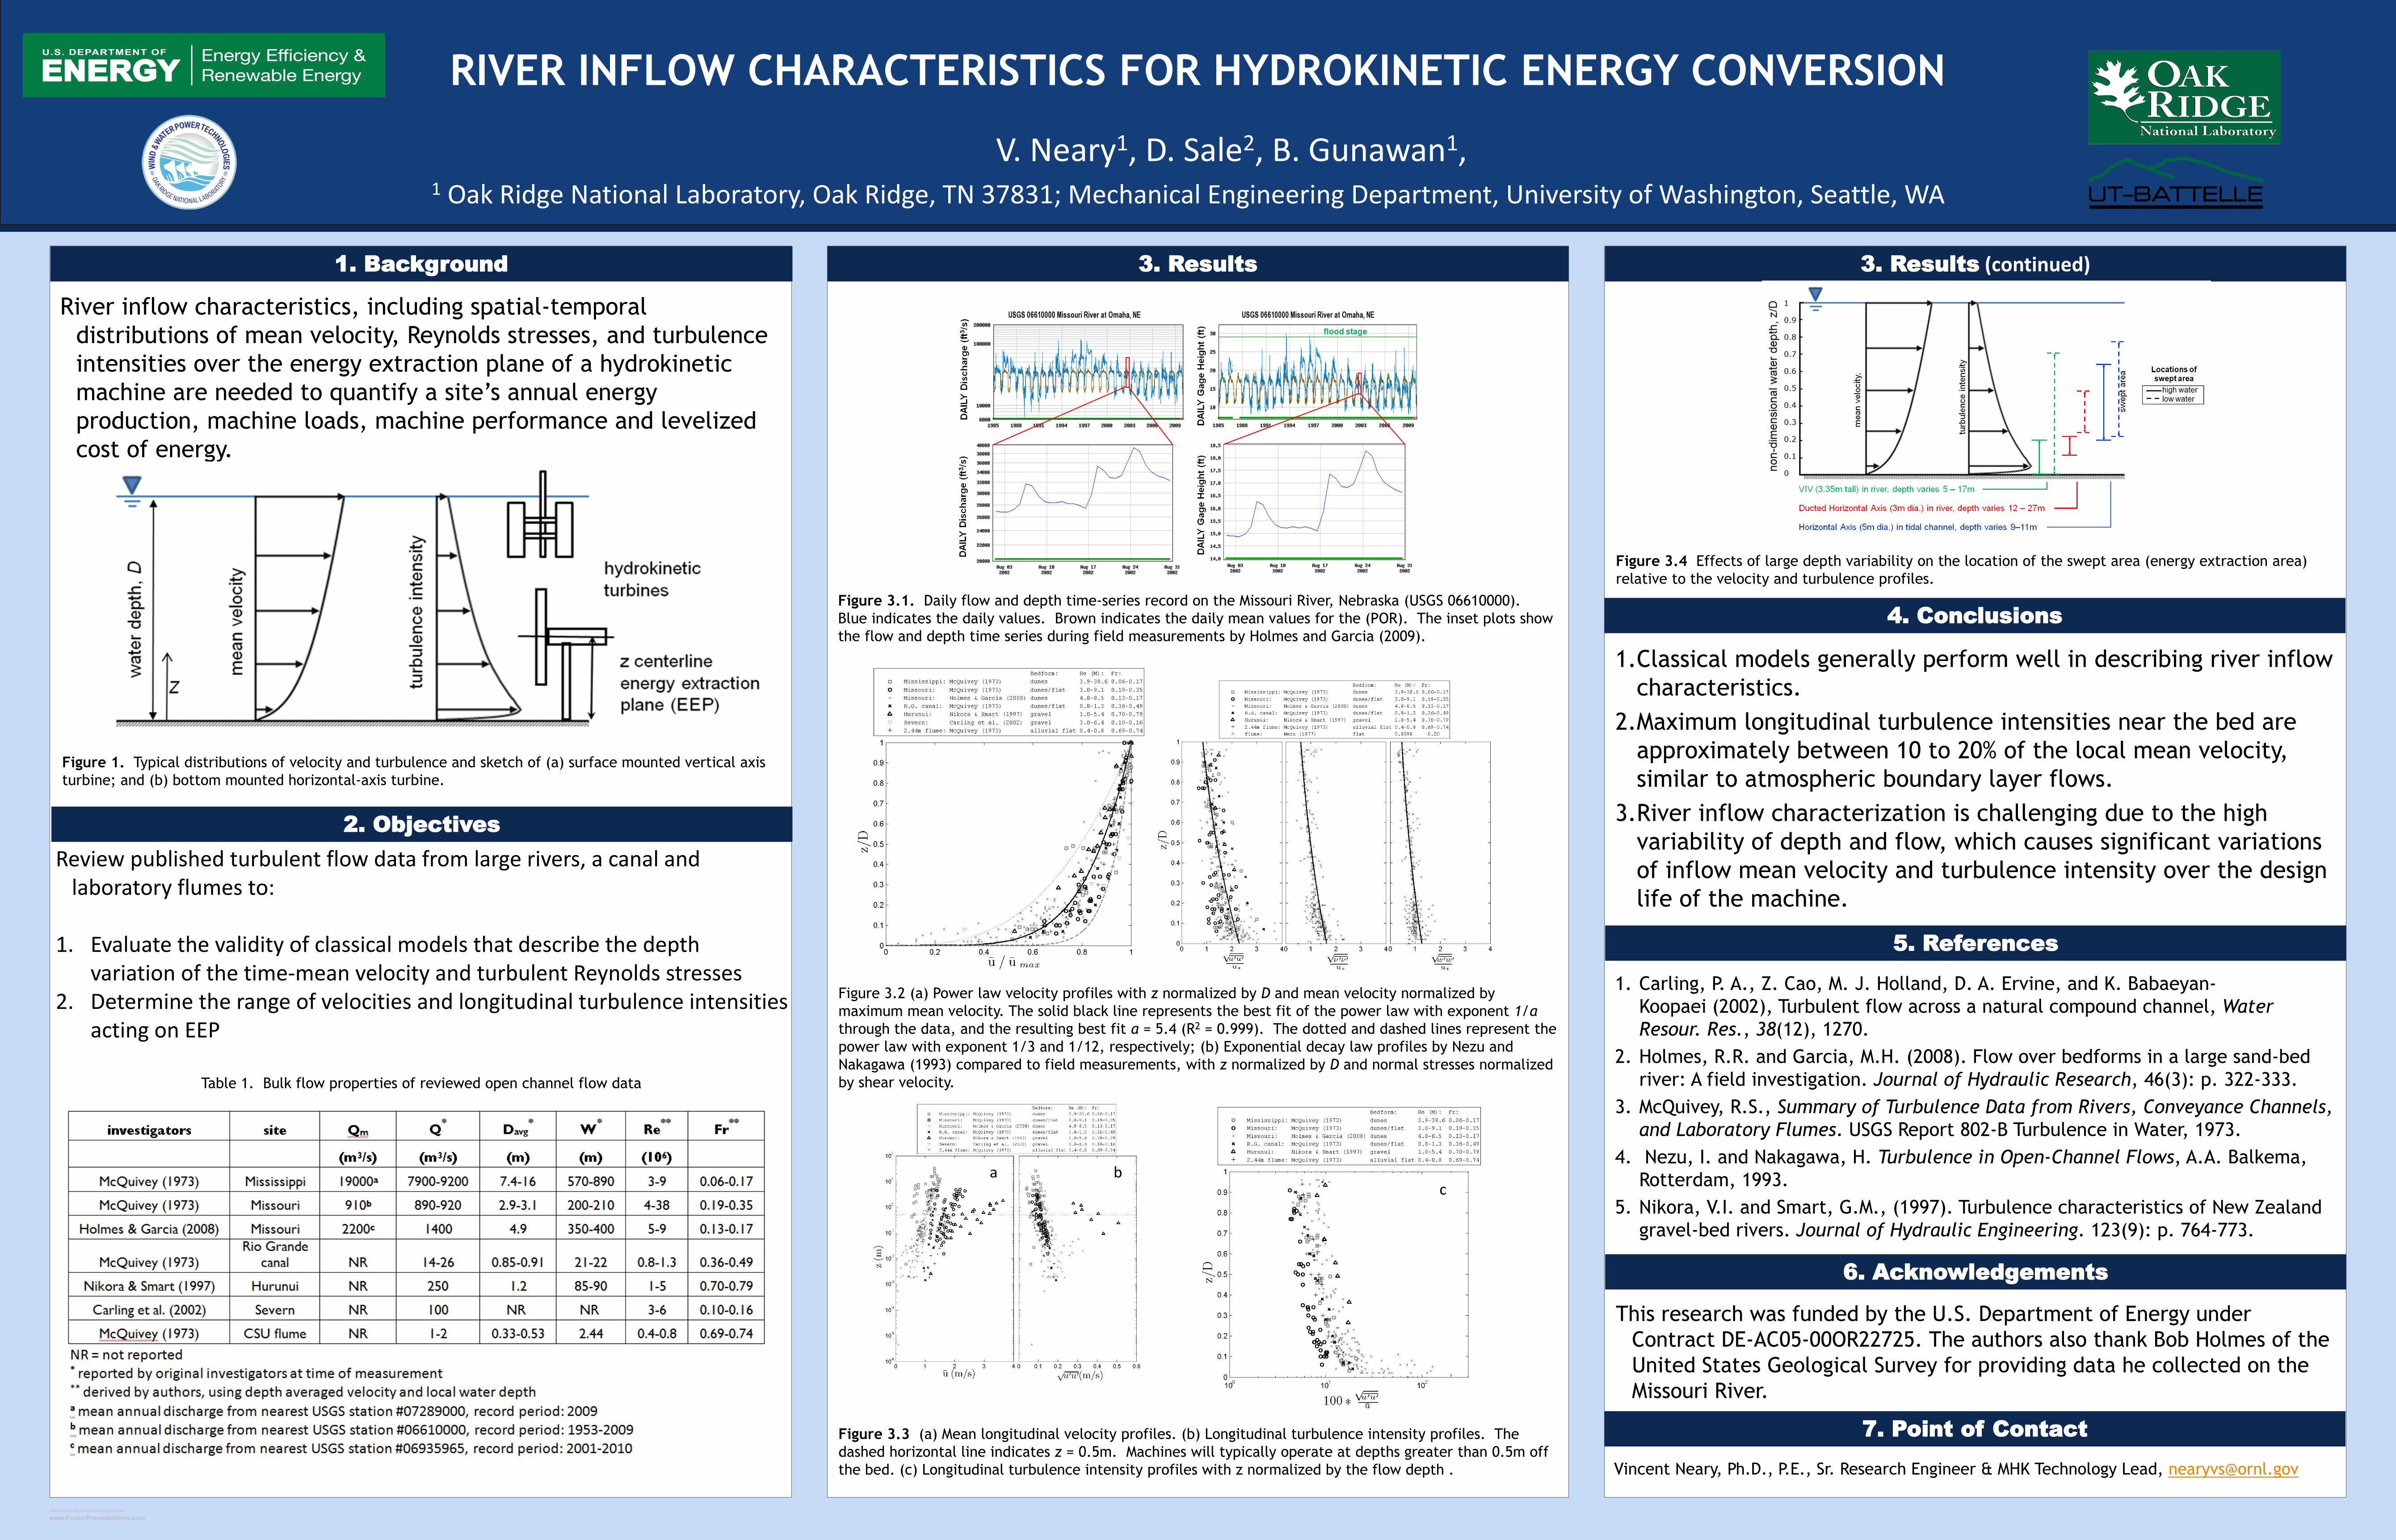
River inflow characteristics, including spatial-temporal
distributions of mean velocity, Reynolds stresses, and turbulence
intensities over the energy extraction plane of a hydrokinetic
machine are needed to quantify a site’s annual energy
production, machine loads, machine performance and levelized
cost of energy.
1. Background 3. Results 3. Results (continued)
1.Classical models generally perform well in describing river inflow
characteristics.
2.Maximum longitudinal turbulence intensities near the bed are
approximately between 10 to 20% of the local mean velocity,
similar to atmospheric boundary layer flows.
3.River inflow characterization is challenging due to the high
variability of depth and flow, which causes significant variations
of inflow mean velocity and turbulence intensity over the design
life of the machine.
5. References
6. Acknowledgements
This research was funded by the U.S. Department of Energy under
Contract DE-AC05-00OR22725. The authors also thank Bob Holmes of the
United States Geological Survey for providing data he collected on the
Missouri River.
RIVER INFLOW CHARACTERISTICS FOR HYDROKINETIC ENERGY CONVERSION
1 Oak Ridge National Laboratory, Oak Ridge, TN 37831; Mechanical Engineering Department, University of Washington, Seattle, WA
V. Neary1, D. Sale2, B. Gunawan1,
1. Carling, P. A., Z. Cao, M. J. Holland, D. A. Ervine, and K. Babaeyan-
Koopaei (2002), Turbulent flow across a natural compound channel, Water
Resour. Res., 38(12), 1270.
2. Holmes, R.R. and Garcia, M.H. (2008). Flow over bedforms in a large sand-bed
river: A field investigation. Journal of Hydraulic Research, 46(3): p. 322-333.
3. McQuivey, R.S., Summary of Turbulence Data from Rivers, Conveyance Channels,
and Laboratory Flumes. USGS Report 802-B Turbulence in Water, 1973.
4. Nezu, I. and Nakagawa, H. Turbulence in Open-Channel Flows, A.A. Balkema,
Rotterdam, 1993.
5. Nikora, V.I. and Smart, G.M., (1997). Turbulence characteristics of New Zealand
gravel-bed rivers. Journal of Hydraulic Engineering. 123(9): p. 764-773.
Table 1. Bulk flow properties of reviewed open channel flow data
Figure 3.4 Effects of large depth variability on the location of the swept area (energy extraction area)
relative to the velocity and turbulence profiles.
Figure 3.3 (a) Mean longitudinal velocity profiles. (b) Longitudinal turbulence intensity profiles. The
dashed horizontal line indicates z = 0.5m. Machines will typically operate at depths greater than 0.5m off
the bed. (c) Longitudinal turbulence intensity profiles with z normalized by the flow depth .
Figure 3.2 (a) Power law velocity profiles with z normalized by D and mean velocity normalized by
maximum mean velocity. The solid black line represents the best fit of the power law with exponent 1/α
through the data, and the resulting best fit α = 5.4 (R2 = 0.999). The dotted and dashed lines represent the
power law with exponent 1/3 and 1/12, respectively; (b) Exponential decay law profiles by Nezu and
Nakagawa (1993) compared to field measurements, with z normalized by D and normal stresses normalized
by shear velocity.
Figure 3.1. Daily flow and depth time-series record on the Missouri River, Nebraska (USGS 06610000).
Blue indicates the daily values. Brown indicates the daily mean values for the (POR). The inset plots show
the flow and depth time series during field measurements by Holmes and Garcia (2009).
Figure 1. Typical distributions of velocity and turbulence and sketch of (a) surface mounted vertical axis
turbine; and (b) bottom mounted horizontal-axis turbine.
4. Conclusions
2. Objectives
Review published turbulent flow data from large rivers, a canal and laboratory flumes to:
1. Evaluate the validity of classical models that describe the depth
variation of the time-mean velocity and turbulent Reynolds stresses 2. Determine the range of velocities and longitudinal turbulence intensities
acting on EEP
a b c
7. Point of Contact
Vincent Neary, Ph.D., P.E., Sr. Research Engineer & MHK Technology Lead, [email protected]