quick assessment protocols - amazon web services... · usepa region 5 is the entity within the...
TRANSCRIPT

EPA/600/R-08/061 May 2008
Quick Assessment Protocols for Measuring Relative Ecological Significance
of Terrestrial Ecosystems
By
Audrey L. Mayer*, Allison H. Roy Sustainable Technology Division
National Risk Management Research Laboratory US Environmental Protection Agency
Cincinnati, OH 45268
and
Mary White Office of Strategic Environmental Analysis
US Environmental Protection Agency Region 5 Chicago, IL 60604
and
Charles G. Maurice Office of Research and Development—Office of Science Policy
and Region 5—Superfund Division US Environmental Protection Agency
Chicago, IL 60604
and
Landon McKinney ASC Group, Inc.
Columbus, OH 43214
National Risk Management Research Laboratory Office of Research and Development
U.S. Environmental Protection Agency Cincinnati, OH 45268
* Current Address: University of Helsinki, Faculty of Biosciences, P.O. Box 27, 00014 Helsinki FINLAND

Notice
The U.S. Environmental Protection Agency through its Office of Research and Development funded and collaborated in the research described here under the Regional Applied Research Effort (RARE) internal grant program with Region 5, through a project called “Development of Methods to Evaluate Critical Ecosystems.” Protocol development and planning meetings were supported under work assignment 68-C-02-067 to Science Applications International Corporation (SAIC); creation and formatting of draft protocols and the Quality Assurance Project Plan was accomplished under contract 68-W-02018 though the Great Lakes National Program Office to Booz Allen Hamilton; and field data collection was performed under simplified acquisition GS-10F-0114M to ASC Group, Inc. It has been subjected to the Agency‘s peer and administrative review and has been approved for publication as an EPA document.
Disclaimer
Mention of trade names or commercial products does not constitute endorsement or recommendation for use.
ii

Foreword
The U. S. Environmental Protection Agency (USEPA) is charged by Congress with protecting the Nation's land, air, and water resources. Under a mandate of national environmental laws, the Agency strives to formulate and implement actions leading to a compatible balance between human activities and the ability of natural systems to support and nurture life. To meet this mandate, USEPA’s research program is providing data and technical support for solving environmental problems today and building a science knowledge base necessary to manage our ecological resources wisely, understand how pollutants affect our health, and prevent or reduce environmental risks in the future.
The National Risk Management Research Laboratory (NRMRL) is the Agency's center for investigation of technological and management approaches for preventing and reducing risks from pollution that threaten human health and the environment. The focus of the Laboratory's research program is on methods and their cost-effectiveness for prevention and control of pollution to air, land, water, and subsurface resources; protection of water quality in public water systems; remediation of contaminated sites, sediments and ground water; prevention and control of indoor air pollution; and restoration of ecosystems. NRMRL collaborates with both public and private sector partners to foster technologies that reduce the cost of compliance and to anticipate emerging problems. NRMRL's research provides solutions to environmental problems by: developing and promoting technologies that protect and improve the environment; advancing scientific and engineering information to support regulatory and policy decisions; and providing the technical support and information transfer to ensure implementation of environmental regulations and strategies at the national, state, and community levels.
This publication has been produced as part of the Laboratory's strategic long-term research plan. It is published and made available by USEPA's Office of Research and Development to assist the user community and to link researchers with their clients.
Sally Gutierrez, Director National Risk Management Research Laboratory
iii

Abstract
Land use change in USEPA’s Region 5 (Illinois, Indiana, Michigan, Minnesota, Ohio, and Wisconsin) is occurring rapidly, particularly with the loss of agricultural land and gain in forest and urbanized land use. The risk of losing habitats and ecosystems that are critical to the health of the Region is therefore very high; however, identifying high quality, critical habitats remains a challenge. To address this issue, USEPA researchers developed a spatially-explicit, geographic information system (GIS)-based model called the “Critical Ecosystem Assessment Model” or “CrEAM”. The CrEAM generated a relative ecological significance score for each undeveloped 300 m by 300 m cell within USEPA Region 5. This report details protocols that were developed to gather field data to independently and quantitatively verify the CrEAM generated score. The protocols prescribe data collection which capture measures of diversity, rarity, and persistence for forested, nonforested, and wetland ecosystems. For each 300 m by 300 m site, data are collected in a 4-hour time period, by a team of 4 people. Data collected using the protocols in field trials in 2005 and 2006 did not match well with the corresponding CrEAM scores. However, particularly with respect to the plant communities, the protocol data did reflect qualitative site assessments conducted by professional ecologists. The protocols were straight-forward to implement in the field and may be useful for applications beyond this project.
iv

Table of Contents
Notice …………………………………………………………………………………. ii
Disclaimer …………………………………….……………………………………. ....ii
Foreword ………………………………………………………………...………….... iii
Abstract …………………………………………………………………..…………... iv
Table of contents ………………………………………………………………..……. v
List of tables …………………………………………………………………..……… vi
List of figures …………………………………………………………………….….. vi
Acknowledgements …………………………………………………………………... vii
Chapter 1 Introduction ..……………………………………………………………... 1
Chapter 2 Overview of the CrEAM Model …..……………………………………... 3 Landscape diversity criteria .................................................................................. 8 Ecological persistence criteria ................................................................................8 Landscape rarity ...……………………………………………………………..… 10 Composite scores (Diversity + Persistence + Rarity) ………………………….....10
Model validation ……………………………………………………………….... 11 Potential applications ……………………………………………………………. 13
Endnotes …………………………………………………………………………. 13
Chapter 3 Protocol development and testing ………………………………………... 15 Field data collection using the protocols ………………………………………... 17 Issues in protocol use …………………………………………………………..... 19
Chapter 4 Data analysis ……………………………………………………………… 21 Methods …………………………………………………………………………. 21 Results ………………………………………………………………………….... 23 Discussion ……………………………………………………………………...…31
References ……………………………………………………………………..………33
Appendix A List of meeting participants and affiliations ...…………………………. A-1
Appendix B Forested terrestrial protocol and datasheets ………………..………...... B-1
Appendix C Nonforested terrestrial protocol and datasheets …………………..……. C-1
Appendix D Wetlands protocol and datasheets ……………………………............... D-1
Appendix E Quality Assurance Project Plan (QAPP) ………………………............. E-1
v

Tables
Table 2.1. Land cover pixel aggregation of NLCD data ……………………………………………...… 4
Table 2.2. Descriptions of CrEAM layers and scoring …………………………………………………. 5
Table 3.1. USEPA quick protocols versus other protocols …………………………………………….. 16
Table 3.2. Predicted versus observed site conditions ………………………………………..………...… 17
Table 4.1. Summary Kruskal-Wallis statistics for CrEAM predicted rank ………………………..……. 24
Table 4.2. Summary Kruskal-Wallis statistics for qualitative site assessment rank …...…….................. 25
Table 4.3. Summary Kruskal-Wallis statistics for site characteristics by land cover class ….................... 29
Figures
Figure 2.1. Three composite CrEAM layers and combined layer ………………………………….......... 11
Figure 3.1. Location of field sites in 2005 and 2006 ……………………………………………………. 18
Figure 4.2. Qualitative site assessment rankings, diversity and richness variables …………………...… 26
Figure 4.3. Qualitative site assessment rankings, diversity and richness for forests …………………..… 27
Figure 4.4. Qualitative site assessment rankings, diversity and richness for nonforests ………………… 28
Figure 4.5. Qualitative site assessment rankings, diversity and richness for wetlands ………………….. 28
Figure 4.6. Richness and diversity differences between forest, nonforest, and wetland sites ………….. 30
Figure 4.7. Richness and diversity differences between wetland subclasses …………………………… 31
vi

Acknowledgements
This work is the culmination of the effort of many people over many years, and we would like to acknowledge their contribution here.
Dr. Heriberto Cabezas was chief of the Sustainable Environments Branch at the ORD-NRMRL lab in Cincinnati, Ohio during the project, and we gratefully acknowledge his oversight, scientific advice, and support for this project from the initial planning stages through its completion. Several USEPA-Region 5 staff members were critical to the project, and we wish to extend a special thanks to Dr. David Macarus and Mr. John Perrecone. We also thank Dr. Matthew Hopton at USEPA-ORD-Cincinnati for help with Figure 2.1, and thank Mr. John McCready at USEPA-ORD-Cincinnati for creating the report cover design and CD jacket design. Pictures on the cover were taken by the contractor under simplified acquisition #GS-10F0114M. Dr. Audrey Mayer, Mr. Brian Westfall, and Dr. Allison Roy were project officers for various portions of the project.
Much of the protocol testing and data collection occurred on state or federally owned parks and preserves, and we thank the staff in these areas for their invaluable service. These areas include: Midewin National Tallgrass Prairie (IL), Cook County Forest Preserve (IL), Muscatatuck National Wildlife Refuge (IN), Big Oaks National Wildlife Refuge (IN), Hoosier National Forest, Indiana Dunes State Park (IN), Hoosier Prairie State Nature Preserve (IN), Hartwick Pines State Park (MI), Warren Dunes State Park (MI), Silver Lake State Park (MI), Lake Superior State Forest (MI), Huron-Manistee National Forest (MI), Irwin Prairie State Nature Preserve (OH), Secor Metro Park (Toledo Metroparks, OH), along with sites owned by the YMCA, The Nature Conservancy, and the University of Michigan. We are especially grateful for assistance from: Sam Whiteleather (Minnehaha State Fish and Wildlife Preserve, IN); John Jaeger (Toledo Metroparks, OH); Steve Harvey (Irwin Prairie State Preserve, OH); Cloyce Hedge, Ron Hellmich, and Jack Nelson (Indiana Department of Natural Resources); and Greg Schneider and Rick Gardner (Ohio Department of Natural Resources).
We would also like to especially thank the participants of the protocol development meetings, whom we list in Appendix A. These researchers were an invaluable part of the process, helping shape the protocols and boundaries for their use and application. However, the final protocols presented here inevitably differ from the earlier drafts, and therefore acknowledgement of these individuals should not be construed as acceptance of the final protocols and analyses.
Students at the University of Helsinki, Department of Biological and Environmental Sciences, participated in forest data collection in Finland and northwestern Russia using the forest protocol. They provided invaluable comments and suggestions which improved the protocol, and so we would like to thank Annukka Luomi, Noora Nieminen, Leena Nukari, and Leena Vihermaa for their hard work and interest.
Finally, we would like to thank Dr. Denis White at the USEPA-ORD-Corvallis; Dr. Doug Boucher, Director of the Tropical Forest and Climate Initiative, Union of Concerned Scientists; and an anonymous statistician for their thoughtful and thorough reviews on earlier drafts of this report.
Dr. Audrey Mayer was supported by the Academy of Finland from 2006-2008.
vii


CHAPTER 1 Introduction
Land use change in the USEPA Region 5 is occurring rapidly, particularly the loss of agricultural land and gain in forest and urbanized land use (Potts et al. 2004). The USEPA Region 5 is the entity within the USEPA with jurisdictional authority for the geographic region consisting of Illinois, Indiana, Michigan, Minnesota, Ohio, and Wisconsin. Henceforth in this report, it will be referred to simply as Region 5. The USEPA is charged with protecting human health and the environment, and the rapid rate of land use change in Region 5 has increased the risk of losing high quality habitats and ecosystems. Therefore, Region 5 senior management viewed protecting areas of relatively high ecological significance as “critical” to the USEPA mission. Identifying and delineating critical ecosystems throughout the roughly 1 million km2 region is a difficult task. Further, it is even more difficult to quantify the levels of ecological significance over such a large region. Identifying and delineating areas of high ecological significance, so that they can be protected, is an important but difficult task. It is even more difficult to quantify the level of ecological significance of an area. Currently, the level of ecological significance of an area is frequently identified using best professional judgment. These judgments are rarely verified through independent, quantitative methods and they can be influenced by personal and professional biases.
To meet the need to identify and delineate critical ecosystems across Region 5, and to rate the relative ecological significance of these undeveloped areas, USEPA researchers developed a predictive model which used remote sensing technology, spatially explicit data sets, and a geographic information system (GIS). This GIS-based predictive model is referred to as the “Critical Ecosystem Assessment Model” or “CrEAM”. The USEPA researchers defined and estimated relative ecological significance by applying three equally weighted criteria: ecological diversity, rarity of land cover type and features, and persistence of the habitat structure and community (i.e., the inverse of physical and chemical perturbation). In turn, the relative magnitudes of each of these criteria were estimated by indicator measures based on spatially explicit data sets and manipulations of those data sets. The CrEAM provides two types of output maps or relative scores for each 300 m x 300 m area of undeveloped land. Results for each of the three criteria can be accessed as well as the relative cumulative ratings or scores.
Although this report is primarily intended to describe three rapid ecological assessment protocols, we include in this report an abbreviated description of the CrEAM, including its methodology, data sources, and results, since verification of this model was the primary reason for developing the protocols. Because of this linkage with the CrEAM, several characteristics of the protocols are a direct consequence of the methods used in the CrEAM, as well as the test data being collected throughout Region 5. Protocol characteristics incorporated from the CrEAM include the 300 m by 300 m data collection area, the land cover classes covered by the protocols, and the emphasis in the protocols on collecting data to measure the diversity and rarity of, and threats to, an area. In 2005, the USEPA Science Advisory Board (SAB) reviewed CrEAM and offered a detailed assessment on the model’s methodology and appropriate applications (Federal Register 2005, Science Advisory Board 2005). Comments from this assessment are incorporated into this description of CrEAM as footnotes and a discussion at the end of Chapter 2.
Chapter 3 provides an explanation of how the protocols were developed and tested, and highlights specific issues that emerged during the field tests. The protocols are designed for sampling forested (deciduous, evergreen, mixed), nonforested (grassland, shrubland, bare rock/sand/clay), and wetland (herbaceous, woody) ecosystems. These protocols were developed and tested over a 3 year period. Initial drafts were prepared by over 30 ecologists during a 2-day meeting held at the Region 5 offices in Chicago, Illinois. These draft protocols were first tested in the field by Region 5 and USEPA Office of Research & Development (ORD) personnel in the Chicago area, and adjustments to the protocols were made after this initial test. A full test of the protocols was performed during a 3-day meeting in Bloomington Indiana; again, over 30 ecologists participated, including some from the first protocol drafting meeting.
These final protocols were used to collect data at 26 sites during the summer of 2005 and 2006. The data were then used to assess the capability of these protocols to distinguish between plots having relatively high, medium, and low ecological significance as per CrEAM predictions. In 2005, we chose field sites throughout Region 5 to get an even number of sites in each of the 8 land cover classes (deciduous, mixed, evergreen forest; grassland, shrubland, dunes nonforested; forested and emergent wetland), and in
1

each of three relative ecological significance categories (high, medium, and low) predicted by the CrEAM, based on the cumulative score of each 300 m by 300 m cell (Table 3.1). Due to the lack of areas exhibiting a high level of ecological significance in the southern half of the Region, the majority of these sites were in Minnesota, Wisconsin, and Michigan. Between the 2005 and 2006 field seasons, our focus changed from verifying the CrEAM to testing the protocols themselves. In 2006, ASC Group, Inc. collected data at an additional 10 sites throughout the southern half of the Region, again representing all protocols. By the end of the two summers, data had been collected for a total of 26 sites, with 5 sites for each of the following land cover types: deciduous forest, mixed forest, forested wetlands, emergent wetlands, and grasslands. In Chapter 4, we analyzed the data collected with respect to 1) CrEAM predictions of the site, and 2) qualitative assessments of site condition.
The protocols prescribe the collection of data on a 300 m by 300 m site, in a 4 hour time period, by a team of 4 people. These data are used as measures of sample plot characteristics, such as amount of human disturbance, soil features, and flora and fauna community compositions, which taken together can indicate the relative level of ecological significance. In this respect, the protocols may prove useful for other applications.
2

CHAPTER 2 Overview of the CrEAM model
Although natural resource managers are responsible for decisions which affect their jurisdictions at several scales, information to support these decisions is rarely available for all but the smallest areas. This is particularly true for the significance of a small area to ecological sustainability goals for larger assessment regions, regardless of how this significance is measured (e.g., Jenson et al. 1996, Costanza and Mageau 1999, O’Malley and Wing 2000, Xu et al. 2001, Campbell 2001). Collecting data that are consistent and comparable over large areas is an additional challenge to informed decision-making (Levin et al. 1997, Gaston 2000, Patil et al. 2001, Verburg et al. 2002). Landscape-scale ecological assessment methods have been developed for the Mid-Atlantic Region of the United States (the Regional Vulnerability Assessment (REVA); Jones et al. 1997, Patil et al. 2002, Locantore et al. 2004, Smith et al. 2004), as well as the state of Maryland (the Green Infrastructure Assessment; Weber and Wolf 2000), but the unique landscape disturbances in the northern midwestern United States, dominated by intense agriculture, suggested that a different methodology would be prudent.
The Critical Ecosystems Team of USEPA Region 5 was charged with the task of assessing ecological significance1
in the six Region 5 states. For this effort, ecologically significant areas were considered to be distinct, unique landscapes with high levels of biological diversity, persistence, and rarity. Although this does not follow a strict, ecological definition, this operational definition focused the criteria on essential characteristics of robust ecosystems, and could be used to identify the quality or condition of habitat patches. In this report, the model was validated by comparing GIS model predictions to field data measuring the same characteristics (diversity, persistence, rarity), rather than a broader definition of ecological significance. The primary objective of the model was to identify the most ecologically significant areas across the Region so that Regional USEPA staff could use the information to:
• guide internal USEPA resource allocations; • track general landscape-scale conditions in the
Region; • aid in reviewing grant proposals; • identify and target protection and restoration efforts; • aid in issuing and/or reviewing air and water quality
permits; • inform National Environmental Policy Act (NEPA)
reviews; • and help set compliance, enforcement or cleanup
targets2. A GIS platform was used to allow investigators to
efficiently aggregate multiple geographically referenced datasets, and can be used effectively to conduct landscape scale analysis (van Horssen et al. 1999, Aspinall and Pearson 2000, DellaSalla et al. 2001, Bojórquez-Tapia et al. 2002). The National Land Cover Database3 (NLCD, Loveland and Shaw 1996) with a picture element (“pixel”4) size of 30 m by 30 m was used as the base layer. This database was generated by the Multi-Resolution Land Characteristics (MRLC) program, begun as a cooperative effort among four U.S. government agencies at the Earth Resources Observation Systems (EROS) Data Center of the US Geological Survey. The coverage is a mosaic of satellite scenes taken between 1990 and 1992 in which the pixels were classified into 23 land cover types in the continental United States (Anderson et al. 1976).
In Region 5, three of 23 potential land cover categories (perennial ice/snow, evergreen shrub land, and mixed shrub land) were not present. Of the 20 land cover categories in Region 5, nine are considered undeveloped and therefore ecologically significant (Wade and Ebert 2005). These nine (mixed forest, bare rock/sand/clay, evergreen forest, deciduous forest, shrub land, woody wetlands, herbaceous wetlands, grasslands/herbaceous vegetation) plus open water (lakes and rivers, excluding the Great Lakes) were used in further analyses. The original 30 m by 30 m pixels from the NLCD were aggregated into 300 m by 300 m cells to facilitate computer processing. These cells were assigned the land cover classification possessed by the majority of the 10 by 10 pixels (Table 2.1). In forested areas where there was no majority, deciduous and coniferous forest tallies were summed and reclassified as mixed forest.
3

Table 2.1. Percent of pixels by land cover for undeveloped data and number of cells after aggregation by median and dominance.
NLCD land cover type
Original data 2 (% 30 m
pixels)
Aggregated by median
(% 300 m2 pixels)
Aggregated by dominance
(% 300 m2 pixels)
Error rate for aggregation by dominance (%)
Open water 7.39 7.44 8.20 10.92 Sand/rock 0.05 0.05 0.03 -48.84 Deciduous forest 52.42 52.51 56.08 6.98 Coniferous forest 7.02 6.93 6.36 -9.39 Mixed forest 6.94 6.89 4.24 -38.87 Shrubland 0.32 0.32 0.22 -31.52 Grassland 1.79 1.78 0.64 -64.30 Woody wetland 18.58 18.60 20.21 8.76 Herbaceous wetland 5.50 5.48 4.03 -26.63
The CrEAM is a landscape scale assessment method using GIS to compile a variety of spatially explicit data available for the region, describing three broad categories:
1. Landscape diversity5: The presence of population, community, and/or ecosystem diversity (Ehrlich and Wilson 1991, Chapin et al. 2000);
2. Ecological persistence: The potential for an ecosystem to persist without loss or decline, preferably without external assistance or management (Dale et al. 2000, Gunderson et al. 2002);
3. Landscape rarity: The occurrences of rare native species, or communities and land cover types of special ecological interest (Dobson et al. 1997, Pimm and Lawton 1998).
Relevant existing datasets were used as indicators for the three criteria. Datasets were spatially and temporally consistent, covering the entire six state region, and representative of conditions that existed in the early 1990’s. A total of 20 datasets were used as indicators for the three criteria: 4 for landscape diversity, 12 for ecological persistence, and 4 for landscape rarity (Table 2.2). In all of the data layers and resultant criteria layers, scores were scaled from 0 to 100, with zero indicating the lowest quality, the greatest stress, or the least valuable observation.
4
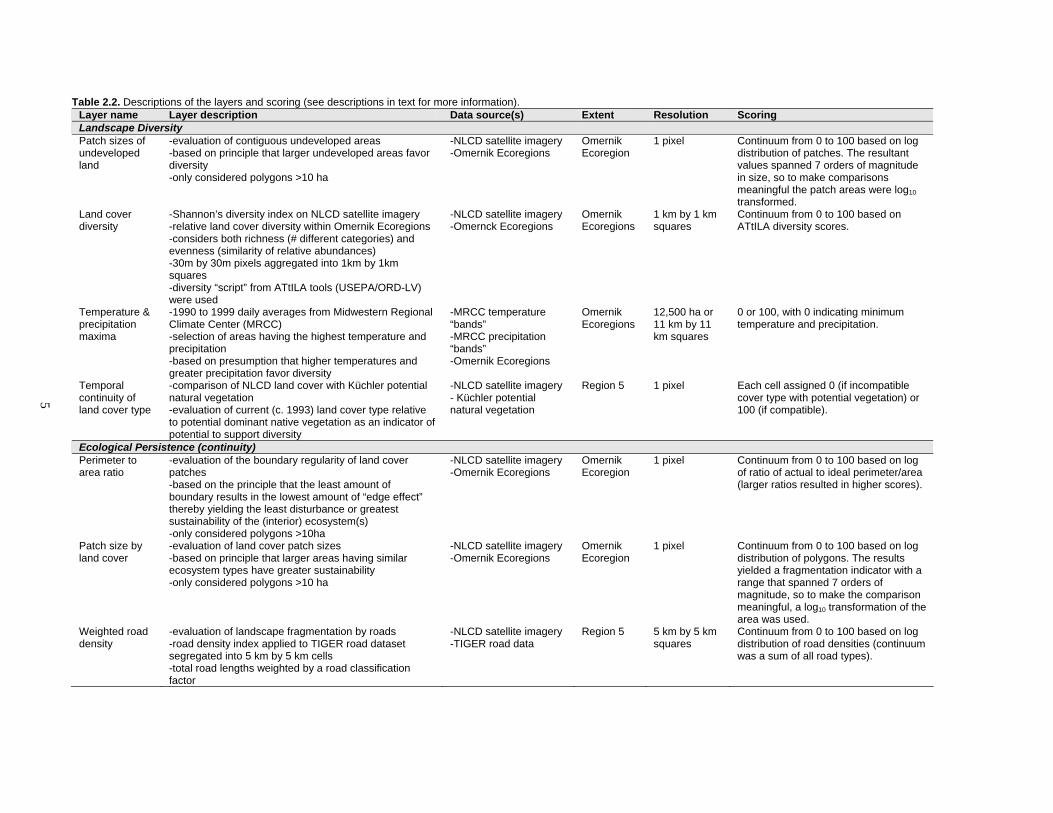
Table 2.2. Descriptions of the layers and scoring (see descriptions in text for more information). Layer name Layer description Data source(s) Extent Resolution Scoring Landscape Diversity Patch sizes of -evaluation of contiguous undeveloped areas -NLCD satellite imagery Omernik 1 pixel Continuum from 0 to 100 based on log undeveloped -based on principle that larger undeveloped areas favor -Omernik Ecoregions Ecoregion distribution of patches. The resultant land diversity values spanned 7 orders of magnitude
-only considered polygons >10 ha in size, so to make comparisons meaningful the patch areas were log10 transformed.
Land cover -Shannon’s diversity index on NLCD satellite imagery -NLCD satellite imagery Omernik 1 km by 1 km Continuum from 0 to 100 based ondiversity -relative land cover diversity within Omernik Ecoregions -Omernck Ecoregions Ecoregions squares ATtILA diversity scores.
-considers both richness (# different categories) and evenness (similarity of relative abundances) -30m by 30m pixels aggregated into 1km by 1km squares-diversity “script” from ATtILA tools (USEPA/ORD-LV) were used
Temperature & -1990 to 1999 daily averages from Midwestern Regional -MRCC temperature Omernik 12,500 ha or 0 or 100, with 0 indicating minimum precipitation Climate Center (MRCC) “bands” Ecoregions 11 km by 11 temperature and precipitation. maxima -selection of areas having the highest temperature and -MRCC precipitation km squares
precipitation “bands” -based on presumption that higher temperatures and -Omernik Ecoregions greater precipitation favor diversity
Temporal -comparison of NLCD land cover with Küchler potential -NLCD satellite imagery Region 5 1 pixel Each cell assigned 0 (if incompatible continuity of natural vegetation - Küchler potential cover type with potential vegetation) or land cover type -evaluation of current (c. 1993) land cover type relative natural vegetation 100 (if compatible).
to potential dominant native vegetation as an indicator of potential to support diversity
Ecological Persistence (continuity) Perimeter to -evaluation of the boundary regularity of land cover -NLCD satellite imagery Omernik 1 pixel Continuum from 0 to 100 based on log area ratio patches -Omernik Ecoregions Ecoregion of ratio of actual to ideal perimeter/area
-based on the principle that the least amount of (larger ratios resulted in higher scores). boundary results in the lowest amount of “edge effect” thereby yielding the least disturbance or greatest sustainability of the (interior) ecosystem(s)-only considered polygons >10ha
Patch size by -evaluation of land cover patch sizes -NLCD satellite imagery Omernik 1 pixel Continuum from 0 to 100 based on log land cover -based on principle that larger areas having similar -Omernik Ecoregions Ecoregion distribution of polygons. The results
ecosystem types have greater sustainability yielded a fragmentation indicator with a -only considered polygons >10 ha range that spanned 7 orders of
magnitude, so to make the comparison meaningful, a log10 transformation of the area was used.
Weighted road -evaluation of landscape fragmentation by roads -NLCD satellite imagery Region 5 5 km by 5 km Continuum from 0 to 100 based on log density -road density index applied to TIGER road dataset -TIGER road data squares distribution of road densities (continuum
segregated into 5 km by 5 km cells was a sum of all road types). -total road lengths weighted by a road classificationfactor
5

Layer name Layer description Data source(s) Extent Resolution Scoring Waterway -identification of reservoirs for downgrading based on -NLCD satellite imagery Region 5 1 pixel 0 or 100, with 0 indicating that a dam or impoundment dam locations Corps of Engineers dam other impoundment is present, 100 no
-dams and corresponding reservoirs interrupt the data impoundments.continuities (fragmentation) of waterways -intersection of NLCD open water and wetland patches with Corps of Engineers dam locations
Land cover -comparison of NLCD land cover with Küchler potential -NLCD satellite imagery Region 5 <90 ha or <1 0 (current land cover not matchingsuitability natural vegetation - Küchler potential km by 1 km potential vegetation) or 100 (current
-evaluation of current (c. 1993) land cover relative to natural vegetation cover matching potential). potential dominant native vegetation as an indicator ofthe likelihood of sustainability of the correspondingecosystems
Ecological Persistence (stressors) Airport buffers -the zone of disturbance extents surrounding airports
are directly related to the sizes of the airplanes utilizing FAA runway length data Region 5 0.5 cell 0 (at or within an airport buffer zone) or
100 (outside of buffer)6.them. Further, airplane sizes are directly related to airport runway lengths. Therefore, the extents of the zone of disturbance are directly related to the runwaylengths.
National Priority -unowned sites where hazardous waste was released to Region 5 CIRCLIS Region 5 0.5 cell 0 (at or within 300 m of a site) or 100 List Superfund the environment and which were in the formal clean up database (outside of buffer). sites process during FY2000
-site property, plus a 300 m “disturbance zone” around the periphery, is downgraded
RCRA owned sites where hazardous waste was released to Region 5 RCRIS Region 5 0.5 cell 0 (at or within 300 m of a site) or 100 Corrective the environment and which were in the formal clean up database (outside of buffer). Action sites process during FY2000
-facility property, plus a 300 m “disturbance zone” around the periphery, is downgraded
Water quality -ambient levels of total suspended solids, dissolved STORET water quality Omernik 8-digit HUC Cells in HUCs which had no violations summary oxygen, and nitrate/nitrite nitrogen based on summary of data Ecoregion of pollution thresholds received 100, if
1990 to 1994 NPDES permitted discharge levels one threshold exceeded the cell -using USEPA Office of Water BASINS model to received 66, if two thresholds 33, if alldetermine ambient levels three thresholds 0.
Watershed -dam density by watershed Corps of Engineers dam Region 5 1 pixel Continuum depending upon the number obstruction -normalized for watershed area data of dams in a HUC (from 0 to 209).Air quality -OPPT air risk model output for 85 pollutants TRI data Region 6 Census tract Cells in census tracts with no qualitysummary -human health toxicity used as a surrogate for violations or exceptions received 100,
ecotoxicity cells with five or more received 0, and -scoring based on number of pollutants that exceeded a the rest received a continuous score chronic non-cancer threshold between 0 and 100.
Development -activities in urban and agricultural areas generate disturbance disturbances to surrounding areas
NLCD satellite imagery Region 5 1 pixel 0 (at or within 300 m buffer) or 100(outside of buffer)7.
buffer -300 m width buffer zone will surround >10 ha urban and agricultural polygons -takes into account stressors such as pesticides, fertilizers, and noise
6

Layer name Layer description Data source(s) Extent Resolution Scoring Landscape rarityLand cover -NLCD data was summarized by Omernik Ecoregion -NLCD satellite imagery Omernik 1 pixel Cells of the more rare land cover type rarity -each pixel was given a score based on the relative -Omernik Ecoregions Ecoregion (determined by # of cells) received 100,
rarity of the land cover type in the ecoregion cells in the most common type received 0, and other land cover types received scores distributed logarithmic-allybetween 0 and 100.
Species rarity The highest species rarity (G1, G2, G3, G4, G5) Natural Heritage Region 5 7.5 minute If the highest observation in the quad observed in a 7.5 minute quad Database quads was G1, the whole quad received the
score of 100; if G2 through G5 the quad scored 75, 50, 25, or 0, respectively. A score from 100 to 0 was assigned to each quad in the region, and each cell was assigned the score of the quad in which it was located.
Rare species The number of G1, G2, & G3 species occurrences per Natural Heritage Region 5 7.5 minute Rare species were those having GHRS abundance 7.5 minute quad Database quads ranks of G1 through G3, so the number
of reported G1, G2, and G3 species was summed for each quad in the region. Quads with zero rare species received a score of 0, those with 1-2 species received 25, 3-9 species received 50, 10-15 received 75, and quads with more than 15 rare species received 1008.
Rare species The number of broad taxonomic groups of G1, G2, and Natural Heritage Region 5 7.5 minute Quads with no presence of rare taxa G3 species per 7.5 minute quad Database quads taxonomic groups received a 0, quads abundance with 1 received a score of 25, quads
with 2-3 received 50, those with 4-6 received 75, and more than six received 1009.
7

Landscape diversity criteria Biological diversity typically refers to the number of
species (i.e., species richness) and distribution of abundances of these species (i.e., evenness) within a defined area. However, diversity has been measured at many scales, from genes to communities to ecosystems, and has included ecosystem processes, structures, and functions (Chapin et al. 2000, Dale et al. 2000, Convention on Biological Diversity – Article 2). Indices of species and community diversity require data that can be difficult and expensive to obtain, especially at larger scales. The following four datasets were used as indicators of relative landscape diversity. The four ecological diversity layers were rasterized to the cell unit and summed to produce a composite diversity layer.
1) Patch size of undeveloped land10 – Undeveloped patches were defined as areas of undeveloped land cover surrounded by developed11 land cover types. The size of undeveloped land cover patches was used as an indicator of species diversity, based on island biogeography theory which correlates species richness with “island” (undeveloped patch) size (MacArthur and Wilson 1967, Rosenzweig 1995, Dale et al. 2000). For this layer, all pixels of undeveloped land cover (irrespective of land cover type) were aggregated into patches and the area of each patch was calculated. Patches under 10 ha were omitted12.
2) Land cover diversity- The nine, undeveloped NLCD land cover classes were used to calculate land cover diversity. Diversity was calculated using the Shannon (H’) index, which was calculated for 1 km by 1 km13 squares using the 30 m by 30 m land cover (Magurran 1988). Each H’ value was then multiplied by the percent undeveloped area in each respective 1 km by 1 km square in order to produce a weighted or modified Shannon index.
3) Temperature and precipitation maxima14 - Areas having the highest average temperature and precipitation were used as an indicator of species diversity based on the ecological principle that warmer, moister climate favors higher numbers of species (Lugo and Brown 1991, Gaston 2000). Sarkar et al. (2005) found that environmental data can be used as surrogates for species diversity data, particularly over large areas. Daily average temperature and daily total precipitation data for the Midwest for 1990-1999 were obtained in summary contours from the Midwestern Regional Climate Center, Champaign IL. These data were then georeferenced using 25 registration tie points distributed on the state borders. Once georegistered, this combined temperature and precipitation data layer was superimposed onto the Omernik Level III Ecoregions, to identify the portion of each ecoregion that was likely to have the highest species diversity based on temperature and moisture maxima (Omernik 1995, Omernik and Bailey 1997).
4) Temporal continuity of land cover type15 – Temporal continuity was used as an indicator of species diversity since long-term, established ecosystems tend to have more complex communities with more species than younger systems (Krohne 2001). For this calculation Küchler potential vegetation types based on climate and soils (Küchler 1964) were cross-referenced with the NLCD land cover classifications, and classification correspondence was used as an indicator of temporal continuity. Classification correspondence was only considered if the land cover classes were compatible. Compatibility was based on whether the Küchler classification could reasonably be envisioned as existing within the NLCD classification. For example, patches of oak hickory forest could exist in cells classified by the NLCD as mixed forest, since tree species are heterogeneously distributed in mixed forests and the deciduous portion of the mixed forest could consist of oak and hickory trees. NLCD cells that were deemed compatible were assigned a score of 100, whereas cells with incompatible vegetation were assigned a score of 0. Of the nine undeveloped NLCD classifications, three classifications (open water, bare rock/sand/clay, and emergent herbaceous wetlands) were viewed as potentially occurring anywhere in Region 5 and, thus, were treated as universally compatible. The other six NLCD classifications were viewed as being compatible with some of the Küchler potential vegetation types but not others.
Ecological persistence criteria Ecological persistence was defined as the potential for
an ecosystem to persist for 100 years16, an arbitrary number which may suggest a stable ecosystem, without external assistance (e.g., management). Persistence was viewed as being negatively impacted by two factors, landscape fragmentation and presence of chemical, physical, and biological stressors (Underwood 1989, Patil et al. 2001). A data layer was included if it contributed information on fragmentation or stressors, if consistent regional coverage was available, and if it did not duplicate information in another dataset within this criterion. The latter consideration was subsequently verified through sensitivity analysis. Landscape fragmentation was characterized by five datasets, and stressors by seven datasets (Table 2.2). Although non-indigenous invasive species are considered to be very important stressors, they were not included due to the unavailability of reliable, Region-wide datasets.
5) Patch perimeter to area analysis – NLCD pixel data were aggregated into patches by land cover type, and the perimeter of each patch was calculated (boundary convolution was used as a measure of landscape fragmentation; Gascon et al. 2000). Patches less than 10 ha were eliminated. Low perimeter to area ratios translate into patches impacted by lower edge effects (e.g., increased exotic species invasions, microclimate changes), and these patches received higher scores. Since shallower waters and
8
shorelines tend to be the most active biologically, for open water the perimeter-to-area ratio scores were inverted. 6) Patch size by land cover- The inverse of the size of a patch of land was used as a direct measure of landscape fragmentation; larger the patch of the same land cover type, the higher the likely persistence of that patch (Dale et al. 2000, Gascon et al. 2000, Krohne 2001). Patch size was calculated by aggregating the contiguous undeveloped pixels of the same land cover type and calculating the area (patches under 10 ha were omitted).
7) Weighted road density –Roads fragment undeveloped areas, introduce corridors for invasive plants and animals, modify hydrology and cause disturbance zones on both sides of the road (Southerland 1994, Forman and Alexander 1998, Abbitt et al. 2000, Gascon et al. 2000, Lindenmayer and Franklin 2002). Tiger/Line files from the U.S. Bureau of the Census for 1990 were used to calculate road densities in 5 km by 5 km squares across the region by summing the linear lengths of roads. These road densities were then weighted by road category (miscellaneous, local/rural, secondary, primary) using multipliers of 1, 2, 2.67, and 3, which correspond to the expected disturbance buffer of 600 m, 1200 m, 1600 m, and 1800 m for each road category, respectively. The array of 5 km by 5 km squares, each having a single weighted road density, was superimposed onto the NLCD base map of undeveloped areas, and each 300 m by 300 m cell was assigned the weighted road density score corresponding to the grid square in which it was located.
8) Waterway impoundments17 - Dams, irrigation diversions, and other water management structures can disrupt the hydrology of streams and wetlands, and disturb critical reproductive and foraging behavior for amphibious and aquatic species, negatively impacting the species diversity these habitats can support (Dougherty et al. 1995, Wilcove et al. 1998). The location of the dams in the region was obtained from the USGS, Reston VA, for the period ending 1996 (http://mapping.usgs.gov/esic/exic_index.html). The point data were superimposed onto the undeveloped NLCD data which had been aggregated into patches. Any open water, forested wetland or emergent wetland patch that was within 500 m (an arbitrary distance) of a dam18 was considered to be artificially impounded and thus hydrologically fragmented. Cells located within the impounded patches were given a score of 0 and the rest of the cells were scored at 10019.
9) Airport buffers – The noise related to airports is a well-known disturbance and stressor to wildlife (Manci et al. 1988). In general, the decibels of noise that an aircraft produced was directly proportional to the size of the aircraft, which is roughly proportional to the length of the runway required by the aircraft (Dillingham and Martin 2000, FAA 2002). Public use airport data from the Bureau of
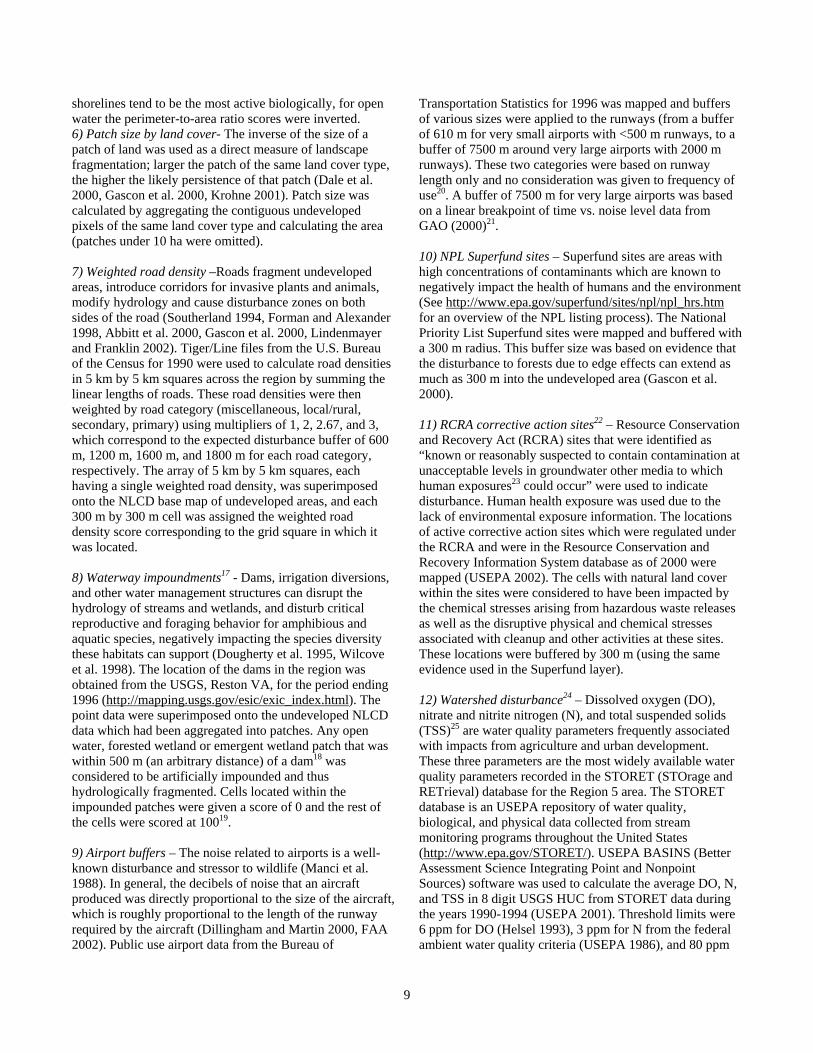
Transportation Statistics for 1996 was mapped and buffers of various sizes were applied to the runways (from a buffer of 610 m for very small airports with <500 m runways, to a buffer of 7500 m around very large airports with 2000 m runways). These two categories were based on runway length only and no consideration was given to frequency of use20. A buffer of 7500 m for very large airports was based on a linear breakpoint of time vs. noise level data from GAO (2000)21.
10) NPL Superfund sites – Superfund sites are areas with high concentrations of contaminants which are known to negatively impact the health of humans and the environment (See http://www.epa.gov/superfund/sites/npl/npl_hrs.htm for an overview of the NPL listing process). The National Priority List Superfund sites were mapped and buffered with a 300 m radius. This buffer size was based on evidence that the disturbance to forests due to edge effects can extend as much as 300 m into the undeveloped area (Gascon et al. 2000).
11) RCRA corrective action sites22 – Resource Conservation and Recovery Act (RCRA) sites that were identified as “known or reasonably suspected to contain contamination at unacceptable levels in groundwater other media to which human exposures23 could occur” were used to indicate disturbance. Human health exposure was used due to the lack of environmental exposure information. The locations of active corrective action sites which were regulated under the RCRA and were in the Resource Conservation and Recovery Information System database as of 2000 were mapped (USEPA 2002). The cells with natural land cover within the sites were considered to have been impacted by the chemical stresses arising from hazardous waste releases as well as the disruptive physical and chemical stresses associated with cleanup and other activities at these sites. These locations were buffered by 300 m (using the same evidence used in the Superfund layer).
12) Watershed disturbance24 – Dissolved oxygen (DO), nitrate and nitrite nitrogen (N), and total suspended solids (TSS)25 are water quality parameters frequently associated with impacts from agriculture and urban development. These three parameters are the most widely available water quality parameters recorded in the STORET (STOrage and RETrieval) database for the Region 5 area. The STORET database is an USEPA repository of water quality, biological, and physical data collected from stream monitoring programs throughout the United States (http://www.epa.gov/STORET/). USEPA BASINS (Better Assessment Science Integrating Point and Nonpoint Sources) software was used to calculate the average DO, N, and TSS in 8 digit USGS HUC from STORET data during the years 1990-1994 (USEPA 2001). Threshold limits were 6 ppm for DO (Helsel 1993), 3 ppm for N from the federal ambient water quality criteria (USEPA 1986), and 80 ppm
9

for TSS. For each parameter, BASINS was used to identify the HUCs for which parameter averages exceeded 85% of the threshold limit.
13) Watershed obstructions – Data from the U.S. Army Corps of Engineers26 was used for water impoundments in this layer. To determine the intensity of hydrologic alteration, the number of dams within each 8-digit HUC was summed and assigned to all cells within the HUC. 14) Air quality summary – The USEPA air quality model, Assessment System for Population Exposure Nationwide (ASPEN), was used to obtain predicted ambient air pollution concentrations (Rosenbaum et al. 1999). ASPEN provides outdoor air concentrations for 148 of the 189 hazardous air pollutants listed in the 1990 Clean Air Act Amendments. Concentrations of pollutants were predicted by modeling air emissions from major stationary sources, mobile sources, and area sources. Background was estimated by considering residual air pollutants from previous human activities, pollutants transferred from other countries, and natural emission sources. In the current work, we only included 85 of the air pollutants27, based on the availability of robust human health, non-cancer chronic health benchmarks (Caldwell et al. 1998). Human health benchmarks28 were used in this study due to the lack of widely available values for chronic stress on ecological endpoints. A ratio was generated for each pollutant by census tract29 by dividing the predicted ambient concentration by the corresponding non-cancer chronic health benchmark. Ratios greater or equal to one indicated that the benchmark was exceeded.
15) Development disturbance buffer – The developed pixels were aggregated into contiguous patches, and a 300 m buffer zone was created outside each patch. Using the same rationale as for the RCRA sites, these zones immediately adjacent to the patches of development were presumed to be stressed. While it is likely that different development types will stress the environment by different amounts, there was no quantitative evidence in the literature to support that hypothesis, thus a single buffer of 300 m30 was used.
16) Land cover suitability – Land cover suitability provided an indicator of the existing land cover viability. For this layer, existing land cover types identified by the NLCD were cross-referenced to the Küchler potential vegetation designations (Küchler 1964) in the same manner that they were for the temporal continuity of land cover type metric. The cells of undeveloped land with land cover that corresponded to the same types given in the Küchler maps were given the maximum score. Due to the lack of detail in the Küchler maps, some land cover categories such as open water or bare land did not map into a potential vegetation type. In order to not penalize these land cover cells, they were given the maximum score (100).
Landscape rarity Rarity is a measure of the abundance and/or the
distribution of an ecological unit, such as a species or habitat type (Kunin and Gaston 1993, Gaston 1994). The rarity composite used here is a combination of land cover and biotic rarity. Land cover rarity is a measure of the frequency distribution of NLCD land cover types within Omernik ecoregions. Biotic rarity included both species rarity and the rarity of higher taxonomic units. The biotic rarity layers are based on rare species inventories of the six states National Heritage Programs (NHP’s). The G1 through G5 Global Heritage Ranking System (GHRS) conservation status ranks used by the NHP were adopted (Stein 2001): G1 (critically imperiled); G2 (imperiled); G3 (vulnerable); G4 (apparently secure); and G5 (secure). The NHPs of the six Region 5 states provided these data to USEPA under confidential business information (CBI) protection. Due to the legal agreement, the data can only be summarized by USGS 7.5 minute quadrangle (quad)31.
17) Land cover rarity – The cells of undeveloped land cover were analyzed by ecoregion. Some ecoregions have as few as three land cover types and some as many as six, but the frequency distribution by land cover was always a logarithmic distribution.
18) Species rarity –Within a quad, the rarest GHRS rank determined the score for the entire quad.
19) Rare species abundance – The number of rare species sighted in a quad was used as a measure of rare species abundance.
20) Rare taxa abundance – The number of broad taxonomic groups represented by the G1, G2, and G3 species occurring in a quad as rare species taxa abundance were reported. For this indicator the broad taxonomic group designations established by the NHP are amphibian, bird, bryophyte, chelicerate, crustacean, dicot, fish, gymnosperm, insect, lichen, mammal, mollusk, monocot, platyhelminth, pteridophyte, reptile, and uniramian arthropod.
Composite scores (Diversity + Persistence + Rarity) The 20 summary scores generated from the GIS data
layers were summed by criterion for each undeveloped cell across Region 5 (Table 2.2). This resulted in 3 sets of raw composite scores, one set each for Diversity, Persistence, and Rarity. The model is linear and all of the data layers were weighted equally. Unequal weighting is a value judgment which, with little evidence, can introduce larger artificial biases than the errors that they were intended to alleviate (Dawes 1986)32.
The three sets of composite scores representing the three criteria were weighted equally as well, based on the same
10

logic applied to the 20 individual datasets. Each set of composite scores was normalized from 1 to 100 so that each criterion exerted an equal influence on the final scores. The final scores for each cell were generated by summing the three composite scores33. Thus, each undeveloped land cover cell across Region 5 was assigned a relative rating potentially ranging between 0 and 300 (Figure 2.1). This data reduction approach has been not been subject to a statistical evaluation, that is, it has not been evaluated
against competing data reduction methods. There is no guarantee that this data reduction method is appropriate or the “best” method (provides the optimal classification rule). The purpose of this investigation is to provide a protocol for assessing terrestrial ecosystem quality, based on the CrEAM model that has been reported elsewhere. An in-depth analysis of the individual category layers and competing data reduction techniques is beyond the scope of this paper.
Diversity Persistence Rarity (4 data layers) (12 data layers) (4 data layers)
Figure 2.1. Three composite layers and combined composite layer
Model validation34
Qualitative validation Two types of qualitative validation have been performed
for CrEAM. First, CrEAM scores for cells in national or state protected areas (which are areas of ecological importance) were compared to cells outside of these areas. Cells scored in the highest 1% of all the predicted scores in the following locations: St. Croix River area in Minnesota, Barabou Hills area in south-central Wisconsin, Shawnee National Forest in southern Illinois, Indiana dunes along the southern shore of Lake Michigan, and Sleeping Bear dunes of the east shore of Lake Michigan in Michigan, Hoosier
National Forest in southern Indiana, and the Wayne National Forest in southern Ohio. Second, CrEAM results were compared to The Nature Conservancy’s (TNC) ecosystem conservation planning assessment (Poiani and Richter 2000). The TNC has created a “portfolio” of sites which consists of areas they believe are important to preserve indigenous flora and fauna. The polygons of the portfolio sites were converted into cells and developed cells were removed from consideration. The portfolio sites occupy 1,620,484 cells out of a total of 3,634,183 undeveloped cells, or 45% of the undeveloped area in the study area. Of the highest scoring cells in the CrEAM model, 56% of them were within TNC portfolio sites.
11
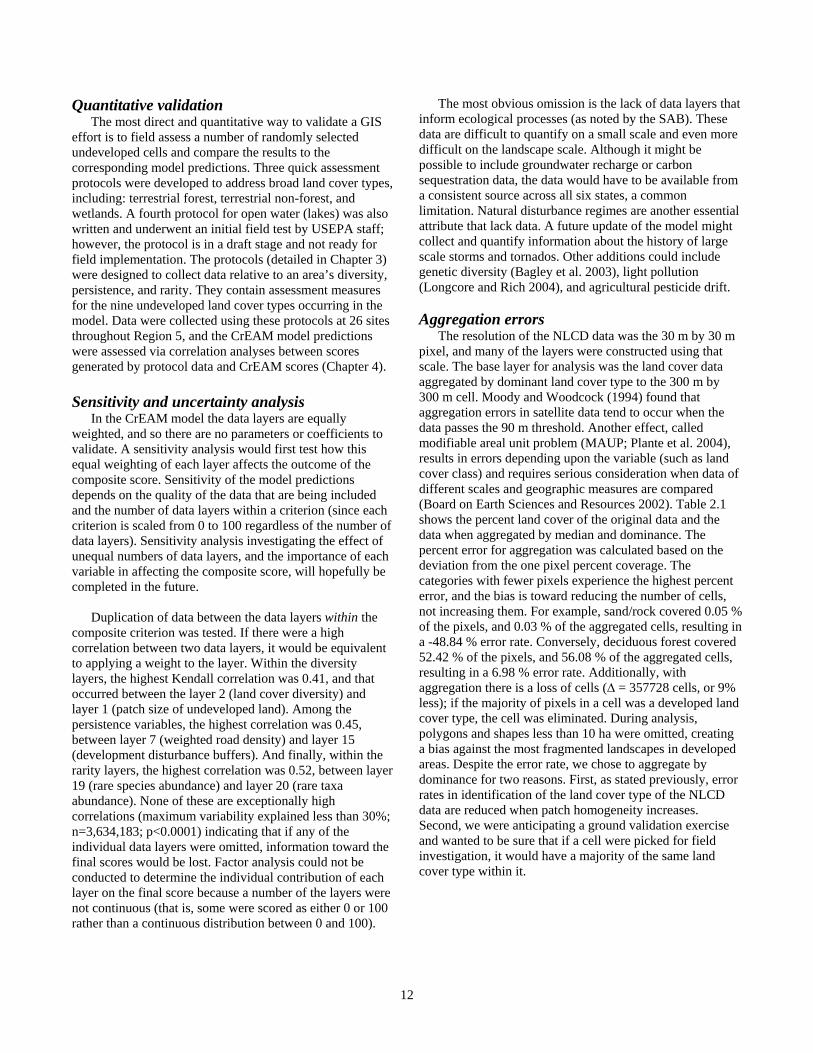
Quantitative validation The most direct and quantitative way to validate a GIS
effort is to field assess a number of randomly selected undeveloped cells and compare the results to the corresponding model predictions. Three quick assessment protocols were developed to address broad land cover types, including: terrestrial forest, terrestrial non-forest, and wetlands. A fourth protocol for open water (lakes) was also written and underwent an initial field test by USEPA staff; however, the protocol is in a draft stage and not ready for field implementation. The protocols (detailed in Chapter 3) were designed to collect data relative to an area’s diversity, persistence, and rarity. They contain assessment measures for the nine undeveloped land cover types occurring in the model. Data were collected using these protocols at 26 sites throughout Region 5, and the CrEAM model predictions were assessed via correlation analyses between scores generated by protocol data and CrEAM scores (Chapter 4).
Sensitivity and uncertainty analysis In the CrEAM model the data layers are equally
weighted, and so there are no parameters or coefficients to validate. A sensitivity analysis would first test how this equal weighting of each layer affects the outcome of the composite score. Sensitivity of the model predictions depends on the quality of the data that are being included and the number of data layers within a criterion (since each criterion is scaled from 0 to 100 regardless of the number of data layers). Sensitivity analysis investigating the effect of unequal numbers of data layers, and the importance of each variable in affecting the composite score, will hopefully be completed in the future.
Duplication of data between the data layers within the composite criterion was tested. If there were a high correlation between two data layers, it would be equivalent to applying a weight to the layer. Within the diversity layers, the highest Kendall correlation was 0.41, and that occurred between the layer 2 (land cover diversity) and layer 1 (patch size of undeveloped land). Among the persistence variables, the highest correlation was 0.45, between layer 7 (weighted road density) and layer 15 (development disturbance buffers). And finally, within the rarity layers, the highest correlation was 0.52, between layer 19 (rare species abundance) and layer 20 (rare taxa abundance). None of these are exceptionally high correlations (maximum variability explained less than 30%; n=3,634,183; p<0.0001) indicating that if any of the individual data layers were omitted, information toward the final scores would be lost. Factor analysis could not be conducted to determine the individual contribution of each layer on the final score because a number of the layers were not continuous (that is, some were scored as either 0 or 100 rather than a continuous distribution between 0 and 100).
The most obvious omission is the lack of data layers that inform ecological processes (as noted by the SAB). These data are difficult to quantify on a small scale and even more difficult on the landscape scale. Although it might be possible to include groundwater recharge or carbon sequestration data, the data would have to be available from a consistent source across all six states, a common limitation. Natural disturbance regimes are another essential attribute that lack data. A future update of the model might collect and quantify information about the history of large scale storms and tornados. Other additions could include genetic diversity (Bagley et al. 2003), light pollution (Longcore and Rich 2004), and agricultural pesticide drift.
Aggregation errors The resolution of the NLCD data was the 30 m by 30 m
pixel, and many of the layers were constructed using that scale. The base layer for analysis was the land cover data aggregated by dominant land cover type to the 300 m by 300 m cell. Moody and Woodcock (1994) found that aggregation errors in satellite data tend to occur when the data passes the 90 m threshold. Another effect, called modifiable areal unit problem (MAUP; Plante et al. 2004), results in errors depending upon the variable (such as land cover class) and requires serious consideration when data of different scales and geographic measures are compared (Board on Earth Sciences and Resources 2002). Table 2.1 shows the percent land cover of the original data and the data when aggregated by median and dominance. The percent error for aggregation was calculated based on the deviation from the one pixel percent coverage. The categories with fewer pixels experience the highest percent error, and the bias is toward reducing the number of cells, not increasing them. For example, sand/rock covered 0.05 % of the pixels, and 0.03 % of the aggregated cells, resulting in a -48.84 % error rate. Conversely, deciduous forest covered 52.42 % of the pixels, and 56.08 % of the aggregated cells, resulting in a 6.98 % error rate. Additionally, with aggregation there is a loss of cells (∆ = 357728 cells, or 9% less); if the majority of pixels in a cell was a developed land cover type, the cell was eliminated. During analysis, polygons and shapes less than 10 ha were omitted, creating a bias against the most fragmented landscapes in developed areas. Despite the error rate, we chose to aggregate by dominance for two reasons. First, as stated previously, error rates in identification of the land cover type of the NLCD data are reduced when patch homogeneity increases. Second, we were anticipating a ground validation exercise and wanted to be sure that if a cell were picked for field investigation, it would have a majority of the same land cover type within it.
12

Potential applications Almost forty percent of the land area is undeveloped in
Region 5. However, most regulatory actions take place in developed areas. This leaves a large portion of the region without assessment or consideration, yet the agency is charged with protecting all air, land and waters irrespective of land ownership. USEPA is the only federal agency that has the opportunity to protect the environment in such a holistic manner.
In addition to the intended uses of CrEAM discussed at the beginning of this chapter, the model could also provide a trend analysis of ecosystem condition in the Region. The data presented here represents the conditions in the early 1990’s because the NLCD data that is the basis of much of the analysis was collected from 1990-1992. If the same analysis were rerun using the NLCD 2000 land cover and corresponding data layers form 2000-2002, the results could be compared to 1990. It would become possible to track improvements due to restoration and protection efforts, as well as document degradation in quality across the Region at a landscape scale.
There are a number of programs which may benefit from CrEAM (particularly if it is revised as per the SAB’s suggestions):
• The Assessment and Watershed Protection Division of the Office of Water in USEPA Headquarters has proposed using the data to create a “Stressor x Quality” diagram to assist in their work. They are considering prioritizing restoration efforts based on recovery potential of watersheds (Norton 2004).
• In Region 5, the Underground Injection Control Program for the state of Michigan is administered by regional personnel. They have expressed an interest in using these results to help them prioritize well inspections.
• In other inspection, enforcement, or granting activities, the sites near the highest scoring areas or those most at risk could be used to help prioritize workloads or grant awards.
• Analysts reviewing National Environmental Policy Act (NEPA) Environmental Impact Statements (EIS) could benefit from knowing the relative ecological significance of various options being proposed.
• A Supplemental Environmental Project (SEP) is part of an enforcement settlement where a violator voluntarily agrees to an environmental project. The SEP must have a nexus (i.e., connection) to the violation, and model results could help establish that nexus and identify areas for restoration.
• The pesticide program has expressed an interest in including this information in the training materials that they provide to the states for training pesticide applicators.
Aside from the numerous critiques the SAB provided that are already listed in footnotes, the SAB supported the concept and broad methodological approach of CrEAM, and encouraged Region 5 to update and revise CrEAM with the SAB’s comments as a guide (Federal Register 2005, Science Advisory Board 2005). The development of the rapid assessment protocols, and their use to collect data in Region 5 for CrEAM validation, was a critical validation step outlined by the SAB.
Endnotes 1 The SAB did not believe that the CrEAM methodology reflected “ecological significance,” because the methodology lacks information on ecosystem processes, functions, and ecosystem services. 2 The SAB stated that scientifically defensible uses of the current version of CrEAM included: guidance for internal USEPA resource allocations and grant reviews, and tracking general conditions throughout the Region. 3 The SAB noted that in its current form, the NLCD has poor accuracy, which could affect the accuracy of the CrEAM. Also, NLCD classes may not be relevant for NEPA reviews. 4 Throughout the rest of this chapter, the word “pixel” will be used to refer to the original NLCD 30 m by 30 m data; “cell” will refer to aggregated 300 m by 300 m land cover data; “square” will be used when data are summarized into other resolutions; “patch” will refer to pixels, cells or squares that have been aggregated by a common classification into irregular polygons; and “shape files” will refer to GIS vector files. 5 Based on the data layers included in each category, the SAB suggested a change in terminology from “ecological diversity” to “landscape diversity”, from “ecological sustainability” to “ecological persistence”, and from “rare species and land cover” to “landscape rarity”. 6 The SAB disagreed with this method of scoring. 7 The SAB found this scoring method to be problematic. 8 The SAB suggested that quads in this layer should be scored continuously. 9 The SAB suggested that quads in this layer should be scored continuously. 10 According to the SAB, the matrix of land cover type surrounding habitat patches can also affect the diversity within habitat patches. Categorizing all developed land cover types as one type eliminates this information, however in Region 5 only agriculture fell into this category. 11 The SAB stated that the reclassification of all ”developed” land cover types into one class (”developed”) could be problematic, since some developed land uses (such as urban and residential areas) may have different (and possibly greater) impacts on the ”undeveloped” land cover classes than other ”developed” land uses (such as
13

agriculture or silviculture). 12 The SAB stated that although the omission of patch sizes less than 10 ha in this and other layers was due to the aggregation of data into 300 m by 300 m cells, this omission leaves out keystone habitats (such as ephemeral ponds) which may be ecologically important. 13 The SAB noted that such a coarse resolution would probably reduce the accuracy of species and habitat diversity because it reduces habitat heterogeneity and eliminates habitat types which naturally occur in patches smaller than 1km by 1km. Also, this resolution is likely less relevant for NEPA reviews. 14 The SAB was concerned that temperature and precipitation measured at a large scale was unlikely to be predictive of diversity at smaller scales, including Omernik Ecoregions. 15 The SAB suggested that this layer could be omitted, since it seemed to be identical to the “land cover suitability” layer. 16 The SAB pointed out that this criterion was unlikely to be true for successional or transitional habitats which are governed by natural disturbances such as fire. 17 The SAB pointed out that this layer may duplicate information in the “watershed disturbances” layer and could be eliminated. 18 The SAB noted that dam size may also be an important factor. 19 The SAB disagreed with this scoring method. 20 The SAB stated that frequency of use is likely an important factor influencing noise levels. 21 The SAB recommended that this layer be improved with data from relevant NEPA/Environmental Impact Statement reports for airports, and FAA data on noise at airports (e.g., FAA 1997, USEPA 1998, USEPA 2000, FAA 2003).22 The SAB believed that the layer as it stands was of limited utility, and possibly could be combined with the Superfund layer. Furthermore, the layer does not incorporate hydrologic linkages to the rest of the landscape (through which pollutants can affect large areas). 23 The SAB pointed out that human effects may differ qualitatively and quantitatively from ecological effects, and therefore may be of limited utility. Data from ecological risk assessments at RCRA sites should be used to revise this layer.24 Upon the advice of the SAB, the name of this layer has been changed from “water quality summary.” 25 The SAB recommended adding data on phosphorus, metals (e.g., mercury), and persistent organics (e.g., PCBs) to this layer. However, these data did not exist for 1990. 26 The SAB pointed out that using the same data twice double-counts the information. 27 The SAB suggested additional data for this layer, including: atmospheric nitrogen deposition (wet), tropospheric ozone concentration, and atmospheric mercury inputs. 28 Again, the SAB indicated that human health thresholds may not be well-correlated with ecological effects.
29 The SAB suggested the use of a more compatible resolution, such as HUCs). 30 Again, the SAB states that different developed land cover types will have different kinds and intensities of effects on habitat, which requires a variety of buffer widths. At minimum, the SAB suggests a wider buffer for urban land uses. 31 Although the SAB acknowledged the legal reason for this coarse resolution, it noted that the resolution made the data much less useful than it otherwise would have been. 32 The SAB argued that equal weighting was likewise an untested hypothesis. 33 The SAB stated that simply summing all three criteria scores results in a metric that is not ecologically meaningful without more information on how the weighting system relates to real-world relationships. 34 The SAB pointed out that the resulting scores of CrEAM are a unitless value, which complicates model validation. The SAB also emphasized the need for validation and explicit descriptions of model limitations before CrEAM is put to use.
14

CHAPTER 3 Protocol development and testing
The time and expense involved in repeated intensive surveys are infeasible for most organizations. Instead, similar information can be collected in two ways. Remote sensing can be used to gather broad scale land cover information and, paired with environmental variables such as temperature and precipitation, can estimate or predict areas of high biodiversity or other ecological characteristics. These indicators or surrogates must be demonstrated to be closely correlated to the ecological characteristics of concern (Kurtz et al. 2001, OECD 2004, Carpenter et al. 2005, Similä et al. 2006). Alternatively, a team of experts can visit an area which is known or assumed to support high diversity or unique ecological features, and conduct a rapid but exhaustive survey of all of the organisms and environmental conditions they observe. This approach can sometimes be done quantitatively, however it is usually used for qualitative assessments (Sayre et al. 2000).
These quick assessment protocols are intended to provide a rapid means of quantitative assessment which can be used to assess similar habitats of various qualities. Such a structured field data collection methodology is necessary if the same sets of indicators are to be collected and compared at many sites or over a long period of time (Fennessy et al. 2004). While several organizations have developed protocols for rapidly assessing species diversity and habitat quality in a variety of ecosystems, the assessment methods in this project differ from other efforts in several key respects (see Table 3.1). Few of the existing methods can be completed by users representing a variety of expertise with high accuracy and low cost (Innis et al. 2000). Most are associated with developing lists of species occurrences in particular areas which are of interest for biodiversity conservation goals (e.g., Foster et al. 1994, Hayden 2007). Further, the area surveyed in the other methods is not fixed across sites, but varies due to ecological boundaries or financial resources, reducing comparability across sites. Although local-scale conservation efforts are necessary, regional and national scale strategies are also critical for coordinating policy actions which impact local conditions (Pienkowski et al. 1995). It is this regional scale that the protocols introduced here are meant to target. The terrestrial protocols presented in this report mimic the USEPA’s Rapid Bioassessment Protocols for stream ecosystems in that they require specific expertise (vegetation and birds), are for a defined area, and can be applied and compared across large geographical areas (Table 3.1).
These protocols were developed to assess diversity, rarity, and persistence within 300 m by 300 m cells based on the CrEAM methodology. While diversity and rarity can be habitat-specific, our aim was to compare critical habitats across the region (and thus have similar protocols). We grouped the nine land cover times into three broad categories: forested; nonforested; and wetlands, encompassing both forested and nonforested wet areas. Throughout this project, the accuracy of these strict groupings as applied to the complexity of real habitats was discussed. Ultimately, we decided to standardize the data collection methods across all of the protocols as much as possible, to ensure that the same data were collected in all areas. In this way, habitat groupings can be revisited and adjusted post-data collection, if necessary.
The protocols were developed by a volunteer group of regional biologists and ecologists over several working meetings (including field tests), tested by field crews over two summers, and further adjusted. We describe the protocol development process in part to explain the reasoning behind the methodology and type of data collected. The advantages of using a large group of experts to develop these protocols include utilizing a wide range of expert-level knowledge on ecosystem quality, field data collection techniques and equipment, and other issues central to collecting ecological data. In all of the meetings, there was a general consensus reached on most of the major issues, but of course disagreements remained on smaller issues and details of the protocols. Therefore, these protocols may not be suitable for every situation, and they most certainly will not be agreeable to every ecologist or natural resource manager. However, we hope that, by incorporating as many voices and opinions as possible, these protocols will be a robust tool for general use, to be modified as needed by its future users for specific situations.
Meeting 1: Chicago IL, June 17-19 2003 The first working meeting of this research project was
held at the Region 5 headquarters in Chicago, Illinois. A group of approximately 30 biologists and ecologists (Appendix A) volunteered to participate at this first working meeting. The group was tasked to develop three protocols, one for each broad land cover type:
• Forested terrestrial: This includes three 1992 Level II NLCD forest cover types, including deciduous, evergreen, and mixed deciduous/evergreen forests
15

Table 3.1. Comparison of the USEPA quick assessment protocol characteristics with other protocols. Organization Protocol name Purpose Data collected Area surveyed References USEPA Quick
Assessment Protocols for
Relative diversity, persistence, and rarity of an area
GIS layers of land cover and human impacts form base, data collected on the
USEPA
Terrestrial Ecosystems Rapid Bioassessment Protocols
Stream quality
ground
Data collected on the ground (species inventory, abundance, habitat
The Nature Conservancy
Conservation International
Rapid Ecological Assessment (REA)
Rapid Assessment Program (RAP)
Identify areas of high diversity, key threats to important areas, management requirements of protected areas Identify areas of high diversity, develop conservation recommendations
structure) GIS layers of remote sensing imagery form base, data collected on the ground
Data collected on the ground (species inventory)
The Field Museum of Natural History (Chicago)
Rapid Biological Inventory (RBI)
Identify areas of high diversity, develop conservation recommendations
Data collected on the ground (species inventory)
300 m by 300 m
Length of reach (variable) plus 18 m riparian buffer on either side Area of concern (variable)
Area of concern (variable)
Area of concern (variable)
This report
Barbour et al. 1999
Sayre et al. 2000.
Roberts 1991, Foster et al. 1994, www.conservation.o rg*
Hayden 2007, http://fm2.fieldmuse um.org/rbi/what.asp
*http://www.biodiversityscience.org/xp/CABS/research/rap/methods/rapmethods.xml
(NLCD #41, 42 and 43). • Nonforested terrestrial: This includes three 1992
NLCD cover types; grassland, shrubland, dunes, and barrens (#31, 51 and 71). These land cover classes represent some of the most impacted habitat types in the region, and therefore we included grasslands reclaimed from mining and grazing in our analysis to ensure an adequately large sample size.
• Wetlands/Open water: The two 1992 NLCD cover types in the wetlands category include emergent and woody (forested) wetlands (#91 and 92). Open water include streams and lakes.
Volunteers represented a full range of taxonomic specialty (e.g., mammals, plants, aquatic invertebrates), and grouped themselves according to their experience concerning three land cover types: terrestrial forested, terrestrial non-forested, and wetlands/open water. Early in the session, the last group split into one wetlands and one open water group, mainly due to the significant differences in field methodology commonly used in these habitat types.
Meeting participants were faced with the following charge: develop protocols which could be used to assess ecosystem health for nine undeveloped land cover types. Each protocol was to consist of a set of techniques that could be conducted on a 300 m by 300 m plot, by a team of four knowledgeable field researchers, in a four hour period. The protocols were to consist of techniques that directly or indirectly measure a) ecological diversity, b) ecological persistence (or conversely, risk of deterioration from disturbances), and c) rare or endangered species or features.
In addition, the three groups were asked to: determine the required qualifications for each field team member; identify supporting publications; construct lists of required equipment; estimate approximate costs; and identify seasonal considerations and any other significant factors that would affect the protocols. Groups first met individually, sketched out initial drafts, and then presented the drafts to all of the participants for feedback. After this feedback session, groups went back and revised their first drafts. As a result of this meeting, four draft protocols were produced that were somewhat similar to each other in terms of the type of data collected, methodology, and required qualifications for protocol users.
Protocol-testing at Midewin National Tallgrass Prairie and Cook County Forest Preserve (IL), September 19-23 2003
Three of the authors of this report (Dr. Charles Maurice, Dr. Audrey Mayer, and Dr. Mary White) and Region 5 USEPA staff spent several days at field sites in Cook County Forest Preserve (Maple Lake) and the Midewin National Tallgrass Prairie, to field test the preliminary protocols developed in the first meeting. From our experiences with the protocols during this trip, we made a few minor procedural and equipment adjustments. We also developed datasheets and more detailed methodological sections (especially with respect to equipment use) for the protocols. As a result of this field work, a decision was made to focus on the three terrestrial protocols that would assess eight land cover types. Open water assessment was dropped from further refinement at this time due to the expense of conducting the necessary field work, and due to already developed stream assessment methods (Barbour et
16

Table 3.2. Site conditions as predicted by the CrEAM model versus conditions found by the field crews. 2006 sites are also listed along with their site assessments. Sites abbreviations: DF = deciduous forest; MF = mixed forest; EF = evergreen forest; NG = nonforested grassland; FW = forested wetland; EW =
emergent wetland. Site
number Year surveyed Qualitative site assessment
(/ORAM score max 100) CrEAM predicted condition
(using 1990 data layers)* DF1 2005 Medium Low DF2 2005 Low Medium DF3 2005 Low Low DF4 2006 High DF5 2006 High MF6 MF7
2005 2005
Low Low
High Medium
MF8 2006 Medium MF9 2006 Medium EF10 2005 Low Low EF11 2005 Low Low NG12 2005 High Low NG13 2005 High Low NG14 2005 High NG15 2006 Medium NG16 2006 Medium FW17 2005 High/61 High FW18 FW19
2005 2005
High High/65
Medium Low
FW20 2006 High FW21 2006 Medium EW22 2005 High/64 Low EW23 2005 Low/19 High EW24 EW25
2005 2006
Low/9 High
EW26 2006 High
al.1999).
Meeting 2: Bloomington IN, April 22-24 2004 The purpose of this meeting was to test the three
protocols in the field, to make sure that all potential logistical problems had been identified, and to determine whether the protocols were adequate to assess diversity, persistence, and rarity. Thirty-four ecologists from throughout Region 5 attended (some had also attended the protocol development meeting in 2003), and two groups of four ecologists were formed for each of the three protocols (Appendix A). The nonforested terrestrial protocol was tested four times (two sites visited on two mornings), while the forested and wetland protocols were tested twice (two sites visited on one morning). From these tests, minor adjustments were made to the nonforested terrestrial protocol (most notably changing species abundance recording to species frequency), while more substantial changes were made to the forested and wetland protocols. Assessments on whether the protocols could accurately gauge ecosystem health were not feasible due to several factors, not least of which was the absence of true high-quality sites of an adequate size (at least 300 m by 300 m) for some habitat types, especially for grasslands.
Participants at this meeting were given the protocol prior to the meeting. During the first afternoon session the day
before the first morning field trial, the groups familiarized themselves with the methods and equipment, and identified any obvious problems. After the first morning trial, groups met individually to assess problems encountered in the morning and modify the protocols as appropriate. A large session with all participants was held the afternoon after the second field trial day to discuss common problems with the protocols.
Field data collection using the protocols At the end of these meetings and early trials, the three
protocols (forested, Appendix B; nonforested, Appendix C; wetlands, Appendix D) were standardized for formatting and field data sheets were finalized. Using the final draft protocols with data sheets, ASC Group, Inc. collected data in the early summer of 2005 at 16 sites throughout Minnesota, Michigan, and northern Indiana in Region 5. These sites were selected at random by Region 5 staff to represent a range of quality within each habitat cover type as predicted by the CrEAM model (Table 3.2). The 16 sites visited included habitat types for all three protocols: three deciduous forests, three mixed forests, one evergreen forest, three grasslands, three forested wetlands, and three emergent wetlands. Shrub lands and dunes were not sampled because we were unable to find enough sites of sufficient size (300 m by 300 m) and quality where it was logistically feasible to collect data. At the end of the field
*CrEAM scores are not relevant for 2006 sites as these sites were selected from within protected areas with known or suspected high condition, and not at random (as the 2005 sites were selected).
17

season, some minor changes were made to the protocols, most notably standardization of the datasheets across protocols, plus methods for bird surveys and human impacts.
In 2006, ASC Group, Inc. collected data at ten sites throughout Ohio and southern Indiana in Region 5, again representing all protocols. Two sites were visited in each of five landcover types: deciduous forest, mixed forest, grasslands, and forested wetlands, and emergent wetlands. By the end of the two summers, data had been collected for a total of 26 sites, with five sites for each of the following land cover types: deciduous forest, mixed forest, forested
wetlands, emergent wetlands, and grasslands. Evergreen forests were omitted from 2006 sampling because of the difficulty in locating natural evergreen forests in 2005. Figure 3.1 illustrates all 26 sites visited by ASC Group, Inc. In addition to collecting the data as directed by the protocols, the ASC Group, Inc. team also applied the Ohio Rapid Assessment Methods (Mack 2001) for wetlands to five wetland sites, and wrote short, qualitative narratives about the condition of all sites. These narratives provide some further insight into how well the protocols capture the ecological conditions of the site, particularly in contrast to the cumulative scores (Table 3.2).
Figure 3.1. Location of field sites in 2005 and 2006 in which protocols were used to collect data. DF = deciduous forest, MF = mixed forest, EF = evergreen forest, NG = nonforested grassland, FW = forested wetland, EW = emergent wetland.
18

In a separate project, the forest protocol was used to collect data in known high-quality spruce and birch forests in southern Finland and northwestern Russia (see http://www.helsinki.fi/biosci/environment/boomerang.htm for more information on that project). Data were collected on 21 sites in Finland and 21 in Russia. The data on forest composition and structure will be compared to data collected by the National Forest Inventory programs in Finland and Russia, to determine the completeness and accuracy of the protocol with respect to forest conditions at the sites. An initial comparison of ten Finnish sites suggested that forest structure data such as mean height, mean diameter at breast height, and basal area per ha, are directly comparable to the data collected using the Finnish National Forest Inventory methods.
Issues in protocol use After extensive experience with the protocols in the
field, both the United States crew and the Finland crew had opinions and suggestions that we feel are important to include here. These opinions will help researchers and natural resource managers determine whether these protocols will be appropriate for the goals of the future projects, or whether modifications to the protocols (or other protocols) would be necessary.
Comments concerning all protocols Size and Shape
After aggregating the GIS layers of the CrEAM model, each land use pixel was 300 m by 300 m in size. Since the entire pixel was given a predicted diversity, rarity, and persistence score, the conditions on the ground needed to be surveyed over this entire area. However, the size restriction presents some difficulties. First, some of the most impacted habitat types in Region 5 have been reduced to a size smaller than 300 m by 300 m, which can prevent sampling of sites across a range of disturbance. Other habitat types, such as ephemeral wetlands, tend to occur in patches smaller than 300 m by 300 m. Furthermore, the square configuration eliminated large but long, linear habitats such as shrubland ecotones, and remnant grasslands along railroad tracks.
In small patches of habitat, and particularly for those habitats which naturally occur in long, thin patches (such as forested wetlands in riparian areas, or shrubland along ecotones), the square 300 m by 300 m shape can prevent the patch from being surveyed appropriately. Both the ASC Group, Inc. team in the US and the Finnish team successfully adjusted the shape to fit it into an irregular patch in the field, while maintaining the overall survey area of 9 hectares. As long as the same amount of area is surveyed, the change should not be problematic. However, for verification of the CrEAM model (which has a pixel size of 300 m by 300 m), maintaining the square shape was
important (otherwise two pixels would be surveyed.)
Setting The location of a site within a large habitat patch can
affect site quality. For example, sites located along the edge of a habitat patch may be more disturbed than sites buffered on all sides by the same habitat. Thus, site selection within a habitat patch may affect the condition assessment of the entire patch. Studies which use these protocols to compare the quality of entire habitat patches should collect landscape data related to patch size and amount of undeveloped buffer surrounding the site.
Successional age The successional stage of the habitat directly affects
field evaluation of community quality. However, succession at a site can vary based on both natural and anthropogenic disturbances. The size and extent of the disturbance will determine whether or not the quality of the site is affected. A determination of successional age and time since major disturbance should be included in the field data collection. This data could be used to separate quality differences due to natural successional processes from anthropogenic disturbances.
Seasonality The protocols specify that the optimal sampling period
is during the growing season. Later weeks in the growing season may be more suitable for some of the data collected, particularly plants (when many are fruiting or flowering and therefore more easily identified). However, due to the seasonal life history patterns of many species of plants and animals, data collection for comparison purposes should all occur ideally within a two- week time span, and certainly within no more than a four-week time span.
In the Finnish project, we collected data in Finland in the last three weeks of May, and the Russian data in the first three weeks of June. Although the field sites were all along the same latitude, the changes over that time period were especially pronounced, particularly with respect to migratory birds and insects. When we began our surveys in May, we found no insects, and about one-fourth of the bird species expected to be observed on some of our sites had not yet arrived in Finland. However, due to the number of sites on which we needed to collect data, data collection spread over six weeks was unavoidable. We would, however, recommend that in northern zones, data collection not begin until all of the migratory birds have arrived (which is also typically when insects are emerging in great numbers). The timing may be heavily dependent upon weather patterns during the spring.
Seasonality also affects the amount of water in wetlands, which can greatly impact the plant and animal species are observed. Wetland inundation is also affected by
19

inter-annual variation precipitation, regional precipitation patterns, and depth of the groundwater table (location-specific). Subsequent efforts should consider this natural variation across sites when sampling, taking care not to mistake natural differences in inundation for differences in ecosystem quality.
Field logistics The protocols have been designed to ensure a fixed
level of effort (four people for four hours), to ensure that data can be compared across sites which are assumed to represent a large variation in ecological characteristics. However, sites supporting little ecological heterogeneity are in practice easier and quicker to survey (e.g., less time required to check identification, fewer structural features to examine for fauna, etc.) than those sites which are more heterogeneous. For this reason, very homogeneous sites are more thoroughly sampled than very diverse sites. In our experience, the level of effort allowed was adequate for all the sites we visited, including those sites in relatively undisturbed forests in Finland and northwestern Russia. However, it is possible that for extremely diverse areas, the level of effort allotted would be inadequate, and some data would not be collected. Subsequent data analyses would need to take this into consideration.
The four hour protocol was designed to allow two sites to be sampled per day if necessary. However, bird behavior varies considerably over the course of a day; they are most active at dawn and dusk. For this reason, the two-person animal crew should conduct point-count bird surveys at these times, starting 30 minutes before sunrise if counting at dawn, and ending 30 minutes after sunset if counting at dusk. Although the two-person vegetation crew can theoretically begin sampling 30 minutes after the point counts begin, the low levels of light can affect sampling for longer than these 30 minutes. Headlamps are recommended equipment for the plant team, however we found in our field experience that plant sampling is still impeded somewhat. Thus, there is a small but unavoidable mismatch in the total time that the animal team and the plant team actually spend collecting data.
Forests, wetlands, and forested wetlands In this project, we have assumed strict boundaries
between habitat types with respect to which protocol should be used in which area. For this reason, we have attempted to standardize the data collected and the datasheets to the extent feasible. However, there are still some significant differences between the protocols, due to the original development process (in which specialists by habitat recommended field methods they were most familiar with in their habitat specialty). Therefore, the data collected, once processed, may not be comparable across sites in different broad land cover types.
We discussed whether forested wetlands should be surveyed using the forested protocol or the wetlands protocol. We decided to use the wetlands protocol because the defining feature of the area would be its seasonally-inundated nature, rather than the density of trees or other forest characteristics on the site. Depending upon the goal of the project, future users of these protocols should address this issue explicitly when including forested wetlands in surveyed sites.
After conducting their fieldwork in 2005 and 2006, ASC Group, Inc. questioned whether the wetlands protocol would adequately differentiate two distinctly different non-forested wetlands, particularly between marsh communities versus sedge or wet meadows. As it stands, the current protocol may be better designed for marsh wetlands.
Comments for the forested protocol In many states, natural heritage programs are charged
with monitoring species and natural communities which are rare. As part of the monitoring of rare communities, these programs are also charged with trying to identify the highest quality remaining natural communities in their respective state. Over the years, they have developed certain characteristics that natural (vegetative) communities should have in order to be considered high quality. Assessing a natural (forested) community as high quality is accomplished by looking at the following factors:
• Biodiversity • Natural and anthropogenic disturbances • Surrounding land use • Invasive species • Canopy age • Stand size
Of these, the current protocol seems to address most of these factors appropriately except for surrounding land use and stand size.
Both the US and Finland teams were concerned about the lack of adequate assessment of coarse woody debris, which is an important habitat source for flora and fauna communities, and can serve as an indicator of fungal and invertebrate diversity. Lichen diversity and condition is a useful indicator for air pollution, fire ecology, and forest management effects. The Finnish group added two additional survey methods to collect detailed information on coarse woody debris, based on the methodology detailed in Krankina et al. (2002), and lichen diversity and condition based on the Finnish SFS5670 survey method. Due to the additional work involved for these two methods, an additional team member was added to aid the coarse woody debris data collection. Future sampling efforts should evaluate the costs of adding and additional field member versus the benefits of the data collected.
20

∑=
1 D= S
i 1
2pi
CHAPTER 4 Data analysis
The field data were analyzed according to three main objectives: 1) to determine whether the ecological characteristics of the sites supported the CrEAM model quality classifications, 2) to assess whether the ecological characteristics of diversity, persistence, and rarity reflected qualitative perceptions of ecosystem quality, and 3) to compare ecological characteristics across land cover types (i.e., protocols). The first objective included only sites sampled in 2005, since CrEAM quality scores were not determined for 2006 sites, while the second and third objectives included data from both years. For both the CrEAM predictions and qualitative assessment, scores were divided into categories of low, medium, and high quality. Due to both the small sample size and the non-normal distribution of several of the variables, we used a nonparametric Kruskal-Wallis test to identify significant differences between means of sites grouped by quality rank or protocol used. Because of the low power in the tests, the p-values were not corrected for the high number of comparisons (47), but readers are cautioned regarding increased risk of Type I error (erroneous rejections of the null hypothesis).
Due to resource restraints and difficulties in the field, we were unable to collect data on enough sites to quantitatively compare on-the-ground conditions in each land cover and condition category. Furthermore, some of the sites visited in the 2005 field season were incorrectly classified by the 1992 NLCD land cover layer (e.g., NLCD predicted mixed forest where there was evergreen forest). The combination of the classification problems, plus the decreased administrative support for the CrEAM model, prompted us to shift our focus in 2006 from validation of the CrEAM model to testing the protocols as field data collection tools. We visited sites in 2006 which increased the sample size for each protocol, irrespective of CrEAM site quality
Richness is simply the number of species (or units of interest). Diversity is calculated using the number of different species (richness) and the equitability of the abundance of those species, i.e., the distribution of individuals among species in a given area. Communities with many species of relatively equal dominance are more quantitatively diverse than those with fewer species and/or are dominated by one species. Although species are the most common unit used to calculate diversity of ecological systems, genotypes, functional groups, trophic levels, and even morphological types have all been used (Magurran 1988; Rosenzweig 1995).
To quantify the ecological diversity of each site, we calculated both richness and diversity (Table 3.2). For richness, the number of native species observed on the site was summed within each of the following taxonomic groups: birds, mammals, plants, invertebrates, and herpetofauna (amphibians and reptiles). These protocols measure the richness of all taxonomic groups encountered, although for some groups richness is measured at a higher taxonomic grouping than species (such as genera or family). The species richness of birds, mammals, invertebrates, plants, and herpetofauna were recorded on each site, with the exception of invertebrate richness on wetlands sites in 2005. No amphibians or reptiles were observed on the two nonforested sites in 2006.
Point counts and plots were used to collect observations of birds and plants, respectively, and therefore abundances of species were recorded, allowing diversity calculations to be made for these two groups. Diversity was calculated for birds and plants using two common diversity indices:
Shannon’s index (based on information theory): predictions. While here we have maintained the “diversity, S
∑=
= − i 1
H ' ln p pi i
these protocols may need to analyze their data differently, depending upon the goals of the project. and Simpson’s index, using the following equation:
Methods (4.2)
(4.1) rarity, persistence” categories in our data analysis for testing ecological significance as defined by the CrEAM, users of
Diversity data Diversity of ecosystems, species, organisms and their
genetic variance is considered to be an important property of ecological systems (Wilson 1992; Rosenzweig 1995).
21
where pi is the proportional abundance of the ith species.

While these indices account for both the species richness and evenness of individuals among the species, the Shannon index (Equation 4.1) is especially sensitive to the presence of rare species (and therefore differences in species richness), while the Simpson’s index (Equation 4.2) is more sensitive to evenness (in particular the presence of very dominant species; Magurran 1988). Although both indices behave similarly over very coarse scales, the different sensitivities allow for detailed comparisons across sites. Shannon and Simpson diversity were calculated for birds and plants for all sites, with the exception of bird diversity on the 2005 wetlands sites (bird census methods were added to the wetlands protocol before the 2006 season).
While overall richness and diversity of taxonomic groups may indicate more functionally intact ecosystems (when compared with areas of similar ecosystem type), these community variables are not always positively correlated among taxonomic groups, regardless of ecosystem functionality (Hopton and Mayer 2006). Taxonomic differences in richness and diversity can indicate important characteristics of a site; high bird diversity in a site with low plant diversity, for example, may indicate an area of complex vegetation structure and a beneficial landscape, along with past human impacts which simplified the plant community. Therefore, lumping species from all taxonomic groups into single metrics of richness and diversity is rarely advisable.
Persistence data We interpret “persistence” here as the degree of
impairment evident on a site. This can be measured directly by physical evidence of human activities, or by the presence of invasive species. We assume that the higher the richness or proportion of either, the greater the negative effects on the ecological community at that site (Millennium Ecosystem Assessment 2005). This view ignores less obvious impacts, such as climate change, but may provide a useful snapshot of the threats to persistence of a site. We calculated two types of pressures: the number of kinds of observable human activities, and the proportion of invasive species within each taxonomic group.
1. Number of different kinds of observable human impacts (e.g., trash, trails, noise). We assume that the greater the number or “richness” of different types of impacts, the lower the persistence of the site (through greater level of threat). Although outright habitat destruction obviously decreases persistence, other seemingly less destructive activities may considerably degrade the ecological quality of a site. Trash or trails by themselves may not have much impact; however, these are an indication of human presence, much like deer tracks indicate the presence of deer. Signs of management, such as ditches or mowing, also indicate that the habitat type or ecosystem function is not what it
otherwise would be without human activity. These data were collected for all sites with the exception of wetlands in 2005 (human presence methods and bird point counts were added to the wetlands protocol after the 2005 season). Since a greater richness of human impacts is negatively related to the persistence of the site, we multiplied each score by -1, so that those sites with no impact observations (0) received the highest score.
2. Proportion of number of invasive species to number of native species (within each taxonomic group). Second to outright habitat destruction, dominance by invasive species is a significant cause of decline in native species, and can lead to dramatic (and nearly irreversible) changes in habitat conditions and ecological communities (Mooney and Cleland 2001, Olden et al. 2004, Millennium Ecosystem Assessment 2005). Similar to the rarity measures, this measure compares the richness of known invasive/exotic species to the richness of native species. The higher proportion of invasive species relative to native species, the greater the risk to the ecosystem. We recorded invasive species richness for birds, mammals, and plants. However, only one record of an invasive mammal was recorded (a Norway rat, Rattus norvegicus, on a wetlands site in 2005), so we excluded this variable from the analyses. Since a larger proportion of invasive species is negatively related to the persistence of the site, we multiplied each score by -1.
Rarity data The rarity of a species depends on its geographic range,
habitat specificity, and local population size (Rabinowitz 1981). For example, species that are geographically restricted, have very specialized habitat requirements, or have a naturally sparse population size are considered naturally rare. Naturally rare species can provide important information about the characteristics about a site, in particular the presence of unusual abiotic or biotic conditions. Therefore, these species are often referred to as “indicator” species (Dale and Beyeler 2001). Using field assessments to determine rarity may not be useful, because species may be difficult to survey due to their small population size (US Forest Service 2004), or a species may be mistaken for a rare species because it is difficult to observe or collect. Furthermore, some species may have once been common, but are rare at a site due to disturbances caused by human activity. Local inventories are necessary to assess geographic range, habitat specificity, and local population size, and this detailed information is often difficult to collect. Thus, we calculated rarity based on published, nationally available lists of threatened and endangered species. In the United States, over 1000 species have been listed at the Federal level as either endangered or threatened, and the primary cause of endangerment in the United States is habitat destruction (US Fish and Wildlife Service 2006). Many more species are listed at the state level. The presence of these threatened and endangered
22

species on a site may indicate a unique habitat or a low threat level, both which are important indicators of high quality.
Proportion of number of rare species to number of native species (within each taxonomic group). We used the proportion of the total species richness which are included on one or more rarity lists (e.g., federal and state threatened and endangered lists, G1 and G2 ranked species, etc.). This measure compares the richness of rare species to the richness of all of the species on the site, within each taxonomic group. A high proportion of rare to overall species would indicate a site which provides a large variety of specialized habitats or resources for native species, or may indicate a site which may be particularly unaffected by human activity. Simply using the number of rare species at each site is not appropriate, since sites with naturally higher species richness (such as those at lower latitudes) are more likely to have more rare species than sites of equivalent condition but in areas where fewer species are supported (Rosenzweig 1995). Presence of particular indicators species would also be important to consider with respect to the total number of species observed. We calculated this proportion of rare species or birds and plants, for all sites. No listed mammals were recorded on any sites, so we excluded this variable from the analyses.
Unused data Not all of the data collected by the protocols were used
in this data analysis. However, it was the opinion of the participants in the protocol development meetings that collecting excess data was better than not collecting some data and needing it later. Some of the data would be useful in cases where a disturbance drastically changed the character of a visited site. For example, a soil profile could provide valuable information for future restoration efforts. Other data, such as canopy cover, are a function of the age, soil fertility, and disturbance dynamics of forested sites and are expected to change over time with tree growth and death. While cover is an important characteristic of a site, it is a difficult measure to incorporate into a perspective which ranks sites from high to low potential persistence.
Some of these variables could be used quantitatively, while some will probably be restricted to qualitative assessments. For example, the depth and color of the O (organic, top) soil layer has important implications for the productivity of the site. One could use these data to assess the variability in species richness and diversity with potential site productivity, in an investigation of the theoretical relationship between diversity and productivity. Some variables can be used to assess the accuracy of the data collected. The data collected on the weather conditions during the time of data collection provide qualitative but valuable information on how complete the survey is likely to have been. For example, flying animals tend to stay sheltered during very windy days, and are therefore less likely to be observed. The use of each variable and its qualitative or quantitative contribution to a research project will have to be decided on a case-by-case basis.
Results CrEAM predicted scores and protocol data
Diversity, persistence, and rarity variables for seven forest sites, two grassland sites, and five wetland sites were compared to CrEAM quality scores (Table 3.2). CrEAM pixel scores ranged from 13-260 (out of a possible 300) within Region 5, and were divided into categories of low, medium, and high condition based on breakpoints in the distribution of pixels scores across the region. “Low” condition had composite CrEAM scores of 13-73 (6% of pixels), “medium” condition had scores of 12-156 (45% of pixels), and “high” condition had scores of 183-260 (11% of pixels).
Based on predicted CrEAM scores, we found no significant differences for any protocol data variables between sites in the low, medium or high categories for the 14 sites surveyed in 2005 (Table 4.1). For most variables, the values of site characteristics such as diversity and rarity did not increase with CrEAM quality score, as was expected. The extremely low sample size precludes any further differentiation within land cover types.
23

Table 4.1. Summary statistics for Kruskal-Wallis analysis based on CrEAM predicted rank (low, medium, high quality).
Variable & CrEAM rank
N Mean StDev K-W Variable & CrEAM rank
N Mean StDev K-WH p H p
Bird species richness Herpetofauna richness Low 8 15.4 6.8 0.22 0.894 Low 8 1.38 0.92 1.51 0.469 Medium 3 15.7 8.5 Medium 3 2.00 1.00 High 3 13.0 5.6 High 3 2.00 1.00
Shannon’s bird diversity Plant species richness Low 6 2.2 0.5 1.42 0.491 Low 8 19.6 18.3 0.85 0.652 Medium 2 2.6 0.2 Medium 3 25.0 30.3 High 1 2.3 . High 3 30.7 34.6
Simpson’s bird diversity Shannon’s plant diversity Low 6 8.1 3.2 2.22 0.329 Low 8 1.97 0.95 1.22 0.544 Medium 2 11.2 1.8 Medium 3 1.51 0.21 High 1 9.1 . High 3 2.51 1.28
% Invasive bird species Simpson’s plant diversity Low 8 0.01 0.0 1.00 0.597 Low 8 8.6 9.2 1.04 0.595 Medium 3 0.02 0.0 Medium 3 12.0 15.8 High 3 0.00 0.0 High 3 14.4 16.8
% Listed bird species % Invasive plant species Low 8 0.02 0.0 0.95 0.621 Low 8 0.01 0.04 0.75 0.687 Medium 3 0.01 0.0 Medium 3 0.00 0.00 High 3 0.00 0.0 High 3 0.00 0.00
Mammal species richness % Listed plant species Low 8 4.3 1.7 0.01 0.996 Low 8 0.00 0.01 0.75 0.687 Medium 3 4.3 1.5 Medium 3 0.00 0.00 High 3 4.0 0.0 High 3 0.00 0.00
Insect richness Human disturbance richness Low 6 6.5 2.7 2.27 0.322 Low 6 4.2 1.2 0.53 0.766 Medium 2 4.0 1.4 Medium 2 6.0 4.2 High 1 5.0 . High 1 5.0 .
Qualitative site assessments and protocol data After the field team left each site, they wrote a
qualitative narrative, which described the general conditions of the site and the potential for long-term persistence of the ecological conditions. Based on these narratives and the overall perception of the team, all 26 sites were given a ranking from high to low. High-ranked sites were those high biodiversity and little or no evidence of recent disturbance, or a particularly rare or unique community. A low ranking reflected clear and recent signs of disturbance (e.g., logging, invasives species, etc). A medium ranking would have intermediate biodiversity and some evidence of disturbance.
The protocols were able to differentiate sites by the quality rankings assessed by the field team. The qualitative site assessment ranks (low, medium, and high) reflected differences in the proportion of Shannon’s and Simpson’s bird diversity, listed bird species, and herpetofauna richness, plant species richness, Shannon’s plant diversity, Simpson’s plant diversity, and number of human disturbances (Table 4.2; Figure 4.2). While bird diversity was highest on the low-ranked sites, the proportion of bird species observed
which were listed as of concern, threatened or endangered was highest on the high-ranked sites. Plant richness and diversity variables, as well as human disturbance, followed the expected pattern, where low-ranked sites had much lower richness and diversity (and more evidence of human disturbances) than the medium- or high-ranked sites (Figure 4.2). Variables describing mammal and insect communities demonstrated no differences among qualitative site assessment rank (Table 4.2).
24

Table 4.2. Summary statistics for Kruskal-Wallis analysis based on qualitative site assessment ranks by ASC Group, Inc.
Variable & ASC rank
N Mean StDev K-W Variable & ASC rank
N Mean StDev K-WH p H p
Bird species richness Herpetofauna richness Low 8 15.4 7.3 3.34 0.189 Low 8 1.63 0.74 5.28 0.071 Medium 6 9.8 1.8 Medium 6 0.67 0.82 High 12 13.1 6.2 High 12 2.08 1.51
Shannon’s bird diversity Plant species richness Low 6 2.42 0.28 10.98 0.004 Low 8 7.6 4.2 10.30 0.006 Medium 6 1.61 0.19 Medium 6 36.8 34.0 High 8 1.88 0.45 High 12 39.6 18.1
Simpson’s bird diversity Shannon’s plant diversity Low 6 10.0 2.5 11.22 0.004 Low 8 1.42 0.38 9.62 0.008 Medium 6 4.2 0.9 Medium 6 2.54 1.32 High 8 6.0 2.2 High 12 2.78 0.79
% Invasive bird species Simpson’s plant diversity Low 8 0.01 0.02 1.97 0.373 Low 8 3.2 1.3 10.76 0.005 Medium 6 0.00 0.00 Medium 6 18.8 17.9 High 12 0.02 0.05 High 12 17.5 11.0
% Listed bird species % Invasive plant species Low 8 0.01 0.02 6.74 0.034 Low 3 0.00 0.00 5.03 0.081 Medium 6 0.00 0.00 Medium 8 0.01 0.04 High 12 0.05 0.07 High 3 0.00 0.00
Mammal species richness % Listed plant species Low 8 4.00 1.41 1.88 0.392 Low 3 0.00 0.00 1.46 0.483 Medium 6 5.00 1.10 Medium 8 0.00 0.01 High 12 4.25 1.66 High 3 0.00 0.00
% Invasive mammal species Human disturbance richness Low 8 0.06 0.18 2.25 0.325 Low 6 5.00 2.10 6.96 0.031 Medium 6 0.00 0.00 Medium 6 2.00 1.10 High 12 0.00 0.00 High 8 3.13 2.10
Insect richness Low 6 4.83 1.60 0.338 0.844 Medium 6 8.17 10.15 High 8 6.50 4.34
25

Shannon's bird diversity
0.00
0.50
1.00
1.50
2.00
2.50
3.00
low medium high
a) b)
c)
Proportion of listed birds
0.00
0.01
0.02
0.03
0.04
0.05
0.06
0.07
0.08
low
medium
high
d)
Simpson's bird diversity
0.00
2.00
4.00
6.00
8.00
10.00
12.00
low medium high
Herpetofauna richness
0.00
0.50
1.00
1.50
2.00
2.50
3.00
low
medium
high
e)
Plant species richness
0.00
10.00
20.00
30.00
40.00
50.00
60.00
low
medium
high
f)
Shannon's plant diversity
0.00
0.50
1.00
1.50
2.00
2.50
3.00
3.50
low
medium
high
Number of human disturbance types
0.00
1.00
2.00
3.00
4.00
5.00
6.00
7.00
low medium high
g) h)
Simpson's plant diversity
0.00
5.00
10.00
15.00
20.00
25.00
30.00
low
medium
high
Figure 4.2. Differences among all sites ranked as low, medium, and high in a) Shannon’s bird diversity, b) Simpson’s bird diversity, c) proportion of listed bird species, d) herpetofauna species richness, e) plant species richness, f) Shannon’s plant diversity, g) Simpson’s plant diversity, and h) number of human disturbance types (richness).
26

Due to the low sample size, we were unable to diversity and richness, and lower herpetofauna richness quantitatively analyze rankings within land cover types; (Figure 4.3). Interestingly, the medium ranked sites had the however, trends can be observed in bar graphs. For forests, lowest bird richness and diversity. low and medium ranked sites tended to have lower plant
a)
Forest bird species richness
0
5
10
15
20
25
low
medium
high
b)
Forest Shannon's bird diversity
0
0.5
1
1.5
2
2.5
3
low medium high
Forest herpetofauna species richness
0
1
2
3
4
5
6
low
medium
high
Forest Shannon's plant diversity
0
0.5
1
1.5
2
2.5
low
medium
high
Forest Simpson's bird diversity
0
2
4
6
8
10
12
low medium high
c) d)
Forest plant species richness
0 2 4
6 8
10 12
14 16
low
medium
high
e) f)
Forest Simpson's plant diversity
0
1
2
3
4
5
6
low
medium
high
g)
Figure 4.3. Means and standard errors of forest sites ranked as low, medium or high in qualitative site assessments in a) bird species richness, b) Shannon’s bird diversity, c) Simpson’s bird diversity, d) herpetofauna species richness, e) plant species richness, f) Shannon’s plant diversity, and g) Simpson’s plant diversity.
27

All five nonforested sites were ranked as medium or support much lower plant diversity than medium quality high quality by the qualitative site assessment. High quality sites. There were no other notable differences between sites tended to support higher bird diversity (Figure 4.4). rankings for the other variables. Contrary to our expectations, high quality sites tended to
a)
Nonforest Simpson's bird diversity
0 1 2 3 4 5 6 7 8 9
medium high
b)
Nonforest Shannon's plant diversity
0
1
2
3
4
5
medium high
Nonforest Simpson's plant diversity
0
10
20
30
40
50
medium
high
c) Figure 4.4. Means and standard errors of nonforested sites ranked as medium or high in qualitative site assessments in a) Simpson’s bird diversity, b) Shannon’s plant diversity and c) Simpson’s plant diversity. No sites were ranked as low quality.
Among the wetland sites, only one was ranked in the diversity (Figure 4.5). There were no notable differences qualitative assessment as medium quality (and only two between rankings for the other diversity, rarity, and were ranked as low quality). High quality sites tended to persistence variables. support much higher levels of plant species richness and
a)
Wetlands plant species richness
0
10
20
30
40
50
60
low high
b)
Wetlands Simpson's plant diversity
0 5
10
15
20 25 30 35
low high
Figure 4.5. Means and standard errors of wetland sites ranked as low or high in qualitative site assessments in a) plant species richness and b) Simpson’s plant diversity. Only one site was ranked as medium quality, and therefore it was excluded from the analysis.
28

Table 4.3. Summary Kruskal-Wallis statistics for site characteristics by land cover class. Variable & land cover class
N Mean StDev K-W Variable &
land cover class
N Mean StDev K-W
H p H p Bird species richness Herpetofauna richness
Forest 11 15.3 5.8 6.865 0.032 Forest 11 1.82 1.33 10.14 0.006 Nonforest 5 16.0 6.3 Nonforest 5 0.20 0.45 Wetland 10 9.1 4.3 Wetland 10 2.10 0.99
Shannon’s bird diversity Plant species richness Forest 11 2.11 0.44 6.093 0.048 Forest 11 7.5 3.7 16.58 0.001 Nonforest 5 2.05 0.35 Nonforest 5 47.8 23.5 Wetland 4 1.44 0.28 Wetland 10 43.6 19.8
Simpson’s bird diversity Shannon’s plant diversity Forest 11 7.90 3.16 7.566 0.023 Forest 11 1.43 0.31 14.96 0.001 Nonforest 5 6.48 2.07 Nonforest 5 2.82 0.83 Wetland 4 3.38 1.02 Wetland 10 3.02 0.90
% Invasive bird species Simpson’s plant diversity Forest 11 0.01 0.02 0.652 0.722 Forest 11 3.3 0.9 14.55 0.001 Nonforest 5 0.01 0.02 Nonforest 5 18.9 16.9 Wetland 10 0.02 0.06 Wetland 10 21.8 10.6
% Listed bird species % Invasive plant species Forest 11 0.01 0.02 1.277 0.528 Forest 11 0.00 0.00 12.72 0.002 Nonforest 5 0.03 0.04 Nonforest 5 0.11 0.09 Wetland 10 0.04 0.08 Wetland 10 0.02 0.02
Mammal species richness % Listed plant species Forest 11 4.45 1.04 2.936 0.230 Forest 11 0.00 0.00 2.381 0.304 Nonforest 5 5.40 1.82 Nonforest 5 0.00 0.01 Wetland 10 3.70 1.49 Wetland 10 0.01 0.02
% Invasive mammal species Human disturbance richness Forest 11 0.00 0.00 1.6 0.449 Forest 11 3.55 2.34 1.205 0.547 Nonforest 5 0.00 0.00 Nonforest 5 3.60 1.52 Wetland 10 0.05 0.16 Wetland 4 2.50 2.52
Insect richness Forest 11 4.4 1.7 10.735 0.005 Nonforest 5 14.0 7.6 Wetland 4 3.0 4.1
Comparisons among land cover types Nonforested areas supported the highest insect richness of Although a different protocol was used for each of the any of the land cover categories, yet the lowest herpetofauna
three major land cover types, the methods were standardized richness (Figure 4.6 d–e). Forested sites supported the across protocols in such a way that the data analysis should lowest plant richness and diversity (Figure 4.6 f–h), which not result in differences due to the protocol. Thus, any may be partially explained by the lack of spring ephemerals significant differences are considered differences among in the groundcover layer after leaf-out. Finally, invasive land cover types (forested, nonforested, and wetland). plant species composed higher proportions of the overall Several of the variables differed by major land cover types community in nonforested areas, compared to forests and (Table 4.3). Wetlands had lower bird richness and diversity wetlands. compared to forested and nonforested sites (Figure 4.6 a–c).
29

a)
Bird species richness
0 2 4 6 8
10 12 14 16 18 20
Forest
Nonforest
Wetland
Simpson's bird diversity
0 1 2 3 4 5 6 7 8 9
10
Forest
Nonforest
Wetland
b)
c) d)
Shannon's bird diversity
0
0.5
1
1.5
2
2.5
Forest Nonforest Wetland
Insect richness
0 2 4 6 8
10 12 14 16 18 20
Forest Nonforest Wetland
Plant species richness
0
10
20
30
40
50
60
70
Forest Nonforest Wetland
e)
Herpetofauna richness
0
0.5
1
1.5
2
2.5
3
Forest
Nonforest
Wetland
f)
Shannon's plant diversity
0
0.5
1
1.5
2
2.5
3
3.5
Forest
Nonforest
Wetland
Simpson's plant diversity
0
5
10
15
20
25
30
Forest Nonforest Wetland
g) h)
i)
% invasive plant species
0
0.02
0.04
0.06
0.08
0.1
0.12
0.14
0.16
Forest
Nonforest
Wetland
Figure 4.6. Characteristics which displayed significant differences between forest, nonforested, and wetland sites in a) bird species richness, b) Shannon’s bird diversity, c) Simpson’s bird diversity, d) insect richness, e) herpetofauna richness, f) plant species richness, g) Shannon’s plant diversity, h) Simpson’s plant diversity, and i) proportion of invasive plant species.
30

There were very few noticeable distinctions between the land cover subclasses (e.g., deciduous, mixed, and evergreen forests), although this may be due to the extremely small number of sites surveyed in each subclass. There were no differences in forested subclasses
for any of the measured variables. Forested wetlands tended to support higher species richness and diversity than emergent wetlands for most taxonomic groups, including birds, mammals, and plants (Figure 4.7).
Wetland subclasses
0
10
20
30
40
50
60
70
Bird richness Mammal richness
Plant richness Simpson's plant diversity
forested wetlands emergent wetlands
Figure 4.7. Characteristics which displayed significant differences between wetland land cover subclass sites.
Discussion We first evaluated the CrEAM predictions with
respect to the measured ecological conditions of the sites. The CrEAM predictions were not accurate with respect to the animal and plant community characteristics measured by the protocols (Table 4.2) or the qualitative assessments made by the field team upon leaving the site (based on interpretation of Table 3.2). Although a larger sample size may find better agreement, it is likely that the inconsistencies between the 1992-era GIS data layers and the on-the-ground conditions at the sites in 2005, as well as other data issues as pointed out by the SAB, contributed to the discrepancy. Updating the CrEAM model with more current information might bring the predicted condition scores in better agreement with the field conditions. Additionally, if the site boundaries did not match up to the correct CrEAM pixel, the pixel actually surveyed on the ground may not have a similar quality ranking (although presumably adjacent pixels would not have wholly different predicted quality). While the protocol did not match CrEAM predictions, this fact should not detract from the value of these protocols at assessing ecological health.
Overall, the data collected by the protocols were able to differentiate among the qualitative assessment ranks, and in particular differentiated plant communities on sites
judged to be low quality versus those of medium and high quality. This result is somewhat expected, as the protocol dictates the types of data collected by the field team, and these data had at least some influence over their qualitative assessment of a site upon leaving it. The animal communities did not vary as expected; for example, bird diversity was highest on the lowest ranked sites. There are two possible explanations. First, the qualitative site assessments may have preferentially used plant community characteristics when making an assessment. Unfortunately, we have no other independent measure of site condition for which to compare data from the protocols. Second, the protocols may be better designed to collect data on plant communities which represent ecosystem diversity and persistence qualities than for animal communities. The fast, one-time visit may be less suitable for highly mobile animal communities, as many species which the site may usually support may not be present at the time of the survey. Repeated visits might build a more complete picture of these communities. Alternatively, the animal communities may respond more to structural features of the plant community, rather than richness or diversity. If the protocols were designed to collect more data on these structural features, they may be more highly correlated with animal richness and diversity.
31

While plant richness and diversity was higher in the higher quality forest and wetland sites (as expected), the nonforested grassland sites had higher plant richness and diversity on the medium ranked rather than the high ranked sites. High diversity in moderately disturbed sites conforms to the intermediate disturbance hypothesis (Connell 1978), whereby the highest quality grassland sites may have lower plant diversity due to competitive exclusion by the dominant species. However, we had the fewest number of nonforested sites (5), so the lack of patterns seen in the data may also be an artifact of the small sample size.
Plant-based indicators were effective at distinguishing site quality and have many logistical, sampling advantages over animals. For example, plants can be sampled at any time of day, and potentially in larger time windows of the year compared to birds (although some plants need to be flowering for accurate identification). Moreover, a team of two can collect a substantial amount of plant data in a relatively short time frame, and documentation of species is easy. Given these advantages, one might suggest limiting the assessments to plant communities. However, the ecological health of an area is dependent on all biotic and abiotic factors, and cannot be determined by one taxonomic group. When developing the protocols, we attempted to include as much ecological information as possible given the time and labor constraints. Nonetheless, it is important to acknowledge that the protocols were more effective at sampling plants than animals.
Very few invasive species and human disturbances were found on the sites, so these characteristics were not useful in differentiating site quality. The highest numbers of invasive species were found in nonforested grasslands and emergent wetlands (Figure 4.7f), possibly reflecting historical disturbances (e.g., tilling, tiling, and draining) in the Upper Midwest. However, it should be remembered that the sites visited in this project were those that were known to be at least intact enough to classify as a “natural” land cover class. Areas which are more highly disturbed by human activities were less likely to meet the
CrEAM criteria for natural land cover classes, and were therefore excluded from the site visits. We would expect these areas to support much higher numbers of invasive species, and we would expect many more observations (in frequency and type) of human disturbances. Additionally, if these protocols were repeated over time at the same sites, it would be possible to determine the extent to which these data are relevant to changes in quality in these critical ecosystems.
Finally, it should be emphasized that the number of sites visited was very small and the within treatment variability was high, thus limiting the power to detect differences among categories. While many of the variables differed between sites, both in terms of quality rank and land cover type, these differences did not meet a 0.05 significance level. Thus, we expect that our results are conservative and additional data will likely result in more ecological variables being significantly related to site quality. Given a large enough number of sites for each land cover subclass (e.g., deciduous, mixed, and evergreen forest), it may be possible to also use these data to distinguish between these subclasses.
The experience of the field teams with the three protocols for forested, nonforested, and wetland land cover types were generally positive. We found that the data collection methods are straightforward, the list of equipment adequately describes what is needed in the field, and the data can be collected in the four hour time period with four people. The protocols can be modified to fit nine hectare areas which are not square, and the complicated seasonal patterns of taxonomic groups could be addressed by using the protocol repeatedly at the same site, or confining sampling to a smaller time window. While the protocols were designed with the specific purpose of validating the CrEAM GIS model, they may be suitable for other uses. However, further testing would be required to make sure that the protocols collect the necessary data. Alterations made to the protocols are possible (such as the addition of lichen community assessments in forests); however, they should also be tested prior to use.
32

References
Abbitt RJF, Scott JM, Wilcove DS. 2000. The geography of vulnerability: Incorporating species geography and human development patterns into conservation planning. Biological Conservation 96:169-175.
Anderson JR, Hardy EE, Roach JT, Witmer RE. 1976. A land use and land cover classification system for use with remote sensor data. Geological Survey Professional Paper 964, United States Government Printing Office, Washington, D.C. 28 pp.
Aspinall R, Pearson D. 2000. Integrated geographical assessment of environmental condition in water catchments: Linking landscape ecology, environmental modeling and GIS. Journal of Environmental Management 59:299-319.
Bagley MJ, Franson SE, Christ SA, Waits ER, Toth GP. 2003. Genetic diversity as an indicator of ecosystem condition and sustainability: Utility for regional assessments of stream condition in the eastern United States. EPA/600/R-03/056 (NTIS PB20044107063). U.S. Environmental Protection Agency, Washington, D.C.
Barbour MT, Gerritsen J, Snyder BD, Stribling JB. 1999. Rapid Bioassessment Protocols for use in streams and wadeable rivers: Periphyton, benthic macroinvertebrates and fish, Second Edition. EPA 841-B-99-002. U.S. Environmental Protection Agency; Office of Water; Washington, D.C.
Board on Earth Sciences and Resources. 2002. Community and Quality of Life: Data needs for informed decision making. National Academies Press, Washington, D.C.
Bojórquez-Tapia LA, Juárez L, Cruz-Bello G. 2002. Integrating fuzzy logic, optimization, and GIS for ecological impact assessments. Environmental Management 30:418-433.
Caldwell JC, Woodruff TJ, Morello-Frosch R, Axelrad DA. 1998. Application of health information to hazardous air pollutants modeled in EPA’s cumulative exposure project. Toxicology and Industrial Health 14:429-454.
Campbell DE. 2001. Proposal for including what is valuable to ecosystems in environmental assessments. Environmental Science and Technology 35:2867-2873.
Carpenter SR, Westley F, Turner MG. 2005. Surrogates for resilience of social-ecological systems. Ecosystems 8:941-944.
Chapin FS III, Zavaleta ES, Eviner VT, Naylor RL, Vitousek PM, Reynolds HL, Hooper DU, Lavorel S, Sala OE, Hobbie SE, Mack MC, Díaz S. 2000. Consequences of changing biodiversity. Nature 405:234-242.
Connell, JH. 1978. Diversity in tropical rain forests and coral reefs. Science 199:1302-1310.
Costanza R, Mageau M. 1999. What is a healthy ecosystem? Aquatic Ecology 33:105-115.
Dale VH, Brown S, Haeuber A, Hobbs NT, Huntly N, Naiman RJ, Riebsame WE, Turner MG, Valone TJ. 2000. Ecological principles and guidelines for managing the use of land. Ecological Applications 10:639-670.
Dale VH, Beyeler SC. 2001. Challenges in the development and use of ecological indicators. Ecological Indicators 1:3-10.
Dawes RM. 1986. Forecasting one’s own preference. International Journal of Forecasting 2:5-14.
DellaSalla DA, Staus NL, Strittholt JR, Hackman A, Iacobelli A. 2001. An updated protection areas database for the United States and Canada. Natural Areas Journal 21:124-135.
Dillingham GL, Martin B. 2000. Aviation and the environment: FAA’s role in major airport noise programs. US General Accounting Office, Washington, D.C. 102 pp.
Dobson AP, Rodriguez JP, Roberts WM, Wilcove DS. 1997. Geographic distribution of endangered species in the United States. Science 275:550-553.
Dougherty TC, Hall AW, Wallingford HR. 1995. Environmental impact assessment of irrigation and drainage projects. Report No. 53, UN Food and Agriculture Organization, Rome, Italy.
Ehrlich PR, Wilson EO. 1991. Biodiversity studies: Science and Policy. Science 253:758-762.
33

FAA. 2002. Estimated airplane noise levels in A-weighted decibels. Advisory Circular 36-3H. Federal Aviation Administration, Washington, D.C.
Federal Register. 2005. Science Advisory Board Staff Office; Notification of an upcoming Science Advisory Board meeting 70(51):13028.
Fennessy MS, Jacobs AD, Kentula ME. 2004. Review of Rapid Methods for Assessing Wetland Condition. EPA/620/R-04/009. U.S. Environmental Protection Agency, Washington, D.C.
Forman RTT, Alexander LE. 1998. Roads and their major ecological effects. Annual Review of Ecology and Systematics 29:207-231.
Foster RB, Parker III TA, Gentry AH, Emmons LH, Chicchón A, Schulenberg T, Rodríguez L, Lamas G, Ortega H, Icochea J, Wust W, Romo M, Castillo JA, Phillips O, Reynel C, Kratter A, Donahue PK, Barkley LJ. 1994. The Tambopata-Candamo Reserved Zone of Southeastern Perú: A Biological Assessment. Conservation International, Washington, D.C.
Gascon C, Williamson GB, da Fonseca GAB. 2000. Receding forest edges and vanishing reserves. Science 288:1356-1358.
Gaston KJ. 1994. Rarity. Chapman and Hall, London, UK.
Gaston KJ. 2000. Global patterns in biodiversity. Nature 405:220-227.
GAO. 2000. Aviation and the Environment: FAA’s Role in Major Airport Noise Programs. GAO/RCED-00-98 (April 2000). U.S. General Accounting Office, Washington, D.C.
Gunderson LH, Pritchard L, Jr., Holling CS, Folke C, Peterson GD. 2002. A summary and synthesis of resilience in large-scale systems. Pages 249-266 in LH Gunderson, Pritchard L, Jr., (eds), Resilience and the behavior of large-scale systems. Island Press, Washington, D.C.
Hayden T. 2007. Conservation science: Ground force. Nature 445:481-483.
Helsel DR. 1993. Statistical analysis of water-quality data. In RW Paulson et al. (compilers), National water summary 1990-1991 - Hydrologic events and stream water quality. U.S. Geological Survey Water-Supply Paper 2400, p. 93-100.
Hopton ME, Mayer AL. 2006. Using Self-Organizing Maps to explore patterns in species richness and protection. Biodiversity and Conservation 15:4477-4494.
Innis SA, Naiman RJ, Elliott SR. 2000. Indicators and assessment methods for measuring the ecological integrity of semi-aquatic terrestrial environments. Hydrobiologia 422/423:111-131.
Jenson ME, Bourgeron P, Everett R, Goodman I. 1996. Ecosystem management: A landscape ecology perspective. Water Resources Bulletin 32:203-216.
Jones KB, Riiters KH, Wickham JD, Tankersley Jr. RD, O’Neill RV, Chaloud DJ, Smith ER, Neale AC. 1997. An ecological assessment of the United States Mid-Atlantic Region: A landscape atlas. EPA/600/R-97/130. US Environmental Protection Agency, Washington, D.C., 104 pp.
Krankina ON, Harmon ME, Kukuev YA, Treyfeld RF, Kashpor NN, Kresnov VG, Skudin VM, Protasov NA, Yatskov M, Spycher G, Povarov ED. 2002. Coarse woody debris in forest regions of Russia. Canadian Journal of Forest Research 32:768-778.
Krohne DT. 2001. General Ecology. Brooks/Cole, Belmont, CA.
Küchler AW. 1964. Manual to accompany the map of potential vegetation of the conterminous United States. Special Publication No. 36. American Geographical Society, NY. 77 pp.
Kunin WE and Gaston KJ. 1993. The biology of rarity: Patterns, causes and consequences. Trends in Ecology and Evolution 8:298-301.
Kurtz JC, Jackson LE, Fisher WS. 2001. Strategies for evaluating indicators based on guidelines from the Environmental Protection Agency’s Office of Research and Development. Ecological Indicators 1:49-60.
Levin SA, Grenfell B, Hastings A, Perelson AS. 1997. Mathematical and computational challenges in population biology and ecosystems science. Science 275:334-343.
Lindenmayer DB, Franklin JF. 2002. Conserving forest biodiversity: A comprehensive multiscaled approach. Island Press, Washington, D.C.
Locantore NW, Tran LT, O-Neill RV, McKinnis PW, Smith ER, O’Connell M. 2004. An overview of data integration methods for regional assessment. Environmental Monitoring and Assessment 94:249-261.
34

Longcore T, Rich C. 2004. Ecological light pollution. Frontiers in Ecology and the Environment 2:191-198.
Loveland TR, Shaw DM. 1996. Multi resolution land characterization: building collaborative partnerships. Pages 83-89 in JM Scott, T Tear, F Davis (eds), Gap analysis: A landscape approach to biodiversity planning. Proceedings of the ASPRS/GAP Symposium. National Biological Service, Moscow, ID.
Lugo AE, Brown S. 1991. Comparing tropical and temperate forests. Pp. 319-330 in J Cole, G Lovett, S Findlay (eds), Comparative Analyses of Ecosystems: Patterns, mechanisms and theories. Springer-Verlag, NY.
MacArthur RH, Wilson EO. 1967. The theory of island biogeography. Princeton University Press, Princeton NJ.
Mack JJ. 2001. Ohio Rapid Assessment Method for Wetlands v. 5.0: User’s Manual and Forms. Ohio EPA Technical Report WET/2001-1. Ohio Environmental Protection Agency Division of Surface Water, 401/Wetland Ecology Unit, Columbus, OH.
Magurran AE. 1988. Ecological Diversity and its Measurement. Princeton University Press, Princeton, NJ.
Manci KM, Gladwin DN, Villella R, Cavendish MG. 1988. Effects of aircraft noise and sonic booms on domestic animals and wildlife: a literature synthesis. U.S. Fish and Wildlife Service, NERC-88/29. Ft. Collins, CO. 88 pp.
Millennium Ecosystem Assessment. 2005. Ecosystems and human well-being: Synthesis. Island Press, Washington, D.C.
Moody A, Woodcock CE. 1994. Scale-dependent errors in the estimation of land-cover proportions: Implications for global land-cover datasets. Photogrammetric Engineering & Remote Sensing 60:585-596.
Mooney HA, Cleland EE. 2001. The evolutionary impact of invasive species. Proceedings of the National Academy of Sciences USA 98:5446-5451.
Norton D. 2004. Assessment and Watershed Protection Division, U.S. Environmental Protection Agency, public comments. http://www.epa.gov/nerl/news/profiles/303d.html (Accessed 18 September 2007).
OECD. 2004. OECD Key Environmental Indicators. Organisation for Economic Co-Operation and Development, Paris, France. 36pp.
Olden JD, Poff NL, Douglas MR, Douglas ME, Fausch KD. 2004. Ecological and evolutionary consequences of biotic homogenization. Trends in Ecology and Evolution 19:1824.
O’Malley R, Wing K. 2000. Forging a new tool for ecosystem reporting. Environment 42:20-31.
Omernik JM. 1995. Ecoregions: A spatial framework for environmental management. Pp. 49-69 in WS Davis and TP Simon (eds), Biological assessment and criteria: Tools for water resource planning and decision making. Lewis Publishers, Boca Raton.
Omernik JM, Bailey RG. 1997. Distinguishing between watersheds and ecoregions. Journal of American Water Resources Association 33:935-949.
Patil GP, Brooks RP, Myers WL, Rapport DJ, Taillie C. 2001. Ecosystem health and its measurement at landscape scale: Toward the next generation of quantitative assessments. Ecosystem Health 7:307-316.
Patil GP, Brooks RP, Myers WL, Taillie C. 2002. Multiscale advanced raster map analysis system for measuring ecosystem health at landscape scale – A novel synergistic consortium initiative. Pages 567-576 in DJ Rapport, WL Lasley, DE Rolston, NO Nielsen, CO Qualset, AB Damania (eds), Managing for Healthy Ecosystems. CRC Press.
Pienkowski MW, Bignal EM, Galbraith CA, McCracken DI, Stillman RA, Boobyer MG, Curtis DJ. 1995. A simplified classification of land-type zones to assist the integration of biodiversity objectives in land-use policies. Biological Conservation 75:11-25.
Pimm SL, Lawton JH. 1998. Planning for biodiversity. Science 279:2068-2069.
Plante M, Lowell K, Potvin F, Boots B, Fortin M-J. 2004. Studying deer habitat on Anticosti Island, Québec: relating animal occurrences and forest map information. Ecological Modelling 174:387-399.
Poiani K, Richter B. 2000. Functional landscapes and the conservation of biodiversity. Working Paper No. 1 in Conservation Science, The Nature Conservancy, Washington, D.C.
Potts R, Gustafson E, Stewart SI, Thompson FR, Bergen K, Brown DG, Hammer R, Radeloff V, Bengston D, Sauer J, Sturtevant B. 2004. The Changing Midwest Assessment: land cover, natural resources, and people. Gen. Tech. Rep. NC-250. St. Paul, MN: U.S. Department of Agriculture, Forest Service, North Central Research Station. 87 p.
35

Rabinowitz, D. 1981. Seven forms of rarity. Pages 205-217 in H Synge (ed.), The biological aspects of rare plant conservation. John Wiley & Sons, New York.
Roberts L. 1991. Ranking the rainforests. Science 251:15591560.
Rosenbaum AS, Axelrad DA, Woodruff TJ, Wei Y-H, Ligocki MP, Cohen JP. 1999. National estimates of outdoor air toxics concentrations. Journal of the Air and Waste Management Association 49:1138-1152.
Rosenzweig ML. 1995. Species Diversity in Space and Time. Cambridge University Press, New York, NY.
Sarkar S, Justus J, Fuller T, Kelley C, Garson J, Mayfield M. 2005. Effectiveness of environmental surrogates for the selection of conservation area networks. Conservation Biology 19:815-825.
Sayre R, Roca E, Sedaghatkish G, Young B, Keel S, Roca R, Sheppard S. 2000. Nature in Focus: Rapid Ecological Assessment. Island Press, Washington D.C. 182 pp.
Science Advisory Board. 2005. Review of the EPA Region 5 Critical Ecosystem Assessment Model (CrEAM). EPASAB-05-011. US Environmental Protection Agency, Washington, D.C. 47 pp. Available online: http://www.epa.gov/sab/panels/epec_crmpesls.html.
Similä M, Kouki J, Mönkkönen M, Sippola A-L, Huhta E. 2006. Co-variation and indicators of species diversity: Can richness of forest-dwelling species be predicted in northern boreal forests? Ecological Indicators 6:686-700.
Smith ER, Tran LT, O’Neill RV, Locantore NW. 2004. Regional Vulnerability Assessment of the Mid-Atlantic Region: Evaluation of integration methods and assessment results. EPA/600/R-03/082 (NTIS PB2004104952). US Environmental Protection Agency, Washington, D.C.
Southerland M. 1994. Evaluation of ecological impacts from highway development. US Environmental Protection Agency, EPA 300-B-94-006, Washington D.C., 69 pp.
Stein BA. 2001. A fragile cornucopia: Assessing the status of U.S. biodiversity. Environment 43:10-22.
Underwood AJ. 1989. The analysis of stress in natural populations. Biological Journal of the Linnean Society 37:51-78.
USEPA. 1986. Quality criteria for water. EPA/440/5-86001. US Environmental Protection Agency, Washington, D.C.
ecological modeling method (EMM) and its application. Hydrobiologia 443:159-175.
36
USEPA. 2000. Preliminary Data Summary, Airport Deicing Operations (Revised). EPA-821-R-00-016. U.S. Environmental Protection Agency, Washington, D.C.
USEPA. 2001. BASINS 3.0: Better Assessment Science Integrating point and Nonpoint Sources. EPA/823/B01/001. U.S. Environmental Protection Agency, Washington, D.C.
USEPA. 2002. 25 years of RCRA: Building on our past to protect our future. 530-K-02-027. U.S. Environmental Protection Agency, Washington, D.C. [online database: http://www.epa.gov/enviro/html/rcris/rcris_query.html]
US Fish and Wildlife Service. 2006. Summary of Listed Species; Species and Recovery Plans as of 03/06/2006. Available online at http://ecos.fws.gov/tess_public/TESSBoxscore [accessed 5 March 2006].
US Forest Service. 2004. Management Indicator Species Environmental Assessment: Appendix C1 – Summary of analysis Processes. http://www.fs.fed.us/r5/klamath/projects/projects/mis/app endixc.shtml [accessed 10 February 2007].
van Horssen PW, Schot PP, Barendregt A. 1999. A GIS-based plant prediction model for wetland ecosystems. Landscape Ecology 14:253-265.
Verburg PH, Soepboer W, Veldkamp A, Limpiada R, Espaldon V, Mastura SSA. 2002. Modeling the spatial dynamics of regional land use: The CLUE-S model. Environmental Management 30:391-405.
Wade TG, Ebert DW. 2005. Analytical Tools Interface for Landscape Assessments (ATTILA) User Manual. EPA/600/R-04/083. US Environmental Protection Agency, Washington, D.C.
Weber R, Wolf J. 2000. Maryland’s Green Infrastructure – using landscape assessment tools to identify a regional conservation strategy. Environmental Monitoring and Assessment 63:265-277.
Wilcove DS, Rothstein D, Dubrow J, Phillips A, Losos E. 1998. Quantifying threats to imperiled species in the United States. BioScience 48:607-615.
Wilson EO. 1992. The diversity of life. Belnap Press (Harvard), Cambridge MA.
Xu F-L, Dawson RW, Tao S, Cao J, Li B-G. 2001. A method for lake ecosystem health assessment: An

APPENDIX A List of meeting participants and affiliations
Meeting 1 Participants Candice Bauer, US Environmental Protection Agency Martin Berg, Loyola University Douglas Boucher, Hood College Richard Bradley, Ohio State University Kim Brown, Ohio University Kelly Burks-Copes, US Army Corps of Engineers Guy Cameron, University of Cincinnati George Estabrook, University of Michigan – Ann Arbor Michael Gentleman, US Environmental Protection Agency Jochen Gerber, The Field Museum Edward Hammer, US Environmental Protection Agency Edwin Herricks, University of Illinois – Chicago George Host, Natural Resources Research Institute Ricardo Lopez, US Environmental Protection Agency Patrick Malone, Illinois Department of Natural Resources Daniel Mazur, US Environmental Protection Agency Barbara Mazur, US Environmental Protection Agency Greg Mueller, The Field Museum Darrel Murray, University of Illinois – Chicago Diane Nelson, US Environmental Protection Agency Gregory Nowacki, U S Forest Service Dennis Nyberg, University of Illinois – Chicago John Ritzenthaler, National Audubon Society Robin Scribailo, Purdue University – North Central Nancy Solomon, Miami University Doug Stotz, The Field Museum Phil Willink, The Field Museum Kristopher Wright, University of Wisconsin – Platteville Paul Zedler, University of Wisconsin - Madison
Meeting 2 Participants Forested Terrestrial Protocol Kim Brown, Ohio University John Bruggink, Northern Michigan University Gary Fewless, University of Wisconsin, Green Bay Rick Gardner, Ohio Department of Natural Resources Margaret Kuchenreuther, University of Minnesota - Morris Jon Mendelson, Governors State University Nancy Murray, Ohio Wesleyan University Dennis Nyberg, University of Illinois - Chicago Nancy Solomon, Miami University Craig Wayson, Indiana University - Bloomington
Nonforested Terrestrial Protocol Roger Anderson, Illinois State University George Estabrook, University of Michigan - Ann Arbor Tom Givnish, University of Wisconsin - Madison Alice Heikens, Franklin College Pat Malone, Illinois Department of Natural Resources Darrel Murray, University of Illinois - Chicago Daniel Pavuk, Bowling Green State University Chris Stanton, Baldwin-Wallace College Kathy Winnett-Murray, Hope College Barbara Zom-Arnold, University of Illinois - Chicago
Wetlands Protocol Tim Ellinger, University of Wisconsin - Milwaukee Carl vol Ende, Northern Illinois University Clark Garry, University of Wisconsin - River Falls Jim Hodgson, St. Norbert College David Lonzarich, University of Wisconsin - Eau Claire Vicky Meretsky, Indiana University - Bloomington Carl Richards, Sea Grant Minnesota Greg Spyreas, Illinois Natural History Survey Daniel Soluk, Illinois Natural History Survey
A-1