questionnaire survey report on the university gender ... · pdf filethe university gender...
TRANSCRIPT

Questionnaire Survey Report on
the University Gender Equality Action Plan
June 2010
University of Tsukuba Office of Gender Equality

1
Introduction
This survey report summarizes the responses of 2,004 members of the staff at the University of Tsukuba to a questionnaire survey conducted in December 2009 on the University’s gender equality action plan.
Prior to this survey, the Office of Gender Equality conducted a questionnaire survey on gender equality
in 2008 and investigated what action plans would be needed in order to promote gender equality at the University. One of the outcomes of this development was “Sustainable Support for Female Researchers – the University of Tsukuba’s Approach”, a model program adopted in the 2009 academic year to support female researchers through Special Coordination Funds for Promoting Science and Technology received from the Japan’s Ministry of Education, Culture, Sports, Science and Technology. The Office is currently working to advance this program.
The program consists of projects in each of four main areas: 1) Consciousness change
• Lecture series on gender equality as part of the Liberal Arts education (April 2010) • On-campus seminars for management-level university staff (scheduled for June and July 2010) • International symposium (scheduled for September 2010)
2) Work environment improvement
• Corporate contracts with daycare facilities and babysitter agencies (begun in November 2009) • Introduction of a childcare coupon program (May 2010)
3) Organization of a career path counseling and support system
• Opening of the Au Work-life Balance Counseling Center on Tsukuba Campus by counselors and psychological counselors (April 2010)
• Opening of the Au Work-life Balance Counseling Center on the Tokyo Campus by counselors and psychological counselors (May 2010)
4) Other relevant projects
• Launch of an information and support website for female researchers (February 2010).
The questionnaire survey was conducted in order to assess staff opinion on future initiatives to be undertaken by the University of Tsukuba and to draw up a long-term action plan for 2010 and subsequent academic years. We are grateful to all participants for taking time out of their busy schedules to give us feedback.
We look forward to the community’s continued understanding and support as we pursue a number of
initiatives that garnered a strong response from the survey’s 2,004 respondents. For more information on our Work-life Balance program and other activities at the Office of Gender
Equality, please visit our website at http://www.geo-wlb.tsukuba.ac.jp/?q=en/.
June 2010 Kazuko Shiojiri, Vice President
Akiko Yoshise, Director Office of Gender Equality
University of Tsukuba

2
Contents
Introduction .................................................................................................................................................. 1 Contents ....................................................................................................................................................... 2 Questionnaire Results Summary ................................................................................................................... 3
1. Response rate .................................................................................................................................. 3
2. Respondent characteristics .............................................................................................................. 4 1) Gender, position and department ................................................................................................. 4 2) Spouse’s employment status and living status with parents .......................................................... 6
3. Childbirth, childcare and nursing care ............................................................................................. 9
4. Action plans needed for the support for childbirth, childcare and nursing care (overall)................. 12
1) Responses by gender ................................................................................................................. 12 2) Responses by whether the respondent had responsibility for nursing care .................................. 14
5. Action plans needed for the support for childbirth, childcare and nursing care (university faculty) 16
1) Overall response ....................................................................................................................... 16 2) Analysis by department ............................................................................................................. 17
6. Other action plans that are considered to be required for the support for childbirth, childcare and nursing care ......................................................................................................................................... 19
7. Affirmative actions that are considered effective ........................................................................... 20
8. Career support and consciousness change that are considered effective ......................................... 22
9. Approach to gender equality at the University of Tsukuba ............................................................. 24
1) Website and questionnaire ......................................................................................................... 24 2) Introducing new courses............................................................................................................ 26 3) Temporary daycare services ...................................................................................................... 28 4) Counseling Center ..................................................................................................................... 31 5) Website ..................................................................................................................................... 34
10. Gender equality at the University .................................................................................................. 37

3
Questionnaire Results Summary
1. Response rate
A total of 5,378 copies of questionnaire were distributed throughout the University. Responses were received from 2,008 members of staff. There were 2,004 valid responses, giving an overall response rate of 37.3%, which unfortunately was lower than that of the previous survey. For all university organizations to which 40 or more copies of the questionnaire were distributed, the number and percentage of respondents are listed by organization from the highest to the lowest response rate. We would like to thank again all the organizations that participated in the survey.
The response rates by position were about 25% for university faculty, about 65% for administrative staff and about 36% for laboratory school teachers.
University Organizations* Distributed (n)
Response (n)
Response (%)
Department of General Affairs 111 91 82.0% University Library (except Otsuka Library) 89 73 82.0% Department of Finance and Accounting 53 43 81.1% Department of Facilities 54 39 72.2% Department of Research Promotion 46 33 71.7% Department of Global Activities 49 34 69.4% Department of Educational Promotion 62 42 67.7% Special Needs Education School for the Deaf, University of Tsukuba 114 77 67.5% Special Needs Education School for Children with Autism, University of Tsukuba
48 30 62.5%
Senior High School at Sakado, University of Tsukuba 50 24 48.0% Academic Service Office for Library, Information and Media Studies** 116 54 46.6% Agricultural and Forestry Research Center 54 25 46.3% Academic Service Office for Human Sciences** 92 41 44.6% Academic Service Office for Pure and Applied Sciences** 292 121 41.4% Special Needs Education School for the Physically Challenged, University of Tsukuba
78 32 41.0%
Research Facility Center for Science and Technology, and Radioisotope Center 44 17 38.6% Academic Service Office for Art and Sport Sciences** 268 100 37.3% Education Bureau of the Laboratory School 60 22 36.7% Center for Computational Sciences 47 17 36.2% Academic Service Office for Systems and Information Engineering** 395 142 35.9% Academic Service Office for Life and Environmental Sciences** 366 128 35.0% Foreign Language Center 42 13 31.0% Junior High School at Komaba, University of Tsukuba, and Senior High School at Komaba, University of Tsukuba
57 17 29.8%
Academic Service Office for Humanities and Social Sciences** 270 79 29.3% Junior High School at Otsuka, University of Tsukuba, and Senior High School at Otsuka, University of Tsukuba
92 26 28.3%
Special Needs Education School for the Mentally Challenged, University of Tsukuba
53 14 26.4%
University Hospital 1,212 313 25.8% Academic Service Office for Business Sciences** 133 34 25.6% Special Needs Education School for the Visually Impaired, University of Tsukuba
123 30 24.4%
Elementary School, University of Tsukuba 51 12 23.5% Academic Service Office for Medical Sciences** 516 111 21.5%
Total 5,378 2,008 37.3% *Some Centers are included in relevant Academic Service Offices. **Academic Service Offices include faculty members from relevant Graduate Schools. 【訳注:脚注の内容にあわせて表の該当箇所に「*」「**」を挿入しております。】

4
2. Respondent characteristics 1) Gender, position and department
1/ 5/ Gender (n=2,004) Comparison of Gender by Age Group 2/ 6/ Male 20’s 30’s 40’s 50’s 60’s Not specified 3/ 7/ Female Male Female 4/ Not specified
The total number of respondents was 2,004, of which 47% was male and 52% female. A comparison of the proportions of men and women in different age groups reveals increasingly more male respondents in older age groups; this reflects the demographic composition of the University as a whole.
1/ Comparison of Respondents by Position (n=2,004) 2/
1/
2/
3/
4/ 5/
6/
7/
1/
2/
3/
4/
5/ 6/
7/
8/
9/
10/
11/
12/
13/ 14/
15/
16/
17/
18/
19/
20/
21/ 22/ 23/

5
University faculty 3/ Researchers 4/ Laboratory school teachers 5/ Administrative staff 6/ Technical officials 7/ Medical and nursing staff 8/ Technicians and custodians 9/ Other faculty members (part-time) 10/ Other administrative staff (part-time) 11/ Not specified 12/ Comparison of Respondents by Department (n=422) 13/ Humanities and Social Sciences 14/ Business Sciences 15/ Pure and Applied Sciences 16/ Systems and Information Engineering 17/ Life and Environmental Sciences 18/ Comprehensive Human Sciences (Human Sciences) 19/ Comprehensive Human Sciences (Physical Education, Health and Sport Sciences / Art and Design) 20/ Comprehensive Human Sciences (Medicine) 21/ Library, Information and Media Studies 22/ Others 23/ Not specified
By position, 27% of respondents were administrative officials, 21% were the university faculty, 18% were part-time administrative staff, and 12% were medical and nursing staff. By department 34% of respondents were in Comprehensive Human Sciences, 15% in Life and Environmental Sciences, 15% in Pure and Applied Sciences and 12% in Humanities and Social Sciences.

6
2) Spouse’s employment status and living status with parents Of 1,367 respondents who were
married, the percentage of living apart from his/her spouse reached about 10% for the university faculty, which was the highest of all by position, followed by laboratory school teachers and by medical and nursing staff. 1/ Percentage of Employees Living With or Apart from Spouse by Position
2/ University faculty Researchers Laboratory school teachers Administrative staff Technical officials Medical and nursing staff Technicians and custodians Other faculty members (part-time) Other administrative staff (part-time)
3/ Living with the spouse Living apart from the spouse Not specified
The percentage of respondents whose spouse was in employment decreased with age.
1/ Comparison of Employment Status of Spouses by Age Group
2/ 20’s 30’s 40’s 50’s 60’s
3/ In full-time employment In part-time employment Own a business Not in employment Not specified
1/
2/ 3/
1/
2/ 3/

7
By position, the percentage of respondents whose spouse was in employment was lower for the university faculty and technicians and Custodians and highest for medical and nursing staff among full-time workers. 1/ Comparison of Employment Status of
Spouses by Position 2/ University faculty Researchers Laboratory school teachers Administrative staff Technical officials Medical and nursing staff Technicians and custodians Other faculty members (part-time) Other administrative staff (part-time) 3/ In full-time employment In part-time employment Own a business Not in employment Not specified
1/
2/ 3/

8
Of 1,367 respondents who were married, only 229 were living with his/her parent(s), indicating a trend toward nuclear families at the University of Tsukuba as well.
1/ Comparison of Family Structure by Marital Status 2/ Child(ren) 3/ Parent(s) 4/ Grandparent(s) 5/ Other family members 6/ Married 7/ Not married
1/ 2/ 3/ 4/
5/
6/
7/

9
3. Childbirth, childcare and family care Of all respondents, about
400 were planning to have
children in the future.
1/ “Are you planning to have children?” (n=2,004) 2/ Yes 3/ No 4/ Not specified
1/
2/
3/
4/

10
The percentage of respondents who were planning to have children was especially high among medical and nursing staff.
1/ Comparison of Respondents Planning to Have Children by Position 2/ University faculty Researchers Laboratory school teachers Administrative staff Technical officials Medical and nursing staff Technicians and custodians Other faculty members (part-time) Other administrative staff (part-time) 3/ Yes No Not specified
1/
2/ 3/

11
Not many respondents in their 20’s had children. This reflects the facts that female respondents who outnumber male respondents in younger age groups have fewer children than males and that there were fewer respondents with children among medical and nursing staff in which the proportion of the young age group is high.
1/ Presence of Children by Age Group 2/ 20’s 40’s 60’s 3/ With children No children Not specified
Of all respondents, 27%, or more than 500, answered that he/she was or had been responsible for the care of a family member. More than 40% of workers in their 50’s and more than 50% of workers in their 60’s had a past or present experience in caring for family members. 1/
“Do you or did you have responsibility for the care of a family member?” (n=2,004) 2/ Yes 3/ No 4/ Not specified
1/
2/ 3/
1/
2/
3/
4/

12
4. Action plans needed for the support for childbirth, childcare and family care (overall) 1) Responses by gender
1/ Action Plans Required for the Support (All Respondents) (n=2,004, Multiple answers up to 3) 2/ Increase in childcare facilities Daycare services for sick and convalescent children Childcare services for elementary school students Opening childcare facilities for children waitlisted for nurseries Transportation services for nursery and school-age children Establish an information network for childbirth, childcare and family care Financial support for babysitter or other services for employees who are having difficulties in balancing work and childcare Allow fixed-term employees to apply for extension Financial support for employees living apart from their spouses Others Not specified
The most needed plan was “increase in childcare facilities” followed by “financial support for babysitter or other services for employees who are having difficulties in balancing work and childcare,” “daycare services for school-age children,” “daycare services for sick and convalescent children,” and “opening childcare facilities for children waitlisted for nurseries” in this order.
The top five plans were similar also by age group and by position.
1/
2/

13
However, the action plan that was considered most necessary was different between men and women. “Daycare services for sick and convalescent children” was most desired by female employees, while it was only the 6th rank in male employees, indicating that there is an urgent need for this type of support among female respondents.
1/ Comparison of Action Plans Required for the Support by Gender (All Respondents) 2/ Increase in childcare facilities Daycare services for sick and convalescent children Childcare services for elementary school students Opening childcare facilities for children waitlisted for nurseries Transportation services for nursery and school-age children Establish an information network for childbirth, childcare and family care Financial support for babysitter or other services for employees who are having difficulties in balancing work and childcare Allow fixed-term employees to apply for extension Financial support for employees living apart from their spouses Others Not specified 3/ Male 4/ Female
1/
3/
4/
2/

14
2) Responses by whether the respondent had responsibility for family care
1/ Comparison of Action Plans Required for the Support by the Presence/Absence of a Family Member Who Needs/Needed Care (All Respondents) 2/ Increase in childcare facilities Daycare services for sick and convalescent children Childcare services for elementary school students Opening childcare facilities for children waitlisted for nurseries Transportation services for nursery and school-age children Establish an information network for childbirth, childcare and family care Financial support for babysitter or other services for employees who are having difficulties in balancing work and childcare Allow fixed-term employees to apply for extension Financial support for employees living apart from their spouses Others Not specified 3/ Yes 4/ No
1/
2/
3/
4/

15
When comparing the respondents who were/had been responsible for family care and those who did not, “financial support for babysitter or other services for employees who are having difficulties in balancing work and childcare” was the most needed support among those who had experience in family care. The University has introduced a childcare coupon program, but it seems that financial support for family care is also important.

16
5. Action plans needed for the support for childbirth, childcare and family care (university faculty) 1) Overall response
1/ “Which support do you think is necessary?” (University Faculty) (n=422, Multiple answers up to 3) 2/ Preferential allocation of part-time positions Preferential allocation of government subsidies Research support, e.g., by allocation of an RA Academic support, e.g., by allocation of a TA Financial support for research Faculty evaluation with consideration for childbirth, childcare and family care Others Not specified
Comparison by any age group, workplace location and marital status revealed the following three ranks of support actions:
1) Most desired supports (selected by ≥70% of respondents)
• Preferential allocation of part-time positions • Faculty evaluation with consideration for childbirth, childcare and family care
2) Moderately desired supports (selected by ≥30% of respondents)
• Research support, e.g., by allocation of a research assistant (RA) • Academic support, e.g., by allocation of a teaching assistant (TA)
3) Least desired supports (selected by ≥10% of respondents)
• Preferential allocation of government subsidies • Financial support for research.
The Office of Gender Equity has been working to set up a system under which employees can apply
directly for the University-controlled part-time positions. At the same time, it seems imperative to incorporate a section for childbirth, childcare and family care into the faculty evaluation system.
1/
2/
17
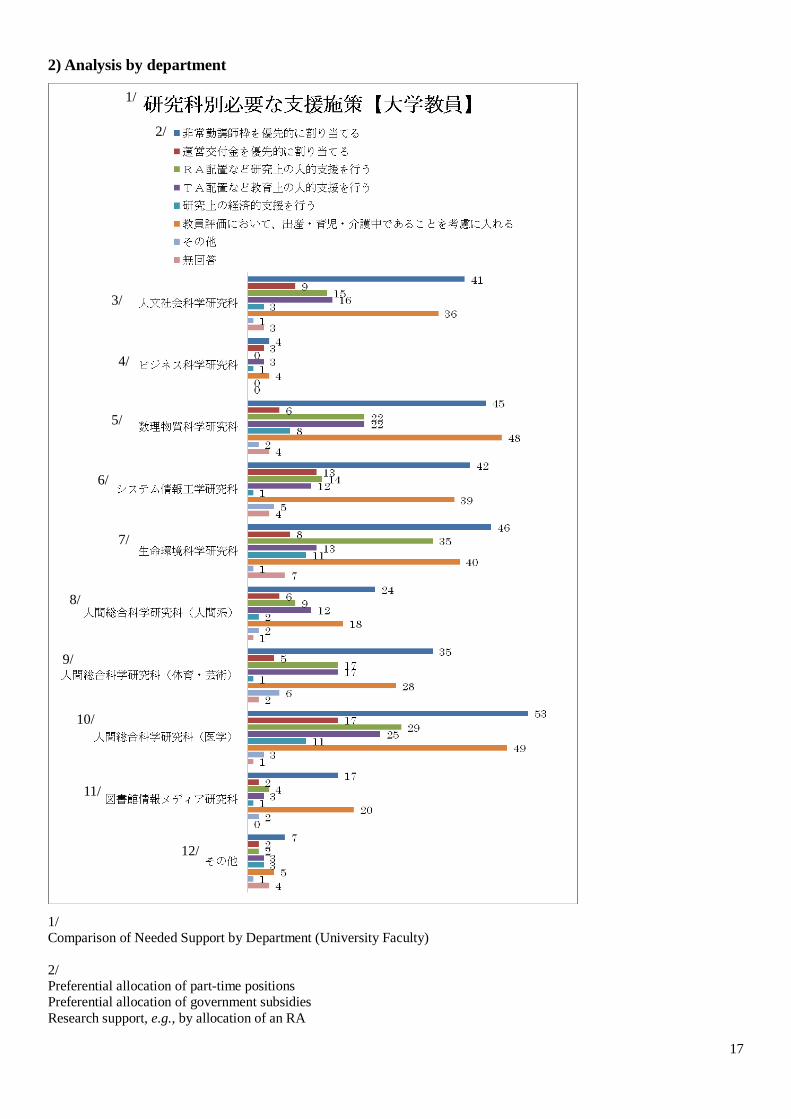
2) Analysis by department
1/ Comparison of Needed Support by Department (University Faculty) 2/ Preferential allocation of part-time positions Preferential allocation of government subsidies Research support, e.g., by allocation of an RA
1/
2/
3/
4/
5/
6/
7/
8/
9/
10/
11/
12/

18
Academic support, e.g., by allocation of a TA Financial support for research Faculty evaluation with consideration for childbirth, childcare and family care Others Not specified 3/ Humanities and Social Sciences 4/ Business Sciences 5/ Pure and Applied Sciences 6/ Systems and Information Engineering 7/ Life and Environmental Sciences 8/ Comprehensive Human Sciences (Human Sciences) 9/ Comprehensive Human Sciences (Physical Education, Health and Sport Sciences / Art and Design) 10/ Comprehensive Human Sciences (Medicine) 11/ Library, Information and Media Studies 12/ Others
By department, “research support, e.g., by allocation of an RA” was considered most required by the respondents in Life and Environmental Sciences. This result indicates that it is necessary to investigate the need for RA allocation for the faculty members who are likely to spend a lot of time in laboratories.

19
6. Other action plans that are considered to be required for the support for childbirth, childcare and family care
The following services were suggested by 270 respondents for possible support actions for childbirth,
childcare and family care. Which services do you think should be in place at the University in support of
childbirth, childcare and family care? Total Male Female N/S*
1 Expansion of daycare facilities and services 45 27 17 1 2 Flexible working conditions such as reduced duties and work hours 44 28 16 0 3 Improved climate and understanding for leave system 31 16 14 1 4 Hiring replacement workers 25 15 10 0 5 Improved maternity and childcare leave systems 24 19 5 0 6 Enhanced financial support 21 12 9 0 7 Improved nursing leave system 8 6 2 0 8 Support system to encourage childcare and family care for male employees 8 4 4 0 9 Opening of consultation services 7 5 2 0 10 Enhanced services on campuses other than Tsukuba 5 4 1 0 11 Raise awareness for the system 5 5 0 0 12 Friendly work environment for pregnant women and women with children 4 4 0 0 13 Establishment of nursing facilities and services 4 2 2 0 14 Consideration for transfer/relocation 4 4 0 0 15 Improved support system for undergraduate and graduate students 4 2 2 0 16 Extended support for part-time employees 4 4 0 0 17 Support for return to work after maternity leave 3 2 1 0 18 Informational support services for family care 3 0 3 0 19 Others 21 8 13 0
All 270 167 101 2 *Gender not specified.
We have received a variety of concrete opinions that will be helpful for us when planning the next activities at our office.
The University of Tsukuba has signed contracts with daycare facilities to expand the childcare services
for its employees. Under the Act on Advancement of Measures to Support Raising Next-Generation Children the University has also announced its Phase III Action Program in April 2010 to promote improvements in the work environment. We will need to conduct another survey to follow the changes in opinions after these improvements are in effect.
It should also be noted that we have received many responses from laboratory school teachers.
Understanding their conditions, e.g., through interviews, seems worth an immediate investment of effort, as their work environment is very different from those in the university setting.
The corporate contracts agreed with daycare facilities in 2009 cover childcare services not only for
Tsukuba Campus but also for Tokyo and other areas. It is necessary to disseminate this information more widely and verify new plans whether they are targeting only Tsukuba Campus or not.
20
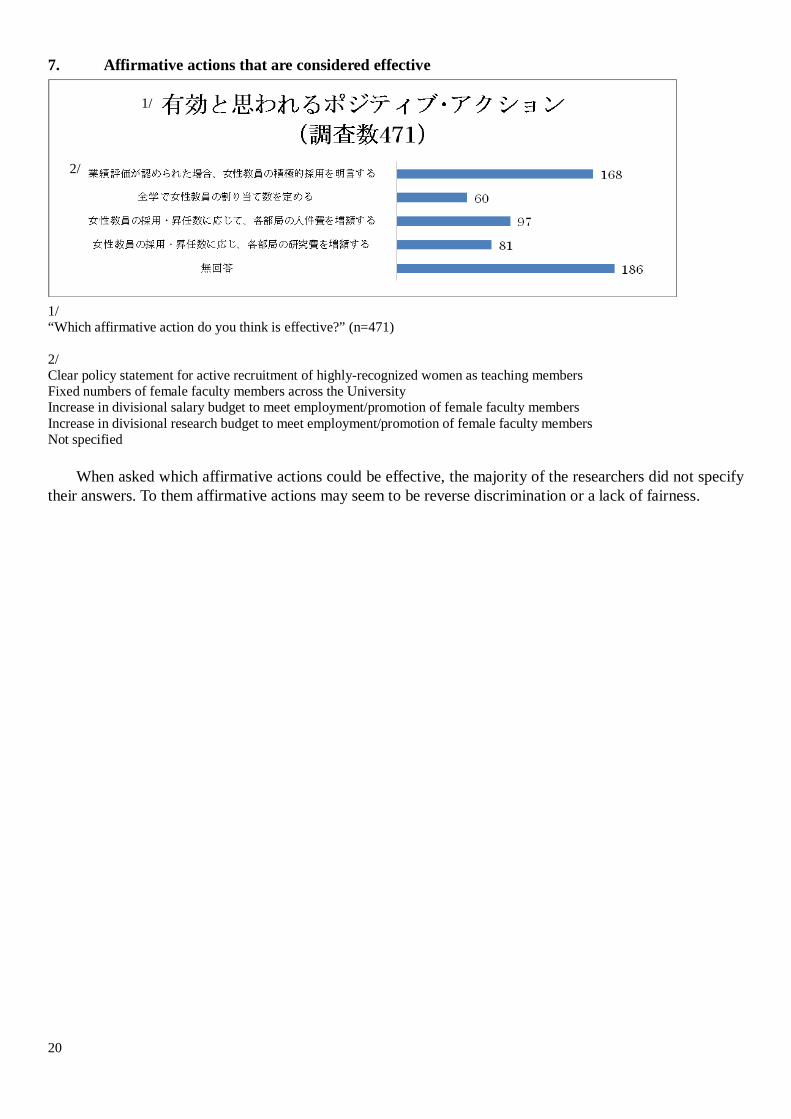
7. Affirmative actions that are considered effective
1/ “Which affirmative action do you think is effective?” (n=471) 2/ Clear policy statement for active recruitment of highly-recognized women as teaching members Fixed numbers of female faculty members across the University Increase in divisional salary budget to meet employment/promotion of female faculty members Increase in divisional research budget to meet employment/promotion of female faculty members Not specified
When asked which affirmative actions could be effective, the majority of the researchers did not specify their answers. To them affirmative actions may seem to be reverse discrimination or a lack of fairness.
1/
2/

21
1/ Comparison of Perceived Effective Affirmative Actions by Gender 2/ Clear policy statement for active recruitment of highly-recognized women as teaching members Fixed numbers of female faculty members across the University Increase in divisional salary budget to meet employment/promotion of female faculty members Increase in divisional research budget to meet employment/promotion of female faculty members Not specified 3/ Male 4/ Female
When compared by gender, on the other hand, the number of respondents who did not specify the answer was relatively smaller in women than in men. This result indicates that female researchers are more strongly aware of the need for affirmative actions.
The affirmative action that was most popular was “clear policy statement to actively recruit women for
publicly advertized teaching positions when their performance is equal to that of male candidates.” This answer was popular regardless of age group, gender, workplace location and position.
The President of the University of Tsukuba announced this policy in the past. The survey result suggests
that it is important to raise awareness of this policy regardless of gender for better understanding of the purpose of this affirmative action.
1/
2/
3/
4/

22
8. Career support and consciousness change that are considered effective
1/ “Which career support or consciousness change do you think is effective?” (n=2,004) 2/ Counseling services for female employees Mentoring system for female employees Harassment consulting services for female employees Seminars to present female role models Development of a female employee network Support to foster female leaders Employee seminars on gender equality Symposium on gender equality Not specified
Overall, 1) counseling services for female employees, 2) employee seminars on gender equality and 3) support to foster female leaders were selected most in this order.
The University has opened the Au Work-life Balance Counseling Center, and on-campus seminars for
management-level employees are also scheduled. It is necessary to continue to advertise these opportunities throughout the campuses in the future.
1/
2/

23
1/ Comparison of Perceived Effective Career Support by Gender 2/ Counseling services for female employees Mentoring system for female employees Harassment consulting services for female employees Seminars to present female role models Development of a female employee network Support to foster female leaders Employee seminars on gender equality Symposium on gender equality Not specified 3/ Male 4/ Female
When compared by gender, both male and female respondents were more likely to select both “counseling services for female employees” and “support to foster female leaders.” However, male respondents tended to select “employee seminars on gender equality,” while female respondents were more in favor of “development of a female employee network.”
“Role model presentation” and “symposium” were least selected by both women and men. It may be
because that these ideas were abstract to the respondents. These results should be carefully taken into account in our future activities.
1/
2/
3/
4/

24
9. Approach to gender equality at the University of Tsukuba 1) Website and questionnaire Visibility of the website for gender equality
Of 2,004 respondents, 75% were unfamiliar with the Office of Gender Equality’s website. Men, respondents in their fifties and sixties, and administrative officials were somewhat more likely to be familiar with the site, although no group’s awareness exceeded 30%.
1/ “Do you know the website of the Office of Gender Equality?” 2/ Yes 3/ No 4/ Not specified
The website of the Office of Gender Equality was renewed in February 2010, now providing abundant contents such as life information as well as new communication tools such as a bulletin board. The website is also viewable on mobile phones.
The result of this section of the survey clearly indicates the need to raise the visibility of the website and
encourage generations full with life events (childcare, for example) to use the website.
1/
2/
3/
4/

25
Visibility of the questionnaire survey report on gender equality
Of 2,004 respondents, about 75% answered that they did not know about the questionnaire survey report on gender equality.
There were more men than women, employees in their 50’s than other age groups, and administrative officials than other types of employee who answered they knew, but their percentages were all less than 40%.
This tendency was
very similar to the previous answer about the website. The results of this survey will also be posted on the website. However, it is essential to inform all employees about the report to facilitate information sharing.
1/ “Do you know the questionnaire survey results on gender equality we have reported previously?” (n=2,004) 2/ Yes 3/ No 4/ Not specified
1/
2/
3/
4/

26
2) Introducing new courses Need for a new academic course on gender equality
1/ “Do you think the University should start a new course on gender equality?” (n=2,004) 2/ Yes 3/ No 4/ Don’t know 5/ Not specified
1/
2/
3/
4/
5/

27
1/ Comparison of the Need for a Gender Equality Course by Position 2/ University faculty Researchers Laboratory school teachers Administrative staff Technical officials Medical and nursing staff Technicians and custodians Other faculty members (part-time) Other administrative staff (part-time) 3/ Yes No Don’t know Not specified
About one third of the respondents answered that they didn’t know about the need for a gender equality course. The rate was especially high among technicians and custodians; more than 60% of them selected “don’t know.”
The percentage of respondents who answered “don’t know” was similar when compared by gender, age
group or workplace location. It seems important to reinforce the significance of gender equality before career choice.
1/
2/
3/

28
3) Temporary daycare services Interest in temporary daycare services
About one third of the respondents expressed interest in using a temporary daycare services.
In particular, the percentage was high
among respondents in their 30’s, who are likely to have preschool or early school-age children, as well as among the laboratory school teachers. 1/ “Are you interested in using temporary daycare
facilities or similar services?” (n=446) 2/ Yes 3/ No 4/ Don’t know 5/ Not specified
1/ Comparison of Interest in Temporary Daycare Services by Age Group 2/ 20’s 30’s 40’s 50’s 60’s 3/ Yes No Don’t know Not Specified
1/
5/
1/
2/ 3/
2/
3/ 4/

29
1/ Comparison of Interest in Temporary Daycare Services by Position 2/ University faculty Researchers Laboratory school teachers Administrative staff Technical officials Medical and nursing staff Technicians and custodians Other faculty members (part-time) Other administrative staff (part-time) 3/ Yes No Don’t know Not Specified
1/
2/ 3/

30
Among the reasons why the respondents were not interested in using temporary daycare services, “no need” was selected mostly by men. It seems likely that they have another family member at home who is responsible for childcare.
Among women, in
contrast, the most selected answer was “expensive.” It is necessary to improve the
support system for employees who really need this type of service. To facilitate the use of temporary daycare services, we are starting a childcare coupon program in the academic year 2010 as a part of financial support efforts. Future efforts should include on-campus temporary daycare services. 1/ Comparison of Reasons for No Interest in Temporary Daycare Services by Gender 2/ No need Expensive Service is not user-friendly (e.g., application is cumbersome) Never experienced Others Not specified 3/ Male 4/ Female
1/ 2/
3/
4/

31
4) Counseling Center Necessity of Counseling Services by Counselors and Psychological Counselors
Sixty-one percent of the respondents thought that the counseling services were necessary. The percentage was similar when compared by gender or by age group.
1/ “Do you think counseling services by counselors and psychological counselors are necessary?” (n=2,004) 2/ Yes 3/ No 4/ Don’t know 5/ Not specified
1/
2/ 3/
4/
5/

32
By position, the percentage of respondents who thought the counseling services were necessary was highest for part-time faculty members; approximately 80% answered “necessary.” On the other hand, the technicians and custodians had the lowest percentage of
“necessary” and the highest percentage of “unnecessary” answers. 1/ Comparison of the Necessity for Counseling Center by Position 2/ University faculty Researchers Laboratory school teachers Administrative staff Technical officials Medical and nursing staff Technicians and custodians Other faculty members (part-time) Other administrative staff (part-time) 3/ Necessary Unnecessary Don’t know Not Specified
1/
2/ 3/

33
1/ “Why do you think a counseling center is not necessary?” (n=165) 2/ Other on-campus counseling systems (e.g., harassment counseling) are available Off-campus services are available Don’t know how many people are using the services Others Not specified
Overall, 8% of respondents indicated a belief that the counseling center is not necessary, and a majority of this group cited a lack of knowledge of how many individuals are served by the center as the underlying reason for that belief. Gender, age group, and position had no appreciable impact on this attitude.
Twenty-five percent of respondents who answered “don’t know” indicated the same reason.
These results point to the importance of raising awareness about center activities and, to the extent that
is compatible with the facility’s confidentiality obligations, disclosing the number of individuals taking advantage of counseling services.
1/
2/

34
5) Website Necessity of the Office of Gender Equality website
With regard to the website of the Office of Gender Equality, the majority of the 2,004 respondents answered that it was necessary, while one third of them answered “don’t know.”
1/ “Do you think the website is necessary?” (n=2,004) 2/ Yes 3/ No 4/ Don’t know 5/ Not specified
1/
2/
3/
4/
5/

35
The percentage of respondents who considered the website necessary was considerably higher among part-time faculty members, while the percentage of respondents who considered the website unnecessary was higher among technicians and custodians and laboratory school teachers. These results were similar to those
on the counseling center. 1/ Comparison of the Necessity for the Website by Position 2/ University faculty Researchers Laboratory school teachers Administrative staff Technical officials Medical and nursing staff Technicians and custodians Other faculty members (part-time) Other administrative staff (part-time) 3/ Necessary Unnecessary Don’t know Not specified
1/
2/ 3/
36
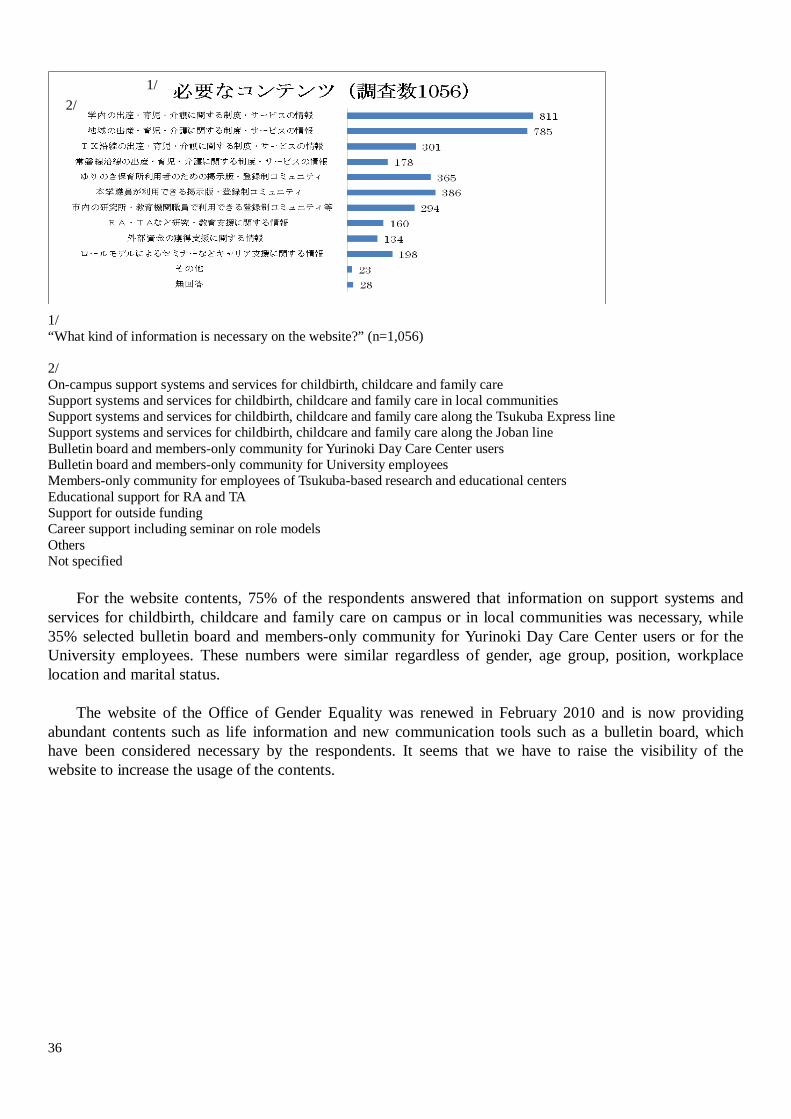
1/ “What kind of information is necessary on the website?” (n=1,056) 2/ On-campus support systems and services for childbirth, childcare and family care Support systems and services for childbirth, childcare and family care in local communities Support systems and services for childbirth, childcare and family care along the Tsukuba Express line Support systems and services for childbirth, childcare and family care along the Joban line Bulletin board and members-only community for Yurinoki Day Care Center users Bulletin board and members-only community for University employees Members-only community for employees of Tsukuba-based research and educational centers Educational support for RA and TA Support for outside funding Career support including seminar on role models Others Not specified
For the website contents, 75% of the respondents answered that information on support systems and services for childbirth, childcare and family care on campus or in local communities was necessary, while 35% selected bulletin board and members-only community for Yurinoki Day Care Center users or for the University employees. These numbers were similar regardless of gender, age group, position, workplace location and marital status.
The website of the Office of Gender Equality was renewed in February 2010 and is now providing
abundant contents such as life information and new communication tools such as a bulletin board, which have been considered necessary by the respondents. It seems that we have to raise the visibility of the website to increase the usage of the contents.
1/ 2/

37
10. Gender equality at the University
We received opinions on gender equality at the University from 208 respondents. Opinions Total Male Female N/S*
Perceived workplace situation 6 0 6 0 1 There is gender discrimination. 4 0 4 0 2 Homebound responsibilities have a negative influence on
recruitment/promotion of female workers. 2 0 2 0
Required system or approaches 117 48 69 0 3 Improved system and climate for easier use of maternal and childcare leave /
Better workplace understanding for maternal and childcare leave 13 5 8 0
4 Consciousness change and education for the entire workplace 13 4 9 0 5 Consciousness change in men 13 6 7 0 6 Wider publicity of the system and approaches 12 4 8 0 7 Environmental arrangement to support balance between work and family and
allow diversified ways of working 11 4 7 0
8 Enhanced daycare facilities and services 9 4 5 0 9 Proper and fair performance evaluation 9 4 5 0 10 Proactive recruitment/promotion of women 7 2 5 0 11 Active organizational approach to and promotion of equality 6 4 2 0 12 More stringent measures against harassment 6 1 5 0 13 Systems should be also accessible by undergraduate and graduate students. 5 4 1 0 14 More emphasis on support for family care 4 0 4 0 15 Consciousness change in women 3 3 0 0 16 Expanded maternal and childcare leave 3 2 1 0 17 Increased financial support for childcare 3 1 2 0 Gender equality in general 48 27 20 1 18 Unsatisfied about the direction of gender equality movement 23 13 10 0 19 Gender equality is advanced/no longer needed. Does not feel discrimination. 6 4 1 1 20 Varies by region 6 4 2 0 21 Environmental arrangement is necessary to encourage men to participate in
household duties and childcare. 4 0 4 0
22 Concerned that extreme actions may lead to reverse discrimination. 4 4 0 0 23 Social change is needed. 3 1 2 0 24 Inherent gender difference and gender roles are acceptable. 2 1 1 0 Others 37 25 12 0 25 Comments on the questionnaire 10 9 1 0 26 Need for improvements in working conditions 5 3 2 0 27 More administrative efficiency is needed. 3 2 1 0 28 Others 19 11 8 0
All 208 100 107 1 *Gender not specified.
There were many comments on the system and approaches needed. There is a continued need to create a better environment to support childbirth, childcare and family care. At the same time, we have to work on consciousness changes in the workplace. The areas in which women want to see particular improvements are the salary system and awareness changes in management-level male employees/faculty members. The University should make further efforts to improve the working environment, for example, through on-campus seminars targeted at management-level employees.
We also received comments of dissatisfaction with the gender equality activities and with our office.
Some of these opinions seem to arise from doubts about affirmative action, but there are also many opinions that the activity of the Office of Gender Equality is not sufficient. We must publish additional information of our activities on our website and more effective implementation of policy by reflecting various opinions within the University.