questioning ‘the ultimate question’
TRANSCRIPT

I
Erasmus School of Economics
Thesis
To obtain the academic degree of
Master of Science in Economics & Business
(Major in Marketing)
Questioning ‘the Ultimate Question’
An Exploratory Study on the Predictive Power of Customer Metrics
applied to Consumer Behavior in the Dutch Soft-Drinks market
Author: Yarco Hoddenbach
E-mail address: [email protected]
Supervisor: N.M. Camacho
Study Program: Business Economics
Specialization: Marketing
Date: July 16, 2013

MASTER THESIS - Questioning ‘the Ultimate Question’ 2013
I
Abstract
This research studied the predictive ability of customer satisfaction and Net Promoter Score
(NPS) on loyalty of Dutch soft-drinks consumers. Additionally, the relationship marketing variables
trust, commitment, and attitudinal loyalty (Palmatier et al. 2006) have been added to see if the
predictive power of the metrics could be improved.
In this thesis a distinction is made between attitudinal loyalty, behavioral loyalty intentions
and actual behavioral loyalty. Behavioral intentions are measured by statements on the repurchasing
likelihood and spending intention of the favorite soft-drink brand in the subsequent week, while
attitudinal loyalty is measured by five statements on “the consumer’s identification with a particular
goods provider and preference of a product over alternatives” as Jones and Taylor (2007) define the
construct. Actual behavioral loyalty is measured in a second survey where the respondents are asked to
indicate how much they spend and bought of soft-drinks in the week after they filled in the first
survey.
Correlations showed that the NPS has a strong significant relationship with behavioral loyalty.
The same counts for customer satisfaction and the additional relationship marketing variables, which
showed significant relations with behavioral loyalty intentions. For actual behavioral loyalty (spending
behavior) the relational factors affective commitment and attitudinal loyalty showed an insignificant
relationship.
When looking at the behavioral loyalty intentions (repurchasing and spending intention), it
appeared that the NPS increased the explained variance when added to a model of standard
demographic variables (gender, age, education and household size). Customer satisfaction and the
relationship marketing variables even further increased the explained variance of the regression
models.
Based on actual spending behavior, the most interest finding is that customer satisfaction and
relationship dimensions do not contribute to a higher predictive power of the NPS, while predictions
on behavioral loyalty intentions were improved by adding satisfaction and relational variables.

MASTER THESIS - Questioning ‘the Ultimate Question’ 2013
II
We looked in our data to see if the NPS model on actual spending could be improved, and
found that measures of behavioral intentions were far better predictors of actual spending behavior
than the NPS, satisfaction and relationship variables.
Overall, NPS can be a good predictor of loyalty indicators. However, Reichheld’s (2003)
claim that the NPS is the ultimate question seems inappropriate. We show that, in the case of soft-
drinks, for predicting behavioral intentions the NPS is not the best metric. For actual behavior, NPS
outperforms customer satisfaction and relationship variables, but is outperformed by measures of
repurchase intention.

MASTER THESIS - Questioning ‘the Ultimate Question’ 2013
III
Acknowledgements
I would like to dedicate this page to all people who have helped me (directly and indirectly) in writing
this thesis. First of all, a big thank you goes out to all participants in the survey, and a special thank
you to the 110 who took the time to participate in the follow-up survey as well. Without you I could
have never done this research and therefore you have made the biggest contribution to this thesis, for
which I am very grateful. An honorable mention goes out to my supervisor, Nuno Camacho, who has
spent a lot of time in guiding me. Thank you for your very useful ideas, inspiration and insights. In
addition I would like to thank my girlfriend, all of my family and friends for supporting me, and
helping where they could. You have all been wonderful during these stressful months and I appreciate
the support, patience and kindness in this period. Another thank you goes out to all other teachers at
the Erasmus University and the The Hague University for giving me the knowledge to produce this
thesis. Now that I finally reached the end stage of my educational path, I can say that the last mile is
the longest, but during this final Master year, I have also learned the most. This is not only from the
courses that I took, but also in professional life, combining studying and working at a respectable
company. I am glad and proud to present you this thesis, and before you start reading, I would like to
provide you with one of the most important lessons I have learned, by quoting one of the greatest
geniuses of all times:

MASTER THESIS - Questioning ‘the Ultimate Question’ 2013
IV
Table of Contents Abstract .................................................................................................................................................... I
Acknowledgements ............................................................................................................................... III
List of Tables ......................................................................................................................................... VI
List of Figures ....................................................................................................................................... VI
1 Introduction .......................................................................................................................................... 1
1.1 A Profile of the Soft-drinks Industry ............................................................................................. 1
1.1.1 Definition of Soft-drinks ........................................................................................................ 1
1.1.2 History of Soft-drinks ............................................................................................................. 2
1.1.3 Soft-drink Consumption Nowadays ....................................................................................... 3
1.2 Problem Statement and Research Objective .................................................................................. 7
1.2.1 The Predictive Power of Customer Metrics ........................................................................... 7
1.2.2 Questioning ‘the Ultimate Question’ ...................................................................................... 7
1.2.3 The Influence of Relationship Marketing Dimensions on Predictions ................................... 7
1.2.4 Sub-questions ......................................................................................................................... 8
1.3 Scientific and Managerial Relevance ............................................................................................ 8
1.3.1 Scientific Relevance ............................................................................................................... 8
1.3.2 Managerial Relevance ............................................................................................................ 9
1.4 Structure of the Thesis ................................................................................................................... 9
2 Literature Review ............................................................................................................................... 10
2.1 Customer Loyalty ........................................................................................................................ 10
2.1.1 Customer Loyalty and Firm Performance ............................................................................ 10
2.1.2 Definitions of Customer Loyalty .......................................................................................... 10
2.1.3 Attitudinal Loyalty vs. Behavioral Loyalty .......................................................................... 11
2.1.4 Attitudinal Loyalty as Antecedent of Behavioral Loyalty .................................................... 12
2.2 The Net Promoter Score .............................................................................................................. 13
2.2.1 The Development of the Net Promoter Score ...................................................................... 14
2.2.2 Net Promoter Criticism......................................................................................................... 15
2.3 Customer Satisfaction .................................................................................................................. 18
2.3.1 Definitions of Customer Satisfaction ................................................................................... 18
2.3.2 The American Customer Satisfaction Index (ACSI) and firm growth ................................. 18
2.3.3 Linkage between Customer Satisfaction and Loyalty .......................................................... 19
2.4 Linkage between Relational Factors and Loyalty ....................................................................... 20
2.4.1 Trust...................................................................................................................................... 20
2.4.2 Commitment ......................................................................................................................... 21
2.5 Customer Loyalty among Soft-drink Consumers ........................................................................ 22
2.6 Conceptual Framework ............................................................................................................... 24
2.8 Conclusion ................................................................................................................................... 24
3 Research Methodology ....................................................................................................................... 26

MASTER THESIS - Questioning ‘the Ultimate Question’ 2013
V
3.1 Research Design .......................................................................................................................... 26
3.2 Data Collection ............................................................................................................................ 26
3.3 Cleaning the Data ........................................................................................................................ 27
3.4 Representativeness and Sample Profile ....................................................................................... 28
3.5 Analyses Techniques ................................................................................................................... 29
4 Data Analysis and Results .................................................................................................................. 30
4.1 Reliability and Validity ............................................................................................................... 30
4.1.1 Reliability: Cronbach’s Alpha .............................................................................................. 30
4.1.2 Validity ................................................................................................................................. 31
4.2 Descriptives ................................................................................................................................. 33
4.2.1 Sample descriptives .............................................................................................................. 33
4.2.2 Soft-drink Purchasing Behavior ........................................................................................... 34
4.3 Correlation ................................................................................................................................... 35
4.3.1 Correlation between Satisfaction, Other Relational Variables and NPS .............................. 35
4.3.2 Correlation between the Predictor Variables and Behavioral Loyalty ................................. 36
4.4 Regression ................................................................................................................................... 37
4.4.1 Predicting Repurchasing Intention ....................................................................................... 38
4.4.2 Predicting Spending Intentions ............................................................................................. 42
4.4.3 Predicting Actual (Future) Spending .................................................................................... 44
4.5 Conclusion ................................................................................................................................... 48
5 Conclusion .......................................................................................................................................... 50
5.1 General Discussion ...................................................................................................................... 51
5.1.1 What Customer Metric Best Predicts Behavioral Loyalty? .................................................. 51
5.1.2 Questioning ‘the Ultimate Question’ .................................................................................... 52
5.1.3 The Influence of Relationship Marketing Dimensions ......................................................... 52
5.2 Academic Contribution ............................................................................................................... 53
5.3 Managerial Implications .............................................................................................................. 53
5.4 Limitations and Directions for Future Research.......................................................................... 53
Appendix ............................................................................................................................................... 55
A. Reference List ................................................................................................................................... 56
B. Questionnaire .................................................................................................................................... 61
C. Follow-up Questionnaire .................................................................................................................. 69
E. Factor Analysis Output ..................................................................................................................... 72
F. Descriptives ....................................................................................................................................... 73
MASTER THESIS - Questioning ‘the Ultimate Question’ 2013
VI
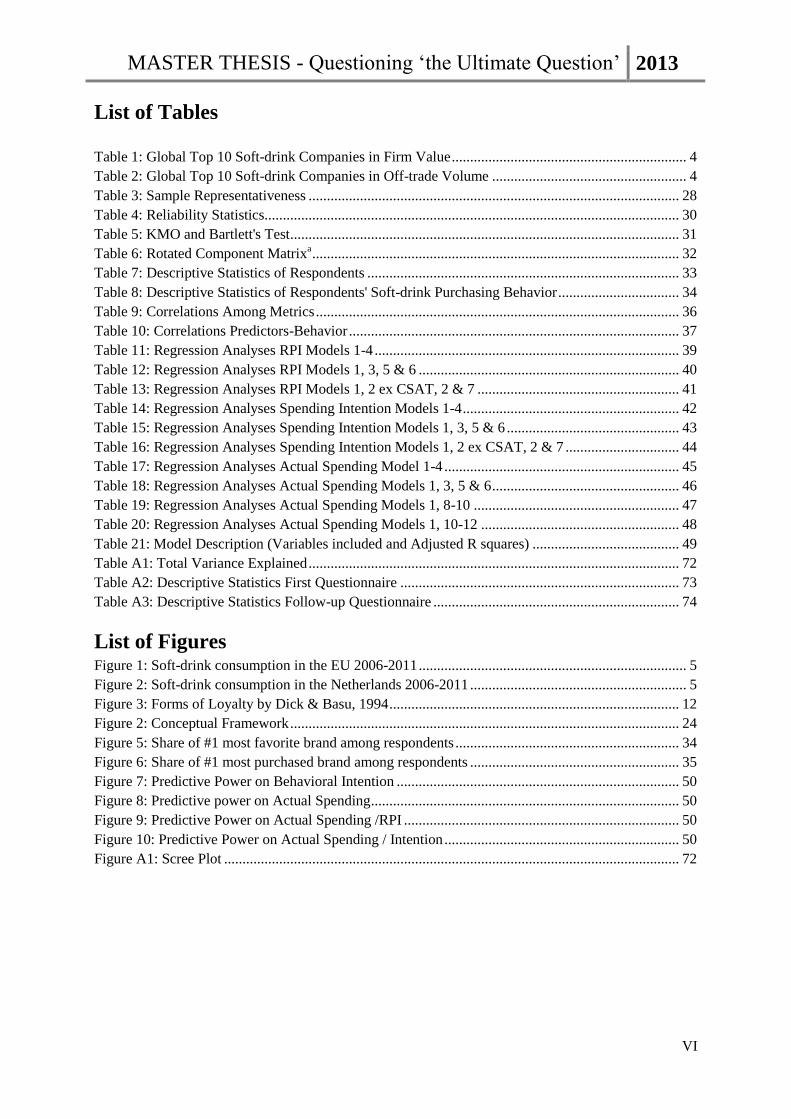
List of Tables
Table 1: Global Top 10 Soft-drink Companies in Firm Value ................................................................ 4
Table 2: Global Top 10 Soft-drink Companies in Off-trade Volume ..................................................... 4
Table 3: Sample Representativeness ..................................................................................................... 28
Table 4: Reliability Statistics................................................................................................................. 30
Table 5: KMO and Bartlett's Test .......................................................................................................... 31
Table 6: Rotated Component Matrixa .................................................................................................... 32
Table 7: Descriptive Statistics of Respondents ..................................................................................... 33
Table 8: Descriptive Statistics of Respondents' Soft-drink Purchasing Behavior ................................. 34
Table 9: Correlations Among Metrics ................................................................................................... 36
Table 10: Correlations Predictors-Behavior .......................................................................................... 37
Table 11: Regression Analyses RPI Models 1-4 ................................................................................... 39
Table 12: Regression Analyses RPI Models 1, 3, 5 & 6 ....................................................................... 40
Table 13: Regression Analyses RPI Models 1, 2 ex CSAT, 2 & 7 ....................................................... 41
Table 14: Regression Analyses Spending Intention Models 1-4 ........................................................... 42
Table 15: Regression Analyses Spending Intention Models 1, 3, 5 & 6 ............................................... 43
Table 16: Regression Analyses Spending Intention Models 1, 2 ex CSAT, 2 & 7 ............................... 44
Table 17: Regression Analyses Actual Spending Model 1-4 ................................................................ 45
Table 18: Regression Analyses Actual Spending Models 1, 3, 5 & 6 ................................................... 46
Table 19: Regression Analyses Actual Spending Models 1, 8-10 ........................................................ 47
Table 20: Regression Analyses Actual Spending Models 1, 10-12 ...................................................... 48
Table 21: Model Description (Variables included and Adjusted R squares) ........................................ 49
Table A1: Total Variance Explained ..................................................................................................... 72
Table A2: Descriptive Statistics First Questionnaire ............................................................................ 73
Table A3: Descriptive Statistics Follow-up Questionnaire ................................................................... 74
List of Figures Figure 1: Soft-drink consumption in the EU 2006-2011 ......................................................................... 5
Figure 2: Soft-drink consumption in the Netherlands 2006-2011 ........................................................... 5
Figure 3: Forms of Loyalty by Dick & Basu, 1994 ............................................................................... 12
Figure 2: Conceptual Framework .......................................................................................................... 24
Figure 5: Share of #1 most favorite brand among respondents ............................................................. 34
Figure 6: Share of #1 most purchased brand among respondents ......................................................... 35
Figure 7: Predictive Power on Behavioral Intention ............................................................................. 50
Figure 8: Predictive power on Actual Spending .................................................................................... 50
Figure 9: Predictive Power on Actual Spending /RPI ........................................................................... 50
Figure 10: Predictive Power on Actual Spending / Intention ................................................................ 50
Figure A1: Scree Plot ............................................................................................................................ 72

MASTER THESIS - Questioning ‘the Ultimate Question’ 2013
1
1 Introduction
In the introduction of this thesis, the research questions and structure of the thesis are
described. In paragraph 1.2 the problems that will be researched will be stated along with the research
objective. The scientific and managerial relevance of this research are discussed in paragraph 1.3. In
the final paragraph, 1.4, the structure of the thesis will be described. The introduction kicks off with a
background description of the soft-drinks industry.
1.1 A Profile of the Soft-drinks Industry
1.1.1 Definition of Soft-drinks
“‘Soft drink’, refers to any of a class of nonalcoholic beverages, usually but not necessarily
carbonated, containing a natural or artificial sweetening agent, edible acids, natural or artificial
flavors, and sometimes juice” (Bert, 2011). The term soft-drinks has been used to distinguish these
drinks from ‘hard-drinks’, alcoholic beverages such as hard liquor and spirits (though soft-drinks
allow an alcoholic percentage of less than 0.5%). Other generic terms for soft-drinks are soda, pop,
coke, soda pop, fizzy drink, tonic, seltzer, mineral, sparkling water, or carbonated beverage.1 Soft-
drinks may also contain fruit juice, but if the drink contains over 25% fruit, it is considered a juice.
There are several categories within soft-drinks, which distinguishes the different flavors of soft-drinks
available. The Union of European Soft Drinks Associations (UNESDA) defines soft-drinks as
follows:2 “A drink is referred to as ‘soft’ to distinguish it from a so-called ‘hard’ drink or hard liquor
and a soft drink refers to a non-alcoholic drink. Historically, a ‘hard’ drink was one which had been
distilled such as whisky or gin, unlike say, a wine, beer or cider. The criteria for what precisely
constitutes a soft drink vary from country to country. Normally, soft drinks are drunk chilled or at
room temperature. Iced teas, coffees and drinks made with fruit squashes or cordials are classified as
soft drinks. The term excludes fruit juices and drinks made with milk or dairy products, such as milk
shakes, or warm drinks such as hot chocolates, coffees, teas.“
1http://en.wikipedia.org/wiki/Soft_drink
2http://www.unesda.org/facts-figures
MASTER THESIS - Questioning ‘the Ultimate Question’ 2013
2
The categories included in the definition of soft-drinks: carbonates, still drinks (<25% juice),
iced tea, iced coffee, sports drinks and energy drinks. In this thesis soft-drinks are defined as
carbonated, non-alcoholic beverages such as cola, lemon-lime, orange, lemonade, tonic, but also
sports- and energy drinks.
1.1.2 History of Soft-drinks
Soft-drinks have been around since the 17th century. Then, soft-drinks (non-carbonated) were
made from water and lemon juice sweetened with honey. In 1676, the Compagnie de Limonadiers of
Paris were granted a monopoly for the sale of lemonade soft drinks. During the 18th century, carbon
dioxide was infused with water to create carbonated water, (also known as soda water), the major and
defining component of most soft drinks. Pharmacists added herbs and chemicals to unflavored mineral
water, and drinking either natural or artificial mineral water was considered a healthy practice. Flavors
were added to bring taste to the artificial mineral waters.
During the 1880s, hundreds of new drinks came to the market claiming to have medicinal
effects. In this decade, John Pemberton, was inventing a nonalcoholic beverage (similar to French
Wine Coca) as a response to the Prohibition act. Pemberton claimed Coca-Cola cured many diseases,
including morphine addiction, dyspepsia, neurasthenia, headache, and impotence. In 1887, another
pharmacist and businessman, Asa Candler bought the formula for Coca-Cola from the inventor John
Pemberton for $2,300. By the late 1890s, Coca-Cola was one of America's most popular fountain
drinks, largely due to Candler's aggressive marketing of the product.
In 1898, Pepsi was invented. By the year Pepsi was being sold, Coca Cola already sold about a
million gallons (approximately 3.8 million liters). What followed is also known as ‘the Cola Wars’.
Pepsi has been declared bankrupt twice, once during the First World War, and again a decade later
during the Depression. The Cola wars reached a peak in the 1980s when in 1979 Pepsi for the first
time ever had beaten Coca-Cola sales in the supermarkets. This did not last long, however, and in the
1990s it seemed that Pepsi has lost the war, since they increased their focus on health and snacks.
Nowadays, Pepsi has to deal with a third place, as the two favorite soft-drink brands are Coca-Cola
and Diet Coke (Coca-Cola Light).

MASTER THESIS - Questioning ‘the Ultimate Question’ 2013
3
Coca-Cola was first introduced in the Netherlands during the Olympics of 1928 in Amsterdam
as the first main sponsor of this major event. Fanta has been introduced in 1960. Sprite followed in
1966. The first diet version of Coca-Cola, known as Coca-Cola Light in Europe and Diet Coke in the
U.S., followed in 1984 (Hemelrijk, L., 1996).
1.1.3 Soft-drink Consumption Nowadays
Global soft-drinks consumption is slightly increasing due to introduction and growth of soft-
drink brands in emerging markets, such as Brazil, India, and China. Coca-Cola for example sells its
soft-drinks in every country on the planet, except for Cuba, and North Korea, as the company opened a
factory in Myanmar in June, 2013.3
Soft-drinks consumption in mature (most Western) markets is decreasing, and margins are
getting smaller. However, the soft-drinks industry is highly innovative with some 40% of the products
on sale today having been introduced in the past five years.4 Energy and sports drinks contribute
greatly to this fact. As soft-drink consumption in general is decreasing in Western markets, energy
drinks are still growing strong. In fact, it is the fastest growing soft-drinks category, according to the
latest Euromonitor report.5
In 2012, the world consumed 220 billion liters of soft-drinks. Cola is the most preferred drink
with 57% of that volume. Americans still are the largest soft-drinks consumers with 165 liters per
capita, followed by Mexico with 146 liters per capita (who are the world’s leading cola consumers
(108 liter per capita).6
According to the latest Euromonitor report it is the third consecutive year of global value
growth for the soft-drinks market.7 The global growth is driven in large part by consumers in emerging
nations. As the spending power of consumers continues to grow in these markets, many can now
afford to move from unpackaged beverages such as water, lemonade or fresh juices to packaged
3http://www.coca-colacompany.com/press-center/press-releases/coca-cola-starts-local-production-in-myanmar
4http://www.unesda.org/facts-figures
5http://ladyofthecakes.wordpress.com/2013/03/19/who-consumes-the-most-energy-drinks-and-are-they-
dangerous/ 6http://ladyofthecakes.wordpress.com/2013/04/09/which-countries-consume-the-most-soft-drinks/
7http://blog.euromonitor.com/2013/01/soft-drinks-in-2013-growth-to-continue-as-demand-diversifies.html

MASTER THESIS - Questioning ‘the Ultimate Question’ 2013
4
drinks. In the past, Coca-Cola or Pepsi were chosen as part of joining a global culture. Nowadays,
consumers are starting to make their choices based more on regional taste instead of global identity.
As an example, Chinese consumers are now able to choose from, not only Coca-Cola and Pepsi, but
Hangzhou Wahaha’s Future Cola; or Master Kong’s Iced Tea; or Jiaduobao, which sold almost 1.4
billion liters in 2012 compared to 2.5 billion for Coca-Cola.8
According to Euromonitor, the world soft-drink industry in terms of value and volume is
dominated by the following players:
Table 1: Global Top 10 Soft-drink
Companies in Firm Value
Table 2: Global Top 10 Soft-drink Companies in Off-trade
Volume
Source: Euromonitor International (2012).
The list of largest companies (see tables 1 and 2 above) is likely to remain relatively stable due to the
fact that the global players get most value from the developed markets, which are also the more
matured markets. Companies that do business in developed markets are more likely to concentrate on
niche development that offer added value but do not tend to generate incremental overall volume. It is
unlikely that a new up-and-coming company will be able to enter this type of market.9
The story in developing, emerging markets is quite different. There is an extremely high
potential for volume growth, driven by large populations and increasing wealth. In the near future it is
likely that China Resources and Parle Bisleri get in to the global top 10 volume-based rank, but it will
take longer for these players to get in the top 10 value-based rank.
8http://blog.euromonitor.com/2013/01/soft-drinks-in-2013-growth-to-continue-as-demand-diversifies.html
9http://blog.euromonitor.com/2013/01/soft-drinks-in-2013-growth-to-continue-as-demand-diversifies.html

MASTER THESIS - Questioning ‘the Ultimate Question’ 2013
5
UNESDA has reported the following results of soft-drinks consumption in the EU and in the
Netherlands over the years 2006-2011:
Figure 1: Soft-drink consumption in the EU
2006-2011
Figure 2: Soft-drink consumption in the
Netherlands 2006-2011
Source: UNESDA, Canadean Wisdom 2012 Annual Cycle (2012).
Over 2011, the Netherlands consumed 1,886.4 million liters of soft-drinks, which comes down to
113.3 liters per capita. The European total soft-drinks consumption in 2011 was 48,256.4 liters,
comprising 96 liters per capita. Thus, soft-drinks consumption in the Netherlands is well above the
average in Europe. The Dutch are the fifth largest soft-drinks consumers of Europe. Germany (138),
Czech Republic, Belgium and Austria consume more soft-drinks per capita.10
The Dutch branch organization for soft-drinks, waters and juices (FWS), investigated the drink
consumption in the Netherlands from 2007-2010. The research shows that the average Dutch
consumes 2.1 liters on a day. This 2.1 liters, consists of 33% coffee and tea, 27% water, and 15% soft-
drinks. The average Dutch consumes slightly more than a glass of soft-drink per day (313ml). About a
third are light soft-drink consumers. Of all soft-drink consumed, Cola is consumed most often (42%),
followed by a fruit lemonade (25%) and orange soda (10%).11
10http://www.unesda.org/facts-figures
11http://webwerk.b-en-t.nl/fws/12316-bladerbare-pdf-kerngegevens/
88
89
90
91
92
93
94
95
96
97
43000
44000
45000
46000
47000
48000
49000
2006 2007 2008 2009 2010 2011
Soft-drinks consumption EU
Soft-drink consumption in millions of liters (left axis)
Soft-drink consumption in liters per capita (right axis)
100
102
104
106
108
110
112
114
1.600
1.650
1.700
1.750
1.800
1.850
1.900
2006 2007 2008 2009 2010 2011
Soft-drinks consumption NL
Soft-drink consumption in millions of liters (left axis)
Soft-drink consumption in liters per capita (right axis)

MASTER THESIS - Questioning ‘the Ultimate Question’ 2013
6
As soft-drink consumption is leveling or declining in mature markets, (especially the U.S.,
where the consumption of soft-drinks per capita has reached the lowest level since 198712
), soft-drink
producers are investing heavily to counter this trend. About 60% of Coca-Cola's turnover in the U.S. is
derived from carbonated soft drinks, compared with about a quarter at PepsiCo. More than 70% of
sales at Dr Pepper Snapple, the third largest player, are from soft-drinks and around 90% of its
turnover is from the U.S.13
Therefore, a lot is invested in growing markets, not only emerging
countries (BRIC-countries), but also sports and energy beverage markets that are growing fast.14
Moreover, producers have tried to find the solution to critics who claim soft-drinks contribute majorly
to the epidemic of obesity, to find all-natural, low calorie alternatives for their products. The beverage
giants have already seen this coming, and have taken measures by offering their own brands of water
bottles as they saw a trend in the rising consumption of bottled water.15
As the market volume is
shrinking in the matured markets, soft-drink producers rely more than ever on the loyalty of their
customers in these markets. This counts especially during these times of recession, according to
Muhtar Kent, CEO of The Coca-Cola Company, who states: “During difficult economic times,
consumers gravitate toward the brands they know, the brands they love and trust.”16
Many researchers have studied the link between brand loyalty and firm performance, which is
now generally accepted. “Good managers understand that the road to growth runs through customers
— not just attracting new customers, but holding on to the ones you have, motivating them to spend
more and getting them to recommend your products and services to the people they know”
(Keiningham, et al., 2008). Over the years, researchers have designed many metrics to explain the
connections between customer behavior and growth. Consensus is that most companies still lack the
knowhow of measuring and managing the customer relationship effectively. Therefore, it is essential
to use the right customer metrics for assessing and monitoring how companies deliver for customers
and determining customers’ new and unmet needs (Keiningham, et al., 2008).
12 http://www.cnbc.com/id/100592919
13 http://online.wsj.com/article/SB10001424127887323783704578245973076636056.html
14 http://money.msn.com/now/post.aspx?post=d2bfc3cd-35b5-4e44-8434-bc9d442811c1
15 http://www.brandchannel.com/home/post/2013/03/13/Water-Consumption-Soda-031313.aspx
16 http://www.mcknightkurland.com/blog/brand-rejuvenation%E2%80%94the-rules-remain-valid

MASTER THESIS - Questioning ‘the Ultimate Question’ 2013
7
1.2 Problem Statement and Research Objective
This thesis consists of exploratory research looking at three relevant major marketing issues.
1.2.1 The Predictive Power of Customer Metrics
First of all, research in this thesis investigates the differences in predictive power of alternative
customer metrics, to see which metric has the highest predictive power for attitudinal loyalty and two
types of behavioral loyalty: repurchasing intentions and actual spending behavior. The key metrics
included in this research are Customer Satisfaction (Fornell, 1992, Cronin and Taylor, 1992) and the
Net Promoter Score (Reichheld, 2003). These two metrics are compared in terms of their predictive
power towards behavioral loyalty. Therefore, the research question can be defined as follows:
What customer metric best predicts Behavioral Loyalty?
1.2.2 Questioning ‘the Ultimate Question’
Second, as many managers rely on or would like to rely on only one metric, instead of a set of
metrics to measure firm performance, researchers tried to find this ‘silver’ metric (Ambler, 2003). For
example, Reichheld (2003) developed ‘the Ultimate Question’, as he named the Net Promoter Score,
and claims it is the only question marketeers need to rely on. However, there is a heated debate around
this claim. Critics claim that this stand-alone measure is insufficient and additional measures are
needed (Keiningham et al., 2007, 2008; Schneider et al., 2008; East et al., 2011; Wiesel et al., 2012).
This research finds out who is right, in the context of fast moving consumer goods (FMCG), soft-
drinks in this case. Therefore, as the previous research question should provide the predictive power of
the NPS and Customer Satisfaction, to answer this research question the predictive powers of these
metrics are compared with each other and multidimensional model with both metrics included, to see
if the predictive power of the NPS can be improved. This leads to the following research question:
Is the Net Promoter Score really ‘the Ultimate Question’?
1.2.3 The Influence of Relationship Marketing Dimensions on Predictions
Third, since relationship marketing has become more and more important as a key part of any
business strategy, we look at the influence of relational factors on the predictions, to see whether a

MASTER THESIS - Questioning ‘the Ultimate Question’ 2013
8
single question metric as the NPS or customer satisfaction can be improved. The question is if these
relational factors increase the predictive power of metrics on behavioral loyalty.
Do relational factors make better predictions?
1.2.4 Sub-questions
In addition to these research questions, sub-questions are defined to help answering these research
questions.
How loyal are consumers to soft-drink brands?
Which factors are important for assessing consumer loyalty among soft-drink consumers?
What is the impact of relational factors on consumer loyalty?
What are the differences in predictive power among consumer metrics?
What are the differences in predicting (re)purchase intentions in contrast with actual
purchasing behavior?
1.3 Scientific and Managerial Relevance
What makes this thesis both scientific and managerial relevant, is that this study brings
empirical evidence to an ongoing and heated debate about which customer metrics are more effective
in predicting customer behavior. It is crucial to inform the debate with facts, which is the goal of this
thesis. The study is based on FMCG (soft-drinks), a very large and consumer-oriented industry, which
makes the results also applicable to many other industries and context. This stands in sharp contrast
with most existing research which has studied the effects of customer metrics on loyalty by looking at
data from contractual settings, in service industries.
1.3.1 Scientific Relevance
This thesis builds on the study by Wiesel, Verhoef, and de Haan, posted on HBR Blog
Network in July, 2012, which investigates the ability of some single-question customer metrics to
predict and measure firm performance.17
To see how, they looked at each measure if it predicted
customer loyalty on an individual level as well as on the level of the company as a whole.
17 http://blogs.hbr.org/cs/2012/07/there_is_no_one_best_measure_o.html

MASTER THESIS - Questioning ‘the Ultimate Question’ 2013
9
Over the last decade, it has been the Marketing Science Institute’s (MSI) top priority to
investigate the accountability of marketing actions. Since 2002 Accountability and ROI of Marketing
Expenditures has been among the top 10 of research priorities by MSI, it even was the top priority
over 2008-2010. Following these researches, many claim to have found the one metric that businesses
can rely on. Take Reichheld’s Net Promoter Score for example. According to Reichheld (2003) it is
the one number you need to grow in order to get a successful business. Critics say a single question
customer metric is not sufficient. This study tries to find out who is right.
1.3.2 Managerial Relevance
More results from research on this topic show that there is a lack of comprehension on this
topic, however, it is of uttermost importance to marketing departments to show to the boardroom how
their efforts influence firm value and performance. Another result by studies in the field is that for
measuring the return on marketing investments (ROMI) there is not one best, or silver metric,
therefore it is implied that dashboards need to consist of several metrics to successfully evaluate and
predict marketing efforts’ success (Ambler, 2003; Seggie et al. 2011; Wiesel, Verhoef, de Haan, 2012;
Farris, Bendle, Pfeifer, Reibstein, 2010). This study makes a contribution by providing managers an
answer on who is right and what to use for analyzing and predicting firm performance.
1.4 Structure of the Thesis
This thesis is structured as follows. As this chapter gives an introduction to the topic and states
the problem and relevance, in the next chapter, theories on the topics of research are being discussed
and reviewed. Moreover, the hypotheses and conceptual framework of this particular study are being
described. In the third chapter, the research methodology will be presented to show how the research
has been designed and how data has been collected. In addition, the representativeness of the sample
will be discussed and some analysis techniques that have been used are described. In the following
chapter, analyses of the data will be discussed along with a presentation of the results. The final
chapter discusses the managerial implications of the conclusions from the results to answer the main
research questions as proposed in the introduction. Furthermore, limitations to this study are being
described and recommendations for further research are given.

MASTER THESIS - Questioning ‘the Ultimate Question’ 2013
10
2 Literature Review
In order to get a clear view on the problem statement and existing literature on this topic, this
chapter provides a review on findings from scientific literature. At first, the concept of customer
loyalty will be discussed. Second, the link with customer satisfaction, net promoter score and the
relational factors shall be a subject of discussion.
2.1 Customer Loyalty
2.1.1 Customer Loyalty and Firm Performance
The aim of this research is to investigate the relationship between customer metrics and firm
performance, to see if customer metrics have predictive value towards firm performance. Firm
performance, however, cannot easily be assessed, because it can have a variety of meanings to
different firms with different objectives. Ambler and Roberts (2005) describe a firm’s performance in
as achieving goals of which short-term survival and long-term growth are the most common. As
customers are a company’s most important assets (Gupta et al. 2006, Wiesel et al. 2012), firm
performance is in both researches being described as levels of customer repurchase and levels of
spending.
In this thesis, a firm’s performance is also evaluated by the loyalty of its customers. In general,
marketeers have agreed that customer loyalty is one of the main drivers of firm performance, as it can
generate positive returns such as increased sales, lower costs, and more predictable profit streams
(Ostrowski et al., 1993, Terrill et al., 2000, Jones and Taylor, 2005). Customer loyalty has been found
a key source to competitive advantage (Bharadwaj et al. 1993) and to firm survival and growth
(Reichheld 1996).
2.1.2 Definitions of Customer Loyalty
As customer loyalty is considered to drive firm performance, following the applications of
several metrics to loyalty, different definitions have been found that define customer loyalty. Loyalty
has been defined as “a deeply held commitment to rebuy or re-patronize a preferred product / service
consistently in the future, thereby causing repetitive same-brand or same brand set purchasing,

MASTER THESIS - Questioning ‘the Ultimate Question’ 2013
11
despite situational influences and marketing efforts having the potential to cause switching behavior”
(Oliver,1999).
Jones and Sasser (1995) define customer loyalty as “a customer’s sense of belonging or identification
with the employees, services or products of a company; these feelings have a direct impact on
customer behavior”.
Reichheld (2003) defines customer loyalty as “the willingness of someone – a customer, an employee,
or a friend – to make an investment or personal sacrifice in order to strengthen a relationship.”
2.1.3 Attitudinal Loyalty vs. Behavioral Loyalty
Dick and Basu (1994) suggest that loyalty has an attitudinal and behavioral dimension. In line
with this suggestion, many studies have proven there are two kinds of loyalty: behavioral loyalty and
attitudinal loyalty (Kumar and Shah, 2006; Lam et al., 2004; Fullerton, 2005). Attitudinal loyalty
means having a positive attitude towards a product, brand or company. This type of loyalty refers to
the individual’s cognitive degree of loyalty. Jones and Taylor (2007) define it as “a consumer’s
identification with a particular goods provider and preference of a product over alternatives”.
Behavioral loyalty has more often been considered as the quantity and frequency of purchases.
“From a behavioral view, customer loyalty is defined as repeat patronage, that is, the proportion of
times a purchaser chooses the same product or service in a specific category compared to the total
number of purchases made by the purchaser in that category” (Neal, 1999). Behavioral loyalty
focuses more on intentions to repurchase and actual repeat purchasing behavior. Roest and Hulsen
(2008) suggest that someone is loyal when he/she purchases the same brand at least three times.
According to Dick and Basu (1994), the two loyalty dimensions lead to four levels of loyalty
in a high-low matrix. The most ideal level of loyalty is called ‘true loyalty’, consisting of both high
levels of behavioral and attitudinal loyalty. If attitudinal loyalty is high and behavioral loyalty is low
latent loyalty. If attitudinal loyalty is low and behavioral loyalty is high, there is spurious loyalty.
When both attitudinal and behavioral loyalty are low, the stage is called no loyalty, a stage which is
unfavorable to firms (Dick and Basu, 1994).

MASTER THESIS - Questioning ‘the Ultimate Question’ 2013
12
A study by Jones and Taylor (2007)
on the multi-dimensionality of loyalty
suggested that the two-dimensional
structure of the construct – a behavioral
element and a combined attitudinal/
cognitive element – holds. Therefore, in this
research loyalty is consistently measured as
a two-dimensional construct consisting of
attitudinal and behavioral constructs. Most
of the loyalty literature supports this
simplified view of customer loyalty, suggesting that both attitudinal and behavioral aspects are
necessary to define loyalty (Bandyopadhyay & Martell, 2007; Chaudhuri & Holbrook 2001; Dick &
Basu, 1994; Zeithaml, Berry& Parasuraman, 1996).
2.1.4 Attitudinal Loyalty as Antecedent of Behavioral Loyalty
There have been many researches that treat attitudinal loyalty as an antecedent of behavioral
loyalty (Bandyopadhyay, Martell, 2007; Jacoby, Kyner, 1973; Pritchard, Havitz, Howard, 1999; East,
Gendall, Hammond, Lomax, 2005; Russell-Bennett, McColl-Kennedy, Coote, 2007; Reynolds and
Arnold, 2000; Carpenter, 2008). Either way, both attitudinal and behavioral dimensions of loyalty are
found to be equally critical (Kumar & Shah, 2006; Lam et al., 2004; Fullerton, 2005).
Chaudhuri and Holbrook (2001) use attitudinal and behavioral loyalty as causal impact on
market share, they believe the relationship of attitudinal and behavioral loyalty is interrelated, not
cause-effect. Cheng (2011) argues that while behavioral loyalty ensures that customer loyalty can be
converted into actual purchase behavior, attitudinal loyalty can indirectly have an effect on firm
performance by creating a positive image of a business through word-of-mouth.
Whereas in most behavioral sciences past behavior is seen as the best predictor of future
behavior, most followers of behavioral loyalty consider past behavior also the best predictor of
customer loyalty. In addition, Lee and Cunningham (2001) consider behavioral loyalty also to be
Figure 2: Forms of Loyalty by Dick & Basu, 1994
High
Low
Low High
Behavioral Loyalty
Attitudin
al L
oyal
ty
Latent Loyalty
True Loyalty
No Loyalty
Spurious Loyalty

MASTER THESIS - Questioning ‘the Ultimate Question’ 2013
13
predicted on purchase intention. Zeithaml et al. (1996) developed the Behavioral-Intentions Battery to
categorize loyalty in intentional and behavioral loyalty measurements. The loyalty dimensions consists
of two items that relate to recommendation (behavior rather than intention) and two items that relate to
repurchase intentions. The customers who intent to remain loyal are willing to pay higher prices, they
intent to repurchase and are willing to recommend the product to others (Zeithaml et al., 1996;
Chauduri and Holbrook, 2001). This research illustrates that repurchase intentions are decent
indicators of future behavior (Zeithaml et. al, 1996).
Most customer loyalty studies integrate multi-dimensional concepts into a single construct
comprising: “repurchase intention”, “recommendation intention”, “customer retention”, or “price
tolerance”. Researchers record these components to integrate them into a single dependent variable
that determine factors affecting loyalty (Cheng, 2011).
A study by Cheng (2011) uses behavioral loyalty (a substantial element) and attitudinal loyalty
(a psychological construct) to make predictions of behavioral and attitudinal loyalties to identify the
differences between the behavioral loyalty model and attitudinal loyalty model. The difference found
between behavioral and attitudinal loyalty is that behavioral loyalty ensures that customer loyalty can
be converted into actual purchase behaviors, while attitudinal loyalty will not ensure that customers
will purchase the products themselves. However, through word-of-mouth, attitudinal loyalty will
create a positive image of a firm. This may not directly bring profit, but will indirectly have positive
effects on firm performance through brand equity (Cheng, 2011; Keller, 1993).
2.2 The Net Promoter Score
There have been many researches where the willingness to recommend is used as a behavioral
loyalty measurement item (Bloemer et al., 1999; Zeithaml et al., 1996; Wiesel et al., 2012). The Net
Promoter Score (NPS) has been advocated by Reichheld (2003) as the ultimate question and the one
metric managers can rely on for measuring performance. The NPS measures the willingness to
recommend through a single question: “How likely will you recommend the company/brand/product
or service to a friend or a colleague?” The higher the score, the more customers are delighted with the
product or service experience and would recommend it to a friend or colleague (Keiningham et al.

MASTER THESIS - Questioning ‘the Ultimate Question’ 2013
14
2007). Often this question is measured on a 0–10 scale. Those scoring a 9 or 10 are ‘promoters’ of the
brand, while those scoring a value between 0 and 6 are ‘detractors’, and those scoring a 7 or 8 are
‘passives’. The Net Promoter Score for the brand is then calculated by the percentage of promoters
minus the percentage of detractors (Reichheld, 2003).
2.2.1 The Development of the Net Promoter Score
The Net Promoter has received the attention of some of the best journals, and has resulted in
scientific publications in top outlets such as the MIT Sloan Management Review (Reichheld 2006a),
but also a coverage press in the Wall Street Journal (2006) and a number-one best-selling business
book, ‘The Ultimate Question’ (Reichheld 2006c). Additionally, various trade journal articles have
published the Net Promoter (e.g., McGregor 2006; Morris 2006).
The developers of the NPS (Fred Reichheld, along with Satmetrix and Bain & Company) has made
very strong claims about the advantage of the NPS over other loyalty metrics. Specifically, they have
stated:
1. The NPS is “the best predictor of growth,”
2. The NPS is “the single most reliable indicator of a company’s ability to grow”
3. “Satisfaction lacks a consistently demonstrable connection to … growth” (Reichheld, 2003).
Nowadays, the metric has been implemented by major companies like Microsoft, American
Express, General Electric, Intuit, T-Mobile, Charles Schwab, and Enterprise, the metric is even being
reported to investors (Keiningham et al., 2007). However, the NPS is at the center of a debate
regarding its merits, which caused a rather heated discussion among professionals (Keiningham et al.,
2007). Though Reichheld (2003) and co-authors claim that the NPS is the only number managers need
to grow to measure customer behavior and boost firm performance, there have been many critics that
disprove the robustness of the NPS as a customer metric (Keiningham et al., 2007; East, Romaniuk,
and Lomax, 2011).

MASTER THESIS - Questioning ‘the Ultimate Question’ 2013
15
2.2.2 Net Promoter Criticism
Many researchers have compared the NPS with customer satisfaction measures like the American
Customer Satisfaction Index (ACSI) (Fornell et al., 1992, see paragraph 2.3) to disprove Reichheld’s
claims. Reason for the criticism is that “the evidence regarding the relationship between the Net
Promoter metric and firm revenue growth (Reichheld, 2003, and Satmetrix, 2004) has not been
subjected to rigorous scientific scrutiny and peer review” (Keiningham et al., 2007).
Morgan and Rego (2006) looked at the longitudinal impact on business performance of various
satisfaction and loyalty metrics. They found no predictive value in their evaluation of the NPS.
However, their calculation and data used for the NPS differed completely with Reichheld’s approach.
Thus, their conclusions about NPS cannot be accurately relied on (Keiningham et al. 2007).
The research by Keiningham et al.(2007) is the first cross-industry, longitudinal examination of
the association between Net Promoter and firm revenue growth, that attempted to replicate Reichheld's
(2003, 2006c) and Satmetrix's (2004) methodology. Keiningham et al. (2007) found very strong
evidence of research bias in the research by Reichheld (2003). In their replication of a subset of
Reichheld ‘s data for his best case scenarios, Keiningham et al. (2007) found a 0.000 correlation to
growth, suggesting that the NPS is not at all a good predictor of growth. Their findings clearly show
that when using a replicate of Reichheld’s own data, the NPS was not superior to the ACSI.18
Richard Evensen, one of the bloggers from Forrester Research, adds to the debate that the NPS is a
useful question, but the method, i.e. the NPS formula, is too problematic. According to him, the
biggest concern is“… that there is not sufficient quantitative evidence to support a correlation
between NPS and customer actions (renewals or even actual recommendations). Given its time in the
field, SatMetrix should be able to show 100s if not 1000s of cases with high correlation coefficients
(Pearson’s r = 70%+). To date, they have only provided a totally unsupported position that findings
support the link between Net Promoter and financials. 19
18 http://www.customerthink.com/blog/net_promoter_acsi_smackdown
19 http://blogs.forrester.com/richard_evensen/11-04-18-
stop_using_nps_net_promoter_score_but_please_save_the_question

MASTER THESIS - Questioning ‘the Ultimate Question’ 2013
16
Besides the questionable correlation, the scale definitions are culturally insensitive. According to
Reichheld, Promoters are captured by the percentage of customers who score a 9 or a 10. The blogger
in this case gave a beautiful citation from one of his clients when asked for a rating: “10 is for God. 9
is for el Maestro. So, 8 is as good as you can get.” 20
Besides this example, there is a well-established
literature in marketing and psychometrics, that show how different cultures use response scales
differently (de Jong, Steenkamp, Fox and Baumgartner, 2008; de Jong, Steenkamp and Veldkamp,
2009). Moreover, Detractors are captured by the percentage of customers who score a value in the
range from 0 to 6, while a 5 or a 6 says something different about a customer than one who scores a 0
or a 1 (Bird & Ehrenberg, 1967; 1968; Barnard, 1990; Bollen, 2008). Additionally, these authors state
that the NPS is rather an attitudinal than a behavioral metric. It measures how many people say they
would be likely to recommend, rather than how many are actually doing so. A large body of research
indicates that claimed intention is a better reflection of present attitudes than future behavior
(Bird & Ehrenberg, 1967; 1968; Barnard, 1990; Bollen, 2008).
Another critic states: "The rule-of-thumb score classes proposed by Reichheld (promoters are
those respondents who give a likelihood of recommendation of 9 or 10 while the detractors give 6 or
less) are not supported statistically, mask important changes and potentially mislead management that
there is negative NPS when this may not be the case." -Ken Roberts, Forethought Research Australia.21
Further criticism is that the Net Promoter scale is unipolar (willingness to recommend), while
Reichheld’s analysis method treats the scale as bipolar (willingness to recommend vs. willingness to
detract). Schneider, Berent, Thomas and Krosnick (2008) additionally demonstrate that the 11-point
scale has the least predictive value of any of the scales tested. The authors propose to use an
alternative 7-point scale with labeled ends and a midpoint for the NPS question but also recommend a
bipolar scale for a reworded variant. The proposed 7-point scale should have the following labels:
1. Extremely likely to recommend against
20 http://blogs.forrester.com/richard_evensen/11-04-18-
stop_using_nps_net_promoter_score_but_please_save_the_question 21
http://blogs.forrester.com/richard_evensen/11-04-18-
stop_using_nps_net_promoter_score_but_please_save_the_question

MASTER THESIS - Questioning ‘the Ultimate Question’ 2013
17
2. Moderately likely to recommend against
3. Slightly likely to recommend against
4. Neither likely to recommend nor recommend against
5. Slightly likely to recommend
6. Moderately likely to recommend
7. Extremely likely to recommend
Furthermore, Schneider, et al. (2008) counter-intuitively demonstrate in their paper that "satisfaction"
and "liking" are better at predicting actual recommendations than "likelihood to recommend".
Reichheld (2003) claims in the HBR article ‘The One Number You Need to Grow', that since
his tests showed propensity to recommend to be the single question that had the strongest statistical
relationship to future company performance, there was no point asking any other questions in
customer surveys. The authors of the book “Customer Satisfaction: The customer experience through
the customer's eyes” (Hill, Roche & Allen, 2007) state that “a single item question is much less
reliable and more volatile than a composite index” (p. 7), in favor of the ACSI measure. In addition,
Keiningham et al. (2007) find that, “contrary to Reichheld's assertions, recommend intention alone
will not suffice as a single predictor of customers' future loyalty behaviors. Use of multiple indicators
instead of a single predictor model performs significantly better in predicting customer
recommendations and retention."
East et al. (2011) have not only criticized the NPS, but took the ACSI along, and stated that
both measures have weaknesses that could be avoided with a new measure that has been developed by
the researchers. Satisfied customers are more likely to remain loyal and express a positive word-of-
mouth (WOM), which could lead to customer acquisition and sales. Therefore it is likely that these
metrics may predict brand performance. East et al. (2011) show in their study that ex-users and never-
users, who are not captured by the NPS, can give some positive WOM, but mostly generate negative
WOM. Additionally, the study shows that the NPS’ detractors, who according to Reichheld are
responsible for generating negative WOM, actually are only responsible for a small amount of the
negative WOM. The researchers prove that the NPS and the ACSI do not provide adequate
measurement of NWOM and dissatisfaction respectively. Also, the NPS lacks a measurement of the
impact of WOM. According to East et al. (2007) the total effect of WOM should be established by the

MASTER THESIS - Questioning ‘the Ultimate Question’ 2013
18
separate measurement of the volume and impact on purchase of PWOM and NWOM. Therefore, they
have worked out the Net Effect of WOM with the following equation:
[(volume × impact)PWOM + (volume × impact)NWOM]/market share
In the study by Wiesel, Verhoef, and de Haan, (2012), the NPS is compared to the Customer
Effort Score (CES) and Customer Satisfaction for their relation to repurchasing and increased
spending. They find that the NPS is a good predictor of the individual customer’s attitudes, but on the
firm level is outperformed by the CES.
Richard Everson, from Forrester Research, states to stop using the NPS, or rather, start to use
it more properly. Despite all the critics, the NPS remains a popular metric because of its simplicity. It
is a well marketed, easy to understand tool and its model makes intuitive sense: every organization
wants more promoters than detractors.
2.3 Customer Satisfaction
2.3.1 Definitions of Customer Satisfaction
Customer satisfaction can be defined as “an overall evaluation based on the total purchase
and consumption experience with a good or service over time”(Anderson, 1994; Fornell, 1992).
Cronin and Taylor (1992) measured customer satisfaction as a one-item scale that asks for the
customers’ overall feeling towards an organization.
2.3.2 The American Customer Satisfaction Index (ACSI) and firm growth
As many researches have proven the relationship between customer loyalty and customer
satisfaction, some even go beyond and examine the direct relationship between customer satisfaction
and firm growth. Anderson, Fornell, and Mazvancheryl (2004) have proven a positive relationship
between the ACSI and the ratio of price to book value, equity prices, and Tobin's Q, which is the ratio
of a firm's market value to the replacement cost of its assets (Tobin, 1969). Gruca and Rego (2005)
have used ACSI and COMPUSTAT data and found that the satisfaction measure creates shareholder
value by increasing future cash flow growth and reducing its variability.

MASTER THESIS - Questioning ‘the Ultimate Question’ 2013
19
Fornell et al. (2006) also proved there is a significant positive relationship between the ACSI
and firm growth. They found that firms which perform better in the ACSI, also perform significantly
in terms of market returns.
2.3.3 Linkage between Customer Satisfaction and Loyalty
Many believe customer satisfaction to be a fundamental determinant of customer loyalty.
There is plenty of research that justifies this declaration. Reynolds and Beatty (1999) have found that
satisfaction affects behavioral loyalty directly. Fornell (1992) has done research in a variety of
products and service categories, and found a strong positive effect on customer loyalty intentions. Ever
since, many scholars studied this relationship and found a significantly positive correlation between
customer satisfaction and customer loyalty(Dick and Basu, 1994; Zeithaml et al., 1996; Lai et al.,
2009).
If a customer is satisfied, the likelihood of repeat patronage is great. According to Cheng
(2011), attitudinal loyalty is created by satisfaction, whereby the customer recommends the product or
service through word-of-mouth. Thus, customer satisfaction has a positive effect on attitudinal and
behavioral loyalty. In addition, researchers have found that satisfaction helps brands to build long and
profitable relationships with their customers (Eshghi et al., 2007).
Customer satisfaction has therefore long been used to predict behavioral intentions (Anderson,
Fornell, and Lehmann 1994; Cronin and Taylor 1992; Zeithaml, Berry, and Parasuraman 1996). These
studies assume transactional customer relationships in which the determinant of repeat purchasing is
successful previous experience rather than the development of trust and commitment. Garbarino and
Johnson (1999) used satisfaction as a mediator to represent the basic model in which overall
satisfaction with previous encounters mediates future behavioral intentions, that has been used in most
consumer (satisfaction) research.
However, some argue that satisfaction is a weak predictor of customer loyalty. Though it is
true that loyal customers are often satisfied, not all satisfied customers are loyal. In addition, a
customer who is merely satisfied might remain loyal. Jones and Sasser (1995) find that unless a
customer is completely satisfied, there is always a chance that this customer will defect.“Complete

MASTER THESIS - Questioning ‘the Ultimate Question’ 2013
20
satisfaction is key to secure customer loyalty and superior long-term financial performance.” In their
Harvard Business Review article, they claim that higher levels of customer satisfaction do not
necessarily correspond with higher likelihood to repurchase a product or service.
In another, more recent, Harvard Business Review article, Verhoef, Wiesel and de Haan
(2012) explore the predictive power of inter alia customer satisfaction on loyalty and repurchasing. In
contrast with the Net Promoter Score and the Customer Effort Score, customer satisfaction was found
to be a weak predictor. Therefore, these researchers emphasize how important it is to examine other –
potentially – influential factors (Jones et al., 2002; Wiesel et al., 2012). Their implication is that it is
dangerous to rely on a single customer metric and urge for a multi-dimensional approach to predict
behavior loyalty.
2.4 Linkage between Relational Factors and Loyalty
A study by Palmatier et al. (2006) suggests that several relational mediators (trust,
commitment, satisfaction and quality) influence customer loyalty, word-of-mouth and expectance of
continuity, but also seller-objective performance. Based on this research, these factors are consistently
measured in this thesis to analyze the behavioral loyalty effects towards fast moving consumer goods.
2.4.1 Trust
In retailing, Berry (1993) states that "trust is the basis for loyalty."Morgan and Hunt (1994)
found that trust and commitment are key variables that mediate successful relationship marketing in
the context of automobile tire relationships. Garbarino & Johnson (1999) define trust as “customer
confidence in the quality and reliability of the services or products offered by the organization”.
Commitment is defined as “customer psychological attachment, loyalty, concern for future
welfare, identification, and pride in being associated with the organization”. In accordance with the
theory of trust and commitment as mediators (Morgan and Hunt 1994), trust is considered as a
precursor of commitment. As commitment involves potential vulnerability and sacrifice, people are
unlikely to be committed unless there is trust. In addition, this theory proposes trust and commitment
as influential factors in the future intentions of an exchange partner (Garbarino & Johnson, 1999).

MASTER THESIS - Questioning ‘the Ultimate Question’ 2013
21
In another study, Chaudhuri and Holbrook (2001) examine the chain of effects from brand
trust and brand affect to brand performance. They look at how brand trust and brand affect combine to
determine purchase loyalty and attitudinal loyalty. They found that purchase loyalty leads to greater
market share and attitudinal loyalty leads to a higher relative price for the brand, which in their turn
are determined by trust in the brand and by feelings or affect elicited by the brand.
2.4.2 Commitment
Commitment is defined in marketing literature as: “a desire to maintain a relationship”, “a
pledge of continuity between parties”, “the sacrifice or potential for sacrifice if a relationship ends”,
“the absence of competitive offerings” (Moorman, Deshpand, and Zaltman 1993; Morgan and Hunt
1994; Gustafsson, Johnson, and Roos 2005). Many researchers have looked at the influence of -
among others - commitment on customer loyalty. Assael (1987) even sees commitment as a crucial
part of loyalty, as he defines brand loyalty as “commitment to a certain brand” arising from certain
positive attitudes. Keller and Kotler (2009) consistently define brand loyalty as “a commitment to
rebuy or to repatronize a preferred product or service.”An important conceptual difference between
customer satisfaction and the commitment dimensions is that satisfaction is "backward looking",
whereas the commitment dimensions are more "forward looking" (Gustafsson, Johnson, and Roos
2005).
Similar to trust, commitment is recognized as an essential ingredient for successful long-term
relationships (Dwyer, Schurr, and Oh 1987; Morgan and Hunt 1994). Gundlach, Achrol, and Mentzer
(1995) argue that commitment has three components: an instrumental component of some form of
investment, an attitudinal component that may be described as affective commitment or psychological
attachment, and a temporal dimension indicating that the relationship exists over time (Garbarino &
Johnson, 1999).
In contrast with many researches on commitment, this thesis also takes into account the
calculative commitment, whereas other only account for affective commitment. Calculative
commitment is important because it captures the competitiveness of the firm’s value proposition.
Whereas customer satisfaction and affective commitment focus on perceptions of an offer per se,

MASTER THESIS - Questioning ‘the Ultimate Question’ 2013
22
calculative commitment reflects the viability of competitive offerings (Gustafsson, Johnson, and Roos
2005). This thesis has adapted the measurement items of affective and calculative commitment by
Gustafsson et al. 2005 to apply for FMCG such as soft-drinks.
2.5 Customer Loyalty among Soft-drink Consumers
The idea that customer loyalty is great among soft-drink consumers, comes from the huge
rivalry between the Coca-Cola Company and PepsiCo. The two major cola brands, Coca-Cola and
Pepsi, are among the most popular brands in the world and the Cola wars already last since the brands
existed, for more than a century.
“Soft drinks have been a rite of passage among the youth cultures of modern societies for generations
which legitimizes these categories for future generations. However, it is becoming less and less likely
that these traditional points of entry will be the “guaranteed” new consumer pipelines that they have
been. The Cola Wars of the 1980s assumed cola consumption and pitted brands against each other for
share. In the near future, we will see brands battling for an ever-shrinking piece of the market if their
offerings are not adjusted to reflect evolving preferences, and if consumer relationships are not
successfully managed to encourage trial and discourage defection.” (Interbrand Best Global Brands
report, 2012).
According to Interbrand, Coca-Cola is even considered as the best global brand of 2012,
meaning the brand has most value which is estimated at $ 77,839 million.22
Coca-Cola, a company of
126 years old, and with nearly 70 million fans on Facebook, 1.8 billion Coke products consumed daily
and 3,500 beverages in its diverse portfolio. Pepsi follows on a twenty-second place in the top 100
best global brands with a brand value of $ 16,594 million. Even a third soft-drink brand can be found
in the top 100 of best global brands of 2012, which is Sprite at #66, with a brand value of $ 5,709
million.
22http://www.interbrand.com/nl/best-global-brands/2012/Best-Global-Brands-2012.aspx

MASTER THESIS - Questioning ‘the Ultimate Question’ 2013
23
A study by Atilgan, Aksoy, & Akinci (2005), verified the customer-based brand equity
(CBBE) approach from Aaker (1991) applied to the beverages industry in Turkey. They found that
brand loyalty is the most influential determinant of brand equity.
Another Turkish study by Ulas and Arslan (2006) investigated brand switching attitudes of
cola consumers in Turkey, shortly after the introduction of a successful domestic cola brand. This
domestic brand, Cola Turka, engaged in the Turkish cola wars with Pepsi and Coca-Cola. At the time
of the study already pushed Pepsi of its second place in the market, claiming that Cola Turka owns
over 20% of the market where Pepsi’s share is decreasing to below 20% and Coca-Cola is leading the
market with 60%.
A more recent paper by Abarajithan & Ragel (2011) studied customer switching behavior
toward the carbonated soft-drink market in Sri Lanka. They showed what factors determine switching
behavior among carbonated soft-drink consumers in Sri Lanka. The authors proposed that the
marketing mix influenced the switching behavior. The marketing mix is considered to consist out of
four P’s. The four P’s are product, price, place and promotion (Kotler, Armstrong; 2010). The study
showed that of these dimensions, the marketer’s product mix, promotional mix and distributional
strategies have a high influence on the switching decision, whereas price strategy plays a moderate
role.
Another study compared the results of brand loyalty among soft-drink consumers in Kenya
and India (Mise, Nair, Odera, Ogutu, 2013). The findings reveal that the majority of Indian soft-drink
consumers were truly loyal and not brand switchers. The majority of Kenyan soft-drink consumers
stated that they are not truly loyal, nor brand switchers. Therefore, Kenyan soft-drink consumers are
indifferent buyers compared to Indian consumers who are mostly truly loyal.
Muniz & Hamer (2001) even studied ‘oppositional brand loyalty’ and the cola wars, by
analyzing consumer messages posted to multiple online newsgroups. The study shows that consumers
identify themselves by the brands they consume, but also the brands they do not consume. These
consumers express their opposition to competitive brands by initiating and participating in playful
rivalries (insulting and challenging) towards consumers loyal to competitor brands.

MASTER THESIS - Questioning ‘the Ultimate Question’ 2013
24
2.6 Conceptual Framework
This thesis aims to investigate the ability to predict repurchasing intentions and actual
repurchasing behavior in convenience FMCG using customer metrics such as ‘Customer Satisfaction’
and the ‘Net Promoter Score’ (NPS). In addition Trust, Commitment and Attitudinal Loyalty are
looked at to see the influence of these relationship dimensions. Therefore, soft-drinks have been used
as an example of convenience FMCG to predict repurchasing behavior and intentions and the effects
of the NPS, Customer Satisfaction, and set of relationship marketing dimensions. Besides these direct
effects of these approaches on predicting behavioral loyalty, also indirect effects are being looked at,
to see if the model of the NPS as predictor of behavioral loyalty can be further improved by adding
customer satisfaction to the model, and an additional model with the complete set of relationship
variables.
Figure 3: Conceptual Framework
2.8 Conclusion
Consensus is that customer loyalty is one of the main drivers of firm performance, as it can
generate positive returns such as increased sales, lower costs, and more predictable profit streams
Net Promoter Score
Customer Satisfaction
Behavioral Loyalty
Repurchasing Likelihood
Spending Intention
Actual Spending Behavior
Relationship Variables
Customer Satisfaction
Affective Commitment
Calculative Commitment
Attitudinal Loyalty
Trust
Control Variables
Gender
Age
Education
Household Size

MASTER THESIS - Questioning ‘the Ultimate Question’ 2013
25
(Ostrowski et al., 1993, Terrill et al., 2000, Jones and Taylor, 2005). Dick and Basu (1994) have
conceptualized a multidimensional construct of loyalty, namely an attitudinal and behavioral
dimension. The attitudinal dimension is more or less the attitude of a consumer towards a company,
product or service, whereas the behavioral dimension is considered to be the frequency or quantity of
purchases.
The Net Promoter Score has been argued to be the ultimate question for managers to use for
assessing customer loyalty. However, critics argue that using just the NPS is insufficient. Therefore, in
this thesis shall be looked at if customer satisfaction and relationship marketing variables increase the
predictive power of the NPS.
In contrast to the NPS, there have been many researches that studied customer satisfaction as
an antecedent of customer loyalty. As most researchers have found satisfaction to be a good indicator
of customer loyalty, some have argued that just satisfaction is not enough. However, the positive
relationship between satisfaction and loyalty is generally accepted.
In relationship marketing a set of variables has been used to determine customer loyalty.
Besides customer satisfaction, also trust, commitment and attitudinal loyalty form antecedents of
behavioral loyalty. Palmatier et al. (2006) has suggested that several relational mediators (trust,
commitment, satisfaction and quality) influence customer loyalty, word-of-mouth and expectance of
continuity.

MASTER THESIS - Questioning ‘the Ultimate Question’ 2013
26
3 Research Methodology
In this chapter the methodology and research approach will be described. The research method
is based on existing research. The methodology describes how quantitative research is developed,
examined and analyzed.
3.1 Research Design
The research design of this study is a combination of several designs. Besides the literature
review of existing research, this research uses primarily collected quantitative survey data to explain
the relationships between several independent variables (customer metrics, relationship marketing
dimensions) on dependent variables (behavioral loyalty; repurchasing likelihood, spending intention,
actual spending behavior). Zikmund (1984) suggests that the degree of uncertainty about the research
problem determines the research methodology. Since key dependent variables and relationships are
defined, the main design of this study can be called explanatory. The motivation of this study comes
from a research by Wiesel et al. (2012) that provided a theory on existing relations. The purpose of
this study is to evaluate the relationships and theories, supported by primarily collected data.
3.2 Data Collection
For the research, data has been collected via two surveys which are spread throughout the
internet; e-mail and social media. The surveys have been distributed via Qualtrics, a website with
survey design possibilities and downloadable SPSS-output. A first survey has been sent out to
measure the behavior and attitude of consumers towards soft-drink brands which they purchase in the
supermarket. One week later a follow-up survey has been sent out to the e-mail address which the
respondents had given in the first survey, to measure the actual purchase behavior of soft-drink brands
in the supermarket in that week to control for predictions on future repurchasing behavior. The data
collection process took place during the first two weeks of June 2013.
At first, a pretest was conducted with ten respondents to optimize the survey. The survey has
been optimized after these first ten respondents have participated, editing some wording and
readability. Afterwards, the link to fill in the survey has been spread throughout the use of social

MASTER THESIS - Questioning ‘the Ultimate Question’ 2013
27
media such as Facebook, LinkedIn and Twitter, and shared by participants to also reach their
connections. Also e-mail connections are used. This led to a total of 449 participants in the first
survey.
Once a respondent entered the website of the survey, an introduction had to be read before the
survey started, which introduced clear definitions of soft-drinks and soft-drink brands. Examples were
given on how to enter values to answer the open questions (e.g. what punctuation mark to use and how
to write the brands), but also how to answer the scale questions. A full copy of the questionnaire (with
the instructions) can be found in Appendix B. The survey started with the question on how often the
respondent bought soft-drinks at the supermarket. Hereafter, the respondent was asked to provide up to
five of his most often bought soft-drinks (in order), and up to five favorite soft-drink brands in order.
This was followed by questions regarding the average purchasing behavior in volume (liters) and
monetary (Euro’s) of soft-drinks in general and his/her favorite soft-drink brand. An overview of the
scales and the sources of measuring the variables customer satisfaction, NPS, attitudinal loyalty,
behavioral loyalty intentions, trust, affective and calculative commitment can be found in the in the
next chapter, along with the descriptives and reliability (i.e. Cronbach’s alpha) of these constructs will
be described. Further in this chapter, in paragraph 3.4 , a description of the sample will be provided.
A week later I conducted a second wave of my survey, targeting the same respondents. This
follow-up survey has been sent out a week after the responded had completed the first survey. In total,
133 respondents have responded in this second wave. Thus, a response rate of 51.4% was the result.
The full copy can be found in Appendix D. The survey consists of six questions that measures actual
behavioral loyalty. These questions were the volume of soft-drinks purchased in that week in general,
and the amount spent on soft-drinks in that week in general, and the volume purchased and amount
spent per brand.
3.3 Cleaning the Data
The survey has been filled in quite well. Some errors and inconsistencies were found. These
cases had to be deleted from the dataset to avoid the analysis of this research to be influenced by
invalid data. 5 respondents have provided values to their soft-drink purchases in general that are lower

MASTER THESIS - Questioning ‘the Ultimate Question’ 2013
28
than the value that they have entered for their favorite brand purchases. Obviously, it is impossible to
buy more of your favorite soft-drink brand than soft-drinks in general. One case of extreme, unrealistic
values and uncompleted cases have been deleted as well. In total, there were 449 cases, of which 49%
was incomplete. After further cleaning 220 valid and complete cases were left. In the follow-up survey
133 participants responded in total. 85% (113 cases) completed the survey. Two cases seemed
unrealistic, and have been deleted. By coincidence, exactly 50% (110) complete cases were left to be
used for analysis.
3.4 Representativeness and Sample Profile
The table below shows some descriptives and frequencies from the sample profile versus the
Dutch population. There is some variance between the sample and the Dutch population, which have
been gathered by the Dutch Central Bureau for Statistics (CBS) as of April 2013.
Table 3: Sample Representativeness
Variable Sample Population*
Gender Absolute Relative
Cumulative
Percent
Absolute
(*1000) Relative
Male 139 63,20%
63,20% 8306 49,50%
Female 81 36,80%
100,00% 8472 50,50%
Total 220 100,00%
16778 100,00%
Level of Education Absolute Relative
Cumulative
Percent
Absolute
(*1000) Relative
Primary school 1 0,50%
0,50% 923 8,40%
Secondary school 7 3,20%
3,60% 3694 33,60%
Intermediate vocational ed. (MBO) 18 8,20%
11,80% 3452 31,40%
Higher professional ed. (HBO) 114 51,80%
63,60% 2001 18,20%
University (WO) 80 36,70%
100,00% 923 8,40%
Total 220 100,00%
10994 100,00%
Household Size Absolute Relative Relative Cumulative
Percent
Absolute
(*1000) Relative Average
1 60 27,30% 27,50% 27,30% 2762 36,80% 1
2 71 32,30%
72,50%
59,90%
4751 63,20% 3,4 3 31 14,10% 73,60%
4 39 17,70% 91,40%
5 or more 19 8,60% 100,00%
Total 220 100,00% 100,00%
7513 100,00% 2,2
Age Range Male
Average
Female
Average
Total
Average
Male
Average
Female
Average
Total
Average
Age 18-69 29 29,2 29,1 39,9 41,7 40,8
*CBS 5 April 2013

MASTER THESIS - Questioning ‘the Ultimate Question’ 2013
29
Major differences between the sample and Dutch population can be found in all demographic
aspects. Males, the higher professional educated and multiple person household are overrepresented.
This high variance will lead to some difficulties in generalizing towards the Dutch population,
therefore, this has to be interpreted with caution.
3.5 Analyses Techniques
The data will be analyzed through the statistical software program SPSS. Descriptive statistics
and frequency tables will show basic analyses on the dataset. A factor analysis will summarize
construct-items in the dataset and allow me to check the validity of the measures for the different
constructs (by checking if the factors obtained conform with the theoretical predictions). Cronbach’s
alpha will allow me to test whether the measures are reliable. In addition, KMO and Bartlett’s test will
show sample adequacy and validity. Cronbach’s alpha should also indicate if the data is reliable.
Recall that the goal is to measure the predictive power of the different metrics and relation
factors on behavioral loyalty, intentions and actual spending on soft-drinks. The predictive power will
be analyzed by checking the correlations and their significance between the measures and the outcome
variables (an approach akin to the one used by Wiesel, Verhoef, de Haan, 2012). In addition a linear
regression model will be applied to see how models can be improved by adding or deleting variables
in the model.

MASTER THESIS - Questioning ‘the Ultimate Question’ 2013
30
4 Data Analysis and Results
This chapter provides the results of the data analysis. The first paragraph presents the validity
and reliability of the data by Cronbach’s alpha, KMO and Bartlett’s test of sphericity, and a factor
analysis to reduce the number of measures into several dimensions. Descriptives of the dataset will be
given in paragraph 4.2. Paragraph 4.3 shows the relationships among variables through correlations.
Hereafter, several models are tested through linear regression. The chapter will finish with a
conclusion.
4.1 Reliability and Validity
4.1.1 Reliability: Cronbach’s Alpha
To control the data for reliability, a reliability analysis was executed on the multi-item
constructs to measure Behavioral Loyalty, Repurchase Intentions, Attitudinal Loyalty, Trust, Affective
and Calculative Commitment. Customer Satisfaction and the Net Promoter Score have been measured
as single-item constructs. Table 4 (below) shows the Cronbach’s alpha value of these constructs (if a
multiple item construct), and the source of which the constructs have been adopted. All of the
constructs’ Cronbach’s alpha value are above the threshold of 0.6. Hence, we can proceed with the use
of these constructs, because the data among the 220 respondents is reliable. Unused measures from the
questionnaire which are not included in further analysis, have not been taken into the reliability
analysis and are therefore not shown in the table below.
Table 4: Reliability Statistics
Construct N of Items Cronbach's alpha Source
Trust 3 ,847 Garbarino & Johnson, 1999; Morgan & Hunt, 1994
Affective Commitment 3 ,639 Gustafsson, Johnson, and Roos, 2005
Calculative Commitment 2 ,662 Gustafsson, Johnson, and Roos, 2005
Attitudinal Loyalty 5 ,839 Harris and Goode, 2004
Customer Satisfaction 1 - Cronin and Taylor, 1992
Net Promoter Score 1 - Reichheld, 2003
Repurchase Intentions 4 ,842 Morgan and Rego, 2006
Behavioral Loyalty 2 ,926 Warshaw, 1980

MASTER THESIS - Questioning ‘the Ultimate Question’ 2013
31
4.1.2 Validity
KMO and Bartlett’s Test
To check the data for dimensions and validity, of the 21 items, the single-item measures
Customer Satisfaction and Net Promoter Score were excluded and a Factor Analysis on the multi-item
constructs Attitudinal Loyalty, Trust, Affective and Calculative Commitment has been executed, and,
since the behavioral loyalty measures are more indications of repurchasing likelihood, we excluded
these items from the factor analysis as well.
A KMO and Bartlett’s Test of Sphericity has been executed as part of the factor analysis. The
Kaiser-Meyer-Olkin Measure indicates that the sample is adequate (KMO > 0,6) and Bartlett’s Test of
Sphericity shows the dataset is significant and responses used are valid and suitable for this study (see
table below). N.B. including Customer Satisfaction, the Net Promoter Score and the Behavioral
Loyalty items do not change these results, but are excluded from the Factor Analysis to not disrupt the
dimension composition.
Table 5: KMO and Bartlett's Test
Kaiser-Meyer-Olkin Measure of Sampling Adequacy. ,832
Bartlett's Test of Sphericity Approx. Chi-Square 1175,714
df 91
Sig. ,000
Factor Analysis
The factor analysis was executed using Principal Component Analysis and rotated Varimax
with Kaiser Normalization. The Varimax rotation maximizes the variance of the squared loadings of a
factor on all the variables included, so that for each factor, high loadings will result for a few
variables; the rest will be near zero. The results of the Factor Analysis can be found in the table on top
of the next page. The results show that the items which tend to belong together, according to this
rotated component matrix also do belong together. Thus, this factor analysis proves the validity of the
multi-item constructs. Additionally, table A1 in Appendix E shows the total variance explained by the
four components (66%) that have an Eigen value > 1. The scree plot (figure A1 in Appendix E) also
indicates four factors.

MASTER THESIS - Questioning ‘the Ultimate Question’ 2013
32
Table 6: Rotated Component Matrixa
Component
1 2 3 4
My favorite soft-drinks brand always meets expectations ,206 ,822 ,067 ,010
My favorite soft-drinks brand can be counted on to provide good quality ,285 ,840 ,090 -,026
My favorite soft-drinks brand is reliable ,116 ,854 ,171 -,030
I am happy to be a customer of my favorite soft-drinks brand ,231 ,331 ,560 ,105
My favorite soft-drinks brand is the soft-drinks brand that takes the best care of its customers ,081 -,010 ,823 ,128
I have feelings of trust toward the company ,187 ,140 ,737 ,139
It pays off economically to be a customer of my favorite soft-drinks brand -,067 -,092 ,162 ,829
I would suffer economically if the relationship were broken with my favorite soft-drinks brand ,048 -,064 ,176 ,760
I believe that my favorite soft-drinks brand is preferable to any other soft-drinks brand ,716 ,222 ,184 ,040
I believe that my favorite soft-drinks brand has the best offer ,366 ,191 -,009 ,589
I prefer the quality of my favorite soft-drinks brand to the quality of competitors ,750 ,289 ,090 -,074
I have repeatedly found my favorite soft-drinks brand better than others ,822 ,146 ,038 ,016
I am a loyal customer of my favorite soft-drinks brand ,744 ,096 ,249 ,222
I consider my favorite soft-drinks brand my first choice for soft-drinks purchases ,800 ,088 ,130 ,110
Extraction Method: Principal Component Analysis.
Rotation Method: Varimax with Kaiser Normalization.
a. Rotation converged in 6 iterations.
Component 1 (yellow) consists of all attitudinal loyalty items.
Component 2 (blue) consists of all items related to measure trust.
Component 3 (red) consists of all items related to the affective commitment measures.
Component 4 (green) consists of the two calculative commitment items.
One exception is the attitudinal loyalty item “I believe that my favorite soft-drinks brand has the
best offer” actually has a higher factor loading on calculative commitment then attitudinal loyalty,
which does make sense, since this item is price-related.
After the factor analysis has been executed, the mean scores have been calculated for each
respondents in each construct as a weighted average of all items measuring the corresponding
construct, with weights being the factor loadings of each item in the corresponding factor.
That is, as discussed in the equation below, ij is the score of respondent i in construct j, n is
the number of items used to measure construct j, i is the individual respondent, λ is the factor loading
score of item k in factor j for individual i and xijk is the response of respondent i to item k which is
part of the multi-item construct j.
ij = ijk ijk ijk

MASTER THESIS - Questioning ‘the Ultimate Question’ 2013
33
By using this equation, items with a high weight contribute more to the component score than
the low weighted items. The use of this summated scale is considered a valuable addition to any
multivariate analysis because it reduces measurement error and represents multiple facets of a concept
(Hair, Black, Babin, and Tatham, 2006).
4.2 Descriptives
4.2.1 Sample descriptives
The data has first been analyzed through the descriptive statistics. The complete descriptive
output of the two surveys can be found in the appendix. The table below provides the descriptives of
the variables used in the further analysis. This table also includes the descriptives about the computed
component scores for the multi-item constructs attitudinal loyalty, trust, affective and calculative
commitment.
Table 7: Descriptive Statistics of Respondents
N Min Max Mean Std. Dev.
Gender 220 0 1 0,37 ,483
Age 220 18 69 29,10 10,551
Education 220 1 5 4,20 ,758
Household size 220 1 5 2,48 1,294
Affective Commitment 220 1,98 5,00 4,0767 ,60151
Calculative Commitment 220 1,26 5,00 3,4128 ,62381
Attitudinal Loyalty 220 1,00 5,00 2,3555 ,86649
Trust 220 1,81 5,00 3,7394 ,67320
Customer Satisfaction 220 1 5 4,09 ,713
Net Promoter Score 220 1 5 3,54 1,132
RPI Favorite 220 1 5 3,51 1,237
RPI Spending 220 0,00 35,00 4,0419 4,91780
Actual Spending 110 0,00 26,00 3,5119 4,15764
Valid N (listwise) 110
What can be derived from this table is that among the sample, Customer Satisfaction and
Affective Commitment and are high towards the favorite soft-drink brand of the consumers (mean
above 4). The Net Promoter Score, Trust and Calculative Commitment are moderately high (mean
above 3). The mean for Attitudinal Loyalty is actually quite low (2.36).

MASTER THESIS - Questioning ‘the Ultimate Question’ 2013
34
4.2.2 Soft-drink Purchasing Behavior
The table below provides a descriptive summary of the average weekly soft-drink purchasing
behavior from the 220 respondents that have been questioned.
Table 8: Descriptive Statistics of Respondents' Soft-drink Purchasing Behavior
N Min Max Mean Std. Dev.
How often do you buy soft-drinks* in the supermarket? 220 1 7 4,25 1,560
Please estimate how much you buy soft-drinks in general in liters*** on
average in the supermarket per week 220 0,00 18,00 2,4930 2,78884
Please estimate how much you spend on soft-drinks in general in €uro's on
average in the supermarket per week 220 0,00 35,00 4,6730 4,92900
Please estimate how much you buy from your #1 favorite soft-drink brand in
liters*** on average in the supermarket per week 220 0,00 12,00 1,6133 1,86350
Please estimate how much you spend on your #1 favorite soft-drink brand in
€uro's on average in the supermarket per week 220 0,00 16,00 2,8373 3,22702
Valid N (listwise) 220
When looking at the average weekly purchasing behavior estimated by the respondents, the sample
buys nearly 2.5 liters of soft-drinks per week for approximately € 4.65. The sample buys nearly 1.6
liters of soft-drinks from their favorite brand for € 2.85. The total volume bought by the sample comes
down to nearly 550 liters of soft-drinks. In total, the sample has spent more than a thousand euro’s.
In figure 5 below, the share of the sample’s favorite brands is visualized. Similar to figure 6 on
the next page, the slices of the pie are arranged, in a clockwise manner, according to the ranking by
market shares in the sample and that the legend is organized likewise. It seems that Coca-Cola is by
far the most popular brand. 80 of the 220 respondents reported Coca-Cola as their #1 favorite brand.
Surprisingly, not Pepsi or another Coca-Cola brand is on the second place, but Red Bull. Third is
Fanta. In the graph all brands with less than 1% share in favorite brand are put together under ‘Other’.
Figure 5: Share of #1 most favorite brand among respondents
37%
11%10%
5%4%
4%
2%2%
2%
1%1%1%
20%
Share of #1 favorite brand
Coca Cola
Red Bull
Fanta
Lipton Ice Tea
Coca Cola Light
Coca Cola Zero
Fernandes
Dubbel Frisss
Crystal Clear
Karvan Cevitam
Pepsi
Taksi
Other

MASTER THESIS - Questioning ‘the Ultimate Question’ 2013
35
Looking at figure 6, which shows what brand is purchased most by the respondents, Coca-
Cola is for 35% of the sample the first choice. In addition, the diet versions Coca-Cola Zero and Coca-
Cola Light make it to the top 5 of #1 most purchased brands, as number two and four respectively.
Fanta, which is also a brand owned by The Coca-Cola Company, is the most purchased brand by 7.3%
of the sample, and therefore is ranked third. Red Bull closes the top 5 of most purchased brands. One
other thing to notice is that among the #1 most purchased brands, in contrast with the #1 favorite
brands, private label brands are listed (AH Cola Light, C1000 Cola, and Freeway Cola).
Figure 6: Share of #1 most purchased brand among respondents
4.3 Correlation
4.3.1 Correlation between Satisfaction, Other Relational Variables and NPS
The correlations between the relational factors of Palmatier (2006) should indicate if his
suggestion can also be applied to the dataset of this study. The correlation matrix shows mostly
significant correlations. Attitudinal loyalty shows some insignificance with affective commitment and
customer satisfaction. However, since calculative commitment and trust show a strongly significant
relationship with attitudinal loyalty, a positive relationship hold among most of these relational
factors.
Looking at the NPS, the metric has also significant correlations with other relational variables
and customer satisfaction. According to the data, trust and calculative commitment correlate the most
with the NPS. Apparently, the correlation between NPS and attitudinal loyalty is relatively low.
However, we are more interested in the correlations with behavioral loyalty.
35%
11%
7%7%
7%
5%2%2%1%1%1%1%1%1%
1%1%
15%
Share of #1 most purchased brand
Coca ColaCoca Cola ZeroFantaCoca Cola LightRed BullLipton Ice TeaDubbel FrisssSpa & FruitCrystal ClearAH Cola LightC1000 ColaCoca Cola CherryFanta ZeroFernandesFreeway ColaSprite

MASTER THESIS - Questioning ‘the Ultimate Question’ 2013
36
Table 9: Correlations Among Metrics
Affective
Commitment
Calculative
Commitment
Attitudinal
Loyalty Trust
Customer
Satisfaction NPS
Affective
Commitment
Pearson Correlation 1 ,323** -,063 ,441** ,482** ,348**
Sig. (2-tailed) ,000 ,353 ,000 ,000 ,000
N 220 220 220 220 220 220
Calculative
Commitment
Pearson Correlation ,323** 1 ,290** ,414** ,386** ,405**
Sig. (2-tailed) ,000 ,000 ,000 ,000 ,000
N 220 220 220 220 220 220
Attitudinal
Loyalty
Pearson Correlation -,063 ,290** 1 ,137* ,046 ,216**
Sig. (2-tailed) ,353 ,000 ,042 ,502 ,001
N 220 220 220 220 220 220
Trust Pearson Correlation ,441** ,414** ,137* 1 ,404** ,432**
Sig. (2-tailed) ,000 ,000 ,042 ,000 ,000
N 220 220 220 220 220 220
Customer
Satisfaction
Pearson Correlation ,482** ,386** ,046 ,404** 1 ,230**
Sig. (2-tailed) ,000 ,000 ,502 ,000 ,001
N 220 220 220 220 220 220
NPS Pearson Correlation ,348** ,405** ,216** ,432** ,230** 1
Sig. (2-tailed) ,000 ,000 ,001 ,000 ,001
N 220 220 220 220 220 220
**. Correlation is significant at the 0.01 level (2-tailed).
*. Correlation is significant at the 0.05 level (2-tailed).
4.3.2 Correlation between the Predictor Variables and Behavioral Loyalty
To see whether a positive relationship exists among NPS, customer satisfaction, relational
factors and behavioral loyalty, the correlation is checked between the metrics and the loyalty
indicators. In the Correlations matrix which can be found next page, all significant correlations are
marked green for ease of interpretability. What can be concluded from this matrix is that the
independent variables all have strongly significant correlations with behavioral loyalty intention
(repurchasing likelihood of favorite brand and spending intentions on favorite brand), as these
coefficients are significant at the 0.01 level (indicated by **).
Furthermore, the relationship between the relationships can be derived from the value of the
correlation coefficient. It appears from the data that Trust has by far the largest influence (0.435) on
repurchase intentions, followed by NPS (0.293). Customer satisfaction and calculative commitment
have an equal effect (0.270). Affective commitment (0.189) and attitudinal loyalty (0.217) have a
relatively low effect on repurchasing intention of a favorite soft-drink brand.

MASTER THESIS - Questioning ‘the Ultimate Question’ 2013
37
Table 10: Correlations Predictors-Behavior
Affective
Commitment
Calculative
Commitment
Attitudinal
Loyalty Trust
Customer
Satisfaction NPS
RPI
Likelihood
- Favorite
Pearson Correlation ,189** ,270** ,217** ,435** ,270** ,293**
Sig. (2-tailed) ,005 ,000 ,001 ,000 ,000 ,000
N 220 220 220 220 220 220
Spending
Intention -
Favorite
Pearson Correlation ,232** ,287** ,204** ,327** ,256** ,170*
Sig. (2-tailed) ,001 ,000 ,002 ,000 ,000 ,012
N 220 220 220 220 220 220
Actual
Spending
Pearson Correlation ,088 ,207* ,128 ,274** ,091 ,248**
Sig. (2-tailed) ,360 ,030 ,182 ,004 ,344 ,009
N 110 110 110 110 110 110
**. Correlation is significant at the 0.01 level (2-tailed).
*. Correlation is significant at the 0.05 level (2-tailed).
Looking at Spending Intention, all correlation coefficients seem to be strongly significant (at
0.01 level) as well. Again, Trust has the largest influence, followed by calculative commitment,
customer satisfaction, affective commitment and the relatively low influence of attitudinal loyalty and
NPS. Most of the independent variables – except for attitudinal loyalty and affective commitment –
have a significant relationship with the actual purchasing behavior in the subsequent week. Trust and
NPS are strongly significant at the 0.01 level, calculative commitment is significant at the 0.05 level.
These three predictors also have a quite a large effect. Customer satisfaction, affective commitment
and attitudinal loyalty don’t seem to have a significant relationship with the actual spending behavior
at all. The correlation coefficients are also very low. It is quite a surprise that the relationship between
actual spending behavior and customer satisfaction is insignificant, since many claim satisfaction to be
a major determinant of behavioral loyalty.
In general we may conclude that Trust appears to have the largest effect on behavioral loyalty,
followed by calculative commitment. Relatively, the relationship marketing variables have great
predictive power on behavioral intentions, but to a lesser extent on actual behavioral loyalty. The Net
Promoter Score is overall a good predictor on behavioral loyalty.
4.4 Regression
Multiple regression models are used to estimate the relationship between dependent and
multiple independent variables, known as predictors. In this thesis we have three dependent variables
to measure customer (behavioral) loyalty. These dependent variables are measured as repurchasing

MASTER THESIS - Questioning ‘the Ultimate Question’ 2013
38
likelihood of a customer’s favorite brand, spending intention on a customer’s favorite brand and the
actual spending behavior recorded in the subsequent week. We have set up several regression models
with different predictors to see the influence of Customer Satisfaction, the Net Promoter Score (NPS),
and the relationship marketing dimensions (Customer Satisfaction, Trust, Attitudinal Loyalty,
Affective and Calculative Commitment) on the different dependent variables.
We start off by looking at the effects on predicting repurchase intentions, while in the second
section we look at predicting spending intention, and in the final section we study the effects on
predicting actual spending behavior. To do so, several regression models have been set-up. In the first
model, we only look at the demographic variables (gender, age, education level and household size) as
predictors. In the second model we add the relational factors, to see if this model has better predictive
value. In the third model, we add the NPS to the first model to see if this stand-alone measure can
improve the predictive power. This model is compared to a model including all predictor variables, to
see if the predictive power of the NPS will be improved, or if the NPS as a stand-alone measure will
be a sufficient predictor. Additionally, we compare the predictive power of Customer Satisfaction with
that of the NPS, and a model that integrates both metrics. Finally, we propose a method to improve the
NPS based on our findings.
4.4.1 Predicting Repurchasing Intention
Comparing Relationship Marketing Dimensions and NPS
In table 11 on the next page, the regression coefficients can be found of the different models
on predicting the repurchasing likelihood of the respondent’s favorite soft drink brand. All four
models appear to be significant, however, the extended models (2, 3 and 4) improve the significance in
contrast with the first model. The R square and the adjusted R square indicate how much of the
variance is explained by the model. This determination coefficient shows that the models 2, 3 and 4
significantly explain more variance than model 1. Model 4 seems to explain most of the variance, but
the R square does not improve much on model 2. Looking at the adjusted R square, which includes a
penalty for additional parameters, the model still improves. Model 3 shows that the NPS is a
significant predictor on repurchasing likelihood, however, as a stand-alone measure it explains less

MASTER THESIS - Questioning ‘the Ultimate Question’ 2013
39
than when relational factors and customer satisfaction are included in the model. The results are also
graphically shown at the end of this chapter in figures 10 and 10.
Table 11: Regression Analyses RPI Models 1-4
Y1 RPI Likelihood Favorite Model 1 Model 2 Model 3 Model 4
R square 0,044 0,278 0,143 0,290
Adjusted R square 0,026 0,248 0,123 0,256
F-value 2,487 9,004 7,131 8,528
Sig. F 0,044 0,000 0,000 0,000
X β St. β Sig. β St. β Sig. β St. β Sig. β St. β Sig.
X0 (Constant) 4,687 ,000 1,102 ,197 3,466 ,000 1,245 ,144
X1 Gender ,037 ,015 ,829 ,072 ,028 ,633 ,017 ,007 ,918 ,054 ,021 ,719
X2 Age -,002 -,014 ,839 -,003 -,028 ,651 ,006 ,048 ,481 -,001 -,006 ,918
X3 Education -,324 -,198 ,005 -,378 -,231 ,000 -,354 -,217 ,001 -,390 -,239 ,000
X4 Household Size ,074 ,078 ,249 ,029 ,031 ,612 ,042 ,044 ,494 ,023 ,024 ,688
X5 Affective Commitment - - - -,065 -,032 ,663 - - - -,113 -,055 ,456
X6 Calculative Commitment - - - ,041 ,021 ,772 - - - -,015 -,008 ,916
X7 Attitudinal Loyalty - - - ,185 ,130 ,040 - - - ,158 ,111 ,082
X8 Trust - - - ,704 ,383 ,000 - - - ,643 ,350 ,000
X9 Customer Satisfaction - - - ,241 ,139 ,053 - - - ,253 ,146 ,041
X10 Net Promoter Score - - - - - - ,353 ,323 ,000 ,142 ,130 ,069
In model 1, only the level of education seems to be a significant predictor (p = 0.005). The
negative value of this variable shows a negative relationship, meaning the higher the educational level
of the respondent, the lower the repurchasing likelihood of his/her favorite brand. All other
demographic variables are insignificant.
In the second model, besides the demographic variables, relational factors are included,
improving the significance of the model to p = 0.000 and the adjusted R² to 24.8%. Education,
attitudinal loyalty and trust have significant regression coefficients, with a p-value of 0.000, 0.040, and
0.000 respectively. According to the high value of the unstandardized regression coefficient of trust,
this appears to have a relatively large effect.
In the third model we see that the ultimate question (Reichheld, 2003) is a significant predictor
on repurchasing likelihood. The model is strongly significant (p = 0.000), but the adjusted R² (12.3%)
is almost half of model 2, therefore performs much worse. Education and the NPS are the only
significant parameters with p-values of (0.001 and 0.000 respectively).

MASTER THESIS - Questioning ‘the Ultimate Question’ 2013
40
In the fourth model all predictors are included. The adjusted R² is highest of all four models,
this model explains approximately 25.6% of the variance in repurchasing likelihood. The model is
strongly significant as the p-value = 0.000. It appears that by adding the Net Promoter Score and the
relation factors in the model, customer satisfaction becomes a significant predictor, while attitudinal
loyalty and the NPS itself become insignificant.
Comparing NPS and Customer Satisfaction
In three more models, we compare model 1 to the NPS (model 3), to customer satisfaction
(model 5) and a combination of these models with both the NPS and customer satisfaction integrated
(model 6). The results of these regression models can be found in the table below.
Table 12: Regression Analyses RPI Models 1, 3, 5 & 6
Y1 RPI Likelihood Favorite Model 1 Model 3 Model 5 Model 6
R square 0,044 0,143 0,127 0,192
Adjusted R square 0,026 0,123 0,107 0,169
F-value 2,487 7,131 6,238 8,442
Sig. F 0,044 0,000 0,000 0,000
X β St. β Sig. β St. β Sig. β St. β Sig. β St. β Sig.
X0 (Constant) 4,687 ,000 3,466 ,000 2,850 ,000 2,215 ,003
X1 Gender ,037 ,015 ,829 ,017 ,007 ,918 ,060 ,023 ,716 ,038 ,015 ,811
X2 Age -,002 -,014 ,839 ,006 ,048 ,481 -,003 -,021 ,748 ,004 ,032 ,632
X3 Education -,324 -,198 ,005 -,354 -,217 ,001 -,371 -,227 ,001 -,386 -,237 ,000
X4 Household Size ,074 ,078 ,249 ,042 ,044 ,494 ,064 ,067 ,302 ,039 ,041 ,515
X5 Affective Commitment - - - - - - - - - - - -
X6 Calculative Commitment - - - - - - - - - - - -
X7 Attitudinal Loyalty - - - - - - - - - - - -
X8 Trust - - - - - - - - - - - -
X9 Customer Satisfaction - - - - - - ,503 ,290 ,000 ,398 ,230 ,000
X10 Net Promoter Score - - - ,353 ,323 ,000 - - - ,294 ,269 ,000
All these regression models appear to be strongly significant (p-value = 0,000). Looking at the
determination coefficient (adjusted R square), the NPS (model 3) explains more variance (12.3%)
than customer satisfaction (10.7%). When both metrics are integrated in, 16.9% of the variance is
explained. These models are also included in figures 7 and 9 at the end of this chapter.
Additionally, we want to see how much of the added explained variance is contributed by the
relational dimensions in comparison with customer satisfaction and the NPS. Therefore, we run
another regression analysis of model 2, excluding customer satisfaction. This is compared to model 2,

MASTER THESIS - Questioning ‘the Ultimate Question’ 2013
41
and a new model that includes the NPS instead of customer satisfaction (model 7). Again, the models
without customer satisfaction or NPS instead of satisfaction are strongly significant. The results can be
seen in table 13 below.
Table 13: Regression Analyses RPI Models 1, 2 ex CSAT, 2 & 7
Y1 RPI Likelihood Favorite Model 1 Model 2 ex CSAT Model 2 Model 7
R square 0,044 0,265 0,278 0,275
Adjusted R square 0,026 0,238 0,248 0,244
F-value 2,487 9,528 9,004 8,869
Sig. F 0,044 0,000 0,000 0,000
X β St. β Sig. β St. β Sig. β St. β Sig. β St. β Sig.
X0 (Constant) 4,687 ,000 1,289 ,116 1,102 ,197 1,412 ,085
X1 Gender ,037 ,015 ,829 ,078 ,030 ,611 ,072 ,028 ,633 ,061 ,024 ,688
X2 Age -,002 -,014 ,839 -,002 -,017 ,781 -,003 -,028 ,651 ,000 ,003 ,956
X3 Education -,324 -,198 ,005 -,358 -,220 ,000 -,378 -,231 ,000 -,369 -,226 ,000
X4 Household Size ,074 ,078 ,249 ,028 ,029 ,632 ,029 ,031 ,612 ,022 ,023 ,705
X5 Affective Commitment - - - ,033 ,016 ,814 -,065 -,032 ,663 -,006 -,003 ,964
X6 Calculative Commitment - - - ,101 ,051 ,464 ,041 ,021 ,772 ,052 ,026 ,713
X7 Attitudinal Loyalty - - - ,182 ,128 ,045 ,185 ,130 ,040 ,157 ,110 ,088
X8 Trust - - - ,744 ,405 ,000 ,704 ,383 ,000 ,689 ,375 ,000
X9 Customer Satisfaction - - - - - - ,241 ,139 ,053 - - -
X10 Net Promoter Score - - - - - - - - - ,133 ,122 ,090
From this table we can conclude that the relational factors without customer satisfaction
contribute greatly to the explained variance, increasing the adjusted R square from model 1 with more
than 21%. Comparing model 2 with the edited model 2, it seems that customer satisfaction only
contributes for 1% in the explained variance according to the adjusted R squares from the models. The
regression coefficient of customer satisfaction is insignificant at the 0.05 level. When looking at model
7, where the NPS is added to the relationship marketing variables to replace customer satisfaction, it
seems that the NPS adds less to the explained variance than customer satisfaction.
From this data, it appears that the repurchasing likelihood can best be predicted by an overall
model that integrates the relational factors and the NPS, as it explains most variance. Comparing the
NPS with customer satisfaction shows that NPS outperforms the satisfaction metric. However,
comparing the regression coefficient, it seems that based upon this data, customer satisfaction does
have a larger influence on repurchasing likelihood of one’s favorite soft-drink brand. This is also
shown in table 13, where customer satisfaction was replaced by the NPS, but performed less. In this

MASTER THESIS - Questioning ‘the Ultimate Question’ 2013
42
table we also found that of the three predictors, relational factors performed best on predicting the
intention to repurchase.
4.4.2 Predicting Spending Intentions
Comparing Relationship Marketing Dimensions and NPS
The correlations from paragraph 4.3.2 show a significant relationship between the independent
variables and the spending intention on a respondent’s favorite soft-drink brand. To further analyze
this relationship and estimate the effects of the independent variables on pending intention, a
regression analysis was executed with spending intention as dependent variable. The results can be
found in the table below and figures 7 and 10 at the end of this chapter.
Table 14: Regression Analyses Spending Intention Models 1-4
Y2 Spending Intention Favorite Model 1 Model 2 Model 3 Model 4
R square 0,083 0,250 0,122 0,250
Adjusted R square 0,066 0,218 0,101 0,215
F-value 4,887 7,795 5,936 6,985
Sig. F 0,001 0,000 0,000 0,000
X β St. β Sig. β St. β Sig. β St. β Sig. β St. β Sig.
(Constant) 9,374 ,000 -0,766 ,748 7,279 ,000 -0,799 ,739
X1 Gender -1,185 -,169 ,011 -1,065 -,152 ,013 -1,220 -,174 ,008 -1,060 -,151 ,014
X2 Age -,013 -,040 ,554 -,013 -,040 ,526 -,001 -,002 ,978 -,014 -,042 ,516
X3 Education -1,128 -,252 ,000 -1,209 -,270 ,000 -1,181 -,264 ,000 -1,206 -,269 ,000
X4 Household Size ,018 ,007 ,917 -,081 -,031 ,616 -,037 -,014 ,827 -,079 -,030 ,624
X5 Affective Commitment - - - ,334 ,059 ,426 - - - ,345 ,061 ,419
X6 Calculative Commitment - - - ,421 ,077 ,285 - - - ,434 ,080 ,283
X7 Attitudinal Loyalty - - - ,520 ,133 ,040 - - - ,527 ,134 ,040
X8 Trust - - - 1,101 ,218 ,003 - - - 1,115 ,221 ,003
X9 Customer Satisfaction - - - ,592 ,124 ,088 - - - ,589 ,124 ,091
X10 Net Promoter Score - - - - - - ,605 ,202 ,002 -,033 -,011 ,879
All the regression models are significant, model 2, 3 and 4 improve the significance of the
variance and explanation power of the variance in contrast from model 1. One difference is that of
these four models, model 2 seems to be most explaining variance when we look at the adjusted R².
Therefore, we can already say that the relational marketing factors do increase the explained variance
of spending intention in contrast with the NPS. Model 1 is a significant model with two significant
regression coefficients, gender and education. The model explains just 6.6% of the variance. Model 2
improves the first model by adding relational factors. The adjusted R² increases to 24.8% explained

MASTER THESIS - Questioning ‘the Ultimate Question’ 2013
43
variance on spending intention. Besides gender and education, also attitudinal loyalty and trust are
significant predictors (p-values are 0.013, 0.000, 0.040 and 0.003 respectively). The NPS explains far
less variance (10.1%) on spending intention than the relation factors in the previous model. However,
the model is strongly significant (p = 0.000), and in addition to gender and education, the NPS proves
to be a significant predictor on spending intention. Model 4 does not differ that much from model 2.
The NPS is included, along with the relational and demographic variables, but this does not increase
the explained variance. In fact, the adjusted R square decreases with 0.3%. The NPS itself is not a
significant predictor.
Comparing NPS and Customer Satisfaction
Three more models are compared to see differences in predictive power of the NPS to
customer satisfaction and a combination of the NPS and customer satisfaction. The results of these
regression models can be found in table below. The models are all strongly significant with p-values
of 0.000. Again, we find that model 6, which integrates both the NPS and customer satisfaction,
explains most variance (15.4%). However, one major difference between predicting spending intention
and repurchasing likelihood, is that for spending intention, customer satisfaction appears to be a better
predictor than the NPS as model 5 explains 13.9% of the variance and model 3 only 10.1%.
Table 15: Regression Analyses Spending Intention Models 1, 3, 5 & 6
Y2 Spending Intention Favorite Model 1 Model 3 Model 5 Model 6
R square 0,083 0,122 0,159 0,177
Adjusted R square 0,066 0,101 0,139 0,154
F-value 4,887 5,936 8,070 7,655
Sig. F 0,001 0,000 0,000 0,000
X β St. β Sig. β St. β Sig. β St. β Sig. β St. β Sig.
(Constant) 9,374 ,000 7,279 ,000 4,570 ,026 3,632 ,080
X1 Gender -1,185 -,169 ,011 -1,220 -,174 ,008 -1,126 -,160 ,012 -1,158 -,165 ,009
X2 Age -,013 -,040 ,554 -,001 -,002 ,978 -,015 -,047 ,471 -,006 -,019 ,775
X3 Education -1,128 -,252 ,000 -1,181 -,264 ,000 -1,251 -,279 ,000 -1,275 -,284 ,000
X4 Household Size ,018 ,007 ,917 -,037 -,014 ,827 -,010 -,004 ,953 -,046 -,018 ,780
X5 Affective Commitment - - - - - - - - - - - -
X6 Calculative Commitment - - - - - - - - - - - -
X7 Attitudinal Loyalty - - - - - - - - - - - -
X8 Trust - - - - - - - - - - - -
X9 Customer Satisfaction - - - - - - 1,315 ,276 ,000 1,161 ,244 ,000
X10 Net Promoter Score - - - ,605 ,202 ,002 - - - ,434 ,145 ,029

MASTER THESIS - Questioning ‘the Ultimate Question’ 2013
44
Here too, we want to compare the effects of relationship marketing variables with and without
customer satisfaction to a model integrating the relational variables with NPS instead of satisfaction.
Table 16: Regression Analyses Spending Intention Models 1, 2 ex CSAT, 2 & 7
Y2
Spending Intention
Favorite Model 1 Model 2 ex CSAT Model 2 Model 7
R square 0,083 0,240 0,250 0,240
Adjusted R square 0,066 0,211 0,218 0,208
F-value 4,887 8,326 7,795 7,375
Sig. F 0,001 0,000 0,000 0,000
X β St. β Sig. β St. β Sig. β St. β Sig. β St. β Sig.
X0 (Constant) 9,374 ,000 -1,549 ,497 -0,766 ,748 -1,599 ,486
X1 Gender -1,185 -,169 ,011 -1,051 -,150 ,014 -1,065 -,152 ,013 -1,045 -,149 ,015
X2 Age -,013 -,040 ,554 -,010 -,031 ,630 -,013 -,040 ,526 -,011 -,034 ,604
X3 Education -1,128 -,252 ,000 -1,161 -,259 ,000 -1,209 -,270 ,000 -1,157 -,258 ,000
X4 Household Size ,018 ,007 ,917 -,084 -,032 ,602 -,081 -,031 ,616 -,082 -,031 ,614
X5 Affective Commitment - - - ,576 ,102 ,147 ,334 ,059 ,426 ,593 ,105 ,142
X6 Calculative Commitment - - - ,569 ,105 ,140 ,421 ,077 ,285 ,589 ,108 ,136
X7 Attitudinal Loyalty - - - ,513 ,131 ,043 ,520 ,133 ,040 ,523 ,133 ,043
X8 Trust - - - 1,200 ,238 ,001 1,101 ,218 ,003 1,223 ,242 ,001
X9 Customer Satisfaction - - - - - - ,592 ,124 ,088 - - -
X10 Net Promoter Score - - - - - - - - - -,054 -,018 ,807
We can draw similar conclusions to previous paragraph, stating that relational factors contribute most
to the explained variance. Without customer satisfaction, the relational factors explain 14.5% more
than the base model. Satisfaction increases the explained variance with less than 1%, while the NPS
even decreases the explained variance. Therefore, we can state that the indicators of behavioral loyalty
intentions can best be predicted by a model that integrates the relationship marketing variables with
the NPS and customer satisfaction. Of these three it appeared that the relational marketing dimension
are the best predictors on behavioral intentions.
4.4.3 Predicting Actual (Future) Spending
The actual spending in the subsequent week of 110 respondents from the first survey have
been recorded in a follow-up survey. As derived from the correlation matrix in paragraph 4.3.2, the
independent variables customer satisfaction, calculative commitment, trust and the NPS have a
significant relationship with the actual purchasing behavior. We executed regression models to
estimate this relationship and see the influence of the predictors on actual spending. The results are
summarized in table 17 on the next page.

MASTER THESIS - Questioning ‘the Ultimate Question’ 2013
45
Comparing Relationship Marketing Dimensions and NPS
What can be derived from this table is that none of these regression models are actually
significant at the 0.05 level. Perhaps this is due to the relatively low sample size in the follow-up
survey. Therefore, when a significance level of p < 0.10 is accepted, we can conclude that by adding
the NPS, model 3 is significant, as the p-value is 0.057.
In addition, we find that model 1, has a negative adjusted R square. This indicates that the
model has some useless regressors in the model. Models 2 and 4 are largely insignificant, but also
explain very little variance, since the adjusted R squares are less than 5%. The model with NPS
explains 5.3% of the variance on actual spending according to the adjusted R square. The models have
also been captured in figures 8-10.
Table 17: Regression Analyses Actual Spending Model 1-4
Y3 Actual Spending Model 1 Model 2 Model 3 Model 4
R square 0,021 0,109 0,097 0,130
Adjusted R square -0,016 0,028 0,053 0,042
F-value 0,574 1,353 2,226 1,479
Sig. F 0,682 0,220 0,057 0,158
X β St. β Sig. β St. β Sig. β St. β Sig. β St. β Sig.
(Constant) 3,541 ,368 -2,981 ,575 -0,593 ,883 -2,704 ,609
X1 Gender -,436 -,049 ,619 -,420 -,048 ,627 -,390 -,044 ,645 -,402 -,046 ,640
X2 Age ,038 ,105 ,313 ,040 ,110 ,294 ,058 ,158 ,123 ,050 ,138 ,193
X3 Education -,231 -,037 ,727 -,264 -,042 ,688 -,228 -,037 ,721 -,263 -,042 ,687
X4 Household Size ,167 ,055 ,576 ,078 ,026 ,791 ,156 ,051 ,588 ,095 ,031 ,748
X5 Affective Commitment - - - -,087 -,013 ,912 - - - -,335 -,051 ,674
X6 Calculative Commitment - - - ,706 ,103 ,359 - - - ,550 ,080 ,475
X7 Attitudinal Loyalty - - - ,139 ,030 ,772 - - - ,053 ,011 ,912
X8 Trust - - - 1,428 ,245 ,040 - - - 1,063 ,182 ,143
X9 Customer Satisfaction - - - -,212 -,033 ,777 - - - -,164 -,026 ,825
X10 Net Promoter Score - - - - - - ,999 ,279 ,004 ,644 ,180 ,122
The NPS has a very large significant effect in model 3, as the unstandardized Beta coefficient
is nearly 1 and the p-value is 0.004. Apparently, for actual spending as outcome variable, the relational
factors as predictors are irrelevant and NPS appears to be a far better predictor of actual spending.
Comparing NPS and Customer Satisfaction
The NPS is compared to two more regression models that integrate customer satisfaction and a
combination of the NPS and customer satisfaction to predict actual spending behavior. The results of

MASTER THESIS - Questioning ‘the Ultimate Question’ 2013
46
these regression models can be found in table 18 below. Again, none of these models are significant at
the 0.05 level. It even appears that model with only customer satisfaction is insignificant at 0.10 level.
The negative value of the adjusted R square indicates that model 5 contains terms that do not help to
predict the response.
Table 18: Regression Analyses Actual Spending Models 1, 3, 5 & 6
Y3 Actual Spending Model 1 Model 3 Model 5 Model 6
R square 0,021 0,097 0,031 0,097
Adjusted R square -0,016 0,053 -0,016 0,045
F-value 0,574 2,226 0,655 1,850
Sig. F 0,682 0,057 0,659 0,097
X β St. β Sig. β St. β Sig. β St. β Sig. β St. β Sig.
(Constant) 3,541 ,368 -0,593 ,883 0,726 ,881 -1,258 ,792
X1 Gender -,436 -,049 ,619 -,390 -,044 ,645 -,466 -,053 ,596 -,400 -,045 ,639
X2 Age ,038 ,105 ,313 ,058 ,158 ,123 ,040 ,111 ,290 ,058 ,158 ,125
X3 Education -,231 -,037 ,727 -,228 -,037 ,721 -,180 -,029 ,786 -,215 -,034 ,739
X4 Household Size ,167 ,055 ,576 ,156 ,051 ,588 ,168 ,055 ,573 ,157 ,052 ,588
X5 Affective Commitment - - - - - - - - - - - -
X6 Calculative Commitment - - - - - - - - - - - -
X7 Attitudinal Loyalty - - - - - - - - - - - -
X8 Trust - - - - - - - - - - - -
X9 Customer Satisfaction - - - - - - ,616 ,096 ,325 ,168 ,026 ,789
X10 Net Promoter Score - - - ,999 ,279 ,004 - - - ,974 ,272 ,007
Comparing the adjusted R squares from model 3 and 6, it seems that customer satisfaction
does not add any explained variance of the NPS. The significance of model 6 does just slightly fall
into the 0.10 level, but is much lower than the p-value of model 3. Looking at the regression
coefficients, it seems that the only significant predictor is the Net Promoter Score in model 3 and 6.
An interest finding from this analysis is that, in the case of soft-drinks, customer satisfaction and
relationship marketing dimensions do not contribute to a higher predictive value than the NPS. In
contrast with the behavioral intentions measures repurchasing likelihood and spending intentions,
actual spending behavior can best be predicted by the NPS. Obviously, managers will find it far more
relevant to predict actual spending behavior than predicting intentions.
Improving the predictive power of the NPS on actual spending
Since actual spending seems to have such low significance and determination coefficients,
there must be a way to improve the relationship. In order to better predict actual spending, five more

MASTER THESIS - Questioning ‘the Ultimate Question’ 2013
47
regression models have been set-up. These regression models consist of model 3 (demographics and
NPS), and additionally the Repurchase Intention (RPI) of a favorite brand (model 8), the Spending
intention on a favorite brand (model 9), both RPI and spending intention (model 10) are added
respectively.
Table 19: Regression Analyses Actual Spending Models 1, 8-10
Y3 Actual Spending Model 1 Model 8 Model 9 Model 10
R square 0,021 0,315 0,263 0,353
Adjusted R square -0,016 0,276 0,220 0,308
F-value 0,574 7,909 6,138 7,942
Sig. F 0,682 0,000 0,000 0,000
X β St. β Sig. β St. β Sig. β St. β Sig. β St. β Sig.
(Constant) 3,541 ,368 -2,943 ,409 -2,289 ,535 -3,292 ,345
X1 Gender -,436 -,049 ,619 -,971 -,110 ,195 -,115 -,013 ,881 -,673 -,076 ,365
X2 Age ,038 ,105 ,313 ,028 ,076 ,402 ,046 ,126 ,177 ,029 ,079 ,374
X3 Education -,231 -,037 ,727 -,002 ,000 ,997 ,182 ,029 ,755 ,168 ,027 ,760
X4 Household Size ,167 ,055 ,576 ,159 ,052 ,529 ,136 ,045 ,603 ,147 ,048 ,551
X5 Affective Commitment - - - - - - - - - - - -
X6 Calculative Commitment - - - - - - - - - - - -
X7 Attitudinal Loyalty - - - - - - - - - - - -
X8 Trust - - - - - - - - - - - -
X9 Customer Satisfaction - - - - - - - - - - - -
X10 Net Promoter Score - - - ,191 ,053 ,563 ,636 ,178 ,047 ,193 ,054 ,549
X11 RPI Favorite - - - 1,705 ,526 ,000 - - - ,305 ,237 ,017
X12 RPI Spending Favorite - - - - - - ,550 ,427 ,000 1,276 ,393 ,000
First thing to notice is that by including at least one type of repurchase intention, either
repurchasing likelihood (model 7) or spending intention (model 8), increases the significance of the
regression models dramatically. For all five regression models, the p-value is 0.000. Looking at the
determination coefficient, the adjusted R square, it seems that the repurchasing likelihood (31.5%)
explains more variance than spending intention (26.3%). When both behavioral intention measures are
included in the model (model 9), the explained variance rises to 35.3%.
Furthermore, we tried to optimize this last model by also including customer satisfaction
(model 11), and the other relationship marketing dimensions (model 12), to see if this also increased
the explained variance and could make better prediction. The results are as follow (see table 20 on the
next page):

MASTER THESIS - Questioning ‘the Ultimate Question’ 2013
48
Table 20: Regression Analyses Actual Spending Models 1, 10-12
Y3 Actual Spending Model 1 Model 10 Model 11 Model 12
R square 0,021 0,353 0,367 0,390
Adjusted R square -0,016 0,308 0,316 0,315
F-value 0,574 7,942 7,308 5,176
Sig. F 0,682 0,000 0,000 0,000
X β St. β Sig. β St. β Sig. β St. β Sig. β St. β Sig.
(Constant) 3,541 ,368 -3,292 ,345 -0,212 ,958 0,703 ,877
X1 Gender -,436 -,049 ,619 -,673 -,076 ,365 -,626 -,071 ,396 -,640 -,073 ,389
X2 Age ,038 ,105 ,313 ,029 ,079 ,374 ,027 ,074 ,403 ,033 ,091 ,311
X3 Education -,231 -,037 ,727 ,168 ,027 ,760 ,133 ,021 ,808 ,279 ,045 ,618
X4 Household Size ,167 ,055 ,576 ,147 ,048 ,551 ,142 ,047 ,561 ,097 ,032 ,698
X5 Affective Commitment - - - - - - - - - -,392 -,059 ,565
X6 Calculative Commitment - - - - - - - - - ,399 ,058 ,541
X7 Attitudinal Loyalty - - - - - - - - - -,807 -,172 ,062
X8 Trust - - - - - - - - - -,054 -,009 ,932
X9 Customer Satisfaction - - - - - - -,821 -,128 ,140 -,845 -,132 ,188
X10 Net Promoter Score - - - ,193 ,054 ,549 ,267 ,075 ,410 ,354 ,099 ,330
X11 RPI Favorite - - - ,305 ,237 ,017 1,325 ,408 ,000 1,429 ,440 ,000
X12 RPI Spending Favorite - - - 1,276 ,393 ,000 ,340 ,264 ,009 ,391 ,303 ,004
When customer satisfaction and the other relationship marketing dimensions are added to
model 10, the explained variance increases to 36.7% and 39% respectively. This is also captured in
figure 8, that graphically shows models 10-12 predict best. From these models we find actual spending
behavior can best be predicted by behavioral intentions. A measure of the repurchasing likelihood
outperforms all other predictors. When the behavioral intentions measures are included in a model
with customer satisfaction and the NPS, this will increase the explained variance from actual spending.
4.5 Conclusion
In this chapter the findings from analysis of the data have been presented. The results showed
significant correlations between the predictors (customer satisfaction, affective and calculative
commitment, trust, attitudinal loyalty, the net promoter score) and the predicted (repurchase intentions,
spending intention and actual spending). However, for actual spending the affective commitment and
attitudinal loyalty did not have significant correlations. In general, we can conclude that these items
can predict the outcome variables. Regression analyses showed that in the case of repurchase intention
and spending intention, customer satisfaction alone and in combination with other relational factors
increase the explained variance of the models with Net Promoter Score.

MASTER THESIS - Questioning ‘the Ultimate Question’ 2013
49
For the actual spending as an outcome variable, none of the regression models are significant
at the 0.05 level. However, if we look at the 0.10 level, the regression model which includes only the
Net Promoter Score in addition to the demographic variables, is significant (p = 0.057). Interestingly,
this model shows that for actual spending, the conclusions are different than for repurchase and
spending intentions, as NPS alone can be a sufficient indicator, and neither customer satisfaction nor
relational marketing variables improve the model, where for the repurchasing and spending intentions,
the relational marketing variables did improve the model. The NPS regression model on actual
spending can be improved by including measures of behavioral intent.
In the table below an overview of the models and included predictor variables, plus their
adjusted R squares on the dependent variables can be found, to be used as a legend for the figures on
the next page. On the next page the results of the several models are visualized, based on the
determination coefficient, the adjusted R square.
Table 21: Model Description (Variables included and Adjusted R squares)
NPS CSAT Other RM RPI SPI RPI SPI ACTUAL
Model 2 ex CSAT
24% 21%
Model 2
25% 22% 3%
Model 3
12% 10% 5%
Model 4
26% 22% 4%
Model 5
11% 14% -2%
Model 6
17% 15% 5%
Model 7
24% 21%
Model 8
28%
Model 9
22%
Model 10
31%
Model 11
32%
Model 12
32%

MASTER THESIS - Questioning ‘the Ultimate Question’ 2013
50
Figure 7: Predictive Power on Behavioral
Intention
Figure 8: Predictive power on Actual Spending
* Note: The models appear in order of appearance on the X-
axis, because there is no x-value for this scatter plot.
Figure 9: Predictive Power on Actual Spending
/RPI
Figure 10: Predictive Power on Actual Spending
/ Intention
Model 2
ex CSAT
Model 2
Model 3
Model 4
Model 5Model 6
Model 7
0%
5%
10%
15%
20%
25%
0% 10% 20% 30%
Ad
just
ed R
² S
pen
din
g I
nte
nti
on
Adjusted R² RPI Likelihood
Predictive Power on Behavioral
Intentions
Model 2
ex CSAT
Model 2
Model 3
Model 4
Model 5
Model 8
Model 9
Model 10
Model 11
Model 12
-5%
0%
5%
10%
15%
20%
25%
30%
35%
Ad
just
ed R
² A
ctu
al S
pen
din
g
Predictive Power on Actual Spending
Model 6
Model 2Model 3
Model 4
Model 5-2%
-1%
0%
1%
2%
3%
4%
5%
6%
0% 10% 20% 30%Ad
just
ed R
² A
ctu
al S
pen
din
g
Adjusted R² RPI Likelihood
Predictive Power on Actual Spending
/ RPI
Model 6
Model 2
Model 3 Model 4
Model 5-2%
-1%
0%
1%
2%
3%
4%
5%
0% 5% 10% 15% 20% 25%
Ad
just
ed R
² A
ctu
al S
pen
din
g
Adjusted R² Spending Intention
Predictive Power on Actual Spending
/ Intention

MASTER THESIS - Questioning ‘the Ultimate Question’ 2013
51
5 Conclusion
This final chapter consists of conclusions drawn from the research, which will be discussed in
paragraph 5.1 to answer the research questions defined in the introduction of this thesis. In paragraph
5.2 the academic contribution of this thesis will be discussed. The managerial implications of the
findings from this research will be discussed in paragraph 5.3. In the final paragraph, 5.4, the
limitations encountered in this research will be discussed along with directions for future research on
this topic.
5.1 General Discussion
Following from the results of the analysis of the data, several conclusions can be drawn.
5.1.1 What Customer Metric Best Predicts Behavioral Loyalty?
At first, correlations showed that Reichheld’s (2003) Net Promoter Score (NPS) has a strong
significant relationship with behavioral loyalty. The same can be said for customer satisfaction and the
additional relationship marketing variables, trust, commitment, attitudinal loyalty (Palmatier et al.
2006), which showed a strong significant relation with behavioral loyalty intentions. For actual
behavioral loyalty (spending behavior) the relational factors affective commitment and attitudinal
loyalty showed these did not have a significant relationship.
To estimate the relationships between these predictors and behavioral loyalty through the different
outcome variables (repurchasing likelihood, spending intention and actual spending), multiple
regression analyses were executed and showed some interesting results.
When looking at the behavioral loyalty intentions (repurchasing likelihood and spending intention), it
appeared that the NPS increased the explained variance when it was added to a model of standard
demographic variables (gender, age, education and household size). Customer satisfaction, and
Palmatier’s (2006) relationship marketing variables even further increased the explained variance of
the regression models.
However, when looking at the actual behavioral loyalty indicator (the recorded amount spent on soft-
drinks in the subsequent week), the results are in contrast with the regression results on behavioral

MASTER THESIS - Questioning ‘the Ultimate Question’ 2013
52
intentions. Based on the actual spending behavior, results show that the NPS is a good predictor, but
customer satisfaction and the relationship marketing variables do not at all predict well. An interest
finding from this last analysis is that, in the case of soft-drinks, customer satisfaction and relationship
marketing dimensions do not contribute to a higher predictive value than the NPS. In contrast with
repurchase and spending intentions, actual spending behavior can best be predicted by the NPS.
5.1.2 Questioning ‘the Ultimate Question’
From analysis of the data we have seen that the ultimate question, the Net Promoter Score, overall is a
good indicator of behavioral loyalty, which is also found by Wiesel et al. (2012). Something that is
very interesting, is that from the analysis appeared that the NPS is the best indicator of actual
behavioral loyalty, while behavioral intentions were better predicted by improved models that also
included relationship marketing variables. However, due to the very low significance value and
determination coefficient, we looked in our data to see if we could improve the NPS model, and found
that measures of behaviorally intentions were far better predictors of actual spending behavior than the
NPS, satisfaction and relationship marketing variables. This is in consistency with findings from De
Cannière, De Pelsmacker, and Geusens (2010), who find that purchase intentions significantly
predicted actual buying behavior.
5.1.3 The Influence of Relationship Marketing Dimensions
As the correlation and regression analyses have pointed out, the relationship marketing dimensions by
Palmatier et al. (2006), consisting of trust, commitment, attitudinal loyalty and customer satisfaction,
do have a certain influence in predicting behavioral intentions. The regression analyses showed that
when predicting behavioral intentions (the repurchasing likelihood of a favorite soft-drink brand and
the spending intention towards a favorite soft-drink brand) were best predicted by regression models
which included the relationship marketing variables. However, when predicting actual spending
behavior, the data suggested that the relational factors did not increase the predictive power of the
NPS.

MASTER THESIS - Questioning ‘the Ultimate Question’ 2013
53
5.2 Academic Contribution
While most research has studied the effects of customer metrics based on loyalty in service industries,
such as banking, cellular phone, insurance, credit cards etc., this study is one of few based on FMCG
making a contribution to the cross-industry analysis of this topic.
As described in the literature review, there has been many controversy over the Net Promoter Score.
The single-item measure has been subject of a rather heated debate among professionals and
academics. Because of its simplicity, the metric has become very popular and adopted by many
prominent firms in various industries. However, as many critics disprove the relationship between the
NPS and firm growth, or the statements made by Reichheld that NPS predicts better than Customer
Satisfaction and other loyalty measures, this thesis has provided additional evidence based on the soft-
drink industry. The findings in this thesis suggest that the NPS does outperform customer satisfaction
when predicting actual sales data. On contrary to Reichheld’s statements (see paragraph 2.4), the NPS
model can be improved by adding behavioral intentions measures such as repurchasing likelihood in a
prediction model.
5.3 Managerial Implications
As many managers have already adopted the NPS to measure their firm’s performance and many
academics criticize, this thesis provides an end to the uncertainty of using the NPS for this assessment.
Many researchers have already claimed it is unwise to use only a single-item measure to assess firm
performance, as this is clearly an unreliable indicator. The managerial implication of this thesis is that
we showed that based on the behavioral intentions, NPS is not the best predictor, while based on
actual behavior, NPS performs much better than customer satisfaction and additional relational factors.
However, we have shown that the NPS as a predictor still can be improved by including behavioral
intention measures to predict actual behavior.
5.4 Limitations and Directions for Future Research
Some limitations were encountered during this research. Further research could improve or disprove
these findings if the data is cross-industry, cross-cultural and longitudinal. The time scope of the

MASTER THESIS - Questioning ‘the Ultimate Question’ 2013
54
research was limited. Respondents were asked to report their actual spending on soft-drinks one week
after they finished the first survey. To get more reliable and valid data, and to lessen the bias in this
dataset, the respondents should be followed for some longer time to truly measure loyalty. As for
example, Keiningham et al. (2007) used cross-industry longitudinal data which has been collected
from a panel for over two years.
In addition, only 50% of the respondents who participated in the first survey, reported their actual
purchasing behavior in the follow-up survey in the consecutive week. This could be a reason why the
correlation and regression analyses on actual spending turned out to be not significant at the 0.05 level.
However, further research could confirm or disprove this reasoning.
Another limitation is that the actual purchase behavior was measured only by customer’s own
estimates, which could potentially create some bias. To reduce this bias the research could be
optimized by using actual panel scanner data.
For going deeper into the discussion of ACSI vs. NPS future research should include the three
measurement constructs of the American Customer Satisfaction Index (Fornell, 1992), while in this
research a single-item construct obtaining overall customer satisfaction is used, similar to Cronin and
Taylor’s research (1992).
Another point for further research is to analyze the differences for the respondents who show low and
high loyalty. De Cannière, De Pelsmacker, and Geusens (2010), studied the moderating role of
relationship strength on the link between perceived relationship quality, purchase intention and
behavior, and found differences between strong loyal customers and weak loyal customers.
Specifically, a better relationship quality leads to stronger repurchase intention for customers with
weaker relations with the retailer, whereas a stronger intention led to more purchase behavior for
customers with a stronger relation with the retailer (De Cannière, De Pelsmacker, and Geusens, 2010).

MASTER THESIS - Questioning ‘the Ultimate Question’ 2013
55
Appendix
A. Reference List ................................................................................................................................... 56
B. Questionnaire .................................................................................................................................... 61
C. Follow-up Questionnaire .................................................................................................................. 69
E. Factor Analysis Output ..................................................................................................................... 72
F. Descriptives ....................................................................................................................................... 73

MASTER THESIS - Questioning ‘the Ultimate Question’ 2013
56
A. Reference List
Aaker, D. A., & Keller, K. L. (1990). Consumer evaluations of brand extensions. The Journal of
Marketing, 27-41.
Aaker, D. A. (1992). The value of brand equity. Journal of business strategy,13(4), 27-32.
Abarajithan, W., & Ragel, V. (2011). The Study of Customer Switching Behaviour Toward
Carbonated Soft Drink Market. Available at SSRN 1951780.
Ambler, T. (2003). Marketing and the Bottom Line: The Marketing Metrics that Will Pump Up Cash
Flow. Pearson Education.
Ambler, T., & Roberts, J. (2006). Beware the silver metric: Marketing performance measurement has
to be multidimensional. Marketing.
Ambler, T., & Roberts, J. H. (2008). Assessing marketing performance: don't settle for a silver
metric. Journal of Marketing Management, 24(7-8), 733-750.
Anderson, E. W., Fornell, C., & Lehmann, D. R. (1994). Customer satisfaction, market share, and
profitability: findings from Sweden. The Journal of Marketing, 53-66.
Anderson, E. W., Fornell, C., & Mazvancheryl, S. K. (2004). Customer satisfaction and shareholder
value. Journal of Marketing, 172-185.
Assael, H. (1987). Consumer behavior and marketing action (Vol. 3). Boston;: Kent Publishing
Company.
Atilgan, E., Aksoy, S., & Akinci, S. (2005). Determinants of the brand equity: a verification approach
in the beverage industry in Turkey. Marketing intelligence & planning, 23(3), 237-248.
Bandyopadhyay, S., & Martell, M. (2007). Does attitudinal loyalty influence behavioral loyalty? A
theoretical and empirical study. Journal of Retailing and Consumer Services, 14(1), 35-44.
Barnard, N. R., & Ehrenberg, A. S. (1990). Robust measures of consumer brand beliefs. Journal of
Marketing Research, 477-484.
Barwise, P., & Farley, J. U. (2004). Marketing Metrics:: Status of Six Metrics in Five
Countries. European Management Journal, 22(3), 257-262.
Berry, L. L. (1993). Playing fair in retailing. Arthur Anderson Retailing Issues Newsletter, 5(2).
Bert, V. (2011) "105 what is your generic term for a weetened carbonated beverage?" Harvard Dialect
Survey, Retrieved 6/3/2013.
Bharadwaj, S. G., Varadarajan, P. R., & Fahy, J. (1993). Sustainable competitive advantage in service
industries: a conceptual model and research propositions. The Journal of Marketing, 83-99.
Bird, M., & Ehrenberg, A. S. (1966). Intentions-to-buy and claimed brand usage. OR, 27-46.
Bloemer, J., De Ruyter, K. O., & Wetzels, M. (1999). Linking perceived service quality and service
loyalty: a multi-dimensional perspective. European Journal of Marketing, 33(11/12), 1082-1106.
Cannière, M. H., De, Pelsmacker, P., De & Geuens, M. (2009). Relationship quality and the theory of
planned behavior models of behavioral intentions and purchase behavior. Journal of Business
Research, 62(1), 82-92.
Cannière, M. H., De, Pelsmacker, P., De & Geuens, M. (2010). Relationship quality and purchase
intention and behavior: the moderating impact of relationship strength. Journal of Business and
Psychology, 25(1), 87-98.

MASTER THESIS - Questioning ‘the Ultimate Question’ 2013
57
Carpenter, J. M. (2008). Consumer shopping value, satisfaction and loyalty in discount
retailing. Journal of Retailing and Consumer Services, 15(5), 358-363.
CBS - Cijfers. (2013, April 5). Retrieved June 28, 2013, from http://www.cbs.nl/nl-
NL/menu/cijfers/default.htm
Chaudhuri, A., & Holbrook, M. B. (2001). The chain of effects from brand trust and brand affect to
brand performance: the role of brand loyalty. The Journal of Marketing, 81-93.
Chaudhuri, A., & Holbrook, M. B. (2002). Product-class effects on brand commitment and brand
outcomes: The role of brand trust and brand affect. The Journal of Brand Management, 10(1), 33-58.
Cheng, S. I. (2011). Comparisons of competing models between attitudinal loyalty and behavioral
loyalty. International Journal of Business and Social Science, 2(10), 149-166.
Cronin Jr, J. J., & Taylor, S. A. (1992). Measuring service quality: a reexamination and extension. The
journal of marketing, 55-68.
Dick, A. S., & Basu, K. (1994). Customer loyalty: toward an integrated conceptual
framework. Journal of the academy of marketing science, 22(2), 99-113.
Dwyer, F. R., Schurr, P. H., & Oh, S. (1987). Developing buyer-seller relationships. The Journal of
marketing, 11-27.
East, R., Gendall, P., Hammond, K., & Lomax, W. (2005). Consumer loyalty: singular, additive or
interactive?. Australasian Marketing Journal (AMJ), 13(2), 10-26.
Ehrenberg, A. S. C. (1968). The elements of lawlike relationships. Journal of the Royal Statistical
Society. Series A (General), 280-302.
Eshghi, A., Haughton, D., & Topi, H. (2007). Determinants of customer loyalty in the wireless
telecommunications industry. Telecommunications policy, 31(2), 93-106.
Farris, P. W., Bendle, N. T., Pfeifer, P. E., & Reibstein, D. J. (2010). Marketing metrics: The definitive
guide to measuring marketing performance. Pearson Education.
Fornell, C. (1992). A national customer satisfaction barometer: the Swedish experience. the Journal of
Marketing, 6-21.
Fornell, C., Johnson, M. D., Anderson, E. W., Cha, J., & Bryant, B. E. (1996). The American
customer satisfaction index: nature, purpose, and findings. The Journal of Marketing, 7-18.
Fornell, C., Mithas, S., Morgeson III, F. V., & Krishnan, M. S. (2006). Customer satisfaction and
stock prices: high returns, low risk. Journal of marketing, 3-14.
Fullerton, G. (2005). How commitment both enables and undermines marketing
relationships. European Journal of Marketing, 39(11/12), 1372-1388.
Ganesh, J., Arnold, M. J., & Reynolds, K. E. (2000). Understanding the customer base of service
providers: an examination of the differences between switchers and stayers. The Journal of Marketing,
65-87.
Garbarino, E., & Johnson, M. S. (1999). The different roles of satisfaction, trust, and commitment in
customer relationships. the Journal of Marketing, 70-87.
Gruca, T. S., & Rego, L. L. (2005). Customer satisfaction, cash flow, and shareholder value. Journal
of Marketing, 115-130.
Gundlach, G. T., Achrol, R. S., & Mentzer, J. T. (1995). The structure of commitment in
exchange. The Journal of Marketing, 78-92.
Gupta, S., Lehmann, D., & Ames Stuart, J. (2004). Valuing customers. Journal of marketing research,
7-18.

MASTER THESIS - Questioning ‘the Ultimate Question’ 2013
58
Gupta, S., & Lehmann, D. R. (2006). Customer lifetime value and firm valuation. Journal of
Relationship Marketing, 5(2-3), 87-110.
Gupta, S. (2009). Customer-based valuation. Journal of Interactive Marketing,23(2), 169-178.
Gustafsson, A., Johnson, M. D., & Roos, I. (2005). The effects of customer satisfaction, relationship
commitment dimensions, and triggers on customer retention. Journal of marketing, 210-218.
Hair Jr, J. F., Black, W. C., Babin, B. J., & Anderson, R. E., 2009. Multivariate data analysis.
Hayes, B. E., & Intuit, T. (2008). Customer loyalty 2.0. Quirk’s Marketing Research Review, 57.
Hemelrijk, L., & Het geheim van Coca-cola, GRONIEK JAARGANG 30 (1996-1997).
Hill, N., Roche, G., & Allen, R. (2007). Customer satisfaction: The customer experience through the
customer's eyes. The Leadership Factor.
Interbrand (2012). Best Global Brands 2012. Retrieved June 26, 2013 from
http://www.interbrand.com/en/best-global-brands/2012/Best-Global-Brands-2012-Brand-View.aspx.
Jacoby, J., & Kyner, D. B. (1973). Brand loyalty vs. repeat purchasing behavior.Journal of Marketing
research, 1-9.
Jones, T. O., & Sasser, W. E. (1995). Why satisfied customers defect. Harvard business review, 73(6),
88.
Jones, T., & Taylor, S. F. (2007). The conceptual domain of service loyalty: how many
dimensions?. Journal of Services Marketing, 21(1), 36-51.
Keiningham, T. L., Cooil, B., Aksoy, L., Andreassen, T. W., & Weiner, J. (2007). The value of
different customer satisfaction and loyalty metrics in predicting customer retention, recommendation,
and share-of-wallet. Managing Service Quality, 17(4), 361-384.
Keiningham, T. L., Cooil, B., Andreassen, T. W., & Aksoy, L. (2007). A longitudinal examination of
net promoter and firm revenue growth. Journal of Marketing, 39-51.
Keiningham, T. L., Aksoy, L., Cooil, B., & Andreassen, T. W. (2012). Linking customer loyalty to
growth. Obtenido el, 1.
Keller, K. L. (1993). Conceptualizing, measuring, and managing customer-based brand equity. The
Journal of Marketing, 1-22.
Kotler, P., & Keller, K. (1956). L. 2009. Marketing management, 13.
Kotler, P. J., & Armstrong, G. M. (2010). Principles of marketing. Pearson Education.
Kumar, V., Shah, D., & Venkatesan, R. (2006). Managing retailer profitability—one customer at a
time!. Journal of Retailing, 82(4), 277-294.
Lai, F., Griffin, M., & Babin, B. J. (2009). How quality, value, image, and satisfaction create loyalty at
a Chinese telecom. Journal of Business Research, 62(10), 980-986.
Lam, S. Y., Shankar, V., Erramilli, M. K., & Murthy, B. (2004). Customer value, satisfaction, loyalty,
and switching costs: an illustration from a business-to-business service context. Journal of the
Academy of Marketing Science, 32(3), 293-311.
Lee, M., & Cunningham, L. F. (2001). A cost/benefit approach to understanding service
loyalty. Journal of services Marketing, 15(2), 113-130.
Louis, J. C., & Yazijian, H. (1980). The cola wars. Everest House.
McGregor, J. (2006). Would you recommend us?. Business Week, 30, 94.

MASTER THESIS - Questioning ‘the Ultimate Question’ 2013
59
Mise, J. K., Nair, C., Odhiambo Odera, P., & Ogutu, M. (2013). Comparative Study on Brand Loyalty
in Kenya and India Consumer Softdrinks Markets. Global Journal of Management And Business
Research, 13(3).
Moorman, C., Deshpande, R., & Zaltman, G. (1993). Factors affecting trust in market research
relationships. The Journal of Marketing, 81-101.
Morgan, R. M., & Hunt, S. D. (1994). The commitment-trust theory of relationship marketing. the
journal of marketing, 20-38.0
Morgan, N. A., & Rego, L. L. (2006). The value of different customer satisfaction and loyalty metrics
in predicting business performance. Marketing Science,25(5), 426-439.
Muniz, A. M., & Hamer, L. O. (2001). Us versus them: Oppositional brand loyalty and the cola
wars. Advances in consumer research, 28, 355-361.
Neal, W. D. (1999). Satisfaction is Nice, But Value Drives Loyalty: The most satisfied customer may
not necessarily be the most loyal. Marketing research,11, 21-24.
Oliver, R. L. (1999). Whence consumer loyalty?. the Journal of Marketing, 33-44.
Ostrowski, P. L., O'Brien, T. V., & Gordon, G. L. (1993). Service quality and customer loyalty in the
commercial airline industry. Journal of Travel Research,32(2), 16-24.
Palmatier, R. W., Dant, R. P., Grewal, D., & Evans, K. R. (2006). Factors influencing the
effectiveness of relationship marketing: a meta-analysis. Journal of marketing, 136-153.
Pauwels, K., Ambler, T., Clark, B. H., LaPointe, P., Reibstein, D., Skiera, B., & Wiesel, T. (2009).
Dashboards as a Service Why, What, How, and What Research Is Needed?. Journal of Service
Research, 12(2), 175-189.
Pritchard, M. P., Havitz, M. E., & Howard, D. R. (1999). Analyzing the commitment-loyalty link in
service contexts. Journal of the Academy of Marketing Science, 27(3), 333-348.
Reichheld, F. F. (1996). Learning from customer defections. Harvard Business Review, 74(2), 56.
Reichheld, F. F. (2003). The one number you need to grow. Harvard business review, 81(12), 46-55.
Reichheld, F. F. (2006). The Ultimate Question: For Unlocking the Door to Good Profits and True
Growth. Harvard Business School Press.
Reichheld, F.F. (2006). The ultimate question. Harvard Business School Press, Boston, MA.
Reichheld, F. (2006). The microeconomics of customer relationships. MIT Sloan Management
Review, 47(2), 73.
Reynolds, K. E., & Beatty, S. E. (1999). Customer benefits and company consequences of customer-
salesperson relationships in retailing. Journal of Retailing, 75(1), 11-32.
Rizley, R. (n.d.). 2008–2010 Guide to MSI Research Programs and Procedures. MSI Research
Priorities. Retrieved from http://www.msi.org/research/index.cfm?id=43
Roest, H. C. A., & Hulsen, M. (2008). Loyale klanten: Hebben is hebben maar houden de
kunst. Jaarboek MarktOnderzoekAssociate 2008: Ontwikkelingen in het Marktonderzoek, 129-150.
Russell-Bennett, R., McColl-Kennedy, J. R., & Coote, L. V. (2007). Involvement, satisfaction, and
brand loyalty in a small business services setting. Journal of Business Research, 60(12), 1253-1260.
Schneider, D., Berent, M., Thomas, R., Interactive, H., & Krosnick, J. (2008). Measuring Customer
Satisfaction and Loyalty: Improving the ‘Net-Promoter’Score.

MASTER THESIS - Questioning ‘the Ultimate Question’ 2013
60
Seggie, S. H., Cavusgil, E., & Phelan, S. E. (2007). Measurement of return on marketing investment: a
conceptual framework and the future of marketing metrics. Industrial Marketing Management, 36(6),
834-841.
Szymanski, D. M., Bharadwaj, S. G., & Varadarajan, P. R. (1993). An analysis of the market share-
profitability relationship. The Journal of Marketing, 1-18.
Terrill, C., Middlebrooks, A., & American Marketing Association. (2000). Market leadership
strategies for service companies: creating growth, profits, and customer loyalty. NTC Business
Books.
Thurm, S. (2006). One Question, and Plenty of Debate. Wall Street Journal.
Tobin, J. (1969). A general equilibrium approach to monetary theory. Journal of money, credit and
banking, 1(1), 15-29.
Ulas, D., & Arslan, H. B. (2006). An empirical investigation of Turkish cola market. British Food
Journal, 108(3), 156-168.
Wiesel, T., Verhoef, P. C., & Haan, de, E. (2012, July 11). There Is No Single Best Measure of Your
Customers - Harvard Business Review [Web log post]. Retrieved March 11, 2013 from
http://blogs.hbr.org/cs/2012/07/there_is_no_one_best_measure_o.html
Zeithaml, V. A., Berry, L. L., & Parasuraman, A. (1996). The behavioral consequences of service
quality. The Journal of Marketing, 31-46.
Zikmund William, G. (1984). Business research methods. Thomson Learning.

MASTER THESIS - Questioning ‘the Ultimate Question’ 2013
61
B. Questionnaire
Consumer Behavior in the Soft-Drink market
Dear visitor,
Thank you for your interest in my survey. I am a Master student at the Erasmus University Rotterdam
and I am conducting research on consumer behavior in the soft-drinks category at the supermarket.
Please read the instructions carefully before entering the survey.
I will start by asking you some questions regarding your attitude towards your favorite soft-drink
brand and about soft-drink purchasing behavior. Next, I ask you some general questions about
yourself. Most questions are based on rating scales with 5 possible answers. Please read the questions
and answers options carefully and choose the option that best describes your answer.
Once you complete this survey – which will take you approximately 10 minutes - you have answered
95% of all questions. I would like to ask you to please answer the remaining 5% after a week (the
second survey will take you no more than 1-2 minutes). Therefore I ask you to please provide me with
your correct e-mail address at the end of this survey so that I can send you an invitation for the follow-
up survey.
I appreciate and thank you very much for answering the questions in this survey honestly and to the
best of your ability. The information collected will be kept strictly confidential and will not be printed
or published in any form that would identify any individual. If you have any questions or comments
regarding this survey, feel free to send me an e-mail: [email protected]
Kind regards,
Yarco Hoddenbach
Get started and continue to the next page by clicking >>If you want to change answers, you can go
back to the previous page by clicking <<

MASTER THESIS - Questioning ‘the Ultimate Question’ 2013
62
Q1 How often do you buy soft-drinks* in the supermarket?
Note:*Soft-drinks are defined as carbonated, non-alcoholic beverages such as cola, lemon-lime,
orange, lemonade, tonic, but also sports- and energy drinks.
o Never (1)
o Less than Once a Month (2)
o Once a Month (3)
o 2-3 Times a Month (4)
o Once a Week (5)
o 2-3 Times a Week (6)
o Daily (7)
Q2 Which soft-drink brands** do you buy more often in the supermarket?
Note: Please indicate your most frequently purchased soft-drinks brand starting from 1. You can
indicate up to 5 brands. If you buy less than 5 brands, you can leave the additional items empty, if you
buy more than 5 brands, just rank your top 5.
** The most popular brands are Coca Cola, Fanta, Sprite, Pepsi, Sisi, 7up, Red Bull, but also the Light
and Zero versions are considered to be distinctive brands. Please write down the full brand name, for
example Coca Cola Light. If you consider private label brands as your favorite, please write down the
full brand name represented on the bottle, for example: AH Cola Light.
______ #1 most frequently purchased brand: (1)
______ #2 most frequently purchased brand: (2)
______ #3 most frequently purchased brand: (3)
______ #4 most frequently purchased brand: (4)
______ #5 most frequently purchased brand: (5)
Q3 What are your favorite soft-drink brands? Note: Please indicate your favorite brands in order with
your most favorite at 1. You can indicate up to 5 brands. If you have less than 5 favorites, you can
leave the additional items empty, if you have more than 5 favorites, just rank your top 5.Please write
down the full brand name with extension.
______ #1 favorite brand: (1)
______ #2 favorite brand: (2)
______ #3 favorite brand: (3)
______ #4 favorite brand: (4)
______ #5 favorite brand: (5)
Q4 For how many years has your #1 favorite brand been your favorite?

MASTER THESIS - Questioning ‘the Ultimate Question’ 2013
63
Note: Please give your answer in numbers in whole years.
Q5 Please estimate how much you buy soft-drinks in general in liters*** on average in the
supermarket per week:
Note: If you do not buy any soft-drinks, please enter 0 below. If you buy less than 1 liter per week,
please indicate the adequate proportion considering that a month has 4 weeks (e.g. if you buy 1 liter
per month, you should indicate 0.25 liters per week).
*** Recall that a 'regular' soft-drink bottle at the supermarket usually contains 1,5 liters, and a can
contains 0,33 liters (so a 6-pack contains approximately 2 liters).
Q6 Please estimate how much you spend on soft-drinks in general in €uro's on average in the
supermarket per week:
Note: If you do not buy any soft-drinks, please enter 0 below. If you spend less than 1 €uro per week,
please indicate the adequate proportion considering that a month has 4 weeks (e.g. if you spend 1 €uro
per month, you should indicate 0.25 €uro per week).
Q7 Please estimate how much you buy from your #1 favorite soft-drink brand in liters*** on average
in the supermarket per week:
Q8 Please estimate how much you spend on your #1 favorite soft-drink brand in €uro's on average in
the supermarket per week:
Q9 When was the last time you bought the following items in the supermarket?
Less than
a week
ago (1)
More than
a week,
less than 2
weeks ago
(2)
More than
2 weeks,
less than 3
weeks ago
(3)
More than
3 weeks,
less than a
month ago
(4)
More than
a month
ago (5)
Never (6)
Soft-drinks in general (1)
Your #1 favorite brand (2)
Your #2 favorite brand (3)
Soft-drinks from a private label (4)
Soft-drinks from a non-favorite, non-
private label brand (5)
Q10 Out of the 10 last purchases of soft-drinks in the supermarket, please estimate how much you
have bought from your #1 and #2 favorite brand, private label brand, and other brands.

MASTER THESIS - Questioning ‘the Ultimate Question’ 2013
64
Note: Please assign an estimated percentage to the brands, so that the total sums 100%.
______ Your #1 favorite brand (1)
______ Your #2 favorite brand (2)
______ Soft-drinks from a private label (3)
______ Soft-drinks from a non-favorite, non-private label brand (4)
Q11 To what extent do you agree with the following statement?
Strongly
Disagree
(1)
Disagree
(2)
Neither
Agree nor
Disagree
(3)
Agree (4) Strongly
Agree (5)
Overall I am completely satisfied with
my favorite soft-drinks brand (1)
Q12 Please answer the following question by indicating the likelihood according to the 5-point scale
Very
Unlikely
(1)
Unlikely
(2)
Undecided
(3) Likely (4)
Very
Likely (5)
How likely is it that you will
recommend your most favorite soft-
drink brand to a friend or a colleague?
(1)
Q13 To what extent do you agree with the following statements?
Strongly
Disagree
(1)
Disagree
(2)
Neither
Agree nor
Disagree
(3)
Agree (4) Strongly
Agree (5)
My favorite soft-drinks brand always
meets expectations (8)
My favorite soft-drinks brand can be
counted on to provide good quality (9)
My favorite soft-drinks brand is
reliable (10)
Q14 To what extent do you agree with the following statements?

MASTER THESIS - Questioning ‘the Ultimate Question’ 2013
65
Strongly
Disagree
(1)
Disagree
(2)
Neither
Agree nor
Disagree
(3)
Agree (4) Strongly
Agree (5)
I am happy to be a customer of my
favorite soft-drinks brand (11)
My favorite soft-drinks brand is the
soft-drinks brand that takes the best
care of its customers (12)
I have feelings of trust toward the
company (14)
It pays off economically to be a
customer of my favorite soft-drinks
brand (15)
I would suffer economically if the
relationship were broken with my
favorite soft-drinks brand (16)
Strongly
Disagree
(1)
Disagree
(2)
Neither
Agree nor
Disagree
(3)
Agree (4) Strongly
Agree (5)
I believe that my favorite soft-drinks
brand is preferable to any other soft-
drinks brand (2)
I believe that my favorite soft-drinks
brand has the best offer (3)
I prefer the quality of my favorite
soft-drinks brand to the quality of
competitors (4)
I have repeatedly found my favorite
soft-drinks brand better than others
(5)
I am a loyal customer of my favorite
soft-drinks brand (6)
I consider my favorite soft-drinks
brand my first choice for soft-drinks
purchases (7)
Q16 Please answer the following questions by indicating the likelihood according to the 5-point scale
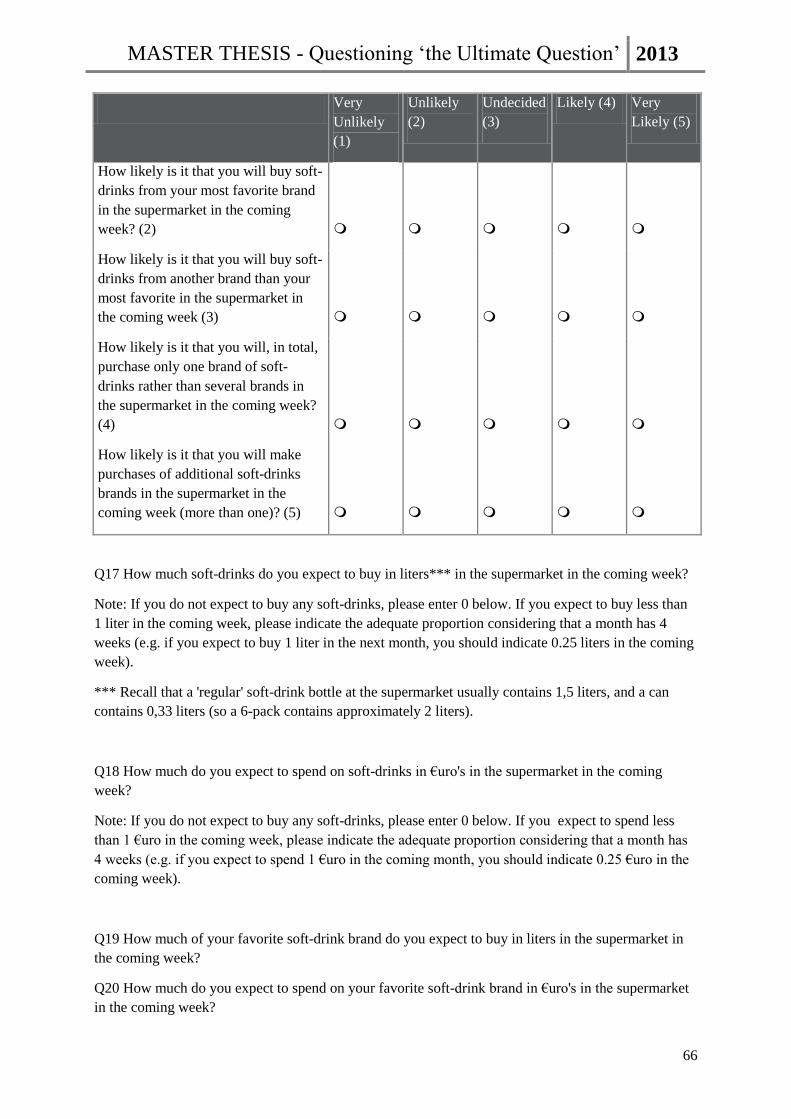
MASTER THESIS - Questioning ‘the Ultimate Question’ 2013
66
Very
Unlikely
(1)
Unlikely
(2)
Undecided
(3)
Likely (4) Very
Likely (5)
How likely is it that you will buy soft-
drinks from your most favorite brand
in the supermarket in the coming
week? (2)
How likely is it that you will buy soft-
drinks from another brand than your
most favorite in the supermarket in
the coming week (3)
How likely is it that you will, in total,
purchase only one brand of soft-
drinks rather than several brands in
the supermarket in the coming week?
(4)
How likely is it that you will make
purchases of additional soft-drinks
brands in the supermarket in the
coming week (more than one)? (5)
Q17 How much soft-drinks do you expect to buy in liters*** in the supermarket in the coming week?
Note: If you do not expect to buy any soft-drinks, please enter 0 below. If you expect to buy less than
1 liter in the coming week, please indicate the adequate proportion considering that a month has 4
weeks (e.g. if you expect to buy 1 liter in the next month, you should indicate 0.25 liters in the coming
week).
*** Recall that a 'regular' soft-drink bottle at the supermarket usually contains 1,5 liters, and a can
contains 0,33 liters (so a 6-pack contains approximately 2 liters).
Q18 How much do you expect to spend on soft-drinks in €uro's in the supermarket in the coming
week?
Note: If you do not expect to buy any soft-drinks, please enter 0 below. If you expect to spend less
than 1 €uro in the coming week, please indicate the adequate proportion considering that a month has
4 weeks (e.g. if you expect to spend 1 €uro in the coming month, you should indicate 0.25 €uro in the
coming week).
Q19 How much of your favorite soft-drink brand do you expect to buy in liters in the supermarket in
the coming week?
Q20 How much do you expect to spend on your favorite soft-drink brand in €uro's in the supermarket
in the coming week?

MASTER THESIS - Questioning ‘the Ultimate Question’ 2013
67
Q21 Assuming you will purchase only one brand of soft-drinks in the supermarket in the coming
week, what is the probability that it will be one of the following?
Note: Please assign an estimated percentage to the brands, so that the total sums 100%.
______ Your #1 favorite brand (1)
______ Your #2 favorite brand (2)
______ Soft-drinks from a private label (3)
______ Soft-drinks from a non-favorite, non-private label brand (4)
You’re almost done with the survey. The following are five simple questions about yourself to
complete this questionnaire.
Q22 Please indicate your gender
o Male (1)
o Female (2)
Q23 Please indicate your age
Q24 Please indicate your level of education
o Primary school (1)
o Secondary school (2)
o Intermediate vocational education (MBO) (3)
o Higher professional education (HBO) (4)
o University (WO) (5)
Q24 Please indicate your household size
o 1 (1)
o 2 (2)
o 3 (3)
o 4 (4)
o 5 or more (5)
Q25 Please indicate your e-mail address

MASTER THESIS - Questioning ‘the Ultimate Question’ 2013
68

MASTER THESIS - Questioning ‘the Ultimate Question’ 2013
69
C. Follow-up Questionnaire Follow-up Survey Soft-drinks
Dear visitor,
Welcome back and thank you for taking the time to complete your participation via this follow-up
survey. It has been about a week since you filled in the last survey. This follow-up survey is really
short and consists of only a few questions to measure how much soft-drinks you have actually
purchased in the last week.
For your information: soft-drinks are defined as carbonated, non-alcoholic beverages such as cola,
lemon-lime, orange, lemonade, tonic, but also sports- and energy drinks. The most popular brands are
Coca Cola, Fanta, Sprite, Pepsi, Sisi, 7up, Red Bull, but also the Light and Zero versions are
considered to be distinctive brands. So keep in mind, if asked, to write down the full brand name, for
example Coca Cola Light. If you buy private label brands, or consider this as your favorite, please
write down the name represented on the bottle, for example: AH Cola Light.
Your participation is very much appreciated. Any questions or comments regarding this survey, feel
free to contact me via e-mail: [email protected]
Kind regards,
Yarco Hoddenbach

MASTER THESIS - Questioning ‘the Ultimate Question’ 2013
70
Q1 What are your favorite soft-drink brands? Please indicate your favorite brands in order with your
most favorite at 1.
You can indicate up to 5 brands. If you have less than 5 favorites, you can leave the additional items
empty, if you have more than 5 favorites, just rank your top 5.
Please write down the full brand name with extension.
______ #1 favorite brand: (1)
______ #2 favorite brand: (2)
______ #3 favorite brand: (3)
______ #4 favorite brand: (4)
______ #5 favorite brand: (5)
Q2 Which soft-drinks brands did you buy most often at the supermarket in the last week?
Please indicate your most frequently purchased soft-drinks brand of the last week starting from 1. You
can indicate up to 5 brands. If you have bought less than 5 brands, you can leave the additional items
empty, if you have bought more than 5 brands, just rank your top 5.Please write down the full brand
name with extension.
______ #1 most purchased brand: (1)
______ #2 most purchased brand: (2)
______ #3 most purchased brand: (3)
______ #4 most purchased brand: (4)
______ #5 most purchased brand: (5)
Q3 Consider one 'regular' soft-drink bottle at the supermarket contains 1,5 liters, and a can contains
0,33 liters (so a 6-pack contains approximately 2 liters).
Please estimate how much soft-drinks in general you have bought in liters in the supermarket last
week:
If you did not buy any soft-drinks, please enter 0 below.
Q4 Please estimate how much you have spent on soft-drinks in general in €uro's in the supermarket
last week:
If you did not buy any soft-drinks, please enter 0 below.
Q5 Consider one 'regular' soft-drink bottle at the supermarket contains 1,5 liters, and a can contains
0,33 liters (so a 6-pack contains approximately 2 liters).

MASTER THESIS - Questioning ‘the Ultimate Question’ 2013
71
Please estimate how much you have bought from your favorite soft-drink brand in liters in the
supermarket last week:
If you did not buy any soft-drinks, please enter 0 below.
Q6 Please estimate how much you have spent on your favorite soft-drink brand in general in €uro's in
the supermarket last week:
If you did not buy any soft-drinks, please enter 0 below.
Q7 Of all your purchases of soft-drinks in the last week, how much did you buy of the following
items?
Please give your estimates to the brands in %, so that the total sums up to 100%.
______ Your #1 favorite brand (1)
______ Your #2 favorite brand (2)
______ Soft-drinks from a private label (3)
______ Soft-drinks from a non-favorite, non-private label brand (4)

MASTER THESIS - Questioning ‘the Ultimate Question’ 2013
72
E. Factor Analysis Output
Table A1: Total Variance Explained
Component
Initial Eigenvalues Extraction Sums of Squared Loadings Rotation Sums of Squared Loadings
Total
% of
Variance
Cumulative
% Total
% of
Variance
Cumulative
% Total
% of
Variance
Cumulative
%
1 4,811 34,362 34,362 4,811 34,362 34,362 3,317 23,690 23,690
2 2,005 14,323 48,685 2,005 14,323 48,685 2,460 17,571 41,261
3 1,442 10,301 58,986 1,442 10,301 58,986 1,756 12,544 53,805
4 1,004 7,170 66,156 1,004 7,170 66,156 1,729 12,352 66,156
5 ,772 5,513 71,669
6 ,659 4,707 76,376
7 ,613 4,378 80,755
8 ,552 3,943 84,697
9 ,505 3,607 88,305
10 ,416 2,970 91,275
11 ,384 2,742 94,017
12 ,339 2,420 96,437
13 ,269 1,920 98,357
14 ,230 1,643 100,000
Extraction Method: Principal Component Analysis.
Figure A1: Scree Plot

MASTER THESIS - Questioning ‘the Ultimate Question’ 2013
73
F. Descriptives
Table A2: Descriptive Statistics First Questionnaire
N Min Max Mean Std. Dev
How often do you buy soft-drinks* in the supermarket? 220 1 7 4,25 1,560
For how many years has your #1 favorite brand been your favorite? 220 0 60 9,96 9,133
Please estimate how much you buy soft-drinks in general in liters*** on average in the supermarket per week 220 0,00 18,00 2,4930 2,78884
Please estimate how much you spend on soft-drinks in general in €uro's on average in the supermarket per week 220 0,00 35,00 4,6730 4,92900
Please estimate how much you buy from your #1 favorite soft-drink brand in liters*** on average in the
supermarket per week 220 0,00 12,00 1,6133 1,86350
Please estimate how much you spend on your #1 favorite soft-drink brand in in €uro's on average in the
supermarket per week 220 0,00 16,00 2,8373 3,22702
When was the last time you bought the following items in the supermarket?-Soft-drinks in general 220 1 6 1,95 1,448
When was the last time you bought the following items in the supermarket?-Your #1 favorite brand 220 1 6 2,25 1,568
When was the last time you bought the following items in the supermarket?-Your #2 favorite brand 220 1 6 3,02 1,742
When was the last time you bought the following items in the supermarket?-Soft-drinks from a private label 220 1 6 3,90 1,832
When was the last time you bought the following items in the supermarket?-Soft-drinks from a non-favorite,
non-private label brand 220 1 6 4,51 1,615
Out of the 10 last purchases of soft-drinks in the supermarket, please estimate how much you have bought of -
Your #1 favorite brand 220 0,00 100,00 56,9318 27,24202
Out of the 10 last purchases of soft-drinks in the supermarket, please estimate how much you have bought of -
Your #2 favorite brand 220 0,00 100,00 25,1409 19,32191
Out of the 10 last purchases of soft-drinks in the supermarket, please estimate how much you have bought of -
Soft-drinks from a private label 220 0,00 100,00 9,8182 15,56291
Out of the 10 last purchases of soft-drinks in the supermarket, please estimate how much you have bought of -
Soft-drinks from a non-favorite, non-private label brand 220 0,00 100,00 7,2909 17,94657
Overall I am completely satisfied with my favorite soft-drinks brand 220 1 5 4,09 ,713
How likely is it that you will recommend your most favorite soft-drink brand to a friend or a colleague? 220 1 5 3,54 1,132
My favorite soft-drinks brand always meets expectations 220 2 5 4,09 ,639
My favorite soft-drinks brand can be counted on to provide good quality 220 1 5 4,16 ,660
My favorite soft-drinks brand is reliable 220 1 5 3,99 ,755
I am happy to be a customer of my favorite soft-drinks brand 220 1 5 3,75 ,799
My favorite soft-drinks brand is the soft-drinks brand that takes the best care of its customers 220 1 5 3,22 ,763
I have feelings of trust toward the company 220 1 5 3,38 ,875
It pays off economically to be a customer of my favorite soft-drinks brand 220 1 5 2,63 1,001
I would suffer economically if the relationship were broken with my favorite soft-drinks brand 220 1 5 2,06 1,003
I believe that my favorite soft-drinks brand is preferable to any other soft-drinks brand 220 1 5 3,70 ,872
I believe that my favorite soft-drinks brand has the best offer 220 1 5 3,19 ,930
I prefer the quality of my favorite soft-drinks brand to the quality of competitors 220 1 5 3,90 ,818
I have repeatedly found my favorite soft-drinks brand better than others 220 2 5 3,92 ,784
I am a loyal customer of my favorite soft-drinks brand 220 1 5 3,60 1,017
I consider my favorite soft-drinks brand my first choice for soft-drinks purchases 220 1 5 3,83 ,869
How likely is it that you will buy soft-drinks from your most favorite brand in the supermarket in the coming
week? 220 1 5 3,51 1,237
How likely is it that you will buy soft-drinks from another brand than your most favorite in the supermarket in
the coming week 220 1 5 2,60 1,188
How likely is it that you will, in total, purchase only one brand of soft-drinks rather than several brands in the
supermarket in the coming week? 220 1 5 3,00 1,190
How likely is it that you will make purchases of additional soft-drinks brands in the supermarket in the coming
week (more than one)? 220 1 5 2,62 1,118
How much soft-drinks do you expect to buy in liters*** in the supermarket in the coming week? 220 0,00 18,00 2,3149 2,81244
How much do you expect to spend on soft-drinks in €uro's in the supermarket in the coming week? 220 0,00 35,00 4,0419 4,91780
How much of your favorite soft-drink brand do you expect to buy in liters in the supermarket in the coming
week? 220 0,00 50,00 1,8035 3,82717

MASTER THESIS - Questioning ‘the Ultimate Question’ 2013
74
How much do you expect to spend on your favorite soft-drink brand in €uro's in the supermarket in the coming
week? 220 0,00 25,00 2,6741 3,39618
Assuming you will purchase only one brand of soft-drinks in the supermarket in the coming week, what is the
probability that it will be-Your #1 favorite brand 220 0,00 100,00 67,9455 31,54553
Assuming you will purchase only one brand of soft-drinks in the supermarket in the coming week, what is the
probability that it will be -Your #2 favorite brand 220 0,00 100,00 19,6000 23,21655
Assuming you will purchase only one brand of soft-drinks in the supermarket in the coming week, what is the
probability that it will be -Soft-drinks from a private label 220 0,00 100,00 6,9318 15,90755
Assuming you will purchase only one brand of soft-drinks in the supermarket in the coming week, what is the
probability that it will be -Soft-drinks from a non-favorite, non-private label brand 220 0,00 100,00 5,5227 18,51334
Please indicate your gender 220 1 2 1,37 ,483
Please indicate your age 220 18 69 29,10 10,551
Please indicate your level of education 220 1 5 4,20 ,758
Please indicate your household size 220 1 5 2,48 1,294
Valid N (listwise) 220
Table A3: Descriptive Statistics Follow-up Questionnaire
N Min Max Mean Std. Dev
How much soft-drinks did you buy in general at the supermarket in the last week? 110 0,00 16,00 2,5891 3,16719
How much did you spend on soft-drinks in general at the supermarket in the last week? 110 0,00 70,00 4,2237 7,70379
How much did you buy of each of the previously mentioned brands** at the supermarket in the last week-#1
most purchased brand 110 0,00 25,00 2,1380 3,39909
How much did you buy of each of the previously mentioned brands** at the supermarket in the last week-#2
most purchased brand 36 0,00 15,00 1,7128 2,40302
How much did you buy of each of the previously mentioned brands** at the supermarket in the last week-#3
most purchased brand 27 0,00 2,00 ,9652 ,59786
How much did you buy of each of the previously mentioned brands** at the supermarket in the last week-#4
most purchased brand 11 0,00 1,50 ,7955 ,57899
How much did you buy of each of the previously mentioned brands** at the supermarket in the last week-#5
most purchased brand 6 0,00 1,50 ,3883 ,58380
How much did you spend on each of the previously mentioned brands** at the supermarket in the last week-
#1 most purchased brand 110 0,00 35,00 2,7499 4,47393
How much did you spend on each of the previously mentioned brands** at the supermarket in the last week-
#2 most purchased brand 39 0,00 15,00 1,9782 2,37420
How much did you spend on each of the previously mentioned brands** at the supermarket in the last week-
#3 most purchased brand 27 0,00 6,00 1,3389 1,11099
How much did you spend on each of the previously mentioned brands** at the supermarket in the last week-
#4 most purchased brand 12 0,00 2,00 ,8283 ,73688
How much did you spend on each of the previously mentioned brands** at the supermarket in the last week-
#5 most purchased brand 5 0,00 1,50 ,8000 ,75829
Valid N (listwise) 5