questionable billing for medicare outpatient therapy services (oei
TRANSCRIPT

Department of Health and Human Services
OFFICE OF INSPECTOR GENERAL
QUESTIONABLE BILLING FOR
MEDICARE OUTPATIENT
THERAPY SERVICES
Daniel R. Levinson Inspector General
December 2010
OEI-04-09-00540
E X E C U T I V E S U M M A R Y
OBJECTIVE
To identify questionable billing for Medicare outpatient therapy services in 2009.
BACKGROUND Outpatient therapy is designed to improve, restore, and/or compensate for loss of functioning following illness or injury. Medicare expenditures for outpatient therapy increased 133 percent between 2000 and 2009, from $2.1 billion to $4.9 billion, while the number of Medicare beneficiaries receiving outpatient therapy increased only 26 percent, from 3.6 million to 4.5 million.
Medicare limits (i.e., caps) its annual per-beneficiary outpatient therapy expenditures. Providers may exceed a beneficiary’s cap if the services are medically necessary and are supported by medical record documentation. If services are expected to exceed an annual cap, providers must indicate this when submitting the claim to Medicare.
We identified 20 counties that had in 2009 (1) the highest average Medicare payment per beneficiary and (2) more than $1 million in total Medicare payments for outpatient therapy (i.e., high-utilization counties). We analyzed Miami-Dade County, Florida, separately because it had the highest average Medicare payments per beneficiary among the high-utilization counties and the highest total Medicare payments for outpatient therapy in 2009. Additionally, prior Office of Inspector General work has demonstrated that Miami-Dade County is a high-risk area for Medicare fraud.
We then determined the extent to which levels of outpatient therapy billing characteristics in the 20 high-utilization counties differed from national levels. These included the following six questionable billing characteristics that may indicate fraud: (1) services for which providers indicated that an annual cap would be exceeded, (2) beneficiaries whose providers indicated that an annual therapy cap would be exceeded on the beneficiaries’ first date of service, (3) payments for beneficiaries who received outpatient therapy from multiple providers, (4) payments for therapy services provided throughout the year, (5) payments for services that exceeded an annual cap, and (6) providers who were paid for more than 8 hours of outpatient therapy provided in a single day. We did not assess the medical necessity of outpatient therapy services.
i O E I - 0 4 - 0 9 - 0 0 5 4 0 Q U E S T I O N A B L E B I L L I N G F O R M E D I C A R E O U T P A T I E N T T H E R A P Y S E R V I C E S

E X E C U T I V E S U M M A R Y
FINDINGS Medicare per-beneficiary spending on outpatient therapy services in Miami-Dade County was three times the national average in 2009. Medicare paid an average of $3,459 per Miami-Dade beneficiary for outpatient therapy, compared to an average of $1,078 nationally. Each therapy beneficiary in Miami-Dade County received an average of 158 services during 2009, while the national average was 49 services per beneficiary. Medicare also paid therapy providers that served Miami-Dade beneficiaries an average of $83,867, eight times the average amount it paid providers that served beneficiaries in other counties nationally ($10,131). Providers that served Miami-Dade beneficiaries provided an average of 3,828 outpatient therapy services, eight times the average number of services by providers that served beneficiaries in other counties nationally (458).
Miami-Dade County had at least three times the national levels for five of the six questionable billing characteristics in Medicare outpatient therapy services. Five of the six questionable billing characteristics occurred in Miami-Dade County at three to four times the national levels. Specifically, (1) providers serving beneficiaries in Miami-Dade County indicated that outpatient therapy services would exceed an annual cap four times as often as providers nationally, (2) providers serving Miami-Dade beneficiaries indicated on claims that an annual cap would be exceeded on the beneficiaries’ first date of service four times as often as providers nationally, (3) the average Medicare payment for Miami-Dade beneficiaries who received outpatient therapy from multiple providers was three times the national average, (4) Miami-Dade beneficiaries were three times as likely to receive outpatient therapy throughout the year as beneficiaries nationally, and (5) Miami-Dade beneficiaries were three times as likely to exceed an annual cap as beneficiaries nationally.
Medicare per-beneficiary spending on outpatient therapy in the other high-utilization counties was 72 percent greater than the national average; these counties also exhibited questionable billing but to a lesser extent than Miami-Dade County. Medicare paid an average of $1,852 per beneficiary in 19 other high-utilization counties, 72 percent greater than the national average of $1,078. Additionally, as a group, these counties had at least twice the national level for five of the six questionable billing characteristics in Medicare outpatient
ii O E I - 0 4 - 0 9 - 0 0 5 4 0 Q U E S T I O N A B L E B I L L I N G F O R M E D I C A R E O U T P A T I E N T T H E R A P Y S E R V I C E S

E X E C U T I V E S U M M A R Y
therapy services we reviewed. Further, each of these counties had at least twice the national level for 1 or more of the 6 characteristics.
RECOMMENDATIONS We found that high-utilization counties had high levels of per-beneficiary spending and questionable billing characteristics compared to national levels. Our findings demonstrate that outpatient therapy services in Miami-Dade County, as well as 19 other high-utilization counties nationwide, warrant additional review as part of ongoing Medicare antifraud activities.
We recommend that the Centers for Medicare & Medicaid Services (CMS):
Target outpatient therapy claims in high-utilization areas for further review. CMS should monitor utilization trends and use this information to target providers in geographic areas that may be susceptible to fraud.
Target outpatient therapy claims with questionable billing characteristics for further review. CMS should use the questionable billing characteristics we identified to analyze and monitor claims data to detect and deter fraud and abuse.
Review geographic areas and providers with questionable billing and take appropriate action based on results. Prior to payment, CMS should review claims submitted by providers with high levels of questionable billing and in geographic areas with high utilization to ensure that they are legitimate. If CMS determines that fraudulent claims have been submitted, it should take steps to suspend payments to these providers and recover overpayments to them.
Revise the current therapy cap exception process. We found that providers in high-utilization counties used the KX modifier and exceeded annual therapy caps at levels much higher than the national average. The current therapy cap exception process does not ensure appropriate utilization of Medicare outpatient therapy services. CMS should consider developing per-beneficiary edits and maximum payment amounts to control overutilization of outpatient therapy services.
iii O E I - 0 4 - 0 9 - 0 0 5 4 0 Q U E S T I O N A B L E B I L L I N G F O R M E D I C A R E O U T P A T I E N T T H E R A P Y S E R V I C E S

O E I - 0 4 - 0 9 - 0 0 5 4 0 Q U E S T I O N A B L E B I L L I N G F O R M E D I C A R E O U T P A T I E N T T H E R A P Y S E R V I C E S iv
E X E C U T I V E S U M M A R Y
AGENCY COMMENTS AND OFFICE OF INSPECTOR GENERAL RESPONSE In its written comments on this report, CMS concurred with all four of our recommendations and described actions it would take to address them. We support CMS’s efforts to address these issues and encourage it to continue making progress in these areas. We did not make changes to the report based on CMS’s comments.

T A B L E O F C O N T E N T S
E X E C U T I V E S U M M A R Y . . . . . . . . . . . . . . . . . . . . . . . . . . . . . . . . . . . . . i
I N T R C 1 O D U T I O N . . . . . . . . . . . . . . . . . . . . . . . . . . . . . . . . . . . . . . . . . . .
F I N D I N G S . . . . . . . . . . . . . . . . . . . . . . . . . . . . . . . . . . . . . . . . . . . . . . . . 12
Medicare per-beneficiary spending on outpatient therapy services in Miami-Dade County was three times the national
average in 2009 . . . . . . . . . . . . . . . . . . . . . . . . . . . . . . . . . . . . . . . 12
Miami-Dade County had at least three times the national levels for five of the six questionable billing characteristics in Medicare
outpatient therapy services . . . . . . . . . . . . . . . . . . . . . . . . . . . . . . 14
Medicare per-beneficiary spending on outpatient therapy
services in the other high-utilization counties was 72 percent greater than the national average; these counties also exhibited questionable billing but to a lesser extent than Miami-Dade
County . . . . . . . . . . . . . . . . . . . . . . . . . . . . . . . . . . . . . . . . . . . . . . . 16
R E C O M M E N D A T I O N S . . . . . . . . . . . . . . . . . . . . . . . . . . . . . . . . . . . . . 19
Agency Comments and Inspector General Response. . . . . . . . . . . 20
A P P E N D I X E S . . . . . . . . . . . . . . . . . . . . . . . . . . . . . . . . . . . . . . . . . . . . . 22
A: HCPCS Codes for Medicare Outpatient Therapy Services, Fee Schedule Amounts, and Medicare Payments, 2009 . . . . . . 22
B: Questionable Billing Characteristic for 20 High-Utilization Counties, Compared to National Levels. . . . . . . . . . . . . . . . . . 24
C: A gency Comments . . . . . . . . . . . . . . . . . . . . . . . . . . . . . . . . . . . 25
A C K N O W L E D G M E N T S . . . . . . . . . . . . . . . . . . . . . . . . . . . . . . . . . . . . 28

I N T R O D U C T I O N I N T R O D U C T I O N I N T R O D U C T I O N
OBJECTIVE OBJECTIVE To identify questionable billing for Medicare outpatient therapy services in 2009.
BACKGROUND Outpatient therapy is designed to improve, restore, and/or compensate for loss of functioning following illness or injury. Medicare expenditures for outpatient therapy increased 133 percent between 2000 and 2009, from $2.1 billion to $4.9 billion, while the number of Medicare beneficiaries receiving outpatient therapy increased only 26 percent, from 3.6 million to 4.5 million.1, 2, 3
Medicare beneficiaries are eligible to receive outpatient therapy under Medicare Part B. Medicare covers three types of outpatient therapy:
physical therapy (PT): diagnosis and treatment of impairments, functional limitations, disabilities, or changes in physical function and health status;4
occupational therapy (OT): treatment to improve or restore functions that have been impaired (or permanently lost or reduced) because of illness or injury, to improve the individual’s ability to perform tasks required for independent functioning;5 and
speech language pathology (SLP): diagnosis and treatment of speech and language disorders, that result in communication disabilities or swallowing disorders.6
PT services account for the majority of Medicare payments for outpatient therapy. In 2009, PT services represented approximately 74 percent ($3.6 billion) of Medicare expenditures for outpatient therapy
1 Computer Sciences Corporation (CSC), CY 2006 Outpatient Therapy Services
Utilization Report, February 2008. Accessed at http://www.cms.hhs.gov/TherapyServices/downloads/2_CY2006OutpatientTherapyUtilizationReport_PDF_Final.pdf on June 17, 2009.
2 Office of Inspector General (OIG) analysis of Centers for Medicare & Medicaid Services (CMS) claims data, April 2010. The percentage increase is based on unrounded figures.
3 “Expenditures” describes the amount paid by Medicare after the Part B coinsurance. This represents approximately 80 percent of the amount allowed by Medicare.
4 CMS, Medicare Benefit Policy Manual, Pub. No. 100-02, ch. 15, § 230.1. 5 Ibid., § 230.2. 6 Ibid., § 230.3.
1 O E I - 0 4 - 0 9 - 0 0 5 4 0 Q U E S T I O N A B L E B I L L I N G F O R M E D I C A R E O U T P A T I E N T T H E R A P Y S E R V I C E S

I N T R O D U C T I O N
services.7 OT services accounted for 19 percent ($945 million) and SLP services accounted for 7 percent ($328 million) of all Medicare expenditures for outpatient therapy.8
Each type of outpatient therapy service must be provided in accordance with a written plan of care established by an appropriate medical professional, such as a physician or physical therapist.9 The service must be appropriate for the beneficiary’s condition and reasonable in terms of frequency and duration under accepted standards of practice. Further, outpatient therapy must be provided to improve a beneficiary’s functioning level.10 Therefore, Medicare does not typically cover services provided to maintain a beneficiary’s existing level of functioning.11
Outpatient therapy may be provided in a variety of settings. In addition to covering services provided in physicians’ and therapists’ offices, Medicare covers outpatient therapy provided by hospitals, skilled nursing facilities, outpatient rehabilitation facilities, comprehensive outpatient rehabilitation facilities, and home health agencies.12
Medicare Payment for Outpatient Therapy Services
Medicare pays for most outpatient therapy services according to the Medicare Physician Fee Schedule (fee schedule).13 Medicare reimburses the provider 80 percent of either the fee schedule amount or the actual
2
7 OIG analysis of CMS claims data, April 2010. 8 Ibid. 9 42 CFR § 410.61(a) and (b). See also 42 CFR § 410.59(a)(2), § 410.60(a)(2), and
§ 410.62(a)(2). 10 CMS, Medicare Benefit Policy Manual, Pub. No. 100-02, ch. 15, § 220.2.
11 CMS, Medicare Benefit Policy Manual, Pub. No. 100-02, ch. 15, § 220.2.D. The services of a therapy provider are not necessary to carry out maintenance treatment and are not covered under ordinary circumstances. However, if the patient’s safety is at risk and the functional maintenance services involve complex and sophisticated therapy procedures, the judgment and skill of a therapist may be necessary for the safe and effective delivery of such services.
12 CMS, Medicare Claims Processing Manual, Pub. No. 100-04, ch. 5, § 10. Accessed at http://www.cms.hhs.gov/manuals/downloads/clm104c05.pdf on June 17, 2009. Hospitals may provide outpatient therapy to outpatients and to inpatients when they are not covered under Part A. Skilled nursing facilities may provide outpatient therapy to residents and nonresidents when they are not covered under Part A. Home health agencies may provide outpatient therapy only to individuals who are not homebound or are not receiving services under home health plans of care. For beneficiaries who are under home health plans of care, Medicare pays for rehabilitation therapy services provided by home health agencies at the home health prospective payment system rate.
13 Ibid. Applies to all settings except Critical Access Hospitals, which are paid on a reasonable cost basis.
O E I - 0 4 - 0 9 - 0 0 5 4 0 Q U E S T I O N A B L E B I L L I N G F O R M E D I C A R E O U T P A T I E N T T H E R A P Y S E R V I C E S

I N T R O D U C T I O N
charge (whichever is lower), and the beneficiary is responsible for the remaining 20 percent.14
3
10) the
All outpatient therapy services are reported to Medicare using Healthcare Common Procedure Coding System (HCPCS) codes.15 In 2009, Medicare covered outpatient therapy under 75 HCPCS codes. Some of the services billed using these codes are considered outpatient therapy services only when billed by a therapist.16 To indicate that the claim is for outpatient therapy, a provider must add a modifier to the code on the claim.17 The modifier also indicates whether the service was PT, OT, or SLP.18 The 2009 fee schedule amounts for these services ranged from $5.05 for hot- or cold-pack therapy (HCPCS 970and infrared therapy (HCPCS 97026) to $182.86 for a test involving beneficiary’s vocal cords (HCPCS 92616).19 Appendix A provides a list of the 75 HCPCS codes, the associated fee schedule amounts, and total Medicare payments in 2009.
Medicare reimburses providers at different rates based on the setting in which the service is provided. Physicians and therapists in private practice who serve beneficiaries in their offices may be paid at the nonfacility rate, which includes additional reimbursement for some services to account for additional overhead expenses.20
Medicare per-beneficiary payment limits. Medicare limits (i.e., caps) its annual per-beneficiary outpatient therapy services expenditures unless the services are furnished by or under arrangement with a hospital. The Balanced Budget Act of 1997 added the caps as a way to control increasing therapy costs.21 The caps have been updated annually since 2002 using the Medicare Economic Index.22
14 Ibid. 15 Ibid. 16 Ibid., § 20. 17 Ibid., § 20. Modifiers are two-digit codes appended to HCPCS codes to provide
additional information about the billed service. In some cases, addition of a modifier may directly affect payment.
18 Billing providers use the modifier GP to indicate PT services, GO to indicate OT services, and GN to indicate SLP services. These three modifiers are for informational purposes only and do not affect payment.
19 HCPCS 92616 is described in the Medicare Physician Fee Schedule as a “laryngeal sense test.”
20 CMS, Medicare Claims Processing Manual, Pub. No. 100-04, ch. 5, § 10. 21 Ibid. 22 Ibid., § 10.2.
O E I - 0 4 - 0 9 - 0 0 5 4 0 Q U E S T I O N A B L E B I L L I N G F O R M E D I C A R E O U T P A T I E N T T H E R A P Y S E R V I C E S

I N T R O D U C T I O N
In 2009, a beneficiary could receive a combination of PT and SLP services for which Medicare allowed up to $1,840 before exceeding the cap; the cap for OT services was also $1,840.23, 24 The caps are determined on a calendar-year basis, meaning that beneficiaries’ services begin counting toward the cap on January 1 of each year.
The beneficiary may qualify for use of the cap exceptions process when documented, medically necessary services exceed an annual cap.25 By adding a modifier (KX) to the HCPCS code on the claim, the provider attests that the services are reasonable and necessary, and are supported by documentation in the medical record indicating that the beneficiary requires continued outpatient therapy and qualifies for an exception. Providers should use the KX modifier only when services are expected to exceed an annual cap. According to the Medicare Claims Processing Manual, “[u]se of the KX modifier when there is no indication that the cap is likely to be exceeded is abusive.” 26
Fraud in Medicare Outpatient Therapy Services
Outpatient therapy service providers have been prosecuted for defrauding the Medicare program in recent years. For example, OIG and the Department of Justice (DOJ) investigated a Detroit-area provider who pled guilty in 2009 to an $18 million fraud scheme. This provider paid kickbacks to hundreds of Medicare beneficiaries in exchange for their Medicare identification numbers. The numbers were used to bill for PT and OT services that were never provided to the beneficiaries.27 In 2004, an OIG investigation resulted in a $325 million settlement with one therapy provider for alleged fraud.28 The types of alleged fraud included services that lacked a certified plan of care and
4
23 CMS, Medicare Claims Processing Manual, Pub. No. 100-04, Transmittal No. 1678,
Change Request 6321 (February 13, 2009). 24 In 2010, caps were increased to $1,860. 25 CMS, Medicare Claims Processing Manual, Pub. No. 100-04, ch. 5, § 10.2. 26 Ibid. 27 DOJ, Detroit-Area Rehabilitation Facility Executive Pleads Guilty To $18.2 Million
Medicare Fraud Scheme, September 28, 2009. Accessed at http://www.justice.gov/opa/pr/2009/September/09-crm-1040.html on February 23, 2010.
28 DOJ, HealthSouth To Pay United States $325 Million To Resolve Medicare Fraud Allegations, December 30, 2004. Accessed at http://www.usdoj.gov/opa/pr/2004/December/04_civ_807.htm on June 17, 2009.
O E I - 0 4 - 0 9 - 0 0 5 4 0 Q U E S T I O N A B L E B I L L I N G F O R M E D I C A R E O U T P A T I E N T T H E R A P Y S E R V I C E S

I N T R O D U C T I O N
services provided by inappropriate personnel.29 In this case, services were not performed by licensed physical therapists, as required.
Medicare Fraud in Miami-Dade County
Miami-Dade County, Florida, has been a focus area of efforts to combat Medicare fraud, waste, and abuse in recent years. OIG has published reports indicating that Miami-Dade County is at high risk for fraudulent Medicare claims, including infusion therapy services for beneficiaries with HIV/AIDS, home health services, inhalation drugs, and ultrasound services.30 Additionally, in 2007, HHS and DOJ established a joint Medicare Fraud Strike Force (Strike Force) team in South Florida to combat Medicare fraud. Strike Forces are teams of Federal, State, and local investigators that combat fraud in certain areas of the country by analyzing current Medicare claims data.31 In July 2010, the Strike Force in South Florida charged 24 defendants in Miami for allegedly participating in various schemes that resulted in approximately $103 million in false billing.32
These schemes involved fraudulent billing for physical therapy services, as well as other types of services. HHS and DOJ also created the Health Care Fraud Prevention and Enforcement Action Team (HEAT)
5
29 CMS, Medicare Benefit Policy Manual, Pub. No. 100-02, ch. 15, §§ 230.1, 230.2, and
230.3. In addition to covering services provided by therapists and physicians, Medicare covers therapy provided by physician assistants, nurse practitioners, and clinical nurse specialists if permitted by the States in which they practice. Qualified physical and occupational assistants are also covered if they are supervised. All therapy providers must be licensed, certified, or registered to practice in the States in which they provide services and have passed a national examination. However, some outpatient therapy services must be provided only by therapists. CMS, Medicare Claims Processing Manual, Pub. No. 100-04, ch. 5, § 20.
30 The Department of Health & Human Services (HHS) OIG, Aberrant Billing in South Florida for Beneficiaries With HIV/AIDS, OEI-09-07-00030, September 2007; HHS OIG, Aberrant Medicare Home Health Outlier Payment Patterns in Miami-Dade County and Other Geographic Areas in 2008, OEI-04-08-00570, November 2009; HHS OIG, Aberrant Claim Patterns for Inhalation Drugs in Miami-Dade County, OEI-03-08-00290, April 2009; and HHS OIG, Medicare Part B Billing for Ultrasound, OEI-01-08-00100, July 2009.
31 HHS News Release, Strike Force Formed To Target Fraudulent Billing of Medicare Program by Health Care Companies. Accessed at http://www.hhs.gov/news/press/2007pres/05/20070509c.html on February 23, 2010.
32 Nationwide Strike Force operations in July 2010 resulted in charges against 94 doctors and over $251 million in alleged false billing. HHS and DOJ, Medicare Fraud Strike Force Charges 94 Doctors, Health Care Company Owners, Executives and Others for More Than $251 Million in Alleged False Billing. Accessed at http://www.stopmedicarefraud.gov/innews/dc.html#july-16-2010 on July 28, 2010.
O E I - 0 4 - 0 9 - 0 0 5 4 0 Q U E S T I O N A B L E B I L L I N G F O R M E D I C A R E O U T P A T I E N T T H E R A P Y S E R V I C E S

I N T R O D U C T I O N
to strengthen and expand efforts to combat health care fraud, waste, and abuse.33
Medicare Program Integrity
CMS uses program safeguard contractors (PSC) and Zone Program Integrity Contractors (ZPIC) to perform program integrity responsibilities, including data analysis; investigations; and other activities to reduce fraud, waste, and abuse.34 PSCs and ZPICs identify overpayments associated with their investigations and notify the appropriate claims-processing contractor to collect the overpayments.
CMS is authorized to suspend Medicare payments to providers suspected of committing fraud.35 Additionally, the Social Security Act specifies circumstances under which the Secretary of HHS must exclude certain entities from Medicare and other circumstances under which the Secretary may, at his or her discretion, exclude entities.36
METHODOLOGY
Scope
We reviewed national Part B Medicare outpatient therapy claims from 2009. Our population consisted of claims from the 100-percent paid claims data from the National Claims History (NCH) File and includes claims processed by fiscal intermediaries, carriers, and Medicare Administrative Contractors (MAC).37, 38
33 HHS, Attorney General Holder and HHS Secretary Sebelius Announce New
Interagency Health Care Fraud Prevention and Enforcement Action Team. Accessed at http://www.hhs.gov/news/press/2009pres/05/20090520a.html on February 23, 2010.
34 CMS is replacing PSCs with ZPICs. 35 42 CFR § 405.371. CMS may suspend approved payments if it suspects overpayment
to a provider or if a provider has engaged in fraud or willful misrepresentation of claims. 36 Social Security Act § 1128. The Secretary of HHS has delegated the exclusion
authority to OIG. 37 In 2009, Medicare contracted with fiscal intermediaries, carriers, and MACs to process
outpatient therapy claims. Generally, fiscal intermediaries processed claims from institutions and carriers processed claims from physicians, certain nonphysician practitioners, and physical and occupational therapists in private practice. CMS began the process of replacing its fiscal intermediaries and carriers with MACs in October 2005. MACs assumed claims processing from both fiscal intermediaries and carriers as the transitions occurred.
38 We used the files with claims processed through December 31, 2009, for our analysis. These files are estimated to be 88 percent complete; that is, they included approximately 88 percent of all claims for outpatient therapy services provided during 2009.
6 O E I - 0 4 - 0 9 - 0 0 5 4 0 Q U E S T I O N A B L E B I L L I N G F O R M E D I C A R E O U T P A T I E N T T H E R A P Y S E R V I C E S

I N T R O D U C T I O N
We defined outpatient therapy claims as those billed under one of the 75 outpatient therapy HCPCS codes with one of the three modifiers that specify whether the service was PT, OT, or SLP. We did not assess the medical necessity of outpatient therapy or compliance with Medicare billing requirements.
Identification of High-Utilization Counties
To identify high-utilization counties, we assigned each Medicare outpatient therapy claim in our population to a county based on the beneficiary’s residence.39 We determined the total Medicare payments for outpatient therapy in each county. We also calculated the average payment for outpatient therapy services per therapy beneficiary in each county.40 We then identified 20 counties that had (1) the highest average Medicare payment per beneficiary and (2) more than $1 million in total Medicare payments for outpatient therapy services.41 We refer to these counties as “high-utilization counties.” See Figure 1 for a map showing their locations.
7
39 We used the Social Security Administration standard county code of a beneficiary’s
residence. Our population included 3,721 county codes; however, some of the county codes may have been inaccurately reported. The U.S. Census Bureau estimates there are 3,141 counties and county equivalents in the United States. U.S. Census Bureau, Census Bureau Tip Sheet, January 16, 2009. Accessed at http://www.census.gov/newsroom/releases/archives/tip_sheets/tp09-02.html on May 24, 2010.
40 We calculated numbers of therapy services based on the units of service on each claim line with a therapy HCPCS code. That is, we considered a claim line with a unit count of “2” (for example, the beneficiary received two 15-minute increments of a timed service) as having two services.
41 Nationally, the average of total payments within a county was $1.3 million. Counties with less than $1 million accounted for 16 percent of all Medicare payments for outpatient therapy services nationally.
O E I - 0 4 - 0 9 - 0 0 5 4 0 Q U E S T I O N A B L E B I L L I N G F O R M E D I C A R E O U T P A T I E N T T H E R A P Y S E R V I C E S

I N T R O D U C T I O N
Figure 1: Counties With Highest Utilization of Medicare Outpatient Therapy Services, 2009
Analysis of Billing in High-Utilization Counties and Nationally
We categorized the claims into three groups: (1) Miami-Dade County, (2) the other 19 high-utilization counties combined, and (3) national. We analyzed Miami-Dade County separately because it had the highest average Medicare payments per beneficiary among the high-utilization counties and the highest total Medicare payments for outpatient therapy in 2009.42
To determine how billing for outpatient therapy in high-utilization counties compared to national billing, we calculated the average Medicare payments and number of services per beneficiary in Miami-Dade County, in the other 19 high-utilization counties combined, and nationally. We also calculated the average payment and number of services per provider serving beneficiaries in a county. We compared
8
42 Fifteen of the 3,721 counties had a higher average payment per beneficiary than
Miami-Dade County. Medicare paid a total of less than $1 million for outpatient therapy in these 15 counties, combined. All but 1 of these 15 counties was reported with an inaccurate county code.
O E I - 0 4 - 0 9 - 0 0 5 4 0 Q U E S T I O N A B L E B I L L I N G F O R M E D I C A R E O U T P A T I E N T T H E R A P Y S E R V I C E S

I N T R O D U C T I O N
both averages for Miami-Dade County and the other 19 high-utilization counties combined to national averages.43
We used the National Provider Identifier Directory to identify providers that received over $1 million in total Medicare payments for outpatient therapy. We calculated these providers’ total payments for outpatient therapy. We then determined how many of these providers were located in Miami-Dade County and the other 19 high-utilization counties.
Questionable billing characteristics. By using past OIG work on Medicare billing and in consultation with representatives of the Medicare PSCs, we identified six billing characteristics that may indicate fraud in outpatient therapy services. For example, a high prevalence of these characteristics may indicate inappropriate billing, such as providers’ billing for services that were unnecessary or not provided. These characteristics were:
Average number of outpatient therapy services per beneficiary that providers indicated would exceed an annual cap. According to therapy fraud experts within the PSCs, the KX modifier is often overused and/or used inappropriately. We calculated the average number of services per beneficiary that had the KX modifier.
Percentage of outpatient therapy beneficiaries whose providers indicated that an annual cap would be exceeded on the beneficiaries’ first date of service in 2009. Providers should use the KX modifier only when providing services that are expected to exceed an annual cap. This is unlikely to occur on the beneficiary’s first date of service in a new calendar year. We identified beneficiaries whose providers billed Medicare using the KX modifier on the beneficiaries’ first date of service in calendar year 2009.
Average Medicare payment per beneficiary who received outpatient therapy from multiple providers. This characteristic raises concerns about stolen Medicare identification numbers or “professional beneficiaries” who exchange their identification numbers for kickbacks from providers. We identified beneficiaries who received
43 Beneficiaries who received services in more than one county and providers that served
beneficiaries in more than one county during 2009 are included in multiple counties in the national averages. In 2009, 4,531,609 beneficiaries received outpatient therapy from 81,170 providers. Less than 1 percent of these beneficiaries lived in more than one county. Providers served outpatient therapy beneficiaries in an average of six counties.
9 O E I - 0 4 - 0 9 - 0 0 5 4 0 Q U E S T I O N A B L E B I L L I N G F O R M E D I C A R E O U T P A T I E N T T H E R A P Y S E R V I C E S

I N T R O D U C T I O N
outpatient therapy from more than one provider in 2009 and calculated the average reimbursement per beneficiary in 2009.
Percentage of outpatient therapy beneficiaries whose providers were paid for services provided throughout the year. Therapy services are appropriate for improving the beneficiary’s functioning level, but not for maintaining an existing level of functioning. We identified beneficiaries who received outpatient therapy during all four quarters of 2009.
Percentage of outpatient therapy beneficiaries whose providers were paid for services that exceeded one of the annual caps. We identified beneficiaries who received either a combination of PT and SLP services or OT services, excluding those provided in hospitals, for which Medicare allowed more than $1,840.
Percentage of outpatient therapy beneficiaries whose providers were paid for more than 8 hours of outpatient therapy provided in a single day. According to PSC representatives, providing more than 8 hours of therapy to a beneficiary in a single day is usually medically unnecessary and/or infeasible because of the characteristics of the Medicare population and the nature of services provided. We identified HCPCS codes for which the unit of service represents a specific amount of time (typically, 15 minutes) spent in direct contact with the beneficiary on any single calendar day. We then determined how many of these services a beneficiary received on the same day.
We determined the incidence of the 6 characteristics in Miami-Dade County, in the other 19 high-utilization counties combined, and nationally. We calculated the levels of the characteristics nationally and for the 19 high-utilization counties by combining all outpatient therapy claims in each of these two groups. For example, to determine the average number of services per beneficiary billed with the KX modifier, we identified the total number of services billed with the KX modifier in each group and divided these sums by the total number of outpatient therapy beneficiaries in each group. The approach we used resulted in weighted averages based on county size. See Appendix B for the incidence of the six characteristics within each high-utilization county.
Limitations
The six characteristics are not intended to be a comprehensive set of characteristics for identifying questionable billing. Also, although the
10 O E I - 0 4 - 0 9 - 0 0 5 4 0 Q U E S T I O N A B L E B I L L I N G F O R M E D I C A R E O U T P A T I E N T T H E R A P Y S E R V I C E S

I N T R O D U C T I O N
presence of such characteristics raises questions about the appropriateness of outpatient therapy claims, it does not necessarily mean that such claims are inappropriate or fraudulent.
The findings in this report are based on Medicare claims for services provided in 2009 and cannot be generalized to any other time period.
Standards
This study was conducted in accordance with the Quality Standards for Inspections approved by the Council of the Inspectors General on Integrity and Efficiency.
11 O E I - 0 4 - 0 9 - 0 0 5 4 0 Q U E S T I O N A B L E B I L L I N G F O R M E D I C A R E O U T P A T I E N T T H E R A P Y S E R V I C E S

F I N D I N G S F I N D I N G S
Medicare per-beneficiary spending on outpatient
therapy services in Miami-Dade County was
three times the national average in 2009
Medicare paid $159 million for outpatient therapy services provided to Miami-Dade beneficiaries, the highest of any county in 2009. On average, per-beneficiary spending on
outpatient therapy services in Miami-Dade County was three times the national average in 2009. Miami-Dade beneficiaries also received three times as many services as beneficiaries nationally. Providers serving Miami-Dade beneficiaries received eight times the average payment and provided eight times the average number of services as providers that served beneficiaries elsewhere. Table 1 compares these averages in Miami-Dade County with national averages.
12
Table 1. Medicare Outpatient Therapy Services in Miami-Dade County
Compared to National Levels, 2009
Outpatient Therapy Utilization
Miami-Dade County
Average National
Average*
Ratio of Miami-Dade County
Average to National Average
Medicare payments per beneficiary $3,459 $1,078 3:1
Number of services per beneficiary 158 49 3:1
Medicare payments per provider serving beneficiaries in a county $83,867 $10,131 8:1
Number of services per provider serving beneficiaries in a county 3,828 458 8:1
* Beneficiaries who received services in more than one county and providers that served beneficiaries in more than one county during 2009 are included in multiple counties in the national averages. In 2009, 4,531,609 beneficiaries received outpatient therapy from 81,170 providers. Less than 1 percent of these beneficiaries lived in more than one county. Providers served outpatient therapy beneficiaries in an average of six counties.
Note: All figures have been rounded to nearest whole number.
Source: OIG analysis of 2009 Medicare outpatient therapy claims, 2010.
These outpatient therapy utilization levels did not occur in all counties with high Medicare outpatient therapy payments. For example, Los Angeles County, California, the county with the second-highest total payments ($125 million in 2009), was home to more than twice as many outpatient therapy beneficiaries as Miami-Dade County. However, the average per-beneficiary payment and average payment per provider that served beneficiaries in Los Angeles County more closely resembled the national averages than did Miami-Dade County. The ratios of Los Angeles County to national averages for payments per beneficiary and per provider were 1:1 and 3:1, respectively.
O E I - 0 4 - 0 9 - 0 0 5 4 0 Q U E S T I O N A B L E B I L L I N G F O R M E D I C A R E O U T P A T I E N T T H E R A P Y S E R V I C E S

F I N D I N G S
Medicare paid an average of $3,459 per Miami-Dade beneficiary for
outpatient therapy services, compared to an average of $1,078 nationally
Medicare paid an average of $3,459 per Miami-Dade beneficiary for outpatient therapy in 2009. This was the second-highest of all counties nationally and was over three times the national average of $1,078 per beneficiary.44 In contrast, Medicare paid an average of $1,294 per Los Angeles beneficiary. For 10 Miami-Dade beneficiaries, Medicare paid over $278,000 for outpatient therapy in 2009, an average of $27,810 per beneficiary.
Outpatient therapy beneficiaries in Miami-Dade County received an average
of 158 services, compared to an average of 49 services nationally
Miami-Dade beneficiaries received an average of 158 outpatient therapy services in 2009. The average number of services per Miami-Dade beneficiary was the highest of all high-utilization counties and was three times the national average of 49 services. In contrast, beneficiaries in Los Angeles County received an average of 54 outpatient therapy services.
Medicare paid providers serving Miami-Dade beneficiaries an average of
$83,867 for outpatient therapy, compared to an average of $10,131 nationally
Medicare paid outpatient therapy providers that served Miami-Dade beneficiaries an average of $83,867 in 2009, eight times the average amount it paid providers that served beneficiaries in other counties nationally ($10,131). In contrast, Medicare paid providers that served beneficiaries in Los Angeles County an average of $26,814. Additionally, 52 of the 235 providers that received over $1 million in Medicare payments for outpatient therapy services in 2009 were located in Miami-Dade County. These Miami-Dade providers received a total of $88 million, with payments ranging from $1 million to $4 million.
Providers serving Miami-Dade beneficiaries provided an average of
3,828 services, compared to an average of 458 services nationally
Providers that served Miami-Dade beneficiaries provided an average of 3,828 outpatient therapy services in 2009, eight times the average number of services by providers that served beneficiaries in other counties nationally (458). In contrast, providers that served beneficiaries in Los Angeles County provided an average of 1,124 services.
13
44 The highest Medicare payment per beneficiary in counties reported with accurate
codes was $4,452. Payments in this county for outpatient therapy totaled $623,000.
O E I - 0 4 - 0 9 - 0 0 5 4 0 Q U E S T I O N A B L E B I L L I N G F O R M E D I C A R E O U T P A T I E N T T H E R A P Y S E R V I C E S

F I N D I N G S
Miami-Dade County had at least three times the Miami-Dade County exceeded the national level for five of the six national levels for five of the six questionable questionable billing characteristics billing characteristics in Medicare outpatient in Medicare outpatient therapy
therapy services services we reviewed by at least a
factor of three. Table 2 compares, for each characteristic, levels in Miami-Dade County to the national levels.
Table 2. Questionable Outpatient Therapy Billing in Miami-Dade County Compared to
National Levels, 2009
Characteristic Miami-Dade
County National Ratio of Miami-Dade
County to National
Average number of outpatient therapy services per beneficiary that providers indicated would exceed an annual cap 60 14 4:1
Percentage of outpatient therapy beneficiaries whose providers indicated that an annual cap would be exceeded on the beneficiaries’ first date of service in 2009 20% 5% 4:1
Average Medicare payment per beneficiary who received outpatient therapy from multiple providers $5,664 $1,670 3:1
Percentage of outpatient therapy beneficiaries whose providers were paid for services provided throughout the year 10% 3% 3:1
Percentage of outpatient therapy beneficiaries whose providers were paid for services that exceeded an annual cap 63% 22% 3:1
Percentage of outpatient therapy beneficiaries whose providers were paid for more than 8 hours of outpatient therapy provided in a single day 0.3% 0.7% <1:1
Note: All figures have been rounded to nearest whole number.
Source: OIG analysis of 2009 Medicare outpatient therapy claims, 2010.
Providers serving beneficiaries in Miami-Dade County indicated that
outpatient therapy services would exceed an annual cap four times as
often as providers nationally
Providers serving Miami-Dade beneficiaries were paid for an average of 60 outpatient therapy services per beneficiary for which they billed Medicare using the KX modifier in 2009. Services billed with the KX modifier represented an average of 38 percent of each Miami-Dade beneficiary’s total number of outpatient therapy services. Nationally, providers were paid for an average of 14 services with the KX modifier per beneficiary, representing an average of 29 percent of all outpatient therapy services.
14 O E I - 0 4 - 0 9 - 0 0 5 4 0 Q U E S T I O N A B L E B I L L I N G F O R M E D I C A R E O U T P A T I E N T T H E R A P Y S E R V I C E S
F I N D I N G S
Providers serving Miami-Dade beneficiaries indicated that an annual cap
would be exceeded on the beneficiaries’ first date of service four times
more often than providers nationally For 20 percent of therapy beneficiaries in Miami-Dade County, providers used the KX modifier on their first date of service in 2009. Nationally, providers used the KX modifier on beneficiaries’ first date of service in 2009 for 5 percent of therapy beneficiaries. Payments for these claims in Miami-Dade County totaled nearly $3 million. According to the Medicare Claims Processing Manual, this practice may be abusive.45
This characteristic was not prevalent in all counties with high Medicare therapy payments. For example, providers serving beneficiaries in Cook County, Illinois, the county with the third-highest Medicare outpatient therapy payments ($92 million in 2009), used the KX modifier on the beneficiaries’ first date of service only 5 percent of the time.
The average Medicare payment for Miami-Dade beneficiaries who received
outpatient therapy from multiple providers was three times the national
average
Twenty-nine percent of outpatient therapy beneficiaries in Miami-Dade County were served by more than one provider in 2009. Medicare paid an average of $5,664 for these beneficiaries. Nationally, 18 percent of outpatient therapy beneficiaries were served by more than one provider. Medicare paid an average of $1,670 for each of these beneficiaries.
Miami-Dade beneficiaries were three times as likely to receive outpatient
therapy throughout the year as beneficiaries nationally
Ten percent of Miami-Dade beneficiaries received outpatient therapy during all four quarters of 2009. In contrast, 3 percent of outpatient therapy beneficiaries nationally received services during all four quarters.
Miami-Dade beneficiaries were three times as likely to exceed an annual cap
as beneficiaries nationally
Medicare allowed payment above an annual cap for 63 percent of outpatient therapy beneficiaries in Miami-Dade County in 2009. That is, these beneficiaries received either a combination of PT and SLP services or OT services, excluding those provided in hospitals, that cost
15
45 CMS, Medicare Claims Processing Manual , Pub. No. 100-04, ch. 5, § 10.2.
O E I - 0 4 - 0 9 - 0 0 5 4 0 Q U E S T I O N A B L E B I L L I N G F O R M E D I C A R E O U T P A T I E N T T H E R A P Y S E R V I C E S

F I N D I N G S
more than $1,840. Nationally, 22 percent of beneficiaries exceeded an annual cap.
Ninety-four percent of Medicare payments to providers serving beneficiaries in
Miami-Dade County were attributed to beneficiaries who exceeded an annual
cap. Medicare paid providers that served Miami-Dade beneficiaries who exceeded an annual cap $150 million in 2009, accounting for 94 percent of all payments to providers serving Miami-Dade beneficiaries. Medicare paid an average of $5,162 for outpatient therapy provided to each of these beneficiaries, almost three times the cap amount of $1,840. Nationally, 63 percent of payments were for beneficiaries who exceeded an annual cap. Medicare paid an average of $3,169 nationally for beneficiaries who exceeded an annual cap.
Medicare per-beneficiary spending on outpatient
therapy in the other high-utilization counties was
72 percent greater than the national average; these
counties also exhibited questionable billing but to
a lesser extent than Miami-Dade County
As a group, the 19 other high-utilization counties accounted for a total of $162 million in Medicare payments for outpatient therapy in 2009. Medicare paid an average of $1,852 per beneficiary in these counties, 72 percent greater than the national average of $1,078.
Beneficiaries who received outpatient therapy in these counties received an average of 83 services in 2009, compared to the national average of 49 services per beneficiary. Medicare paid an average of $21,131 per provider for outpatient therapy provided to beneficiaries in these counties, compared to the national average of $10,131 per provider. Additionally, 12 of the 243 providers that received over $1 million in Medicare payments for outpatient therapy in 2009 were located in these 19 counties and received a total of $19 million.
The 19 high-utilization counties combined had at least twice the national
level for 5 of the 6 questionable billing characteristics
As a group, these 19 high-utilization counties had at least twice the national level for 5 of the 6 questionable billing characteristics in Medicare outpatient therapy services we reviewed. Table 3 compares these high-utilization counties to Miami-Dade County and national levels of the six characteristics.
16 O E I - 0 4 - 0 9 - 0 0 5 4 0 Q U E S T I O N A B L E B I L L I N G F O R M E D I C A R E O U T P A T I E N T T H E R A P Y S E R V I C E S

F I N D I N G S
17
Table 3. Questionable Outpatient Therapy Billing Characteristics in Miami-Dade County and
19 High-Utilization Counties Combined Compared to National Levels, 2009
Characteristic
Miami-Dade
County
19 Other High-
Utilization Counties National
Ratio of the 19 High-Utilization
Counties to National
Average number of outpatient therapy services per beneficiary that providers indicated would exceed an annual cap 60 37 14 3:1
Percentage of outpatient therapy beneficiaries whose providers indicated that an annual cap would be exceeded on the beneficiaries’ first date of service in 2009 20% 9% 5% 2:1
Average Medicare payment per beneficiary who received outpatient therapy from multiple providers $5,664 $3,152 $1,670 2:1
Percentage of outpatient therapy beneficiaries whose providers were paid for services provided throughout the year 10% 14% 3% 4:1
Percentage of outpatient therapy beneficiaries whose providers were paid for services that exceeded an annual cap 63% 38% 22% 2:1
Percentage of outpatient therapy beneficiaries whose providers were paid for more than 8 hours of outpatient therapy provided in a single day 0.3% 1.0% 0.7% 1:1
Note: All figures have been rounded to nearest whole number.
Source: OIG analysis of 2009 Medicare outpatient therapy claims, 2010.
The 19 high-utilization counties combined had lower levels than Miami-Dade County for 4 of the 6 characteristics. The characteristics that were more prevalent in these 19 counties than in Miami-Dade County were the percentages of beneficiaries who (1) received outpatient therapy throughout the year and (2) received over 8 hours of outpatient therapy in 1 day. Fourteen percent of beneficiaries in these counties received outpatient therapy throughout the year. In contrast, 3 percent of outpatient therapy beneficiaries nationally and 10 percent of Miami-Dade beneficiaries received services throughout the year. Additionally, the percentage of beneficiaries who received over 8 hours of outpatient therapy in 1 day was slightly greater in these 19 high-utilization counties than nationally and in Miami-Dade County.
Each of the 19 high-utilization counties had at least twice the national level
for 1 or more of the 6 questionable billing characteristics
Individually, each high-utilization county had at least twice the national level for one or more of the six questionable billing characteristics. Four of the 19 counties had at least twice the national level for at least 3 of the 6 characteristics.
O E I - 0 4 - 0 9 - 0 0 5 4 0 Q U E S T I O N A B L E B I L L I N G F O R M E D I C A R E O U T P A T I E N T T H E R A P Y S E R V I C E S

F I N D I N G S
The levels of some characteristics were high in many of these 19 counties. For example, in 11 high-utilization counties, the percentages of beneficiaries that received more than 8 hours of outpatient therapy in 1 day were at least twice the national average. Additionally, in 8 of these 11 counties, at least 5 percent of therapy beneficiaries received over 8 hours of outpatient therapy in 1 day, over 7 times the national average. See Appendix B for each high-utilization county’s questionable billing levels.
18 O E I - 0 4 - 0 9 - 0 0 5 4 0 Q U E S T I O N A B L E B I L L I N G F O R M E D I C A R E O U T P A T I E N T T H E R A P Y S E R V I C E S
R E C O M M E N D A T I O N S
R E C O M M E N D A T I O N S
Miami-Dade County, Florida, had the highest total Medicare payments for outpatient therapy in 2009. We found that per-beneficiary spending on outpatient therapy in Miami-Dade County was three times the national average in 2009. We also found that Miami-Dade County had high levels of questionable billing for outpatient therapy. Miami-Dade County exceeded the national levels for five of the six questionable billing characteristics we reviewed by at least a factor of three. Nineteen other high-utilization counties exhibited questionable characteristics in billings for Medicare outpatient therapy services in 2009, but to a lesser extent than Miami-Dade County. The presence of these characteristics raises questions about the appropriateness of outpatient therapy claims but does not necessarily mean that such claims are inappropriate or fraudulent.
South Florida, and Miami-Dade County in particular, has been the focus of efforts to combat Medicare fraud, waste, and abuse in recent years. In May 2009, HHS and DOJ established an interagency team to combat health care fraud nationwide focusing on South Florida and several other geographic areas. Our findings demonstrate that outpatient therapy services in Miami-Dade County and other high-utilization counties warrant additional review as part of ongoing Medicare antifraud activities.
We recommend that CMS:
Target outpatient therapy claims in high-utilization areas for further review
We found that high-utilization counties have high levels of questionable billing characteristics compared to national levels. CMS should monitor utilization trends, such as therapy expenditures per provider and per beneficiary, and use this information to target providers in geographic areas that may be susceptible to fraud.
Target outpatient therapy claims with questionable billing characteristics
for further review
CMS should use the questionable billing characteristics we identified to analyze and monitor claims data to detect and deter fraud and abuse. As part of its analysis, CMS should examine claims for characteristics that are readily identifiable, such as providers that frequently bill for services using the KX modifier on the beneficiary’s first date of service in the calendar year and those that become evident across beneficiaries’ and providers’ claims over time. For example, CMS could identify providers that bill for high numbers of services per beneficiary using the
19 O E I - 0 4 - 0 9 - 0 0 5 4 0 Q U E S T I O N A B L E B I L L I N G F O R M E D I C A R E O U T P A T I E N T T H E R A P Y S E R V I C E S

R E C O M M E N D A T I O N S
KX modifier, relative to the national or surrounding geographic area’s levels.
Review geographic areas and providers with questionable billing and take
appropriate action based on results
When geographic areas are found to have high or increasing utilization of outpatient therapy or when monitoring identifies providers with high levels of questionable billing, CMS should review selected claims prior to payment to ensure that they are legitimate. If CMS determines that fraudulent claims have been submitted, it should take steps to suspend payments to these providers and recover overpayments to them. To assist CMS, we will provide a list of additional high-utilization counties and non-high-utilization counties with high levels of questionable billing characteristics under separate cover. Additionally, we will consider providers with high levels of questionable billing for investigation.
Revise the current therapy cap exception process
We found that providers in high-utilization counties used the KX modifier and exceeded annual therapy caps at levels much higher than the national average. The current therapy cap exception process does not ensure appropriate utilization of Medicare outpatient therapy services. CMS should consider developing per-beneficiary edits and maximum payment amounts to control overutilization of outpatient therapy services. Unless CMS claims-processing contractors use edits or review claims prior to payment, the current therapy cap exceptions process does not identify or limit unusually high annual per-beneficiary utilization. CMS could determine payment amounts that only a small percentage of beneficiaries would surpass in a single year. Claims that exceed these maximum amounts would automatically be subject to medical review prior to payment.
AGENCY COMMENTS AND OFFICE OF INSPECTOR GENERAL RESPONSE CMS concurred with all four recommendations. Through several of its PSCs and ZPICs, CMS is engaged in data analysis of outpatient therapy services. For example, CMS is monitoring specific geographic areas and has already identified claim characteristics and utilization patterns that may detect and deter fraud and abuse in certain designated high-risk areas. CMS’s analyses have already resulted in investigations and referrals to law enforcement, which subsequently led to criminal indictments and arrests. In addition, the MAC in Miami, Florida,
20 O E I - 0 4 - 0 9 - 0 0 5 4 0 Q U E S T I O N A B L E B I L L I N G F O R M E D I C A R E O U T P A T I E N T T H E R A P Y S E R V I C E S

R E C O M M E N D A T I O N S
instituted a prepayment edit to lower the utilization rate for outpatient therapy services.
CMS also stated that when PSCs and ZPICs identify geographic areas with high or increasing outpatient therapy utilization, it takes corrective actions, such as onsite reviews, prepayment edits, and postpayment reviews.
Regarding the last recommendation, CMS concurs with the need to address the limitations of the current therapy cap exceptions process and is developing both short-term and long-term options. CMS included the following short-term options in the 2011 Physician Fee Schedule Proposed Rule:
requiring the reporting of new patient function-related Level II HCPCS codes and severity modifiers,
applying medical necessity edits when per-beneficiary expenditures reach a predetermined value, and
introducing per-session codes to bundle payment for groups of current therapy codes into a single per-session payment.
For the long term, CMS is developing a therapy-related data collection instrument that includes measurement items relevant to payment.
We support CMS’s efforts to address these issues and encourage it to continue making progress in these areas. We will consider providers with high levels of questionable billing for investigation. We will also share a list of these providers with CMS so it may take appropriate action. We did not make changes to the report based on CMS’s comments. For the full text of CMS’s comments, see Appendix C.
21 O E I - 0 4 - 0 9 - 0 0 5 4 0 Q U E S T I O N A B L E B I L L I N G F O R M E D I C A R E O U T P A T I E N T T H E R A P Y S E R V I C E S

A P P E N D I X ~ A
HCPCS Codes for Medicare Outpatient Therapy Services, Fee Schedule Amounts, and Medicare Payments, 2009*
HCPCS Code Description
Nonfacility Fee
Schedule Amount
Facility Fee Schedule
Amount
Number of Medicare
Claims Total Medicare
Payments
97110 Therapeutic exercises $28.49 $28.49 49,229,880 $1,994,469,190
97530 Therapeutic activities $29.94 $29.94 16,920,929 $604,742,625
97140 Manual therapy $26.33 $26.33 18,279,063 $502,444,717
97112 Neuromuscular reeducation $29.21 $29.21 12,435,150 $375,879,132
97001 Physical therapy evaluation $69.25 $69.25 4,199,233 $227,015,902
97116 Gait training therapy $24.89 $24.89 8,951,914 $205,988,238
92526 Oral function therapy $77.54 $26.69 2,902,618 $177,572,847
97535 Self care management training $30.30 $30.30 4,646,094 $172,681,674 G0283 Electrical stimulation other than wound $11.90 $11.90 9,585,421 $89,965,073
97113 Aquatic therapy/exercises $35.35 $35.35 1,165,459 $83,420,907
92507 Speech/hearing therapy $61.67 $25.25 1,604,393 $76,822,378
97035 Ultrasound therapy $11.54 $11.54 6,746,273 $65,794,786
97003 Occupational therapy evaluation $73.22 $73.22 1,003,691 $58,465,572
97032 Electrical stimulation $16.59 $16.59 2,695,018 $43,038,732
97532 Cognitive skills development $24.16 $24.16 698,410 $27,702,946
97150 Group therapeutic procedures $18.03 $18.03 1,782,119 $25,539,949
97124 Massage therapy $22.72 $22.72 1,134,287 $24,108,635
97542 Wheelchair management training $27.05 $27.05 604,481 $22,473,139
92610 Swallowing function evaluation $61.67 $61.67 309,513 $18,705,280
92506 Speech/hearing evaluation $154.00 $42.56 160,331 $17,864,825
97760 Orthotic management and training $32.82 $32.82 459,094 $17,180,166
97002 Physical therapy reevaluation $37.15 $37.15 557,614 $16,760,845
97597 Active wound care: 20 cm or less $62.03 $27.41 239,873 $10,640,377
97012 Mechanical traction therapy $14.43 $14.43 846,893 $9,761,844
92611 Motion fluoroscopy/swallowing $70.69 $70.69 109,937 $7,643,271
97033 Electric current therapy $25.61 $25.61 323,713 $6,694,468
97022 Whirlpool therapy $18.39 $18.39 401,468 $5,551,642
97750 Physical performance test $28.85 $28.85 135,518 $4,428,371
97016 Vasopneumatic device therapy $15.51 $15.51 354,614 $4,193,393
97024 Diathermy, e.g., microwave $5.41 $5.41 639,190 $2,734,629
97598 Active wound care: greater than 20 cm $76.46 $37.15 42,363 $2,434,433
97004 Occupational therapy reevaluation $41.84 $41.84 54,982 $1,911,344
97018 Paraffin bath therapy $8.30 $8.30 261,651 $1,734,700
97761 Prosthetic training $28.85 $28.85 39,514 $1,666,576
97762 Checkout for orthotic/prosthetic use $36.07 $36.07 46,457 $1,605,450
92508 Speech/hearing therapy $29.57 $12.98 60,355 $1,393,711
97533 Sensory integration $25.97 $25.97 37,384 $1,129,882 * Healthcare Common Procedure Coding System (HCPCS) codes provide a standardized coding system used by Medicare to describe specific items and services.
Sources: Medicare Physician Fee Schedule (2009) and Office of Inspector General analysis of 2009 Medicare outpatient therapy claims.
22 O E I - 0 4 - 0 9 - 0 0 5 4 0 Q U E S T I O N A B L E B I L L I N G F O R M E D I C A R E O U T P A T I E N T T H E R A P Y S E R V I C E S

O E I - 0 4 - 0 9 - 0 0 5 4 0 Q U E S T I O N A B L E B I L L I N G F O R M E D I C A R E O U T P A T I E N T T H E R A P Y S E R V I C E S 23
A P P E N D I X A
Continued: HCPCS Codes for Medicare Outpatient Therapy Services, Fee Schedule Amounts, and Medicare Payments, 2009*
HCPCS Code Description
Nonfacility Fee
Schedule Amount
Facility Fee Schedule
Amount
Number of Medicare
Claims Total Medicare
Payments
97026 Infrared therapy $5.05 $5.05 237,206 $1,000,552
G0281 Unattended electrical stimulation $11.90 $11.90 98,928 $982,243
97537 Community/work reintegration $26.69 $26.69 21,681 $952,940
92609 Use of speech device service $86.92 $86.92 11,348 $718,044
97034 Contrast bath therapy $15.15 $15.15 48,020 $587,001
92612 Endoscopy swallowing test (fees) $152.92 $63.48 5,013 $579,374
92597 Oral speech device evaluation $102.79 $42.92 6,329 $526,915
95831 Limb muscle testing, manual $24.89 $13.71 22,587 $472,713
95851 Range of motion measurements $15.15 $7.57 32,043 $441,859
97605 Negative pressure wound treatment, < 50 cm $35.35 $25.25 14,514 $431,545
64550 Application of neurostimulator $13.71 $8.66 35,634 $429,507
90901 Biofeedback training, any method $31.74 $19.48 12,368 $411,492 96125 Cognitive test by health care professional $94.86 $80.79 4,259 $386,866 0183T** Wound ultrasound $0.00 $0.00 4,115 $357,281
97036 Hydrotherapy $26.33 $26.33 10,401 $261,857
97039** Physical therapy treatment $0.00 $0.00 10,609 $244,501
97755 Assistive technology assessment $33.18 $33.18 2,755 $237,770
92607 Exam for speech device treatment, 1 hour $162.30 $162.30 2,071 $236,062
96105 Assessment of aphasia $74.66 $74.66 2,484 $188,254
G0329 Electromagnetic treatment for ulcers $7.93 $7.93 18,724 $134,480
97139** Physical medicine procedure $0.00 $0.00 5,543 $105,235
97606 Negative pressure wound treatment, > 50 cm $37.87 $27.77 2,613 $92,541
92616 Laryngeal sense test $182.86 $93.05 529 $80,436
95852 Range of motion measurements $12.26 $5.77 6,060 $58,720
97799** Physical medicine procedure $0.00 $0.00 555 $56,642
97028 Ultraviolet therapy $6.49 $6.49 10,764 $55,970
97010 Hot or cold pack therapy $5.05 $5.05 220,633 $28,655
92608 Exam for speech device treatment additional $31.74 $31.74 671 $28,006
95832 Hand muscle testing, manual $24.16 $14.79 1,167 $21,076
97602*** Wound(s) care, nonselective $0.00 $0.00 16,422 $19,433
95833 Body muscle testing, manual $33.90 $22.36 671 $17,408
95834 Body muscle testing, manual $40.39 $28.49 319 $9,849
96111 Developmental test, extended $127.68 $123.35 68 $6,189
92614 Laryngoscopic sensory test $133.81 $63.48 36 $3,797 95992 Canalith repositioning procedure $40.76 $36.79 968 $1,125
96110 Developmental test, limited $12.62 $12.62 22 $404
92605*** Evaluation for nonspeech device prescription $0.00 $0.00 60 $24
92606*** Nonspeech device service $0.00 $0.00 118 $0 * Healthcare Common Procedure Coding System (HCPCS) codes provide a standardized coding system used by Medicare to describe specific items and services.
** No fee schedule amount exists for this code; the local carrier (or A/B Medicare Administrative Contractor) determines the coverage and pricing for this code.
*** This code is a bundled service under the fee schedule.
Sources: Medicare Physician Fee Schedule (2009) and Office of Inspector General analysis of 2009 Medicare outpatient therapy claims.

A P P E N D I X ~ B
Questionable Billing Characteristics for 20 High-Utilization Counties, Compared to National Levels
Questionable Billing Characteristics
County/Parish
Average Payment
per Beneficiary
Total Medicare Payments
Average Number of
Services Billed With KX
Modifier per Beneficiary
Percentage of Services Billed
With KX Modifier on First Date of
Service per Beneficiary
Average Payment for Beneficiaries
Who Received Services From
More Than One Provider
Percentage of Beneficiaries
Receiving Services
Throughout the Year
Percentage of Beneficiaries
Exceeding Annual Cap
Percentage of Beneficiaries
With More Than 8 Hours of
Service in a Single Day
Number of Questionable
Billing Characteristics at Least Twice
the National Level*
National $1,078 $4,922,328,414 14 4.9% $1,670 3.1% 21.6% 0.7% NA
Miami-Dade, FL $3,459 $159,180,288 60 20.2% $5,664 9.7% 63.0% 0.3% 5
St. Mary, LA $2,343 $1,571,955 48 7.2% $2,365 2.7% 35.3% 6.1% 2
Avoyelles, LA $2,054 $1,244,468 43 10.2% $2,103 2.6% 39.1% 0.5% 2
Leflore, MS $2,031 $1,062,159 45 6.9% $1,773 3.4% 29.6% 0.6% 1
Okeechobee, FL $2,026 $1,616,424 17 4.9% $4,301 4.0% 38.2% 0.3% 1
Kings, NY $1,972 $79,973,326 41 9.8% $3,361 16.8% 40.7% 0.3% 4
Rusk, TX $1,890 $1,124,662 52 16.6% $1,785 3.4% 30.1% 6.2% 3
Lauderdale, MS $1,814 $2,368,575 39 15.0% $2,883 2.7% 27.9% 5.8% 3
Liberty, TX $1,807 $1,442,333 51 15.0% $2,394 2.6% 27.8% 5.8% 3
Warren, MS $1,791 $1,296,449 37 4.3% $3,201 3.7% 38.0% 1.0% 1
Ouachita, LA $1,749 $3,255,832 32 6.9% $2,307 3.3% 31.8% 5.0% 2
Thomas, GA $1,747 $1,864,483 45 7.6% $2,024 2.2% 36.7% 0.7% 1
Lincoln, LA $1,747 $1,109,029 39 8.7% $2,493 2.7% 29.6% 5.2% 2
San Patricio, TX $1,744 $1,641,316 33 5.2% $2,821 3.1% 35.0% 4.0% 2
Acadia, LA $1,742 $1,332,625 34 3.3% $1,836 2.4% 31.5% 1.7% 2
Iberia, LA $1,742 $1,929,809 27 7.4% $1,506 2.1% 30.4% 2.9% 1
De Kalb, IN $1,739 $1,038,248 48 8.0% $1,973 2.7% 27.5% 8.4% 2
Angelina, TX $1,718 $2,283,187 30 10.0% $2,696 2.6% 34.6% 1.4% 2
Queens, NY $1,714 $53,872,258 33 8.0% $3,007 14.6% 37.3% 0.5% 2
Dubois, IN $1,676 $1,670,940 36 7.9% $1,753 2.8% 27.2% 5.0% 2 Note: Bolded figures indicate levels that are at least twice the national level.
* Figures are based on rounded questionable billing levels.
Source: Office of Inspector General analysis of 2009 Medicare outpatient therapy services claims.
O E I - 0 4 - 0 9 - 0 0 5 4 0 Q U E S T I O N A B L E B I L L I N G F O R M E D I C A R E O U T P A T I E N T T H E R A P Y S E R V I C E S 24
A P PEN D x c
Agency Comments: Centers for Medicare & Medicaid Services
/$oP....q,,,( tf... DEPARTMENT OF HEALTH & HUMAN SERVICES Centers for Medicare & Medicaid Services
,~,!-AdminilJtrator Washington, DC 20201
DATE: OCT 1 2 2010
TO: Daniel R. Levinson Inspector General
FROM: Donald M. Berwick, M.D. Administrator
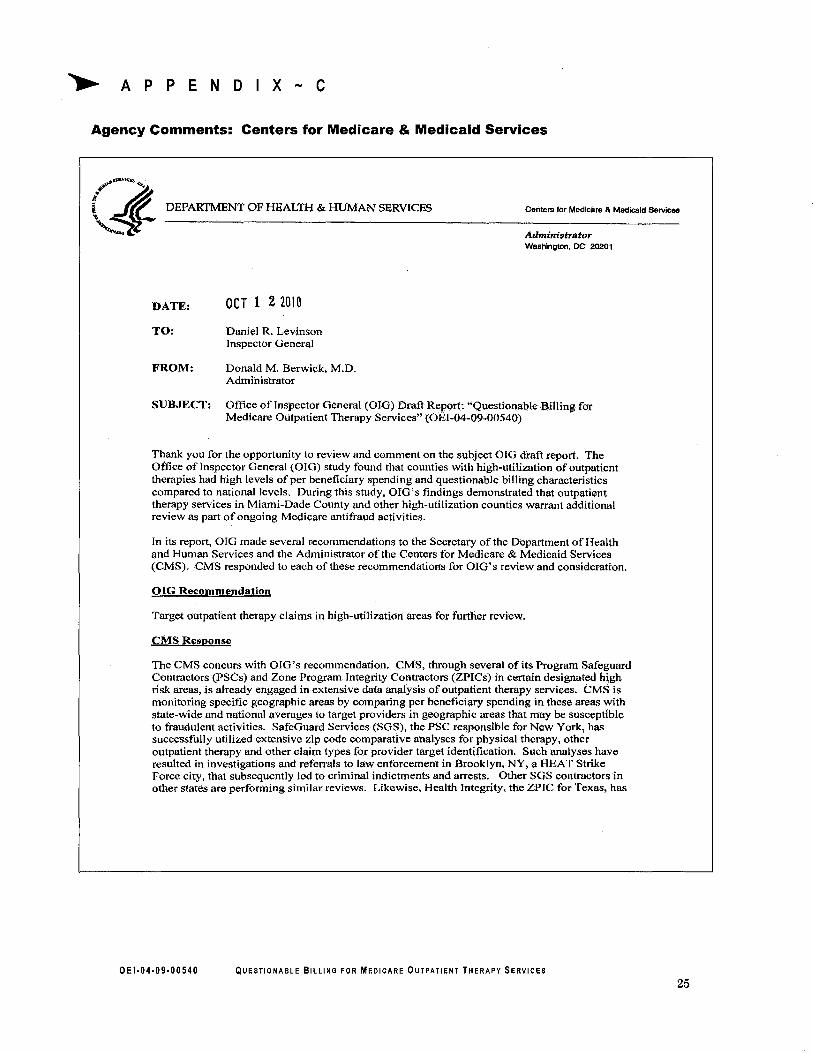
SUBJECT: Office of Inspector General (OIG) Draft Report: "Questionable Billing for Medicare Outpatient Therapy Services" (OEI-04-09-00540)
Thank you for the opportunity to review and comment on the subject OIG draft report. The Office of Inspector General (OIG) study found that counties with high-utilization of outpatient therapies had high levels of per beneficiary spending and questionable billing characteristics compared to national levels. During this study, OIG's findings demonstrated that outpatient therapy services in Miami-Dade Cotmty and other high-utilization counties warrant additional review as part of ongoing Medicare antifraud activities.
In its report, OIG made several recommendations to the Secretary of the Department of Health and Human Services and the Administrator ofthe Centers for Medicare & Medicaid Services (CMS). CMS responded to each of these recommendations for OIG's review and consideration.
OIG Recommendation
Target outpatient therapy claims in high-utilization areas for further review.
CMS Response
The CMS concurs with OIG's recommendation. CMS, through several ofits Program Safeguard Contractors (PSCs) and Zone Program Integrity Contractors (ZPICs) in certain designated high risk areas, is already engaged in extensive data analysis of outpatient therapy services. CMS is monitoring specific geographic areas by comparing per beneficiary spending in these area') with state-wide and national averages to target providers in geographic areas that may be susceptible to fraudulent activities. SafeGuard Services (SGS), the PSC responsible for New York, has successfully utilized extensive zip code comparative analyses for physical therapy, other outpatient therapy and other claim types for provider target identification. Such analyses have resulted in investigations and referrals to law enforcement in Brooklyn, NY, a HEAT Strike Force city, that subsequently led to criminal indictments and arrests. Other SGS contractors in other states are performing similar reviews. Likewise, Health Integrity, the ZPIC for Texas, has
OEI·04·09·00540 QUESTIONABLE BILLING FOR MEDICARE OUTPATIENT THERAPY SERVICES
25

A P P E N D I X ~ C
O E I - 0 4 - 0 9 - 0 0 5 4 0 Q U E S T I O N A B L E B I L L I N G F O R M E D I C A R E O U T P A T I E N T T H E R A P Y S E R V I C E S
26

A P P E N D I X ~ C
O E I - 0 4 - 0 9 - 0 0 5 4 0 Q U E S T I O N A B L E B I L L I N G F O R M E D I C A R E O U T P A T I E N T T H E R A P Y S E R V I C E S
27

O E I - 0 4 - 0 9 - 0 0 5 4 0 Q U E S T I O N A B L E B I L L I N G F O R M E D I C A R E O U T P A T I E N T T H E R A P Y S E R V I C E S
28
A C K N O W L E D G M E N T S
This report was prepared under the direction of Dwayne Grant, Regional Inspector General for Evaluation and Inspections in the Atlanta regional office, and Jaime Durley, Deputy Regional Inspector General.
Sarah Ambrose served as the team leader for this study and Holly Williams served as the lead analyst. Other principal Office of Evaluation and Inspections staff from the Atlanta regional office who contributed to this report include Gerius Patterson; central office staff who contributed include Kevin Farber and Arianne Spaccarelli.

Office of Inspector General http://oig.hhs.gov
The mission of the Office of Inspector General (OIG), as mandated by Public Law 95-452, as amended, is to protect the integrity of the Department of Health and Human Services (HHS) programs, as well as the health and welfare of beneficiaries served by those programs. This statutory mission is carried out through a nationwide network of audits, investigations, and inspections conducted by the following operating components:
Office of Audit Services The Office of Audit Services (OAS) provides auditing services for HHS, either by conducting audits with its own audit resources or by overseeing audit work done by others. Audits examine the performance of HHS programs and/or its grantees and contractors in carrying out their respective responsibilities and are intended to provide independent assessments of HHS programs and operations. These assessments help reduce waste, abuse, and mismanagement and promote economy and efficiency throughout HHS.
Office of Evaluation and Inspections The Office of Evaluation and Inspections (OEI) conducts national evaluations to provide HHS, Congress, and the public with timely, useful, and reliable information on significant issues. These evaluations focus on preventing fraud, waste, or abuse and promoting economy, efficiency, and effectiveness of departmental programs. To promote impact, OEI reports also present practical recommendations for improving program operations.
Office of Investigations The Office of Investigations (OI) conducts criminal, civil, and administrative investigations of fraud and misconduct related to HHS programs, operations, and beneficiaries. With investigators working in all 50 States and the District of Columbia, OI utilizes its resources by actively coordinating with the Department of Justice and other Federal, State, and local law enforcement authorities. The investigative efforts of OI often lead to criminal convictions, administrative sanctions, and/or civil monetary penalties.
Office of Counsel to the Inspector General The Office of Counsel to the Inspector General (OCIG) provides general legal services to OIG, rendering advice and opinions on HHS programs and operations and providing all legal support for OIG’s internal operations. OCIG represents OIG in all civil and administrative fraud and abuse cases involving HHS programs, including False Claims Act, program exclusion, and civil monetary penalty cases. In connection with these cases, OCIG also negotiates and monitors corporate integrity agreements. OCIG renders advisory opinions, issues compliance program guidance, publishes fraud alerts, and provides other guidance to the health care industry concerning the anti-kickback statute and other OIG enforcement authorities.