queensland regional input-output · pdf filethe only differences, ... i-o tables are only...
TRANSCRIPT

Office of the GovernmentStatistician
Queensland
Regional
Input-Output
Tables
1996-9734 Industries

Office of the Government StatisticianLevel 8, 33 Charlotte Street, Brisbane, Queensland, Australia
PO Box 37 Brisbane Albert Street, BC, Queensland, Australia, 4002Telephone” (07) 3224 5326 Facsimile: (07) 3220 0861
ISBN 0-9751137-3-9
Copyright protects this publication. Except for purposes permitted under the Copyright Act, reproduction by whatever means is prohibited without the prior written permission of the Government Statistician. Anyinformation reproduced from this publication must be sourced to the Office of the Government Statistician.Although the Queensland Regional Input-Output Tables, 1996-97, have been derived from sources believed to be reliable, the Office of the Government Statistician does not guarantee or make any representations as to the accuracy or completeness of the data contained. Any information, statement, opinion or advice expressed or implied in this report is made in good faith but on the basis that the Office of the Government Statistician, its agents and employees are not liable for any damage or loss whatsoever which may occur in relation to its use.

TABLE OF CONTENTS Preface 1Queensland Statistical Divisions, 1996 2Structure of the Regional Input-Output Tables 3Compilation Methodology 6 Regional Input-Output Tables
Table 2 Brisbane-Moreton 8Table 3 Wide Bay-Burnett 16Table 4 Darling Downs 24Table 5 South West 32Table 6 Fitzroy 40Table 7 Central West 48Table 8 Mackay 56Table 9 Northern 64Table 10 Far North 72Table 11 North West 80
Multipliers Value Added
Table 12 Brisbane-Moreton 91Table 13 Wide Bay-Burnett 92Table 14 Darling Downs 93Table 15 South West 94Table 16 Fitzroy 95Table 17 Central West 96Table 18 Mackay 97Table 19 Northern 98Table 20 Far North 99Table 21 North West 100
Employment
Table 22 Brisbane-Moreton 101Table 23 Wide Bay-Burnett 102Table 24 Darling Downs 103Table 25 South West 104Table 26 Fitzroy 105Table 27 Central West 106Table 28 Mackay 107Table 29 Northern 108Table 30 Far North 109Table 31 North West 110
Appendix A 111
i


PREFACE
This publication presents regional input-output (I-O) tables for Queensland’s Statistical Divisions for
the 1996-97 financial year. Regional I-O tables record the supply and disposal of industry outputs
and therefore present a representation of the structure and industry interrelationships of a regional
economy.
The production of these tables completes the input-output system for Queensland and its regions for
1996-97. The regional I-O tables have been derived from the Queensland Input-Output Tables
1996-97, also produced by the Office of the Government Statistician, which in turn were based on
the Australian Bureau of Statistics (ABS) Input-Output Tables, Australia 1996-97. Compilation of
regional I-O tables is a difficult exercise due to the paucity of regional data. The Office of the
Government Statistician has made every effort to use and confront all available regional data in the
compilation of these tables. However, due to the lack of regional data, a substantial proportion of
these tables have been synthetically estimated. This lack of data has been compensated to some
extent by compiling the regional tables as one large matrix which incorporates both the regional
tables and the interregional trade flows and ensuring this matrix consolidates to the Queensland I-O
table.
The regions used in the regional I-O tables correspond to the Queensland Statistical Divisions
classified by Australian Standard Geographical Classification 1996, with the exception of the
Brisbane and Moreton Statistical Divisions which have been combined.
For further information relating to these tables, contact Jim Hurley on (07) 322 51562 or e-mail
Dr Gary Ward Government Statistician August 2004
1

Queensland’s Statistical Divisions 1996
2

STRUCTURE OF THE TABLES
An I-O table is a system of accounts which shows, in value terms, the supply and disposal of goods
and services produced within an economy over a period, usually one year. The row of an I-O table
shows the disposal of the output of an industry to itself or other industries (intermediate usage), or to
final demand categories. A column shows the origin of inputs into production, whether they are
intermediate inputs or primary inputs such as labour and capital. The table is balanced as total inputs
in each industry equals total outputs from each industry.
The 1996-97 Queensland regional I-O tables are comprised of 34 industries, 8 primary input
categories (rows P1 to P6b) and 9 final demand categories (columns Q1 to Q7b) which, by
convention, are arranged into four quadrants (see Table 1). The first, or intermediate quadrant,
represented by the matrix of 34 industry rows and columns, shows all the intermediate (non-final
use) transactions. The second, or final demand quadrant, represented by the 34 industry rows and
columns Q1 to Q7b, records disposal (or sales) of industry output to final (or end) use of goods and
services. The third or primary input quadrant, represented by rows P1 to P6b and the 34 industry
columns, shows payments to the factors of production, such as compensation of employees and
gross operating surplus and mixed income, as well as taxes and imported inputs. The fourth
quadrant, comprising rows P1 to P6b and columns Q1 to Q7b, records primary inputs that flow
directly to final demand.
The only differences, in terms of structure, between the 1996-97 State I-O table and the Queensland
regional I-O tables is that the regional I-O tables show, in addition to total exports and imports, the
categories “foreign and interstate” and “interregional” for exports and imports. Further, the regional
I-O tables are only compiled at the 34 industry level (whereas the Queensland tables are available at
the 107, 35 and 34 industry levels).
The reader should note that column and row totals in the tables may not equate to the published
totals due to rounding.
3

Table 1. Structure of Queensland Regional Input-Output Tables
Direct allocation of imports, basic prices, recording of intra-industry flows
Industry Classification
The 34 industries represented in the Queensland regional I-O tables are based on the 1993
Australian and New Zealand Standard Industrial Classification (ANZSIC) classification. A
concordance between the Queensland regional 34 industry classification, the 107 Queensland
industry classification and the ANZSIC is shown in Appendix A.
Treatment of Imports
There are two treatments of imports in I-O tables, namely direct allocation and indirect allocation.
Direct allocation of imports involves allocating all imports to the industry that uses them. That is, all
imported materials used by an industry, regardless of the industry of origin, are recorded in row P6 of
4

the corresponding industry column that requires the imports as an input to production.
Consequently, all flows in the first and second quadrants of a direct allocation table refer only to the
usage of domestically (regionally) produced goods. The regional tables are only available with direct
allocation of imports.
In contrast, in an indirect allocation table, imports are allocated indirectly to the supply of the industry
which produces (or would produce) similar commodities in the domestic economy to which the table
relates. This supply is then allocated along the corresponding row of the table to the using industries.
Hence, the flows in quadrants one and two of an indirect table record both imported and domestically
produced products.
Direct allocation tables are appropriate where the principal concern is the assessment of impacts on
the domestic economy to which the table relates. Where import replacement is of major interest,
indirect allocation tables are more appropriate.
Employment
Employment data contained in this publication are measured on a full-time equivalent basis and are
compiled from ABS 1996 Census of Population and Housing and ABS 6201.3, Labour Force data.
Estimates of hours worked per person employed by industry obtained from the Census were used to
derive initial full-time equivalent estimates. These estimates were then adjusted to the labour force
data given the coverage of the labour force survey over the financial year as opposed to the Census,
which only accounts for a point in time. Where appropriate, estimates were also supplemented by
data from the 1996-97 ABS Manufacturing and Mining Censuses.
During compilation of the regional I-O tables, more detailed analysis of employment data at the
regional level has resulted in revisions to previously published estimates of employment. This is
especially the case for the mining and manufacturing industries.
Clients that have previously purchased the 1996-97 Queensland I-O Tables will be supplied an
updated version of the tables. To obtain an updated version of the I-O tables please contact Jim
Hurley on (07) 322 51562 or e-mail [email protected].
5

COMPILATION METHODOLOGY
The compilation of regional I-O tables presents fundamental difficulties due to the paucity of regional
data, especially with respect to interregional and intraregional flows of goods and services. While
every effort has been made to use all available data, the regional tables are largely synthetic in
nature. Therefore, they should only be regarded as broadly indicative of the transactions within and
between regions. Further, any analysis based on these tables should be broad without spurious
precision.
While the compilation procedure is synthetic in nature, the Queensland Regional Input-Output
Tables, 1996-97 were compiled as one matrix which incorporates individual regional tables and
interregional trade with a balancing procedure that consolidates the regions to the Queensland
parent table. This balancing procedure, detailed in Byron, Crossman, Hurley and Smith (1993), uses
a mathematical technique to balance the component regional tables and interregional trade to the
Queensland table after assigning reliability weights. The technique involves minimisation of the sum
of the squares of the adjustments between the original and the balanced estimates in the system,
weighted by the reliabilities subject to the accounting constraints. The accounting constraints ensure
that each individual table balances and that the ten regional tables consolidate back to the
Queensland table.
Reference Byron, R.P., Crossman, P.J., Hurley, J. E. and Smith, S.C.E. (1993), Balancing Hierarchical Regional Accounting Matrices, paper presented at the International Conference on National Accounts, Economic Analysis and Social Statistics, Siena, Italy.
6
1996-97 QUEENSLAND REGIONAL INPUT-OUTPUT TABLES
7

TABLE 2: BRISBANE-MORETON INDUSTRY BY INDUSTRY FLOW TABLE 1996-97DIRECT ALLOCATION OF COMPETING IMPORTS, BASIC PRICES, RECORDING INTRA-INDUSTRY FLOWS, 34 INDUSTRIES ($ MILLION)
INDUSTRY DESCRIPTION 1 2 3 4 5 6 7 8 9 10 11 12
1 Sheep - - - - - - - - - - - -
2 Grains - - - - 0.1 - - - - - 3.4 -
3 Beef cattle - - 13.0 - - - - - - - 64.8 -
4 Dairy cattle and pigs - - - 1.3 - - - - - - 126.0 -
5 Other agriculture - 0.1 2.1 3.5 34.3 1.2 0.1 - - - 112.4 2.6
6 Sugar cane growing - - - - - 0.9 - - - - 29.8 -
7 Forestry and fishing - - 0.1 0.1 0.3 - 0.8 - - - 0.2 -
8 Coal, oil and gas - - - - 1.4 - - 0.2 0.1 - 5.6 1.5
9 Non-ferrous metal ores - - - - - - - - 1.1 0.3 - -
10 Other mining - - - - 0.4 - - 5.5 6.9 6.2 6.1 -
11 Food manufacturing - - 1.4 14.5 44.4 0.2 2.3 - 0.1 0.3 468.6 15.7
12 Textiles, clothing and footwear - - - 0.1 0.4 - 0.3 - - 0.1 4.0 25.5
13 Wood and paper manufacturing - - 0.5 0.2 5.8 0.3 0.8 0.1 0.2 2.1 83.9 4.3
14 Chemicals, petroleum and coal products - 0.5 2.2 6.5 38.4 2.1 12.7 3.1 6.5 32.5 122.9 9.8
15 Non-metallic mineral products - - - - - - 1.2 0.1 0.3 0.3 17.9 0.1
16 Metals, metal products - - - - - - 4.8 0.8 0.7 0.9 132.1 2.1
17 Machinery, appliances and equipment - 0.1 0.2 0.5 2.1 0.1 7.3 2.8 4.2 21.8 3.0 0.3
18 Miscellaneous manufacturing - - - 0.1 0.4 - 0.9 0.7 0.9 6.0 1.3 1.7
19 Electricity supply, gas and water - - 0.4 1.9 3.5 0.3 0.2 1.3 1.8 0.3 55.6 3.6
20 Residential building construction - - - - - - - - - - 0.1 -
21 Other construction - - 0.3 0.7 1.1 0.1 - 0.1 0.5 0.6 0.1 -
22 Trade - 0.8 3.0 8.5 25.2 1.9 9.7 3.3 4.5 21.9 297.2 44.3
23 Accommodation, cafes and restaurants - 0.1 0.4 1.0 2.0 0.3 0.3 0.1 0.2 2.4 47.2 4.6
8

TABLE 2: BRISBANE-MORETON INDUSTRY BY INDUSTRY FLOW TABLE 1996-97DIRECT ALLOCATION OF COMPETING IMPORTS, BASIC PRICES, RECORDING INTRA-INDUSTRY FLOWS, 34 INDUSTRIES ($ MILLION)
INDUSTRY DESCRIPTION 1 2 3 4 5 6 7 8 9 10 11 12
24 Road transport - 0.6 2.6 4.4 12.8 0.9 0.9 1.2 1.0 22.6 303.1 9.9
25 Rail and pipeline transport - 0.3 0.1 0.5 1.8 0.1 0.1 17.7 0.3 0.9 47.4 3.3
26 Other transport - 0.2 0.6 0.7 5.0 0.2 0.6 0.9 0.3 3.7 65.4 13.3
27 Communication services - 0.1 0.9 1.2 3.3 0.3 0.4 0.3 1.3 5.1 20.0 3.3
28 Finance, property and business services - 0.6 4.7 4.2 19.0 1.8 2.9 4.5 3.4 16.2 176.1 28.1
29 Ownership of dwellings - - - - - - - - - - - -
30 Government administration and defence - - 0.1 - 0.8 0.1 0.3 0.5 0.3 5.2 10.4 0.4
31 Education - - - - 0.1 - - - - 0.3 2.7 1.2
32 Health and community services - - 0.4 0.9 1.1 - - 65.2 - - 3.9 1.2
33 Cultural and recreational services - - - - 0.1 - - - 0.1 0.1 4.7 0.3
34 Personal and other services - - 0.1 - 0.1 - 0.1 0.1 - - 2.3 0.8
T1 Total intermediate usage - 3.5 33.3 51.0 203.9 10.9 46.7 108.7 34.7 149.8 2,218.3 178.2
P1 Compensation of employees - 2.2 11.2 14.6 177.4 6.4 31.6 19.9 18.7 109.6 688.9 126.0
P2 Gross operating surplus and mixed income - 4.3 7.6 33.2 142.6 8.3 14.3 34.6 53.3 40.0 400.9 37.7
P3 Taxes less subsidies on products - 0.1 0.5 0.7 3.1 0.1 1.4 0.4 0.4 2.3 33.0 9.9
P4 Taxes less subsidies on production - 0.2 1.3 2.9 8.5 0.5 1.7 0.9 1.1 5.6 50.8 5.6
P5 Complementary imports - - - - - - - - - - - -
P6 Imported inputs - 2.0 29.4 30.2 130.3 4.6 14.0 12.0 18.5 24.4 1,034.7 179.3
P6a Foreign and interstate - 1.1 5.4 22.5 92.0 3.3 10.8 9.2 15.4 15.4 450.0 144.5
P6b Interregional - 0.9 24.1 7.6 38.3 1.4 3.2 2.8 3.0 9.0 584.7 34.8
T2 Total production 0.1 12.2 83.3 132.5 665.9 30.7 109.5 176.5 126.6 331.6 4,426.6 536.7
Employment (fte persons) 1 351 918 1,641 7,476 281 1,716 341 371 2,225 15,565 4,165
9

TABLE 2: BRISBANE-MORETON INDUSTRY BY INDUSTRY FLOW TABLE 1996-97DIRECT ALLOCATION OF COMPETING IMPORTS, BASIC PRICES, RECORDING INTRA-INDUSTRY FLOWS, 34 INDUSTRIES ($ MILLION)
INDUSTRY DESCRIPTION
1 Sheep
2 Grains
3 Beef cattle
4 Dairy cattle and pigs
5 Other agriculture
6 Sugar cane growing
7 Forestry and fishing
8 Coal, oil and gas
9 Non-ferrous metal ores
10 Other mining
11 Food manufacturing
12 Textiles, clothing and footwear
13 Wood and paper manufacturing
14 Chemicals, petroleum and coal products
15 Non-metallic mineral products
16 Metals, metal products
17 Machinery, appliances and equipment
18 Miscellaneous manufacturing
19 Electricity supply, gas and water
20 Residential building construction
21 Other construction
22 Trade
23 Accommodation, cafes and restaurants
13 14 15 16 17 18 19 20 21 22 23 24
- - - - - - - - - - - -
- 0.1 - - - - - - - - - -
- - - - - - - - - - - -
- 0.1 - - - - - - - - - -
0.1 3.8 - 0.1 0.1 0.5 0.2 3.1 8.4 10.5 22.5 -
- - - - - - - - - - - -
9.5 0.1 - - - 0.4 - - 0.4 6.4 21.2 0.1
4.1 7.5 19.9 1.4 0.9 0.8 15.9 0.3 0.4 12.0 6.4 0.9
0.2 12.5 2.5 44.9 - - - - 0.2 0.1 - 0.7
0.3 2.7 84.9 11.8 0.8 2.3 4.3 25.3 53.4 4.6 4.2 0.3
0.1 16.9 - 0.3 0.6 0.5 1.7 1.1 2.5 237.3 363.3 1.0
1.6 2.5 0.7 3.7 0.9 5.7 0.2 5.6 2.7 12.0 13.5 1.3
184.1 20.6 9.8 20.8 13.7 83.7 4.9 333.0 58.1 356.9 43.7 8.9
106.8 307.8 24.4 49.6 42.8 29.0 57.1 83.2 93.8 153.1 64.7 113.1
5.9 4.0 190.7 26.1 5.6 5.6 15.2 475.8 370.9 30.2 2.6 0.9
27.6 16.5 33.5 546.1 196.5 60.8 22.9 337.3 391.7 83.4 9.9 15.7
4.8 2.2 2.3 15.6 116.0 1.3 9.2 23.8 93.8 103.5 11.5 22.5
1.6 1.8 1.3 22.5 4.7 10.2 0.4 6.4 23.2 42.1 27.4 3.6
19.8 19.8 21.3 52.2 13.7 3.2 162.5 3.8 10.0 72.3 56.8 5.2
0.1 - - 0.1 0.1 - 0.1 0.8 0.9 1.7 0.5 0.1
0.4 0.2 0.3 0.2 0.2 0.1 0.8 2.6 1.8 11.8 18.8 1.0
156.1 130.3 34.6 99.1 115.9 68.6 58.7 276.5 292.9 876.5 299.3 252.7
18.6 13.6 6.0 18.8 6.0 3.9 4.4 16.8 14.3 124.9 7.9 16.3
10

TABLE 2: BRISBANE-MORETON INDUSTRY BY INDUSTRY FLOW TABLE 1996-97DIRECT ALLOCATION OF COMPETING IMPORTS, BASIC PRICES, RECORDING INTRA-INDUSTRY FLOWS, 34 INDUSTRIES ($ MILLION)
INDUSTRY DESCRIPTION
24 Road transport
25 Rail and pipeline transport
26 Other transport
27 Communication services
28 Finance, property and business services
29 Ownership of dwellings
30 Government administration and defence
31 Education
32 Health and community services
33 Cultural and recreational services
34 Personal and other services
T1 Total intermediate usage
P1 Compensation of employees
P2 Gross operating surplus and mixed income
P3 Taxes less subsidies on products
P4 Taxes less subsidies on production
P5 Complementary imports
P6 Imported inputs
P6a Foreign and interstate
P6b Interregional
T2 Total production
Employment (fte persons)
13 14 15 16 17 18 19 20 21 22 23 24
61.6 29.8 182.0 54.3 15.9 22.4 6.5 94.4 91.8 327.9 25.3 314.3
7.0 23.7 69.2 28.6 8.1 1.8 11.1 10.0 19.2 49.5 14.0 0.7
68.9 48.7 12.8 54.0 14.6 4.3 6.2 5.0 41.7 659.1 25.6 40.2
19.6 10.4 9.6 17.6 15.3 6.2 12.7 9.9 15.3 507.9 68.1 72.7
161.5 119.3 46.1 159.1 78.5 24.6 110.7 392.8 616.5 3,057.6 492.1 244.6
- - - - - - - - - - - -
16.7 3.2 1.6 7.4 3.0 1.0 4.2 9.1 10.6 48.3 3.2 71.5
1.1 1.1 0.7 1.3 1.1 0.2 1.1 1.3 0.8 5.7 2.2 1.4
2.9 3.8 0.2 0.4 0.5 0.1 0.2 0.2 0.9 5.0 0.9 0.4
5.1 1.3 0.5 0.6 1.3 0.4 0.4 0.2 0.1 81.1 39.7 1.5
2.9 1.9 0.9 1.9 1.3 0.5 0.8 0.6 1.4 11.0 5.3 1.5
889.1 806.2 755.7 1,238.5 657.9 337.9 512.3 2,119.1 2,217.7 6,892.1 1,650.6 1,193.2
605.8 399.8 257.8 636.6 685.1 264.5 246.2 450.4 1,019.2 4,822.3 1,109.5 462.8
334.7 361.4 211.4 413.7 166.6 90.4 609.6 1,007.4 1,067.4 1,732.3 561.5 669.2
18.7 18.8 7.4 9.7 17.6 4.4 17.6 33.0 57.5 241.3 153.7 79.8
27.5 31.2 14.3 25.7 29.6 8.8 -0.9 28.0 49.5 364.5 35.3 51.9
- 8.7 - - 0.2 - - - - - - -
552.0 2,749.4 143.7 972.4 839.2 190.6 157.6 633.8 757.8 1,384.5 530.4 304.2
508.2 2,417.7 111.1 916.2 807.1 167.7 94.2 593.0 708.2 1,241.2 412.4 288.4
43.8 331.8 32.6 56.2 32.1 22.9 63.4 40.8 49.6 143.3 118.0 15.8
2,427.6 4,375.5 1,390.3 3,296.7 2,396.3 896.6 1,542.5 4,271.5 5,169.1 15,436.4 4,041.1 2,761.1
14,579 8,493 5,087 15,549 16,232 8,239 6,537 21,587 50,825 169,583 41,597 21,802
11

TABLE 2: BRISBANE-MORETON INDUSTRY BY INDUSTRY FLOW TABLE 1996-97DIRECT ALLOCATION OF COMPETING IMPORTS, BASIC PRICES, RECORDING INTRA-INDUSTRY FLOWS, 34 INDUSTRIES ($ MILLION)
INDUSTRY DESCRIPTION
1 Sheep
2 Grains
3 Beef cattle
4 Dairy cattle and pigs
5 Other agriculture
6 Sugar cane growing
7 Forestry and fishing
8 Coal, oil and gas
9 Non-ferrous metal ores
10 Other mining
11 Food manufacturing
12 Textiles, clothing and footwear
13 Wood and paper manufacturing
14 Chemicals, petroleum and coal products
15 Non-metallic mineral products
16 Metals, metal products
17 Machinery, appliances and equipment
18 Miscellaneous manufacturing
19 Electricity supply, gas and water
20 Residential building construction
21 Other construction
22 Trade
23 Accommodation, cafes and restaurants
25 26 27 28 29 30 31 32 33 34T4 Total
intermediate usage
- - - - - - - - - - -
- - - - - - - - - - 3.7
- - - - - - - - - - 77.9
- - - - - - - - - - 127.3
0.1 0.5 - 18.5 - 3.0 0.1 0.9 38.7 2.5 270.0
- - - - - - - - - - 30.7
0.6 - - 0.5 - - - 0.2 0.3 0.1 41.4
0.2 0.4 2.7 6.1 0.2 1.7 0.6 4.3 0.5 0.6 96.6
- 0.3 0.1 - - - - - - - 62.7
0.3 0.8 0.3 15.2 3.3 3.6 0.1 3.6 12.4 1.4 260.9
1.7 2.0 4.9 44.8 1.0 7.0 4.9 12.2 31.8 6.1 1,289.1
2.1 1.2 1.0 9.5 0.9 2.9 1.5 8.2 3.0 3.6 115.0
10.3 18.8 29.0 234.4 32.9 78.9 29.2 13.3 23.7 15.0 1,722.0
19.6 382.4 35.9 238.9 42.7 57.9 3.6 39.9 18.9 27.7 2,229.9
0.1 0.2 0.1 6.5 35.8 10.2 0.3 4.1 0.1 4.5 1,215.2
73.1 24.5 33.8 24.6 103.5 24.3 17.2 9.0 15.7 6.0 2,215.0
94.2 48.4 16.3 50.0 2.7 116.8 6.1 17.8 9.8 5.0 815.7
1.0 0.9 4.1 41.4 3.8 42.8 13.7 3.9 5.8 4.3 278.9
14.2 23.5 10.1 209.8 18.4 28.8 25.6 29.5 17.1 9.0 895.6
0.1 0.3 0.1 8.3 186.7 1.5 0.1 1.4 0.3 0.2 203.5
7.8 4.2 0.2 24.7 0.6 31.4 0.2 0.9 0.4 0.2 112.5
38.8 166.6 208.8 560.5 94.0 76.7 57.3 102.3 96.6 54.0 4,537.4
1.6 27.3 23.6 355.9 - 47.8 8.0 17.5 26.2 9.3 827.2
12

TABLE 2: BRISBANE-MORETON INDUSTRY BY INDUSTRY FLOW TABLE 1996-97DIRECT ALLOCATION OF COMPETING IMPORTS, BASIC PRICES, RECORDING INTRA-INDUSTRY FLOWS, 34 INDUSTRIES ($ MILLION)
INDUSTRY DESCRIPTION
24 Road transport
25 Rail and pipeline transport
26 Other transport
27 Communication services
28 Finance, property and business services
29 Ownership of dwellings
30 Government administration and defence
31 Education
32 Health and community services
33 Cultural and recreational services
34 Personal and other services
T1 Total intermediate usage
P1 Compensation of employees
P2 Gross operating surplus and mixed income
P3 Taxes less subsidies on products
P4 Taxes less subsidies on production
P5 Complementary imports
P6 Imported inputs
P6a Foreign and interstate
P6b Interregional
T2 Total production
Employment (fte persons)
25 26 27 28 29 30 31 32 33 34T4 Total
intermediate usage
4.7 62.6 35.5 86.4 4.2 25.6 10.2 23.7 36.9 11.9 1,887.8
1.4 18.1 11.6 101.2 0.5 4.2 2.6 9.7 3.7 1.7 470.1
2.5 430.8 78.1 554.3 0.6 106.5 14.8 23.0 22.2 9.9 2,315.1
7.7 60.1 37.7 608.3 1.4 134.2 31.3 66.4 55.9 33.0 1,837.6
129.5 417.2 147.9 7,669.9 551.1 450.2 67.1 258.4 294.3 135.1 15,885.7
- - - - - - - - - - -
3.3 31.4 17.6 117.9 1.3 304.6 13.7 9.9 3.9 3.5 704.8
0.7 3.8 0.6 56.1 - 6.3 5.6 3.3 1.6 2.6 103.1
0.2 2.4 2.5 9.8 - 7.0 1.7 49.4 6.3 2.4 169.9
0.3 2.9 1.3 240.7 - 7.8 11.1 6.4 192.6 3.9 604.3
0.4 1.2 1.5 37.7 - 7.6 2.6 13.5 4.0 3.4 105.6
416.4 1,732.9 705.5 11,331.9 1,085.3 1,589.0 329.3 732.9 922.8 356.9 41,512.2
266.8 983.2 787.4 4,692.2 - 2,004.8 2,425.6 2,773.8 491.8 1,051.5 27,643.5
103.0 1,230.2 906.5 3,358.8 4,512.3 325.4 296.0 513.9 404.4 224.7 19,877.5
5.9 43.4 38.5 138.6 29.4 15.7 8.3 22.1 25.8 15.0 1,053.8
-2.9 37.0 49.4 511.1 348.5 -4.1 31.4 39.1 21.2 27.1 1,802.2
- - - - - - - - - - 9.0
57.8 496.3 235.4 1,126.7 114.9 321.1 102.7 290.7 325.6 165.9 13,932.2
39.2 457.1 220.7 929.1 103.5 277.7 88.4 266.7 277.3 154.6 11,849.3
18.6 39.2 14.6 197.5 11.4 43.4 14.3 24.0 48.3 11.3 2,082.9
847.1 4,522.8 2,722.6 21,158.4 6,090.3 4,251.8 3,193.3 4,372.6 2,191.6 1,841.0 105,828.6
7,083 17,692 17,835 128,225 - 43,683 57,735 74,580 19,797 31,624 813,415
13

TABLE 2: BRISBANE-MORETON INDUSTRY BY INDUSTRY FLOW TABLE 1996-97DIRECT ALLOCATION OF COMPETING IMPORTS, BASIC PRICES, RECORDING INTRA-INDUSTRY FLOWS, 34 INDUSTRIES ($ MILLION)
INDUSTRY DESCRIPTION
1 Sheep
2 Grains
3 Beef cattle
4 Dairy cattle and pigs
5 Other agriculture
6 Sugar cane growing
7 Forestry and fishing
8 Coal, oil and gas
9 Non-ferrous metal ores
10 Other mining
11 Food manufacturing
12 Textiles, clothing and footwear
13 Wood and paper manufacturing
14 Chemicals, petroleum and coal products
15 Non-metallic mineral products
16 Metals, metal products
17 Machinery, appliances and equipment
18 Miscellaneous manufacturing
19 Electricity supply, gas and water
20 Residential building construction
21 Other construction
22 Trade
23 Accommodation, cafes and restaurants
Household Government Private Public enterprise
General government
Change in inventories Total Foreign and
interstate InterregionalTotal final
demand (Q1 to Q7)
Total production
Q1 Q2 Q3 Q4 Q5 Q6 Q7 Q7a Q7b
- - - - - - - - - - 0.1
0.3 - - - - - 8.2 5.8 2.4 8.5 12.2
0.4 - 2.0 - - -5.0 8.0 5.7 2.3 5.5 83.3
0.3 - 3.7 - - -2.5 3.6 - 3.6 5.2 132.5
164.9 4.9 - - - 0.2 225.9 110.2 115.7 395.9 665.9
- - - - - - - - - - 30.7
43.1 14.8 0.3 - 0.2 - 9.7 2.6 7.2 68.1 109.5
13.8 - - - - - 66.1 66.1 - 79.9 176.5
- - - - - -36.4 100.3 100.3 - 63.9 126.6
2.5 4.7 14.9 0.1 - - 48.6 8.3 40.3 70.7 331.6
1,690.7 - 22.9 0.1 - 4.3 1,419.6 1,066.5 353.1 3,137.6 4,426.8
106.2 - 1.0 1.5 1.6 0.7 310.7 310.7 - 421.8 536.7
296.4 6.1 29.9 9.0 6.5 -3.0 360.7 328.6 32.1 705.7 2,427.7
347.0 57.4 19.9 - - 9.9 1,711.3 1,134.5 576.8 2,145.6 4,375.5
11.4 - 2.4 - - 3.9 157.4 90.5 66.9 175.1 1,390.2
56.7 - 63.6 9.4 10.9 3.0 938.2 726.1 212.1 1,081.8 3,296.8
86.4 - 310.1 11.9 14.9 3.7 1,153.6 955.1 198.5 1,580.6 2,396.3
107.3 - 270.4 12.9 37.5 13.9 175.7 116.9 58.9 617.7 896.6
587.1 20.3 2.1 27.5 - - 9.9 6.4 3.4 646.9 1,542.5
- - 3,978.8 78.9 10.2 - - - - 4,067.9 4,271.4
- 190.9 2,894.7 729.4 1,241.4 - 0.4 0.4 - 5,056.7 5,169.1
7,040.6 1.2 1,248.9 32.1 104.8 - 2,471.5 1,975.3 496.2 10,899.1 15,436.5
1,806.5 0.1 - - - - 1,407.3 1,119.4 287.9 3,213.8 4,041.1
ExportsFinal consumption expenditure Gross fixed capital formation
14

TABLE 2: BRISBANE-MORETON INDUSTRY BY INDUSTRY FLOW TABLE 1996-97DIRECT ALLOCATION OF COMPETING IMPORTS, BASIC PRICES, RECORDING INTRA-INDUSTRY FLOWS, 34 INDUSTRIES ($ MILLION)
INDUSTRY DESCRIPTION
24 Road transport
25 Rail and pipeline transport
26 Other transport
27 Communication services
28 Finance, property and business services
29 Ownership of dwellings
30 Government administration and defence
31 Education
32 Health and community services
33 Cultural and recreational services
34 Personal and other services
T1 Total intermediate usage
P1 Compensation of employees
P2 Gross operating surplus and mixed income
P3 Taxes less subsidies on products
P4 Taxes less subsidies on production
P5 Complementary imports
P6 Imported inputs
P6a Foreign and interstate
P6b Interregional
T2 Total production
Employment (fte persons)
Household Government Private Public enterprise
General government
Change in inventories Total Foreign and
interstate InterregionalTotal final
demand (Q1 to Q7)
Total production
Q1 Q2 Q3 Q4 Q5 Q6 Q7 Q7a Q7b
ExportsFinal consumption expenditure Gross fixed capital formation
349.4 61.3 31.2 0.8 1.7 2.7 426.2 340.8 85.4 873.3 2,761.1
211.2 15.2 2.7 0.1 0.1 0.1 147.5 108.3 39.2 377.0 847.1
331.3 312.5 12.7 0.2 0.3 11.2 1,539.7 1,362.7 177.0 2,207.9 4,523.0
611.9 3.6 7.9 - - - 261.6 180.8 80.8 885.0 2,722.6
2,076.7 247.3 1,004.6 91.9 84.9 0.2 1,767.8 511.2 1,256.6 5,273.5 21,159.2
5,918.4 4.1 - - - - 167.7 154.5 13.2 6,090.2 6,090.2
108.6 3,376.9 28.7 4.0 2.8 - 26.1 26.1 - 3,547.1 4,251.9
569.6 2,028.2 6.2 1.5 1.0 - 483.8 397.7 86.1 3,090.2 3,193.3
1,622.2 2,287.4 2.4 0.6 0.6 - 289.3 130.7 158.6 4,202.6 4,372.5
1,010.8 221.5 25.7 0.2 12.5 - 316.7 286.2 30.4 1,587.3 2,191.6
944.5 732.5 - - - - 58.4 55.4 3.0 1,735.4 1,841.0
26,116.5 9,590.9 9,987.5 1,012.1 1,531.9 7.0 16,071.5 11,683.9 4,387.6 64,317.4 105,829.6
- - - - - - - - - - 27,643.5
- - - - - - - - - - 19,877.5
2,235.8 - 443.2 13.5 11.1 2.2 171.9 171.9 - 2,877.6 3,931.5
- - 328.5 - - - - - - 328.5 2,130.8
19.9 - 21.1 - 0.1 0.7 - - - 41.9 50.8
6,825.7 245.9 2,603.5 141.9 235.2 73.1 394.6 394.6 - 10,519.9 24,452.1
6,015.9 245.2 2,527.0 100.3 233.2 79.9 394.6 394.6 - 9,596.0 21,445.3
809.9 0.7 76.5 41.6 2.1 -6.8 - - - 923.9 3,006.8
35,198.0 9,836.8 13,384.0 1,167.5 1,778.3 82.9 16,638.0 12,250.4 4,387.6 78,085.6 183,915.3
- - - - - - - - - - 813,415
15

TABLE 3: WIDE BAY-BURNETT INDUSTRY BY INDUSTRY FLOW TABLE 1996-97DIRECT ALLOCATION OF COMPETING IMPORTS, BASIC PRICES, RECORDING INTRA-INDUSTRY FLOWS, 34 INDUSTRIES ($ MILLION)
INDUSTRY DESCRIPTION 1 2 3 4 5 6 7 8 9 10 11 12
1 Sheep - - - - - - - - - - - -
2 Grains - 2.8 0.7 1.0 0.2 0.3 - - - - 10.1 -
3 Beef cattle - - 22.6 - - - - - - - 30.5 -
4 Dairy cattle and pigs - - - 5.0 - - - - - - 20.6 -
5 Other agriculture - 0.5 6.3 4.9 36.8 8.9 0.3 - - - 32.1 0.2
6 Sugar cane growing - - - - - 4.3 - - - - 147.6 -
7 Forestry and fishing - - 0.6 0.1 0.4 0.6 3.5 - - - 0.3 -
8 Coal, oil and gas - - - 0.2 - - 0.1 0.5 - - 2.3 0.1
9 Non-ferrous metal ores - - - - - - - - 0.2 0.1 - -
10 Other mining - - - - 0.1 0.2 0.1 5.7 1.5 0.5 2.5 -
11 Food manufacturing - - 5.0 19.9 4.5 1.3 2.3 - - - 50.2 1.4
12 Textiles, clothing and footwear - - - - 0.1 0.1 0.1 - - - 0.2 0.7
13 Wood and paper manufacturing - - 0.4 0.2 0.2 0.4 0.6 0.1 - - 2.4 0.1
14 Chemicals, petroleum and coal products - - 0.1 0.1 0.4 0.3 0.1 - - - 0.2 -
15 Non-metallic mineral products - - - - - - 1.2 0.1 0.1 0.1 0.4 -
16 Metals, metal products - - 0.1 0.3 0.4 0.8 1.2 0.4 0.2 0.2 3.8 -
17 Machinery, appliances and equipment - 0.4 0.3 0.4 0.6 0.2 5.8 3.5 1.0 1.5 0.2 -
18 Miscellaneous manufacturing - - - - - - 0.1 0.8 0.2 0.3 0.1 -
19 Electricity supply, gas and water - 0.2 1.1 2.1 1.1 1.7 0.2 1.6 0.7 - 9.3 0.2
20 Residential building construction - - - - - - - - - - - -
21 Other construction - 0.1 0.5 0.7 0.2 0.5 - 0.1 0.1 0.1 - -
22 Trade - 2.1 4.6 7.4 7.6 7.4 8.3 3.4 1.0 2.0 25.6 1.1
23 Accommodation, cafes and restaurants - 0.2 0.5 0.6 0.7 1.2 0.2 0.1 - 0.5 4.5 0.2
16

TABLE 3: WIDE BAY-BURNETT INDUSTRY BY INDUSTRY FLOW TABLE 1996-97DIRECT ALLOCATION OF COMPETING IMPORTS, BASIC PRICES, RECORDING INTRA-INDUSTRY FLOWS, 34 INDUSTRIES ($ MILLION)
INDUSTRY DESCRIPTION 1 2 3 4 5 6 7 8 9 10 11 12
24 Road transport - 1.4 4.1 3.6 4.7 3.7 0.8 1.3 0.2 1.6 34.6 0.3
25 Rail and pipeline transport - 0.5 0.1 0.4 0.3 0.2 - 12.6 0.1 - 3.3 -
26 Other transport - 0.2 0.2 0.2 0.2 0.2 0.1 0.2 - 0.2 2.3 0.1
27 Communication services - 0.2 1.7 1.3 0.9 1.5 0.4 0.3 0.3 0.4 2.8 0.1
28 Finance, property and business services - 1.3 7.1 4.0 5.1 7.0 2.0 4.4 0.6 2.7 21.9 0.8
29 Ownership of dwellings - - - - - - - - - - - -
30 Government administration and defence - - 0.1 - 0.4 0.4 0.2 0.6 0.1 0.4 2.5 -
31 Education - - - - - - - - - - 0.3 -
32 Health and community services - - 0.5 0.6 0.2 - - 3.2 - - 0.6 -
33 Cultural and recreational services - - 0.1 - 0.1 - - - - - 0.6 -
34 Personal and other services - - 0.1 - - - - 0.1 - - 0.2 -
T1 Total intermediate usage - 9.9 57.1 53.1 65.4 41.7 27.5 39.4 6.5 10.8 411.8 5.3
P1 Compensation of employees - 4.1 25.4 16.4 78.9 28.9 25.5 28.2 4.4 9.2 95.6 4.7
P2 Gross operating surplus and mixed income - 14.3 31.3 31.3 64.7 44.2 18.4 58.5 10.5 8.3 70.1 0.7
P3 Taxes less subsidies on products - 0.3 0.8 0.6 1.3 0.6 1.1 0.5 0.1 0.2 3.6 0.5
P4 Taxes less subsidies on production - 0.6 2.3 2.4 3.7 2.2 1.1 1.1 0.3 0.7 5.1 0.2
P5 Complementary imports - - - - - - - - - - - -
P6 Imported inputs - 6.5 27.4 28.9 56.8 34.5 25.8 32.6 7.2 12.3 177.7 4.0
P6a Foreign and interstate - 4.1 11.8 18.3 37.0 21.3 20.0 17.7 5.2 9.0 127.1 2.1
P6b Interregional - 2.3 15.6 10.6 19.8 13.2 5.8 14.9 2.0 3.3 50.5 1.9
T2 Total production - 35.7 144.3 132.5 270.8 152.0 99.4 160.3 29.1 41.5 763.8 15.4
Employment (fte persons) - 767 1,527 1,591 4,524 1,666 962 310 81 148 2,401 199
17

TABLE 3: WIDE BAY-BURNETT INDUSTRY BY INDUSTRY FLOW TABLE 1996-97DIRECT ALLOCATION OF COMPETING IMPORTS, BASIC PRICES, RECORDING INTRA-INDUSTRY FLOWS, 34 INDUSTRIES ($ MILLION)
INDUSTRY DESCRIPTION
1 Sheep
2 Grains
3 Beef cattle
4 Dairy cattle and pigs
5 Other agriculture
6 Sugar cane growing
7 Forestry and fishing
8 Coal, oil and gas
9 Non-ferrous metal ores
10 Other mining
11 Food manufacturing
12 Textiles, clothing and footwear
13 Wood and paper manufacturing
14 Chemicals, petroleum and coal products
15 Non-metallic mineral products
16 Metals, metal products
17 Machinery, appliances and equipment
18 Miscellaneous manufacturing
19 Electricity supply, gas and water
20 Residential building construction
21 Other construction
22 Trade
23 Accommodation, cafes and restaurants
13 14 15 16 17 18 19 20 21 22 23 24
- - - - - - - - - - - -
- - - - - - - - - - - -
- - - - - - - - - - - -
- - - - - - - - - - - -
- 0.1 - - - - 0.1 0.4 1.1 1.6 3.1 -
- - - - - - - - - - - -
12.8 - - - - - - - 0.1 1.5 4.2 -
0.4 - 1.1 - 0.4 - 76.4 - - 1.1 0.8 0.1
0.1 0.2 0.1 5.9 - 0.1 - - - - - -
- - 3.0 0.2 - - 0.6 1.4 3.3 0.2 0.3 -
- 0.1 - - - - 0.2 0.1 0.1 16.1 21.3 0.1
- - - - - 0.1 - 0.1 0.1 0.2 0.2 -
55.1 - 0.1 0.1 1.0 3.1 0.4 30.7 4.3 10.4 0.8 0.5
0.1 - - - 0.1 - 0.2 0.1 0.1 0.1 0.1 0.1
0.4 - 4.9 0.1 0.2 0.1 3.3 21.1 18.2 0.4 0.1 -
1.2 - 0.6 8.9 4.4 1.0 3.3 5.4 6.0 2.1 0.3 0.6
0.2 - 0.1 0.2 9.8 - 0.7 1.0 2.9 3.5 0.3 0.2
0.1 - - 0.1 0.2 0.2 - 0.3 0.5 0.5 0.5 0.2
2.8 0.3 1.4 1.8 2.4 0.1 17.0 0.3 1.0 7.3 6.0 0.6
- - - - - - - 0.1 0.1 0.1 - -
0.1 - - - - - 0.3 0.2 0.1 0.6 1.4 0.1
9.9 0.8 1.2 1.0 14.2 1.7 12.1 14.0 17.1 32.4 16.6 15.9
0.9 0.1 0.2 0.1 0.7 0.1 1.2 0.9 0.9 5.8 0.5 1.1
18

TABLE 3: WIDE BAY-BURNETT INDUSTRY BY INDUSTRY FLOW TABLE 1996-97DIRECT ALLOCATION OF COMPETING IMPORTS, BASIC PRICES, RECORDING INTRA-INDUSTRY FLOWS, 34 INDUSTRIES ($ MILLION)
INDUSTRY DESCRIPTION
24 Road transport
25 Rail and pipeline transport
26 Other transport
27 Communication services
28 Finance, property and business services
29 Ownership of dwellings
30 Government administration and defence
31 Education
32 Health and community services
33 Cultural and recreational services
34 Personal and other services
T1 Total intermediate usage
P1 Compensation of employees
P2 Gross operating surplus and mixed income
P3 Taxes less subsidies on products
P4 Taxes less subsidies on production
P5 Complementary imports
P6 Imported inputs
P6a Foreign and interstate
P6b Interregional
T2 Total production
Employment (fte persons)
13 14 15 16 17 18 19 20 21 22 23 24
14.8 0.2 6.2 0.5 2.2 0.6 1.4 5.3 5.7 12.2 1.6 20.8
0.5 0.2 2.2 0.3 1.1 - 3.1 0.4 0.9 1.7 0.7 -
1.5 0.1 0.1 0.1 0.5 - 0.3 0.1 0.7 6.0 0.4 0.8
1.3 0.1 0.4 0.2 2.4 0.2 3.2 0.7 1.0 24.8 4.6 5.5
9.6 0.6 1.5 1.7 6.5 0.6 20.9 22.0 40.2 142.4 27.7 15.6
- - - - - - - - - - - -
0.9 - 0.1 0.1 0.4 - 0.8 0.6 0.8 3.4 0.2 6.3
0.1 - - - 0.1 - 0.3 0.1 - 0.3 0.1 0.1
0.2 - - - - - - - 0.1 0.3 0.1 -
0.2 - - - 0.1 - 0.1 - - 4.2 2.0 0.1
0.1 - - - 0.1 - 0.1 - 0.1 0.6 0.3 0.1
113.5 3.0 23.2 21.5 47.0 8.3 146.1 105.4 105.5 279.9 94.4 68.9
69.2 5.2 15.7 29.6 71.8 5.4 40.5 38.2 129.1 398.4 88.5 41.1
41.8 2.3 8.7 5.7 15.0 2.4 281.2 70.1 115.4 139.0 43.7 60.5
1.3 0.2 0.7 0.5 1.3 0.1 6.8 2.3 4.4 19.2 12.1 6.9
3.2 0.4 1.3 1.7 2.1 0.3 2.2 1.9 3.8 23.4 2.8 4.5
- 2.3 - - - - - - - - - -
55.4 14.8 14.3 15.1 120.6 7.7 57.5 82.2 159.0 259.7 66.7 57.5
42.0 13.4 7.4 14.3 102.0 5.8 40.4 54.1 124.6 185.8 48.6 44.3
13.5 1.4 7.0 0.9 18.6 1.8 17.2 28.1 34.4 73.9 18.1 13.2
284.4 28.1 63.9 74.2 257.8 24.1 534.3 300.1 517.3 1,119.6 308.1 239.4
1,825 144 397 583 1,815 247 777 1,819 4,408 13,873 3,284 1,870
19

TABLE 3: WIDE BAY-BURNETT INDUSTRY BY INDUSTRY FLOW TABLE 1996-97DIRECT ALLOCATION OF COMPETING IMPORTS, BASIC PRICES, RECORDING INTRA-INDUSTRY FLOWS, 34 INDUSTRIES ($ MILLION)
INDUSTRY DESCRIPTION
1 Sheep
2 Grains
3 Beef cattle
4 Dairy cattle and pigs
5 Other agriculture
6 Sugar cane growing
7 Forestry and fishing
8 Coal, oil and gas
9 Non-ferrous metal ores
10 Other mining
11 Food manufacturing
12 Textiles, clothing and footwear
13 Wood and paper manufacturing
14 Chemicals, petroleum and coal products
15 Non-metallic mineral products
16 Metals, metal products
17 Machinery, appliances and equipment
18 Miscellaneous manufacturing
19 Electricity supply, gas and water
20 Residential building construction
21 Other construction
22 Trade
23 Accommodation, cafes and restaurants
25 26 27 28 29 30 31 32 33 34T4 Total
intermediate usage
- - - - - - - - - - -
- - - - - - - - - - 15.1
- - - - - - - - - - 53.2
- - - - - - - - - - 25.5
- - - 1.5 - 0.5 - 0.1 3.2 0.3 101.9
- - - - - - - - - - 152.0
0.1 - - 0.1 - - - - - - 24.7
- - 0.3 0.3 - 0.3 0.1 0.5 - 0.1 85.3
- - - - - - - - - - 6.7
- - - 0.6 0.3 0.3 - 0.2 0.5 0.1 21.6
0.1 0.1 0.2 1.6 0.1 0.6 0.3 0.6 1.8 0.3 128.5
0.1 - - 0.2 - - 0.1 0.2 0.1 0.1 2.8
0.2 0.3 0.7 3.3 3.9 3.0 1.6 0.3 0.6 0.3 125.2
- 0.1 - 0.1 0.1 - - 0.1 - - 2.8
- - - 0.1 2.1 0.7 - 0.2 - 0.1 53.8
2.0 0.5 0.7 0.5 3.7 0.6 0.8 0.4 0.4 0.2 51.2
4.8 1.7 0.2 1.0 - 1.2 0.2 0.3 0.1 0.1 42.7
0.1 - 0.2 0.5 0.3 0.4 0.5 0.1 0.1 0.1 6.4
1.5 1.0 0.9 13.8 2.6 3.5 4.0 3.0 1.1 0.7 91.1
- - - 0.4 18.0 0.1 - 0.1 - - 19.1
0.6 0.1 - 1.2 0.1 1.0 - 0.1 - - 8.5
2.5 4.0 11.4 16.9 8.1 4.4 5.2 8.5 4.1 2.8 275.5
0.1 0.7 1.3 11.6 - 3.8 0.8 1.0 1.0 0.4 42.0
20

TABLE 3: WIDE BAY-BURNETT INDUSTRY BY INDUSTRY FLOW TABLE 1996-97DIRECT ALLOCATION OF COMPETING IMPORTS, BASIC PRICES, RECORDING INTRA-INDUSTRY FLOWS, 34 INDUSTRIES ($ MILLION)
INDUSTRY DESCRIPTION
24 Road transport
25 Rail and pipeline transport
26 Other transport
27 Communication services
28 Finance, property and business services
29 Ownership of dwellings
30 Government administration and defence
31 Education
32 Health and community services
33 Cultural and recreational services
34 Personal and other services
T1 Total intermediate usage
P1 Compensation of employees
P2 Gross operating surplus and mixed income
P3 Taxes less subsidies on products
P4 Taxes less subsidies on production
P5 Complementary imports
P6 Imported inputs
P6a Foreign and interstate
P6b Interregional
T2 Total production
Employment (fte persons)
25 26 27 28 29 30 31 32 33 34T4 Total
intermediate usage
0.3 1.5 2.0 3.0 0.4 1.9 1.0 1.5 1.5 0.6 141.4
0.1 0.3 0.5 2.6 - 0.2 0.2 0.5 0.1 0.1 33.5
- 4.5 1.4 4.6 - 1.8 0.3 0.3 0.2 0.2 27.8
0.4 1.7 2.4 21.4 0.1 11.4 3.3 4.7 2.6 1.9 104.4
6.9 9.7 8.0 259.8 47.8 30.3 5.8 15.9 13.1 6.6 750.1
- - - - - - - - - - -
0.3 0.9 1.2 4.9 0.1 21.4 1.6 0.8 0.2 0.2 50.0
- 0.1 - 1.8 - 0.4 0.4 0.2 0.1 0.1 4.7
- 0.1 0.1 0.3 - 0.3 0.2 3.6 0.2 0.1 11.0
- 0.1 0.1 6.7 - 0.5 0.8 0.3 5.5 0.2 21.7
- - 0.1 1.1 - 0.3 0.2 0.9 0.2 0.2 5.2
20.1 27.5 31.8 359.9 87.9 89.0 27.5 44.5 37.0 15.6 2,485.3
26.6 26.4 30.9 186.0 - 177.1 216.3 187.3 26.0 64.9 2,195.4
11.1 41.5 79.3 178.3 482.3 34.0 34.4 80.1 48.8 69.2 2,197.0
0.5 1.3 2.6 5.3 3.2 1.5 1.0 1.8 1.2 0.8 84.6
-0.2 1.0 3.4 19.1 37.5 -1.5 3.6 3.3 0.9 1.5 135.9
- - - - - - - - - - 2.3
13.1 50.0 34.7 228.2 41.3 57.4 22.3 44.9 34.7 20.6 1,871.4
7.3 32.7 25.8 130.5 22.0 39.4 17.4 34.2 26.6 16.9 1,309.0
5.8 17.3 9.0 97.6 19.3 18.0 5.0 10.7 8.1 3.7 562.4
71.1 147.7 182.7 976.8 652.2 357.4 305.1 361.9 148.6 172.5 8,972.1
808 502 726 5,317 - 3,958 6,190 5,567 1,162 1,879 71,327
21

TABLE 3: WIDE BAY-BURNETT INDUSTRY BY INDUSTRY FLOW TABLE 1996-97DIRECT ALLOCATION OF COMPETING IMPORTS, BASIC PRICES, RECORDING INTRA-INDUSTRY FLOWS, 34 INDUSTRIES ($ MILLION)
INDUSTRY DESCRIPTION
1 Sheep
2 Grains
3 Beef cattle
4 Dairy cattle and pigs
5 Other agriculture
6 Sugar cane growing
7 Forestry and fishing
8 Coal, oil and gas
9 Non-ferrous metal ores
10 Other mining
11 Food manufacturing
12 Textiles, clothing and footwear
13 Wood and paper manufacturing
14 Chemicals, petroleum and coal products
15 Non-metallic mineral products
16 Metals, metal products
17 Machinery, appliances and equipment
18 Miscellaneous manufacturing
19 Electricity supply, gas and water
20 Residential building construction
21 Other construction
22 Trade
23 Accommodation, cafes and restaurants
Household Government Private Public enterprise
General government
Change in inventories Total Foreign and
interstate InterregionalTotal final
demand (Q1 to Q7)
Total production
Q1 Q2 Q3 Q4 Q5 Q6 Q7 Q7a Q7b
- - - - - - - - - - -
1.4 - - - - 0.9 18.2 12.8 5.4 20.5 35.7
0.2 - 15.7 - - -8.4 83.6 - 83.6 91.1 144.3
0.1 - 5.3 - - -4.4 106.0 0.2 105.9 107.0 132.5
23.7 0.5 - - - 0.2 144.4 88.2 56.2 168.9 270.8
- - - - - - - - - - 152.0
10.4 1.6 1.0 - - - 61.6 15.5 46.1 74.8 99.4
0.7 - - - - - 74.3 72.4 1.9 75.0 160.3
- - - - - -1.1 23.5 23.4 - 22.3 29.1
0.3 0.5 6.4 - - - 12.7 1.2 11.5 19.8 41.5
73.5 - 2.6 - - 1.1 558.1 505.5 52.6 635.4 763.8
10.2 - 0.1 - - 0.1 2.2 2.2 - 12.6 15.4
13.3 0.6 1.8 0.9 - -16.0 158.6 77.8 80.7 159.2 284.4
8.3 0.7 - - - - 16.2 3.8 12.4 25.2 28.1
0.5 - 0.1 - - 0.2 9.3 4.2 5.1 10.1 63.9
5.9 - 0.9 0.3 0.2 0.1 15.6 12.3 3.3 23.0 74.2
- - 13.0 14.8 0.1 0.3 187.0 22.6 164.3 215.1 257.8
8.8 - 2.5 2.6 0.5 0.2 3.2 0.4 2.8 17.7 24.1
98.4 2.3 - 3.8 - - 338.6 16.5 322.1 443.2 534.3
- - 261.4 18.6 1.1 - - - - 281.0 300.1
- 21.2 162.8 175.6 149.1 - 0.1 - 0.1 508.8 517.2
611.2 0.1 35.2 7.7 4.4 - 185.4 150.7 34.7 844.1 1,119.6
144.2 - - - - - 122.0 87.6 34.3 266.1 308.1
ExportsFinal consumption expenditure Gross fixed capital formation
22

TABLE 3: WIDE BAY-BURNETT INDUSTRY BY INDUSTRY FLOW TABLE 1996-97DIRECT ALLOCATION OF COMPETING IMPORTS, BASIC PRICES, RECORDING INTRA-INDUSTRY FLOWS, 34 INDUSTRIES ($ MILLION)
INDUSTRY DESCRIPTION
24 Road transport
25 Rail and pipeline transport
26 Other transport
27 Communication services
28 Finance, property and business services
29 Ownership of dwellings
30 Government administration and defence
31 Education
32 Health and community services
33 Cultural and recreational services
34 Personal and other services
T1 Total intermediate usage
P1 Compensation of employees
P2 Gross operating surplus and mixed income
P3 Taxes less subsidies on products
P4 Taxes less subsidies on production
P5 Complementary imports
P6 Imported inputs
P6a Foreign and interstate
P6b Interregional
T2 Total production
Employment (fte persons)
Household Government Private Public enterprise
General government
Change in inventories Total Foreign and
interstate InterregionalTotal final
demand (Q1 to Q7)
Total production
Q1 Q2 Q3 Q4 Q5 Q6 Q7 Q7a Q7b
ExportsFinal consumption expenditure Gross fixed capital formation
32.2 6.8 2.2 0.1 0.1 0.2 56.6 46.5 10.1 98.1 239.4
16.7 1.6 0.1 - - - 19.2 13.0 6.2 37.6 71.1
29.6 28.3 0.1 - - - 61.9 50.9 11.0 119.9 147.7
54.8 0.4 0.5 - - - 22.7 12.5 10.2 78.3 182.7
160.7 27.6 18.0 7.4 1.5 - 11.4 6.5 4.9 226.7 976.9
626.9 0.5 - - - - 24.8 23.5 1.4 652.2 652.2
11.6 292.4 2.7 0.4 0.2 - - - - 307.4 357.4
43.8 243.4 0.5 0.1 - - 12.5 8.6 4.0 300.4 305.1
140.9 197.4 0.2 - - - 12.4 0.1 12.3 350.9 361.9
102.0 23.3 1.2 - 0.4 - - - - 126.9 148.6
80.3 84.2 - - - - 2.8 2.2 0.6 167.3 172.5
2,310.8 933.4 534.2 232.4 157.5 -26.7 2,345.0 1,261.3 1,083.7 6,486.7 8,972.0
- - - - - - - - - - 2,195.4
- - - - - - - - - - 2,197.0
135.3 - 13.4 1.5 0.4 0.8 35.5 35.5 - 186.9 271.4
- - 9.8 - - - - - - 9.8 145.8
1.7 - 1.2 - - -0.2 - - - 2.7 5.0
615.9 23.1 179.2 27.0 25.0 2.4 - - - 872.6 2,744.0
214.2 17.0 154.2 23.8 24.1 3.3 - - - 436.6 1,745.6
401.7 6.1 25.0 3.2 0.8 -0.8 - - - 436.0 998.4
3,063.7 956.6 737.9 260.9 182.9 -23.7 2,380.5 1,296.8 1,083.7 7,558.8 16,530.8
- - - - - - - - - - 71,327
23

TABLE 4: DARLING DOWNS INDUSTRY BY INDUSTRY FLOW TABLE 1996-97DIRECT ALLOCATION OF COMPETING IMPORTS, BASIC PRICES, RECORDING INTRA-INDUSTRY FLOWS, 34 INDUSTRIES ($ MILLION)
INDUSTRY DESCRIPTION 1 2 3 4 5 6 7 8 9 10 11 12
1 Sheep 2.0 - - - - - - - - - 14.6 11.5
2 Grains 0.1 24.3 1.6 1.0 0.7 - - - - - 28.0 -
3 Beef cattle - - 34.3 - - - - - - - 210.7 -
4 Dairy cattle and pigs - - - 5.8 - - - - - - 119.8 -
5 Other agriculture 1.7 5.1 15.7 5.6 48.9 - 0.1 - - - 60.6 1.4
6 Sugar cane growing - - - - - - - - - - - -
7 Forestry and fishing - - 0.6 - 0.3 - 0.4 - - - - -
8 Coal, oil and gas - 0.1 - - - - - - - - 0.3 -
9 Non-ferrous metal ores - - - - - - - - - - - -
10 Other mining - 0.2 0.2 - 0.4 - - 0.7 - 0.8 0.9 -
11 Food manufacturing 0.4 0.1 14.0 30.6 12.3 - - - - - 115.4 5.2
12 Textiles, clothing and footwear 0.1 0.2 0.2 - 0.3 - - - - - 0.8 4.2
13 Wood and paper manufacturing 0.1 0.5 4.3 0.3 0.6 - - - - - 7.7 0.2
14 Chemicals, petroleum and coal products 0.1 0.6 0.5 0.2 1.4 - - - - - 0.2 -
15 Non-metallic mineral products - - - - - - 0.2 - - - 0.1 -
16 Metals, metal products 0.1 0.4 0.4 0.7 1.3 - 0.1 - - 0.1 3.6 0.1
17 Machinery, appliances and equipment 0.2 4.0 1.0 0.5 1.3 - 0.8 0.3 - 1.6 0.4 -
18 Miscellaneous manufacturing - - - - 0.1 - - 0.1 - 0.5 0.1 -
19 Electricity supply, gas and water 0.1 1.5 1.6 1.4 1.6 - - 0.1 - - 15.4 0.5
20 Residential building construction - - - - - - - - - - - -
21 Other construction 0.1 1.0 1.3 0.8 0.5 - - - - 0.1 - -
22 Trade 2.2 28.2 14.1 10.3 17.1 - 1.5 0.4 - 2.3 45.6 6.6
23 Accommodation, cafes and restaurants 0.2 2.1 1.1 0.6 1.5 - - - - 0.2 2.5 0.4
24

TABLE 4: DARLING DOWNS INDUSTRY BY INDUSTRY FLOW TABLE 1996-97DIRECT ALLOCATION OF COMPETING IMPORTS, BASIC PRICES, RECORDING INTRA-INDUSTRY FLOWS, 34 INDUSTRIES ($ MILLION)
INDUSTRY DESCRIPTION 1 2 3 4 5 6 7 8 9 10 11 12
24 Road transport 0.7 17.8 10.8 3.7 8.5 - 0.1 0.1 - 1.8 80.7 1.3
25 Rail and pipeline transport 0.1 5.3 0.3 0.3 0.6 - - 1.1 - 0.1 6.0 0.3
26 Other transport 0.1 5.3 1.3 0.4 0.8 - - - - 0.1 4.7 0.2
27 Communication services 0.4 2.2 5.0 1.4 1.8 - 0.1 - - 0.3 6.6 0.3
28 Finance, property and business services 1.8 14.8 20.1 4.2 9.0 - 0.2 0.3 - 0.9 41.9 2.2
29 Ownership of dwellings - - - - - - - - - - - -
30 Government administration and defence - 0.4 0.2 - 0.8 - - 0.1 - 0.6 3.1 0.1
31 Education - - - - - - - - - - 0.6 -
32 Health and community services - - 1.3 0.7 0.3 - - 0.2 - - 2.1 -
33 Cultural and recreational services - - - - - - - - - - 0.3 -
34 Personal and other services - 0.1 0.3 - - - - - - - 0.5 -
T1 Total intermediate usage 10.3 114.2 130.5 68.8 110.2 - 3.7 3.5 - 9.5 773.4 34.8
P1 Compensation of employees 4.4 29.8 35.1 16.3 53.9 - 3.8 2.5 - 11.5 182.5 10.5
P2 Gross operating surplus and mixed income 10.4 179.3 114.9 48.8 172.2 - 2.7 5.2 - 4.5 133.2 5.5
P3 Taxes less subsidies on products 0.2 3.0 2.0 0.7 2.6 - 0.1 - - 0.3 6.2 0.9
P4 Taxes less subsidies on production 0.4 6.7 5.6 3.0 7.1 - - 0.1 - 0.6 8.4 0.3
P5 Complementary imports - - - - - - - - - - - -
P6 Imported inputs 4.8 70.7 56.6 38.5 120.8 - 4.5 3.1 - 11.2 263.2 19.9
P6a Foreign and interstate 2.7 37.6 29.3 26.3 79.8 - 3.1 1.7 - 9.6 185.3 15.8
P6b Interregional 2.0 33.1 27.3 12.2 41.0 - 1.4 1.3 - 1.7 77.8 4.0
T2 Total production 30.5 403.8 344.6 176.2 466.8 - 14.9 14.3 - 37.6 1,366.9 71.9
Employment (fte persons) 400 8,926 2,464 1,701 2,650 - 226 22 - 268 4,127 282
25

TABLE 4: DARLING DOWNS INDUSTRY BY INDUSTRY FLOW TABLE 1996-97DIRECT ALLOCATION OF COMPETING IMPORTS, BASIC PRICES, RECORDING INTRA-INDUSTRY FLOWS, 34 INDUSTRIES ($ MILLION)
INDUSTRY DESCRIPTION
1 Sheep
2 Grains
3 Beef cattle
4 Dairy cattle and pigs
5 Other agriculture
6 Sugar cane growing
7 Forestry and fishing
8 Coal, oil and gas
9 Non-ferrous metal ores
10 Other mining
11 Food manufacturing
12 Textiles, clothing and footwear
13 Wood and paper manufacturing
14 Chemicals, petroleum and coal products
15 Non-metallic mineral products
16 Metals, metal products
17 Machinery, appliances and equipment
18 Miscellaneous manufacturing
19 Electricity supply, gas and water
20 Residential building construction
21 Other construction
22 Trade
23 Accommodation, cafes and restaurants
13 14 15 16 17 18 19 20 21 22 23 24
- - - - - - - - - - - -
- 0.1 - - - - - - - - - -
- - - - - - - - - - - -
- - - - - - - - - - - -
- - - - - - - 0.2 1.2 1.0 2.1 -
- - - - - - - - - - - -
1.5 - - - - - - - - 0.3 1.1 -
- - 0.1 - - - - - - 0.1 0.1 -
- - - - - - - - - - - -
- - 2.5 0.3 0.1 - 0.4 1.1 4.8 0.3 0.2 -
- 0.1 - - 0.1 - 0.1 - 0.1 11.6 17.6 0.1
0.1 - - 0.1 0.1 0.2 - 0.2 0.2 0.6 0.5 0.1
9.1 0.1 0.1 0.7 0.9 3.4 0.2 10.1 4.2 9.1 1.1 0.7
0.1 0.1 - - 0.1 - 0.1 0.1 0.2 0.1 0.1 0.2
0.1 - 2.2 0.2 0.2 - 0.6 8.0 12.4 0.4 - -
0.7 0.1 0.5 8.9 8.8 0.4 1.0 7.4 13.7 2.1 0.2 0.5
0.2 - 0.1 0.5 11.6 - 0.4 1.4 5.6 4.3 0.6 0.5
- - - 0.4 0.1 0.1 - 0.1 0.7 0.7 0.5 0.1
0.7 0.1 0.5 1.4 1.5 0.1 12.0 0.1 0.7 3.6 2.5 0.4
- - - - - - - - 0.1 0.1 - -
- - - - - - 0.1 0.1 0.1 0.7 1.0 0.1
6.2 1.2 0.8 3.0 14.8 2.1 4.3 9.8 18.3 28.2 12.9 18.4
0.7 0.2 0.1 0.5 0.6 0.1 0.3 0.5 0.9 5.9 0.3 1.2
26

TABLE 4: DARLING DOWNS INDUSTRY BY INDUSTRY FLOW TABLE 1996-97DIRECT ALLOCATION OF COMPETING IMPORTS, BASIC PRICES, RECORDING INTRA-INDUSTRY FLOWS, 34 INDUSTRIES ($ MILLION)
INDUSTRY DESCRIPTION
24 Road transport
25 Rail and pipeline transport
26 Other transport
27 Communication services
28 Finance, property and business services
29 Ownership of dwellings
30 Government administration and defence
31 Education
32 Health and community services
33 Cultural and recreational services
34 Personal and other services
T1 Total intermediate usage
P1 Compensation of employees
P2 Gross operating surplus and mixed income
P3 Taxes less subsidies on products
P4 Taxes less subsidies on production
P5 Complementary imports
P6 Imported inputs
P6a Foreign and interstate
P6b Interregional
T2 Total production
Employment (fte persons)
13 14 15 16 17 18 19 20 21 22 23 24
4.4 0.3 3.3 1.1 2.1 0.5 0.4 2.8 5.4 13.0 1.0 20.3
0.2 - 1.1 0.3 0.8 - 0.4 0.2 0.8 1.6 0.4 -
1.5 0.4 0.1 0.9 0.6 - 0.1 0.1 1.6 5.6 0.6 1.9
0.9 0.1 0.2 0.5 2.3 0.1 0.8 0.4 1.0 24.0 3.0 5.7
5.3 1.1 0.8 2.5 6.1 0.4 5.6 10.4 34.3 122.7 15.9 15.1
- - - - - - - - - - - -
0.8 - - 0.2 0.4 - 0.3 0.4 0.9 2.8 0.2 7.0
- - - - 0.1 - 0.1 - - 0.2 0.1 0.1
0.1 0.1 - - - - - - 0.1 0.2 - -
0.1 - - - - - - - - 1.5 0.4 -
0.1 - - - 0.1 - - - 0.1 0.4 0.2 0.1
32.9 4.1 12.7 21.6 51.6 7.5 27.0 53.5 107.6 241.3 62.6 72.7
38.1 8.0 8.9 24.0 68.7 7.1 15.7 23.2 61.8 364.7 61.4 46.3
14.3 3.6 5.0 8.3 17.2 2.9 47.2 42.8 100.4 129.2 30.2 68.3
0.9 0.8 0.4 0.4 1.7 0.1 1.4 1.3 4.7 15.8 6.3 7.7
1.7 0.4 0.7 1.2 2.6 0.2 -0.2 1.1 4.1 22.9 1.4 5.0
- 3.0 - - - - - - - - - -
31.0 11.9 9.2 32.5 107.5 8.4 35.1 49.8 139.8 255.7 50.0 66.0
22.9 9.6 4.4 30.5 94.3 7.6 13.3 34.8 106.2 191.9 36.5 53.0
8.1 2.4 4.8 2.0 13.3 0.8 21.8 15.0 33.6 63.8 13.5 13.0
118.9 31.8 36.9 88.0 249.3 26.3 126.1 171.9 418.4 1,029.7 211.9 266.0
1,087 168 226 708 1,812 252 504 1,071 3,578 12,674 2,328 2,078
27

TABLE 4: DARLING DOWNS INDUSTRY BY INDUSTRY FLOW TABLE 1996-97DIRECT ALLOCATION OF COMPETING IMPORTS, BASIC PRICES, RECORDING INTRA-INDUSTRY FLOWS, 34 INDUSTRIES ($ MILLION)
INDUSTRY DESCRIPTION
1 Sheep
2 Grains
3 Beef cattle
4 Dairy cattle and pigs
5 Other agriculture
6 Sugar cane growing
7 Forestry and fishing
8 Coal, oil and gas
9 Non-ferrous metal ores
10 Other mining
11 Food manufacturing
12 Textiles, clothing and footwear
13 Wood and paper manufacturing
14 Chemicals, petroleum and coal products
15 Non-metallic mineral products
16 Metals, metal products
17 Machinery, appliances and equipment
18 Miscellaneous manufacturing
19 Electricity supply, gas and water
20 Residential building construction
21 Other construction
22 Trade
23 Accommodation, cafes and restaurants
25 26 27 28 29 30 31 32 33 34T4 Total
intermediate usage
- - - 0.1 - - - 0.1 - - 28.3
- - - - - - - - - - 55.8
- - - - - - - - - - 245.0
- - - - - - - - - - 125.6
- - - 1.1 - 0.4 - 0.1 2.3 0.2 147.8
- - - - - - - - - - -
- - - - - - - - - - 4.5
- - - - - 0.1 - 0.1 - - 1.1
- - - - - - - - - - -
- - - 0.5 0.3 0.3 - 0.2 0.4 0.1 15.0
0.1 - 0.2 1.5 0.1 0.9 0.3 0.6 1.2 0.3 212.9
0.1 - 0.1 0.3 0.1 0.3 0.1 0.4 0.1 0.2 9.5
0.2 0.3 1.2 5.0 2.9 3.5 2.2 0.5 0.6 0.5 70.5
- 0.1 - 0.2 0.1 0.1 - 0.2 - - 4.8
- - - 0.1 1.3 0.4 - 0.1 - 0.1 26.4
2.3 0.1 1.0 0.4 4.6 1.0 0.8 0.4 0.2 0.1 62.1
3.5 0.6 0.4 1.3 0.3 4.7 0.2 0.4 0.3 0.2 47.1
- - 0.1 0.6 0.2 1.9 0.4 0.1 0.1 0.1 7.2
0.8 0.5 0.5 6.3 1.3 2.1 1.9 1.7 0.4 0.4 61.9
- - - 0.3 16.0 0.2 - 0.1 - - 17.0
0.5 0.1 - 0.8 0.1 4.9 - 0.1 - - 12.6
2.3 3.3 10.9 15.7 7.4 7.6 4.7 11.1 3.3 2.8 317.6
0.1 0.4 1.1 10.2 - 3.1 0.6 0.8 0.6 0.4 37.4
28

TABLE 4: DARLING DOWNS INDUSTRY BY INDUSTRY FLOW TABLE 1996-97DIRECT ALLOCATION OF COMPETING IMPORTS, BASIC PRICES, RECORDING INTRA-INDUSTRY FLOWS, 34 INDUSTRIES ($ MILLION)
INDUSTRY DESCRIPTION
24 Road transport
25 Rail and pipeline transport
26 Other transport
27 Communication services
28 Finance, property and business services
29 Ownership of dwellings
30 Government administration and defence
31 Education
32 Health and community services
33 Cultural and recreational services
34 Personal and other services
T1 Total intermediate usage
P1 Compensation of employees
P2 Gross operating surplus and mixed income
P3 Taxes less subsidies on products
P4 Taxes less subsidies on production
P5 Complementary imports
P6 Imported inputs
P6a Foreign and interstate
P6b Interregional
T2 Total production
Employment (fte persons)
25 26 27 28 29 30 31 32 33 34T4 Total
intermediate usage
0.2 1.1 1.6 2.3 0.3 2.1 0.7 1.3 0.9 0.5 190.9
0.1 0.2 0.4 1.8 - 0.2 0.1 0.4 0.1 - 23.1
0.1 2.6 2.3 5.7 - 2.9 0.4 0.6 0.2 0.3 41.6
0.3 1.2 2.0 17.9 0.1 8.5 2.4 4.3 1.6 1.5 97.1
4.7 5.4 5.7 149.9 33.6 22.5 4.0 14.1 8.0 4.9 568.6
- - - - - - - - - - -
0.2 1.0 1.0 4.2 0.1 24.2 1.2 0.7 0.1 0.2 51.4
- 0.1 - 1.5 - 0.4 0.3 0.2 - 0.1 4.1
- 0.1 0.1 0.3 - 0.7 0.1 4.8 0.2 0.1 11.7
- - - 2.5 - 0.2 - 0.1 2.0 0.1 7.5
- - 0.1 0.9 - 0.7 0.2 1.0 0.1 0.1 5.3
15.6 17.2 28.9 231.3 68.9 93.9 20.9 44.5 22.7 13.4 2,511.4
19.5 26.5 38.3 169.8 - 180.8 191.7 207.3 21.0 58.7 1,992.0
9.5 36.0 62.3 130.3 405.5 27.4 27.0 60.2 29.9 61.7 1,996.0
0.4 0.9 2.3 4.8 2.6 1.4 0.7 2.0 0.8 0.8 74.1
-0.2 0.9 2.9 17.8 31.3 0.9 2.8 4.1 0.7 1.5 136.2
- - - - - - - - - - 3.0
11.4 21.4 26.6 199.5 36.1 91.7 16.9 47.1 30.8 17.1 1,888.7
7.5 16.1 21.0 131.7 22.0 75.1 13.2 36.5 25.8 14.1 1,359.2
3.9 5.3 5.6 67.7 14.1 16.6 3.7 10.6 5.0 3.0 529.5
56.3 102.9 161.3 753.5 544.3 396.1 260.1 365.3 105.9 153.2 8,601.5
547 492 859 4,942 - 4,431 5,533 6,294 829 1,873 73,351
29
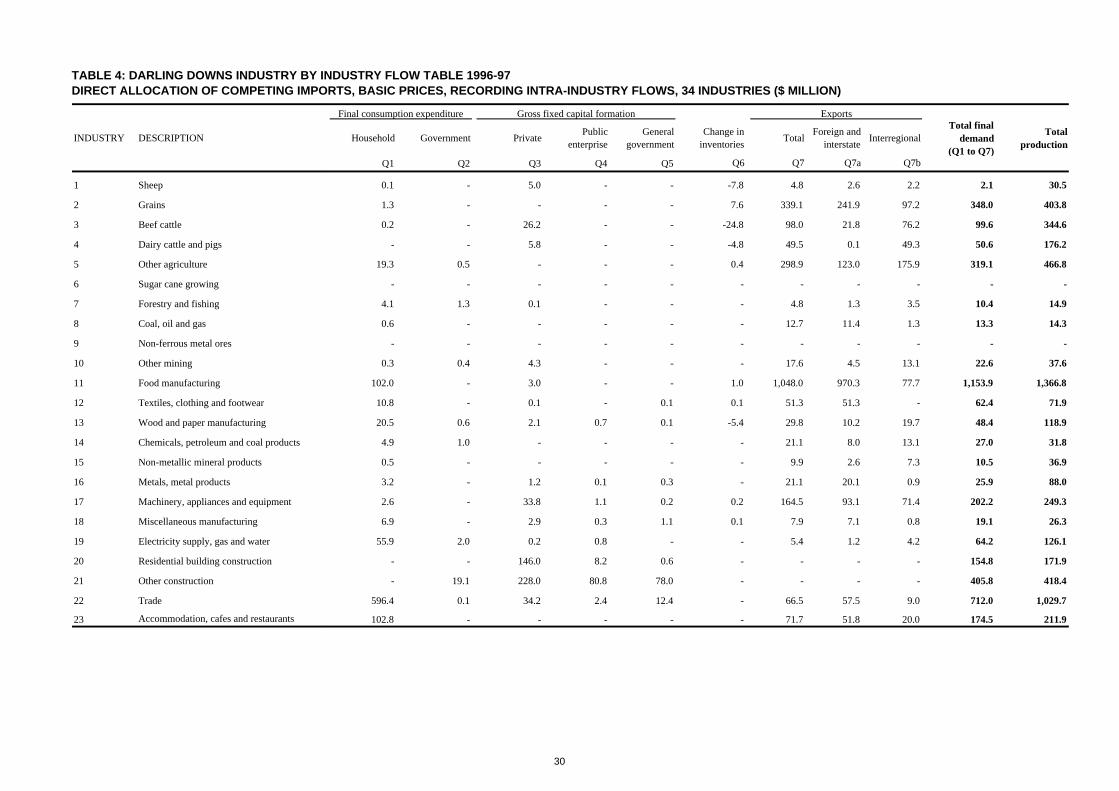
TABLE 4: DARLING DOWNS INDUSTRY BY INDUSTRY FLOW TABLE 1996-97DIRECT ALLOCATION OF COMPETING IMPORTS, BASIC PRICES, RECORDING INTRA-INDUSTRY FLOWS, 34 INDUSTRIES ($ MILLION)
INDUSTRY DESCRIPTION
1 Sheep
2 Grains
3 Beef cattle
4 Dairy cattle and pigs
5 Other agriculture
6 Sugar cane growing
7 Forestry and fishing
8 Coal, oil and gas
9 Non-ferrous metal ores
10 Other mining
11 Food manufacturing
12 Textiles, clothing and footwear
13 Wood and paper manufacturing
14 Chemicals, petroleum and coal products
15 Non-metallic mineral products
16 Metals, metal products
17 Machinery, appliances and equipment
18 Miscellaneous manufacturing
19 Electricity supply, gas and water
20 Residential building construction
21 Other construction
22 Trade
23 Accommodation, cafes and restaurants
Household Government Private Public enterprise
General government
Change in inventories Total Foreign and
interstate InterregionalTotal final
demand (Q1 to Q7)
Total production
Q1 Q2 Q3 Q4 Q5 Q6 Q7 Q7a Q7b
0.1 - 5.0 - - -7.8 4.8 2.6 2.2 2.1 30.5
1.3 - - - - 7.6 339.1 241.9 97.2 348.0 403.8
0.2 - 26.2 - - -24.8 98.0 21.8 76.2 99.6 344.6
- - 5.8 - - -4.8 49.5 0.1 49.3 50.6 176.2
19.3 0.5 - - - 0.4 298.9 123.0 175.9 319.1 466.8
- - - - - - - - - - -
4.1 1.3 0.1 - - - 4.8 1.3 3.5 10.4 14.9
0.6 - - - - - 12.7 11.4 1.3 13.3 14.3
- - - - - - - - - - -
0.3 0.4 4.3 - - - 17.6 4.5 13.1 22.6 37.6
102.0 - 3.0 - - 1.0 1,048.0 970.3 77.7 1,153.9 1,366.8
10.8 - 0.1 - 0.1 0.1 51.3 51.3 - 62.4 71.9
20.5 0.6 2.1 0.7 0.1 -5.4 29.8 10.2 19.7 48.4 118.9
4.9 1.0 - - - - 21.1 8.0 13.1 27.0 31.8
0.5 - - - - - 9.9 2.6 7.3 10.5 36.9
3.2 - 1.2 0.1 0.3 - 21.1 20.1 0.9 25.9 88.0
2.6 - 33.8 1.1 0.2 0.2 164.5 93.1 71.4 202.2 249.3
6.9 - 2.9 0.3 1.1 0.1 7.9 7.1 0.8 19.1 26.3
55.9 2.0 0.2 0.8 - - 5.4 1.2 4.2 64.2 126.1
- - 146.0 8.2 0.6 - - - - 154.8 171.9
- 19.1 228.0 80.8 78.0 - - - - 405.8 418.4
596.4 0.1 34.2 2.4 12.4 - 66.5 57.5 9.0 712.0 1,029.7
102.8 - - - - - 71.7 51.8 20.0 174.5 211.9
ExportsFinal consumption expenditure Gross fixed capital formation
30

TABLE 4: DARLING DOWNS INDUSTRY BY INDUSTRY FLOW TABLE 1996-97DIRECT ALLOCATION OF COMPETING IMPORTS, BASIC PRICES, RECORDING INTRA-INDUSTRY FLOWS, 34 INDUSTRIES ($ MILLION)
INDUSTRY DESCRIPTION
24 Road transport
25 Rail and pipeline transport
26 Other transport
27 Communication services
28 Finance, property and business services
29 Ownership of dwellings
30 Government administration and defence
31 Education
32 Health and community services
33 Cultural and recreational services
34 Personal and other services
T1 Total intermediate usage
P1 Compensation of employees
P2 Gross operating surplus and mixed income
P3 Taxes less subsidies on products
P4 Taxes less subsidies on production
P5 Complementary imports
P6 Imported inputs
P6a Foreign and interstate
P6b Interregional
T2 Total production
Employment (fte persons)
Household Government Private Public enterprise
General government
Change in inventories Total Foreign and
interstate InterregionalTotal final
demand (Q1 to Q7)
Total production
Q1 Q2 Q3 Q4 Q5 Q6 Q7 Q7a Q7b
ExportsFinal consumption expenditure Gross fixed capital formation
24.6 6.0 2.2 - 0.1 0.2 42.0 34.6 7.4 75.0 266.0
11.0 1.5 0.1 - - - 20.6 14.5 6.1 33.1 56.3
25.4 28.0 0.1 - - - 7.8 7.7 0.1 61.3 102.9
43.0 0.3 0.4 - - - 20.5 14.1 6.4 64.3 161.3
134.6 25.5 9.1 2.5 2.8 - 10.4 7.0 3.4 184.8 753.4
535.9 0.4 - - - - 8.0 7.3 0.7 544.3 544.3
9.6 332.2 2.5 0.1 0.3 - - - - 344.7 396.1
46.7 196.0 0.4 - 0.1 - 12.7 9.8 2.9 256.0 260.1
120.2 217.8 0.2 - 0.1 - 15.4 6.4 9.0 353.6 365.3
72.7 19.9 0.3 - 0.3 - 5.3 4.6 0.7 98.5 105.9
66.8 78.0 - - - - 3.1 2.5 0.7 147.9 153.2
2,022.8 930.5 508.0 97.0 96.4 -33.1 2,468.4 1,788.3 680.1 6,090.0 8,601.4
- - - - - - - - - - 1,992.0
- - - - - - - - - - 1,996.0
131.8 - 13.1 0.5 0.8 0.8 35.4 35.4 - 182.3 256.4
- - 9.6 - - - - - - 9.6 145.9
1.6 - 1.2 - - -0.2 - - - 2.6 5.6
668.8 19.2 213.2 11.7 16.1 3.9 - - - 932.8 2,821.5
349.7 14.2 193.6 10.6 14.6 3.3 - - - 586.0 1,945.2
319.0 5.0 19.5 1.1 1.5 0.6 - - - 346.8 876.3
2,824.9 949.7 745.2 109.1 113.2 -28.6 2,503.8 1,823.8 680.1 7,217.3 15,819.1
- - - - - - - - - - 73,351
31

TABLE 5: SOUTH WEST INDUSTRY BY INDUSTRY FLOW TABLE 1996-97DIRECT ALLOCATION OF COMPETING IMPORTS, BASIC PRICES, RECORDING INTRA-INDUSTRY FLOWS, 34 INDUSTRIES ($ MILLION)
INDUSTRY DESCRIPTION 1 2 3 4 5 6 7 8 9 10 11 12
1 Sheep 5.0 - - - - - - - - - - 0.4
2 Grains 0.4 5.5 0.8 - 0.1 - - - - - - -
3 Beef cattle - - 28.5 - - - - - - - - -
4 Dairy cattle and pigs - - - - - - - - - - - -
5 Other agriculture 5.4 1.0 7.6 0.1 25.7 - - - - - 0.2 -
6 Sugar cane growing - - - - - - - - - - - -
7 Forestry and fishing - - 0.2 - 0.1 - - - - - - -
8 Coal, oil and gas - - - - - - - 8.6 - - - -
9 Non-ferrous metal ores - - - - - - - - - - - -
10 Other mining - - 0.1 - 0.1 - - 19.9 - 0.5 - -
11 Food manufacturing 0.1 - 0.4 - 0.2 - - - - - 0.1 0.1
12 Textiles, clothing and footwear - - - - - - - - - - - 0.7
13 Wood and paper manufacturing 0.1 - - - - - - 0.1 - - - -
14 Chemicals, petroleum and coal products 0.1 - 0.1 - 0.1 - - 0.1 - - - -
15 Non-metallic mineral products - - - - - - - - - - - -
16 Metals, metal products 0.2 - 0.1 - - - - - - - - -
17 Machinery, appliances and equipment - 0.1 - - - - - 1.5 - 0.3 - -
18 Miscellaneous manufacturing - - - - - - - - - - - -
19 Electricity supply, gas and water 0.2 0.3 0.9 - 0.5 - - 2.6 - - 0.1 -
20 Residential building construction - - - - - - - - - - - -
21 Other construction 0.3 0.2 0.6 - 0.1 - - 0.4 - - - -
22 Trade 4.4 3.2 3.9 0.1 3.3 - 0.1 6.6 - 1.5 0.2 0.2
23 Accommodation, cafes and restaurants 0.5 0.5 0.7 - 0.6 - - 0.4 - 1.1 - -
32

TABLE 5: SOUTH WEST INDUSTRY BY INDUSTRY FLOW TABLE 1996-97DIRECT ALLOCATION OF COMPETING IMPORTS, BASIC PRICES, RECORDING INTRA-INDUSTRY FLOWS, 34 INDUSTRIES ($ MILLION)
INDUSTRY DESCRIPTION 1 2 3 4 5 6 7 8 9 10 11 12
24 Road transport 1.7 2.1 3.4 - 2.0 - - 2.6 - 0.8 0.3 -
25 Rail and pipeline transport 0.3 1.6 0.3 - 0.3 - - 58.3 - 0.1 - -
26 Other transport 0.1 0.2 0.1 - - - - 0.3 - 0.2 - -
27 Communication services 1.0 0.2 1.0 - 0.3 - - 0.5 - 0.3 - -
28 Finance, property and business services 3.2 1.1 3.2 - 1.3 - - 5.4 - 2.4 0.1 -
29 Ownership of dwellings - - - - - - - - - - - -
30 Government administration and defence 0.1 0.1 0.1 - 0.2 - - 1.5 - 0.2 - -
31 Education - - - - - - - 0.1 - - - -
32 Health and community services - - 0.4 - 0.1 - - - - - - -
33 Cultural and recreational services - - 0.1 - - - - - - - - -
34 Personal and other services - - - - - - - 0.1 - - - -
T1 Total intermediate usage 23.0 16.1 52.6 0.5 35.0 - 0.3 109.0 - 7.6 1.3 1.5
P1 Compensation of employees 9.9 5.4 17.4 0.1 12.9 - 0.6 31.9 - 8.1 1.9 0.4
P2 Gross operating surplus and mixed income 32.8 29.3 48.0 0.9 44.0 - 0.4 188.6 - 12.5 0.4 0.7
P3 Taxes less subsidies on products 0.4 0.5 0.9 - 0.7 - - 1.2 - 0.2 0.1 0.1
P4 Taxes less subsidies on production 1.1 1.2 2.5 0.1 2.1 - - 2.9 - 0.8 0.1 -
P5 Complementary imports - - - - - - - - - - - -
P6 Imported inputs 15.7 15.5 34.9 1.3 39.0 - 0.9 80.5 - 17.8 1.8 3.5
P6a Foreign and interstate 7.0 9.5 18.6 1.0 27.9 - 0.6 46.6 - 11.3 1.1 3.2
P6b Interregional 8.8 6.0 16.3 0.3 11.1 - 0.3 33.9 - 6.5 0.7 0.3
T2 Total production 82.9 67.9 156.4 2.9 133.7 - 2.2 414.1 - 47.0 5.5 6.2
Employment (fte persons) 934 956 1,254 24 1,216 - 32 262 - 102 46 14
33

TABLE 5: SOUTH WEST INDUSTRY BY INDUSTRY FLOW TABLE 1996-97DIRECT ALLOCATION OF COMPETING IMPORTS, BASIC PRICES, RECORDING INTRA-INDUSTRY FLOWS, 34 INDUSTRIES ($ MILLION)
INDUSTRY DESCRIPTION
1 Sheep
2 Grains
3 Beef cattle
4 Dairy cattle and pigs
5 Other agriculture
6 Sugar cane growing
7 Forestry and fishing
8 Coal, oil and gas
9 Non-ferrous metal ores
10 Other mining
11 Food manufacturing
12 Textiles, clothing and footwear
13 Wood and paper manufacturing
14 Chemicals, petroleum and coal products
15 Non-metallic mineral products
16 Metals, metal products
17 Machinery, appliances and equipment
18 Miscellaneous manufacturing
19 Electricity supply, gas and water
20 Residential building construction
21 Other construction
22 Trade
23 Accommodation, cafes and restaurants
13 14 15 16 17 18 19 20 21 22 23 24
- - - - - - - - - - - -
- - - - - - - - - - - -
- - - - - - - - - - - -
- - - - - - - - - - - -
- - - - - - - - 0.3 0.1 0.3 -
- - - - - - - - - - - -
0.4 - - - - - - - - - 0.1 -
- - - - - - 8.5 - - - - -
- - - - - - - - - - - -
- - - 0.1 - - 0.1 0.1 1.3 - - -
- - - - - - - - - 0.2 0.3 -
- - - - - - - - - - - -
2.3 - - - - - - 0.3 0.3 - - -
- - - - - - - - - - - -
- - - - - - - - - - - -
3.0 - - - - - - 0.3 0.3 - - -
- - - - 0.3 - - - 0.1 0.1 - -
- - - - - - - - - - - -
0.2 - - - 0.4 - 2.3 - 0.2 0.6 0.4 0.1
- - - - - - - - - - - -
- - - - - - - - - 0.1 0.1 -
0.4 - - 0.2 0.8 - 0.5 0.4 3.8 4.3 1.4 1.7
0.1 - - - - - 0.1 - 0.3 1.0 0.1 0.2
34

TABLE 5: SOUTH WEST INDUSTRY BY INDUSTRY FLOW TABLE 1996-97DIRECT ALLOCATION OF COMPETING IMPORTS, BASIC PRICES, RECORDING INTRA-INDUSTRY FLOWS, 34 INDUSTRIES ($ MILLION)
INDUSTRY DESCRIPTION
24 Road transport
25 Rail and pipeline transport
26 Other transport
27 Communication services
28 Finance, property and business services
29 Ownership of dwellings
30 Government administration and defence
31 Education
32 Health and community services
33 Cultural and recreational services
34 Personal and other services
T1 Total intermediate usage
P1 Compensation of employees
P2 Gross operating surplus and mixed income
P3 Taxes less subsidies on products
P4 Taxes less subsidies on production
P5 Complementary imports
P6 Imported inputs
P6a Foreign and interstate
P6b Interregional
T2 Total production
Employment (fte persons)
13 14 15 16 17 18 19 20 21 22 23 24
0.9 - - 0.1 - - 0.1 0.1 1.2 1.5 0.1 2.0
0.1 - - - - - 0.2 - 0.4 0.4 0.1 -
0.1 - - - - - - - 0.1 0.4 - 0.1
- - - - 0.2 - 0.1 - 0.2 1.9 0.3 0.4
0.2 - - 0.1 0.3 - 0.5 0.3 4.1 6.8 1.1 0.9
- - - - - - - - - - - -
- - - - - - 0.1 - 0.2 0.4 - 0.8
- - - - - - - - - - - -
- - - - - - - - - - - -
- - - - - - - - - 0.1 0.1 -
- - - - - - - - - - - -
7.6 - - 0.7 2.2 - 12.2 1.6 12.9 18.1 4.6 6.1
4.8 1.0 - 1.8 0.9 - 3.0 0.9 11.7 41.5 8.4 5.1
2.7 0.8 - 0.5 2.8 - 9.7 2.8 32.2 17.2 4.1 7.5
0.1 - - - 0.1 - 0.2 0.1 1.2 2.1 1.1 0.9
0.2 0.1 - 0.1 0.2 - - 0.1 1.0 2.9 0.3 0.6
- 0.4 - - - - - - - - - -
4.3 5.8 - 2.8 11.3 - 3.6 5.5 65.0 43.1 10.5 9.4
2.3 5.8 - 2.1 7.0 - 2.7 3.9 51.0 33.1 7.7 7.2
2.0 - - 0.7 4.4 - 1.0 1.6 13.9 10.1 2.8 2.2
19.7 8.2 - 5.9 17.5 - 28.8 11.0 123.9 124.9 29.0 29.4
189 19 - 48 36 - 109 80 969 1,479 307 231
35

TABLE 5: SOUTH WEST INDUSTRY BY INDUSTRY FLOW TABLE 1996-97DIRECT ALLOCATION OF COMPETING IMPORTS, BASIC PRICES, RECORDING INTRA-INDUSTRY FLOWS, 34 INDUSTRIES ($ MILLION)
INDUSTRY DESCRIPTION
1 Sheep
2 Grains
3 Beef cattle
4 Dairy cattle and pigs
5 Other agriculture
6 Sugar cane growing
7 Forestry and fishing
8 Coal, oil and gas
9 Non-ferrous metal ores
10 Other mining
11 Food manufacturing
12 Textiles, clothing and footwear
13 Wood and paper manufacturing
14 Chemicals, petroleum and coal products
15 Non-metallic mineral products
16 Metals, metal products
17 Machinery, appliances and equipment
18 Miscellaneous manufacturing
19 Electricity supply, gas and water
20 Residential building construction
21 Other construction
22 Trade
23 Accommodation, cafes and restaurants
25 26 27 28 29 30 31 32 33 34T4 Total
intermediate usage
- - - - - - - - - - 5.5
- - - - - - - - - - 6.8
- - - - - - - - - - 28.5
- - - - - - - - - - -
- - - 0.1 - 0.1 - - 0.3 - 41.4
- - - - - - - - - - -
- - - - - - - - - - 1.0
- - - - - - - - - - 17.1
- - - - - - - - - - -
- - - 0.1 - 0.1 - - 0.1 - 22.5
- - - - - - - - - - 1.7
- - - - - - - - - - 0.7
- - - - - - - - - - 3.3
- - - - - - - - - - 0.6
- - - - - - - - - - -
- - - - - - - - - - 4.0
1.1 - - - - - - - - - 3.7
- - - - - - - - - - -
1.1 0.1 0.1 0.8 0.2 0.5 0.3 0.3 0.1 0.1 12.2
- - - - 2.2 - - - - - 2.4
0.6 - - 0.1 - 0.1 - - - - 2.7
1.9 0.1 1.0 1.3 0.7 0.6 0.4 1.3 0.3 0.2 44.5
0.2 - 0.2 1.5 - 0.9 0.1 0.1 0.1 0.1 9.0
36

TABLE 5: SOUTH WEST INDUSTRY BY INDUSTRY FLOW TABLE 1996-97DIRECT ALLOCATION OF COMPETING IMPORTS, BASIC PRICES, RECORDING INTRA-INDUSTRY FLOWS, 34 INDUSTRIES ($ MILLION)
INDUSTRY DESCRIPTION
24 Road transport
25 Rail and pipeline transport
26 Other transport
27 Communication services
28 Finance, property and business services
29 Ownership of dwellings
30 Government administration and defence
31 Education
32 Health and community services
33 Cultural and recreational services
34 Personal and other services
T1 Total intermediate usage
P1 Compensation of employees
P2 Gross operating surplus and mixed income
P3 Taxes less subsidies on products
P4 Taxes less subsidies on production
P5 Complementary imports
P6 Imported inputs
P6a Foreign and interstate
P6b Interregional
T2 Total production
Employment (fte persons)
25 26 27 28 29 30 31 32 33 34T4 Total
intermediate usage
0.3 0.1 0.2 0.2 - 0.3 0.1 0.2 0.1 0.1 20.3
0.1 - 0.1 0.4 - 0.1 - 0.1 - - 63.0
- - 0.1 0.2 - 0.1 - - - - 2.0
0.3 - 0.2 1.2 - 1.3 0.2 0.4 0.1 0.1 10.2
3.2 0.1 0.4 7.3 2.4 2.5 0.3 1.1 0.5 0.3 49.2
- - - - - - - - - - -
0.3 0.1 0.1 0.4 - 5.4 0.1 0.1 - - 10.2
- - - 0.2 - 0.1 - - - - 0.6
- - - - - - - 0.6 - - 1.3
- - - 0.2 - - 0.1 - 0.5 - 1.2
- - - - - - - 0.1 - - 0.4
9.2 0.6 2.4 14.0 5.7 12.2 1.5 4.5 2.2 1.1 366.1
16.0 1.7 6.6 18.1 - 40.0 21.3 26.2 4.0 8.7 310.5
14.9 2.4 6.8 12.0 56.5 12.5 3.1 11.5 5.2 4.8 567.6
0.5 - 0.3 0.4 0.4 0.3 0.1 0.3 0.1 0.1 12.4
-0.2 - 0.4 1.3 4.3 -0.3 0.3 0.8 - 0.2 23.1
- - - - - - - - - - 0.4
25.7 0.9 4.6 26.8 7.3 14.2 2.7 8.3 4.7 2.6 470.0
17.4 0.6 3.2 20.2 5.0 11.1 2.1 5.6 3.6 2.1 320.6
8.3 0.3 1.4 6.6 2.3 3.0 0.6 2.7 1.0 0.5 149.4
66.0 5.6 21.1 72.6 74.2 78.8 29.0 51.7 16.2 17.6 1,750.2
519 38 159 501 - 831 643 794 162 278 12,231
37

TABLE 5: SOUTH WEST INDUSTRY BY INDUSTRY FLOW TABLE 1996-97DIRECT ALLOCATION OF COMPETING IMPORTS, BASIC PRICES, RECORDING INTRA-INDUSTRY FLOWS, 34 INDUSTRIES ($ MILLION)
INDUSTRY DESCRIPTION
1 Sheep
2 Grains
3 Beef cattle
4 Dairy cattle and pigs
5 Other agriculture
6 Sugar cane growing
7 Forestry and fishing
8 Coal, oil and gas
9 Non-ferrous metal ores
10 Other mining
11 Food manufacturing
12 Textiles, clothing and footwear
13 Wood and paper manufacturing
14 Chemicals, petroleum and coal products
15 Non-metallic mineral products
16 Metals, metal products
17 Machinery, appliances and equipment
18 Miscellaneous manufacturing
19 Electricity supply, gas and water
20 Residential building construction
21 Other construction
22 Trade
23 Accommodation, cafes and restaurants
Household Government Private Public enterprise
General government
Change in inventories Total Foreign and
interstate InterregionalTotal final
demand (Q1 to Q7)
Total production
Q1 Q2 Q3 Q4 Q5 Q6 Q7 Q7a Q7b
- - 13.8 - - -13.1 76.7 37.3 39.4 77.5 82.9
0.2 - - - - 1.8 59.1 45.2 13.9 61.1 67.9
- - 19.5 - - -8.8 117.1 22.5 94.5 127.8 156.4
- - - - - - 2.9 - 2.9 2.9 2.9
2.8 0.1 - - - 0.1 89.3 51.9 37.5 92.3 133.7
- - - - - - - - - - -
0.4 0.3 - - - - 0.5 0.1 0.3 1.1 2.2
- - - - - - 397.0 - 397.0 397.0 414.1
- - - - - - - - - - -
- 0.1 16.3 - - -0.1 8.1 1.5 6.6 24.5 47.0
0.5 - - - - - 3.4 0.9 2.5 3.9 5.5
1.7 - - - - - 3.8 3.8 - 5.5 6.2
3.9 0.1 0.1 - - -1.6 13.9 5.0 8.8 16.4 19.7
0.2 0.1 - - - - 7.3 2.5 4.8 7.6 8.2
- - - - - - - - - - -
0.9 - 0.1 - - -1.8 2.9 2.7 0.1 2.0 5.9
1.3 - 0.1 - - - 12.5 11.3 1.2 13.8 17.5
- - - - - - - - - - -
11.8 0.4 - 0.2 - - 4.1 0.1 3.9 16.5 28.8
- - 5.2 3.4 0.1 - - - - 8.7 11.0
- 4.8 46.1 37.0 33.3 - - - - 121.2 123.9
53.8 - 5.7 0.2 0.6 - 20.0 10.0 9.9 80.4 124.9
11.8 - - - - - 8.1 3.7 4.4 20.0 29.0
ExportsFinal consumption expenditure Gross fixed capital formation
38

TABLE 5: SOUTH WEST INDUSTRY BY INDUSTRY FLOW TABLE 1996-97DIRECT ALLOCATION OF COMPETING IMPORTS, BASIC PRICES, RECORDING INTRA-INDUSTRY FLOWS, 34 INDUSTRIES ($ MILLION)
INDUSTRY DESCRIPTION
24 Road transport
25 Rail and pipeline transport
26 Other transport
27 Communication services
28 Finance, property and business services
29 Ownership of dwellings
30 Government administration and defence
31 Education
32 Health and community services
33 Cultural and recreational services
34 Personal and other services
T1 Total intermediate usage
P1 Compensation of employees
P2 Gross operating surplus and mixed income
P3 Taxes less subsidies on products
P4 Taxes less subsidies on production
P5 Complementary imports
P6 Imported inputs
P6a Foreign and interstate
P6b Interregional
T2 Total production
Employment (fte persons)
Household Government Private Public enterprise
General government
Change in inventories Total Foreign and
interstate InterregionalTotal final
demand (Q1 to Q7)
Total production
Q1 Q2 Q3 Q4 Q5 Q6 Q7 Q7a Q7b
ExportsFinal consumption expenditure Gross fixed capital formation
3.0 1.3 0.2 - - - 4.6 3.8 0.7 9.1 29.4
2.2 0.3 0.2 - - - 0.2 0.2 0.1 3.0 66.0
2.0 1.6 - - - - 0.1 0.1 - 3.7 5.6
4.3 0.1 - - - - 6.5 4.8 1.6 10.9 21.1
12.9 5.6 0.4 0.2 0.2 - 4.0 2.5 1.5 23.4 72.6
70.0 0.1 - - - - 4.2 3.7 0.5 74.2 74.2
1.2 66.8 0.5 - - - - - - 68.6 78.8
4.6 23.8 - - - - - - - 28.4 29.0
8.2 38.6 - - - - 3.6 1.5 2.2 50.4 51.7
10.3 2.7 0.1 - - - 1.9 1.8 0.1 14.9 16.2
8.4 7.1 - - - - 1.8 1.4 0.4 17.2 17.6
216.4 153.9 108.4 41.1 34.3 -23.5 853.4 218.4 635.0 1,384.1 1,750.2
- - - - - - - - - - 310.5
- - - - - - - - - - 567.6
16.86 - 2.3 0.1 0.1 0.2 8.7 8.7 - 28.2 40.7
- - 1.7 - - - - - - 1.7 24.8
0.2 - 0.2 - - -0.1 - - - 0.3 0.7
115.7 2.2 11.2 5.3 5.8 6.6 - - - 146.8 616.9
43.5 1.6 5.9 4.7 5.3 8.4 - - - 69.3 389.9
72.2 0.7 5.3 0.5 0.5 -1.7 - - - 77.5 226.9
349.2 156.1 123.9 46.5 40.3 -16.8 862.1 227.1 635.0 1,561.1 3,311.3
- - - - - - - - - - 12,231
39

TABLE 6: FITZROY INDUSTRY BY INDUSTRY FLOW TABLE 1996-97DIRECT ALLOCATION OF COMPETING IMPORTS, BASIC PRICES, RECORDING INTRA-INDUSTRY FLOWS, 34 INDUSTRIES ($ MILLION)
INDUSTRY DESCRIPTION 1 2 3 4 5 6 7 8 9 10 11 12
1 Sheep - - - - - - - - - - - -
2 Grains - 9.4 1.3 0.1 0.2 - - - - - 0.8 -
3 Beef cattle - - 33.6 - - - - - - - 167.2 -
4 Dairy cattle and pigs - - - - - - - - - - 9.2 -
5 Other agriculture - 1.0 8.4 0.5 10.8 - - - - - 9.1 -
6 Sugar cane growing - - - - - - - - - - - -
7 Forestry and fishing - - 0.7 - 0.2 - 0.1 0.4 - - - -
8 Coal, oil and gas - - - - - - - 3.4 - - 0.5 -
9 Non-ferrous metal ores - - - - - - - - - - - -
10 Other mining - - - - - - - 84.9 - 2.0 0.2 -
11 Food manufacturing - - 3.4 1.2 1.2 - 0.8 0.6 - 0.4 26.4 -
12 Textiles, clothing and footwear - - - - - - - 0.2 - - - -
13 Wood and paper manufacturing - - 1.1 - - - 0.2 1.6 - - 1.6 -
14 Chemicals, petroleum and coal products - 0.9 2.2 - 1.3 - 0.2 17.5 - 2.5 0.5 -
15 Non-metallic mineral products - - - - - - - 1.3 - 0.8 - -
16 Metals, metal products - - 0.2 - 0.1 - 0.4 9.1 - - 0.6 -
17 Machinery, appliances and equipment - 0.3 0.1 - - - 0.6 7.0 - 0.8 - -
18 Miscellaneous manufacturing - - - - - - - 0.9 - 0.3 - -
19 Electricity supply, gas and water - 0.7 2.3 0.3 0.7 - 0.1 26.3 - 0.3 10.9 -
20 Residential building construction - - - - - - - - - 0.1 - -
21 Other construction - 0.3 1.0 - 0.1 - - 1.9 - 0.2 - -
22 Trade - 7.7 9.4 0.9 4.5 - 3.6 48.7 - 10.6 7.3 0.6
23 Accommodation, cafes and restaurants - 0.7 0.9 - 0.5 - - 1.4 - 4.1 0.8 -
40

TABLE 6: FITZROY INDUSTRY BY INDUSTRY FLOW TABLE 1996-97DIRECT ALLOCATION OF COMPETING IMPORTS, BASIC PRICES, RECORDING INTRA-INDUSTRY FLOWS, 34 INDUSTRIES ($ MILLION)
INDUSTRY DESCRIPTION 1 2 3 4 5 6 7 8 9 10 11 12
24 Road transport - 4.5 7.6 0.3 2.1 - 0.2 17.1 - 4.7 38.4 -
25 Rail and pipeline transport - 2.1 0.3 - 0.2 - - 227.9 - 0.2 2.2 -
26 Other transport - 2.1 1.7 - 0.3 - 0.2 14.3 - 19.4 2.7 -
27 Communication services - 0.4 1.9 - 0.3 - - 4.3 - 1.6 1.5 -
28 Finance, property and business services - 3.6 12.4 0.3 2.2 - 0.5 61.9 - 32.7 7.9 0.1
29 Ownership of dwellings - - - - - - - - - - - -
30 Government administration and defence - 0.1 0.2 - 0.2 - 0.2 7.8 - 1.1 1.2 -
31 Education - - - - - - - 0.5 - 0.2 0.2 -
32 Health and community services - - 1.0 - - - - 51.3 - - 1.1 -
33 Cultural and recreational services - - - - - - - - - - 0.1 -
34 Personal and other services - - 0.2 - - - - 1.7 - 0.2 0.2 -
T1 Total intermediate usage - 34.1 90.2 4.2 25.2 - 7.4 592.3 - 82.3 290.9 1.0
P1 Compensation of employees - 4.2 20.2 0.9 12.9 - 2.6 402.3 - 47.5 59.7 0.9
P2 Gross operating surplus and mixed income - 55.6 78.3 7.9 43.0 - 8.9 771.0 - 53.6 33.3 0.3
P3 Taxes less subsidies on products - 0.9 1.5 0.1 0.7 - 0.6 6.3 - 1.1 2.5 0.3
P4 Taxes less subsidies on production - 2.1 4.2 0.5 1.9 - 0.8 15.3 - 4.3 3.0 -
P5 Complementary imports - - - - - - - - - - - -
P6 Imported inputs - 21.5 67.3 8.7 37.7 - 17.8 372.2 - 57.1 173.4 6.6
P6a Foreign and interstate - 14.6 30.8 7.4 25.2 - 15.5 194.2 - 38.9 38.4 4.5
P6b Interregional - 6.9 36.5 1.3 12.4 - 2.4 178.0 - 18.2 135.0 2.1
T2 Total production 0.1 118.4 261.6 22.4 121.5 - 38.2 2,159.3 - 245.8 562.8 9.1
Employment (fte persons) 1 1,428 2,278 241 1,275 - 229 4,094 - 481 1,710 51
41

TABLE 6: FITZROY INDUSTRY BY INDUSTRY FLOW TABLE 1996-97DIRECT ALLOCATION OF COMPETING IMPORTS, BASIC PRICES, RECORDING INTRA-INDUSTRY FLOWS, 34 INDUSTRIES ($ MILLION)
INDUSTRY DESCRIPTION
1 Sheep
2 Grains
3 Beef cattle
4 Dairy cattle and pigs
5 Other agriculture
6 Sugar cane growing
7 Forestry and fishing
8 Coal, oil and gas
9 Non-ferrous metal ores
10 Other mining
11 Food manufacturing
12 Textiles, clothing and footwear
13 Wood and paper manufacturing
14 Chemicals, petroleum and coal products
15 Non-metallic mineral products
16 Metals, metal products
17 Machinery, appliances and equipment
18 Miscellaneous manufacturing
19 Electricity supply, gas and water
20 Residential building construction
21 Other construction
22 Trade
23 Accommodation, cafes and restaurants
13 14 15 16 17 18 19 20 21 22 23 24
- - - - - - - - - - - -
- - - - - - - - - - - -
- - - - - - - - - - - -
- - - - - - - - - - - -
- 0.2 - - - - - 0.2 1.0 1.0 1.8 -
- - - - - - - - - - - -
1.3 - - - - - - - - 1.0 3.1 -
- 1.1 2.7 0.1 - - 102.7 - - 0.6 0.4 -
- - - - - - - - - - - -
- 0.5 14.1 1.7 - - 0.6 0.9 4.5 0.2 0.2 -
- 1.5 - - - - 0.1 - 0.1 12.5 15.4 -
- - - - - - - - - - - -
4.7 0.3 0.2 1.4 - 1.6 0.3 4.8 2.9 4.5 0.6 0.4
0.5 7.2 0.7 1.7 - 0.1 1.5 0.5 1.7 0.8 0.4 1.0
0.2 0.2 21.6 3.1 - - 6.3 16.4 25.0 0.6 - -
0.4 0.7 2.6 211.0 2.5 0.4 2.5 6.9 16.7 1.9 0.2 0.4
- 0.1 - 0.8 1.6 - 0.5 0.2 1.3 1.1 0.2 0.1
- - - 0.5 - - - - 0.4 0.3 0.2 -
0.6 2.4 5.5 108.2 0.4 0.1 26.9 0.2 1.3 7.0 5.4 0.7
- - - - - - - - - 0.1 - -
- - - - - - 0.4 0.1 0.2 0.7 1.2 0.1
3.3 13.3 3.8 9.4 2.0 1.4 17.9 9.6 23.6 46.2 15.9 21.0
0.4 1.4 0.8 2.0 - - 1.7 0.6 1.2 6.4 0.4 1.4
42

TABLE 6: FITZROY INDUSTRY BY INDUSTRY FLOW TABLE 1996-97DIRECT ALLOCATION OF COMPETING IMPORTS, BASIC PRICES, RECORDING INTRA-INDUSTRY FLOWS, 34 INDUSTRIES ($ MILLION)
INDUSTRY DESCRIPTION
24 Road transport
25 Rail and pipeline transport
26 Other transport
27 Communication services
28 Finance, property and business services
29 Ownership of dwellings
30 Government administration and defence
31 Education
32 Health and community services
33 Cultural and recreational services
34 Personal and other services
T1 Total intermediate usage
P1 Compensation of employees
P2 Gross operating surplus and mixed income
P3 Taxes less subsidies on products
P4 Taxes less subsidies on production
P5 Complementary imports
P6 Imported inputs
P6a Foreign and interstate
P6b Interregional
T2 Total production
Employment (fte persons)
13 14 15 16 17 18 19 20 21 22 23 24
2.2 3.6 25.4 4.9 0.2 0.4 1.5 2.8 6.4 11.7 1.2 22.9
0.1 1.1 10.3 6.8 0.2 - 7.6 0.3 1.4 2.2 0.7 -
1.4 5.2 1.5 6.4 0.2 - 1.1 0.1 3.0 20.2 1.2 3.2
0.3 0.6 0.8 1.1 0.2 - 2.7 0.2 0.8 17.8 2.4 3.9
3.2 5.3 4.2 13.6 0.7 0.4 30.1 11.0 41.2 122.1 19.8 15.6
- - - - - - - - - - - -
0.5 0.4 0.3 0.6 - - 0.8 0.4 1.0 3.2 0.2 7.4
- - - 0.1 - - 0.4 - - 0.3 - -
- - - - - - - - - 0.3 - -
- - - - - - - - - 1.7 0.4 -
- - - 0.1 - - 0.2 - - 0.5 0.2 -
19.5 45.6 94.9 373.7 8.3 5.0 206.2 55.6 134.1 264.9 71.7 78.6
22.5 33.0 21.8 172.9 10.4 2.0 144.0 31.8 136.6 343.0 73.7 48.1
8.0 69.5 30.6 171.1 2.5 0.9 431.5 42.2 119.3 120.5 36.8 70.4
0.6 1.9 1.1 5.2 0.8 0.1 10.3 1.4 5.7 17.2 10.3 8.1
1.2 3.9 2.1 11.9 1.9 0.2 4.8 1.2 4.9 23.2 2.3 5.3
- 4.2 - - - - - - - - - -
18.2 167.6 42.1 651.1 13.1 5.5 87.1 47.6 159.8 249.5 66.4 71.0
14.5 150.0 25.4 313.1 8.5 4.6 56.6 38.3 131.4 196.0 50.3 57.4
3.7 17.6 16.7 338.0 4.6 0.9 30.5 9.3 28.4 53.5 16.1 13.5
70.1 325.7 192.6 1,386.0 37.1 13.7 883.8 179.8 560.5 1,018.2 261.1 281.5
726 462 390 2,927 289 103 2,359 1,406 5,279 12,557 2,806 2,213
43

TABLE 6: FITZROY INDUSTRY BY INDUSTRY FLOW TABLE 1996-97DIRECT ALLOCATION OF COMPETING IMPORTS, BASIC PRICES, RECORDING INTRA-INDUSTRY FLOWS, 34 INDUSTRIES ($ MILLION)
INDUSTRY DESCRIPTION
1 Sheep
2 Grains
3 Beef cattle
4 Dairy cattle and pigs
5 Other agriculture
6 Sugar cane growing
7 Forestry and fishing
8 Coal, oil and gas
9 Non-ferrous metal ores
10 Other mining
11 Food manufacturing
12 Textiles, clothing and footwear
13 Wood and paper manufacturing
14 Chemicals, petroleum and coal products
15 Non-metallic mineral products
16 Metals, metal products
17 Machinery, appliances and equipment
18 Miscellaneous manufacturing
19 Electricity supply, gas and water
20 Residential building construction
21 Other construction
22 Trade
23 Accommodation, cafes and restaurants
25 26 27 28 29 30 31 32 33 34T4 Total
intermediate usage
- - - - - - - - - - -
- - - - - - - - - - 11.8
- - - - - - - - - - 200.9
- - - - - - - - - - 9.2
- - - 1.1 - 0.3 - - 1.6 0.2 37.4
- - - - - - - - - - -
0.3 - - - - - - - - - 7.4
- - 0.1 0.2 - 0.2 - 0.3 - - 112.6
- - - - - - - - - - -
- - - 0.7 0.2 0.3 - 0.3 0.4 - 112.2
0.2 - 0.1 1.2 - 0.2 0.2 0.5 0.5 0.3 67.0
- - - - - - - - - - 0.3
0.7 0.4 0.5 2.8 1.4 1.9 1.1 0.3 0.3 0.3 36.0
0.4 0.9 0.2 2.8 0.4 0.8 - 1.1 0.1 0.3 48.5
- - - 0.3 2.6 0.9 - 0.3 - 0.3 80.2
10.3 0.5 0.7 0.4 3.8 0.5 0.7 0.3 0.2 0.1 274.5
0.8 0.2 - 0.5 - 0.2 - 0.1 - - 17.2
0.1 - - 0.4 0.1 0.4 0.2 - - - 4.3
6.8 2.3 0.7 17.5 2.0 3.7 3.0 3.7 0.8 0.9 241.7
- - - 0.4 14.3 - - 0.1 - - 15.6
2.5 0.3 - 1.2 - 1.2 - - - - 11.9
10.2 6.9 9.2 22.2 6.3 4.7 4.0 14.7 3.0 3.2 345.0
0.5 1.2 1.0 13.9 - 4.0 0.6 1.3 0.7 0.6 48.7
44

TABLE 6: FITZROY INDUSTRY BY INDUSTRY FLOW TABLE 1996-97DIRECT ALLOCATION OF COMPETING IMPORTS, BASIC PRICES, RECORDING INTRA-INDUSTRY FLOWS, 34 INDUSTRIES ($ MILLION)
INDUSTRY DESCRIPTION
24 Road transport
25 Rail and pipeline transport
26 Other transport
27 Communication services
28 Finance, property and business services
29 Ownership of dwellings
30 Government administration and defence
31 Education
32 Health and community services
33 Cultural and recreational services
34 Personal and other services
T1 Total intermediate usage
P1 Compensation of employees
P2 Gross operating surplus and mixed income
P3 Taxes less subsidies on products
P4 Taxes less subsidies on production
P5 Complementary imports
P6 Imported inputs
P6a Foreign and interstate
P6b Interregional
T2 Total production
Employment (fte persons)
25 26 27 28 29 30 31 32 33 34T4 Total
intermediate usage
1.2 2.3 1.3 3.2 0.2 1.6 0.6 1.5 0.9 0.6 171.7
0.4 0.6 0.5 3.6 - 0.3 0.2 0.6 - - 270.2
0.6 18.9 3.0 15.5 - 5.0 0.6 1.2 0.3 0.6 130.3
1.1 1.9 1.1 15.7 - 7.2 1.4 3.2 1.1 1.3 75.1
25.6 13.6 5.1 206.5 29.6 27.0 3.6 21.0 7.6 6.0 734.5
- - - - - - - - - - -
1.1 2.3 0.9 5.7 0.1 31.5 1.2 0.9 0.1 0.2 69.7
0.1 0.2 - 1.8 - 0.4 0.3 0.2 - 0.1 5.4
- 0.2 0.1 0.4 - 0.4 0.1 3.7 0.2 0.1 59.6
- - - 3.1 - 0.2 - 0.1 1.9 - 8.0
- - - 1.2 - 0.3 0.1 0.8 - 0.2 6.7
63.2 52.9 24.9 322.4 61.2 93.4 17.9 56.4 20.1 15.9 3,214.0
109.6 68.7 41.1 199.3 - 189.8 184.4 207.8 21.4 78.3 2,691.6
59.1 88.5 48.8 148.3 364.7 34.2 35.5 48.7 29.4 24.1 3,036.8
1.9 2.2 2.0 5.8 2.4 1.5 0.7 1.9 0.9 1.1 96.9
-0.9 2.2 2.6 17.2 28.1 -1.4 2.6 3.4 0.7 2.0 151.6
- - - - - - - - - - 4.2
53.4 53.3 23.8 261.2 31.2 60.1 17.5 54.2 35.2 21.2 2,952.2
27.8 43.1 19.4 191.0 21.4 47.0 14.6 44.7 29.5 17.7 1,871.7
25.5 10.2 4.4 70.2 9.8 13.1 2.8 9.4 5.7 3.5 1,080.6
286.3 267.7 143.3 954.2 487.6 377.6 258.7 372.4 107.7 142.5 12,147.2
2,455 1,241 940 5,898 - 4,175 4,845 5,913 870 2,277 71,921
45

TABLE 6: FITZROY INDUSTRY BY INDUSTRY FLOW TABLE 1996-97DIRECT ALLOCATION OF COMPETING IMPORTS, BASIC PRICES, RECORDING INTRA-INDUSTRY FLOWS, 34 INDUSTRIES ($ MILLION)
INDUSTRY DESCRIPTION
1 Sheep
2 Grains
3 Beef cattle
4 Dairy cattle and pigs
5 Other agriculture
6 Sugar cane growing
7 Forestry and fishing
8 Coal, oil and gas
9 Non-ferrous metal ores
10 Other mining
11 Food manufacturing
12 Textiles, clothing and footwear
13 Wood and paper manufacturing
14 Chemicals, petroleum and coal products
15 Non-metallic mineral products
16 Metals, metal products
17 Machinery, appliances and equipment
18 Miscellaneous manufacturing
19 Electricity supply, gas and water
20 Residential building construction
21 Other construction
22 Trade
23 Accommodation, cafes and restaurants
Household Government Private Public enterprise
General government
Change in inventories Total Foreign and
interstate InterregionalTotal final
demand (Q1 to Q7)
Total production
Q1 Q2 Q3 Q4 Q5 Q6 Q7 Q7a Q7b
- - - - - - - - - - 0.1
0.9 - - - - 3.6 102.2 84.9 17.2 106.6 118.4
0.1 - 23.6 - - -13.6 50.6 20.3 30.3 60.7 261.6
- - 0.1 - - - 13.1 - 13.1 13.2 22.4
14.1 0.5 - - - 0.1 69.2 32.4 36.8 84.0 121.5
- - - - - - - - - - -
8.5 1.6 - - 0.2 - 20.4 6.9 13.5 30.8 38.2
0.5 - - - - 6.3 2,039.9 2,038.6 1.3 2,046.7 2,159.3
- - - - - - - - - - -
0.2 0.5 69.1 - - -0.4 64.1 4.8 59.3 133.6 245.8
117.8 - 1.2 - - 0.4 376.4 332.1 44.3 495.8 562.8
8.8 - - - - - - - - 8.8 9.1
21.7 0.6 1.1 0.9 0.2 -2.2 11.7 4.6 7.1 34.1 70.1
10.6 2.1 0.5 - - 0.1 263.9 212.8 51.1 277.2 325.7
0.7 - 0.4 - - 0.2 111.1 30.7 80.4 112.4 192.6
5.1 - 3.8 0.3 1.4 -4.0 1,104.9 1,103.1 1.8 1,111.5 1,386.0
2.0 - 2.2 0.8 - 0.1 14.5 5.3 9.2 19.9 37.1
8.0 - 0.7 - 0.1 - 0.4 - 0.4 9.3 13.7
119.6 2.2 4.1 3.0 - - 513.2 17.3 495.9 642.1 883.8
- - 134.1 29.2 0.8 - - - - 164.2 179.8
- 20.7 150.5 281.4 96.0 - - - - 548.5 560.5
464.9 0.1 58.1 13.8 10.1 - 126.2 88.9 37.2 673.2 1,018.2
111.0 - - - - - 101.4 75.2 26.2 212.4 261.1
ExportsFinal consumption expenditure Gross fixed capital formation
46

TABLE 6: FITZROY INDUSTRY BY INDUSTRY FLOW TABLE 1996-97DIRECT ALLOCATION OF COMPETING IMPORTS, BASIC PRICES, RECORDING INTRA-INDUSTRY FLOWS, 34 INDUSTRIES ($ MILLION)
INDUSTRY DESCRIPTION
24 Road transport
25 Rail and pipeline transport
26 Other transport
27 Communication services
28 Finance, property and business services
29 Ownership of dwellings
30 Government administration and defence
31 Education
32 Health and community services
33 Cultural and recreational services
34 Personal and other services
T1 Total intermediate usage
P1 Compensation of employees
P2 Gross operating surplus and mixed income
P3 Taxes less subsidies on products
P4 Taxes less subsidies on production
P5 Complementary imports
P6 Imported inputs
P6a Foreign and interstate
P6b Interregional
T2 Total production
Employment (fte persons)
Household Government Private Public enterprise
General government
Change in inventories Total Foreign and
interstate InterregionalTotal final
demand (Q1 to Q7)
Total production
Q1 Q2 Q3 Q4 Q5 Q6 Q7 Q7a Q7b
ExportsFinal consumption expenditure Gross fixed capital formation
23.1 6.7 2.2 - 0.7 0.2 76.9 64.9 12.0 109.8 281.4
12.5 1.6 0.7 - - - 1.1 0.8 0.3 16.0 286.2
19.7 34.2 0.3 - - - 83.2 63.5 19.7 137.4 267.7
47.0 0.4 0.2 - - - 20.6 13.7 6.9 68.2 143.3
139.3 27.2 13.9 15.1 6.8 - 17.4 8.8 8.6 219.7 954.1
477.8 0.4 - - - - 9.3 8.8 0.5 487.6 487.6
8.7 294.8 2.7 0.3 1.5 - - - - 308.0 377.6
41.3 180.2 0.3 - 0.4 - 31.0 19.8 11.1 253.3 258.7
113.1 194.7 0.2 - 0.3 - 4.5 0.5 4.0 312.8 372.4
71.6 18.0 0.3 - 1.6 - 8.1 7.3 0.8 99.7 107.7
61.0 61.5 - - - - 13.4 12.3 1.1 135.9 142.5
1,909.5 848.2 470.5 345.0 120.3 -9.0 5,248.8 4,258.3 990.5 8,933.2 12,147.3
- - - - - - - - - - 2,691.6
- - - - - - - - - - 3,036.8
136.2 - 31.9 1.1 3.0 0.7 83.2 83.2 - 256.0 352.9
- - 23.4 - - - - - - 23.4 174.9
1.5 - 1.1 - - 0.6 - - - 3.2 7.4
627.2 19.9 156.9 56.0 35.0 75.2 - - - 970.2 3,922.4
382.2 16.8 102.9 37.4 18.8 83.3 - - - 641.4 2,513.1
245.0 3.1 54.0 18.5 16.3 -8.1 - - - 328.8 1,409.4
2,674.4 868.0 683.8 402.1 158.4 67.4 5,332.0 4,341.5 990.5 10,186.2 22,333.4
- - - - - - - - - - 71,921
47

TABLE 7: CENTRAL WEST INDUSTRY BY INDUSTRY FLOW TABLE 1996-97DIRECT ALLOCATION OF COMPETING IMPORTS, BASIC PRICES, RECORDING INTRA-INDUSTRY FLOWS, 34 INDUSTRIES ($ MILLION)
INDUSTRY DESCRIPTION 1 2 3 4 5 6 7 8 9 10 11 12
1 Sheep 4.4 - - - - - - - - - 0.1 -
2 Grains - - - - - - - - - - - -
3 Beef cattle - - 20.3 - - - - - - - - -
4 Dairy cattle and pigs - - - - - - - - - - - -
5 Other agriculture 1.2 - 1.5 - 2.1 - - - - - 0.1 -
6 Sugar cane growing - - - - - - - - - - - -
7 Forestry and fishing - - - - - - - - - - - -
8 Coal, oil and gas - - - - - - - - - - - -
9 Non-ferrous metal ores - - - - - - - - - - - -
10 Other mining - - 0.1 - - - - - - 0.1 - -
11 Food manufacturing 0.2 - 0.5 - 0.2 - - - - - 0.1 -
12 Textiles, clothing and footwear - - - - - - - - - - - -
13 Wood and paper manufacturing - - - - - - - - - - - -
14 Chemicals, petroleum and coal products - - - - - - - - - - - -
15 Non-metallic mineral products - - - - - - - - - - - -
16 Metals, metal products - - - - - - - - - - - -
17 Machinery, appliances and equipment - - - - - - - - - - - -
18 Miscellaneous manufacturing - - - - - - - - - - - -
19 Electricity supply, gas and water 0.1 - 0.2 - - - - - - - - -
20 Residential building construction - - - - - - - - - - - -
21 Other construction 0.2 - 0.5 - - - - - - - - -
22 Trade 0.8 - 0.8 - 0.1 - - - - - - -
23 Accommodation, cafes and restaurants 0.4 - 0.5 - - - - - - - - -
48

TABLE 7: CENTRAL WEST INDUSTRY BY INDUSTRY FLOW TABLE 1996-97DIRECT ALLOCATION OF COMPETING IMPORTS, BASIC PRICES, RECORDING INTRA-INDUSTRY FLOWS, 34 INDUSTRIES ($ MILLION)
INDUSTRY DESCRIPTION 1 2 3 4 5 6 7 8 9 10 11 12
24 Road transport 1.9 - 3.5 - 0.6 - - - - 0.2 0.4 -
25 Rail and pipeline transport 0.3 - 0.2 - 0.1 - - - - - - -
26 Other transport 0.1 - 0.1 - - - - - - - - -
27 Communication services 0.4 - 0.5 - - - - - - - - -
28 Finance, property and business services 1.3 - 1.5 - 0.2 - - - - - - -
29 Ownership of dwellings - - - - - - - - - - - -
30 Government administration and defence 0.1 - 0.1 - - - - - - - - -
31 Education - - - - - - - - - - - -
32 Health and community services - - 0.2 - - - - - - - - -
33 Cultural and recreational services - - - - - - - - - - - -
34 Personal and other services - - - - - - - - - - - -
T1 Total intermediate usage 11.3 - 30.5 - 3.4 - - - - 0.3 0.9 -
P1 Compensation of employees 4.2 - 5.2 - 3.7 - - - - 0.4 1.1 -
P2 Gross operating surplus and mixed income 32.3 - 48.9 - 3.3 - - - - 0.7 0.4 -
P3 Taxes less subsidies on products 0.4 - 0.7 - 0.1 - - - - - 0.1 -
P4 Taxes less subsidies on production 0.9 - 2.1 - 0.5 - - - - - 0.1 -
P5 Complementary imports - - - - - - - - - - - -
P6 Imported inputs 18.7 - 35.7 - 12.0 - - - - 1.1 2.6 -
P6a Foreign and interstate 7.5 - 19.2 - 5.7 - - - - 1.0 1.4 -
P6b Interregional 11.1 - 16.5 - 6.2 - - - - 0.2 1.3 -
T2 Total production 67.8 - 123.1 - 22.9 - - - - 2.6 5.1 -
Employment (fte persons) 472 - 1,145 - 247 - - - - 11 37 -
49

TABLE 7: CENTRAL WEST INDUSTRY BY INDUSTRY FLOW TABLE 1996-97DIRECT ALLOCATION OF COMPETING IMPORTS, BASIC PRICES, RECORDING INTRA-INDUSTRY FLOWS, 34 INDUSTRIES ($ MILLION)
INDUSTRY DESCRIPTION
1 Sheep
2 Grains
3 Beef cattle
4 Dairy cattle and pigs
5 Other agriculture
6 Sugar cane growing
7 Forestry and fishing
8 Coal, oil and gas
9 Non-ferrous metal ores
10 Other mining
11 Food manufacturing
12 Textiles, clothing and footwear
13 Wood and paper manufacturing
14 Chemicals, petroleum and coal products
15 Non-metallic mineral products
16 Metals, metal products
17 Machinery, appliances and equipment
18 Miscellaneous manufacturing
19 Electricity supply, gas and water
20 Residential building construction
21 Other construction
22 Trade
23 Accommodation, cafes and restaurants
13 14 15 16 17 18 19 20 21 22 23 24
- - - - - - - - - - - -
- - - - - - - - - - - -
- - - - - - - - - - - -
- - - - - - - - - - - -
- - - - - - - - 0.1 - 0.1 -
- - - - - - - - - - - -
- - - - - - - - - - - -
- - - - - - - - - - - -
- - - - - - - - - - - -
- - - - - - - - 1.6 - - -
- - - - - - - - - 0.1 0.3 -
- - - - - - - - - - - -
- - - - - - - - - - - -
- - - - - - - - - - - -
- - - - - - - - - - - -
- - - - - - - 0.1 3.8 - - -
- - - - - - - - - - - -
- - - - - - - - 0.1 - - -
- - - - - - 1.4 - 0.1 0.1 0.1 -
- - - - - - - - - - - -
- - - - - - - - - - 0.1 -
- - - - - - - 0.1 1.2 0.4 0.3 0.4
- - - - - - - - 0.4 0.2 - 0.2
50

TABLE 7: CENTRAL WEST INDUSTRY BY INDUSTRY FLOW TABLE 1996-97DIRECT ALLOCATION OF COMPETING IMPORTS, BASIC PRICES, RECORDING INTRA-INDUSTRY FLOWS, 34 INDUSTRIES ($ MILLION)
INDUSTRY DESCRIPTION
24 Road transport
25 Rail and pipeline transport
26 Other transport
27 Communication services
28 Finance, property and business services
29 Ownership of dwellings
30 Government administration and defence
31 Education
32 Health and community services
33 Cultural and recreational services
34 Personal and other services
T1 Total intermediate usage
P1 Compensation of employees
P2 Gross operating surplus and mixed income
P3 Taxes less subsidies on products
P4 Taxes less subsidies on production
P5 Complementary imports
P6 Imported inputs
P6a Foreign and interstate
P6b Interregional
T2 Total production
Employment (fte persons)
13 14 15 16 17 18 19 20 21 22 23 24
- - - - - - - 0.1 1.8 0.4 0.1 2.6
- - - - - - - - 0.5 0.1 0.1 -
- - - - - - - - 0.1 0.1 - 0.1
- - - - - - - - 0.1 0.4 0.2 0.3
- - - - - - 0.1 0.1 2.4 1.2 0.6 0.5
- - - - - - - - - - - -
- - - - - - - - 0.3 0.1 - 0.7
- - - - - - - - - - - -
- - - - - - - - - - - -
- - - - - - - - - - - -
- - - - - - - - - - - -
- - - - - - 1.5 0.4 12.5 3.3 2.1 4.8
0.2 - - 1.1 - 0.5 0.2 0.5 12.5 9.8 7.2 4.9
0.2 - - 0.7 - - 0.6 1.2 25.3 3.7 3.6 7.2
- - - - - - 0.1 - 1.4 3.3 1.0 0.8
- - - - - - - - 1.3 7.5 0.2 0.5
- - - - - - - - - - - -
- - - 3.8 - 0.3 0.8 2.8 57.0 10.2 11.0 10.1
- - - 1.2 - 0.2 0.6 1.8 36.2 6.4 7.6 7.1
- - - 2.6 - - 0.2 1.0 20.8 3.8 3.4 2.9
0.4 - - 5.8 - 0.8 3.3 4.9 109.9 37.8 25.0 28.3
4 - - 20 - 15 8 33 1,075 426 268 223
51

TABLE 7: CENTRAL WEST INDUSTRY BY INDUSTRY FLOW TABLE 1996-97DIRECT ALLOCATION OF COMPETING IMPORTS, BASIC PRICES, RECORDING INTRA-INDUSTRY FLOWS, 34 INDUSTRIES ($ MILLION)
INDUSTRY DESCRIPTION
1 Sheep
2 Grains
3 Beef cattle
4 Dairy cattle and pigs
5 Other agriculture
6 Sugar cane growing
7 Forestry and fishing
8 Coal, oil and gas
9 Non-ferrous metal ores
10 Other mining
11 Food manufacturing
12 Textiles, clothing and footwear
13 Wood and paper manufacturing
14 Chemicals, petroleum and coal products
15 Non-metallic mineral products
16 Metals, metal products
17 Machinery, appliances and equipment
18 Miscellaneous manufacturing
19 Electricity supply, gas and water
20 Residential building construction
21 Other construction
22 Trade
23 Accommodation, cafes and restaurants
25 26 27 28 29 30 31 32 33 34T4 Total
intermediate usage
- - - - - - - - - - 4.4
- - - - - - - - - - -
- - - - - - - - - - 20.3
- - - - - - - - - - -
- - - - - - - - - - 5.1
- - - - - - - - - - -
- - - - - - - - - - -
- - - - - - - - - - -
- - - - - - - - - - -
- - - - - 0.1 - - - - 2.0
- - - - - - - - - - 1.6
- - - - - - - - - - -
- - - - - - - - - - -
- - - - - - - - - - -
- - - - - - - - - - -
0.8 - - - 0.1 - - - - - 4.9
- - - - - - - - - - -
- - - - - - - - - - 0.1
0.2 - - 0.1 - 0.2 0.1 0.1 - - 2.8
- - - - 0.8 - - - - - 0.9
0.4 - - - - 0.1 - - - - 1.5
0.3 - 0.1 0.1 0.1 0.2 0.1 0.3 - - 5.4
0.1 - 0.1 0.5 - 0.9 - 0.1 0.1 - 3.7
52
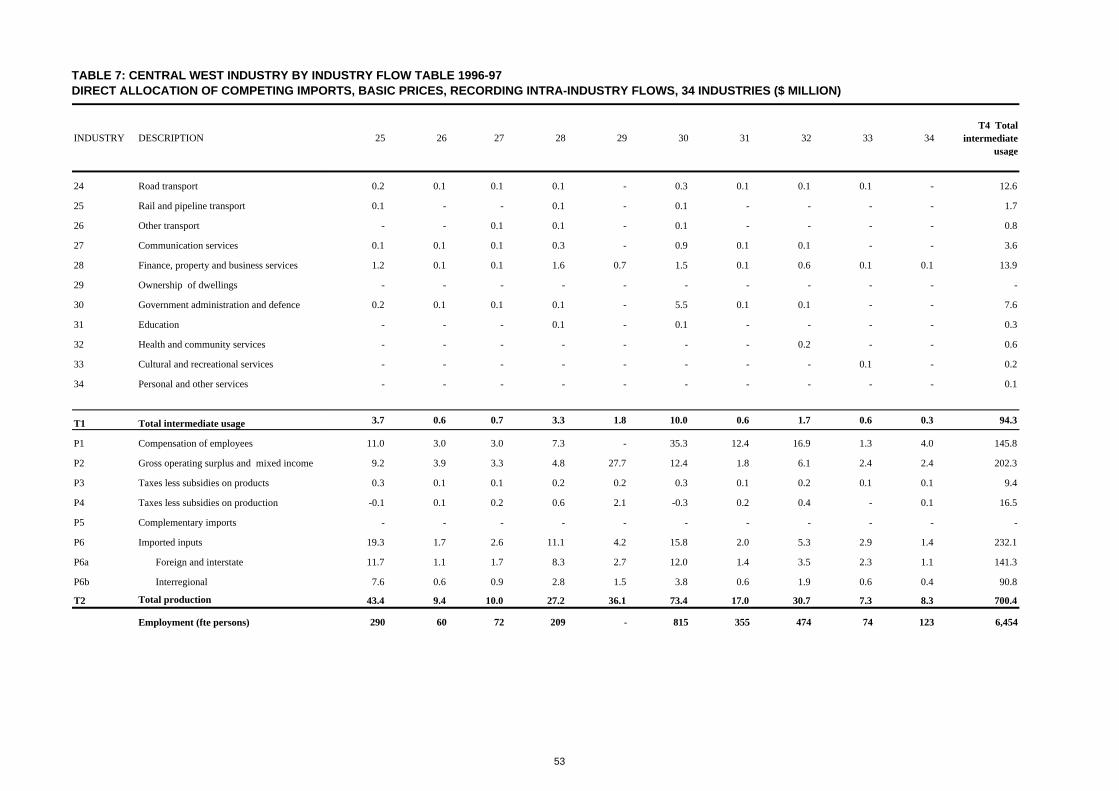
TABLE 7: CENTRAL WEST INDUSTRY BY INDUSTRY FLOW TABLE 1996-97DIRECT ALLOCATION OF COMPETING IMPORTS, BASIC PRICES, RECORDING INTRA-INDUSTRY FLOWS, 34 INDUSTRIES ($ MILLION)
INDUSTRY DESCRIPTION
24 Road transport
25 Rail and pipeline transport
26 Other transport
27 Communication services
28 Finance, property and business services
29 Ownership of dwellings
30 Government administration and defence
31 Education
32 Health and community services
33 Cultural and recreational services
34 Personal and other services
T1 Total intermediate usage
P1 Compensation of employees
P2 Gross operating surplus and mixed income
P3 Taxes less subsidies on products
P4 Taxes less subsidies on production
P5 Complementary imports
P6 Imported inputs
P6a Foreign and interstate
P6b Interregional
T2 Total production
Employment (fte persons)
25 26 27 28 29 30 31 32 33 34T4 Total
intermediate usage
0.2 0.1 0.1 0.1 - 0.3 0.1 0.1 0.1 - 12.6
0.1 - - 0.1 - 0.1 - - - - 1.7
- - 0.1 0.1 - 0.1 - - - - 0.8
0.1 0.1 0.1 0.3 - 0.9 0.1 0.1 - - 3.6
1.2 0.1 0.1 1.6 0.7 1.5 0.1 0.6 0.1 0.1 13.9
- - - - - - - - - - -
0.2 0.1 0.1 0.1 - 5.5 0.1 0.1 - - 7.6
- - - 0.1 - 0.1 - - - - 0.3
- - - - - - - 0.2 - - 0.6
- - - - - - - - 0.1 - 0.2
- - - - - - - - - - 0.1
3.7 0.6 0.7 3.3 1.8 10.0 0.6 1.7 0.6 0.3 94.3
11.0 3.0 3.0 7.3 - 35.3 12.4 16.9 1.3 4.0 145.8
9.2 3.9 3.3 4.8 27.7 12.4 1.8 6.1 2.4 2.4 202.3
0.3 0.1 0.1 0.2 0.2 0.3 0.1 0.2 0.1 0.1 9.4
-0.1 0.1 0.2 0.6 2.1 -0.3 0.2 0.4 - 0.1 16.5
- - - - - - - - - - -
19.3 1.7 2.6 11.1 4.2 15.8 2.0 5.3 2.9 1.4 232.1
11.7 1.1 1.7 8.3 2.7 12.0 1.4 3.5 2.3 1.1 141.3
7.6 0.6 0.9 2.8 1.5 3.8 0.6 1.9 0.6 0.4 90.8
43.4 9.4 10.0 27.2 36.1 73.4 17.0 30.7 7.3 8.3 700.4
290 60 72 209 - 815 355 474 74 123 6,454
53

TABLE 7: CENTRAL WEST INDUSTRY BY INDUSTRY FLOW TABLE 1996-97DIRECT ALLOCATION OF COMPETING IMPORTS, BASIC PRICES, RECORDING INTRA-INDUSTRY FLOWS, 34 INDUSTRIES ($ MILLION)
INDUSTRY DESCRIPTION
1 Sheep
2 Grains
3 Beef cattle
4 Dairy cattle and pigs
5 Other agriculture
6 Sugar cane growing
7 Forestry and fishing
8 Coal, oil and gas
9 Non-ferrous metal ores
10 Other mining
11 Food manufacturing
12 Textiles, clothing and footwear
13 Wood and paper manufacturing
14 Chemicals, petroleum and coal products
15 Non-metallic mineral products
16 Metals, metal products
17 Machinery, appliances and equipment
18 Miscellaneous manufacturing
19 Electricity supply, gas and water
20 Residential building construction
21 Other construction
22 Trade
23 Accommodation, cafes and restaurants
Household Government Private Public enterprise
General government
Change in inventories Total Foreign and
interstate InterregionalTotal final
demand (Q1 to Q7)
Total production
Q1 Q2 Q3 Q4 Q5 Q6 Q7 Q7a Q7b
- - 9.7 - - -18.3 72.0 43.4 28.5 63.3 67.8
- - - - - - - - - - -
- - 13.6 - - -7.2 96.3 38.4 57.8 102.8 123.1
- - - - - - - - - - -
0.3 0.1 - - - -0.1 17.4 14.6 2.8 17.8 22.9
- - - - - - - - - - -
- - - - - - - - - - -
- - - - - - - - - - -
- - - - - - - - - - -
- 0.1 0.3 - - - 0.2 0.1 0.1 0.6 2.6
0.5 - - - - - 3.0 1.2 1.8 3.5 5.1
- - - - - - - - - - -
0.2 0.1 - - - - 0.1 - 0.1 0.4 0.4
- - - - - - - - - - -
- - - - - - - - - - -
0.7 - - - - - 0.1 - 0.1 0.8 5.8
- - - - - - - - - - -
0.5 - - - - - 0.2 0.1 - 0.7 0.8
0.1 0.3 - 0.1 - - - - - 0.5 3.3
- - 1.2 2.6 0.2 - - - - 4.0 4.9
- 4.3 49.1 26.8 28.3 - - - - 108.5 109.9
19.2 - 3.8 0.1 0.2 - 9.1 6.0 3.1 32.4 37.8
9.5 - - - - - 11.9 9.5 2.3 21.3 25.0
ExportsFinal consumption expenditure Gross fixed capital formation
54

TABLE 7: CENTRAL WEST INDUSTRY BY INDUSTRY FLOW TABLE 1996-97DIRECT ALLOCATION OF COMPETING IMPORTS, BASIC PRICES, RECORDING INTRA-INDUSTRY FLOWS, 34 INDUSTRIES ($ MILLION)
INDUSTRY DESCRIPTION
24 Road transport
25 Rail and pipeline transport
26 Other transport
27 Communication services
28 Finance, property and business services
29 Ownership of dwellings
30 Government administration and defence
31 Education
32 Health and community services
33 Cultural and recreational services
34 Personal and other services
T1 Total intermediate usage
P1 Compensation of employees
P2 Gross operating surplus and mixed income
P3 Taxes less subsidies on products
P4 Taxes less subsidies on production
P5 Complementary imports
P6 Imported inputs
P6a Foreign and interstate
P6b Interregional
T2 Total production
Employment (fte persons)
Household Government Private Public enterprise
General government
Change in inventories Total Foreign and
interstate InterregionalTotal final
demand (Q1 to Q7)
Total production
Q1 Q2 Q3 Q4 Q5 Q6 Q7 Q7a Q7b
ExportsFinal consumption expenditure Gross fixed capital formation
1.7 1.2 0.3 - - - 12.6 10.6 1.9 15.7 28.3
1.1 0.3 0.1 - - - 40.1 29.3 10.8 41.6 43.4
1.2 4.3 - - - - 3.1 1.9 1.2 8.6 9.4
1.2 0.1 - - - - 5.0 3.6 1.4 6.3 10.0
9.7 1.6 0.1 - - - 1.8 1.4 0.4 13.2 27.2
33.6 0.1 - - - - 2.4 1.7 0.7 36.1 36.1
0.5 64.7 0.5 - - - - - - 65.8 73.4
2.4 13.5 - - - - 0.7 0.6 0.1 16.7 17.0
4.1 24.7 - - - - 1.3 0.7 0.6 30.1 30.7
5.2 1.3 - - - - 0.6 0.6 - 7.1 7.3
4.2 3.5 - - - - 0.5 0.4 0.1 8.2 8.3
96.0 120.1 78.8 29.6 28.8 -25.5 278.2 164.2 114.0 606.1 700.4
- - - - - - - - - - 145.8
- - - - - - - - - - 202.3
10.3 - 0.3 0.1 0.1 0.1 6.5 6.5 - 17.4 26.7
- - 0.3 - - - - - - 0.3 16.7
0.1 - 0.2 - - -0.2 - - - 0.1 0.1
74.2 2.4 51.1 4.0 5.8 -1.5 - - - 135.9 368.0
22.3 2.2 16.1 3.4 5.0 -0.2 - - - 48.8 190.2
51.9 0.2 35.0 0.5 0.8 -1.3 - - - 87.0 177.9
180.6 122.5 130.7 33.7 34.7 -27.2 284.7 170.7 114.0 759.7 1,460.0
- - - - - - - - - - 6,454
55

TABLE 8: MACKAY INDUSTRY BY INDUSTRY FLOW TABLE 1996-97DIRECT ALLOCATION OF COMPETING IMPORTS, BASIC PRICES, RECORDING INTRA-INDUSTRY FLOWS, 34 INDUSTRIES ($ MILLION)
INDUSTRY DESCRIPTION 1 2 3 4 5 6 7 8 9 10 11 12
1 Sheep - - - - - - - - - - - -
2 Grains - 3.2 0.8 1.5 0.2 0.4 - - - - 11.3 -
3 Beef cattle - - 20.0 - - - - - - - 37.1 -
4 Dairy cattle and pigs - - - - - - - - - - 3.2 -
5 Other agriculture - - 2.1 0.1 4.0 7.0 - - - - 5.2 -
6 Sugar cane growing - - - - - 10.8 - - - - 337.9 -
7 Forestry and fishing - - 0.3 - - 1.0 0.1 0.5 - - 0.3 -
8 Coal, oil and gas - - 0.2 - 0.1 0.1 - 40.5 - 0.6 7.0 -
9 Non-ferrous metal ores - - - - - - - - - - - -
10 Other mining - - - - - 0.4 - 92.5 - 1.4 3.9 -
11 Food manufacturing - - 3.7 1.2 2.3 2.6 2.2 0.9 - 0.5 20.1 -
12 Textiles, clothing and footwear - - - - - - - - - - - -
13 Wood and paper manufacturing - - 0.3 - - 1.4 0.2 1.7 - 0.3 1.4 -
14 Chemicals, petroleum and coal products - - 0.8 - 0.4 5.9 0.2 23.4 - 2.8 1.3 -
15 Non-metallic mineral products - - - - - - - 0.5 - 0.3 0.1 -
16 Metals, metal products - - - - 0.1 - - 11.4 - 0.1 2.7 -
17 Machinery, appliances and equipment - 0.1 0.1 - 0.1 0.5 1.7 44.2 - 3.1 0.2 -
18 Miscellaneous manufacturing - - - - - 0.1 0.1 1.9 - 0.1 - -
19 Electricity supply, gas and water - - 0.6 0.1 0.1 3.0 0.1 17.2 - 0.2 5.3 -
20 Residential building construction - - - - - - - 0.1 - 0.1 - -
21 Other construction - - 0.4 - - 1.2 - 2.2 - 0.1 - -
22 Trade - - 3.9 0.4 1.5 19.4 3.7 54.6 - 9.4 24.2 0.3
23 Accommodation, cafes and restaurants - - 0.5 0.1 0.1 3.2 0.1 1.7 - 4.6 3.3 -
56
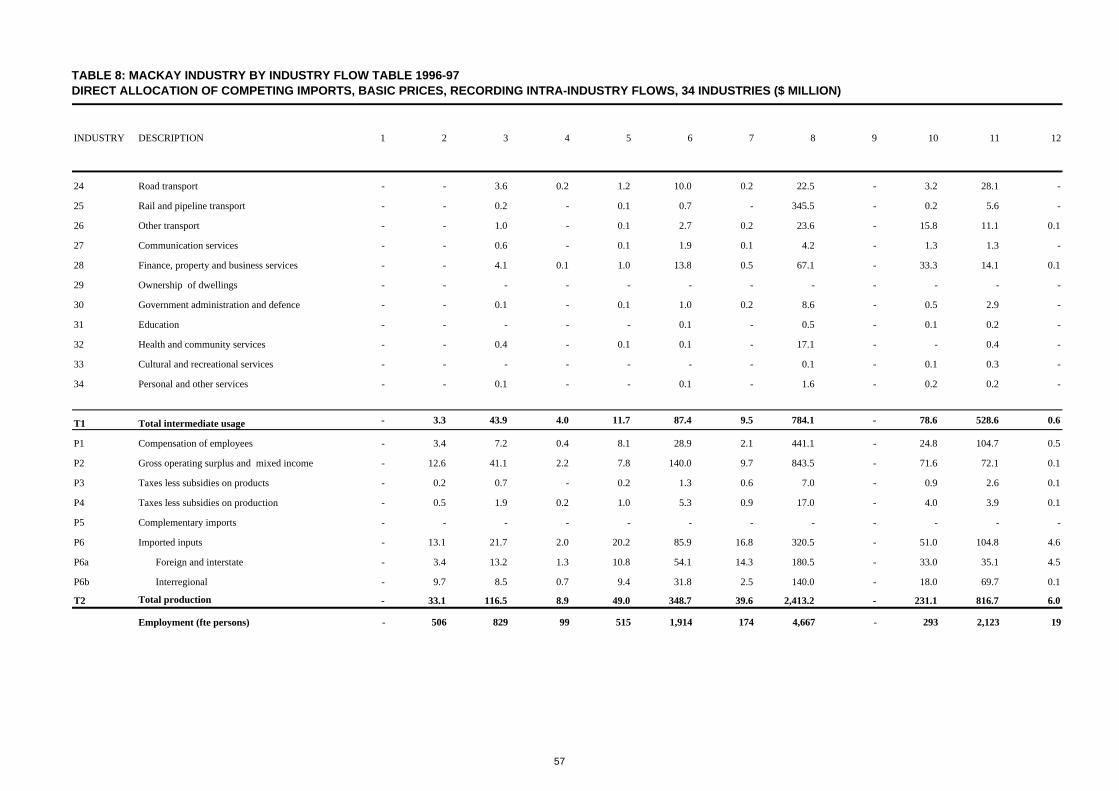
TABLE 8: MACKAY INDUSTRY BY INDUSTRY FLOW TABLE 1996-97DIRECT ALLOCATION OF COMPETING IMPORTS, BASIC PRICES, RECORDING INTRA-INDUSTRY FLOWS, 34 INDUSTRIES ($ MILLION)
INDUSTRY DESCRIPTION 1 2 3 4 5 6 7 8 9 10 11 12
24 Road transport - - 3.6 0.2 1.2 10.0 0.2 22.5 - 3.2 28.1 -
25 Rail and pipeline transport - - 0.2 - 0.1 0.7 - 345.5 - 0.2 5.6 -
26 Other transport - - 1.0 - 0.1 2.7 0.2 23.6 - 15.8 11.1 0.1
27 Communication services - - 0.6 - 0.1 1.9 0.1 4.2 - 1.3 1.3 -
28 Finance, property and business services - - 4.1 0.1 1.0 13.8 0.5 67.1 - 33.3 14.1 0.1
29 Ownership of dwellings - - - - - - - - - - - -
30 Government administration and defence - - 0.1 - 0.1 1.0 0.2 8.6 - 0.5 2.9 -
31 Education - - - - - 0.1 - 0.5 - 0.1 0.2 -
32 Health and community services - - 0.4 - 0.1 0.1 - 17.1 - - 0.4 -
33 Cultural and recreational services - - - - - - - 0.1 - 0.1 0.3 -
34 Personal and other services - - 0.1 - - 0.1 - 1.6 - 0.2 0.2 -
T1 Total intermediate usage - 3.3 43.9 4.0 11.7 87.4 9.5 784.1 - 78.6 528.6 0.6
P1 Compensation of employees - 3.4 7.2 0.4 8.1 28.9 2.1 441.1 - 24.8 104.7 0.5
P2 Gross operating surplus and mixed income - 12.6 41.1 2.2 7.8 140.0 9.7 843.5 - 71.6 72.1 0.1
P3 Taxes less subsidies on products - 0.2 0.7 - 0.2 1.3 0.6 7.0 - 0.9 2.6 0.1
P4 Taxes less subsidies on production - 0.5 1.9 0.2 1.0 5.3 0.9 17.0 - 4.0 3.9 0.1
P5 Complementary imports - - - - - - - - - - - -
P6 Imported inputs - 13.1 21.7 2.0 20.2 85.9 16.8 320.5 - 51.0 104.8 4.6
P6a Foreign and interstate - 3.4 13.2 1.3 10.8 54.1 14.3 180.5 - 33.0 35.1 4.5
P6b Interregional - 9.7 8.5 0.7 9.4 31.8 2.5 140.0 - 18.0 69.7 0.1
T2 Total production - 33.1 116.5 8.9 49.0 348.7 39.6 2,413.2 - 231.1 816.7 6.0
Employment (fte persons) - 506 829 99 515 1,914 174 4,667 - 293 2,123 19
57

TABLE 8: MACKAY INDUSTRY BY INDUSTRY FLOW TABLE 1996-97DIRECT ALLOCATION OF COMPETING IMPORTS, BASIC PRICES, RECORDING INTRA-INDUSTRY FLOWS, 34 INDUSTRIES ($ MILLION)
INDUSTRY DESCRIPTION
1 Sheep
2 Grains
3 Beef cattle
4 Dairy cattle and pigs
5 Other agriculture
6 Sugar cane growing
7 Forestry and fishing
8 Coal, oil and gas
9 Non-ferrous metal ores
10 Other mining
11 Food manufacturing
12 Textiles, clothing and footwear
13 Wood and paper manufacturing
14 Chemicals, petroleum and coal products
15 Non-metallic mineral products
16 Metals, metal products
17 Machinery, appliances and equipment
18 Miscellaneous manufacturing
19 Electricity supply, gas and water
20 Residential building construction
21 Other construction
22 Trade
23 Accommodation, cafes and restaurants
13 14 15 16 17 18 19 20 21 22 23 24
- - - - - - - - - - - -
- - - - - - - - - - - -
- - - - - - - - - - - -
- - - - - - - - - - - -
- 0.1 - - - - - 0.1 0.4 0.3 1.0 -
- - - - - - - - - - - -
0.4 - - - - - - - 0.1 0.6 3.2 -
0.1 - 0.6 - 0.4 - - 0.1 0.1 2.5 2.7 0.4
- - - - - - - - - - - -
- 0.1 1.4 0.1 - - 0.2 1.0 3.1 0.2 0.2 -
- 0.6 - - - - - - 0.1 8.9 19.4 -
- - - - - - - - - - - -
2.1 0.1 - 0.5 0.4 0.9 0.1 1.1 2.0 2.5 0.8 0.3
0.4 2.6 0.1 0.2 0.3 0.1 0.4 0.7 1.3 0.7 0.5 0.7
0.1 - 1.6 0.1 - - 0.4 6.7 7.8 0.1 - -
- 0.4 0.6 13.2 6.1 0.3 0.6 9.5 12.2 1.8 0.3 0.4
- - - 0.5 5.2 - 0.2 0.6 3.0 1.8 0.2 0.2
- - - 0.2 - - - 0.1 0.3 0.2 0.3 0.1
0.3 0.6 0.4 2.6 0.9 0.1 15.2 0.2 0.8 3.8 4.4 0.4
- - - - - - - - 0.1 0.1 - -
- - - - - - 0.1 0.1 0.1 0.6 1.4 0.1
2.4 4.8 0.6 3.1 7.6 1.0 3.0 11.7 17.3 36.4 18.6 17.0
0.4 0.6 0.1 0.5 0.3 0.1 0.3 0.8 1.0 5.7 0.6 1.3
58

TABLE 8: MACKAY INDUSTRY BY INDUSTRY FLOW TABLE 1996-97DIRECT ALLOCATION OF COMPETING IMPORTS, BASIC PRICES, RECORDING INTRA-INDUSTRY FLOWS, 34 INDUSTRIES ($ MILLION)
INDUSTRY DESCRIPTION
24 Road transport
25 Rail and pipeline transport
26 Other transport
27 Communication services
28 Finance, property and business services
29 Ownership of dwellings
30 Government administration and defence
31 Education
32 Health and community services
33 Cultural and recreational services
34 Personal and other services
T1 Total intermediate usage
P1 Compensation of employees
P2 Gross operating surplus and mixed income
P3 Taxes less subsidies on products
P4 Taxes less subsidies on production
P5 Complementary imports
P6 Imported inputs
P6a Foreign and interstate
P6b Interregional
T2 Total production
Employment (fte persons)
13 14 15 16 17 18 19 20 21 22 23 24
1.4 1.6 3.1 1.4 1.1 0.4 0.3 4.3 6.1 14.6 1.7 24.1
0.1 0.9 1.1 0.6 0.8 - 0.8 0.5 1.5 2.4 1.1 0.1
1.2 2.0 0.3 1.4 1.0 0.1 0.4 0.2 3.0 28.8 1.9 3.3
0.2 0.2 0.1 0.4 0.6 0.1 0.4 0.2 0.5 11.4 2.4 2.8
2.0 1.6 0.6 3.1 2.3 0.2 3.6 12.1 25.8 81.6 20.3 11.4
- - - - - - - - - - - -
0.4 0.1 - 0.2 0.2 - 0.2 0.5 0.8 2.4 0.2 5.9
- - - - - - - - - 0.2 0.1 0.1
0.1 - - - - - - - 0.1 0.2 0.1 -
- - - - - - - - - 1.2 0.9 -
- - - - - - - - 0.1 0.3 0.2 0.1
11.6 16.4 10.7 28.1 27.5 3.4 26.3 50.6 87.5 209.3 82.4 68.7
13.8 16.0 5.5 22.5 53.1 2.6 21.2 29.9 61.5 258.6 85.3 38.7
5.6 22.4 4.3 9.5 8.7 1.1 51.5 55.0 69.2 110.6 42.7 56.2
0.5 0.8 0.4 0.5 0.8 0.1 1.3 1.7 4.4 14.3 12.5 6.7
0.8 1.5 0.8 1.4 1.5 0.2 0.2 1.4 3.8 21.7 2.9 4.3
- 3.7 - - - - - - - - - -
12.5 44.6 7.5 33.5 55.8 4.0 13.9 76.1 107.6 193.0 77.2 53.9
10.1 38.4 3.6 29.2 46.5 3.2 11.2 54.6 75.1 157.5 60.2 45.3
2.4 6.2 3.9 4.3 9.2 0.8 2.8 21.4 32.5 35.4 16.9 8.7
44.7 105.3 29.2 95.5 147.5 11.4 114.4 214.7 333.9 807.4 302.8 228.6
378 192 120 596 1,087 120 586 1,361 3,535 9,323 3,409 1,811
59

TABLE 8: MACKAY INDUSTRY BY INDUSTRY FLOW TABLE 1996-97DIRECT ALLOCATION OF COMPETING IMPORTS, BASIC PRICES, RECORDING INTRA-INDUSTRY FLOWS, 34 INDUSTRIES ($ MILLION)
INDUSTRY DESCRIPTION
1 Sheep
2 Grains
3 Beef cattle
4 Dairy cattle and pigs
5 Other agriculture
6 Sugar cane growing
7 Forestry and fishing
8 Coal, oil and gas
9 Non-ferrous metal ores
10 Other mining
11 Food manufacturing
12 Textiles, clothing and footwear
13 Wood and paper manufacturing
14 Chemicals, petroleum and coal products
15 Non-metallic mineral products
16 Metals, metal products
17 Machinery, appliances and equipment
18 Miscellaneous manufacturing
19 Electricity supply, gas and water
20 Residential building construction
21 Other construction
22 Trade
23 Accommodation, cafes and restaurants
25 26 27 28 29 30 31 32 33 34T4 Total
intermediate usage
- - - - - - - - - - -
- - - - - - - - - - 17.4
- - - - - - - - - - 57.1
- - - - - - - - - - 3.2
- - - 0.4 - 0.1 - - 0.6 0.1 21.4
- - - - - - - - - - 348.7
0.5 - - - - - - - - - 7.1
1.1 0.5 0.4 0.7 - 0.3 0.1 0.7 - 0.1 59.4
- - - - - - - - - - -
0.1 - - 0.4 0.1 0.1 - 0.1 0.2 - 106.0
0.3 0.1 0.1 1.0 0.1 0.2 0.1 0.3 1.0 0.2 66.1
- - - - - - - - - - 0.2
0.9 0.7 0.4 1.9 1.0 0.9 0.5 0.2 0.3 0.2 23.3
0.6 1.6 0.1 1.6 0.3 0.2 - 0.5 0.1 0.2 48.2
- - - 0.1 0.5 0.2 - - - - 18.7
9.8 1.4 0.7 - 2.9 - - 0.1 - - 74.4
17.1 3.9 0.2 0.7 0.1 0.3 - 0.1 0.1 0.1 84.3
0.2 - - 0.2 0.1 0.2 0.1 - - - 4.4
6.9 2.2 0.4 7.2 1.0 1.1 1.1 1.2 0.4 0.4 77.9
- - - 0.3 9.9 - - 0.1 - - 10.9
3.8 0.5 - 0.9 - 0.4 - - - - 12.2
16.0 10.5 6.4 14.8 4.2 2.0 2.0 7.0 2.2 2.1 307.8
0.7 2.0 0.8 9.4 - 1.9 0.3 0.6 0.6 0.4 41.9
60

TABLE 8: MACKAY INDUSTRY BY INDUSTRY FLOW TABLE 1996-97DIRECT ALLOCATION OF COMPETING IMPORTS, BASIC PRICES, RECORDING INTRA-INDUSTRY FLOWS, 34 INDUSTRIES ($ MILLION)
INDUSTRY DESCRIPTION
24 Road transport
25 Rail and pipeline transport
26 Other transport
27 Communication services
28 Finance, property and business services
29 Ownership of dwellings
30 Government administration and defence
31 Education
32 Health and community services
33 Cultural and recreational services
34 Personal and other services
T1 Total intermediate usage
P1 Compensation of employees
P2 Gross operating surplus and mixed income
P3 Taxes less subsidies on products
P4 Taxes less subsidies on production
P5 Complementary imports
P6 Imported inputs
P6a Foreign and interstate
P6b Interregional
T2 Total production
Employment (fte persons)
25 26 27 28 29 30 31 32 33 34T4 Total
intermediate usage
2.1 3.9 1.1 2.5 0.2 0.9 0.4 0.8 0.9 0.5 142.3
0.7 1.2 0.4 3.1 - 0.2 0.1 0.4 0.1 0.1 368.5
1.1 78.4 2.4 16.0 - 3.8 0.6 0.8 0.5 0.4 202.2
1.5 2.4 0.7 9.2 - 2.8 0.6 1.3 0.7 0.7 48.9
43.2 20.0 3.2 126.6 18.2 10.8 1.6 8.5 5.0 3.5 539.5
- - - - - - - - - - -
1.6 2.6 0.6 3.6 0.1 13.4 0.6 0.4 0.1 0.2 47.5
0.2 0.2 - 1.0 - 0.1 0.1 0.1 - 0.1 3.2
0.1 0.2 0.1 0.2 - 0.1 0.1 1.7 0.1 0.1 21.2
- 0.1 - 2.3 - 0.1 0.2 0.1 2.0 0.1 7.6
0.1 0.1 - 0.7 - 0.1 0.1 0.3 0.1 0.1 4.6
108.7 132.6 18.0 204.6 38.9 40.3 8.7 25.3 15.2 9.5 2,776.1
118.4 87.3 23.9 145.2 - 94.1 102.5 106.9 16.2 41.1 1,965.5
103.8 122.7 36.9 111.8 247.3 25.6 13.1 23.4 22.9 19.2 2,364.2
2.8 3.5 1.4 3.7 1.6 0.6 0.4 0.9 0.7 0.6 73.7
-1.4 2.6 1.8 12.4 18.9 -0.7 1.3 1.6 0.5 1.0 113.1
- - - - - - - - - - 3.7
82.3 85.0 16.0 194.9 21.3 25.0 8.6 26.1 24.7 14.7 1,818.8
49.0 71.2 13.4 152.5 14.9 19.5 7.0 21.7 20.5 12.6 1,267.5
33.2 13.8 2.6 42.5 6.5 5.5 1.6 4.3 4.2 2.1 551.3
414.7 433.5 98.0 672.8 328.0 185.0 134.6 184.2 80.2 86.1 9,115.2
2,878 1,815 508 3,901 - 1,945 2,570 3,019 618 1,314 52,226
61

TABLE 8: MACKAY INDUSTRY BY INDUSTRY FLOW TABLE 1996-97DIRECT ALLOCATION OF COMPETING IMPORTS, BASIC PRICES, RECORDING INTRA-INDUSTRY FLOWS, 34 INDUSTRIES ($ MILLION)
INDUSTRY DESCRIPTION
1 Sheep
2 Grains
3 Beef cattle
4 Dairy cattle and pigs
5 Other agriculture
6 Sugar cane growing
7 Forestry and fishing
8 Coal, oil and gas
9 Non-ferrous metal ores
10 Other mining
11 Food manufacturing
12 Textiles, clothing and footwear
13 Wood and paper manufacturing
14 Chemicals, petroleum and coal products
15 Non-metallic mineral products
16 Metals, metal products
17 Machinery, appliances and equipment
18 Miscellaneous manufacturing
19 Electricity supply, gas and water
20 Residential building construction
21 Other construction
22 Trade
23 Accommodation, cafes and restaurants
Household Government Private Public enterprise
General government
Change in inventories Total Foreign and
interstate InterregionalTotal final
demand (Q1 to Q7)
Total production
Q1 Q2 Q3 Q4 Q5 Q6 Q7 Q7a Q7b
- - - - - - - - - - -
0.2 - - - - 1.1 14.4 14.4 - 15.7 33.1
0.1 - 12.8 - - -6.6 53.1 12.8 40.3 59.4 116.5
- - 0.1 - - -0.1 5.7 - 5.7 5.7 8.9
6.6 0.3 - - - -0.1 20.8 15.5 5.4 27.6 49.0
- - - - - - - - - - 348.7
4.1 0.9 0.1 - 0.2 - 27.3 7.3 20.0 32.5 39.6
0.9 - - - - 41.5 2,311.4 2,292.7 18.6 2,353.8 2,413.2
- - - - - - - - - - -
0.1 0.3 59.5 - - -0.5 65.7 2.6 63.1 125.1 231.1
69.8 - 1.8 - - 0.5 678.4 630.9 47.5 750.6 816.7
5.8 - - - - - - - - 5.8 6.0
16.6 0.4 0.6 0.6 0.1 -0.4 3.5 0.7 2.9 21.4 44.7
4.5 1.5 0.2 - - 0.1 50.8 36.8 14.0 57.1 105.3
0.1 - - - - 0.1 10.3 3.3 7.0 10.5 29.2
3.1 - 1.5 0.3 1.3 - 14.9 11.0 3.9 21.1 95.5
3.3 - 8.4 1.4 0.3 0.1 49.7 30.2 19.5 63.2 147.5
5.9 - 0.2 0.3 - 0.1 0.6 0.1 0.5 7.0 11.4
33.5 1.2 - 1.8 - - - - - 36.5 114.4
- - 187.5 15.8 0.4 - - - - 203.8 214.7
- 10.4 108.1 152.2 51.0 - - - - 321.6 333.9
354.9 0.1 61.3 4.4 5.9 - 73.1 38.1 35.0 499.6 807.5
96.2 - - - - - 164.7 117.8 46.9 260.9 302.8
ExportsFinal consumption expenditure Gross fixed capital formation
62

TABLE 8: MACKAY INDUSTRY BY INDUSTRY FLOW TABLE 1996-97DIRECT ALLOCATION OF COMPETING IMPORTS, BASIC PRICES, RECORDING INTRA-INDUSTRY FLOWS, 34 INDUSTRIES ($ MILLION)
INDUSTRY DESCRIPTION
24 Road transport
25 Rail and pipeline transport
26 Other transport
27 Communication services
28 Finance, property and business services
29 Ownership of dwellings
30 Government administration and defence
31 Education
32 Health and community services
33 Cultural and recreational services
34 Personal and other services
T1 Total intermediate usage
P1 Compensation of employees
P2 Gross operating surplus and mixed income
P3 Taxes less subsidies on products
P4 Taxes less subsidies on production
P5 Complementary imports
P6 Imported inputs
P6a Foreign and interstate
P6b Interregional
T2 Total production
Employment (fte persons)
Household Government Private Public enterprise
General government
Change in inventories Total Foreign and
interstate InterregionalTotal final
demand (Q1 to Q7)
Total production
Q1 Q2 Q3 Q4 Q5 Q6 Q7 Q7a Q7b
ExportsFinal consumption expenditure Gross fixed capital formation
18.7 3.6 2.3 - 0.7 0.2 60.7 51.9 8.8 86.3 228.6
10.0 0.9 1.3 - 0.1 0.1 33.8 23.8 10.0 46.2 414.7
15.9 16.5 0.8 - 0.1 0.2 197.8 178.7 19.1 231.3 433.5
25.8 0.2 0.1 - - - 23.0 16.0 6.9 49.1 98.0
87.2 12.4 8.5 17.4 1.7 - 6.0 4.0 2.0 133.3 672.8
309.3 0.2 - - - - 18.5 17.7 0.7 328.0 328.0
5.2 129.6 1.2 0.2 1.2 - - - - 137.5 185.0
20.4 110.5 0.1 - 0.3 - - - - 131.5 134.6
70.9 88.8 0.1 - 0.2 - 2.9 0.4 2.6 163.0 184.2
50.9 12.2 0.2 - 1.1 - 8.1 7.0 1.1 72.6 80.2
40.1 30.9 - - - - 10.5 10.0 0.5 81.5 86.1
1,260.2 420.9 456.6 194.6 64.6 36.3 3,905.8 3,523.8 382.0 6,339.0 9,115.1
- - - - - - - - - - 1,965.5
- - - - - - - - - - 2,364.2
94.8 - 25.6 0.9 1.5 1.8 48.6 48.6 - 173.2 247.0
- - 18.9 - - - - - - 18.9 132.0
1.0 - 1.0 - 0.1 0.7 - - - 2.8 6.5
449.5 11.2 125.0 24.0 20.6 54.6 - - - 684.9 2,503.6
253.9 9.3 78.9 20.3 10.1 52.7 - - - 425.1 1,692.6
195.6 1.9 46.1 3.8 10.5 1.9 - - - 259.7 811.0
1,805.5 432.1 627.1 219.5 86.8 93.4 3,954.4 3,572.4 382.0 7,218.8 16,334.0
- - - - - - - - - - 52,226
63
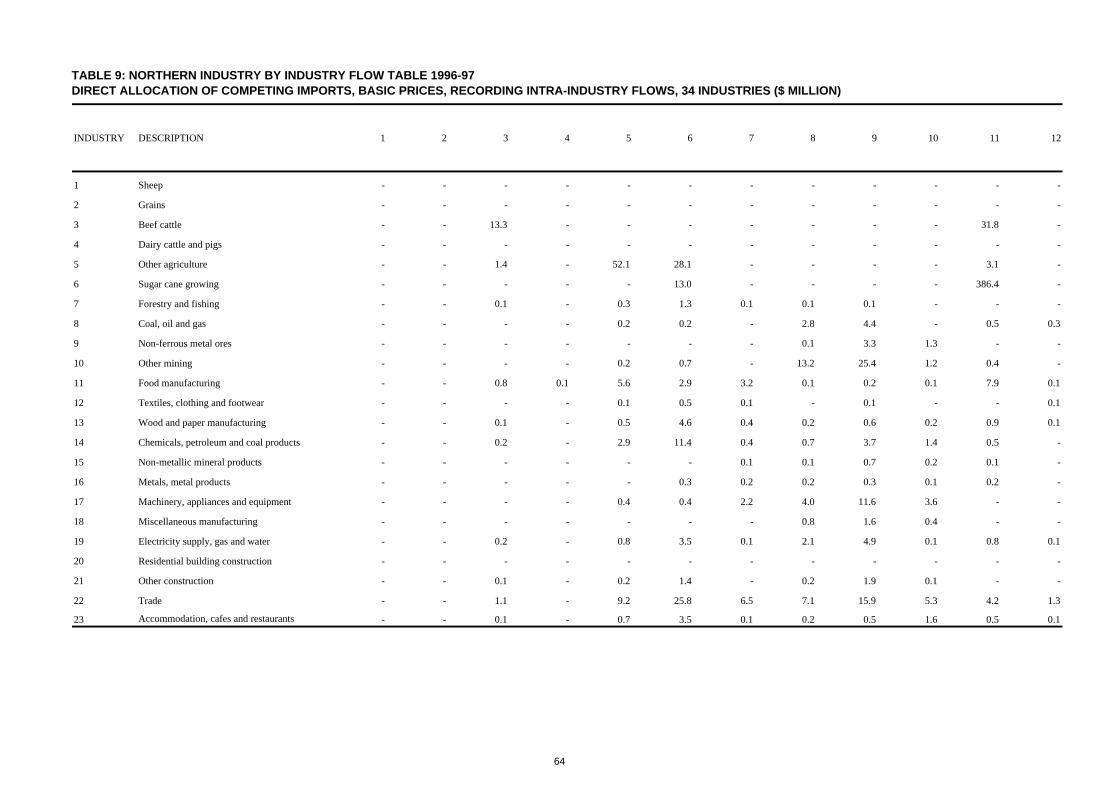
TABLE 9: NORTHERN INDUSTRY BY INDUSTRY FLOW TABLE 1996-97DIRECT ALLOCATION OF COMPETING IMPORTS, BASIC PRICES, RECORDING INTRA-INDUSTRY FLOWS, 34 INDUSTRIES ($ MILLION)
INDUSTRY DESCRIPTION 1 2 3 4 5 6 7 8 9 10 11 12
1 Sheep - - - - - - - - - - - -
2 Grains - - - - - - - - - - - -
3 Beef cattle - - 13.3 - - - - - - - 31.8 -
4 Dairy cattle and pigs - - - - - - - - - - - -
5 Other agriculture - - 1.4 - 52.1 28.1 - - - - 3.1 -
6 Sugar cane growing - - - - - 13.0 - - - - 386.4 -
7 Forestry and fishing - - 0.1 - 0.3 1.3 0.1 0.1 0.1 - - -
8 Coal, oil and gas - - - - 0.2 0.2 - 2.8 4.4 - 0.5 0.3
9 Non-ferrous metal ores - - - - - - - 0.1 3.3 1.3 - -
10 Other mining - - - - 0.2 0.7 - 13.2 25.4 1.2 0.4 -
11 Food manufacturing - - 0.8 0.1 5.6 2.9 3.2 0.1 0.2 0.1 7.9 0.1
12 Textiles, clothing and footwear - - - - 0.1 0.5 0.1 - 0.1 - - 0.1
13 Wood and paper manufacturing - - 0.1 - 0.5 4.6 0.4 0.2 0.6 0.2 0.9 0.1
14 Chemicals, petroleum and coal products - - 0.2 - 2.9 11.4 0.4 0.7 3.7 1.4 0.5 -
15 Non-metallic mineral products - - - - - - 0.1 0.1 0.7 0.2 0.1 -
16 Metals, metal products - - - - - 0.3 0.2 0.2 0.3 0.1 0.2 -
17 Machinery, appliances and equipment - - - - 0.4 0.4 2.2 4.0 11.6 3.6 - -
18 Miscellaneous manufacturing - - - - - - - 0.8 1.6 0.4 - -
19 Electricity supply, gas and water - - 0.2 - 0.8 3.5 0.1 2.1 4.9 0.1 0.8 0.1
20 Residential building construction - - - - - - - - - - - -
21 Other construction - - 0.1 - 0.2 1.4 - 0.2 1.9 0.1 - -
22 Trade - - 1.1 - 9.2 25.8 6.5 7.1 15.9 5.3 4.2 1.3
23 Accommodation, cafes and restaurants - - 0.1 - 0.7 3.5 0.1 0.2 0.5 1.6 0.5 0.1
64

TABLE 9: NORTHERN INDUSTRY BY INDUSTRY FLOW TABLE 1996-97DIRECT ALLOCATION OF COMPETING IMPORTS, BASIC PRICES, RECORDING INTRA-INDUSTRY FLOWS, 34 INDUSTRIES ($ MILLION)
INDUSTRY DESCRIPTION 1 2 3 4 5 6 7 8 9 10 11 12
24 Road transport - - 0.8 - 4.8 11.6 0.3 2.3 3.1 3.0 4.6 0.2
25 Rail and pipeline transport - - - - 0.6 0.8 - 42.8 1.1 0.1 0.7 0.1
26 Other transport - - 0.2 - 0.7 2.9 0.3 1.7 1.0 2.9 1.2 0.4
27 Communication services - - 0.2 - 0.6 3.7 0.1 0.5 4.0 0.8 0.3 0.1
28 Finance, property and business services - - 1.2 - 4.8 21.9 0.9 7.1 9.8 9.4 2.5 0.7
29 Ownership of dwellings - - - - - - - - - - - -
30 Government administration and defence - - - - 0.4 1.2 0.2 1.0 1.0 0.7 0.3 -
31 Education - - - - - 0.1 - 0.1 0.1 0.1 - -
32 Health and community services - - 0.1 - 0.2 0.1 - 6.7 - - 0.1 -
33 Cultural and recreational services - - - - - - - - 0.1 - - -
34 Personal and other services - - - - - 0.2 0.1 0.2 0.1 0.1 - -
T1 Total intermediate usage - - 20.0 0.3 85.4 139.9 15.5 94.3 95.5 32.6 447.1 3.7
P1 Compensation of employees - - 11.9 0.3 39.0 38.4 5.5 47.8 55.5 35.0 97.7 4.8
P2 Gross operating surplus and mixed income - - 21.3 0.6 62.2 133.4 13.6 96.2 130.3 7.3 67.9 1.0
P3 Taxes less subsidies on products - - 0.4 - 1.2 1.5 0.8 0.8 1.4 0.5 4.1 0.2
P4 Taxes less subsidies on production - - 1.2 - 3.7 6.0 1.3 2.0 3.7 1.7 5.7 0.1
P5 Complementary imports - - - - - - - - - - - -
P6 Imported inputs - - 18.7 0.2 52.1 80.1 21.4 37.4 77.9 22.2 149.3 6.7
P6a Foreign and interstate - - 6.8 0.1 35.6 44.8 18.8 26.4 57.7 14.5 67.7 6.2
P6b Interregional - - 12.0 - 16.5 35.3 2.6 11.0 20.2 7.8 81.7 0.4
T2 Total production - - 73.6 1.3 243.6 399.4 58.2 278.3 364.4 99.4 771.9 16.4
Employment (fte persons) - - 786 21 3,223 2,564 310 538 910 549 2,010 151
65

TABLE 9: NORTHERN INDUSTRY BY INDUSTRY FLOW TABLE 1996-97DIRECT ALLOCATION OF COMPETING IMPORTS, BASIC PRICES, RECORDING INTRA-INDUSTRY FLOWS, 34 INDUSTRIES ($ MILLION)
INDUSTRY DESCRIPTION
1 Sheep
2 Grains
3 Beef cattle
4 Dairy cattle and pigs
5 Other agriculture
6 Sugar cane growing
7 Forestry and fishing
8 Coal, oil and gas
9 Non-ferrous metal ores
10 Other mining
11 Food manufacturing
12 Textiles, clothing and footwear
13 Wood and paper manufacturing
14 Chemicals, petroleum and coal products
15 Non-metallic mineral products
16 Metals, metal products
17 Machinery, appliances and equipment
18 Miscellaneous manufacturing
19 Electricity supply, gas and water
20 Residential building construction
21 Other construction
22 Trade
23 Accommodation, cafes and restaurants
13 14 15 16 17 18 19 20 21 22 23 24
- - - - - - - - - - - -
- - - - - - - - - - - -
- - - - - - - - - - - -
- - - - - - - - - - - -
- 0.5 - - - - - 0.3 1.4 1.7 3.1 -
- - - - - - - - - - - -
0.6 - - - - - - - 0.1 1.3 3.6 -
0.4 3.2 2.7 0.6 - - - 0.1 0.1 6.1 3.5 0.4
- 2.8 0.2 39.5 0.3 1.0 - - - - - 0.1
- 0.1 4.1 - - 0.1 0.4 1.4 5.2 0.3 0.3 -
- 0.6 - - - - 0.1 0.1 0.2 16.8 19.2 0.1
- - - - - - - 0.1 0.1 0.4 0.4 -
5.2 0.9 0.3 - 0.6 2.8 0.3 11.1 3.6 10.4 1.4 0.5
0.5 3.6 0.2 - 0.5 0.2 0.9 0.9 1.3 1.9 0.7 1.2
0.2 0.1 4.7 - 0.2 - 1.1 13.7 17.9 0.8 0.1 -
0.2 - 0.2 6.3 0.3 0.1 0.2 2.5 3.6 0.2 0.1 0.1
- - - - 9.5 - 0.1 0.6 2.1 2.3 0.2 0.2
- - - - 0.1 0.1 - 0.1 0.4 0.4 0.3 0.1
0.6 0.8 0.9 12.4 0.9 0.1 18.9 0.2 0.9 5.9 4.3 0.5
- - - - - - - - 0.1 0.1 - -
- - - - - - 0.1 0.1 0.2 0.8 1.4 0.1
5.8 5.8 1.5 0.1 9.0 2.6 5.9 14.4 25.5 61.8 21.2 21.2
0.7 0.6 0.2 - 0.3 0.1 0.4 0.8 1.1 8.0 0.5 1.3
66

TABLE 9: NORTHERN INDUSTRY BY INDUSTRY FLOW TABLE 1996-97DIRECT ALLOCATION OF COMPETING IMPORTS, BASIC PRICES, RECORDING INTRA-INDUSTRY FLOWS, 34 INDUSTRIES ($ MILLION)
INDUSTRY DESCRIPTION
24 Road transport
25 Rail and pipeline transport
26 Other transport
27 Communication services
28 Finance, property and business services
29 Ownership of dwellings
30 Government administration and defence
31 Education
32 Health and community services
33 Cultural and recreational services
34 Personal and other services
T1 Total intermediate usage
P1 Compensation of employees
P2 Gross operating surplus and mixed income
P3 Taxes less subsidies on products
P4 Taxes less subsidies on production
P5 Complementary imports
P6 Imported inputs
P6a Foreign and interstate
P6b Interregional
T2 Total production
Employment (fte persons)
13 14 15 16 17 18 19 20 21 22 23 24
2.0 1.4 6.6 - 0.7 0.6 0.5 4.3 7.2 20.2 1.6 28.3
0.2 1.8 2.8 - 0.5 - 1.2 0.5 1.7 3.6 1.1 0.1
2.3 1.6 0.5 - 0.8 0.1 0.6 0.2 3.1 38.6 1.7 3.1
0.6 0.4 0.3 - 0.7 0.1 0.9 0.4 0.9 25.2 3.5 4.5
4.7 5.3 1.4 0.1 2.8 0.6 7.5 14.6 41.6 162.1 24.7 15.0
- - - - - - - - - - - -
0.7 0.2 0.1 - 0.2 - 0.4 0.5 0.9 3.8 0.2 6.6
- - - - 0.1 - 0.1 0.1 0.1 0.4 0.1 0.1
0.1 0.2 - - - - - - 0.1 0.3 0.1 -
0.1 - - - - - - - - 2.7 1.5 0.1
0.1 0.1 - - 0.1 - 0.1 - 0.1 0.8 0.4 0.1
25.3 30.3 26.8 59.2 27.8 8.9 39.8 67.0 119.5 376.9 95.3 83.6
26.4 30.8 9.1 57.0 27.9 9.0 21.4 33.4 121.7 400.4 82.3 40.8
12.3 17.6 8.8 61.2 9.9 3.4 76.5 53.8 113.3 140.4 41.8 58.2
0.8 0.9 0.4 3.3 0.9 0.1 2.0 1.7 5.2 19.7 13.8 7.2
1.4 1.3 0.8 12.2 2.0 0.2 - 1.5 4.4 26.1 3.2 4.7
- 3.4 - - - - - - - - - -
28.7 53.8 11.3 465.6 65.4 10.6 21.2 64.5 147.7 256.7 66.2 52.8
25.0 45.9 6.3 16.6 56.4 9.6 16.9 49.1 120.6 194.7 51.1 43.5
3.7 8.0 5.1 449.0 8.9 0.9 4.3 15.4 27.1 62.0 15.1 9.3
94.9 138.1 57.2 658.5 133.8 32.1 161.0 221.8 511.8 1,220.1 302.5 247.3
685 397 207 1,009 734 312 606 1,505 4,583 15,050 3,786 1,978
67

TABLE 9: NORTHERN INDUSTRY BY INDUSTRY FLOW TABLE 1996-97DIRECT ALLOCATION OF COMPETING IMPORTS, BASIC PRICES, RECORDING INTRA-INDUSTRY FLOWS, 34 INDUSTRIES ($ MILLION)
INDUSTRY DESCRIPTION
1 Sheep
2 Grains
3 Beef cattle
4 Dairy cattle and pigs
5 Other agriculture
6 Sugar cane growing
7 Forestry and fishing
8 Coal, oil and gas
9 Non-ferrous metal ores
10 Other mining
11 Food manufacturing
12 Textiles, clothing and footwear
13 Wood and paper manufacturing
14 Chemicals, petroleum and coal products
15 Non-metallic mineral products
16 Metals, metal products
17 Machinery, appliances and equipment
18 Miscellaneous manufacturing
19 Electricity supply, gas and water
20 Residential building construction
21 Other construction
22 Trade
23 Accommodation, cafes and restaurants
25 26 27 28 29 30 31 32 33 34T4 Total
intermediate usage
- - - - - - - - - - -
- - - - - - - - - - -
- - - - - - - - - - 45.1
- - - - - - - - - - -
- 0.1 - 1.4 - 0.7 - 0.1 3.4 0.4 98.0
- - - - - - - - - - 399.4
0.2 - - 0.1 - - - - - - 8.1
0.2 - 0.9 1.5 0.1 5.4 0.5 3.4 0.2 0.5 38.2
- - - - - - - - - - 48.7
0.1 0.1 - 0.7 0.3 0.6 - 0.3 0.7 0.1 56.1
0.2 0.1 0.2 1.9 0.1 1.9 0.4 0.8 2.0 0.5 66.4
0.2 0.1 - 0.2 - 0.6 0.1 0.7 0.1 0.3 4.3
0.7 0.8 0.8 4.2 2.3 4.7 1.7 0.6 0.7 0.6 61.6
0.3 2.2 0.4 1.0 0.8 1.8 0.1 1.4 0.2 0.3 41.8
- - - 0.2 1.8 0.8 - 0.2 - 0.2 43.1
0.5 0.1 0.2 0.1 0.5 0.3 0.2 0.1 0.1 0.1 17.2
7.8 2.3 0.1 0.8 - 7.2 0.1 0.2 0.1 0.1 56.1
0.1 - 0.1 0.4 0.2 1.8 0.2 0.1 - 0.1 7.2
2.3 1.4 0.6 10.1 1.6 4.3 2.7 2.8 0.9 0.8 86.1
- - - 0.4 15.6 0.4 - 0.1 - - 16.9
1.3 0.3 - 1.0 - 10.5 - 0.1 - - 19.9
6.0 9.9 12.0 25.7 7.9 15.8 5.9 23.0 5.2 4.7 367.4
0.2 1.5 1.2 15.2 - 5.5 0.8 1.4 1.2 0.7 49.3
68
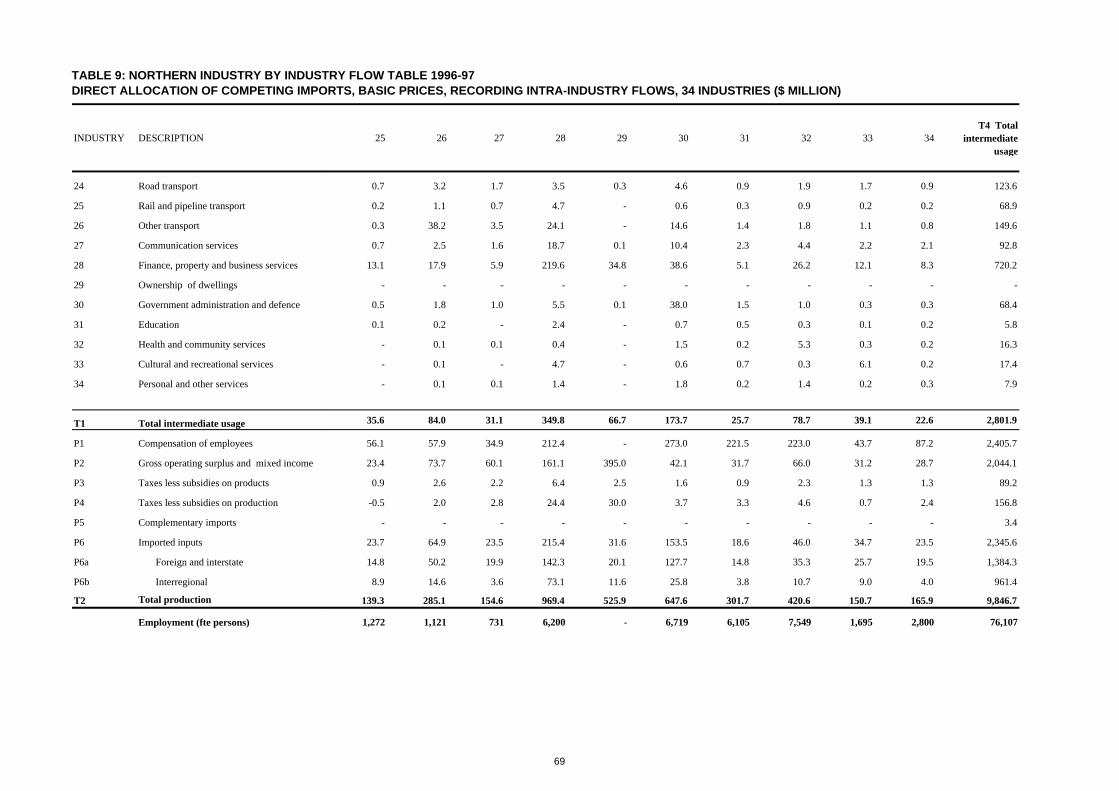
TABLE 9: NORTHERN INDUSTRY BY INDUSTRY FLOW TABLE 1996-97DIRECT ALLOCATION OF COMPETING IMPORTS, BASIC PRICES, RECORDING INTRA-INDUSTRY FLOWS, 34 INDUSTRIES ($ MILLION)
INDUSTRY DESCRIPTION
24 Road transport
25 Rail and pipeline transport
26 Other transport
27 Communication services
28 Finance, property and business services
29 Ownership of dwellings
30 Government administration and defence
31 Education
32 Health and community services
33 Cultural and recreational services
34 Personal and other services
T1 Total intermediate usage
P1 Compensation of employees
P2 Gross operating surplus and mixed income
P3 Taxes less subsidies on products
P4 Taxes less subsidies on production
P5 Complementary imports
P6 Imported inputs
P6a Foreign and interstate
P6b Interregional
T2 Total production
Employment (fte persons)
25 26 27 28 29 30 31 32 33 34T4 Total
intermediate usage
0.7 3.2 1.7 3.5 0.3 4.6 0.9 1.9 1.7 0.9 123.6
0.2 1.1 0.7 4.7 - 0.6 0.3 0.9 0.2 0.2 68.9
0.3 38.2 3.5 24.1 - 14.6 1.4 1.8 1.1 0.8 149.6
0.7 2.5 1.6 18.7 0.1 10.4 2.3 4.4 2.2 2.1 92.8
13.1 17.9 5.9 219.6 34.8 38.6 5.1 26.2 12.1 8.3 720.2
- - - - - - - - - - -
0.5 1.8 1.0 5.5 0.1 38.0 1.5 1.0 0.3 0.3 68.4
0.1 0.2 - 2.4 - 0.7 0.5 0.3 0.1 0.2 5.8
- 0.1 0.1 0.4 - 1.5 0.2 5.3 0.3 0.2 16.3
- 0.1 - 4.7 - 0.6 0.7 0.3 6.1 0.2 17.4
- 0.1 0.1 1.4 - 1.8 0.2 1.4 0.2 0.3 7.9
35.6 84.0 31.1 349.8 66.7 173.7 25.7 78.7 39.1 22.6 2,801.9
56.1 57.9 34.9 212.4 - 273.0 221.5 223.0 43.7 87.2 2,405.7
23.4 73.7 60.1 161.1 395.0 42.1 31.7 66.0 31.2 28.7 2,044.1
0.9 2.6 2.2 6.4 2.5 1.6 0.9 2.3 1.3 1.3 89.2
-0.5 2.0 2.8 24.4 30.0 3.7 3.3 4.6 0.7 2.4 156.8
- - - - - - - - - - 3.4
23.7 64.9 23.5 215.4 31.6 153.5 18.6 46.0 34.7 23.5 2,345.6
14.8 50.2 19.9 142.3 20.1 127.7 14.8 35.3 25.7 19.5 1,384.3
8.9 14.6 3.6 73.1 11.6 25.8 3.8 10.7 9.0 4.0 961.4
139.3 285.1 154.6 969.4 525.9 647.6 301.7 420.6 150.7 165.9 9,846.7
1,272 1,121 731 6,200 - 6,719 6,105 7,549 1,695 2,800 76,107
69
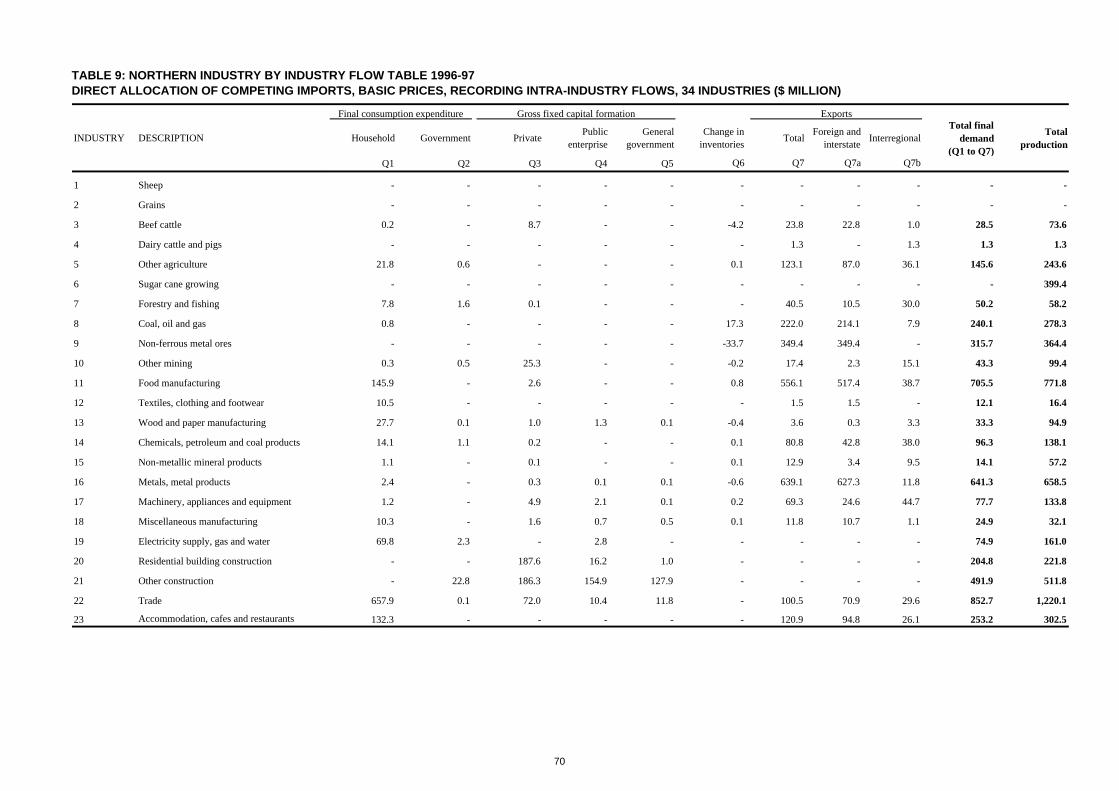
TABLE 9: NORTHERN INDUSTRY BY INDUSTRY FLOW TABLE 1996-97DIRECT ALLOCATION OF COMPETING IMPORTS, BASIC PRICES, RECORDING INTRA-INDUSTRY FLOWS, 34 INDUSTRIES ($ MILLION)
INDUSTRY DESCRIPTION
1 Sheep
2 Grains
3 Beef cattle
4 Dairy cattle and pigs
5 Other agriculture
6 Sugar cane growing
7 Forestry and fishing
8 Coal, oil and gas
9 Non-ferrous metal ores
10 Other mining
11 Food manufacturing
12 Textiles, clothing and footwear
13 Wood and paper manufacturing
14 Chemicals, petroleum and coal products
15 Non-metallic mineral products
16 Metals, metal products
17 Machinery, appliances and equipment
18 Miscellaneous manufacturing
19 Electricity supply, gas and water
20 Residential building construction
21 Other construction
22 Trade
23 Accommodation, cafes and restaurants
Household Government Private Public enterprise
General government
Change in inventories Total Foreign and
interstate InterregionalTotal final
demand (Q1 to Q7)
Total production
Q1 Q2 Q3 Q4 Q5 Q6 Q7 Q7a Q7b
- - - - - - - - - - -
- - - - - - - - - - -
0.2 - 8.7 - - -4.2 23.8 22.8 1.0 28.5 73.6
- - - - - - 1.3 - 1.3 1.3 1.3
21.8 0.6 - - - 0.1 123.1 87.0 36.1 145.6 243.6
- - - - - - - - - - 399.4
7.8 1.6 0.1 - - - 40.5 10.5 30.0 50.2 58.2
0.8 - - - - 17.3 222.0 214.1 7.9 240.1 278.3
- - - - - -33.7 349.4 349.4 - 315.7 364.4
0.3 0.5 25.3 - - -0.2 17.4 2.3 15.1 43.3 99.4
145.9 - 2.6 - - 0.8 556.1 517.4 38.7 705.5 771.8
10.5 - - - - - 1.5 1.5 - 12.1 16.4
27.7 0.1 1.0 1.3 0.1 -0.4 3.6 0.3 3.3 33.3 94.9
14.1 1.1 0.2 - - 0.1 80.8 42.8 38.0 96.3 138.1
1.1 - 0.1 - - 0.1 12.9 3.4 9.5 14.1 57.2
2.4 - 0.3 0.1 0.1 -0.6 639.1 627.3 11.8 641.3 658.5
1.2 - 4.9 2.1 0.1 0.2 69.3 24.6 44.7 77.7 133.8
10.3 - 1.6 0.7 0.5 0.1 11.8 10.7 1.1 24.9 32.1
69.8 2.3 - 2.8 - - - - - 74.9 161.0
- - 187.6 16.2 1.0 - - - - 204.8 221.8
- 22.8 186.3 154.9 127.9 - - - - 491.9 511.8
657.9 0.1 72.0 10.4 11.8 - 100.5 70.9 29.6 852.7 1,220.1
132.3 - - - - - 120.9 94.8 26.1 253.2 302.5
ExportsFinal consumption expenditure Gross fixed capital formation
70

TABLE 9: NORTHERN INDUSTRY BY INDUSTRY FLOW TABLE 1996-97DIRECT ALLOCATION OF COMPETING IMPORTS, BASIC PRICES, RECORDING INTRA-INDUSTRY FLOWS, 34 INDUSTRIES ($ MILLION)
INDUSTRY DESCRIPTION
24 Road transport
25 Rail and pipeline transport
26 Other transport
27 Communication services
28 Finance, property and business services
29 Ownership of dwellings
30 Government administration and defence
31 Education
32 Health and community services
33 Cultural and recreational services
34 Personal and other services
T1 Total intermediate usage
P1 Compensation of employees
P2 Gross operating surplus and mixed income
P3 Taxes less subsidies on products
P4 Taxes less subsidies on production
P5 Complementary imports
P6 Imported inputs
P6a Foreign and interstate
P6b Interregional
T2 Total production
Employment (fte persons)
Household Government Private Public enterprise
General government
Change in inventories Total Foreign and
interstate InterregionalTotal final
demand (Q1 to Q7)
Total production
Q1 Q2 Q3 Q4 Q5 Q6 Q7 Q7a Q7b
ExportsFinal consumption expenditure Gross fixed capital formation
35.8 7.0 2.4 0.1 0.1 0.2 78.1 67.7 10.4 123.6 247.3
16.5 1.7 0.4 - - - 51.7 34.3 17.4 70.3 139.3
27.2 35.0 0.9 - - - 72.4 66.5 5.9 135.5 285.1
43.0 0.4 0.3 - - - 18.1 8.7 9.4 61.9 154.6
167.3 28.2 13.2 9.0 3.0 - 28.5 8.5 20.0 249.2 969.4
515.5 0.5 - - - - 9.9 8.8 1.1 525.9 525.9
9.8 566.0 2.9 0.4 0.2 - - - - 579.3 647.7
46.7 204.2 0.5 0.1 0.1 - 44.2 29.0 15.2 295.9 301.7
134.7 227.5 0.2 - - - 41.8 3.8 37.9 404.3 420.6
91.2 20.2 0.8 - 0.3 - 20.8 19.8 1.0 133.4 150.7
73.7 77.8 - - - - 6.4 4.8 1.6 157.9 165.9
2,265.6 1,197.6 512.4 198.2 145.2 -20.1 2,745.9 2,331.7 414.1 7,044.8 9,846.6
- - - - - - - - - - 2,405.7
- - - - - - - - - - 2,044.1
187.4 - 21.3 1.5 0.7 0.5 35.7 35.7 - 247.1 336.3
- - 15.6 - - - - - - 15.6 172.5
1.9 - 1.1 - - -0.3 - - - 2.7 6.2
804.1 20.0 157.2 25.9 24.5 -15.2 285.2 285.2 - 1,301.9 3,647.5
600.9 16.3 129.2 21.6 23.2 -7.5 285.2 285.2 - 1,069.0 2,453.2
203.2 3.8 28.0 4.3 1.2 -7.7 - - - 232.9 1,194.2
3,258.9 1,217.6 707.7 225.6 170.4 -35.0 3,066.8 2,652.7 414.1 8,612.0 18,458.7
- - - - - - - - - - 76,107
71

TABLE 10: FAR NORTH INDUSTRY BY INDUSTRY FLOW TABLE 1996-97DIRECT ALLOCATION OF COMPETING IMPORTS, BASIC PRICES, RECORDING INTRA-INDUSTRY FLOWS, 34 INDUSTRIES ($ MILLION)
INDUSTRY DESCRIPTION 1 2 3 4 5 6 7 8 9 10 11 12
1 Sheep - - - - - - - - - - - -
2 Grains - - - 0.1 0.1 - - - - - 4.3 -
3 Beef cattle - - 8.5 - - - - - - - 3.5 -
4 Dairy cattle and pigs - - - 0.9 - - - - - - 46.6 -
5 Other agriculture - - 2.9 2.8 45.2 15.2 - - - - 9.9 -
6 Sugar cane growing - - - - - 7.2 - - - - 223.3 -
7 Forestry and fishing - - 0.2 0.1 0.4 0.7 0.1 - 0.2 - 0.2 -
8 Coal, oil and gas - - - - - - - - - - - -
9 Non-ferrous metal ores - - - - - - - - 3.7 1.5 - -
10 Other mining - - - - 0.3 0.4 - - 33.3 2.0 2.7 -
11 Food manufacturing - - 1.6 8.5 5.9 1.7 5.0 - 0.2 0.1 22.9 -
12 Textiles, clothing and footwear - - - - - 0.1 - - 0.1 - - -
13 Wood and paper manufacturing - - 0.2 0.1 0.3 1.3 0.3 - 0.8 - 1.3 -
14 Chemicals, petroleum and coal products - - - - - - - - - - - -
15 Non-metallic mineral products - - - - - - 0.1 - 0.8 0.1 0.3 -
16 Metals, metal products - - - 0.1 0.3 0.6 1.2 - - 0.2 2.5 -
17 Machinery, appliances and equipment - - - 0.1 0.3 0.1 2.2 - 9.2 - 0.1 -
18 Miscellaneous manufacturing - - - - - - 0.1 - 3.2 1.1 - -
19 Electricity supply, gas and water - - 0.4 0.9 1.3 2.3 0.2 - 7.8 0.1 3.9 -
20 Residential building construction - - - - - - - - - - - -
21 Other construction - - 0.2 0.3 0.3 0.8 - - 2.3 0.2 - -
22 Trade - - 2.1 3.2 11.5 13.6 10.5 - 18.9 6.9 18.2 0.6
23 Accommodation, cafes and restaurants - - 0.2 0.4 1.0 2.0 0.2 - 0.6 1.4 2.8 0.1
72

TABLE 10: FAR NORTH INDUSTRY BY INDUSTRY FLOW TABLE 1996-97DIRECT ALLOCATION OF COMPETING IMPORTS, BASIC PRICES, RECORDING INTRA-INDUSTRY FLOWS, 34 INDUSTRIES ($ MILLION)
INDUSTRY DESCRIPTION 1 2 3 4 5 6 7 8 9 10 11 12
24 Road transport - - 1.6 1.4 6.0 5.9 0.5 - 3.8 5.1 16.3 0.1
25 Rail and pipeline transport - - 0.1 0.2 0.7 0.4 0.1 - 1.3 0.2 4.1 -
26 Other transport - - 0.4 0.3 1.0 1.4 0.7 - 1.2 2.4 5.5 0.2
27 Communication services - - 0.5 0.4 0.9 1.9 0.3 - 5.6 1.0 1.2 -
28 Finance, property and business services - - 2.8 1.4 7.1 12.7 1.8 - 16.3 10.3 11.1 0.4
29 Ownership of dwellings - - - - - - - - - - - -
30 Government administration and defence - - - - 0.5 0.7 0.4 - 1.2 1.3 1.5 -
31 Education - - - - - 0.1 - - 0.1 0.1 0.2 -
32 Health and community services - - 0.3 0.4 0.2 0.1 - - 0.1 - 0.2 -
33 Cultural and recreational services - - - - - - - - 0.2 0.1 0.3 -
34 Personal and other services - - - - - 0.1 0.1 - 0.1 0.1 0.1 -
T1 Total intermediate usage - - 22.3 21.5 83.3 69.3 23.9 - 110.8 34.3 383.0 1.6
P1 Compensation of employees - 2.2 5.2 2.7 61.7 26.1 12.3 - 74.7 23.6 91.6 2.3
P2 Gross operating surplus and mixed income - 5.3 20.2 15.7 86.2 77.1 23.6 - 193.7 27.1 49.4 0.4
P3 Taxes less subsidies on products - 0.1 0.4 0.3 1.6 0.9 1.5 - 1.8 0.7 2.1 0.4
P4 Taxes less subsidies on production - 0.2 1.0 1.3 4.7 3.5 2.3 - 4.7 2.2 3.5 0.2
P5 Complementary imports - - - - - - - - - - - -
P6 Imported inputs - 5.0 13.8 13.6 69.3 53.7 37.5 - 114.5 37.8 65.9 5.3
P6a Foreign and interstate - 1.0 10.2 8.4 47.5 32.0 31.4 - 79.5 33.9 29.2 4.9
P6b Interregional - 4.0 3.6 5.3 21.7 21.8 6.1 - 35.0 4.0 36.7 0.4
T2 Total production - 12.9 62.8 55.1 306.8 230.5 101.1 - 500.1 125.7 595.6 10.2
Employment (fte persons) - 223 544 492 4,603 1,813 695 - 1,540 380 2,113 89
73

TABLE 10: FAR NORTH INDUSTRY BY INDUSTRY FLOW TABLE 1996-97DIRECT ALLOCATION OF COMPETING IMPORTS, BASIC PRICES, RECORDING INTRA-INDUSTRY FLOWS, 34 INDUSTRIES ($ MILLION)
INDUSTRY DESCRIPTION
1 Sheep
2 Grains
3 Beef cattle
4 Dairy cattle and pigs
5 Other agriculture
6 Sugar cane growing
7 Forestry and fishing
8 Coal, oil and gas
9 Non-ferrous metal ores
10 Other mining
11 Food manufacturing
12 Textiles, clothing and footwear
13 Wood and paper manufacturing
14 Chemicals, petroleum and coal products
15 Non-metallic mineral products
16 Metals, metal products
17 Machinery, appliances and equipment
18 Miscellaneous manufacturing
19 Electricity supply, gas and water
20 Residential building construction
21 Other construction
22 Trade
23 Accommodation, cafes and restaurants
13 14 15 16 17 18 19 20 21 22 23 24
- - - - - - - - - - - -
- 0.1 - - - - - - - - - -
- - - - - - - - - - - -
- - - - - - - - - - - -
- - - - - - - 0.6 1.7 2.0 6.8 -
- - - - - - - - - - - -
1.7 - - - - - - - 0.1 1.5 7.4 -
- - - - - - - - - - - -
- 0.3 0.2 26.8 26.6 2.6 - - - - - 0.2
- - 4.6 - - 0.1 0.5 2.7 6.2 0.4 0.7 -
- 0.1 - - - - 0.1 0.1 0.1 14.7 30.7 0.1
- - - - - - - - - - 0.4 -
4.7 - 0.1 - 0.8 2.5 0.1 3.2 2.8 5.6 2.4 0.4
- - - - - - - - - - - -
0.2 - 5.6 - 0.1 0.1 1.1 22.2 20.4 0.8 0.1 -
0.5 - 0.9 11.5 3.8 1.4 0.8 11.9 12.5 2.0 0.4 0.4
- - - - 2.7 - 0.2 0.7 2.6 1.5 0.3 0.3
- - - - 0.1 0.2 - 0.3 0.8 0.6 1.1 0.2
0.9 0.1 1.1 0.7 0.9 0.2 21.5 0.4 1.1 7.6 11.8 0.7
- - - - - - - 0.1 0.1 0.1 0.1 -
- - - - 0.1 - 0.1 0.2 0.2 0.7 2.9 0.1
5.9 0.4 1.4 0.3 6.2 2.9 5.7 24.1 26.6 62.6 40.7 29.3
0.8 - 0.2 - 0.3 0.2 0.4 1.4 1.3 7.6 1.0 1.8
74

TABLE 10: FAR NORTH INDUSTRY BY INDUSTRY FLOW TABLE 1996-97DIRECT ALLOCATION OF COMPETING IMPORTS, BASIC PRICES, RECORDING INTRA-INDUSTRY FLOWS, 34 INDUSTRIES ($ MILLION)
INDUSTRY DESCRIPTION
24 Road transport
25 Rail and pipeline transport
26 Other transport
27 Communication services
28 Finance, property and business services
29 Ownership of dwellings
30 Government administration and defence
31 Education
32 Health and community services
33 Cultural and recreational services
34 Personal and other services
T1 Total intermediate usage
P1 Compensation of employees
P2 Gross operating surplus and mixed income
P3 Taxes less subsidies on products
P4 Taxes less subsidies on production
P5 Complementary imports
P6 Imported inputs
P6a Foreign and interstate
P6b Interregional
T2 Total production
Employment (fte persons)
13 14 15 16 17 18 19 20 21 22 23 24
3.2 0.1 7.3 0.1 0.7 0.8 0.6 7.4 7.7 16.1 3.1 34.4
0.3 0.1 2.9 0.1 0.4 0.1 1.2 0.9 1.9 3.4 2.1 0.1
2.4 0.1 0.5 0.1 0.9 0.2 0.6 0.4 3.4 31.8 3.3 4.2
0.8 - 0.3 - 0.7 0.2 0.9 0.7 1.1 21.9 7.0 6.3
6.7 0.3 2.0 0.4 3.2 1.0 8.8 32.7 53.4 197.3 62.2 26.8
- - - - - - - - - - - -
0.9 - 0.1 - 0.2 - 0.4 0.9 1.1 4.0 0.5 9.3
- - - - - - 0.1 0.1 0.1 0.4 0.3 0.1
0.2 - - - - - - - 0.1 0.4 0.1 0.1
0.2 - - - - - - - - 3.5 3.9 0.1
0.1 - - - 0.1 - 0.1 - 0.1 0.8 0.7 0.1
29.5 1.8 27.4 40.3 48.0 12.7 43.3 111.0 145.5 387.2 189.9 115.3
30.7 2.8 9.9 23.9 27.8 14.2 42.5 63.9 134.8 446.0 170.5 60.9
11.4 1.0 9.8 9.4 9.7 4.2 76.2 98.3 110.6 117.5 86.2 88.5
0.9 0.3 0.5 0.6 0.8 0.2 2.1 3.2 6.0 18.2 28.3 10.4
1.5 0.5 0.9 1.9 1.7 0.4 - 2.7 5.2 16.6 6.5 6.8
- 2.7 - - - - - - - - - -
23.7 4.6 14.6 20.4 43.0 12.6 23.6 131.9 156.0 264.3 143.3 79.0
19.3 4.2 8.9 20.2 37.6 10.7 18.0 99.5 116.4 201.6 109.8 64.1
4.4 0.4 5.7 0.2 5.4 1.9 5.6 32.4 39.6 62.7 33.6 14.9
97.8 13.6 63.1 96.6 131.1 44.4 187.7 411.0 558.0 1,249.9 624.8 360.9
884 73 211 667 741 413 1,305 2,929 5,605 16,027 7,752 2,841
75

TABLE 10: FAR NORTH INDUSTRY BY INDUSTRY FLOW TABLE 1996-97DIRECT ALLOCATION OF COMPETING IMPORTS, BASIC PRICES, RECORDING INTRA-INDUSTRY FLOWS, 34 INDUSTRIES ($ MILLION)
INDUSTRY DESCRIPTION
1 Sheep
2 Grains
3 Beef cattle
4 Dairy cattle and pigs
5 Other agriculture
6 Sugar cane growing
7 Forestry and fishing
8 Coal, oil and gas
9 Non-ferrous metal ores
10 Other mining
11 Food manufacturing
12 Textiles, clothing and footwear
13 Wood and paper manufacturing
14 Chemicals, petroleum and coal products
15 Non-metallic mineral products
16 Metals, metal products
17 Machinery, appliances and equipment
18 Miscellaneous manufacturing
19 Electricity supply, gas and water
20 Residential building construction
21 Other construction
22 Trade
23 Accommodation, cafes and restaurants
25 26 27 28 29 30 31 32 33 34T4 Total
intermediate usage
- - - - - - - - - - -
- - - - - - - - - - 4.6
- - - - - - - - - - 12.0
- - - - - - - - - - 47.5
- 0.1 - 2.4 - 0.4 - 0.2 5.3 0.4 96.2
- - - - - - - - - - 230.5
0.2 - - 0.1 - - - 0.1 - - 12.9
- - - - - - - - - - -
- 0.2 - - - - - - - - 62.3
0.1 0.1 - 1.2 0.4 0.3 - 0.5 0.9 0.1 57.8
0.1 0.3 0.2 2.2 0.1 0.5 0.3 1.1 2.7 0.5 99.7
- - - 0.2 - - - 0.1 - - 1.4
0.4 1.0 0.9 5.4 1.1 2.6 1.5 0.7 0.8 0.6 42.0
- 0.1 - - - - - - - - 0.3
- - - 0.3 1.9 0.5 - 0.3 - 0.2 55.2
4.0 1.1 0.8 0.5 4.0 0.5 0.7 0.4 0.3 0.1 63.2
4.2 7.6 0.2 0.8 0.1 3.7 0.1 0.2 0.1 0.1 37.5
0.1 0.1 0.1 1.2 0.3 1.0 0.4 0.1 0.1 0.1 11.2
2.4 2.7 0.7 24.4 2.1 2.6 2.9 4.5 1.3 0.8 108.2
- - - 0.6 18.4 0.1 - 0.2 - - 19.8
1.2 0.6 - 1.8 0.1 2.4 - 0.1 - - 14.7
5.3 24.2 12.1 35.2 8.6 5.6 5.2 22.2 6.3 4.3 420.6
0.2 3.8 1.3 19.3 - 3.4 0.7 2.0 1.5 0.7 56.6
76

TABLE 10: FAR NORTH INDUSTRY BY INDUSTRY FLOW TABLE 1996-97DIRECT ALLOCATION OF COMPETING IMPORTS, BASIC PRICES, RECORDING INTRA-INDUSTRY FLOWS, 34 INDUSTRIES ($ MILLION)
INDUSTRY DESCRIPTION
24 Road transport
25 Rail and pipeline transport
26 Other transport
27 Communication services
28 Finance, property and business services
29 Ownership of dwellings
30 Government administration and defence
31 Education
32 Health and community services
33 Cultural and recreational services
34 Personal and other services
T1 Total intermediate usage
P1 Compensation of employees
P2 Gross operating surplus and mixed income
P3 Taxes less subsidies on products
P4 Taxes less subsidies on production
P5 Complementary imports
P6 Imported inputs
P6a Foreign and interstate
P6b Interregional
T2 Total production
Employment (fte persons)
25 26 27 28 29 30 31 32 33 34T4 Total
intermediate usage
0.6 7.4 1.8 5.3 0.3 1.8 0.8 2.5 2.1 0.8 145.8
0.2 2.8 0.7 6.7 - 0.3 0.3 1.2 0.2 0.1 33.2
0.3 86.8 3.7 31.7 - 7.2 1.3 2.4 1.4 0.7 196.5
0.6 5.5 1.8 22.0 0.1 7.3 2.2 5.8 2.9 2.1 102.1
15.7 58.4 8.1 416.9 46.0 31.8 5.6 32.3 19.3 10.2 1,103.0
- - - - - - - - - - -
0.5 2.2 1.1 8.3 0.1 24.7 1.4 1.3 0.3 0.3 63.1
0.1 0.5 - 3.0 - 0.4 0.4 0.4 0.1 0.2 6.8
- 0.2 0.2 0.6 - 0.5 0.2 5.8 0.4 0.2 10.3
- 0.3 - 8.8 - 0.4 0.9 0.7 9.7 0.2 29.5
- 0.1 0.1 2.2 - 0.5 0.2 1.4 0.2 0.3 7.6
36.3 206.0 33.9 601.0 83.4 98.7 25.1 86.5 56.2 23.1 3,152.2
31.8 180.2 50.2 284.7 - 228.8 219.1 219.4 40.0 87.7 2,672.2
25.8 116.3 58.7 209.0 445.0 29.1 30.2 64.2 36.4 27.8 2,164.2
0.9 5.8 2.4 8.9 2.9 1.9 0.8 2.8 1.8 1.2 110.8
-0.4 2.2 3.1 21.8 34.7 -1.2 3.1 4.9 1.4 2.2 139.8
- - - - - - - - - - 2.7
31.0 209.2 26.2 275.0 38.5 56.2 17.8 47.1 37.6 23.5 2,095.8
20.5 154.0 21.4 168.6 24.3 42.1 14.4 32.5 29.9 19.5 1,515.4
10.4 55.3 4.8 106.4 14.2 14.1 3.5 14.6 7.7 4.0 580.4
125.2 719.8 174.5 1,400.4 604.6 413.6 296.1 425.0 173.4 165.5 10,337.8
777 4,097 1,145 8,437 - 4,885 5,763 8,164 1,637 2,668 89,512
77

TABLE 10: FAR NORTH INDUSTRY BY INDUSTRY FLOW TABLE 1996-97DIRECT ALLOCATION OF COMPETING IMPORTS, BASIC PRICES, RECORDING INTRA-INDUSTRY FLOWS, 34 INDUSTRIES ($ MILLION)
INDUSTRY DESCRIPTION
1 Sheep
2 Grains
3 Beef cattle
4 Dairy cattle and pigs
5 Other agriculture
6 Sugar cane growing
7 Forestry and fishing
8 Coal, oil and gas
9 Non-ferrous metal ores
10 Other mining
11 Food manufacturing
12 Textiles, clothing and footwear
13 Wood and paper manufacturing
14 Chemicals, petroleum and coal products
15 Non-metallic mineral products
16 Metals, metal products
17 Machinery, appliances and equipment
18 Miscellaneous manufacturing
19 Electricity supply, gas and water
20 Residential building construction
21 Other construction
22 Trade
23 Accommodation, cafes and restaurants
Household Government Private Public enterprise
General government
Change in inventories Total Foreign and
interstate InterregionalTotal final
demand (Q1 to Q7)
Total production
Q1 Q2 Q3 Q4 Q5 Q6 Q7 Q7a Q7b
- - - - - - - - - - -
0.4 - - - - - 7.8 7.8 - 8.2 12.9
0.2 - 9.1 - - -2.2 43.7 21.7 22.0 50.8 62.8
0.1 - 3.7 - - -1.5 5.4 - 5.4 7.6 55.1
24.1 0.5 - - - 0.3 185.7 110.2 75.5 210.6 306.8
- - - - - - - - - - 230.5
8.9 1.5 0.1 - 0.2 - 77.5 20.2 57.3 88.2 101.1
- - - - - - - - - - -
- - - - - -55.1 492.9 229.8 263.1 437.8 500.1
0.3 0.5 34.3 - - - 32.9 7.5 25.4 67.9 125.7
137.7 - 1.6 - - 0.5 355.9 311.1 44.8 495.8 595.6
8.4 - - - - - 0.4 0.4 - 8.8 10.2
29.7 0.6 1.4 2.7 - -1.5 22.9 18.2 4.7 55.8 97.8
- 0.1 - - - - 13.2 2.3 10.9 13.3 13.6
0.9 - 0.1 - - 0.1 6.8 3.2 3.6 7.9 63.1
5.3 - 1.1 0.6 1.0 0.1 25.4 21.4 4.0 33.4 96.6
8.2 - 7.4 2.1 0.2 0.4 75.5 51.4 24.0 93.7 131.1
8.6 - 3.9 3.4 5.4 0.2 11.7 9.3 2.4 33.2 44.4
71.8 2.2 - 5.5 - - - - - 79.5 187.7
- - 365.6 24.2 1.3 - - - - 391.1 411.0
- 18.5 142.8 226.3 155.7 - - - - 543.3 558.0
639.7 0.1 10.3 18.0 19.0 - 142.2 127.2 15.0 829.3 1,249.9
121.0 - - - - - 447.1 355.8 91.3 568.2 624.7
ExportsFinal consumption expenditure Gross fixed capital formation
78

TABLE 10: FAR NORTH INDUSTRY BY INDUSTRY FLOW TABLE 1996-97DIRECT ALLOCATION OF COMPETING IMPORTS, BASIC PRICES, RECORDING INTRA-INDUSTRY FLOWS, 34 INDUSTRIES ($ MILLION)
INDUSTRY DESCRIPTION
24 Road transport
25 Rail and pipeline transport
26 Other transport
27 Communication services
28 Finance, property and business services
29 Ownership of dwellings
30 Government administration and defence
31 Education
32 Health and community services
33 Cultural and recreational services
34 Personal and other services
T1 Total intermediate usage
P1 Compensation of employees
P2 Gross operating surplus and mixed income
P3 Taxes less subsidies on products
P4 Taxes less subsidies on production
P5 Complementary imports
P6 Imported inputs
P6a Foreign and interstate
P6b Interregional
T2 Total production
Employment (fte persons)
Household Government Private Public enterprise
General government
Change in inventories Total Foreign and
interstate InterregionalTotal final
demand (Q1 to Q7)
Total production
Q1 Q2 Q3 Q4 Q5 Q6 Q7 Q7a Q7b
ExportsFinal consumption expenditure Gross fixed capital formation
25.3 6.3 3.3 0.1 0.6 0.3 179.3 154.1 25.2 215.1 360.9
20.4 1.6 0.4 - - - 69.6 48.2 21.4 92.0 125.2
26.4 33.7 3.1 - 0.1 0.2 459.9 457.1 2.8 523.3 719.8
48.1 0.4 0.4 - - - 23.6 13.0 10.6 72.4 174.5
168.2 23.6 38.3 26.7 12.6 - 28.1 8.6 19.5 297.4 1,400.4
565.3 0.4 - - - - 38.8 38.3 0.5 604.6 604.6
11.0 334.0 3.5 0.6 1.3 - - - - 350.4 413.6
47.1 203.5 0.5 0.2 0.4 - 37.7 24.1 13.6 289.3 296.1
163.4 241.4 0.3 0.1 0.3 - 9.2 3.5 5.7 414.6 425.0
103.3 22.3 0.9 - 2.0 - 15.5 13.5 2.0 143.9 173.4
82.6 68.8 - - - - 6.7 5.3 1.3 158.0 165.5
2,325.9 960.1 632.0 310.5 200.0 -58.3 2,815.3 2,063.2 752.0 7,185.6 10,337.8
- - - - - - - - - - 2,672.1
- - - - - - - - - - 2,164.2
185.3 - 32.9 2.5 3.1 1.5 48.3 48.3 - 273.6 384.4
- - 24.3 - - - - - - 24.3 164.2
1.9 - 1.3 - 0.1 -0.4 - - - 2.7 5.4
800.0 20.6 118.2 37.9 35.2 3.4 - - - 1,015.4 3,111.2
530.8 15.5 95.8 30.9 29.6 2.8 - - - 705.4 2,220.8
269.2 5.1 22.4 7.0 5.6 0.7 - - - 310.0 890.4
3,313.0 980.7 808.6 350.9 238.5 -53.8 2,863.6 2,111.5 752.0 8,501.5 18,839.3
- - - - - - - - - - 89,512
79

TABLE 11: NORTH WEST INDUSTRY BY INDUSTRY FLOW TABLE 1996-97DIRECT ALLOCATION OF COMPETING IMPORTS, BASIC PRICES, RECORDING INTRA-INDUSTRY FLOWS, 34 INDUSTRIES ($ MILLION)
INDUSTRY DESCRIPTION 1 2 3 4 5 6 7 8 9 10 11 12
1 Sheep 1.1 - - - - - - - - - - -
2 Grains - - - - - - - - - - - -
3 Beef cattle - - 49.0 - - - - - - - - -
4 Dairy cattle and pigs - - - - - - - - - - - -
5 Other agriculture 0.3 - 2.1 - 1.5 - - - - - - -
6 Sugar cane growing - - - - - - - - - - - -
7 Forestry and fishing - - 0.4 - - - - - 0.3 - - -
8 Coal, oil and gas - - - - - - - - - - - -
9 Non-ferrous metal ores - - - - - - - - 20.4 4.5 - -
10 Other mining - - 0.1 - - - - - 53.2 1.0 - -
11 Food manufacturing - - 0.2 - - - - - - - 0.1 -
12 Textiles, clothing and footwear - - - - - - - - - - - -
13 Wood and paper manufacturing - - 0.2 - - - - - 0.3 0.1 - -
14 Chemicals, petroleum and coal products - - 0.4 - 0.1 - - - 1.4 0.2 - -
15 Non-metallic mineral products - - - - - - - - 0.3 - - -
16 Metals, metal products - - 0.1 - - - 0.1 - 25.3 26.8 - -
17 Machinery, appliances and equipment - - - - - - - - 0.3 - - -
18 Miscellaneous manufacturing - - - - - - - - - - - -
19 Electricity supply, gas and water - - 1.1 - - - - - 27.8 0.1 - -
20 Residential building construction - - - - - - - - - 0.1 - -
21 Other construction - - 0.6 - - - - - 5.1 0.1 - -
22 Trade 0.5 - 2.9 - 0.2 - 0.4 - 19.9 2.8 0.2 -
23 Accommodation, cafes and restaurants 0.1 - 0.6 - - - - - 1.3 2.2 - -
80

TABLE 11: NORTH WEST INDUSTRY BY INDUSTRY FLOW TABLE 1996-97DIRECT ALLOCATION OF COMPETING IMPORTS, BASIC PRICES, RECORDING INTRA-INDUSTRY FLOWS, 34 INDUSTRIES ($ MILLION)
INDUSTRY DESCRIPTION 1 2 3 4 5 6 7 8 9 10 11 12
24 Road transport 0.2 - 3.3 - 0.2 - - - 6.9 1.5 - -
25 Rail and pipeline transport 0.1 - 0.3 - - - - - 2.9 0.1 - -
26 Other transport 0.1 - 1.0 - - - - - 1.8 6.7 - -
27 Communication services 0.1 - 0.7 - - - - - 6.1 0.5 - -
28 Finance, property and business services 0.2 - 3.0 - 0.1 - 0.1 - 11.1 6.4 - -
29 Ownership of dwellings - - - - - - - - - - - -
30 Government administration and defence - - 0.1 - - - - - 2.7 0.5 - -
31 Education - - - - - - - - 0.2 0.1 - -
32 Health and community services - - 0.4 - - - - - 0.1 - - -
33 Cultural and recreational services - - - - - - - - - - - -
34 Personal and other services - - - - - - - - - - - -
T1 Total intermediate usage 2.7 - 66.6 - 2.2 - 0.8 - 187.5 53.8 0.5 -
P1 Compensation of employees 1.2 - 11.2 - 3.4 - 0.7 - 146.6 30.4 1.4 -
P2 Gross operating surplus and mixed income 6.3 - 50.4 - 2.1 - 2.0 - 318.4 11.7 0.4 -
P3 Taxes less subsidies on products 0.1 - 1.0 - - - 0.1 - 4.0 0.6 0.1 -
P4 Taxes less subsidies on production 0.2 - 2.8 - 0.3 - 0.2 - 10.4 2.2 0.1 -
P5 Complementary imports - - - - - - - - - - - -
P6 Imported inputs 3.7 - 38.3 - 10.0 - 5.0 - 274.6 32.1 2.8 -
P6a Foreign and interstate 2.0 - 19.5 - 5.7 - 4.2 - 138.7 19.0 2.2 -
P6b Interregional 1.8 - 18.9 - 4.3 - 0.8 - 135.8 13.1 0.6 -
T2 Total production 14.3 - 170.3 - 18.1 - 8.8 - 941.5 130.8 5.3 -
Employment (fte persons) 119 - 987 - 231 - 37 - 1,831 330 39 -
81

TABLE 11: NORTH WEST INDUSTRY BY INDUSTRY FLOW TABLE 1996-97DIRECT ALLOCATION OF COMPETING IMPORTS, BASIC PRICES, RECORDING INTRA-INDUSTRY FLOWS, 34 INDUSTRIES ($ MILLION)
INDUSTRY DESCRIPTION
1 Sheep
2 Grains
3 Beef cattle
4 Dairy cattle and pigs
5 Other agriculture
6 Sugar cane growing
7 Forestry and fishing
8 Coal, oil and gas
9 Non-ferrous metal ores
10 Other mining
11 Food manufacturing
12 Textiles, clothing and footwear
13 Wood and paper manufacturing
14 Chemicals, petroleum and coal products
15 Non-metallic mineral products
16 Metals, metal products
17 Machinery, appliances and equipment
18 Miscellaneous manufacturing
19 Electricity supply, gas and water
20 Residential building construction
21 Other construction
22 Trade
23 Accommodation, cafes and restaurants
13 14 15 16 17 18 19 20 21 22 23 24
- - - - - - - - - - - -
- - - - - - - - - - - -
- - - - - - - - - - - -
- - - - - - - - - - - -
- - - - - - - - 0.1 0.1 0.2 -
- - - - - - - - - - - -
- - - - - - - - - 0.2 0.8 -
- - - - - - - - - - - -
- - 0.2 571.1 - - - - - - - -
- - 0.9 - - - 0.1 0.2 2.1 - 0.1 -
- - - - - - - - - 0.1 0.3 -
- - - - - - - - - - - -
- - - - - - - 0.2 0.2 0.2 0.1 -
- - - 0.4 - - 0.1 - 0.1 - - -
- - 0.2 - - - 0.1 0.2 1.2 - - -
0.1 - 2.6 68.7 - - 0.3 8.1 26.2 0.7 0.1 0.1
- - - - - - - - - - - -
- - - - - - - - - - - -
- - 0.4 32.6 - - - - 0.5 0.8 1.3 0.1
- - - - - - - - - - - -
- - - - - - 0.1 - 0.1 0.1 0.3 -
0.2 0.1 0.3 0.5 0.1 - 1.5 0.8 5.6 3.8 2.5 1.8
0.1 - 0.1 - - - 0.2 0.1 0.5 1.0 0.1 0.2
82

TABLE 11: NORTH WEST INDUSTRY BY INDUSTRY FLOW TABLE 1996-97DIRECT ALLOCATION OF COMPETING IMPORTS, BASIC PRICES, RECORDING INTRA-INDUSTRY FLOWS, 34 INDUSTRIES ($ MILLION)
INDUSTRY DESCRIPTION
24 Road transport
25 Rail and pipeline transport
26 Other transport
27 Communication services
28 Finance, property and business services
29 Ownership of dwellings
30 Government administration and defence
31 Education
32 Health and community services
33 Cultural and recreational services
34 Personal and other services
T1 Total intermediate usage
P1 Compensation of employees
P2 Gross operating surplus and mixed income
P3 Taxes less subsidies on products
P4 Taxes less subsidies on production
P5 Complementary imports
P6 Imported inputs
P6a Foreign and interstate
P6b Interregional
T2 Total production
Employment (fte persons)
13 14 15 16 17 18 19 20 21 22 23 24
0.1 - 0.7 0.4 - - 0.1 0.3 1.9 1.2 0.2 2.3
- - 0.3 2.7 - - 2.3 0.1 0.8 0.5 0.3 -
0.1 0.1 0.1 0.5 - - 0.2 - 1.1 3.0 0.3 0.4
- - 0.1 0.1 - - 0.2 - 0.2 1.7 0.4 0.4
0.2 - 0.1 0.7 - - 3.2 0.7 7.2 6.6 2.3 1.1
- - - - - - - - - - - -
0.1 - - 0.1 - - 0.1 0.1 0.5 0.5 0.1 1.2
- - - - - - - - - - - -
- - - - - - - - - - - -
- - - - - - - - - 0.1 - -
- - - - - - - - - - - -
0.9 0.4 5.9 677.9 0.4 - 8.5 10.8 48.4 20.7 9.5 7.7
1.3 1.5 1.4 30.5 1.0 - 6.1 1.9 39.6 56.8 21.6 7.9
0.2 0.6 1.9 23.6 - - 55.2 5.4 69.2 17.4 10.7 11.7
0.1 0.1 0.1 0.4 - - 1.3 0.2 2.6 2.7 3.0 1.3
0.1 0.2 0.1 1.0 0.1 - 1.0 0.2 2.2 3.5 0.7 0.9
- 1.1 - - - - - - - - - -
1.0 2.4 2.7 13.6 4.1 - 21.7 10.5 130.5 55.6 29.7 16.2
0.5 2.0 0.3 10.6 3.7 - 10.8 6.5 102.5 43.7 22.1 12.4
0.6 0.4 2.4 3.0 0.4 - 10.9 4.0 27.9 11.8 7.6 3.8
3.7 6.3 12.2 746.9 5.6 - 93.9 29.0 292.5 156.7 75.1 45.7
29 18 36 735 42 - 99 210 2,200 2,024 810 357
83

TABLE 11: NORTH WEST INDUSTRY BY INDUSTRY FLOW TABLE 1996-97DIRECT ALLOCATION OF COMPETING IMPORTS, BASIC PRICES, RECORDING INTRA-INDUSTRY FLOWS, 34 INDUSTRIES ($ MILLION)
INDUSTRY DESCRIPTION
1 Sheep
2 Grains
3 Beef cattle
4 Dairy cattle and pigs
5 Other agriculture
6 Sugar cane growing
7 Forestry and fishing
8 Coal, oil and gas
9 Non-ferrous metal ores
10 Other mining
11 Food manufacturing
12 Textiles, clothing and footwear
13 Wood and paper manufacturing
14 Chemicals, petroleum and coal products
15 Non-metallic mineral products
16 Metals, metal products
17 Machinery, appliances and equipment
18 Miscellaneous manufacturing
19 Electricity supply, gas and water
20 Residential building construction
21 Other construction
22 Trade
23 Accommodation, cafes and restaurants
25 26 27 28 29 30 31 32 33 34T4 Total
intermediate usage
- - - - - - - - - - 1.2
- - - - - - - - - - -
- - - - - - - - - - 49.0
- - - - - - - - - - -
- - - - - - - - 0.1 - 4.4
- - - - - - - - - - -
0.2 - - - - - - - - - 1.9
- - - - - - - - - - -
- - - - - - - - - - 596.3
- - - 0.1 - - - - 0.1 - 58.0
- - - - - - - - - - 0.8
- - - - - - - - - - -
0.2 - 0.1 0.2 0.1 0.2 0.1 - - - 2.2
0.1 0.1 - - - - - 0.1 - - 3.1
- - - - - - - - - - 2.0
13.8 0.1 0.2 - 4.2 0.1 0.2 0.1 - - 178.0
- - - - - - - - - - 0.5
- - - - - - - - - - -
3.1 0.2 0.1 1.2 0.3 0.5 0.4 0.5 0.1 0.1 71.5
- - - - 2.7 - - - - - 3.0
1.3 - - 0.1 - 0.1 - - - - 8.2
2.9 1.1 1.0 1.2 0.7 0.4 0.4 1.8 0.2 0.3 54.1
0.2 0.3 0.2 1.4 - 0.6 0.1 0.2 0.1 0.1 10.0
84

TABLE 11: NORTH WEST INDUSTRY BY INDUSTRY FLOW TABLE 1996-97DIRECT ALLOCATION OF COMPETING IMPORTS, BASIC PRICES, RECORDING INTRA-INDUSTRY FLOWS, 34 INDUSTRIES ($ MILLION)
INDUSTRY DESCRIPTION
24 Road transport
25 Rail and pipeline transport
26 Other transport
27 Communication services
28 Finance, property and business services
29 Ownership of dwellings
30 Government administration and defence
31 Education
32 Health and community services
33 Cultural and recreational services
34 Personal and other services
T1 Total intermediate usage
P1 Compensation of employees
P2 Gross operating surplus and mixed income
P3 Taxes less subsidies on products
P4 Taxes less subsidies on production
P5 Complementary imports
P6 Imported inputs
P6a Foreign and interstate
P6b Interregional
T2 Total production
Employment (fte persons)
25 26 27 28 29 30 31 32 33 34T4 Total
intermediate usage
0.4 0.4 0.2 0.2 - 0.2 0.1 0.2 0.1 0.1 21.2
0.2 0.3 0.1 0.5 - 0.1 - 0.1 - - 11.8
0.2 4.1 0.5 1.8 - 1.0 0.2 0.2 0.1 0.1 23.8
0.4 0.2 0.1 0.9 - 0.7 0.2 0.4 0.1 0.1 13.7
6.6 1.6 0.4 7.2 2.5 1.9 0.3 1.9 0.4 0.4 66.4
- - - - - - - - - - -
0.6 0.2 0.2 0.5 - 4.9 0.2 0.2 - - 12.7
0.1 - - 0.2 - - - - - - 0.8
- - - - - - - 0.6 - - 1.3
- - - 0.1 - - - - 0.1 - 0.4
- - - - - - - 0.1 - - 0.3
30.4 8.7 3.3 15.8 10.6 10.9 2.4 6.4 1.4 1.4 1,196.6
30.3 8.1 3.8 22.9 - 40.7 34.0 37.6 2.9 13.0 558.0
35.3 12.4 13.4 24.0 71.1 5.5 4.8 12.6 4.6 7.4 778.3
1.0 0.6 0.4 0.5 0.5 0.2 0.1 0.4 0.1 0.2 21.7
-0.5 0.4 0.5 2.1 5.6 -0.3 0.5 0.8 0.1 0.4 35.8
- - - - - - - - - - 1.1
50.3 25.5 7.3 40.1 9.3 11.5 4.1 11.3 7.1 3.9 824.8
35.4 21.0 5.6 32.9 6.5 8.8 3.2 7.9 6.1 3.1 537.0
14.9 4.5 1.6 7.2 2.8 2.6 0.9 3.3 1.0 0.8 287.9
146.7 55.7 28.7 105.5 97.0 68.5 45.9 69.1 16.3 26.2 3,416.3
582 136 86 690 - 949 914 1,146 136 386 15,158
85
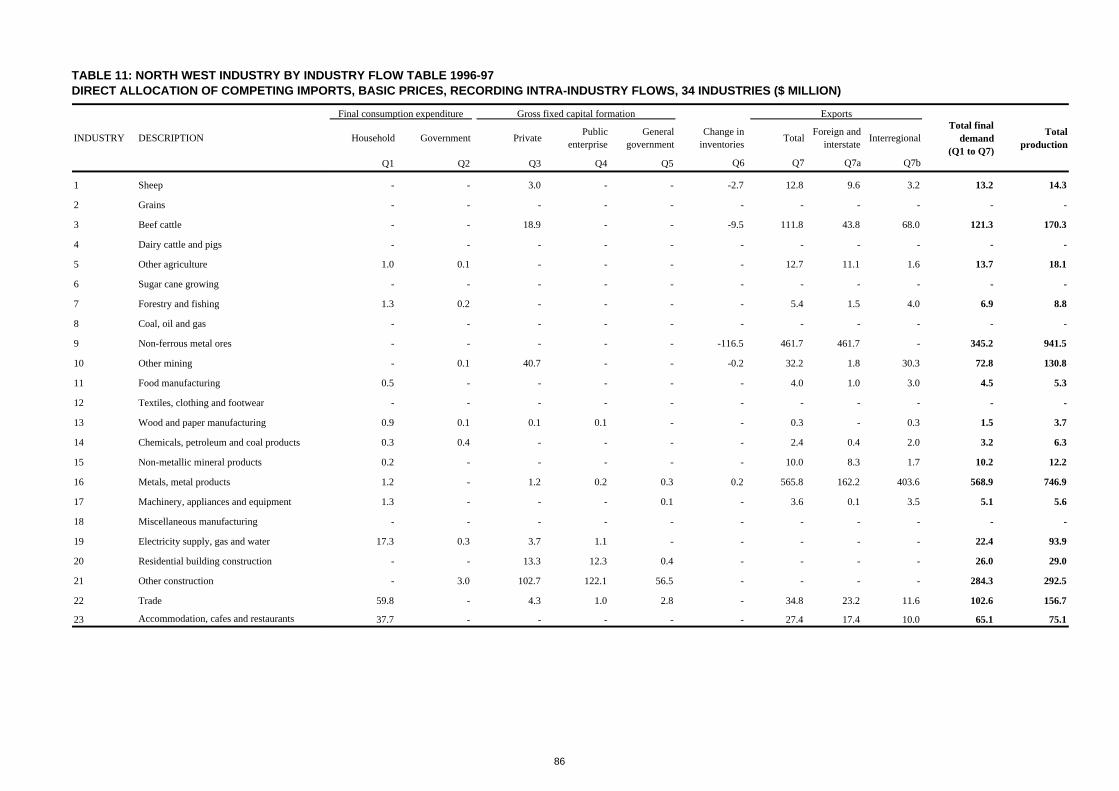
TABLE 11: NORTH WEST INDUSTRY BY INDUSTRY FLOW TABLE 1996-97DIRECT ALLOCATION OF COMPETING IMPORTS, BASIC PRICES, RECORDING INTRA-INDUSTRY FLOWS, 34 INDUSTRIES ($ MILLION)
INDUSTRY DESCRIPTION
1 Sheep
2 Grains
3 Beef cattle
4 Dairy cattle and pigs
5 Other agriculture
6 Sugar cane growing
7 Forestry and fishing
8 Coal, oil and gas
9 Non-ferrous metal ores
10 Other mining
11 Food manufacturing
12 Textiles, clothing and footwear
13 Wood and paper manufacturing
14 Chemicals, petroleum and coal products
15 Non-metallic mineral products
16 Metals, metal products
17 Machinery, appliances and equipment
18 Miscellaneous manufacturing
19 Electricity supply, gas and water
20 Residential building construction
21 Other construction
22 Trade
23 Accommodation, cafes and restaurants
Household Government Private Public enterprise
General government
Change in inventories Total Foreign and
interstate InterregionalTotal final
demand (Q1 to Q7)
Total production
Q1 Q2 Q3 Q4 Q5 Q6 Q7 Q7a Q7b
- - 3.0 - - -2.7 12.8 9.6 3.2 13.2 14.3
- - - - - - - - - - -
- - 18.9 - - -9.5 111.8 43.8 68.0 121.3 170.3
- - - - - - - - - - -
1.0 0.1 - - - - 12.7 11.1 1.6 13.7 18.1
- - - - - - - - - - -
1.3 0.2 - - - - 5.4 1.5 4.0 6.9 8.8
- - - - - - - - - - -
- - - - - -116.5 461.7 461.7 - 345.2 941.5
- 0.1 40.7 - - -0.2 32.2 1.8 30.3 72.8 130.8
0.5 - - - - - 4.0 1.0 3.0 4.5 5.3
- - - - - - - - - - -
0.9 0.1 0.1 0.1 - - 0.3 - 0.3 1.5 3.7
0.3 0.4 - - - - 2.4 0.4 2.0 3.2 6.3
0.2 - - - - - 10.0 8.3 1.7 10.2 12.2
1.2 - 1.2 0.2 0.3 0.2 565.8 162.2 403.6 568.9 746.9
1.3 - - - 0.1 - 3.6 0.1 3.5 5.1 5.6
- - - - - - - - - - -
17.3 0.3 3.7 1.1 - - - - - 22.4 93.9
- - 13.3 12.3 0.4 - - - - 26.0 29.0
- 3.0 102.7 122.1 56.5 - - - - 284.3 292.5
59.8 - 4.3 1.0 2.8 - 34.8 23.2 11.6 102.6 156.7
37.7 - - - - - 27.4 17.4 10.0 65.1 75.1
ExportsFinal consumption expenditure Gross fixed capital formation
86

TABLE 11: NORTH WEST INDUSTRY BY INDUSTRY FLOW TABLE 1996-97DIRECT ALLOCATION OF COMPETING IMPORTS, BASIC PRICES, RECORDING INTRA-INDUSTRY FLOWS, 34 INDUSTRIES ($ MILLION)
INDUSTRY DESCRIPTION
24 Road transport
25 Rail and pipeline transport
26 Other transport
27 Communication services
28 Finance, property and business services
29 Ownership of dwellings
30 Government administration and defence
31 Education
32 Health and community services
33 Cultural and recreational services
34 Personal and other services
T1 Total intermediate usage
P1 Compensation of employees
P2 Gross operating surplus and mixed income
P3 Taxes less subsidies on products
P4 Taxes less subsidies on production
P5 Complementary imports
P6 Imported inputs
P6a Foreign and interstate
P6b Interregional
T2 Total production
Employment (fte persons)
Household Government Private Public enterprise
General government
Change in inventories Total Foreign and
interstate InterregionalTotal final
demand (Q1 to Q7)
Total production
Q1 Q2 Q3 Q4 Q5 Q6 Q7 Q7a Q7b
ExportsFinal consumption expenditure Gross fixed capital formation
1.5 0.9 0.2 - 0.1 - 21.7 18.2 3.5 24.5 45.7
2.8 0.2 0.5 - - - 131.5 94.7 36.7 134.9 146.7
3.8 4.6 0.3 - - - 23.3 21.1 2.2 31.9 55.7
4.2 0.1 - - - - 10.7 7.8 2.9 15.0 28.7
28.3 3.7 0.4 1.0 0.8 - 4.9 4.7 0.2 39.0 105.5
91.8 0.1 - - - - 5.2 5.2 - 97.0 97.0
1.7 53.4 0.4 0.1 0.2 - - - - 55.8 68.5
7.7 35.4 - - - - 1.9 1.6 0.3 45.1 45.9
15.6 50.5 - - - - 1.6 0.5 1.1 67.8 69.1
10.9 3.5 - - - - 1.5 1.3 0.2 15.9 16.3
9.9 12.9 - - - - 3.2 2.6 0.6 25.9 26.2
299.5 169.3 189.9 137.9 61.3 -128.7 1,490.5 899.9 590.6 2,219.7 3,416.3
- - - - - - - - - - 558.0
- - - - - - - - - - 778.3
34.9 - 12.0 0.5 0.5 3.6 27.6 27.6 - 79.1 100.8
- - 8.7 - - - - - - 8.7 44.4
0.3 - 0.4 - - -1.1 - - - - 0.7
246.0 1.8 39.0 18.8 13.7 -0.5 - - - 318.8 1,143.7
121.4 0.8 20.0 15.8 10.3 0.1 - - - 168.4 705.4
124.6 1.0 19.0 3.0 3.4 -0.6 - - - 150.4 438.3
580.8 171.0 250.0 157.2 75.5 -126.7 1,518.1 927.5 590.6 2,625.9 6,042.3
- - - - - - - - - - 15,158
87


REGIONAL MULTIPLIERS
88

MULTIPLIERS
One analytical application of I-O tables involves the use of multipliers that are derived from the tables
through matrix manipulation. Input-output multipliers attempt to measure the total change in all
industries of the economy required to satisfy a unit change (in the majority of cases, a million dollars)
in the final demand of a given industry. Multipliers provide an estimate of the ‘gross’ activity
generated for some given impact on the economy. The concept of gross effects occurs because I-O
multipliers do not account for potential crowding out of one activity by another. The use of multipliers
is not endorsed by either OESR or Queensland Treasury due to their substantial limitations. For a
more detailed explanation of economic impact analysis see Overview of some alternative
methodologies for economic impact analysis on the OESR webpage at
http://www.oesr.qld.gov.au/releases/economicimpact. The reader should note that due to their likely
unreliable nature, multipliers for industries with output of less than $2.5 million have been presented
as ‘na’ (not available).
Multipliers are typically referred to as either Type 1 or Type 2:
Type 1
Type 1 multipliers represent the initial impact on final demand (represented in column1, Initial,
Tables 12-31) plus the additional output required from other industries in the economy needed to
supply the additional demand of the industry receiving the initial impact (represented in column 2,
Industrial Support, Tables12-31). Tables 12-31 also show the initial impact on value added and
employment which is directly generated in each industry as final demand in that industry is impacted.
The industrial support multiplier captures the flow-on effects that occur as the industry that is initially
impacted on, changes its demand for inputs required from other industries. These industries will in
turn respond by changing their input demands leading to additional activity and so on. The sum of
the initial impact combined with the industrial support forms the Type 1 multiplier (represented by
column 3 in Tables 12-31).
Type 2
Type 2 multipliers represent the initial impact on final demand and they measure the industrial
support resulting from the initial impact (i.e., the Type 1 multiplier), plus changes in consumption by
the household sector in response to income changes resulting from the change in output
(represented by column 4, Consumption Induced, Tables 12-31). The inclusion of the consumption
89

induced effects means that Type 2 multipliers are larger than the Type 1 for the same industry.
Depending on the type of impact being applied Type 2 multipliers are generally considered to
overstate the true impact of a change to final demand as they implicitly assume that new employees
resulting from the impact were previously unemployed with zero consumption.
Value Added Multipliers
Value added multipliers (as shown in Tables 12-21) measure the net increase in the economic
activity resulting directly and indirectly from a change in final demand. Value added is the difference
between the gross value of production and the costs of inputs purchased in the production process
and can be viewed as a return on the primary factors of production. Value added is equivalent to
gross state product. Value added is considered to be the more appropriate measure of economic
activity than output and the preferred measure for the broad assessment of the impact of a shock on
the regional economy.
Employment Multipliers
Employment multipliers (shown in Tables 22 -31) indicate the number of jobs, directly and indirectly
generated as a result of an increase to final demand. The multipliers shown in Tables 12-31 reflect
full-time equivalent employment. An important consideration when applying employment multipliers
concerns the likely short-term response of employers to sudden and temporary increases in
demand. Employment responses can often be short-term, or where excess capacity exists, an
increase in labour demand may result in existing staff being employed to work overtime leading to
few, if any, net increases in employment. It is also important to adjust employment multipliers to
account for inflation effects over the period between the reference period of the table and the period
relating to the impact being applied.
Limitations
The attraction of I-O analysis is its relative ease of use and the level of detail obtained concerning
the structure and inter-relationships within an economy. However, it is important to acknowledge
that I-O multipliers represent the average, rather than the marginal, response to changes in final
demand. Due to the several simplifying assumptions associated with I-O tables, the relevance and
application of impact analysis using multipliers must be treated on a case by case basis, requiring
caution to be exercised when interpreting results as they are likely to substantially overstate impacts.
Consequently, a clear understanding of the interpretation, use and limitations of multipliers is
essential for any analysis.
90

TABLE 12: VALUE ADDED MULTIPLIERS, DIRECT ALLOCATION OF IMPORTS, BRISBANE-MORETON 1996-97 (a)PER $ MILLION OF OUTPUT
Industry Description InitialIndustrial Support Type 1
Consumption Induced Type 2
(1) (2) (3) = (1) + (2) (4) (5) = (3) + (4)
1 Sheep na na na na na2 Grains 0.6 0.2 0.8 0.3 1.03 Beef cattle 0.2 0.3 0.5 0.2 0.74 Dairy cattle and pigs 0.4 0.3 0.6 0.2 0.95 Other agriculture 0.5 0.2 0.7 0.3 1.06 Sugar cane growing 0.5 0.2 0.7 0.3 1.07 Forestry and fishing 0.4 0.3 0.7 0.4 1.18 Coal, oil and gas 0.3 0.5 0.8 0.4 1.29 Non-ferrous metal ores 0.6 0.2 0.8 0.2 1.010 Other mining 0.5 0.3 0.8 0.4 1.211 Food manufacturing 0.3 0.3 0.6 0.3 0.912 Textiles, clothing and footwear 0.3 0.2 0.6 0.3 0.913 Wood and paper manufacturing 0.4 0.3 0.7 0.3 1.014 Chemicals, petroleum and coal products 0.2 0.1 0.3 0.1 0.415 Non-metallic mineral products 0.4 0.4 0.8 0.3 1.116 Metals, metal products 0.3 0.3 0.6 0.3 0.917 Machinery, appliances and equipment 0.4 0.2 0.6 0.3 0.918 Miscellaneous manufacturing 0.4 0.3 0.7 0.4 1.019 Electricity supply, gas and water 0.6 0.2 0.8 0.2 1.120 Residential building construction 0.4 0.4 0.7 0.3 1.021 Other construction 0.4 0.3 0.7 0.3 1.122 Trade 0.5 0.4 0.8 0.4 1.223 Accommodation, cafes and restaurants 0.5 0.3 0.8 0.4 1.124 Road transport 0.5 0.3 0.8 0.3 1.125 Rail and pipeline transport 0.4 0.3 0.8 0.4 1.226 Other transport 0.5 0.3 0.8 0.3 1.127 Communication services 0.7 0.2 0.9 0.3 1.228 Finance, property and business services 0.4 0.4 0.8 0.4 1.229 Ownership of dwellings 0.8 0.1 0.9 0.1 1.030 Government administration and defence 0.6 0.3 0.8 0.6 1.431 Education 0.9 0.1 0.9 0.7 1.632 Health and community services 0.8 0.1 0.9 0.6 1.533 Cultural and recreational services 0.4 0.3 0.8 0.3 1.134 Personal and other services 0.7 0.1 0.9 0.6 1.4
(a) Effects of a unit increase in sales to final demand by industry.na - not available due to insignificant output of this industry in the region.
91

TABLE 13: VALUE ADDED MULTIPLIERS, DIRECT ALLOCATION OF IMPORTS, WIDE BAY-BURNETT 1996-97 (a)PER $ MILLION OF OUTPUT
Industry Description InitialIndustrial Support Type 1
Consumption Induced Type 2
(1) (2) (3) = (1) + (2) (4) (5) = (3) + (4)
1 Sheep na na na na na2 Grains 0.5 0.2 0.7 0.1 0.93 Beef cattle 0.4 0.3 0.7 0.2 0.94 Dairy cattle and pigs 0.4 0.3 0.6 0.2 0.85 Other agriculture 0.5 0.2 0.7 0.3 1.06 Sugar cane growing 0.5 0.2 0.7 0.2 0.97 Forestry and fishing 0.5 0.2 0.6 0.3 0.98 Coal, oil and gas 0.6 0.2 0.7 0.2 0.99 Non-ferrous metal ores 0.5 0.1 0.7 0.2 0.8
10 Other mining 0.4 0.2 0.6 0.2 0.811 Food manufacturing 0.2 0.4 0.6 0.2 0.812 Textiles, clothing and footwear 0.4 0.2 0.6 0.3 0.913 Wood and paper manufacturing 0.4 0.3 0.7 0.3 1.014 Chemicals, petroleum and coal products 0.3 0.1 0.4 0.2 0.515 Non-metallic mineral products 0.4 0.2 0.7 0.3 0.916 Metals, metal products 0.5 0.2 0.7 0.4 1.117 Machinery, appliances and equipment 0.3 0.1 0.5 0.3 0.718 Miscellaneous manufacturing 0.3 0.2 0.6 0.3 0.819 Electricity supply, gas and water 0.6 0.2 0.8 0.1 0.920 Residential building construction 0.4 0.2 0.6 0.2 0.821 Other construction 0.5 0.1 0.6 0.2 0.922 Trade 0.5 0.2 0.7 0.3 1.023 Accommodation, cafes and restaurants 0.5 0.2 0.7 0.3 1.024 Road transport 0.5 0.2 0.7 0.2 0.925 Rail and pipeline transport 0.5 0.2 0.7 0.3 1.126 Other transport 0.5 0.1 0.6 0.2 0.827 Communication services 0.6 0.1 0.8 0.2 0.928 Finance, property and business services 0.4 0.2 0.6 0.2 0.929 Ownership of dwellings 0.8 0.1 0.9 0.0 0.930 Government administration and defence 0.6 0.2 0.8 0.4 1.231 Education 0.8 0.1 0.9 0.5 1.432 Health and community services 0.8 0.1 0.8 0.4 1.233 Cultural and recreational services 0.5 0.2 0.7 0.2 0.934 Personal and other services 0.8 0.1 0.9 0.3 1.1
(a) Effects of a unit increase in sales to final demand by industry.na - not available due to insignificant output of this industry in the region.
92

TABLE 14: VALUE ADDED MULTIPLIERS, DIRECT ALLOCATION OF IMPORTS, DARLING DOWNS 1996-97 (a)PER $ MILLION OF OUTPUT
Industry Description InitialIndustrial Support Type 1
Consumption Induced Type 2
(1) (2) (3) = (1) + (2) (4) (5) = (3) + (4)
1 Sheep 0.5 0.2 0.7 0.2 0.92 Grains 0.5 0.2 0.7 0.1 0.83 Beef cattle 0.5 0.3 0.7 0.1 0.94 Dairy cattle and pigs 0.4 0.3 0.6 0.1 0.85 Other agriculture 0.5 0.2 0.7 0.1 0.86 Sugar cane growing na na na na na7 Forestry and fishing 0.4 0.2 0.6 0.2 0.88 Coal, oil and gas 0.5 0.2 0.7 0.2 0.99 Non-ferrous metal ores na na na na na
10 Other mining 0.4 0.2 0.6 0.3 0.911 Food manufacturing 0.2 0.4 0.6 0.2 0.812 Textiles, clothing and footwear 0.2 0.3 0.6 0.2 0.813 Wood and paper manufacturing 0.5 0.2 0.6 0.3 0.914 Chemicals, petroleum and coal products 0.4 0.1 0.5 0.2 0.715 Non-metallic mineral products 0.4 0.2 0.6 0.2 0.916 Metals, metal products 0.4 0.1 0.5 0.2 0.817 Machinery, appliances and equipment 0.4 0.1 0.5 0.2 0.718 Miscellaneous manufacturing 0.4 0.2 0.6 0.3 0.819 Electricity supply, gas and water 0.5 0.1 0.6 0.1 0.820 Residential building construction 0.4 0.2 0.6 0.2 0.821 Other construction 0.4 0.2 0.6 0.2 0.722 Trade 0.5 0.2 0.7 0.3 1.023 Accommodation, cafes and restaurants 0.5 0.2 0.7 0.3 0.924 Road transport 0.5 0.2 0.7 0.2 0.825 Rail and pipeline transport 0.5 0.2 0.7 0.3 1.026 Other transport 0.6 0.1 0.7 0.2 1.027 Communication services 0.7 0.1 0.8 0.2 1.028 Finance, property and business services 0.4 0.2 0.6 0.2 0.929 Ownership of dwellings 0.8 0.1 0.9 0.0 0.930 Government administration and defence 0.5 0.2 0.7 0.4 1.131 Education 0.9 0.1 0.9 0.5 1.432 Health and community services 0.7 0.1 0.8 0.4 1.333 Cultural and recreational services 0.5 0.1 0.6 0.2 0.834 Personal and other services 0.8 0.1 0.9 0.3 1.1
(a) Effects of a unit increase in sales to final demand by industry.na - not available due to insignificant output of this industry in the region.
93

TABLE 15: VALUE ADDED MULTIPLIERS, DIRECT ALLOCATION OF IMPORTS, SOUTH WEST 1996-97 (a)PER $ MILLION OF OUTPUT
Industry Description InitialIndustrial Support Type 1
Consumption Induced Type 2
(1) (2) (3) = (1) + (2) (4) (5) = (3) + (4)
1 Sheep 0.5 0.2 0.7 0.1 0.82 Grains 0.5 0.1 0.7 0.1 0.83 Beef cattle 0.4 0.2 0.7 0.1 0.74 Dairy cattle and pigs 0.4 0.1 0.5 0.0 0.55 Other agriculture 0.4 0.2 0.6 0.1 0.76 Sugar cane growing na na na na na7 Forestry and fishing na na na na na8 Coal, oil and gas 0.5 0.2 0.7 0.1 0.89 Non-ferrous metal ores na na na na na
10 Other mining 0.5 0.1 0.6 0.1 0.711 Food manufacturing 0.4 0.1 0.6 0.2 0.812 Textiles, clothing and footwear 0.2 0.1 0.3 0.1 0.413 Wood and paper manufacturing 0.4 0.2 0.6 0.2 0.814 Chemicals, petroleum and coal products 0.2 0.0 0.2 0.1 0.315 Non-metallic mineral products na na na na na16 Metals, metal products 0.4 0.1 0.5 0.2 0.717 Machinery, appliances and equipment 0.2 0.1 0.3 0.0 0.318 Miscellaneous manufacturing na na na na na19 Electricity supply, gas and water 0.5 0.3 0.7 0.1 0.820 Residential building construction 0.4 0.1 0.4 0.1 0.521 Other construction 0.4 0.1 0.4 0.1 0.522 Trade 0.5 0.1 0.6 0.2 0.823 Accommodation, cafes and restaurants 0.5 0.1 0.6 0.2 0.824 Road transport 0.5 0.1 0.6 0.1 0.725 Rail and pipeline transport 0.5 0.1 0.6 0.1 0.726 Other transport 0.7 0.1 0.8 0.2 1.027 Communication services 0.7 0.1 0.7 0.2 0.928 Finance, property and business services 0.4 0.1 0.6 0.2 0.729 Ownership of dwellings 0.8 0.0 0.9 0.0 0.930 Government administration and defence 0.7 0.1 0.8 0.3 1.131 Education 0.9 0.0 0.9 0.4 1.332 Health and community services 0.8 0.1 0.8 0.3 1.133 Cultural and recreational services 0.6 0.1 0.7 0.2 0.834 Personal and other services 0.8 0.0 0.8 0.3 1.1
(a) Effects of a unit increase in sales to final demand by industry.na - not available due to insignificant output of this industry in the region.
94

TABLE 16: VALUE ADDED MULTIPLIERS, DIRECT ALLOCATION OF IMPORTS, FITZROY 1996-97 (a)PER $ MILLION OF OUTPUT
Industry Description InitialIndustrial Support Type 1
Consumption Induced Type 2
(1) (2) (3) = (1) + (2) (4) (5) = (3) + (4)
1 Sheep na na na na na2 Grains 0.5 0.2 0.7 0.1 0.83 Beef cattle 0.4 0.2 0.6 0.1 0.74 Dairy cattle and pigs 0.4 0.1 0.5 0.1 0.65 Other agriculture 0.5 0.1 0.6 0.1 0.76 Sugar cane growing na na na na na7 Forestry and fishing 0.3 0.1 0.5 0.1 0.58 Coal, oil and gas 0.6 0.2 0.7 0.2 0.99 Non-ferrous metal ores na na na na na
10 Other mining 0.4 0.2 0.7 0.2 0.911 Food manufacturing 0.2 0.3 0.5 0.1 0.612 Textiles, clothing and footwear 0.2 0.1 0.2 0.1 0.313 Wood and paper manufacturing 0.5 0.2 0.6 0.3 0.914 Chemicals, petroleum and coal products 0.3 0.1 0.4 0.1 0.515 Non-metallic mineral products 0.3 0.3 0.6 0.2 0.816 Metals, metal products 0.3 0.2 0.4 0.1 0.517 Machinery, appliances and equipment 0.4 0.1 0.5 0.2 0.818 Miscellaneous manufacturing 0.2 0.2 0.5 0.2 0.619 Electricity supply, gas and water 0.7 0.2 0.8 0.2 1.020 Residential building construction 0.4 0.2 0.6 0.2 0.821 Other construction 0.5 0.1 0.6 0.2 0.822 Trade 0.5 0.2 0.7 0.3 0.923 Accommodation, cafes and restaurants 0.5 0.2 0.6 0.2 0.924 Road transport 0.5 0.2 0.7 0.2 0.825 Rail and pipeline transport 0.6 0.1 0.7 0.3 1.026 Other transport 0.6 0.1 0.7 0.2 1.027 Communication services 0.7 0.1 0.8 0.2 1.028 Finance, property and business services 0.4 0.2 0.6 0.2 0.829 Ownership of dwellings 0.8 0.1 0.9 0.0 0.930 Government administration and defence 0.6 0.2 0.8 0.4 1.231 Education 0.9 0.0 0.9 0.5 1.432 Health and community services 0.7 0.1 0.8 0.4 1.233 Cultural and recreational services 0.5 0.1 0.6 0.2 0.834 Personal and other services 0.7 0.1 0.8 0.4 1.2
(a) Effects of a unit increase in sales to final demand by industry.na - not available due to insignificant output of this industry in the region.
95

TABLE 17: VALUE ADDED MULTIPLIERS, DIRECT ALLOCATION OF IMPORTS, CENTRAL WEST 1996-97 (a)PER $ MILLION OF OUTPUT
Industry Description InitialIndustrial Support Type 1
Consumption Induced Type 2
(1) (2) (3) = (1) + (2) (4) (5) = (3) + (4)
1 Sheep 0.6 0.1 0.7 0.0 0.72 Grains na na na na na3 Beef cattle 0.5 0.1 0.6 0.0 0.64 Dairy cattle and pigs na na na na na5 Other agriculture 0.3 0.1 0.4 0.1 0.56 Sugar cane growing na na na na na7 Forestry and fishing na na na na na8 Coal, oil and gas na na na na na9 Non-ferrous metal ores na na na na na
10 Other mining 0.4 0.1 0.5 0.1 0.611 Food manufacturing 0.3 0.1 0.4 0.1 0.512 Textiles, clothing and footwear na na na na na13 Wood and paper manufacturing na na na na na14 Chemicals, petroleum and coal products na na na na na15 Non-metallic mineral products na na na na na16 Metals, metal products 0.3 0.0 0.3 0.1 0.417 Machinery, appliances and equipment na na na na na18 Miscellaneous manufacturing na na na na na19 Electricity supply, gas and water 0.3 0.3 0.6 0.1 0.620 Residential building construction 0.4 0.0 0.4 0.1 0.521 Other construction 0.4 0.1 0.4 0.1 0.522 Trade 0.6 0.1 0.7 0.1 0.823 Accommodation, cafes and restaurants 0.5 0.0 0.5 0.1 0.724 Road transport 0.5 0.1 0.6 0.1 0.725 Rail and pipeline transport 0.5 0.0 0.5 0.1 0.626 Other transport 0.8 0.0 0.8 0.1 0.927 Communication services 0.7 0.0 0.7 0.1 0.928 Finance, property and business services 0.5 0.1 0.5 0.1 0.729 Ownership of dwellings 0.8 0.0 0.9 0.0 0.930 Government administration and defence 0.6 0.1 0.7 0.2 1.031 Education 0.9 0.0 0.9 0.3 1.232 Health and community services 0.8 0.0 0.8 0.2 1.133 Cultural and recreational services 0.5 0.0 0.6 0.1 0.734 Personal and other services 0.8 0.0 0.8 0.2 1.0
(a) Effects of a unit increase in sales to final demand by industry.na - not available due to insignificant output of this industry in the region.
96

TABLE 18: VALUE ADDED MULTIPLIERS, DIRECT ALLOCATION OF IMPORTS, MACKAY 1996-97 (a)PER $ MILLION OF OUTPUT
Industry Description InitialIndustrial Support Type 1
Consumption Induced Type 2
(1) (2) (3) = (1) + (2) (4) (5) = (3) + (4)
1 Sheep na na na na na2 Grains 0.5 0.1 0.6 0.1 0.63 Beef cattle 0.4 0.2 0.7 0.1 0.84 Dairy cattle and pigs 0.3 0.3 0.6 0.1 0.75 Other agriculture 0.3 0.1 0.5 0.2 0.66 Sugar cane growing 0.5 0.2 0.7 0.1 0.87 Forestry and fishing 0.3 0.2 0.5 0.1 0.68 Coal, oil and gas 0.5 0.2 0.8 0.2 1.09 Non-ferrous metal ores na na na na na
10 Other mining 0.4 0.2 0.7 0.1 0.811 Food manufacturing 0.2 0.4 0.7 0.2 0.812 Textiles, clothing and footwear 0.1 0.1 0.2 0.1 0.313 Wood and paper manufacturing 0.5 0.2 0.6 0.3 0.914 Chemicals, petroleum and coal products 0.4 0.1 0.5 0.1 0.615 Non-metallic mineral products 0.4 0.2 0.6 0.2 0.816 Metals, metal products 0.4 0.2 0.5 0.2 0.817 Machinery, appliances and equipment 0.4 0.1 0.6 0.3 0.818 Miscellaneous manufacturing 0.3 0.2 0.5 0.2 0.819 Electricity supply, gas and water 0.6 0.2 0.8 0.2 1.020 Residential building construction 0.4 0.1 0.6 0.1 0.721 Other construction 0.4 0.2 0.6 0.2 0.822 Trade 0.5 0.2 0.7 0.3 0.923 Accommodation, cafes and restaurants 0.5 0.2 0.7 0.2 0.924 Road transport 0.5 0.2 0.7 0.2 0.825 Rail and pipeline transport 0.5 0.2 0.7 0.2 0.926 Other transport 0.5 0.2 0.7 0.2 0.927 Communication services 0.7 0.1 0.8 0.2 1.028 Finance, property and business services 0.4 0.2 0.6 0.2 0.829 Ownership of dwellings 0.8 0.1 0.9 0.0 0.930 Government administration and defence 0.6 0.2 0.8 0.4 1.231 Education 0.9 0.0 0.9 0.5 1.432 Health and community services 0.7 0.1 0.8 0.4 1.233 Cultural and recreational services 0.5 0.1 0.6 0.2 0.834 Personal and other services 0.7 0.1 0.8 0.3 1.1
(a) Effects of a unit increase in sales to final demand by industry.na - not available due to insignificant output of this industry in the region.
97

TABLE 19: VALUE ADDED MULTIPLIERS, DIRECT ALLOCATION OF IMPORTS, NORTHERN 1996-97 (a)PER $ MILLION OF OUTPUT
Industry Description InitialIndustrial Support Type 1
Consumption Induced Type 2
(1) (2) (3) = (1) + (2) (4) (5) = (3) + (4)
1 Sheep na na na na na2 Grains na na na na na3 Beef cattle 0.5 0.2 0.7 0.2 0.84 Dairy cattle and pigs na na na na na5 Other agriculture 0.4 0.2 0.7 0.2 0.86 Sugar cane growing 0.4 0.2 0.7 0.1 0.87 Forestry and fishing 0.4 0.2 0.5 0.1 0.78 Coal, oil and gas 0.5 0.2 0.8 0.2 1.09 Non-ferrous metal ores 0.5 0.2 0.7 0.2 0.9
10 Other mining 0.4 0.2 0.7 0.3 1.011 Food manufacturing 0.2 0.4 0.6 0.2 0.812 Textiles, clothing and footwear 0.4 0.2 0.5 0.3 0.813 Wood and paper manufacturing 0.4 0.2 0.6 0.3 0.914 Chemicals, petroleum and coal products 0.4 0.1 0.5 0.2 0.715 Non-metallic mineral products 0.3 0.3 0.7 0.2 0.916 Metals, metal products 0.2 0.1 0.3 0.1 0.317 Machinery, appliances and equipment 0.3 0.1 0.4 0.2 0.618 Miscellaneous manufacturing 0.4 0.2 0.6 0.3 0.819 Electricity supply, gas and water 0.6 0.2 0.8 0.1 0.920 Residential building construction 0.4 0.2 0.6 0.2 0.821 Other construction 0.5 0.2 0.6 0.2 0.822 Trade 0.5 0.2 0.7 0.3 1.023 Accommodation, cafes and restaurants 0.5 0.2 0.7 0.3 0.924 Road transport 0.4 0.2 0.7 0.2 0.925 Rail and pipeline transport 0.6 0.2 0.7 0.3 1.126 Other transport 0.5 0.2 0.7 0.2 0.927 Communication services 0.6 0.1 0.8 0.2 1.028 Finance, property and business services 0.4 0.2 0.7 0.2 0.929 Ownership of dwellings 0.8 0.1 0.9 0.0 0.930 Government administration and defence 0.5 0.2 0.7 0.4 1.031 Education 0.9 0.1 0.9 0.5 1.432 Health and community services 0.7 0.1 0.8 0.4 1.233 Cultural and recreational services 0.5 0.2 0.7 0.3 0.934 Personal and other services 0.7 0.1 0.8 0.4 1.2
(a) Effects of a unit increase in sales to final demand by industry.na - not available due to insignificant output of this industry in the region.
98

TABLE 20: VALUE ADDED MULTIPLIERS, DIRECT ALLOCATION OF IMPORTS, FAR NORTH 1996-97 (a)PER $ MILLION OF OUTPUT
Industry Description InitialIndustrial Support Type 1
Consumption Induced Type 2
(1) (2) (3) = (1) + (2) (4) (5) = (3) + (4)
1 Sheep na na na na na2 Grains 0.6 0.0 0.6 0.1 0.73 Beef cattle 0.4 0.2 0.7 0.1 0.84 Dairy cattle and pigs 0.4 0.3 0.6 0.1 0.85 Other agriculture 0.5 0.2 0.7 0.2 0.96 Sugar cane growing 0.5 0.2 0.7 0.2 0.87 Forestry and fishing 0.4 0.2 0.6 0.2 0.78 Coal, oil and gas na na na na na9 Non-ferrous metal ores 0.5 0.1 0.7 0.2 0.9
10 Other mining 0.4 0.2 0.6 0.2 0.811 Food manufacturing 0.2 0.4 0.7 0.2 0.912 Textiles, clothing and footwear 0.3 0.1 0.4 0.2 0.613 Wood and paper manufacturing 0.5 0.2 0.7 0.3 1.014 Chemicals, petroleum and coal products 0.3 0.1 0.4 0.2 0.615 Non-metallic mineral products 0.3 0.3 0.6 0.2 0.816 Metals, metal products 0.4 0.3 0.7 0.3 0.917 Machinery, appliances and equipment 0.3 0.3 0.6 0.2 0.818 Miscellaneous manufacturing 0.4 0.2 0.6 0.3 0.919 Electricity supply, gas and water 0.6 0.2 0.8 0.2 1.020 Residential building construction 0.4 0.2 0.6 0.2 0.821 Other construction 0.5 0.2 0.6 0.2 0.922 Trade 0.5 0.2 0.7 0.3 1.023 Accommodation, cafes and restaurants 0.5 0.2 0.7 0.3 0.924 Road transport 0.5 0.2 0.7 0.2 0.925 Rail and pipeline transport 0.5 0.2 0.7 0.3 0.926 Other transport 0.4 0.2 0.6 0.3 0.927 Communication services 0.7 0.1 0.8 0.3 1.028 Finance, property and business services 0.4 0.3 0.7 0.3 0.929 Ownership of dwellings 0.8 0.1 0.9 0.0 0.930 Government administration and defence 0.6 0.2 0.8 0.5 1.331 Education 0.9 0.1 0.9 0.5 1.532 Health and community services 0.7 0.1 0.8 0.4 1.233 Cultural and recreational services 0.5 0.2 0.7 0.2 0.934 Personal and other services 0.7 0.1 0.8 0.4 1.2
(a) Effects of a unit increase in sales to final demand by industry.na - not available due to insignificant output of this industry in the region.
99

TABLE 21: VALUE ADDED MULTIPLIERS, DIRECT ALLOCATION OF IMPORTS, NORTH WEST 1996-97 (a)PER $ MILLION OF OUTPUT
Industry Description InitialIndustrial Support Type 1
Consumption Induced Type 2
(1) (2) (3) = (1) + (2) (4) (5) = (3) + (4)
1 Sheep 0.5 0.1 0.7 0.1 0.72 Grains na na na na na3 Beef cattle 0.4 0.2 0.6 0.1 0.74 Dairy cattle and pigs na na na na na5 Other agriculture 0.3 0.1 0.4 0.1 0.56 Sugar cane growing na na na na na7 Forestry and fishing 0.3 0.1 0.4 0.0 0.48 Coal, oil and gas na na na na na9 Non-ferrous metal ores 0.5 0.1 0.6 0.1 0.7
10 Other mining 0.3 0.3 0.6 0.1 0.711 Food manufacturing 0.4 0.1 0.4 0.1 0.612 Textiles, clothing and footwear na na na na na13 Wood and paper manufacturing 0.5 0.1 0.6 0.2 0.814 Chemicals, petroleum and coal products 0.4 0.0 0.4 0.1 0.515 Non-metallic mineral products 0.3 0.3 0.6 0.1 0.716 Metals, metal products 0.1 0.6 0.7 0.1 0.717 Machinery, appliances and equipment 0.2 0.0 0.2 0.1 0.318 Miscellaneous manufacturing na na na na na19 Electricity supply, gas and water 0.7 0.1 0.7 0.0 0.820 Residential building construction 0.3 0.2 0.5 0.1 0.621 Other construction 0.4 0.1 0.5 0.1 0.622 Trade 0.5 0.1 0.6 0.2 0.823 Accommodation, cafes and restaurants 0.5 0.1 0.6 0.1 0.724 Road transport 0.5 0.1 0.6 0.1 0.725 Rail and pipeline transport 0.5 0.1 0.6 0.1 0.726 Other transport 0.4 0.1 0.5 0.1 0.527 Communication services 0.6 0.1 0.7 0.1 0.828 Finance, property and business services 0.5 0.1 0.6 0.1 0.729 Ownership of dwellings 0.8 0.1 0.9 0.0 0.930 Government administration and defence 0.7 0.1 0.8 0.3 1.131 Education 0.9 0.0 0.9 0.3 1.232 Health and community services 0.7 0.1 0.8 0.2 1.033 Cultural and recreational services 0.5 0.1 0.5 0.1 0.634 Personal and other services 0.8 0.0 0.8 0.2 1.0
(a) Effects of a unit increase in sales to final demand by industry.na - not available due to insignificant output of this industry in the region.
100

TABLE 22: EMPLOYMENT MULTIPLIERS, DIRECT ALLOCATION OF IMPORTS, BRISBANE-MORETON 1996-97 (a)PER $ MILLION OF OUTPUT
Industry Description InitialIndustrial Support Type 1
Consumption Induced Type 2
(1) (2) (3) = (1) + (2) (4) (5) = (3) + (4)
1 Sheep na na na na na2 Grains 28.7 3.5 32.2 3.6 35.83 Beef cattle 11.0 5.5 16.5 3.3 19.94 Dairy cattle and pigs 12.4 4.4 16.8 3.1 19.85 Other agriculture 11.2 3.3 14.5 4.6 19.16 Sugar cane growing 9.1 4.1 13.2 4.1 17.37 Forestry and fishing 15.7 4.2 19.9 5.3 25.28 Coal, oil and gas 1.9 10.1 12.0 5.9 17.99 Non-ferrous metal ores 2.9 2.8 5.7 3.1 8.8
10 Other mining 6.7 4.8 11.5 6.1 17.611 Food manufacturing 3.5 6.0 9.5 4.2 13.712 Textiles, clothing and footwear 7.8 4.1 11.8 4.5 16.413 Wood and paper manufacturing 6.0 4.1 10.1 4.8 14.914 Chemicals, petroleum and coal products 1.9 1.7 3.6 1.9 5.515 Non-metallic mineral products 3.7 6.2 9.9 5.0 14.816 Metals, metal products 4.7 3.8 8.5 4.0 12.517 Machinery, appliances and equipment 6.8 2.9 9.7 4.8 14.518 Miscellaneous manufacturing 9.2 4.2 13.4 5.4 18.819 Electricity supply, gas and water 4.2 3.3 7.6 3.4 11.020 Residential building construction 5.1 5.5 10.5 3.7 14.321 Other construction 9.8 4.8 14.7 4.6 19.222 Trade 11.0 5.3 16.3 6.1 22.523 Accommodation, cafes and restaurants 10.3 4.9 15.2 5.4 20.624 Road transport 7.9 5.4 13.3 4.2 17.525 Rail and pipeline transport 8.4 5.4 13.7 6.3 20.026 Other transport 3.9 3.7 7.6 4.3 11.927 Communication services 6.6 3.2 9.7 4.9 14.628 Finance, property and business services 6.1 6.6 12.6 5.6 18.229 Ownership of dwellings 0.0 2.1 2.1 0.9 2.930 Government administration and defence 10.3 4.5 14.8 7.8 22.631 Education 18.1 1.3 19.3 9.8 29.2
32 Health and community services 17.1 2.1 19.2 8.7 27.833 Cultural and recreational services 9.0 5.4 14.4 4.9 19.334 Personal and other services 17.2 2.3 19.5 8.0 27.5
(a) Effects of a unit increase in sales to final demand by industry, scaled to represent full time equivalent employment per million dollars worth of output in 1996-97 prices.na - not available due to insignificant output of this industry in the region.
101

TABLE 23: EMPLOYMENT MULTIPLIERS, DIRECT ALLOCATION OF IMPORTS, WIDE BAY BURNETT 1996-97 (a)PER $ MILLION OF OUTPUT
Industry Description InitialIndustrial Support Type 1
Consumption Induced Type 2
(1) (2) (3) = (1) + (2) (4) (5) = (3) + (4)
1 Sheep na na na na na2 Grains 21.5 4.4 25.9 1.9 27.83 Beef cattle 10.6 5.6 16.2 2.8 19.04 Dairy cattle and pigs 12.0 5.1 17.1 2.3 19.45 Other agriculture 16.7 4.0 20.7 3.5 24.26 Sugar cane growing 11.0 3.7 14.7 2.6 17.37 Forestry and fishing 9.7 3.2 12.9 3.3 16.28 Coal, oil and gas 1.9 2.8 4.7 2.5 7.29 Non-ferrous metal ores 2.8 2.0 4.7 2.1 6.8
10 Other mining 3.6 2.7 6.3 2.9 9.211 Food manufacturing 3.1 7.5 10.7 2.7 13.412 Textiles, clothing and footwear 12.9 4.2 17.1 3.9 21.013 Wood and paper manufacturing 6.4 4.4 10.8 3.6 14.414 Chemicals, petroleum and coal products 5.1 1.1 6.3 2.0 8.315 Non-metallic mineral products 6.2 3.5 9.7 3.4 13.116 Metals, metal products 7.8 2.4 10.2 4.7 14.917 Machinery, appliances and equipment 7.0 2.0 9.0 3.2 12.218 Miscellaneous manufacturing 10.2 3.9 14.1 3.3 17.419 Electricity supply, gas and water 1.5 1.8 3.3 1.4 4.720 Residential building construction 6.1 3.7 9.8 2.4 12.221 Other construction 8.5 2.1 10.6 3.0 13.622 Trade 12.4 2.4 14.8 4.0 18.823 Accommodation, cafes and restaurants 10.7 3.2 13.9 3.6 17.524 Road transport 7.8 3.2 11.0 2.5 13.525 Rail and pipeline transport 11.4 2.7 14.1 4.4 18.426 Other transport 3.4 1.7 5.1 2.2 7.427 Communication services 4.0 1.9 5.9 2.2 8.128 Finance, property and business services 5.4 3.4 8.8 2.8 11.629 Ownership of dwellings 0.0 1.3 1.3 0.4 1.730 Government administration and defence 11.1 2.5 13.6 5.5 19.131 Education 20.3 0.9 21.2 6.9 28.0
32 Health and community services 15.4 1.3 16.7 5.2 21.933 Cultural and recreational services 7.8 2.7 10.5 2.4 12.934 Personal and other services 10.9 0.9 11.8 3.8 15.6
(a) Effects of a unit increase in sales to final demand by industry, scaled to represent full time equivalent employment per million dollars worth of output in 1996-97 prices.na - not available due to insignificant output of this industry in the region.
102

TABLE 24: EMPLOYMENT MULTIPLIERS, DIRECT ALLOCATION OF IMPORTS, DARLING DOWNS 1996-97 (a)PER $ MILLION OF OUTPUT
Industry Description InitialIndustrial Support Type 1
Consumption Induced Type 2
(1) (2) (3) = (1) + (2) (4) (5) = (3) + (4)
1 Sheep 13.1 4.2 17.3 2.3 19.62 Grains 22.1 4.1 26.2 1.5 27.73 Beef cattle 7.1 4.1 11.3 1.9 13.24 Dairy cattle and pigs 9.7 4.3 14.0 1.9 15.95 Other agriculture 5.7 2.4 8.0 1.7 9.76 Sugar cane growing na na na na na7 Forestry and fishing 15.2 3.2 18.4 3.2 21.68 Coal, oil and gas 1.5 2.8 4.4 2.5 6.99 Non-ferrous metal ores na na na na na
10 Other mining 7.1 3.0 10.1 3.7 13.811 Food manufacturing 3.0 6.7 9.7 2.5 12.312 Textiles, clothing and footwear 3.9 6.4 10.3 2.7 13.013 Wood and paper manufacturing 9.1 3.3 12.5 3.9 16.414 Chemicals, petroleum and coal products 5.3 1.5 6.7 2.7 9.515 Non-metallic mineral products 6.1 3.6 9.8 3.3 13.116 Metals, metal products 8.0 2.6 10.7 3.3 14.017 Machinery, appliances and equipment 7.3 2.3 9.6 3.2 12.918 Miscellaneous manufacturing 9.6 3.6 13.2 3.6 16.719 Electricity supply, gas and water 4.0 1.9 5.9 1.7 7.620 Residential building construction 6.2 3.6 9.8 2.3 12.121 Other construction 8.6 2.8 11.4 2.2 13.622 Trade 12.3 2.4 14.7 4.0 18.723 Accommodation, cafes and restaurants 11.0 3.2 14.2 3.6 17.724 Road transport 7.8 3.2 11.0 2.5 13.525 Rail and pipeline transport 9.7 2.9 12.7 4.1 16.826 Other transport 4.8 1.8 6.5 2.9 9.527 Communication services 5.3 2.1 7.4 2.8 10.328 Finance, property and business services 6.6 3.1 9.7 3.0 12.729 Ownership of dwellings 0.0 1.3 1.3 0.4 1.730 Government administration and defence 11.2 2.7 13.9 5.1 19.031 Education 21.3 0.9 22.2 7.1 29.3
32 Health and community services 17.2 1.5 18.7 5.7 24.433 Cultural and recreational services 7.8 2.2 10.1 2.5 12.534 Personal and other services 12.2 1.0 13.2 3.8 17.0
(a) Effects of a unit increase in sales to final demand by industry, scaled to represent full time equivalent employment per million dollars worth of output in 1996-97 prices.na - not available due to insignificant output of this industry in the region.
103

TABLE 25: EMPLOYMENT MULTIPLIERS, DIRECT ALLOCATION OF IMPORTS, SOUTH WEST 1996-97 (a)PER $ MILLION OF OUTPUT
Industry Description InitialIndustrial Support Type 1
Consumption Induced Type 2
(1) (2) (3) = (1) + (2) (4) (5) = (3) + (4)
1 Sheep 11.3 3.3 14.6 1.2 15.82 Grains 14.1 3.1 17.1 0.8 18.03 Beef cattle 8.0 3.9 11.9 1.1 13.14 Dairy cattle and pigs 8.2 1.9 10.1 0.5 10.75 Other agriculture 9.1 3.1 12.2 0.9 13.16 Sugar cane growing na na na na na7 Forestry and fishing na na na na na8 Coal, oil and gas 0.6 2.0 2.7 0.9 3.69 Non-ferrous metal ores na na na na na
10 Other mining 2.2 1.6 3.8 1.4 5.111 Food manufacturing 8.3 2.5 10.8 2.5 13.312 Textiles, clothing and footwear 2.2 2.3 4.5 0.7 5.113 Wood and paper manufacturing 9.6 4.4 13.9 2.3 16.214 Chemicals, petroleum and coal products 2.3 0.0 2.3 0.7 3.115 Non-metallic mineral products na na na na na16 Metals, metal products 8.0 1.2 9.2 2.1 11.317 Machinery, appliances and equipment 2.0 1.1 3.2 0.5 3.718 Miscellaneous manufacturing na na na na na19 Electricity supply, gas and water 3.8 1.8 5.6 1.1 6.720 Residential building construction 7.3 1.6 8.8 0.8 9.721 Other construction 7.8 1.0 8.9 0.8 9.722 Trade 11.8 1.5 13.3 2.3 15.723 Accommodation, cafes and restaurants 10.6 1.7 12.3 2.1 14.424 Road transport 7.8 2.3 10.1 1.5 11.625 Rail and pipeline transport 7.9 1.2 9.1 1.7 10.926 Other transport 6.8 1.0 7.8 2.1 9.927 Communication services 7.5 1.3 8.8 2.2 11.028 Finance, property and business services 6.9 1.9 8.8 1.9 10.729 Ownership of dwellings 0.0 0.7 0.7 0.1 0.830 Government administration and defence 10.5 1.7 12.2 3.6 15.831 Education 22.1 0.6 22.7 4.7 27.3
32 Health and community services 15.3 1.0 16.3 3.3 19.733 Cultural and recreational services 10.0 1.4 11.4 1.8 13.234 Personal and other services 15.8 0.6 16.4 3.2 19.6
(a) Effects of a unit increase in sales to final demand by industry, scaled to represent full time equivalent employment per million dollars worth of output in 1996-97 prices.na - not available due to insignificant output of this industry in the region.
104

TABLE 26: EMPLOYMENT MULTIPLIERS, DIRECT ALLOCATION OF IMPORTS, FITZROY 1996-97 (a)PER $ MILLION OF OUTPUT
Industry Description InitialIndustrial Support Type 1
Consumption Induced Type 2
(1) (2) (3) = (1) + (2) (4) (5) = (3) + (4)
1 Sheep na na na na na2 Grains 12.1 3.6 15.6 1.0 16.73 Beef cattle 8.7 4.0 12.7 1.4 14.14 Dairy cattle and pigs 10.8 2.0 12.8 0.8 13.65 Other agriculture 10.5 2.4 12.9 1.4 14.36 Sugar cane growing na na na na na7 Forestry and fishing 6.0 2.3 8.3 1.2 9.48 Coal, oil and gas 1.9 2.7 4.6 2.6 7.29 Non-ferrous metal ores na na na na na
10 Other mining 2.0 3.2 5.1 2.7 7.811 Food manufacturing 3.0 6.1 9.1 1.8 10.912 Textiles, clothing and footwear 5.6 1.4 7.1 1.2 8.313 Wood and paper manufacturing 10.3 3.1 13.4 3.6 17.014 Chemicals, petroleum and coal products 1.4 1.3 2.7 1.3 4.015 Non-metallic mineral products 2.0 4.0 6.1 2.3 8.316 Metals, metal products 2.1 1.2 3.4 1.6 5.017 Machinery, appliances and equipment 7.8 2.0 9.8 3.1 12.818 Miscellaneous manufacturing 7.5 4.2 11.8 2.4 14.219 Electricity supply, gas and water 2.7 1.6 4.2 2.0 6.320 Residential building construction 7.8 2.8 10.6 2.4 13.021 Other construction 9.4 2.2 11.6 2.8 14.322 Trade 12.3 2.7 15.0 3.7 18.723 Accommodation, cafes and restaurants 10.7 2.8 13.6 3.2 16.724 Road transport 7.9 3.2 11.1 2.4 13.525 Rail and pipeline transport 8.6 2.0 10.6 3.9 14.526 Other transport 4.6 1.8 6.4 2.8 9.327 Communication services 6.6 2.0 8.5 3.1 11.628 Finance, property and business services 6.2 3.3 9.5 2.8 12.329 Ownership of dwellings 0.0 1.2 1.2 0.3 1.630 Government administration and defence 11.1 2.7 13.8 5.3 19.131 Education 18.7 0.7 19.5 6.4 25.9
32 Health and community services 15.9 1.7 17.6 5.3 22.933 Cultural and recreational services 8.1 2.0 10.1 2.3 12.334 Personal and other services 16.0 1.2 17.1 5.1 22.3
(a) Effects of a unit increase in sales to final demand by industry, scaled to represent full time equivalent employment per million dollars worth of output in 1996-97 prices.na - not available due to insignificant output of this industry in the region.
105

TABLE 27: EMPLOYMENT MULTIPLIERS, DIRECT ALLOCATION OF IMPORTS, CENTRAL WEST 1996-97 (a)PER $ MILLION OF OUTPUT
Industry Description InitialIndustrial Support Type 1
Consumption Induced Type 2
(1) (2) (3) = (1) + (2) (4) (5) = (3) + (4)
1 Sheep 7.0 1.6 8.6 0.4 9.02 Grains na na na na na3 Beef cattle 9.3 2.8 12.1 0.4 12.54 Dairy cattle and pigs na na na na na5 Other agriculture 10.8 1.7 12.5 0.9 13.46 Sugar cane growing na na na na na7 Forestry and fishing na na na na na8 Coal, oil and gas na na na na na9 Non-ferrous metal ores na na na na na
10 Other mining 4.1 1.2 5.4 0.9 6.311 Food manufacturing 7.2 1.6 8.8 1.2 10.012 Textiles, clothing and footwear na na na na na13 Wood and paper manufacturing na na na na na14 Chemicals, petroleum and coal products na na na na na15 Non-metallic mineral products na na na na na16 Metals, metal products 3.5 0.0 3.5 0.9 4.417 Machinery, appliances and equipment na na na na na18 Miscellaneous manufacturing na na na na na19 Electricity supply, gas and water 2.4 2.5 4.9 0.7 5.620 Residential building construction 6.6 0.7 7.3 0.6 7.921 Other construction 9.8 0.8 10.6 0.7 11.322 Trade 11.3 0.8 12.1 1.3 13.423 Accommodation, cafes and restaurants 10.7 0.8 11.5 1.5 13.024 Road transport 7.9 1.7 9.6 1.1 10.625 Rail and pipeline transport 6.7 0.7 7.4 1.3 8.726 Other transport 6.3 0.7 7.0 1.6 8.627 Communication services 7.2 0.7 7.9 1.5 9.428 Finance, property and business services 7.7 1.2 8.8 1.4 10.329 Ownership of dwellings 0.0 0.4 0.4 0.1 0.530 Government administration and defence 11.1 1.5 12.6 2.5 15.231 Education 20.9 0.3 21.2 3.5 24.7
32 Health and community services 15.5 0.6 16.1 2.7 18.833 Cultural and recreational services 10.2 0.8 11.0 1.0 12.034 Personal and other services 14.7 0.4 15.1 2.3 17.5
(a) Effects of a unit increase in sales to final demand by industry, scaled to represent full time equivalent employment per million dollars worth of output in 1996-97 prices.na - not available due to insignificant output of this industry in the region.
106

TABLE 28: EMPLOYMENT MULTIPLIERS, DIRECT ALLOCATION OF IMPORTS, MACKAY 1996-97 (a)PER $ MILLION OF OUTPUT
Industry Description InitialIndustrial Support Type 1
Consumption Induced Type 2
(1) (2) (3) = (1) + (2) (4) (5) = (3) + (4)
1 Sheep na na na na na2 Grains 15.3 1.6 16.9 1.0 17.93 Beef cattle 7.1 4.1 11.2 1.3 12.54 Dairy cattle and pigs 11.1 5.7 16.8 1.3 18.15 Other agriculture 10.5 2.7 13.2 2.0 15.26 Sugar cane growing 5.5 2.6 8.1 1.3 9.47 Forestry and fishing 4.4 2.6 7.0 1.2 8.28 Coal, oil and gas 1.9 2.9 4.8 2.5 7.39 Non-ferrous metal ores na na na na na
10 Other mining 1.3 3.1 4.4 1.9 6.211 Food manufacturing 2.6 5.8 8.4 2.2 10.612 Textiles, clothing and footwear 3.1 1.1 4.2 1.0 5.213 Wood and paper manufacturing 8.5 2.7 11.2 3.4 14.514 Chemicals, petroleum and coal products 1.8 1.5 3.3 1.7 5.015 Non-metallic mineral products 4.1 3.2 7.3 2.5 9.916 Metals, metal products 6.2 2.8 9.0 2.9 11.917 Machinery, appliances and equipment 7.4 1.9 9.3 3.7 13.018 Miscellaneous manufacturing 10.6 3.3 13.9 2.9 16.819 Electricity supply, gas and water 5.1 1.9 7.0 2.2 9.220 Residential building construction 6.3 2.4 8.7 1.9 10.621 Other construction 10.6 2.6 13.1 2.3 15.522 Trade 11.5 2.5 14.0 3.5 17.523 Accommodation, cafes and restaurants 11.3 2.6 13.9 3.1 17.024 Road transport 7.9 3.4 11.3 2.3 13.625 Rail and pipeline transport 6.9 2.5 9.5 3.2 12.726 Other transport 4.2 2.5 6.7 2.6 9.227 Communication services 5.2 2.0 7.2 2.6 9.828 Finance, property and business services 5.8 2.8 8.6 2.7 11.329 Ownership of dwellings 0.0 1.1 1.1 0.3 1.430 Government administration and defence 10.5 2.3 12.8 5.1 17.931 Education 19.1 0.7 19.8 6.7 26.5
32 Health and community services 16.4 1.5 17.9 5.4 23.333 Cultural and recreational services 7.7 1.9 9.6 2.2 11.934 Personal and other services 15.3 1.1 16.4 4.4 20.8
(a) Effects of a unit increase in sales to final demand by industry, scaled to represent full time equivalent employment per million dollars worth of output in 1996-97 prices.na - not available due to insignificant output of this industry in the region.
107

TABLE 29: EMPLOYMENT MULTIPLIERS, DIRECT ALLOCATION OF IMPORTS, NORTHERN 1996-97 (a)PER $ MILLION OF OUTPUT
Industry Description InitialIndustrial Support Type 1
Consumption Induced Type 2
(1) (2) (3) = (1) + (2) (4) (5) = (3) + (4)
1 Sheep na na na na na2 Grains na na na na na3 Beef cattle 10.7 3.8 14.5 2.3 16.84 Dairy cattle and pigs na na na na na5 Other agriculture 13.2 5.6 18.8 2.6 21.46 Sugar cane growing 6.4 4.4 10.8 2.1 12.97 Forestry and fishing 5.3 3.1 8.4 1.9 10.38 Coal, oil and gas 1.9 3.9 5.8 3.2 9.19 Non-ferrous metal ores 2.5 2.5 5.0 2.5 7.5
10 Other mining 5.5 3.5 9.0 4.7 13.711 Food manufacturing 2.6 6.5 9.1 2.5 11.612 Textiles, clothing and footwear 9.2 2.7 11.9 3.7 15.613 Wood and paper manufacturing 7.2 3.0 10.2 3.8 14.014 Chemicals, petroleum and coal products 2.9 2.2 5.0 3.0 8.015 Non-metallic mineral products 3.6 4.6 8.2 3.3 11.516 Metals, metal products 1.5 0.4 2.0 1.1 3.117 Machinery, appliances and equipment 5.5 2.2 7.7 2.8 10.518 Miscellaneous manufacturing 9.7 3.0 12.7 3.8 16.519 Electricity supply, gas and water 3.8 2.2 6.0 2.1 8.020 Residential building construction 6.8 3.3 10.0 2.6 12.621 Other construction 9.0 2.5 11.5 3.2 14.722 Trade 12.3 3.3 15.6 4.4 20.023 Accommodation, cafes and restaurants 12.5 3.5 16.0 3.8 19.824 Road transport 8.0 4.1 12.1 2.9 15.025 Rail and pipeline transport 9.1 2.6 11.8 4.9 16.726 Other transport 3.9 2.7 6.6 3.0 9.727 Communication services 4.7 2.4 7.1 3.0 10.228 Finance, property and business services 6.4 3.8 10.2 3.5 13.729 Ownership of dwellings 0.0 1.3 1.3 0.4 1.830 Government administration and defence 10.4 3.0 13.3 5.3 18.631 Education 20.2 1.0 21.2 7.7 28.9
32 Health and community services 17.9 2.3 20.2 6.0 26.333 Cultural and recreational services 11.2 3.2 14.4 3.8 18.234 Personal and other services 16.9 1.5 18.4 5.8 24.2
(a) Effects of a unit increase in sales to final demand by industry, scaled to represent full time equivalent employment per million dollars worth of output in 1996-97 prices.na - not available due to insignificant output of this industry in the region.
108

TABLE 30: EMPLOYMENT MULTIPLIERS, DIRECT ALLOCATION OF IMPORTS, FAR NORTH 1996-97 (a)PER $ MILLION OF OUTPUT
Industry Description InitialIndustrial Support Type 1
Consumption Induced Type 2
(1) (2) (3) = (1) + (2) (4) (5) = (3) + (4)
1 Sheep na na na na na2 Grains 17.4 0.1 17.4 1.9 19.43 Beef cattle 8.7 4.9 13.6 2.0 15.64 Dairy cattle and pigs 8.9 5.3 14.2 2.0 16.25 Other agriculture 15.0 4.5 19.5 3.2 22.76 Sugar cane growing 7.9 4.3 12.1 2.4 14.57 Forestry and fishing 6.9 3.2 10.0 2.4 12.48 Coal, oil and gas na na na na na9 Non-ferrous metal ores 3.1 2.2 5.3 2.5 7.8
10 Other mining 3.0 3.2 6.3 3.2 9.511 Food manufacturing 3.5 8.1 11.7 3.5 15.212 Textiles, clothing and footwear 8.6 2.1 10.8 3.2 14.013 Wood and paper manufacturing 9.0 3.7 12.8 4.7 17.514 Chemicals, petroleum and coal products 5.3 1.5 6.9 2.7 9.615 Non-metallic mineral products 3.3 4.2 7.6 3.3 10.816 Metals, metal products 6.9 2.9 9.8 4.0 13.717 Machinery, appliances and equipment 5.7 3.1 8.7 3.5 12.218 Miscellaneous manufacturing 9.3 3.2 12.6 4.7 17.219 Electricity supply, gas and water 6.9 2.5 9.4 3.4 12.820 Residential building construction 7.1 3.1 10.2 2.8 13.021 Other construction 10.0 3.0 13.0 3.7 16.722 Trade 12.8 3.7 16.5 5.2 21.723 Accommodation, cafes and restaurants 12.4 3.8 16.2 4.2 20.424 Road transport 7.9 4.1 12.0 3.2 15.225 Rail and pipeline transport 6.2 3.3 9.5 4.0 13.526 Other transport 5.7 3.1 8.8 3.9 12.727 Communication services 6.6 2.5 9.1 4.0 13.128 Finance, property and business services 6.0 4.9 10.9 4.0 14.929 Ownership of dwellings 0.0 1.5 1.5 0.5 2.130 Government administration and defence 11.8 2.9 14.7 7.2 22.031 Education 19.5 1.1 20.5 8.5 29.0
32 Health and community services 19.2 2.7 21.9 6.6 28.533 Cultural and recreational services 9.4 4.2 13.6 3.8 17.534 Personal and other services 16.1 1.7 17.8 6.4 24.3
(a) Effects of a unit increase in sales to final demand by industry, scaled to represent full time equivalent employment per million dollars worth of output in 1996-97 prices.na - not available due to insignificant output of this industry in the region.
109

TABLE 31: EMPLOYMENT MULTIPLIERS, DIRECT ALLOCATION OF IMPORTS, NORTH WEST 1996-97 (a)PER $ MILLION OF OUTPUT
Industry Description InitialIndustrial Support Type 1
Consumption Induced Type 2
(1) (2) (3) = (1) + (2) (4) (5) = (3) + (4)
1 Sheep 8.3 2.0 10.3 0.6 10.92 Grains na na na na na3 Beef cattle 5.8 3.7 9.5 0.6 10.14 Dairy cattle and pigs na na na na na5 Other agriculture 12.8 1.6 14.3 1.0 15.46 Sugar cane growing na na na na na7 Forestry and fishing 4.2 1.0 5.2 0.5 5.78 Coal, oil and gas na na na na na9 Non-ferrous metal ores 1.9 1.1 3.1 1.0 4.1
10 Other mining 2.5 2.2 4.7 1.6 6.311 Food manufacturing 7.4 0.9 8.3 1.4 9.712 Textiles, clothing and footwear na na na na na13 Wood and paper manufacturing 7.8 2.2 10.0 2.1 12.114 Chemicals, petroleum and coal products 2.8 0.5 3.4 1.2 4.615 Non-metallic mineral products 2.9 2.6 5.5 1.1 6.716 Metals, metal products 1.0 2.8 3.8 1.1 4.917 Machinery, appliances and equipment 7.4 0.6 8.0 0.9 8.918 Miscellaneous manufacturing na na na na na19 Electricity supply, gas and water 1.1 0.7 1.8 0.4 2.220 Residential building construction 7.2 2.0 9.2 0.8 9.921 Other construction 7.5 1.0 8.5 0.9 9.422 Trade 12.9 1.1 14.0 1.9 15.923 Accommodation, cafes and restaurants 10.8 1.0 11.8 1.5 13.424 Road transport 7.8 1.8 9.6 1.1 10.725 Rail and pipeline transport 4.0 1.3 5.2 1.2 6.526 Other transport 2.4 1.0 3.5 0.9 4.427 Communication services 3.0 1.0 4.0 0.8 4.828 Finance, property and business services 6.5 1.2 7.7 1.2 8.929 Ownership of dwellings 0.0 0.7 0.7 0.1 0.930 Government administration and defence 13.8 1.7 15.6 3.2 18.731 Education 19.9 0.4 20.3 3.6 23.9
32 Health and community services 16.6 0.9 17.5 2.7 20.233 Cultural and recreational services 8.3 0.8 9.1 1.0 10.034 Personal and other services 14.7 0.5 15.2 2.4 17.6
(a) Effects of a unit increase in sales to final demand by industry, scaled to represent full time equivalent employment per million dollars worth of output in 1996-97 prices.na - not available due to insignificant output of this industry in the region.
110

Appendix A 1996-97 Input-Output Industry Classification 107 and 34 Industry: Qld Concordance with 1993 ANZSIC
Input-Output Industry Classification Corresponding ANZSIC Industries Code Description Code Description 1 Sheep 0101 Sheep 0122 (part) Grain-sheep and grain-beef cattle farming
0123 (part) Sheep-beef cattle farming 0124 Sheep farming 2 Grains 0102 Grains 0121 Grain growing 0122 (part) Grain-sheep and grain-beef cattle farming 3 Beef cattle 0103 Beef cattle 0122 (part) Grain-sheep and grain-beef cattle farming 0123 (part) Sheep-beef cattle farming 0125 Beef cattle farming 4 Diary cattle and pigs 0104 Dairy cattle 0130 Dairy cattle farming 0105 Pigs 0151 Pig farming 5 Other agriculture 0106 Poultry 0141,2 Poultry farming 0107 Other agriculture 0111 Plant nurseries 0112 Cut flower and flower seed growing 0113 Vegetable growing 0114-7,9 Fruit growing 0152,3,9 Other livestock farming 0162,9 Other crop growing 0200 Services to agriculture, hunting and
trapping 0211-3,9 0220
Services to agriculture Hunting and trapping
6 Sugar cane growing 0107a Sugar cane growing 0161 Sugar cane growing 7 Forestry and fishing 0300 Forestry and logging 0301-3 Forestry and logging 0400 Commercial fishing 0411-5,9 Marine fishing 0420 Aquaculture 8 Coal, oil and gas 1100 Coal, oil and gas 1101,2 Coal mining 1200 Oil and gas extraction 9 Non-ferrous metal ores 1302 Non-ferrous metal ores 1312-7,9 Non-ferrous metal ore mining 10 Other mining 1301 Iron ores 1311 Iron ore mining 1400 Other mining 1411,9 Construction material mining 1420 Mining n.e.c. 1500 Services to mining 1511-4 Exploration 1520 Other mining services 11 Food manufacturing 2101 Meat and meat products 2111-3 Meat and meat product manufacturing 2102 Dairy products 2121,2,9 Dairy product manufacturing 2103 Fruit and vegetable products 2130 Fruit and vegetable processing 2104 Oils and fats 2140 Oil and fat manufacturing 2105 Flour mill products and cereal foods 2151,2 Flour mill and cereal food manufacturing 2106 Bakery products 2161-3 Bakery product manufacturing 2107 Confectionery 2172 Confectionery manufacturing
111

Input-Output Industry Classification Corresponding ANZSIC Industries Code Description Code Description 11 Food manufacturing cont. 2108 Other food products 2171,3,4,9 Other food manufacturing 2109 Soft drinks, cordials and syrups 2181 Soft drink, cordial and syrup manufacturing 2110 Beer and malt 2182 Beer and malt manufacturing 2111 Wine and spirits 2183 Wine manufacturing 2184 Spirit manufacturing 2112 Tobacco products 2190 Tobacco product manufacturing 12 Textiles, clothing and footwear 2201 Textile fibres, yarns and woven fabrics 2211 Wool scouring 2212 Synthetic fibre textile manufacturing 2213 Cotton textile manufacturing 2214 Wool textile manufacturing 2215 Textile finishing 2202 Textile products 2221-3,9 Textile product manufacturing 2203 Knitting mill products 2231,2,9 Knitting mill product manufacturing 2204 Clothing 2241-3,9 Clothing manufacturing 2205 Footwear 2250 Footwear manufacturing 2206 Leather and leather products 2261,2 Leather and leather product manufacturing 13 Wood and paper manufacturing 2301 Sawmill products 2311-3 Log sawmilling and timber dressing 2302 Other wood products 2321 Plywood and veneer manufacturing 2322 Fabricated wood manufacturing 2323 Wooden structural component manufacturing 2329 Wood product manufacturing n.e.c. 2303 Pulp, paper and paperboard 2331 Pulp, paper and paperboard manufacturing 2304 Paperboard containers, paper bags and
sacks 2332 2333
Solid paperboard container manufacturing Corrugated paperboard container manufacturing
2334 Paper bag and sack manufacturing 2339 Paper product manufacturing n.e.c. 2401 Printing and services to printing 2411-3 Printing and services to printing 2402 Publishing, recorded media and
publishing 2421-3 2430
Publishing Recorded media manufacturing and publishing
14 Chemicals, petroleum and coal products 2501 Petroleum and coal products 2510 Petroleum refining 2520 Petroleum and coal product manufacturing 2502 Basic chemicals 2531 Fertiliser manufacturing 2532 Industrial gas manufacturing 2533 Synthetic resin manufacturing 2534
2535 Organic industrial chemical manufacturing n.e.c. Inorganic industrial chemical manufacturing n.e.c.
2503 Paints 2542 Paint manufacturing 2504 Medicinal and pharmaceutical products,
pesticides 2543 2544
Medicinal and pharmaceutical product manufacturing Pesticide manufacturing
2505 Soap and detergents 2545 Soap and other detergent manufacturing 2506 Cosmetic and toiletry preparations 2546 Cosmetic and toiletry preparation manufacturing 2507 Other chemical products 2541 Explosive manufacturing 2547 Ink manufacturing 2549 Chemical product manufacturing n.e.c. 2508 Rubber products 2551,9 Rubber product manufacturing 2509 Plastic products 2561-6 Plastic product manufacturing
112

Input-Output Industry Classification Corresponding ANZSIC Industries Code Description Code Description 15 Non-metallic mineral products 2601 Glass and glass products 2610 Glass and glass product manufacturing 2602 Ceramic products 2621-3,9 Ceramic product manufacturing 2603 Cement, lime and concrete slurry 2631 Cement and lime manufacturing 2633 Concrete slurry manufacturing 2604 Plaster and other concrete products 2632 Plaster product manufacturing 2634 Concrete pipe and box culvert manufacturing 2635 Concrete product manufacturing n.e.c. 2605 Other non-metallic mineral products 2640 Non-metallic mineral product manufacturing n.e.c. 16 Metals, metal products 2701 Iron and steel 2711-3 Iron and steel manufacturing 2702 Basic non-ferrous metals and products 2721-3,9 Basic non-ferrous metal manufacturing 2731-3 Non-ferrous basic metal product manufacturing 2703 Structural metal products 2741,2,9 Structural metal product manufacturing 2704 Sheet metal products 2751,9 Sheet metal product manufacturing 2705 Fabricated metal products 2761-5,9 Fabricated metal product manufacturing 17 Machinery, appliances and equipment 2801 Motor vehicles and parts, other
transport equipment 2811-3,9 2829
Motor vehicle and part manufacturing Transport equipment manufacturing n.e.c.
2802 Ships and boats 2821 Shipbuilding 2822 Boatbuilding 2803 Railway equipment 2823 Railway equipment manufacturing 2804 Aircraft 2824 Aircraft manufacturing 2805 Photographic and scientific equipment 2831,2,9 Photographic and scientific equipment
Manufacturing 2806 Electronic equipment 2841,2,9 Electronic equipment manufacturing 2807 Household appliances 2851 Household appliance manufacturing 2808 Other electrical equipment 2852 Electric cable and wire manufacturing 2853 Battery manufacturing 2854 Electric light and sign manufacturing 2859 Electric equipment manufacturing n.e.c. 2809 Agricultural, mining and construction
machinery, lifting and material handling equipment
2861 2862 2865
Agricultural machinery manufacturing Mining and construction machinery manufacturing Lifting and material handling equipment Manufacturing
2810 Other machinery and equipment 2863 Food processing machinery manufacturing 2864 Machine tool and part manufacturing 2866 Pump and compressor manufacturing 2867 Commercial space heating and cooling equipment
Manufacturing 2869 Industrial machinery and equipment manufacturing
n.e.c. 18 Miscellaneous manufacturing 2901 Prefabricated buildings 2911,9 Prefabricated building manufacturing 2902 Furniture 2921-3,9 Furniture manufacturing 2903 Other manufacturing 2941,2,9 Other manufacturing 19 Electricity supply, gas and water 3601 Electricity supply 3610 Electricity supply 3602 Gas supply 3620 Gas supply 3701 Water supply, sewerage and drainage
services 3701,2 Water supply, sewerage and drainage services
113

Input-Output Industry Classification Corresponding ANZSIC Industries Code Description Code Description 20 Residential building construction 4101 Residential building construction 4111 House construction 4112 Residential building construction n.e.c. 4210-59 (part) Construction trade services 21 Other construction 4102 Other construction 4113 Non-residential building construction 4121,2 Non-building construction 4210-59 (part) Construction trade services 22 Trade 4501 Wholesale trade 4511-4799 (part) Wholesale trade (other than repairs) 5101 Retail trade 5110-5329 (part) Retail Trade (other than repairs) 5401 Mechanical repairs 4611 (part) Farm and construction machinery wholesaling 5311 (part) Car retailing 5321 (part) Automotive fuel retailing 5322 Automotive electrical services 5323 Smash repairing 5329 Automotive repair and services n.e.c. 5402 Other repairs 4511-4799 part) Wholesale trade (repairs n.e.c.) 5261 Household equipment repair services (electrical) 5269 Household equipment repair services n.e.c. 5110-5329 (part) Retail trade (repairs n.e.c.) 23 Accommodation, cafes and restaurants 5701 Accommodation, cafes and
restaurants 5710 5720
Accommodation Pubs, taverns and bars
5730 Cafes and restaurants 5740 Clubs (hospitality) 24 Road transport 6101 Road transport 6110 Road freight transport 6121-3 Road passenger transport 25 Rail and pipeline transport 6201 Rail, pipeline and other transport 6200 Rail transport 6501,9 Other transport 26 Other transport 6301 6401
Water transport Air and space transport
6301-3 6401-3
Water transport Air and space transport
6601 Services to transport; storage 6611,9 Service to road transport 6621-3,9 Services to water transport 6630 Services to air transport 6641-4,9 Other services to transport 6701,9 Storage 27 Communication services 7101 Communication services 7111,2
7120 Postal and courier services Telecommunication services
28 Finance, property and business services 7301 Banking 7310 Central bank 7321 Banks 7302 Non-bank finance 7322 Building societies 7323 Credit unions 7324 Money market dealers 7329 Deposit taking financiers n.e.c. 7330 Other financiers 7340 Financial asset investors
114

Input-Output Industry Classification Corresponding ANZSIC Industries Code Description Code Description 28 Finance, property and business services cont. 7401 Insurance 7411,2 Life insurance and superannuation funds 7421,2 Other insurance 7501 Services to finance, investment
and insurance 7511,9 7520
Services to finance and investment Services to insurance
7702 Other property services 7712 Commercial property operators and developers 7720 Real estate agents 7730 Non-financial asset investors 7741-3 Machinery and equipment hiring and leasing 7801 7802
Scientific research, technical and computer services Legal, accounting, marketing and business management services
7810 7821-3,9 7831-4 7841,2 7851-5
Scientific research Technical services Computer services Legal and accounting services Marketing and business management services
7803 Other business services 7861-7,9 Other business services 29 Ownership of dwellings 7701 Ownership of dwelling 7711 Residential property operators 30 Government administration and defence 8101 Government administration 8111-3 Government administration 8120 Justice 8130 Foreign government representation 8201 Defence 8200 Defence 31 Education 8401 Education 8410 Preschool education 8421-4 School education 8431,2 Post school education 8440 Other education 32 Health and community services 8601 Health services 8611-3 Hospitals and nursing homes 8621-3 Medical and dental services 8631-6,9 Other health services 8640 Veterinary services 8701 Community services 8710
8721,2,9 Child care services Community care services
33 Cultural and recreational services 9101 Motion picture, radio and
television services 9111-3 9121,2
Film and video services Radio and television services
9201 Libraries, museums and the arts 9210 Libraries 9220 Museums 9301
Sport, gambling and recreational services
9231,9 9241,2 9251,2,9 9311,2,9 9321,2,9 9330
Parks and gardens Arts Services to the arts Sport Gambling services Other recreation services
34 Personal and other services 9501 Personal services 9511,9 Personal and household goods hiring 9521-6,9 Other personal services 9700 Private households employing staff 9601 Other services 9610 Religious organisations 9621,2,9 Interest groups 9631-4 Public order and safety services
115