eastmain · du quebec ("aemq ... subsequent to year‐end, eastmain completed a private...
TRANSCRIPT
EASTMAIN
Eastmain Resources Inc.
2015 Annual Report
Eastmain Resources Inc. – 2015 Annual Report

Letter to Shareholders
Our Company is focused on creating shareholder value through the exploration and discovery of ore deposits in the James Bay District of Québec, a province currently ranked by the Fraser Institute as the 8th most favorable jurisdiction in the world for mining. Eastmain is backed by quality projects, which include two very high‐grade gold deposits – Eau Claire and the Eastmain Mine; a Joint Venture with Goldcorp (Éléonore South) and nine district‐scale properties with geological settings indistinguishable from those hosting major mine camps elsewhere in the Canadian Shield. AEMQ – Discovery of the Year Award
In October 2015, Eastmain was selected by its peers to receive the Association de L'Exploration Minière du Quebec ("AEMQ") “Discovery of the Year Award.” This award was given to highlight the importance of the Eau Claire discovery and its potential effect on the exploration and development of mines within the province. The award recognizes the significance of management’s dedication and hard work, which have led to a better geological understanding of the Clearwater project, the expansion and delineation of its Eau Claire gold deposit and to new discoveries along the Eau Claire trend. Clearwater Project
The Clearwater project, host to the Eau Claire gold deposit, has the same geological ingredients observed at each of the major mining districts across the Canadian Shield and is marked by a belt‐scale system of gold mineralization, which has been traced for at least 40 kilometres (kms). Clearwater is located in the James Bay region of the Province of Québec, 350 kms north of Chibougamau and 15 kms east of Hydro Québec's EM‐1 power installation. Infrastructure includes a network of roads built by Hydro Québec to the doorstep of the project and a nearby commercial airport. Eau Claire is the 2nd highest grade undeveloped open pit gold resource in North America, within a short list of development‐track open pit projects containing more than 500,000 ounces of Measured and Indicated ("M&I") mineral resources at greater than 1.5 g/t. M&I near‐surface potentially open‐pit and ramp accessible resources at Eau Claire, as reported in April, 2015, increased by 53% to 6.8 million tonnes containing 885,000 ounces of gold at an exceptional grade of 4.05 g/t Au. The Eau Claire deposit has a significant footprint extending for 1.8 kilometres and has been traced to a vertical depth of 900 metres below surface. The top of the deposit is perched on a hill and exposed for a length of 200 metres. The vein system exposed at surface demonstrates good continuity and illustrates a number of the ore controls responsible for gold mineralization within the deposit. There is excellent potential to continue to add to Open Pit and Underground M&I mineral resources with additional drilling below and lateral to the conceptual pit shell. There is also significant potential for additional discoveries within the Eau Claire belt, where anomalous gold‐bearing rock samples have been defined along a key mineralized corridor for over 7.5 kms, and elsewhere on the 200‐square‐kilometre Clearwater property. A prime area for resource expansion extends for more than a kilometre around current M&I mineral resources. The most recent drill campaign confirmed both high grades and attractive thicknesses within this target area. Potential for additional resources has also been demonstrated by hundreds of gold‐bearing samples detected well outside the limits of the deposit. There is no better time for continued exploration than the present. Drilling costs over the past two decades have never been more attractive than they are now and we intend to take advantage of this opportunity to de‐risk the project through significant drilling campaigns. These campaigns will not only continue to improve our understanding of the controls on gold mineralization, but will expand current resources and provide the confidence to move Inferred Mineral Resources to Measured and Indicated.
A preliminary economic assessment (PEA) of the Eau Claire gold deposit is currently in progress as the first step in transitioning our advanced exploration project towards potential development. Definition drilling within the 450 West Zone of Eau Claire has defined a potential critical mass between 100 and 300 metres below surface that may be amenable to future ramp access. Initial PEA work is evaluating the potential of a combined open pit and underground ramp mining scenario. Exploring Opportunities
There is also significant opportunity to add shareholder value through other project assets held by the Company. As infrastructure in the far north improves, our projects are becoming more accessible, and with renewed interest in the region, offer discovery leverage through possible joint venture opportunities. Recent competitor activity in the Éléonore District may also generate a revitalization of exploration activity on our Éléonore South joint venture, while improved road access to the Ruby Hill East and Eastmain Mine properties facilitates continued exploration of those projects as well. Building the Team
As we transition the Company beyond a pure grassroots exploration play, we’re expanding our operational services network and fortifying the Board of Directors with additional development and production experience. Together with the Advisory Board, our enhanced Board of Directors will direct and support management with Clearwater’s transition from an advanced exploration project towards development. Dr. Laurie Curtis, non‐executive Chairman of the Board, with capital markets experience, and a highly technical and operationally oriented group, consisting of David Joyce, Claude Lemasson and Michael Hoffman, as non‐executive members of the Technical Committee, are overseeing the Company’s business strategy and development process. Eastmain is building for tomorrow, today as we prepare for the challenges of future development. We extend our gratitude to Dr. John Hansuld, a member of the Canadian Mining Hall of Fame for serving as a director of Eastmain since 1986. Dr. Hansuld will join Mr. Serge Bureau and Dr. Ted Moses on our Advisory Board. And we remember the contributions of those dear friends who passed away this year. Mr. Ian Bryans served as a director from 2006 to 2015 and Dr. Richard W. Hutchinson, also a member of the Canadian Mining Hall of Fame served as a director and mining advisor to the Company from 1995 to 2016. Both dedicated supporters and diligent directors of the Company, they are greatly missed by all who knew and worked with them.
Financials
As of October 31, 2015 the Company had current assets of $4.57 million to settle current liabilities of $1.07 million. Subsequent to year‐end, Eastmain completed a private placement to raise gross proceeds of $0.44 million with no warrants or commissions. The Company has no debt.
As of October 31, 2015 there were 133.0 million shares issued with a market capitalization of $49.2 million. There were no warrants outstanding and 7.6 million options at an average exercise price of $0.69 per share.
Net exploration expenditures for the period ending October 31, 2015 of $2.25 million were principally allocated to Clearwater and Eastmain Mine. $1.91 million in exploration rebates were received by the Company from the Province of Quebec.
The financial statements contained in the Annual Report were prepared by management in accordance to generally acceptable accounting principles. The financial information contained elsewhere in the Annual Report conforms to the financial statements. The Auditor has the responsibility of auditing the financial statements and giving an opinion on them.
Future Outlook
The recent rally in gold price has triggered a sense of cautious optimism throughout the sector not seen for the past several years. Foreign exchange rates also currently benefit Canadian deposits with a 35% lift in gold values. As we focus on establishing Eau Claire as a high‐grade gold deposit that will support a profitable, stand‐alone, 10‐year mining operation, there is ample opportunity for continued deposit expansion. Critical value drivers at Eau Claire are grade, growth, geology and gold price. As producers realign their businesses to be successful in low‐price environments, they are grasping the need for quality ounces over quantity. High‐grade deposits, like Eau Claire, in mining‐friendly jurisdictions become much more interesting prospective acquisitions. Back‐to‐basics strategies, which allow companies to grow and to better understand the geological controls on their deposits, will become the norm again in de‐risking future production scenarios. Optimization of gold grades and operational costs will be key to long‐term achievements for future development projects. With these factors in mind, the future outlook of our Company is bright.
On behalf of management and the Board of Directors, I would like to extend our appreciation and thanks to our all of our loyal shareholders and supporters, who share our enthusiasm and optimism for the potential growth of the Company.
I’d also like to extend my personal thanks to our directors, partners, our growing team of employees, and the many service providers, contractors, and advisors for their time, effort and contributions, towards achieving our ultimate goals.
Donald J. Robinson, Ph.D., P.Geo President and CEO January 29, 2016
All scientific and technical data disclosed in this report has been prepared under the supervision of, and verified by Dr. Donald J. Robinson, a “qualified person” within the meaning of National Instrument 43‐101.
For further details on the properties of the Corporation, please refer to the 2015 Annual Information Form available on SEDAR at www.sedar.com . Forward Looking Statements – Certain information set forth in this news release may contain forward-looking statements that involve substantial known and unknown risks and uncertainties, including statements with respect to the development plans and growth targets of the Company. Forward-looking statements consist of statements that are not purely historical, including statements regarding beliefs, plans, expectations or timing of future plans, and include, but not limited to, statements with respect to the timing of completion of the PEA, commencement of the PFS and/or DFS, actual results of current and future exploration activities at the Company’s properties, future developments in the Company’s relationship with indigenous groups, and the potential success of the Company’s future exploration and development strategies. These forward-looking statements are subject to numerous risks and uncertainties, certain of which are beyond the control of Eastmain, including, but not limited to the impact of general economic conditions, industry conditions, dependence upon regulatory approvals, the availability of financing, timely completion of the PEA and any PFS and/or DFS as applicable, and risks associated with the exploration, development and mining industry generally such as economic factors as they affect exploration, future commodity prices, changes in interest rates, safety and security, political, social or economic developments, environmental risks, insurance risks, capital expenditures, operating or technical difficulties in connection with development activities, personnel relations, the speculative nature of gold exploration and development, including the risks of diminishing quantities of grades of Mineral Resources, contests over property title, and changes in project parameters as plans continue to be refined. Readers are cautioned that the assumptions used in the preparation of such information, although considered reasonable at the time of preparation, may prove to be imprecise and, as such, undue reliance should not be placed on forward-looking statements. The Company assumes no obligation to update such information, except as may be required by law.

Management Discussion and Analysis Eastmain Resources Inc.
EASTMAIN RESOURCES INC.
MANAGEMENT’S DISCUSSION AND ANALYSIS – YEAR ENDED OCTOBER 31, 2015
General
The following management’s discussion and analysis (“MD&A”) of the financial condition and results of the operations of Eastmain Resources Inc. (“Eastmain” or the “Company”) constitutes management’s review of the factors that affected the Company’s financial and operating performance for the year ended October 31, 2015. This MD&A has been prepared in compliance with the requirements of National Instrument 51-102 – Continuous Disclosure Obligations. This discussion should be read in conjunction with the Company’s audited consolidated financial statements for the year ended October 31, 2015 together with the notes thereto, which were prepared in accordance with International Financial Reporting Standards “IFRS”. All amounts in the financial statements and this discussion are expressed in Canadian dollars, unless otherwise stated. In the opinion of management, all adjustments (which consist only of normal recurring adjustments) considered necessary for a fair presentation have been included. The results for the periods presented are not necessarily indicative of the results that may be expected for any future period. Information contained herein is presented as at January 26, 2016 unless otherwise indicated.
For the purposes of preparing this MD&A, management, in conjunction with the Board of Directors, considers the materiality of information. Information is considered material if: (i) such information results in, or would reasonably be expected to result in, a significant change in the market price or value of Eastmain common shares; (ii) there is a substantial likelihood that a reasonable investor would consider it important in making an investment decision; (iii) it would significantly alter the total mix of information available to investors. Management, in conjunction with the Board of Directors, evaluates materiality with reference to all relevant circumstances, including potential market sensitivity.
Financial Statements are available at www.sedar.com and the Company’s website www.eastmain.com.
All statements, other than historical facts, included herein, including without limitation, statements regarding potential mineralization, resources, exploration results and future plans and objectives of the Company are forward-looking statements and involve various risks and uncertainties. There can be no assurance that such statements will prove to be accurate, and actual results and future events could differ materially from those anticipated. Factors which may cause actual results and events to differ materially from those anticipated include, but are not limited to: actual results of mineral exploration and development; availability of financing; changes in applicable regulations; mineral value; equity market fluctuations; and cost and supply of materials. Other risk factors may include: general business, economic, competitive, political and social uncertainties; reliability of resource estimates; the actual results of current exploration activities; actual results of reclamation activities; conclusions of economic evaluations; fluctuations in the value of Canadian and United States dollars relative to each other; changes in project parameters as plans continue to be refined; changes in labour costs or other costs of production; future prices of gold and other metal prices; possible variations of mineral grade or recovery rates; failure of plant, equipment or processes to operate as anticipated; accidents, labour disputes and other risks of the mining industry, including but not limited to environmental hazards, cave-ins, pit-wall failures, flooding, rock bursts and other acts of God or unfavourable operating conditions and losses; political instability, insurrection or war; delays in obtaining governmental approvals or financing or in the completion of development or construction activities; and the factors discussed in the section entitled “Risk Factors” of the Annual Information Form filed under the Company’s profile on www.sedar.com.
This management’s discussion and analysis is dated January 26, 2016.
Company Overview
The Company, incorporated under the laws of Ontario, and its wholly-owned subsidiary Eastmain Mines Inc., are engaged in the exploration of metallic mineral resource properties within Canada.
The Company’s primary focus is exploration for precious metals in the Eastmain/Opinaca area of James Bay, Québec, a relatively under-explored region that comprises several Archean greenstone belts – rock assemblages responsible for most of the world’s gold supplies. The James Bay region is one of North America’s newest gold districts. Here, the Company holds 100% interest in two high-grade gold deposits – Eau Claire and the Eastmain Mine – and holds approximately 38.70% interest in, and manages exploration of, the Éléonore South project, a mineral exploration joint arrangement, located immediately south of Goldcorp Inc.'s (“Goldcorp”) Éléonore Project, which hosts the Roberto gold deposit. The Company also holds several high-potential exploration properties covering approximately 1000 km2 of this new and fertile mining district.
Significant Events
• Mineral Resource update for Eau Claire confirms Measured and Indicated (M&I) Open Pit resources increased by 53% to 885,000 ounces of gold within 6.8 M tonnes at an average grade of 4.05 g/t Au (1);
• Eau Claire Gold Deposit – One of the highest-grade undeveloped Open Pit M&I gold resources in North America;
• Total M&I gold resource at Eau Claire increased to 951,000 ounces of gold contained within 7.2 M tonnes at an average grade of 4.09 g/t Au(1);
Management Discussion and Analysis Eastmain Resources Inc.
- 2 -
• Measured Open Pit Gold resource grade at Eau Claire increased to 7.29 g/t Au – includes 227,000 ounces of gold contained within 0.97 M tonnes(1);
• G Mining Inc. contracted to initiate a Preliminary Economic Assessment for Eau Claire;
• Option agreement with Darnley Bay Resources Limited funds wholly-owned Lac Lessard Project;
• Drill-tested 10 PGM-Nickel-Copper anomalies at Lac Lessard – initial results include 12.5-metres of 0.38% nickel (Ni) and 0.13% copper (Cu), with semi-massive sulphides at bottom of interval grading 1.08% Ni and 0.31% Cu over 2.5 metres;
• Eastmain awarded the "Discovery of the Year 2015" by the Association de L'Exploration Minière du Quebec ("AEMQ");
• Dr. Laurie Curtis appointed Chairman of the Board and Director of the Corporation;
• Mr. Claude Lemasson appointed Director of the Corporation and Chair of the Technical Committee;
• 29 drill holes totalling 12,837 metres completed at Eau Claire – focused on expanding Measured & Indicated Open Pit and Ramp Accessible Underground gold resources;
• December 2015 private placement with single Quebec Institution raised $440,000 at significant premium to market with no warrants or commissions;
• Received $766,355 in Mining Duties plus interest for 2014 exploration work in January 2016; and
• Eastmain share performance over the last year has outperformed both the gold sector and peer group.
(1) Results from NI43-101 compliant Mineral Resource update completed by SRK Consulting (Canada) Inc. in April of 2015 (see also 2015 Mineral Resource Statement, page 3). By definition, Mineral Resources are a preliminary estimation only and do not
demonstrate economic viability.
Exploration and Evaluation Activities
Clearwater
Eastmain Resources Inc. owns 100% interest in the Clearwater Property, host to Eau Claire, one of five known gold deposits in the James Bay region of Québec. With ready access and nearby infrastructure in the form of permanent roads and power, Clearwater is superbly located for potential future development. The project is situated approximately 800 kilometres (kms) north of Montréal, 80 kms north of a commercial airport at Nemiscau and less than 10 kms northeast of Hydro Québec's EM-1 complex. With Goldcorp's Eleonore Mine, located only 50 kms geographically north of Clearwater, the James Bay region has become one of the newest gold producing districts in Canada.
The Clearwater Project covers about 200 km2 of Archean geology similar to that underlying many of the major mining camps within the Canadian Shield. The Eau Claire gold deposit is situated at the western end of the property 2.5 kms from Hydro Québec's road network and approximately 18 kms from an existing substation at one of the world's largest hydro-electric power installations. Fuel is delivered to the project by tanker truck and year-round access to the 30-person base camp is facilitated via drill roads five kms from the permanent road network.
Our objective is to establish Eau Claire as a high-grade gold resource that would support a profitable, stand-alone mining operation for a minimum ten-year mine life, based on prevailing metal prices. Over the last few years, Eastmain has focused not only on expanding and defining gold resources potentially amenable to extraction by open pit and underground methods, but also on the discovery of additional resources elsewhere on the property.
Eau Claire Gold Deposit
As at April 27, 2015 (News Release), the Eau Claire Deposit hosts a combined Measured and Indicated (M&I) Resource of 7.2 M tonnes at an average grade of 4.09 g/t gold containing 951,000 ounces of gold, plus an additional 5.1 M tonnes at an average grade of 3.88 g/t gold, classified as Inferred Resources, containing 633,000 ounces of gold(1) .
Eau Claire is one of the highest-grade undeveloped open pit gold deposits in North America. The block model M&I open pit resources at Eau Claire increased by 53% over the previous resource estimate to 885,000 ounces at 4.05 g/t Au, contained within 6.8 M tonnes. Measured open pit resources include 227,000 ounces at 7.29 g/t Au within 0.97 M tonnes (see also 2015 Mineral Resource Statement).
Management Discussion and Analysis Eastmain Resources Inc.
- 3 -
Eau Claire is a structurally-controlled gold deposit consisting of multiple en-echelon, sheeted quartz-tourmaline veins and altered rock, forming two distinctly oriented vein sets known as the 450 and 850 West Zones. These sectors coincide with major structural shear zones, near a mafic/felsic volcaniclastic rock contact, to form a crescent-shaped body covering a footprint that is over 100 metres wide, extends for about 1.8 kilometres in length, and has, to date, been traced to a vertical depth in excess of 900 metres. Portions of the 450 & 850 West Zones outcrop on topographic highs. The 450 West Zone vein set is oriented at N 85oE, dips 45 to 60o south and plunges steeply to the southeast, sub-parallel to an F2 fold axis. The 850 West Zone vein set is aligned N 60oE, dips sub-vertically and plunges gently southwest.
Polyphase gold mineralization evident throughout the Eau Claire deposit includes: early-stage, gold-rich stratabound schist units, which are generally lower grade, but when crosscut by other gold-bearing structures can often exceed 10 g/t across widths of in excess of 10 metres; high-grade laminated quartz-tourmaline feeder veins, ranging from 10 to more than 100 grams gold per tonne in 0.5- to 10-metre-wide intervals (approximately 2.0 metres on average), which infill deep-seated east-west trending gold-bearing hydrothermal structures; and later cross-cutting and extensional, gold-rich veins and gashes within both laminated east-west veins and schist zones.
Distinct rock alteration associated with gold mineralization, consisting of actinolite-tourmaline-biotite-carbonate can often create wide zones of lower-grade gold mineralization ranging from 0.5 to 10 grams per tonne over thicknesses of 5.0 to 25 metres. Both veins and alteration zones contain finely disseminated particles of free gold, tellurides and bismuth minerals.
Mineral Resources
Mineral Resources are only a preliminary estimation, through exploration and sampling, of a concentration of material of intrinsic economic interest, which has been identified in such form, grade, quality and quantity that may have reasonable prospects for eventual economic extraction. Mineral Resources do not demonstrate economic viability, but are the first step in the process to establishing potential economic viability. Both the quality and quantity of Mineral Resources may subsequently be re-defined and re-estimated, through additional consideration and the application of several de-risking modifying factors during preliminary economic assessment, to potentially minable mineral resources. These resources are in turn, after the application of additional modifying mining and economic factors during pre-feasibility and feasibility studies, further de-risked to an estimation of Mineral Reserves, which demonstrate that, at the time of these advanced studies, economic extraction could reasonably be justified.
2015 Mineral Resource Statement
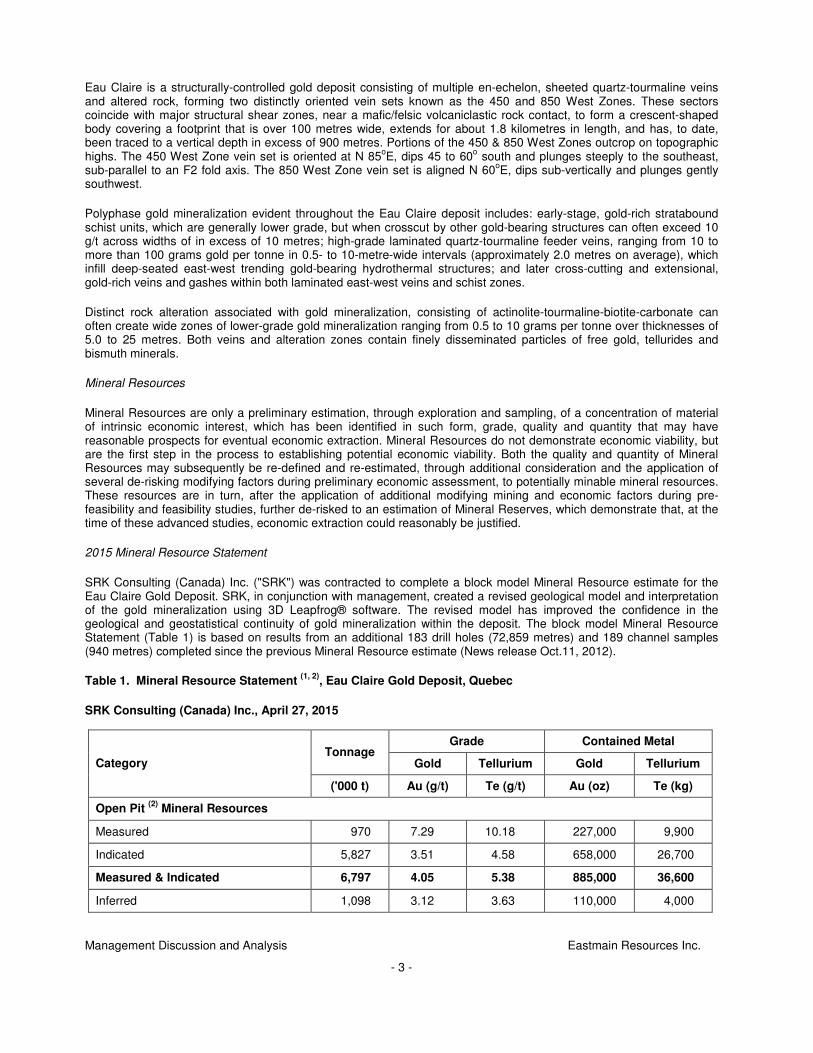
SRK Consulting (Canada) Inc. ("SRK") was contracted to complete a block model Mineral Resource estimate for the Eau Claire Gold Deposit. SRK, in conjunction with management, created a revised geological model and interpretation of the gold mineralization using 3D Leapfrog® software. The revised model has improved the confidence in the geological and geostatistical continuity of gold mineralization within the deposit. The block model Mineral Resource Statement (Table 1) is based on results from an additional 183 drill holes (72,859 metres) and 189 channel samples (940 metres) completed since the previous Mineral Resource estimate (News release Oct.11, 2012).
Table 1. Mineral Resource Statement (1, 2), Eau Claire Gold Deposit, Quebec
SRK Consulting (Canada) Inc., April 27, 2015
Grade Contained Metal Tonnage
Gold Tellurium Gold Tellurium Category
('000 t) Au (g/t) Te (g/t) Au (oz) Te (kg)
Open Pit (2) Mineral Resources
Measured 970 7.29 10.18 227,000 9,900
Indicated 5,827 3.51 4.58 658,000 26,700
Measured & Indicated 6,797 4.05 5.38 885,000 36,600
Inferred 1,098 3.12 3.63 110,000 4,000

Management Discussion and Analysis Eastmain Resources Inc.
- 4 -
Notes:
1. Mineral resources are not mineral reserves and as such have not demonstrated economic viability. All figures are rounded to reflect the relative accuracy of the estimate. Composites have been capped where appropriate.
2. Open pit mineral resources are reported at a cut-off grade of 0.5 g/t gold within a conceptual pit shell and underground mineral resources are reported at a cut-off grade of 2.5 g/t gold outside the conceptual pit shell. Cut-off grades are based on a gold price of US$1300 per ounce, a foreign exchange of US$0.90 to C$1.00 and a gold recovery of 95%. The value of tellurium has not been considered.
2015 Exploration
The 2015 field program included drilling, infill core sampling, prospecting and channel sampling of pre-stripped trench areas along a corridor lateral to the Eau Claire gold deposit. Exploration activity focused on expanding near-surface measured and indicated gold resources within Eau Claire, was combined with targeting potential open-pit satellite resources well outside the limits of the deposit.
29 HQ drill holes, for a total of 12,837 metres of definition drilling, were completed on the upper portion of the Eau Claire gold deposit. Assay data received to date confirms 45 gold-bearing intervals ranging from 0.50 to 25.6 grams gold per tonne over widths ranging from 2.0 to 11.5 metres. Assay intervals exceeding the cut-off grade for underground resources contain an average grade of 8.78 grams gold per tonne over an average width of 2.78 metres.
Significant Assay Intercepts include:
● 10.4 g/t Au over 2.0 m (Hole 553) ● 9.35 g/t Au over 3.0 m (Hole 556) ● 15.8 g/t Au over 2.0 m (Hole 557) ● 25.6 g/t Au over 2.0 m (Hole 561) ● 5.98 g/t Au over 4.5 m (Hole 566) ● 24.8 g/t Au over 2.0 m (Hole 568) ● 20.4 g/t Au over 3.0 m (Hole 570) ● 6.20 g/t Au over 5.5 m (Hole 572)
The 2015 program confirmed the continuation of gold mineralization lateral to the current Measured and Indicated Mineral Resources at Eau Claire. Multiple half-metre-wide quartz-tourmaline vein intersections contain very-fine-grained visible gold ranging in grade from 24.5 to 98.8 grams gold per tonne.
Grade Contained Metal Tonnage
Gold Tellurium Gold Tellurium Category
('000 t) Au (g/t) Te (g/t) Au (oz) Te (kg)
Underground (2) Mineral Resources
Measured - - - - -
Indicated 428 4.78 6.07 66,000 2,600
Measured & Indicated 428 4.78 6.07 66,000 2,600
Inferred 3,974 4.09 3.12 523,000 12,400
Combined Mineral Resources
Measured 970 7.29 10.18 227,000 9,900
Indicated 6,255 3.60 4.68 724,000 29,300
Measured & Indicated 7,225 4.09 5.42 951,000 39,200
Inferred 5,072 3.88 3.23 633,000 16,400

Management Discussion and Analysis Eastmain Resources Inc.
- 5 -
A number of drill holes from this recent drilling campaign also intersected copper-gold-silver mineralization, ranging from 2.0 to 11.5 metres in width, within the upper portion of the Eau Claire deposit. Composite intervals of this sulphide zone range in grade from 0.10 to 1.50 grams gold (Au) per tonne, 7.0 to 16.4 grams silver (Ag) per tonne and 0.40 to 1.5% copper (Cu). This Cu-Au-Ag zone is hosted by highly altered felsic volcaniclastic rocks containing disseminated chalcopyrite-pyrite-pyrrhotite, similar in nature to rocks hosting massive sulphide deposits found in Timmins and Noranda. The Cu-Au-Ag metal signature of this zone is also metallogenically similar to host mineralization at the Eastmain Mine gold deposit, and may have the potential to contribute to future mineable resources at Clearwater. Infill Core Sampling
Infill sampling of historical near-surface drill holes from within the 450 West Zone confirmed a high-grade interval from hole 131, which assayed 6.65 grams per tonne (g/t) Au over 5.0 metres, in the JQ Vein at a depth of 66.0 metres. When combined with assay results from the adjacent P Vein, the intersection provides a composite interval grading 6.75 g/t Au across 13.8 metres, lying within the potential 450 West Zone open pit. 1,438 infill core samples were taken during the 2015 exploration program.
Trenching and Channel Sampling
There is a prospective corridor for discovery of additional gold resources straddling the favourable structural break lateral to Eau Claire. Channel sampling of comparable host lithologies two kilometres east of Eau Claire, within the SNL area, has exposed a potential open-pit resource target. Anomalous gold, detected in 124 channel samples taken along a newly discovered vein structure, ranges from 0.50 to 5.91 g/t Au, with an average grade of 1.07 g/t Au. Previous sampling of what may now be an extension of this vein structure to the east, returned values of up to 20.1 g/t Au over a two-metre interval (including 67.9 g/t Au over a half-metre). The SNL target covers an area approximately 850 metres long by 220 metres wide.
Preliminary Economic Assessment
G Mining Inc. was contracted to perform a preliminary economic assessment ("PEA") of the Eau Claire gold deposit. The scope of services for the PEA will include open-pit and underground mine engineering and design, metallurgical and processing studies, environmental and social impact studies, a review of infrastructure requirements and preliminary economic modeling and analysis. As part of the PEA a series of optimization tests are being performed.
A preliminary phase-one $1.5 M exploration program has been budgeted for 2016. The principal objectives include completion of the PEA, optimization studies of grade parameters and ongoing expansion of gold resources through drilling.
The Company’s net investment in the Clearwater project to October 31, 2015 is $41.4 million.
Eastmain Mine
The Company owns 100% interest in Eastmain Mine property, which comprises 152 mineral claims located in the Upper Eastmain River Greenstone Belt of James Bay, Québec. The Eastmain Mine project, which hosts the Eastmain gold deposit, a copper-gold-silver, sulphide-rich deposit, consisting of three high-grade, gold-rich zones known as the, “A”, “B” and “C” Zones, contains historical resources of 255,750 ounces of gold(2). The project is in the target-definition and drilling stages of exploration. The Company’s exploration focus at Eastmain is the expansion of known resources and discovery of a second deposit along a regionally extensive 10-kilometre-long mine trend. The project includes a 100-person camp, equipment, buildings, underground generators, fuel farm, fully-functioning airstrip, tailings pond, underground ramp access and underground mine workings.
The Québec government's Plan Nord infrastructure program now provides permanent road access to the Eastmain Mine property north from the communities of Chibougamau and Mistissini. This new infrastructure substantially reduces costs, improves project logistics and has stimulated exploration in the region.
(2) These resources are historical estimates and should not be relied upon. These estimates may not be NI43-101 compliant. A qualified
person for Eastmain has not done sufficient work to classify the historical estimates as current mineral resources as defined by NI43-
101.

Management Discussion and Analysis Eastmain Resources Inc.
- 6 -
Previous Exploration
Previous exploration of the property has confirmed surface copper-gold-silver mineralization in rocks and soils within the key mine horizon extending four kilometres northwest from the Eastmain Mine Gold Deposit. Four well-defined targets displaying the Eastmain Mine metal signature returned assays from 0.5 to 125 g/t Au, 0.5 to 28g/t Ag and 0.1 to 3% Cu in rock outcrops occurring in what appears to be a regular periodicity both within the extension of the mine sequence and along a secondary parallel structure.
Surface trenching and drilling are recommended as the next steps in the search for additional gold resources at Eastmain Mine. A $500,000 trenching program is proposed for 2016.
The Company’s net investment in the Eastmain Mine project to October 31, 2015 is $13.6 million.
Ruby Hill
The Company holds 100% interest in certain mineral properties comprising the Ruby Hill project, located within the Upper Eastmain River Greenstone Belt of Northern Québec. The project, which consists of two separate claim blocks, referred to as the Ruby Hill East and Ruby Hill West blocks, covers approximately 10,600 hectares of prospective geology similar to the key mine horizon at the Eastmain Mine gold deposit.
The Ruby Hill East block is immediately east of and contiguous with the Eastmain Mine property and covers what has been interpreted as a geological fold repetition of the key mine horizon. This claim block straddles a regional stratigraphic and structural break – a prime target location for ore deposits. The new Route 167 extension bisects the Ruby Hill East block, providing additional access for exploration along the favourable mine trend.
Ruby Hill West straddles the western limb of the Upper Eastmain River Greenstone Belt, approximately 30 kms west of the Eastmain Mine deposit, in a similar geologic setting. Access to the Ruby Hill West block is via helicopter.
Previous exploration successfully identified several new mineralized targets, each having a similar Au-Ag-Cu signature to the Eastmain Mine Gold Deposit, on both Ruby Hill properties. Anomalous assays of up to 3.1 g/t Au, 3.4 g/t Ag and 0.04% Cu occur in cherty iron formation within mafic volcanic units, near an interpreted structural break at Ruby Hill West, while anomalous gold values of up to 1.65 g/t gold were also detected within cherty units on Ruby Hill East.
In 2015, DIAGNOS Inc. conducted a regional CARDS (Computer Aided Resource Detection System) analysis over the Ruby Hill property areas to create the Eastmain Mine gold signature and to develop similar gold targets. Four separate models of CARDS analysis generated 15 untested gold exploration targets over the Ruby Hill properties – four along the north part of Ruby Hill East and 11 along the northwest flank of Ruby Hill West. Follow-up mapping and prospecting of these target areas is the next phase of work proposed for Ruby Hill.
The Company’s net investment in the Ruby Hill project as at October 31, 2015 is recorded as $nil. In accordance with IFRS standards, the Company recorded impairment charges of $2.7 million on Ruby Hill in 2014 to reflect the current drop in mineral prices and the subsequent affect on the Company’s share price and market capitalization. As such, expenditures of $83,945 incurred during fiscal 2015 have been written-off until such time as economic conditions permit a reversal of the impairment (Note 9 to the audited consolidated financial statements).
Lac Lessard
The Company holds 100% interest in the Lac Lessard property, located 15 kms northeast of the Eastmain Mine project. The property consists of forty-seven claims in one claim block covering 2,475 hectares. Previous airborne VTEM and magnetic surveys indicated that a large portion of the property is underlain by the Crete-du-Coq ultramafic intrusion, a prospective host to nickel, copper, Platinum Group Metals and gold (Ni-Cu-PGM-Au).
The project is under option to Darnley Bay Resources ("DBL"), whereby DBL can earn 50% interest in the project in exchange for $2.5 M in exploration expenditures over a four-year period, annual cash payments of $50,000 and the issuance of 1.6 million DBL common shares to Eastmain. The 2015 exploration program was funded by DBL and managed by Eastmain.
Eleven drill holes, totalling 1,995 metres, testing 10 VTEM targets were completed. Nine drill holes intersected the Crete-du-Coq ultramafic intrusion. Drill hole LL15-02 intersected disseminated sulphides over a 12.5-metre interval assaying 0.38% nickel and 0.13% copper. Semi-massive sulphides intersected at the bottom of this interval contain

Management Discussion and Analysis Eastmain Resources Inc.
- 7 -
1.08% nickel and 0.31% copper over a length of 2.5 metres. A five-metre interval of disseminated nickel sulphides containing 0.41% nickel and 0.09% copper was also intersected 126.0 metres down the hole.
Due to current market conditions DBL has requested an extension in time for the second-year cash payment and required work commitments. The Company’s net investment in the Lac Lessard project to October 31, 2015 is $0.21 million.
Éléonore South
Éléonore South, an exploration-drilling-stage project, is located adjacent to Goldcorp Inc.'s multi-million-ounce Roberto gold deposit (Éléonore project), in the Opinaca geologic Subprovince of James Bay, Québec. Jointly held by Eastmain (38.7%), Azimut Exploration Inc. (22.61%), and Les Mines Opinaca Ltée. (38.69%), a wholly-owned subsidiary of Goldcorp Inc., the property consists of 282 mining claims covering 147 km2 of prospective land, contiguous with and underlain by the same rock formations as those found on Goldcorp’s mine property.
Éléonore mine geology is interpreted to extend onto the Éléonore South property. The property covers a very large area, with very little rock exposure and no record of exploration prior to our first phase of work. Eastmain’s discovery of the JT Gold occurrence returned assays of up to 5.3 g/t gold across 8.0 metres and 10.9 g/t Au over three metres. Subsequent drilling conducted by the Company delineated a kilometre-long, stacked horizon of metamorphosed sediments and intrusive rocks, similar to those found at Éléonore, containing anomalous gold, arsenic and antimony mineralization, the signature metal suite at Éléonore.
The Company recorded an impairment charge on this project in the amount of $4.9 million in 2014. As such, the Company’s expenditures in the project of $9,867 incurred during fiscal 2015, have been written-off until such time as economic conditions permit a reversal of the impairment (Note 9 to the audited consolidated financial statements). As at October 31, 2015, the Company’s net investment in the project has been recorded as $ nil.
Reservoir
The Company holds 100% interest in the Reservoir property, which comprises 156 claims, covering approximately 8,099 hectares, located in the Eastmain-Opinaca district of James Bay, Québec, approximately 60 kilometres southwest of Goldcorp’s Roberto deposit and approximately 45 kilometres west of the Eau Claire gold deposit. This project hosts a large copper-gold occurrence in albite-altered volcanic-sedimentary rocks, similar to those hosting multi-million-ounce past producing gold mines in Timmins, Ontario.
Reservoir straddles the regional structural/stratigraphic break dividing volcanic and sedimentary domains. This break represents an important ore localizing event throughout the region. Previous trenching and drilling confirmed there is a significant kilometric-scale mineralizing system at Reservoir.
As at October 31, 2014 the Company recorded an impairment charge for this project of $1.5 million, and as such, any expenditure incurred on the project during fiscal 2015 has been written-off until such time as economic conditions permit a reversal of the impairment (Note 9 to the audited consolidated financial statements). Accordingly, the Company’s investment in Reservoir as at October 2015 is $ nil.
Lac Hudson
The Company holds 100% interest in Lac Hudson. The Lac Hudson project is located immediately south of the Reservoir Project within the central part of the Eastmain River Greenstone Belt, 35 kms west of Clearwater. The property consists of 187 claims covering 9,682 hectares underlain by volcanic and sedimentary rocks containing sulphide facies iron formation and chemical exhalatives. Several local concentrations of gold and base metals have been detected in iron formation on the property. Previous drilling intersected up to 15.2 g/t gold and 22.3 g/t silver. This early-stage exploration project is prospective for a sedimentary- or volcanic-hosted gold deposit.
Previous work included a desk-top structural interpretation by SRK based on detailed high-resolution airborne magnetic survey data. SRK’s work delineated a regional crustal-scale "D2" structure which bisects the property. This feature is thought to be a regional extension of the same crustal structure found spatially associated with the Eau Claire gold deposit at Clearwater. Future prospecting and geological targeting are planned once market conditions improve.
The Company’s investment in the project to October 31, 2015 is $0.95 million.
Radisson
The Company owns 100% interest Radisson. The Radisson property comprises 207 mineral claims covering approximately 10,698 hectares located within the La Grande Greenstone Belt district of James Bay, Québec. The

Management Discussion and Analysis Eastmain Resources Inc.
- 8 -
property straddles a similarly-aged structural and stratigraphic setting, near a break between complex volcanic and sedimentary rocks, to the setting at Goldcorp’s Roberto Gold deposit. Historic gold discovered within well-developed iron formations on the property suggests that Radisson may also be prospective for Lupin-style (Northwest Territories) gold mineralization.
Honey Badger Exploration Inc. (HBE) had an option to earn a 50% interest in the Radisson project, in exchange for a cash payment of $50,000, issuance of 5 million common shares of HBE to Eastmain and work expenditure commitments of $2.5 million. Honey Badger dropped the option in 2014 as it was unable to raise exploration funds and would therefore not be able to fulfill its obligations with respect to the option agreement.
The Company’s net investment in the project as at October 31, 2015 is $ nil. The Company recorded an impairment charge on this project in the amount of $0.2 million in 2014. Accordingly, expenditures associated with claims maintenance incurred during fiscal 2015 have been written-down (Note 9 to the audited consolidated financial statements). However, as market conditions improve impairment charges may be reversed.
Road King
The wholly-owned Road King project, which is in the very early stages of exploration, is located within the Eastmain/Opinaca district, 85 kms west of the Roberto gold deposit. Similar to Roberto, this 108-claim property straddles the major structural and stratigraphic break between the Eastmain Greenstone Belt and Opinaca sedimentary rocks. The property is also accessible from the LG2 highway. Although the property has been covered by airborne geophysics as well as regional, widely-spaced soil geochemical surveys and minimal prospecting, none of the priority areas have been tested. Additional exploration is warranted.
The Company’s investment in the project to October 31, 2015 is $0.3 million.
Lac Elmer
The Lac Elmer project is located at the western end of the Eastmain River Greenstone Belt approximately 35 kms west of the LG2 highway and roughly 80 kms west of the Reservoir property. The property consists of 178 claims covering 9,379 hectares. Lac Elmer is in the target definition and drilling stages of exploration. Lac Elmer is underlain by a major felsic volcanic centre and characterized by a widespread, highly-altered mineralized horizon that geologically resembles the multi-million-ounce Hemlo gold mine in Northern Ontario and the La Ronde gold deposit located in Val d'Or, Québec. The property hosts a kilometric-sized, intensely-sericite-silica-altered mineralized horizon, enriched in silver-gold-copper and zinc. Previous exploration detected multi-ounce silver and ounce-level gold assays in surface showings and up to 50 g/t silver and 0.5 g/t gold across 30 metres in drilling within felsic volcanics. A second property-scale target includes quartz veins in sheared gabbro/mafic volcanic rocks and quartz-ankerite stockwork in biotite-rich diorite, which returned assays of up to 42 g/t and 102 g/t gold respectively. This target has not been trenched or drilled and warrants additional exploration. The Company’s investment in the project to October 31, 2015 is $0.8 million.
Lidge
The Company holds 100% interest in Lidge, a very-early- to early-stage exploration property located in a prospective geological regime within the James Bay District of Québec. High-density airborne magnetic surveys flown over Lidge delineated several geophysical anomalies in 2014. The Company recorded an impairment charge for Lidge in 2014. Accordingly, $9,978 in exploration expenditures incurred during fiscal 2015, have been written-down (Note 9 to the audited consolidated financial statements). Expenditures for Lidge will continue to be written-down until such time as market conditions improve and impairment charges are reversed. Therefore, the Company’s investment in the project to October 31, 2015 is recorded as nil.
Dyna
Although in 2014 high-density airborne surveys also delineated several anomalies on Dyna, a very-early-stage prospect located in the Opinaca region of James Bay, due to the current decline in gold and base metals markets, the Dyna claims were allowed to expire. The Company’s investment in the project to October 31, 2015 is recorded as $nil

Management Discussion and Analysis Eastmain Resources Inc.
- 9 -
Going Concern
The Company is in the exploration stage and has not yet determined whether its exploration and evaluation assets contain reserves that are economically recoverable. The continued operations of the Company and the recoverability of amounts shown for its exploration and evaluation assets is dependent upon the ability of the Company to obtain financing to complete exploration of its exploration and evaluation assets, the existence of economically recoverable reserves and future profitable production, or alternatively, upon the Company’s ability to recover its costs through a disposition of its exploration and evaluation assets. The amount shown for exploration and evaluation assets does not necessarily represent present or future value. Changes in future conditions could require a material change in the amount recorded for the exploration and evaluation assets.
The audited consolidated financial statements are prepared on the basis that the Company will continue as a going concern, which assumes that the Company will be able to continue operating for the foreseeable future and will be able to realize its assets and discharge its liabilities and commitments in the normal course of operations. As an exploration-stage Company, the Company does not have any sources of revenue and historically has incurred recurring operating losses. As at October 31, 2015, the Company had working capital of $3,504,083 (October 31, 2014 – $2,499,336) and shareholders’ equity of $56,751,428 (October 31, 2014 – $54,613,635). Management has assessed that this working capital is sufficient for the Company to continue as a going concern beyond one year. If the going-concern assumption was not appropriate for these financial statements it would be necessary to restate the Company’s assets and liabilities on a liquidation basis.
Results of Operations
The Company does not earn any significant revenue from consolidated operations. Interest is derived from the investment of funds for the period between the receipt of funds from equity placements and the disbursement of exploration expenditures. From time to time, other income is derived from management fees and charges for the use of Company facilities by third parties.
Three months ended October 31, 2015 compared to the three months ended October 31, 2014:
Net loss for the quarter ended October 31, 2015 was $41,541 (2014 – $9,572,669) a variance of $9,531,128 (99.6%).
• General and administrative expenses were $410,350 (2014 – $166,902) a variance of $243,448 (145.9%), which included Stock option compensation of $66,885, higher costs of supplying shareholder information in the amount of $116,161 and higher professional fees in the amount of $64,419. The aggregate of other administrative expenses was lower by $4,017.
• Impairment of exploration and evaluation assets was $13,093 (2014 – $10,434,944) a variance of $10,421,851. At the end of each reporting period, management reviews carrying amounts of its non-financial assets with finite lives to determine whether there is any indication that those assets have suffered an impairment loss. Where such an indication exists, the recoverable amount is adjusted to the higher of the asset’s fair value less cost to sell or its value in use. During the 4th quarter of fiscal 2014, the decline in commodity prices, which was reflected in the decrease of the Company’s share price, prompted management to recognize an impairment charge and to limit its exploration activity while the cost of capital was at a premium. The properties affected by the impairment charge were: Éléonore South, Ruby Hill, Reservoir, Radisson, Lidge, and Dyna. As a result of their impairment status, exploration expenditures incurred on these properties after October 2014, are written-off as incurred, until such time as an economic value for the properties can be determined.
• Interest and other income was $104,646 (2014 – $10,405) a variance of $94,241. The increased income was derived from the rental of the Eastmain Mine camp to a third party.
• The unrealized loss on investment revaluation for the quarter was $36,267 (2014 – $30,046) a variance of $6,222 (20.7%). The loss is attributable to the decline in market values of the common shares in resource companies held by the Company as detailed in Note 6 to the audited consolidated financial statements.
• Premium income from flow-through shares was $986,567 (2014 – $525,232) a variance of $461,335 (87.8%). The premium on flow-through shares is calculated as being the difference between the price paid by investors for flow-through shares and the fair-market price of those common shares. The premium is recorded as a liability and income is derived from premium amortization pro-rata to eligible expenditures incurred. Premiums recorded on the issue of flow-through shares are disclosed in Note 11 to the audited consolidated financial statements. The premium calculated was increased by $0.07 per share ($743,212) to reflect the drop in share price to the market price on the day of issue.

Management Discussion and Analysis Eastmain Resources Inc.
- 10 -
• Deferred income taxes were $673,541 (2014 – recovery of $523,585) a variance of $1,197,126. Deferred income tax expense is largely affected by the amortization of flow-through premium income and the expected deferred tax recovery related to impairment charges recorded, as detailed in Note 18 to the audited consolidated financial statements.
Year ended October 31, 2015 compared to the year ended October 31, 2014:
Net loss was $853,496 (2014 – $9,193,660) a variance of $8,340,164 (90.7%).
• General and administrative expenses were $1,136,950 (2014 –- $902,460) a variance of $234,490 (26.0%).
• Interest and other income was $162,824 (2014 – $63,019) a variance of $99,805.
• Impairment of exploration and evaluation assets was $133,239 (2014 – $10,434,944) a variance of $10,301,705 (98.7%).
• Realized loss on marketable securities $61,904 (2014 – nil). The company incurred realized losses of $61,904 on the disposal of shares from its investment portfolio. The unrealized loss on investment revaluation was $248,089 (2014 – a gain of $202,828) a variance of $450,917. The loss is attributable to the decline in market values of common shares in resource companies held by the Company as detailed in Note 6 to the audited consolidated financial statements.
• Premium income from flow-through shares was $1,327,164 (2014 – $1,733,150) a variance of $405,986 (23.4%). The premium is amortized on a pro-rata basis to eligible expenditures incurred. There was an adjustment to the calculated value of the flow-through premium in the 4th quarter to reflect a drop in share price to the market price on the day of issue.
• Deferred income taxes were $763,302 (2014 – a recovery of $144,747) a variance of $908,049. Deferred income tax expense is largely affected by the amortization of flow-through premium income and the expected deferred tax recovery related to impairment charges recorded.
Summary of Quarterly Results
Quarter ended Quarter ended Quarter ended Quarter ended 10/31/2015 07/31/2015 04/30/2015 01/31/2015
Interest / other income $ 104,646 $ 27,814 $ 20,132 $ 10,232 Comprehensive (loss) $(41,541) $(315,689) $(238,436) $(257,830) Per share basic $(0.0003) $(0.0024) $(0.0018) $(0.0020) Per share diluted $(0.0003) $(0.0024) $(0.0018) $(0.0020) Trading range of shares High $0.42 $0.49 $0.62 $0.38 Low $0.28 $0.29 $0.29 $0.17
Quarter ended Quarter ended Quarter ended Quarter ended 10/31/2014 07/31/2014 04/30/2014 01/31/2014
Interest / other income $ 10,405 $ 10,578 $ 29,034 $ 13,002 Comprehensive income (loss) $(9,572,669) $ (206,936) $ 19,341 $ 566,604 Per share basic $(0.0803) $(0.0017) $0.0002 $0.0049 Per share diluted $(0.0803) $(0.0017) $0.0002 $0.0049 Trading range of shares High $0.40 $0.47 $0.56 $0.44 Low $0.21 $0.28 $0.28 $0.21
Significant charges included in the amounts above are as follows:
10/31/2015 Comprehensive net loss includes: flow-through share premium income of $986,567; deferred income taxes of $673,044 and; an unrealized loss on investment revaluation of $36,267.
07/31/2015 Comprehensive net loss includes: flow-through share premium income of $137,563; deferred income tax of $36,454; a charge of $117,600 for stock option compensation; an unrealized loss on investment valuation of $75,884 and; an impairment charge of $33,703.
Management Discussion and Analysis Eastmain Resources Inc.
- 11 -
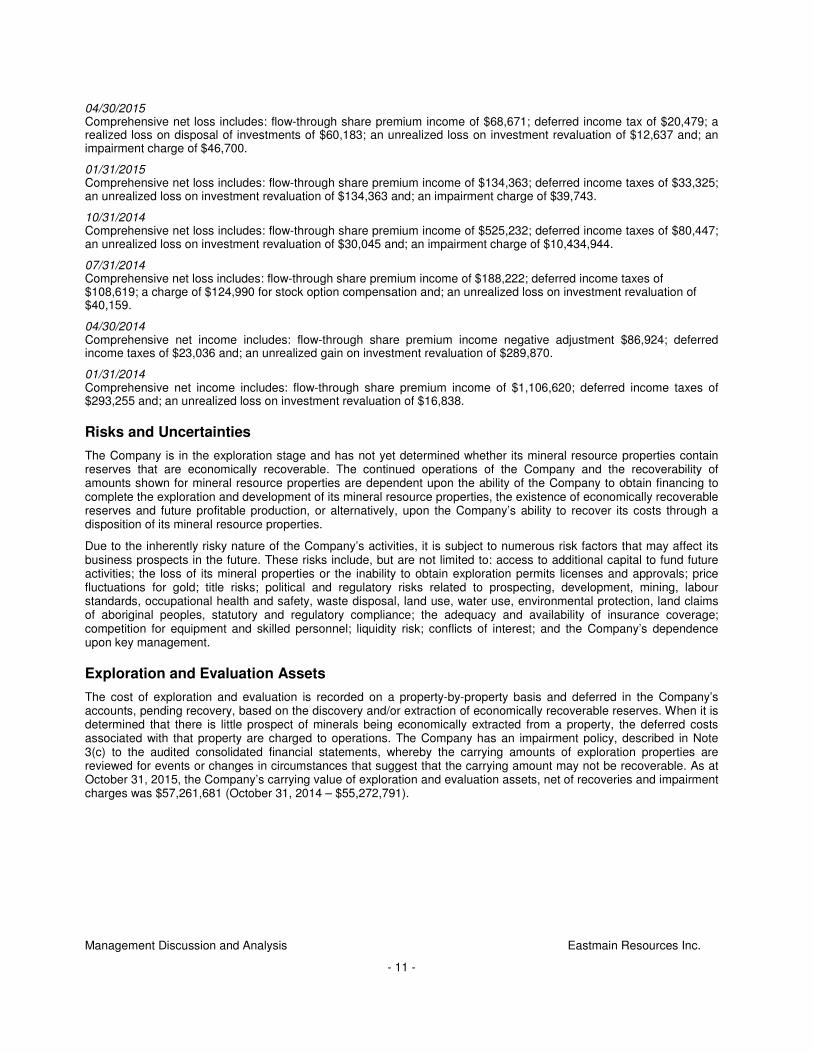
04/30/2015 Comprehensive net loss includes: flow-through share premium income of $68,671; deferred income tax of $20,479; a realized loss on disposal of investments of $60,183; an unrealized loss on investment revaluation of $12,637 and; an impairment charge of $46,700.
01/31/2015 Comprehensive net loss includes: flow-through share premium income of $134,363; deferred income taxes of $33,325; an unrealized loss on investment revaluation of $134,363 and; an impairment charge of $39,743.
10/31/2014 Comprehensive net loss includes: flow-through share premium income of $525,232; deferred income taxes of $80,447; an unrealized loss on investment revaluation of $30,045 and; an impairment charge of $10,434,944.
07/31/2014 Comprehensive net loss includes: flow-through share premium income of $188,222; deferred income taxes of $108,619; a charge of $124,990 for stock option compensation and; an unrealized loss on investment revaluation of $40,159.
04/30/2014 Comprehensive net income includes: flow-through share premium income negative adjustment $86,924; deferred income taxes of $23,036 and; an unrealized gain on investment revaluation of $289,870.
01/31/2014 Comprehensive net income includes: flow-through share premium income of $1,106,620; deferred income taxes of $293,255 and; an unrealized loss on investment revaluation of $16,838.
Risks and Uncertainties
The Company is in the exploration stage and has not yet determined whether its mineral resource properties contain reserves that are economically recoverable. The continued operations of the Company and the recoverability of amounts shown for mineral resource properties are dependent upon the ability of the Company to obtain financing to complete the exploration and development of its mineral resource properties, the existence of economically recoverable reserves and future profitable production, or alternatively, upon the Company’s ability to recover its costs through a disposition of its mineral resource properties.
Due to the inherently risky nature of the Company’s activities, it is subject to numerous risk factors that may affect its business prospects in the future. These risks include, but are not limited to: access to additional capital to fund future activities; the loss of its mineral properties or the inability to obtain exploration permits licenses and approvals; price fluctuations for gold; title risks; political and regulatory risks related to prospecting, development, mining, labour standards, occupational health and safety, waste disposal, land use, water use, environmental protection, land claims of aboriginal peoples, statutory and regulatory compliance; the adequacy and availability of insurance coverage; competition for equipment and skilled personnel; liquidity risk; conflicts of interest; and the Company’s dependence upon key management.
Exploration and Evaluation Assets
The cost of exploration and evaluation is recorded on a property-by-property basis and deferred in the Company’s accounts, pending recovery, based on the discovery and/or extraction of economically recoverable reserves. When it is determined that there is little prospect of minerals being economically extracted from a property, the deferred costs associated with that property are charged to operations. The Company has an impairment policy, described in Note 3(c) to the audited consolidated financial statements, whereby the carrying amounts of exploration properties are reviewed for events or changes in circumstances that suggest that the carrying amount may not be recoverable. As at October 31, 2015, the Company’s carrying value of exploration and evaluation assets, net of recoveries and impairment charges was $57,261,681 (October 31, 2014 – $55,272,791).

Management Discussion and Analysis Eastmain Resources Inc.
- 12 -
Project expenditures for the year ended October 31, 2015
Project Drilling & assays
Technical surveys
Project acquisition
& maintenance
Gross expenditures
Income tax
credits
2015 Net Expenditures
Clearwater $ 2,581,961 $1,209,160 $ 49,983 $ 3,841,104 $(1,910,065) $ 1,931,039
Eastmain Mine 6,577 110,066 14,394 131,037 - 131,037
Éléonore South 1,654 5,063 3,150 9,867 - 9,867
Ruby Hill 976 58,835 24,134 83,945 - 83,945
Reservoir 4,521 2,334 - 6,855 - 6,855
Lac Hudson - 7,455 15,347 22,802 - 22,802
Lac Elmer 2,979 590 2,048 5,617 - 5,617
Radisson - - 22,594 22,594 - 22,594
Road King - 10,333 14,788 25,121 - 25,121
Lidge - 9,978 - 9,978 - 9,978
Lac Lessard 1,625 1,649 - 3,274 - 3,274
Total $ 2,600,293 $1,415,463 $146,438 $ 4,162,194 $(1,910,065) $ 2,252,129
Cumulative acquisition, exploration and evaluation expenditures as at October 31, 2015
Project
Balance November 1,
2014
2015 Net expenditures
Write-downs
Recoveries Balance October 31,
2015
Clearwater $ 39,448,418 $ 1,931,039 $ - $ - $ 41,379,457 Eastmain Mine 13,462,168 131,037 - - 13,593,205 Éléonore South - 9,867 (9,867) - - Ruby Hill - 83,945 (83,945) - - Reservoir - 6,855 (6,855) - - Lac Hudson 928,369 22,802 - - 951,171 Lac Elmer 821,254 5,617 - - 826,871 Radisson - 22,594 (22,594) - - Road King 276,658 25,121 - - 301,779 Lidge - 9,978 (9,978) - - Lac Lessard 335,924 3,274 - (130,000) 209,198
$ 55,272,791 $ 2,252,129 $(133,239) $(130,000) $ 57,261,681
Management Discussion and Analysis Eastmain Resources Inc.
- 13 -
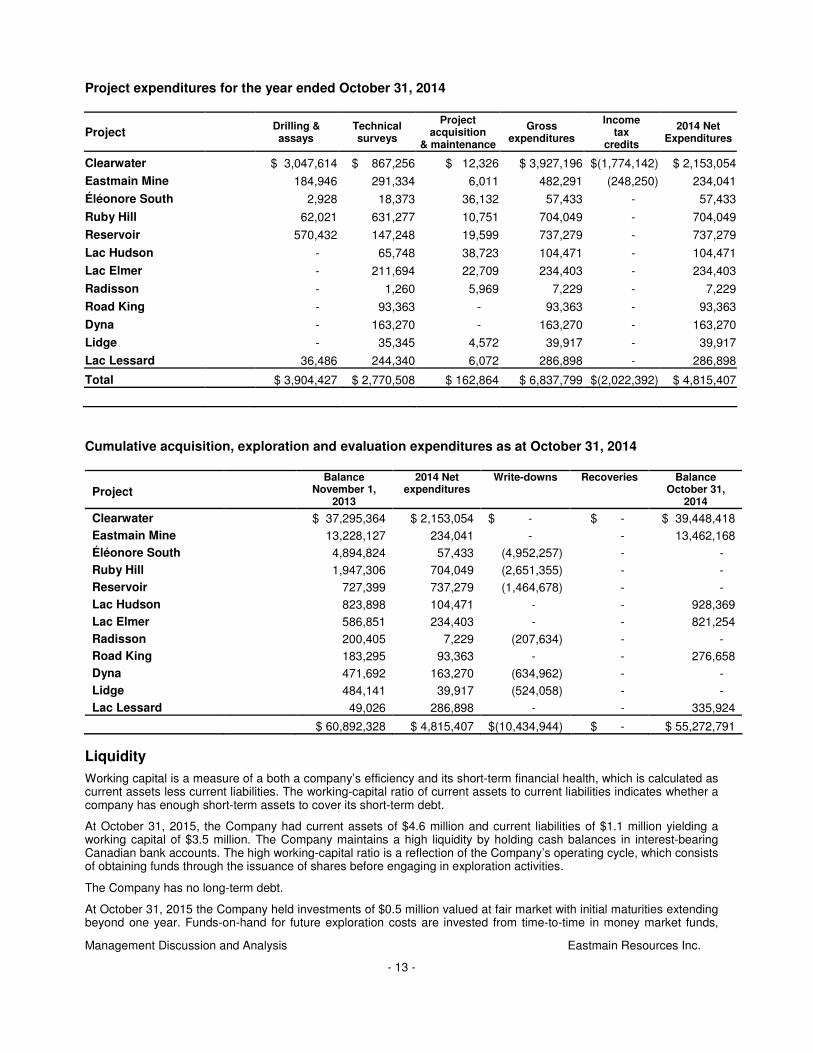
Project expenditures for the year ended October 31, 2014
Project Drilling & assays
Technical surveys
Project acquisition
& maintenance
Gross expenditures
Income tax
credits
2014 Net Expenditures
Clearwater $ 3,047,614 $ 867,256 $ 12,326 $ 3,927,196 $(1,774,142) $ 2,153,054
Eastmain Mine 184,946 291,334 6,011 482,291 (248,250) 234,041
Éléonore South 2,928 18,373 36,132 57,433 - 57,433
Ruby Hill 62,021 631,277 10,751 704,049 - 704,049
Reservoir 570,432 147,248 19,599 737,279 - 737,279
Lac Hudson - 65,748 38,723 104,471 - 104,471
Lac Elmer - 211,694 22,709 234,403 - 234,403
Radisson - 1,260 5,969 7,229 - 7,229
Road King - 93,363 - 93,363 - 93,363
Dyna - 163,270 - 163,270 - 163,270
Lidge - 35,345 4,572 39,917 - 39,917
Lac Lessard 36,486 244,340 6,072 286,898 - 286,898
Total $ 3,904,427 $ 2,770,508 $ 162,864 $ 6,837,799 $(2,022,392) $ 4,815,407
Cumulative acquisition, exploration and evaluation expenditures as at October 31, 2014
Project
Balance November 1,
2013
2014 Net expenditures
Write-downs
Recoveries Balance October 31,
2014
Clearwater $ 37,295,364 $ 2,153,054 $ - $ - $ 39,448,418 Eastmain Mine 13,228,127 234,041 - - 13,462,168 Éléonore South 4,894,824 57,433 (4,952,257) - - Ruby Hill 1,947,306 704,049 (2,651,355) - - Reservoir 727,399 737,279 (1,464,678) - - Lac Hudson 823,898 104,471 - - 928,369 Lac Elmer 586,851 234,403 - - 821,254 Radisson 200,405 7,229 (207,634) - - Road King 183,295 93,363 - - 276,658 Dyna 471,692 163,270 (634,962) - - Lidge 484,141 39,917 (524,058) - - Lac Lessard 49,026 286,898 - - 335,924
$ 60,892,328 $ 4,815,407 $(10,434,944) $ - $ 55,272,791
Liquidity
Working capital is a measure of a both a company’s efficiency and its short-term financial health, which is calculated as current assets less current liabilities. The working-capital ratio of current assets to current liabilities indicates whether a company has enough short-term assets to cover its short-term debt.
At October 31, 2015, the Company had current assets of $4.6 million and current liabilities of $1.1 million yielding a working capital of $3.5 million. The Company maintains a high liquidity by holding cash balances in interest-bearing Canadian bank accounts. The high working-capital ratio is a reflection of the Company’s operating cycle, which consists of obtaining funds through the issuance of shares before engaging in exploration activities.
The Company has no long-term debt.
At October 31, 2015 the Company held investments of $0.5 million valued at fair market with initial maturities extending beyond one year. Funds-on-hand for future exploration costs are invested from time-to-time in money market funds,

Management Discussion and Analysis Eastmain Resources Inc.
- 14 -
term deposits, and bonds or certificates of deposit with maturities matching the Company’s cash-flow requirements, which in management’s opinion, yield the greatest return with the least risk. The Company’s policy is to maintain its investment portfolio in very low-risk liquid securities, which are selected and managed under advice from independent professional advisors.
Accounts receivable and prepaid expenses as at October 31, 2015 were $1,399,328, which included $761,597 for confirmed resource investment tax credits from the Province of Quebec, and also included recoverable HST and QST sales taxes of $188,238, which are subject to verification and normally refunded within 60 to 90 days of the claim. Refunds of taxes are not considered a financial instrument since governments are not obligated to make these payments. Other accounts receivable were $346,509. Advances and prepaid amounts were $102,984.
At October 31, 2015, trade accounts payable and accrued liabilities were $1,074,609 which included payroll withholdings of $46,597 and amounts due to related parties of $69,582. Trade accounts are normally settled within 30 days. Flow-through premiums are amortized to income in proportion to eligible Canadian exploration expenditures (CEE) incurred.
The Company has an estimated $120,000 in resource investment credits and mining duty rebates recoverable from the Province of Québec for current qualified expenditures and returns filed up to October 31, 2015. Since confirmation of these amounts has not yet been received, this estimated refund has not been recorded in the Company’s financial statements.
During the year ended October 31, 2015, the Company received net proceeds of $3.8 million from shares issued and $1.2 million in resource investment tax credits to fund fiscal 2015 activities. During the same period, the Company spent $3.9 million on claim acquisition, claim maintenance, and exploration and evaluation of mineral resource properties. The Company’s current base operating cost is approximately $112,000 per month. All exploration expenditures to be made by the Company, except for flow-through commitments described below, are discretionary. As such, management believes the Company will have sufficient funds available to meet all of its flow-through obligations and cover its ongoing administrative and overhead costs for the foreseeable future.
The Company is reliant on equity markets over the long term to raise capital to fund its exploration activities. In the past, the Company has been successful in raising funds through equity offerings, and while there is no guarantee that this will continue, there is no reason either to believe that this capacity will diminish.
Commitments
During fiscal 2015, the Company issued flow-through shares for which it was committed to spend $3,450,625 in eligible Canadian exploration expenditures (“CEE”) by December 31, 2015. As of October 31, 2015, the Company had incurred qualifying expenditures in excess of the $3,450,625 required.
In December 2015 the Company issued flow-through shares in a private placement for gross proceeds of $440,000. The flow-through premium associated with this issue was $149,600. In accordance with income tax legislation, the Company renounced resource expenditures of $440,000 in favour of the investors with an effective date of December 31, 2015 for activities funded by this flow-through share arrangement. The liability for flow-through premium derived from the issue was $149,600
Capital Resources
The Company, as is typical of junior exploration companies, has only a small investment in capital resources, which is comprised of $58,114 in computer equipment and field equipment of $398,536. The net book value October 31, 2015 was $54,126.
Income taxes
For tax year-ends after December 31, 2005, non-capital losses can be carried forward and used to offset future gains for a period of twenty years, after which they expire (ten years for losses in tax years ending prior to December 31, 2005). To the extent that loss carry-forwards could be used to reduce future tax liabilities, they are a financial resource that can be managed. The Company, by its nature as a mineral exploration business, generates non-capital tax losses, which are not recognized on the income statement because, at this point in time, it is not certain that they will be used to offset tax liabilities within their carry-forward life.
As at October 31, 2015, the Company has non-capital losses available for deduction of $9,704,876 which begin to expire in 2026 and unused capital losses of $438,844 which have no expiry date. In addition, the Company has Canadian exploration and development expenditures available to reduce future years’ taxable income of approximately $27,000,000. The tax benefit of these amounts may be carried forward indefinitely.

Management Discussion and Analysis Eastmain Resources Inc.
- 15 -
Off-Balance-Sheet Arrangements
The Company has no off-balance-sheet arrangements.
Transactions with Related Parties Related party transactions include $18,900 per month salary and $1,000 per month premises rent paid to the President and Chief Executive Officer of the Company. Professional geological consulting and management services fees of $630 per day plus out of pocket expenditures are paid to Shawonis Explorations and Enterprises Ltd. The president of Shawonis is related to the President and Chief Executive Officer of Eastmain Resources Inc. CFO financial consulting service fees of $130 per hour plus out-of-pocket costs are paid to QB 2000 Inc. The Chief Financial Officer of Eastmain Resources Inc. is the president of QB 2000 Inc. The value of related party transactions for the year ended October 31, 2015 was $492,285 (2014 – $491,391). The amount due to related parties October 31, 2015 was $69,582 (2014 –$84,745).
Share Capital
The authorized share capital of the Company consists of an unlimited number of common shares of which, as of January 28 2016, there are 133,919,815 common shares outstanding and 7,868,605 share-purchase options with a weighted average exercise price of $0.68, which would generate proceeds of $5,383,512 if exercised.
Critical Accounting Estimates
The preparation of the audited consolidated financial statements under IFRS requires management to make certain estimates, judgements and assumptions about future events that affect the amounts reported in those audited consolidated financial statements and their related notes. Although these estimates are based on management’s best knowledge of the amounts, events or actions, actual results may differ from those estimates and these differences could be material. a) Significant judgements in applying accounting policies The areas which require management to make significant judgements in determining carrying values include, but are not limited to: Exploration and evaluation assets; and
In estimating the recoverability of capitalized exploration and evaluation assets, management is required to apply judgement in determining whether technical feasibility and commercial viability can be demonstrated for its mineral properties. Once technical feasibility and commercial viability of a property can be demonstrated, it is reclassified from exploration and evaluation assets to property and equipment, and subject to different accounting treatment. As at October 31, 2015 and 2014 management deemed that no reclassification of exploration and evaluation assets was required. Income taxes and recoverability of potential deferred tax assets
In assessing the probability of realizing income tax assets recognized, management makes estimates related to expectations of future taxable income, applicable tax planning opportunities, expected timing of reversals of existing temporary differences, and the likelihood that tax positions taken will be sustained upon examination by applicable tax authorities. In making its assessments, management gives additional weight to both positive and negative evidence that can be objectively verified. Estimates of future taxable income are based on forecasted cash flows from operations and the application of existing tax laws in each jurisdiction. The Company considers whether relevant tax planning opportunities are within the Company's control, are feasible, and are within management's ability to implement. Examination by applicable tax authorities is based on individual facts and circumstances of the relevant tax position examined in light of all available evidence. Where applicable tax laws and regulations are either unclear or subject to ongoing varying interpretations, it is reasonably possible that changes in these estimates can occur that materially affect the amounts of income tax assets recognized. Also, future changes in tax laws could limit the Company from realizing the tax benefits from deferred tax assets. The Company reassesses unrecognized income tax assets at each reporting period. b) Significant accounting estimates and assumptions The areas which require management to make significant estimates and assumptions in determining carrying values include, but are not limited to:
Management Discussion and Analysis Eastmain Resources Inc.
- 16 -
Impairment of exploration and evaluation assets;
When there are indications that an asset may be impaired, the Company is required to estimate the asset’s recoverable amount. The recoverable amount is the greater of value in use and fair value less costs to sell. Determining the value requires the Company to estimate future cash flows associated with the assets and a suitable discount rate in order to calculate the present value. During 2015 the Company’s exploration and evaluation assets were written-down by $133,239 (2014 – $10,434,944). Where an impairment loss subsequently reverses, the carrying value of the asset (or cash generating unit) is increased to the revised estimate of its recoverable amount, unless that amount exceeds the carrying value recorded prior to the recognition of the impairment loss, in which case the carrying value would be re-instated to its pre-impairment-loss carrying value. A reversal of an impairment loss is recognized immediately in the income statement. Management estimates of mineral prices, recoverable reserves, operating capital and restoration costs are subject to certain risks and uncertainties that may affect the recoverability of exploration and evaluation assets. Although management has made its best estimate of these factors, it is possible that changes could occur in the near term that could adversely affect management’s estimate of net cash flow to be generated from its projects. Share-based payments;
The amount expensed for share-based payments is derived from the application of the Black-Scholes option pricing model, which is highly dependent on the expected volatility of the Company’s shares and the expected life of the options. The Company uses an expected volatility rate for its shares based on past trading data. Actual volatility may be significantly different. While the estimate of share-based payments can have a material impact on the operating results reported by the Company, it is a non-cash charge and as such has no impact on the Company’s cash position or future cash flows.
Estimates and underlying assumptions are reviewed on an ongoing basis. Revisions to estimates are recognized in the period in which the estimates are revised and in any future periods affected. Depreciation and impairment of property and equipment; and
The determination of the useful life of property and equipment is based on management estimates. Indicators of impairment are also subject to management’s estimates. Estimation of restoration, rehabilitation and environmental obligations.
Restoration, rehabilitation and environmental liabilities are estimated based on the Company’s interpretation of current regulatory requirements and constructive obligations. These estimates are measured at fair value, which is determined by the net present value of estimated future cash expenditures for the settlement of restoration, rehabilitation and environmental liabilities that may occur upon ceasing exploration and evaluation activities. Such estimates are subject to change based on changes in laws and regulations and negotiations with regulatory authorities. Management’s determination that there are currently no provisions required for site restoration is based on facts and circumstances that existed during the year.
Impairment Analysis
Each reporting period, management reviews the general and economic conditions and mining industry trends that influence recoverability of the carrying value of its exploration and evaluation expenditures. As at October 31, 2015, no further impairment charges were deemed necessary, however, during the year ongoing exploration and evaluation expenditures of $133,239 incurred on properties previously determined to be impaired were written-off as impairment charges. An impairment analysis performed in 2014, identified impairment characteristics on some of the company’s properties which lead to an impairment write-off totaling $10,434,944 during the year ended October 31, 2014. Ongoing expenditures on properties affected by the write-down are now being written off as incurred until such time as economic conditions permit a reversal of the impairment charges.
New Accounting Standards Adopted During the Year
IAS 32 – Financial Instruments, Presentation, (“IAS 32”) is effective for annual periods beginning on or after January 1, 2014. IAS 32 was amended to clarify that the right of offset must be available on the current date and cannot be contingent on a future date. As at November 1, 2014, the Company adopted this pronouncement and there was no material impact on the Company’s consolidated financial statements.
Management Discussion and Analysis Eastmain Resources Inc.
- 17 -
Standards Issued But Not Yet Effective
Financial Instruments
IFRS 9 – Financial Instruments, issued by the IASB in October 2010 is intended to entirely replace IAS 39 Financial Instruments: Recognition and Measurement, using a single approach to determine whether a financial asset is measured at amortized cost or fair value, thereby reducing the complexity of the multiple rules in IAS 39. Most of the requirements in IAS 39 for the classification and measurement of financial liabilities were carried forward unchanged to IFRS 9. The approach in IFRS 9 is based on how an entity manages its financial instruments in the context of its business model and the contractual cash-flow characteristics of financial assets. The new standard also requires the use of a single method of impairment determination, which replaces the multiple methods available under IAS 39. The standard will be effective for annual periods beginning on or after January 1, 2018. The Company is currently evaluating the impact this final standard is expected to have on its consolidated financial statements.
Use of Financial Instruments
The Company’s financial instruments are exposed to certain financial risks, including currency risk, credit risk, liquidity risk, interest-rate risk and commodity-price risk. The Company has not entered into any specialized financial agreements to minimize its investment risk, currency risk or commodity risk and the Company does not hold any asset-backed commercial paper. The Company’s exposure to risk factors and their impact on the Company’s financial instruments are summarized below:
a) Fair value
Fair value represents the amount at which a financial instrument could be exchanged between willing parties, based on current markets for instruments with the same risk, principal and remaining maturity. Fair-value estimates are based on quoted market values and other valuation methods. The Company’s exposure to financial risk relates to its investments in marketable securities is described in Note 6. b) Credit risk
Credit risk is the risk of an unexpected loss if a customer or third party to a financial instrument fails to meet its contractual obligations. The Company’s credit risk is primarily attributable to cash and cash equivalents, marketable securities, and receivables included in prepaid and sundry receivables. The Company has no significant concentration of credit risk arising from operations. Cash and cash equivalents are held with the Royal Bank of Canada, from which management believes the risk of loss to be minimal. Financial instruments included in prepaid and sundry receivables consist of other receivables. Management believes that its concentration of credit risk, with respect to financial instruments included in prepaid and sundry receivables, is minimal. c) Liquidity risk
Liquidity risk is the risk that the Company will not be able to meet its financial obligations as they fall due. The Company’s approach to managing liquidity risk is to ensure that it will have sufficient liquidity to meet liabilities when due. As at October 31, 2015, the Company had current assets of $4,578,692 to settle current liabilities of $1,074,609. All of the Company’s financial liabilities have contractual maturities of 30 days or less except flow-through liabilities which continue until December 31, 2015. During the year ended October 31, 2015, the Company raised net proceeds of $3,796,768 through the issue of shares and the exercise of warrants, and received resource tax credits of $1,148,468 to fund general exploration activities planned for fiscal 2015. In management’s opinion, there are sufficient funds to support the planned exploration program for the foreseeable future. d) Market risk
Market risk is the risk of loss that may arise from changes in market factors such as interest rates, foreign exchange rates, and commodity and equity prices.
Interest rate risk The Company has cash balances, interest-bearing bank accounts and no interest-bearing debt. The Company’s current policy is to invest excess cash in investment-grade bonds, treasury bills, bankers’ acceptances and money market funds. Due to the short-term nature of these financial instruments, fluctuations in market rates do not have a significant impact on the estimated fair value as at October 31, 2015. Foreign currency risk The Company’s functional currency is the Canadian dollar and major purchases are transacted in Canadian dollars. The Company funds certain administrative expenses in the United States on a cash-call basis using US

Management Discussion and Analysis Eastmain Resources Inc.
- 18 -
dollar currency converted from its Canadian dollar bank account held in Canada. Management believes the foreign currency risk derived from currency conversions is manageable and therefore, does not hedge its foreign currency risk.
Sensitivity analysis Based on management’s knowledge and experience of the financial markets, the Company believes the following movements are reasonably possible over a twelve month period:
i. Cash and cash equivalents are subject to floating interest rates. The Company has no variable debt and receives low interest rates on its cash and cash equivalent balances. As such, the Company does not have significant interest rate risk.
ii. Only $623,510 of the Company’s investment in marketable securities, amounting to $2,101,239, is subject to market fluctuations. As at October 31, 2015, if the fair value of the Company’s investment in marketable securities had increased or decreased by 25%, with all other variables held constant, the comprehensive loss and equity for the year ended October 31, 2015 would have been approximately $155,877 higher or lower.
Future Outlook
In October, Eastmain was awarded the "Discovery of the Year 2015" by the Association de L'Exploration Minière du Quebec ("AEMQ"). This peer-nominated award recognizes the importance of Eastmain's recent discoveries, which have significantly led to the expansion and delineation of its Eau Claire gold deposit and to new prospects discovered along the Eau Claire trend. The award reinforces that our principal objective is to create shareholder value through exploration, discovery and the profitability of future mining of the Eau Claire deposit.
Eau Claire is one of the highest-grade undeveloped open-pit projects in North America. There is excellent exploration potential to further expand the size and improve the grade of the current open-pit Mineral Resource and potential ramp-accessible underground mineralization. The Clearwater Project is transitioning from pure exploration towards an early pre-development stage with the initiation of a preliminary economic assessment (PEA). This initial step will lay the groundwork for further exploration, which will increasingly define the geometry and mineral potential of Eau Claire, while de-risking the project.
A four-year decline of metal commodity prices has manifested as a steady decline in the market capitalization of most exploration and development companies. This past year has been one of the most difficult for the mining sector. The precious metals market in particular has been under pressure with weakening metal prices and the forecast consensus is predicting a sluggish outlook for 2016. Senior, intermediate and junior gold producers were down 18%, 11% and 8% year-over-year respectively during 2015. The sector continues searching for the means to lowering costs and improving efficiencies, while ore grades in mines of some of the largest market capitalization companies continue to fall. Regulation, especially on the social and environmental fronts will continue to become more stringent. Future gold price predictions continues to be a flash point amongst analysts and investors alike, being predominantly negative.
In the midst of this turmoil, Eastmain's share price appreciated by 48% during the calendar year, while our exploration peer group generally saw their share performance for 2015 decrease by 15%. Approximately one-half of the total issued shares of the Corporation (133.9 M) traded over this 12-month period.
An updated block model Mineral Resource estimate for the Eau Claire gold deposit resulted in an increase in Measured and Indicated gold Resources while maintaining a very high grade. Eau Claire, one of the highest-grade undeveloped potential open-pit gold projects in North America, is located within one of the most favourable mining jurisdictions in the world, and is complimented by road access and abundant hydro-electric power nearby.
As we continue to unlock its geological potential, the top-priority objectives to advancing Clearwater toward development include completing the PEA, increasing open pit resources both within, and lateral to, the Eau Claire deposit, continued definition drilling to improve grade and continuity, and drilling for new discoveries along the favourable Eau Claire trend. Project expansion through diamond drilling and possible near-future underground exploration is currently facilitated by weak market conditions which have triggered a substantial drop in direct exploration costs.
Scheduled for calendar Q2 2016, the preliminary economic assessment will include open-pit and underground mine engineering and design, metallurgical and processing studies, environmental and social impact studies, a review of infrastructure requirements and preliminary economic modeling and analysis. A weak Canadian currency will continue to be a positive catalyst for non-US based precious metal assets.
Management Discussion and Analysis Eastmain Resources Inc.
- 19 -
Part of our exploration approach includes the optioning of non-core assets. This process allows the Company to focus funding and personnel on more advanced exploration of its primary assets, while using other people’s money to move non-key assets forward. Exploration work completed by Eastmain and funded by Darnley Bay Limited, as part of their first-year earn-in requirements on an option to earn 50% interest in the Lac Lessard project, has confirmed nickel-copper mineralization in sufficient quantities to necessitate additional work.
Now is the time to build for tomorrow. A continued down-turn in the metals market has prompted a significant decrease in the costs associated with fundamental exploration, while increased access to remote areas has triggered new interest in Quebec’s Far North. As an explorer, Eastmain will continue to take advantage when possible of lower-priced drilling, air-support and technical advances on its road to the creation of shareholder value, through the discovery of economically viable deposits.
A $3.0 million budget has been recommended for our two key Québec projects in 2015.
Subsequent Events
i. In accordance with the Company’s stock option compensation plan, 250,000 ten-year-term stock options with an exercise price of $0.36 were granted to a director in November 2015. The estimated cost of these changes, using the Black-Scholes pricing model, is $53,250.
ii. In December 2015 the Company issued 880,000 flow-through shares at $0.50 per share in a private placement for gross proceeds of $440,000. Issue costs in connection with the private placement are estimated to be $22,400. No brokerage commission or finder’s fee was paid. The flow-through premium associated with this issue was $149,600. In accordance with income tax legislation, the Company renounced resource expenditures of $440,000 in favour of the investors with an effective date of December 31, 2015 for activities funded by this flow-through share arrangement. The liability for flow-through premium derived from the issue was $149,600.
Scientific and Technical Disclosure
All disclosure of a scientific or technical nature herein concerning the currently published Eau Claire resource estimate (Company News Release April 27, 2015) is based upon the technical report entitled “Technical Report for the Eau Claire Gold Deposit, Clearwater Project, Quebec" (the “Clearwater Report”), which was prepared by SRK Consulting (Canada) Inc. as of June 11, 2015. Dominic Chartier, P.Geo, Jean Francois Ravenelle, Ph.D., P.Geo and Jean Francois Couture, Ph.D., P.Geo are “qualified persons” within the meaning of National Instrument 43-101 of the Canadian Securities Administrators and have verified the data underlying the statements contained therein concerning the currently published Eau Claire resource estimate. Further information concerning the Clearwater Project is contained in the Clearwater Report available at www.sedar.com.
Disclosure Controls and Procedures
The Company’s Management, with the participation of its President and Chief Executive Officer, Chief Financial Officer and Corporate Secretary, have evaluated the effectiveness of the Company’s disclosure controls and procedures. Based upon the results of that evaluation, the certifying officers have concluded that, as of the end of the period covered by this report, the disclosure controls and procedures effectively provide reasonable assurance that information required to be disclosed, in reports the Company is required to file or submit under Canadian securities laws, was recorded, processed, summarized and reported within the appropriate time periods specified by those laws. The Company’s certifying officers, being the President and Chief Executive Officer and the Chief Financial Officer have evaluated the effectiveness of the Company’s disclosure controls and procedures. The certifying officers also concluded that material information was accumulated and communicated to management of the Company, including the President and Chief Executive Officer and the Chief Financial Officer, as appropriate to allow timely decisions regarding disclosure.
Internal Controls over Financial Reporting
The Company’s President and Chief Executive Officer and the Chief Financial Officer are responsible for establishing and maintaining adequate internal control over financial reporting. Under the supervision of the President and Chief Executive Officer and the Chief Financial Officer, the Company’s internal control over financial reporting is a process designed to provide reasonable assurance regarding the reliability of financial reporting and the preparation of financial statements for external purposes, in accordance with IFRS. The Company’s internal control over financial reporting includes policies that:
a) pertain to the maintenance of records that accurately and fairly reflect, in reasonable detail, the transactions and dispositions of assets of the Company;

Management Discussion and Analysis Eastmain Resources Inc.
- 20 -
b) provide reasonable assurance that transactions are recorded as necessary to permit preparation of financial statements in accordance with IFRS and that the Company’s receipts and disbursements are made only in accordance with authorizations of management and the Company’s Directors; and
c) provide reasonable assurance regarding prevention or timely detection of unauthorized acquisition, use or disposition of the Company’s assets that could have a material effect on the Company’s financial statements.
The Company’s management believes that its policies and procedures provide the best controls achievable under the constraints described above, subject to the limitations below.
Limitation of Controls and Procedures
The Company’s Management including the President and Chief Executive Officer and the Chief Financial Officer believe that any disclosure controls and procedures or internal control over financial reporting, no matter how well conceived and operated, can provide only reasonable, not absolute, assurance that the objectives of the control system are met. The design of a control system must reflect the fact that there are resource constraints, and the benefit of controls must be considered relative to their costs. Because of the inherent limitations in all control systems, they cannot provide absolute assurance that all control issues and instances of fraud, if any, within the Company have been prevented or detected. The inherent limitations include the realities that judgements in decision-making can be faulty, and that breakdowns can occur because of simple error or mistake. Controls can be circumvented by the individual acts of some persons, by collusion of two or more individuals or by unauthorized override of the control. The design of any control system is also based in part upon certain assumptions about the likelihood of future events, and therefore there can be no assurance that any design will succeed in achieving its stated goals under all potential future conditions. Accordingly, because of the inherent limitations in a cost effective control system, misstatements due to error or fraud may occur and not be detected.
Accounting Responsibilities, Procedures and Policies
The Board of Directors, which among other things is responsible for the financial statements of the Company, delegates to management the responsibility for the preparation of the financial statements. Responsibility for their review rests with the Audit Committee. Each year the shareholders appoint independent auditors to audit and report directly to them on the financial statements.
The Audit Committee is appointed by the Board of Directors and all of its members are non-management directors. The Audit Committee meets periodically with management and the external auditors to discuss internal controls, auditing matters and financial reporting issues, and to confirm that all administrative duties and responsibilities are properly discharged. The Audit Committee also reviews the financial statements and Management’s Discussion and Analysis and considers the engagement or reappointment of external auditors. The Audit Committee reports its findings to the Board of Directors for its consideration when approving the financial statements for issuance to the shareholders. The external auditors have full and free access to the Audit Committee.
Additional Information
Additional information relating to the Company, including any published Annual Information Forms, can be found on SEDAR at www.sedar.com.
1
EASTMAIN
EASTMAIN RESOURCES INC.
Consolidated Financial Statements
Years ended October 31, 2015 and 2014
(Expressed in Canadian Dollars)
Table of Contents Page Independent Auditor’s Report ...........................................................................................................................2 Consolidated Statements of Financial Position ................................................................................................3 Consolidated Statements of Loss and Comprehensive Loss ..........................................................................4 Consolidated Statements of Cash Flows..........................................................................................................5 Consolidated Statements of Shareholders’ Equity ...........................................................................................6 Notes to the Consolidated Financial Statements ....................................................................................... 7-24

1210 Sheppard Avenue East, Suite 302, Toronto, Ontario M2K 1E3 Tel: (416) 499-8848 Fax: (416) 491-5301
Stern & Lovrics LLP
Chartered Accountants
Samuel V. Stern, BA, CPA, CA George G. Lovrics, BComm, CPA, CA
CPA (Illinois)
Nazli Dewji, BA, CPA, CMA
INDEPENDENT AUDITOR'S REPORT
To the Shareholders of Eastmain Resources Inc.
We have audited the accompanying consolidated financial statements of Eastmain Resources Inc., which comprise the consolidated
statements of financial position as at October 31, 2015 and 2014, and the consolidated statements of loss and comprehensive loss, cash
flows and shareholders’ equity for each of the years then ended, and a summary of significant accounting policies and other
explanatory information.
Management's Responsibility for the Financial Statements
Management is responsible for the preparation and fair presentation of these consolidated financial statements in accordance with
International Financial Reporting Standards, and for such internal control as management determines is necessary to enable the
preparation of consolidated financial statements that are free from material misstatement, whether due to fraud or error.
Auditor's Responsibility
Our responsibility is to express an opinion on these consolidated financial statements based on our audits. We conducted our audits in
accordance with Canadian generally accepted auditing standards. Those standards require that we comply with ethical requirements
and plan and perform the audits to obtain reasonable assurance about whether the consolidated financial statements are free from
material misstatement.
An audit involves performing procedures to obtain audit evidence about the amounts and disclosures in the consolidated financial
statements. The procedures selected depend on the auditor's judgment, including the assessment of the risks of material misstatement
of the consolidated financial statements, whether due to fraud or error. In making those risk assessments, the auditor considers
internal control relevant to the entity's preparation and fair presentation of the consolidated financial statements in order to design
audit procedures that are appropriate in the circumstances, but not for the purpose of expressing an opinion on the effectiveness of the
entity's internal control. An audit also includes evaluating the appropriateness of accounting policies used and the reasonableness of
accounting estimates made by management, as well as evaluating the overall presentation of the consolidated financial statements.
We believe that the audit evidence we have obtained is sufficient and appropriate to provide a basis for our audit opinion.
Opinion
In our opinion, the consolidated financial statements present fairly, in all material respects, the financial position of Eastmain
Resources Inc. as at October 31, 2015 and 2014 and its financial performance and its cash flows for each of the years then ended in
accordance with International Financial Reporting Standards.
Toronto, Ontario
January 25, 2016 Chartered Accountants Licensed Public Accountants
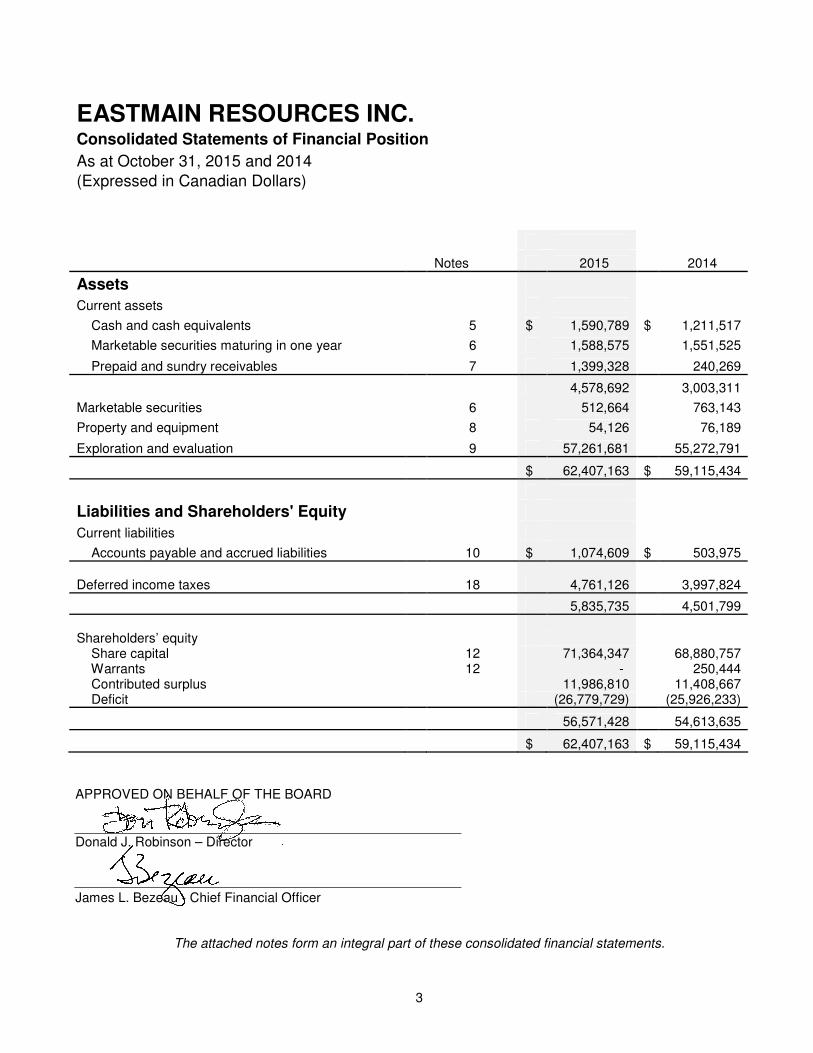
3
EASTMAIN RESOURCES INC. Consolidated Statements of Financial Position As at October 31, 2015 and 2014 (Expressed in Canadian Dollars)
Notes 2015 2014
Assets
Current assets
Cash and cash equivalents 5 $ 1,590,789 $ 1,211,517
Marketable securities maturing in one year 6 1,588,575 1,551,525
Prepaid and sundry receivables 7 1,399,328 240,269
4,578,692 3,003,311
Marketable securities 6 512,664 763,143
Property and equipment 8 54,126 76,189
Exploration and evaluation 9 57,261,681 55,272,791
$ 62,407,163 $ 59,115,434
Liabilities and Shareholders' Equity
Current liabilities
Accounts payable and accrued liabilities 10 $ 1,074,609 $ 503,975 Deferred income taxes 18 4,761,126 3,997,824
5,835,735 4,501,799 Shareholders’ equity Share capital 12 71,364,347 68,880,757 Warrants 12 - 250,444 Contributed surplus 11,986,810 11,408,667 Deficit (26,779,729) (25,926,233)
56,571,428 54,613,635
$ 62,407,163 $ 59,115,434 APPROVED ON BEHALF OF THE BOARD Donald J. Robinson – Director James L. Bezeau - Chief Financial Officer
The attached notes form an integral part of these consolidated financial statements.

4
EASTMAIN RESOURCES INC. Consolidated Statements of Loss and Comprehensive Loss For the Years Ended October 31, 2015 and 2014 (Expressed in Canadian Dollars)
Notes 2015 2014
Operating expenses
General and administrative 15 $ 1,136,950 $ 902,460 Impairment of exploration and evaluation assets 4 & 9 133,239 10,434,944
Operating loss before the following (1,270,189) (11,337,404)
Interest and other income 162,824 63,019
Realized loss on marketable securities (61,904) -
Unrealized gain (loss) on marketable securities (248,089) 202,828
Premium on flow-through shares 1,327,164 1,733,150
Net loss before income taxes (90,194) (9,338,407)
Deferred income tax recovery (expense) (763,302) 144,747 Net loss and comprehensive loss $ (853,496) $ (9,193,660)
Loss per common share, basic and dilutive 16 $ (0.006) $ (0.077)
Weighted average number of common shares
outstanding, basic and dilutive 131,521,925 119,172,637
The attached notes form an integral part of these consolidated financial statements.

5
EASTMAIN RESOURCES INC.
Consolidated Statements of Cash Flows
For the Years Ended October 31, 2015 and 2014
(Expressed in Canadian Dollars) Notes 2015 2014
Operating activities
Comprehensive loss for the year $ (853,496) $(9,193,660)
Depreciation 22,813 30,316
Impairment of exploration and evaluation assets 133,239 10,434,944
Realized loss on marketable securities 61,904 -
Unrealized loss (gain) on marketable securities 248,089 (202,828)
Premium on flow-through shares (1,327,164) (1,733,150)
Deferred income taxes 763,302 (144,747)
Stock-based compensation 204,285 124,990
Prepaid and sundry receivables (397,462) 446,077
Accounts payable and accrued liabilities 37,750 (298,367)
(1,106,740) (536,425)
Financing activities
Proceeds on issue of common shares 3,894,625 5,131,250
Exercise of warrants 170,100 -
Share issue costs (267,957) (370,229)
3,796,768 4,761,021
Investing activities
Exploration and evaluation expenditures (3,496,071) (7,803,585)
Government exploration tax credits received 1,148,468 1,892,479
Proceeds from sale of property option 50,000 -
Purchase of property and equipment (750) (8,410)
Purchase of marketable securities (1,954,263) (1,424,600)
Proceeds on sale and redemption of marketable
Securities 1,941,860 1,419,359
(2,310,756) (5,924,757)
Change in cash and cash equivalents 379,272 (1,700,161)
Cash and cash equivalents, beginning of the year 1,211,517 2,911,678
Cash and cash equivalents, end of the year 5 $ 1,590,789 $ 1,211,517
The attached notes form an integral part of these consolidated financial statements.

6
EASTMAIN RESOURCES INC.
Consolidated Statements of Shareholders’ Equity For the Years Ended October 31, 2015 and October 31, 2014
(Unaudited and Expressed in Canadian Dollars) Reserves
Common shares Warrants Contributed
Shareholders' # $ # $ surplus $ Deficit $ equity $
Balance as at November 1, 2014 120,194,507 68,880,757 6,768,750 250,444 11,408,667 (25,926,233) 54,613,635
Private placements 12,467,308 3,894,625 3,894,625
Share issue expenses (267,957) (267,957)
Premium on issue of flow-through shares (1,327,164) (1,327,164)
Share-based compensation issued 341,685 341,685
Warrants exercised 378,000 184,086 (378,000) (13,986) 170,100
Warrants expired (6,390,750) (236,458) 236,458
Comprehensive loss for the year (853,496) (853,496)
Balance as at October 31, 2015 133,039,815 71,364,347 - - 11,986,810 (26,779,729) 56,571,428
Reserves
Common shares Warrants Contributed Shareholders' # $ # $ surplus $ Deficit $ equity $
Balance as at November 1, 2013 106,627,007 65,551,080 - - 11,188,857 (16,732,573) 60,007,364
Private placements 13,537,500 5,131,250 5,131,250
Share issue expenses (370,229) (370,229)
Premium on issue of flow-through shares (1,193,050) (1,193,050)
Share-based compensation issued 219,810 219,810
Shares issued for acquisition of claims 30,000 12,150 12,150
Warrants issued (250,444) 6,768,750 250,444 -
Comprehensive loss for the year (9,193,660) (9,193,660)
Balance as at October 31, 2014 120,194,507 68,880,757 6,768,750 250,444 11,408,667 (25,926,233) 54,613,635
The attached notes form an integral part of these consolidated financial statements.

EASTMAIN RESOURCES INC. NOTES TO CONSOLIDATED FINANCIAL STATEMENTS October 31, 2015 and October 31, 2014 (Expressed in Canadian Dollars)
7
1. NATURE OF OPERATIONS AND GOING CONCERN
Eastmain Resources Inc. (the "Company" or “Eastmain”) and its wholly-owned subsidiary, Eastmain Mines Inc., are engaged in the acquisition and exploration of resource properties within Canada. The Company is a publicly-held company incorporated under the Business Corporations Act (Ontario) and its common shares are listed on the Toronto Stock Exchange under the symbol “ER”. The Company’s registered office address is 36 Toronto Street, Suite 1000, Toronto, Ontario, Canada M5C 2C5. The Company is in the exploration stage and has not yet determined whether its exploration and evaluation assets contain reserves that are economically recoverable. The continued operations of the Company and the recoverability of amounts shown for its exploration and evaluation assets are dependent upon the ability of the Company to obtain financing to complete the exploration and development of its exploration and evaluation assets, the existence of economically recoverable reserves and future profitable production, or alternatively, upon the Company’s ability to recover its costs through a disposition of its exploration and evaluation assets. The carrying cost for exploration and evaluation does not necessarily represent the present or future value of the projects. Changes in future conditions could require a material change in the amount recorded for the exploration and evaluation assets. These consolidated financial statements are prepared on the basis that the Company will continue as a going concern, which assumes that the Company will be able to continue operating for the foreseeable future and will be able to realize its assets and discharge its liabilities and commitments in the normal course of operations. As an exploration-stage Company, Eastmain does not have any sources of revenue and historically has incurred recurring operating losses. As at October 31, 2015, the Company had working capital of $3,504,083 (October 31, 2014 – $2,499,336) and shareholders’ equity of $56,571,428 (October 31, 2014 – $54,613,635). Management has assessed that this working capital is sufficient for the Company to continue as a going concern beyond one year. If the going-concern assumption was not appropriate for these audited consolidated financial statements it would be necessary to restate the Company’s assets and liabilities on a liquidation basis.
2. BASIS OF PRESENTATION
a) Statement of compliance
The consolidated financial statements of the Company have been prepared in accordance with International Accounting Reporting Standards (“IFRS”) as issued by the International Accounting Standards Board (“IASB”). These consolidated financial statements for the years ended October 31, 2015 and 2014 were reviewed and authorized for issue by the Board of Directors on January 25, 2016. b) Basis of measurement
These consolidated financial statements have been prepared on the historical-cost basis except for financial instruments classified as fair value through profit or loss, which are stated at their fair value. The consolidated financial statements are presented in Canadian dollars, which is also the Company’s functional currency. The preparation of consolidated financial statements in compliance with IFRS requires management to make certain critical accounting estimates. It also requires management to exercise judgement in applying the Company’s accounting policies. The areas involving a higher degree of judgement or complexity, or areas where estimates and assumptions are significant to the consolidated financial statements, are disclosed in Note 4. 3. SIGNIFICANT ACCOUNTING POLICIES AND FUTURE ACCOUNTING CHANGES a) Principles of consolidation
These consolidated financial statements include the accounts of the Company and its wholly-owned subsidiary Eastmain Mines Inc. All significant inter-company transactions and balances have been eliminated. b) Financial instruments Financial assets All financial assets are recognized and derecognized on the trade date, whereby the purchase or sale of a financial asset is under a contract, for which terms require delivery of the financial asset within a time frame established by the market concerned. Financial assets are initially measured at fair value plus transaction costs, except for those financial assets classified as fair value through profit or loss, in which case, the directly attributable transaction costs are expensed in the period in which they are incurred.
EASTMAIN RESOURCES INC. NOTES TO CONSOLIDATED FINANCIAL STATEMENTS October 31, 2015 and October 31, 2014 (Expressed in Canadian Dollars)
8
3. SUMMARY OF SIGNIFICANT ACCOUNTING POLICIES (Continued) Financial assets (Continued)
Financial assets are classified into the following categories: financial assets at fair value through profit or loss (“FVTPL”); held-to-maturity investments; available-for-sale financial assets; and loans and receivables. Classification depends on the nature and the purpose of the financial assets and is determined at the time of initial recognition. Financial liabilities
Financial liabilities are classified as either financial liabilities at FVTPL or other financial liabilities. Other financial liabilities
Other financial liabilities, including borrowings, are measured at fair value net of transaction costs and subsequently at amortized cost using the effective-interest method, with the interest being recognized on the effective-yield basis. The effective-interest method is a method of calculating the amortized cost of a financial liability and allocating interest costs over the relevant period. The effective interest rate is the rate that exactly discounts estimated future cash payments over the expected life of the financial liability or, where appropriate, to the net carrying amount on initial recognition. Derecognition of financial liabilities
The Company derecognizes financial liabilities when the obligations are discharged, cancelled or expired. The Company has designated each of its significant categories of financial instruments as follows:
Cash and cash equivalents FVTPL Marketable securities FVTPL Other receivables Loans and receivables Accounts payable and accrued liabilities Other financial liabilities Deferred premium on flow-through shares Other financial liabilities
Impairment of financial assets
Financial assets are assessed for indicators of impairment at the end of each reporting period. Financial assets are considered to be impaired when there is objective evidence that, as a result of one or more events that occurred after the initial recognition of the financial asset, the estimated future cash flows of the investment has been negatively impacted. Evidence of impairment could include: significant financial difficulty of the issuer or counterparty; default or delinquency in interest or principal payments; or the likelihood that the borrower will enter bankruptcy or financial reorganization. The carrying amount of financial assets is reduced by any impairment loss directly for all financial assets, with the exception of accounts or loans receivable, where the carrying amount is reduced through the use of an allowance account. When an account or loan receivable is considered uncollectible, it is written off against the allowance account. Subsequent recoveries of amounts previously written off are credited to the allowance account. Changes in the carrying amount of the allowance account are recognized in profit or loss. If, in a subsequent period, the amount of the impairment loss decreases and that decrease can be objectively related to an event occurring after the impairment recognition, the previously recognized impairment loss is reversed through profit and loss, to the extent that the restated carrying amount does not exceed the amortized cost that would have existed, had the impairment not been recognized. Financial instruments recorded at fair value
Financial instruments recorded at fair value on the consolidated statements of financial position are classified using a fair-value hierarchy that reflects the significance of the inputs used in making the measurements. The fair-value hierarchy has the following levels: Level 1 – valuation based on unadjusted quoted prices in active markets for identical assets or liabilities; Level 2 – valuation techniques based on inputs, other than quoted prices included in Level 1, that are either directly (i.e. as prices) or indirectly (i.e. derived from prices) observable for the asset or liability; and Level 3 – valuation techniques using inputs for the asset or liability that are not based on observable market data (unobservable inputs). As at October 31, 2015 and October 31, 2014, cash and cash equivalents and marketable securities were classified as Level 1 on the consolidated financial statements. Impairment of non-financial assets
At the end of each reporting period, Management reviews the carrying amounts of its non-financial assets with finite lives to determine whether there is any indication that those assets have suffered an impairment loss. Where such an indication exists, the recoverable amount is adjusted to the higher of the asset’s fair value less cost to sell, or its value in use. In addition, long-lived assets that are not amortized are subject to an annual impairment assessment. Management has assessed its non-financial assets and has determined that impairment existed on some of its exploration and evaluation assets (Note 4(b)).

EASTMAIN RESOURCES INC. NOTES TO CONSOLIDATED FINANCIAL STATEMENTS October 31, 2015 and October 31, 2014 (Expressed in Canadian Dollars)
9
3. SUMMARY OF SIGNIFICANT ACCOUNTING POLICIES (Continued) c) Exploration and evaluation
Recognition and measurement
Exploration and evaluation assets, including the costs of acquiring licenses and directly attributable general and administrative costs, are initially capitalized as exploration and evaluation. These costs are accumulated by property, pending the determination of technical feasibility and commercial viability. Pre-license costs are expensed as incurred. Pre-exploration costs are expensed unless it is considered probable that they will generate future economic benefits. The recoverability of amounts shown for exploration and evaluation is dependent upon the ability of the Company to obtain financing to complete the exploration and development of its mineral resource properties, the existence of economically recoverable reserves and future profitable production, or alternatively, upon the Company’s ability to recover its costs through a disposition of its mineral resource properties. The amounts shown for exploration and evaluation do not necessarily represent present or future value. Changes in future conditions could require a material change in the amount recorded for exploration and evaluation. The technical feasibility and commercial viability of extracting a mineral resource from a property is considered to be determinable when proven and/or probable reserves are concluded to exist and all necessary permits have been received to commence production. A review of each property is carried out at least annually. Upon determination of technical feasibility and commercial viability, exploration and evaluation is first tested for impairment and then reclassified to property and equipment or expensed to the statement of loss and comprehensive loss to the extent of any impairment. Title
Ownership in a mineral property involves certain risk due to the difficulties in determining the validity of certain claims as well as the potential for problems arising from the frequently ambiguous conveyance history, characteristic of many mineral interests. The Company has investigated the ownership of its mineral properties and, to the best of its knowledge, ownership of its interests are in good standing. Impairment
Exploration and evaluation assets are assessed for impairment if: (i) sufficient data exists to determine technical feasibility and commercial viability; and (ii) facts and circumstances suggest that the carrying amount exceeds the recoverable amount. An impairment loss is recognized in the consolidated statement of loss and comprehensive loss if the carrying amount of a property exceeds its estimated recoverable amount. The recoverable amount of property used in the assessment of impairment of exploration and evaluation assets is the greater of its value in use (“VIU”) and its fair value less costs to sell (“FVLCTS”). VIU is determined by estimating the present value of the future net cash flows at a pre-tax discount rate that reflects current market assessment of the time value of money and the risks specific to the property. FVLCTS refers to the amount obtainable from the sale of a property in an arm’s-length transaction between knowledgeable, willing parties, less costs of disposal. For a property that does not generate largely independent cash flows, the recoverable amount is determined for the cash generating unit to which the property belongs. Impairment losses previously recognized are assessed at each reporting date for any indications that the loss has decreased or no longer exists. An impairment loss is reversed if there has been a change in the estimates used to determine the recoverable amount, only to the extent that the property's carrying amount does not exceed the carrying amount that would have been determined if no impairment loss had been recognized. Impairment analyses are performed continually. Ongoing expenditures on impaired properties are written off as incurred, until such time as an estimated recovery in excess of the carrying value can be demonstrated. d) Decommissioning liabilities The Company’s activities give rise to dismantling, decommissioning and site disturbance remediation activities. Provision is made for the estimated cost of site restoration. Decommissioning obligations are measured at the present value of management’s best estimate of expenditures required to settle the present obligation at the balance sheet date. The fair value of the estimated obligation is recorded as a liability with a corresponding increase in the carrying amount of the related asset. The obligation is subsequently adjusted at the end of each period to reflect the passage of time and changes in the estimated future cash flows underlying the obligation. The increase in the provision due to the passage of time is recognized as accretion costs, whereas increases or decreases due to changes in the estimated future cash flows or changes in the discount rate are capitalized. Actual costs incurred upon settlement of the decommissioning obligations are charged against the provision to the extent the provision was established. As at October 31, 2015 and October 31, 2014, the Company had no decommissioning liabilities.

EASTMAIN RESOURCES INC. NOTES TO CONSOLIDATED FINANCIAL STATEMENTS October 31, 2015 and October 31, 2014 (Expressed in Canadian Dollars)
10
3. SUMMARY OF SIGNIFICANT ACCOUNTING POLICIES (Continued) e) Cash and cash equivalents Cash equivalents consist of cash deposits in banks and include cash and short-term money-market instruments that are readily convertible to cash with an original term of less than 90 days. f) Property and equipment Upon initial acquisition, property and equipment are valued at cost, being the purchase price and the directly attributable costs of acquisition or construction required to bring the assets to the location and in the condition necessary for these assets to be capable of operating in the manner intended by management. In subsequent periods, property and equipment are stated at cost less accumulated depreciation and any impairment in value, while land is stated at cost less any impairment in value and is not depreciated. Each component or part of property and equipment with a cost that is significant in relation to the total cost of the item will be depreciated separately, unless there is no difference in depreciation on the respective components. Depreciation is recorded on a declining-balance basis over the estimated useful life of the asset using the following rates: Office equipment – 30%; and Field equipment – 30%. g) Proportionate cost-sharing ventures Certain of the Company’s exploration and evaluation activities are conducted jointly with others. These consolidated financial statements reflect only the Company’s interest in such activities. The Company holds certain interests in mineral properties through joint operating agreements. None of its operations are carried out through joint venture entities.
h) Share-based payment transactions The fair value of share options granted to employees and non-employees is recognized as an expense over the vesting period with a corresponding increase in equity. An individual is classified as a direct employee when the individual is an employee for legal or tax purposes. Directors and officers are deemed to be employees for share-based compensation tax purposes. The fair value of all stock options granted is measured at the grant date and recognized over the period during which the options vest. The fair value of the options granted is measured using the Black-Scholes option-pricing model, taking into consideration amounts believed to approximate the volatility of the trading price of the Company’s stock, the expected life of the award of the stock-based compensation, the share price at the close of trading on the day immediately preceding the grant, and the risk-free interest rate. The amount recognized as an expense is recognized as either a charge to profit and loss or as an addition to mineral properties’ exploration and evaluation costs. Stock option expense is added to the properties in a consistent manner in which exploration wages have been added to the properties. Consideration received on the exercise of stock options is credited directly to share capital. All of the Company’s options were fully vested at the time of issue. The fair value of share-based payment transactions to non-employees and other share-based payments, including shares issued to acquire exploration and evaluation properties, are based on the fair value of the goods and services received. If the fair value cannot be estimated reliably, the share-based payment transaction is measured at the fair value of the equity instruments granted at the date the Company receives the goods or services. The fair value related to the issuance of broker warrants is also measured at the date that the Company receives the services. i) Flow-through share financing Under Canadian tax legislation, a company is permitted to issue flow-through shares, whereby the Company agrees to incur qualifying exploration and evaluation expenditures and renounce the related income tax deductions to the investors. Proceeds from the issuance of these shares are allocated between share capital and the sale of the related tax benefit. The allocation is made based on the difference between the quoted price of the existing shares and the price that the investor pays for the shares. A liability is recognized for the difference. The liability is reduced and the reduction of the premium liability is recorded in other income on a pro-rata basis to the corresponding eligible expenditures that have been incurred.
EASTMAIN RESOURCES INC. NOTES TO CONSOLIDATED FINANCIAL STATEMENTS October 31, 2015 and October 31, 2014 (Expressed in Canadian Dollars)
11
3. SUMMARY OF SIGNIFICANT ACCOUNTING POLICIES (Continued) j) Provisions A provision is recognized if, as a result of a past event, the Company has a present legal or constructive obligation that can be estimated reliably, and it is probable that an outflow of economic benefits will be required to settle the obligation. Provisions are determined by discounting the expected future cash flows at a pre-tax rate that reflects current market assessments of the time value of money and the risks specific to the liability. The unwinding of the discount is recognized as a finance cost. As at October 31, 2015 and October 31, 2014, the Company had no material provisions. k) Credit on duties refundable for loss and refundable tax credits for resource investment The Company is entitled to a refundable credit on duties of 16% for eligible losses under the Québec Mining Duties Act and a refundable resource investment tax credit of 31% under the Québec Income Tax Act. These credits are applicable to qualified exploration expenditures on properties located within the Province of Québec. Such credits are recognized using the cost reduction method. Accordingly, they are recorded as a reduction of the related exploration expenses incurred. Application for these credits is subject to verification and as such, they are recognized only when they are actually received or when a notice of assessment confirming the amount to be paid is issued. l) Common shares Common shares are classified as equity. Incremental costs directly attributable to the issue of common shares are recognized as a deduction from equity, net of any tax effects. m) Basic and diluted loss per share The Company presents basic and diluted loss-per-share data for its common shares, calculated by dividing the loss attributable to common shareholders of the Company by the weighted average number of shares outstanding during the period. Diluted loss per share is determined by adjusting the loss attributable to shareholders and the weighted average number of common shares outstanding, during the period for the effect of warrants and options outstanding, that may add to the total number of common shares. Diluted loss per share is calculated using the treasury stock method. Under the treasury stock method, the weighted average number of common shares outstanding, used for the calculation of diluted loss per share, assumes that the proceeds to be received on the exercise of dilutive stock options and warrants are used to repurchase common shares at the average market price during the year.
n) Restoration, rehabilitation and environmental obligations A legal or constructive obligation to incur restoration, rehabilitation and environmental costs may arise when environmental disturbance is caused by exploration, development or ongoing production activities on a mineral property. The costs of complying with these requirements at the start of a project are capitalized as incurred. The carrying value is amortized over the expected life of the related asset. A provision for restoration, rehabilitation and environmental costs and legal claims, where applicable, is recognized when: (i) the Company has a present legal or constructive obligation as a result of past events; (ii) it is likely that an outflow of resources will be required to settle the obligation; and (iii) the amount can be reliably estimated. Provisions are measured, at management’s best estimate of the expenditure to settle the obligation at the end of the reporting period, and discounted to present value where the effect is material. Increases to provisions which may be necessary from time-to-time are recognized as interest expense. The present value of the reclamation liabilities may be subject to change, based on management’s re-evaluation of estimates, changes in remediation technology, or changes to the applicable laws and regulations prescribed by regulatory authorities, which may affect the ultimate cost of remediation and reclamation. Changes to the provisions are reflected in the period in which they occur. Provision for environmental restoration represents the legal and constructive obligations associated with the eventual closure of the Company’s property, plant and equipment. These obligations consist of costs of removal of tangible assets and the cost of reclamation and monitoring activities. The discount rate is based on pre-tax rates that reflect current market conditions for the time value of money and the risks specific to the liability, excluding risks for which future cash-flow estimates have already been adjusted. As at October 31, 2015 and October 31, 2014 the Company did not have any asset restoration, rehabilitation or environmental obligations.

EASTMAIN RESOURCES INC. NOTES TO CONSOLIDATED FINANCIAL STATEMENTS October 31, 2015 and October 31, 2014 (Expressed in Canadian Dollars)
12
3. SUMMARY OF SIGNIFICANT ACCOUNTING POLICIES (Continued)
o) Income taxes The Company uses the asset and liability method of accounting for income taxes. Under this method, deferred income tax assets and liabilities are recognized for the estimated deferred income tax consequences attributable to differences between the financial statement carrying value of assets and liabilities, and their respective income tax bases. Deferred income tax assets and liabilities are measured using income tax rates in effect for the period in which those temporary differences are expected to be recovered or settled. The effect on deferred income tax assets and liabilities due to a change in income tax rates or laws is recognized as a part of the provision for income taxes in the period in which the changes are substantially enacted. Deferred income tax benefits attributable to these differences, if any, are recognized to the extent that realization of the benefit is more likely than not.
p) New accounting standards adopted during the year IAS 32 – Financial Instruments, Presentation, (“IAS 32”) is effective for annual periods beginning on or after January 1, 2014. IAS 32 was amended to clarify that the right of offset must be available on the current date and cannot be contingent on a future date. As at November 1, 2014, the Company adopted this pronouncement and there was no material impact on the Company’s consolidated financial statements.
q) Standards issued but not yet effective
Financial Instruments
IFRS 9 – Financial Instruments, issued by the IASB in October 2010 is intended to entirely replace IAS 39 Financial Instruments: Recognition and Measurement, using a single approach to determine whether a financial asset is measured at amortized cost or fair value, thereby reducing the complexity of the multiple rules in IAS 39. Most of the requirements in IAS 39 for the classification and measurement of financial liabilities were carried forward unchanged to IFRS 9. The approach of IFRS 9 is based on how an entity manages its financial instruments in the context of its business model and the contractual cash-flow characteristics of each financial asset. The new standard also requires the use of a single method of impairment determination, which replaces the multiple methods available under IAS 39. IFRS 9 will become effective for annual financial reporting periods beginning on or after January 1, 2018. The Company is currently evaluating the impact this final standard is expected to have on its consolidated financial statements. 4. USE OF ESTIMATES AND JUDGEMENTS The preparation of these consolidated financial statements under IFRS requires management to make certain estimates, judgements and assumptions about future events that affect the amounts reported in the consolidated financial statements and related notes to the consolidated financial statements. Although these estimates are based on management’s best knowledge of the amounts, events or actions, actual results may differ from those estimates and these differences could be material. a) Significant judgements in applying accounting policies The areas which require management to make significant judgements in determining carrying values include, but are not limited to: Exploration and evaluation assets; and
In estimating the recoverability of capitalized exploration and evaluation assets, management is required to apply judgement in determining whether technical feasibility and commercial viability can be demonstrated for its mineral properties. Once technical feasibility and commercial viability of a property can be demonstrated, it is reclassified from exploration and evaluation assets to property and equipment, and subject to different accounting treatment. As at October 31, 2015 and 2014 management deemed that no reclassification of exploration and evaluation assets was required. Income taxes and recoverability of potential deferred tax assets
In assessing the probability of realizing income tax assets recognized, management makes estimates related to expectations of future taxable income, applicable tax planning opportunities, expected timing of reversals of existing temporary differences, and the likelihood that tax positions taken will be sustained upon examination by applicable tax authorities. In making its assessments, management gives additional weight to both positive and negative evidence that can be objectively verified. Estimates of future taxable income are based on forecasted cash flows from operations and the application of existing tax laws in each jurisdiction. The Company considers whether relevant tax planning opportunities are within the Company's control, are feasible, and are within management's ability to implement.

EASTMAIN RESOURCES INC. NOTES TO CONSOLIDATED FINANCIAL STATEMENTS October 31, 2015 and October 31, 2014 (Expressed in Canadian Dollars)
13
4. USE OF ESTIMATES AND JUDGEMENTS (Continued)
Income taxes and recoverability of potential deferred tax assets (Continued)
Examination by applicable tax authorities is based on individual facts and circumstances of the relevant tax position examined in light of all available evidence. Where applicable tax laws and regulations are either unclear or subject to ongoing varying interpretations, it is reasonably possible that changes in these estimates can occur that materially affect the amounts of income tax assets recognized. Also, future changes in tax laws could limit the Company from realizing the tax benefits from deferred tax assets. The Company reassesses unrecognized income tax assets at each reporting period. b) Significant accounting estimates and assumptions The areas which require management to make significant estimates and assumptions in determining carrying values include, but are not limited to: Impairment of exploration and evaluation assets;
When there are indications that an asset may be impaired, the Company is required to estimate the asset’s recoverable amount. The recoverable amount is the greater of value-in-use and fair value less costs to sell. Determining the value requires the Company to estimate future cash flows associated with the assets and a suitable discount rate in order to calculate the present value. During 2015 the Company’s exploration and evaluation assets were written down by $133,239 (2014 – $10,434,944). Where an impairment loss subsequently reverses, the carrying value of the asset (or cash generating unit) is increased to the revised estimate of its recoverable amount, unless that amount exceeds the carrying value recorded prior to the recognition of the impairment loss, in which case the carrying value would be re-instated to its pre-impairment-loss carrying value. A reversal of an impairment loss is recognized immediately in the income statement. Management estimates of mineral prices, recoverable reserves, operating capital and restoration costs are subject to certain risks and uncertainties that may affect the recoverability of exploration and evaluation assets. Although management has made its best estimate of these factors, it is possible that changes could occur in the near term that could adversely affect management’s estimate of net cash flow to be generated from its projects. Share-based payments;
The amount expensed for share-based payments is derived from the application of the Black-Scholes option pricing model, which is highly dependent on the expected volatility of the Company’s shares and the expected life of the options. The Company uses an expected volatility rate for its shares based on past trading data. Actual volatility may be significantly different. While the estimate of share-based payments can have a material impact on the operating results reported by the Company, it is a non-cash charge and as such has no impact on the Company’s cash position or future cash flows. Estimates and underlying assumptions are reviewed on an ongoing basis. Revisions to estimates are recognized in the period in which the estimates are revised and in any future periods affected. Depreciation and impairment of property and equipment; and
The determination of the useful life of property and equipment is based on management estimates. Indicators of impairment are also subject to management’s estimates. Estimation of restoration, rehabilitation and environmental obligations.
Restoration, rehabilitation and environmental liabilities are estimated based on the Company’s interpretation of current regulatory requirements and constructive obligations. These estimates are measured at fair value, which is determined by the net present value of estimated future cash expenditures for the settlement of restoration, rehabilitation and environmental liabilities that may occur upon ceasing exploration and evaluation activities. Such estimates are subject to change, based on changes in laws and regulations and negotiations with regulatory authorities. Management’s determination that there are currently no provisions required for site restoration is based on facts and circumstances that existed during the year.
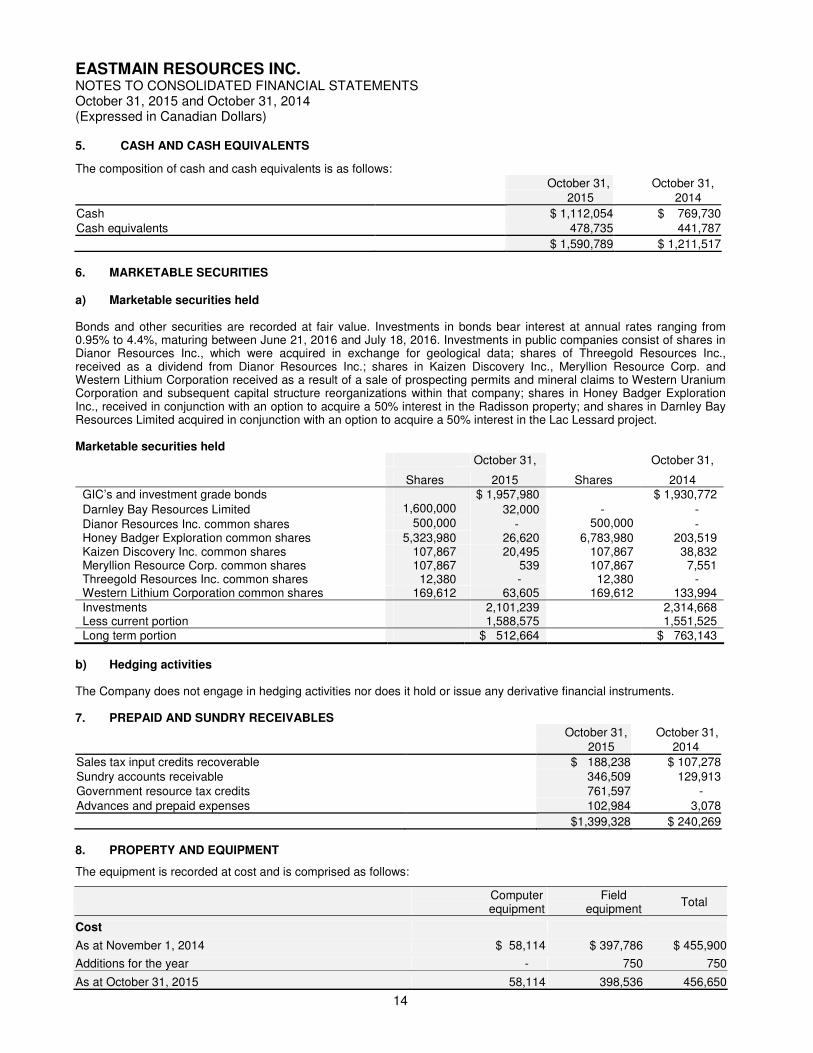
EASTMAIN RESOURCES INC. NOTES TO CONSOLIDATED FINANCIAL STATEMENTS October 31, 2015 and October 31, 2014 (Expressed in Canadian Dollars)
14
5. CASH AND CASH EQUIVALENTS
The composition of cash and cash equivalents is as follows: October 31, October 31, 2015 2014 Cash $ 1,112,054 $ 769,730 Cash equivalents 478,735 441,787 $ 1,590,789 $ 1,211,517 6. MARKETABLE SECURITIES a) Marketable securities held Bonds and other securities are recorded at fair value. Investments in bonds bear interest at annual rates ranging from 0.95% to 4.4%, maturing between June 21, 2016 and July 18, 2016. Investments in public companies consist of shares in Dianor Resources Inc., which were acquired in exchange for geological data; shares of Threegold Resources Inc., received as a dividend from Dianor Resources Inc.; shares in Kaizen Discovery Inc., Meryllion Resource Corp. and Western Lithium Corporation received as a result of a sale of prospecting permits and mineral claims to Western Uranium Corporation and subsequent capital structure reorganizations within that company; shares in Honey Badger Exploration Inc., received in conjunction with an option to acquire a 50% interest in the Radisson property; and shares in Darnley Bay Resources Limited acquired in conjunction with an option to acquire a 50% interest in the Lac Lessard project. Marketable securities held
October 31, October 31,
Shares 2015 Shares 2014 GIC’s and investment grade bonds $ 1,957,980 $ 1,930,772 Darnley Bay Resources Limited 1,600,000 32,000 - - Dianor Resources Inc. common shares 500,000 - 500,000 - Honey Badger Exploration common shares 5,323,980 26,620 6,783,980 203,519 Kaizen Discovery Inc. common shares 107,867 20,495 107,867 38,832 Meryllion Resource Corp. common shares 107,867 539 107,867 7,551 Threegold Resources Inc. common shares 12,380 - 12,380 - Western Lithium Corporation common shares 169,612 63,605 169,612 133,994 Investments 2,101,239 2,314,668 Less current portion 1,588,575 1,551,525 Long term portion $ 512,664 $ 763,143
b) Hedging activities The Company does not engage in hedging activities nor does it hold or issue any derivative financial instruments. 7. PREPAID AND SUNDRY RECEIVABLES October 31, October 31, 2015 2014 Sales tax input credits recoverable $ 188,238 $ 107,278 Sundry accounts receivable 346,509 129,913 Government resource tax credits 761,597 - Advances and prepaid expenses 102,984 3,078 $1,399,328 $ 240,269 8. PROPERTY AND EQUIPMENT
The equipment is recorded at cost and is comprised as follows:
Computer equipment
Field equipment Total
Cost
As at November 1, 2014 $ 58,114 $ 397,786 $ 455,900
Additions for the year - 750 750
As at October 31, 2015 58,114 398,536 456,650
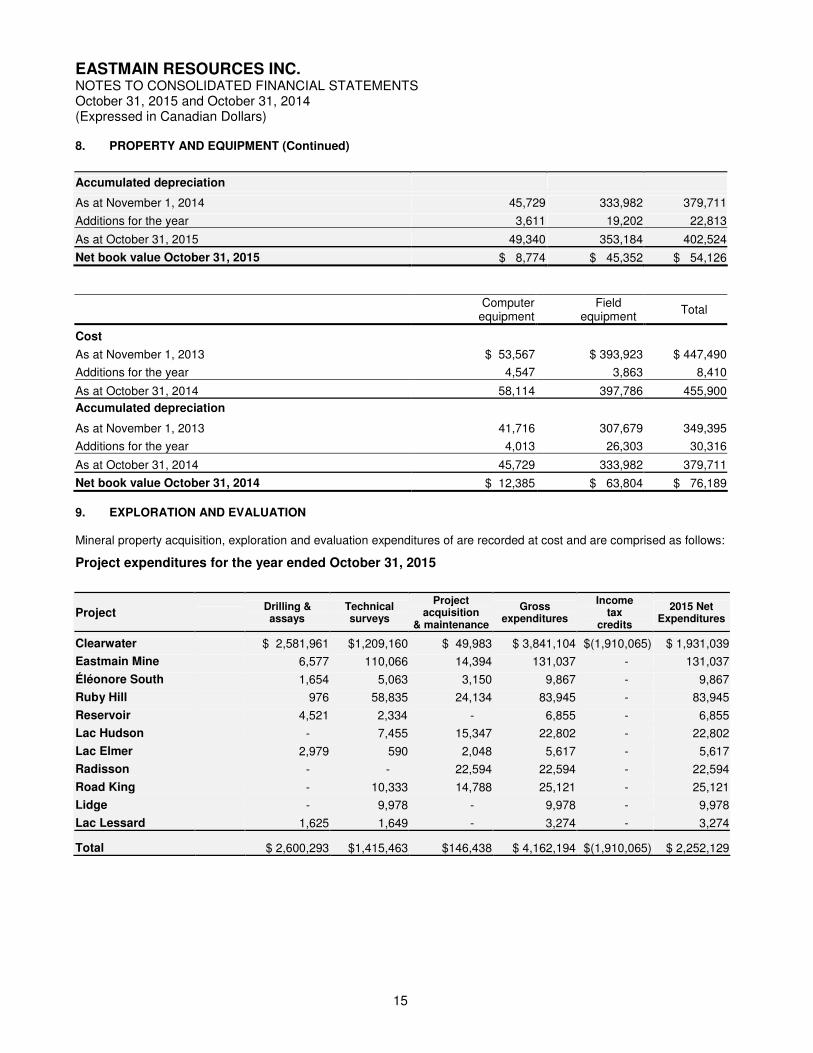
EASTMAIN RESOURCES INC. NOTES TO CONSOLIDATED FINANCIAL STATEMENTS October 31, 2015 and October 31, 2014 (Expressed in Canadian Dollars)
15
8. PROPERTY AND EQUIPMENT (Continued)
Accumulated depreciation
As at November 1, 2014 45,729 333,982 379,711
Additions for the year 3,611 19,202 22,813
As at October 31, 2015 49,340 353,184 402,524
Net book value October 31, 2015 $ 8,774 $ 45,352 $ 54,126
Computer equipment
Field equipment Total
Cost
As at November 1, 2013 $ 53,567 $ 393,923 $ 447,490
Additions for the year 4,547 3,863 8,410
As at October 31, 2014 58,114 397,786 455,900 Accumulated depreciation
As at November 1, 2013 41,716 307,679 349,395
Additions for the year 4,013 26,303 30,316
As at October 31, 2014 45,729 333,982 379,711
Net book value October 31, 2014 $ 12,385 $ 63,804 $ 76,189 9. EXPLORATION AND EVALUATION Mineral property acquisition, exploration and evaluation expenditures of are recorded at cost and are comprised as follows:
Project expenditures for the year ended October 31, 2015
Project Drilling & assays
Technical surveys
Project acquisition
& maintenance
Gross expenditures
Income tax
credits
2015 Net Expenditures
Clearwater $ 2,581,961 $1,209,160 $ 49,983 $ 3,841,104 $(1,910,065) $ 1,931,039
Eastmain Mine 6,577 110,066 14,394 131,037 - 131,037
Éléonore South 1,654 5,063 3,150 9,867 - 9,867
Ruby Hill 976 58,835 24,134 83,945 - 83,945
Reservoir 4,521 2,334 - 6,855 - 6,855
Lac Hudson - 7,455 15,347 22,802 - 22,802
Lac Elmer 2,979 590 2,048 5,617 - 5,617
Radisson - - 22,594 22,594 - 22,594
Road King - 10,333 14,788 25,121 - 25,121
Lidge - 9,978 - 9,978 - 9,978
Lac Lessard 1,625 1,649 - 3,274 - 3,274
Total $ 2,600,293 $1,415,463 $146,438 $ 4,162,194 $(1,910,065) $ 2,252,129

EASTMAIN RESOURCES INC. NOTES TO CONSOLIDATED FINANCIAL STATEMENTS October 31, 2015 and October 31, 2014 (Expressed in Canadian Dollars)
16
9. EXPLORATION AND EVALUATION (Continued)
Cumulative acquisition, exploration and evaluation expenditures as at October 31, 2015
Project
Balance November 1,
2014
2015 Net expenditures
Write-downs
Recoveries Balance October 31,
2015
Clearwater $ 39,448,418 $ 1,931,039 $ - $ - $ 41,379,457 Eastmain Mine 13,462,168 131,037 - - 13,593,205 Éléonore South - 9,867 (9,867) - - Ruby Hill - 83,945 (83,945) - - Reservoir - 6,855 (6,855) - - Lac Hudson 928,369 22,802 - - 951,171 Lac Elmer 821,254 5,617 - - 826,871 Radisson - 22,594 (22,594) - - Road King 276,658 25,121 - - 301,779 Lidge - 9,978 (9,978) - - Lac Lessard 335,924 3,274 - (130,000) 209,198
$ 55,272,791 $ 2,252,129 $(133,239) $(130,000) $ 57,261,681
Project expenditures for the year ended October 31, 2014
Project Drilling & assays
Technical surveys
Project acquisition
& maintenance
Gross expenditures
Income tax
credits
2014 Net Expenditures
Clearwater $ 3,047,614 $ 867,256 $ 12,326 $ 3,927,196 $(1,774,142) $ 2,153,054
Eastmain Mine 184,946 291,334 6,011 482,291 (248,250) 234,041
Éléonore South 2,928 18,373 36,132 57,433 - 57,433
Ruby Hill 62,021 631,277 10,751 704,049 - 704,049
Reservoir 570,432 147,248 19,599 737,279 - 737,279
Lac Hudson - 65,748 38,723 104,471 - 104,471
Lac Elmer - 211,694 22,709 234,403 - 234,403
Radisson - 1,260 5,969 7,229 - 7,229
Road King - 93,363 - 93,363 - 93,363
Dyna - 163,270 - 163,270 - 163,270
Lidge - 35,345 4,572 39,917 - 39,917
Lac Lessard 36,486 244,340 6,072 286,898 - 286,898
Total $ 3,904,427 $ 2,770,508 $ 162,864 $ 6,837,799 $(2,022,392) $ 4,815,407
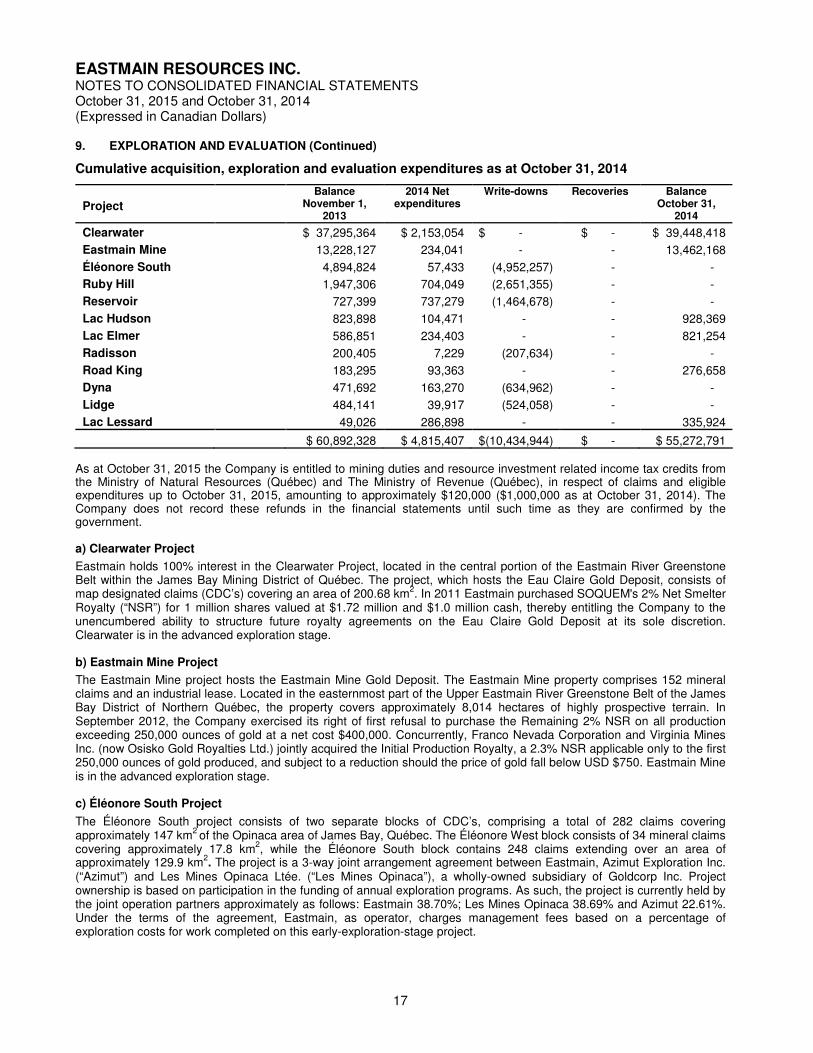
EASTMAIN RESOURCES INC. NOTES TO CONSOLIDATED FINANCIAL STATEMENTS October 31, 2015 and October 31, 2014 (Expressed in Canadian Dollars)
17
9. EXPLORATION AND EVALUATION (Continued)
Cumulative acquisition, exploration and evaluation expenditures as at October 31, 2014
Project
Balance November 1,
2013
2014 Net expenditures
Write-downs
Recoveries Balance October 31,
2014
Clearwater $ 37,295,364 $ 2,153,054 $ - $ - $ 39,448,418 Eastmain Mine 13,228,127 234,041 - - 13,462,168 Éléonore South 4,894,824 57,433 (4,952,257) - - Ruby Hill 1,947,306 704,049 (2,651,355) - - Reservoir 727,399 737,279 (1,464,678) - - Lac Hudson 823,898 104,471 - - 928,369 Lac Elmer 586,851 234,403 - - 821,254 Radisson 200,405 7,229 (207,634) - - Road King 183,295 93,363 - - 276,658 Dyna 471,692 163,270 (634,962) - - Lidge 484,141 39,917 (524,058) - - Lac Lessard 49,026 286,898 - - 335,924
$ 60,892,328 $ 4,815,407 $(10,434,944) $ - $ 55,272,791 As at October 31, 2015 the Company is entitled to mining duties and resource investment related income tax credits from the Ministry of Natural Resources (Québec) and The Ministry of Revenue (Québec), in respect of claims and eligible expenditures up to October 31, 2015, amounting to approximately $120,000 ($1,000,000 as at October 31, 2014). The Company does not record these refunds in the financial statements until such time as they are confirmed by the government. a) Clearwater Project
Eastmain holds 100% interest in the Clearwater Project, located in the central portion of the Eastmain River Greenstone Belt within the James Bay Mining District of Québec. The project, which hosts the Eau Claire Gold Deposit, consists of map designated claims (CDC’s) covering an area of 200.68 km2. In 2011 Eastmain purchased SOQUEM's 2% Net Smelter Royalty (“NSR”) for 1 million shares valued at $1.72 million and $1.0 million cash, thereby entitling the Company to the unencumbered ability to structure future royalty agreements on the Eau Claire Gold Deposit at its sole discretion. Clearwater is in the advanced exploration stage. b) Eastmain Mine Project
The Eastmain Mine project hosts the Eastmain Mine Gold Deposit. The Eastmain Mine property comprises 152 mineral claims and an industrial lease. Located in the easternmost part of the Upper Eastmain River Greenstone Belt of the James Bay District of Northern Québec, the property covers approximately 8,014 hectares of highly prospective terrain. In September 2012, the Company exercised its right of first refusal to purchase the Remaining 2% NSR on all production exceeding 250,000 ounces of gold at a net cost $400,000. Concurrently, Franco Nevada Corporation and Virginia Mines Inc. (now Osisko Gold Royalties Ltd.) jointly acquired the Initial Production Royalty, a 2.3% NSR applicable only to the first 250,000 ounces of gold produced, and subject to a reduction should the price of gold fall below USD $750. Eastmain Mine is in the advanced exploration stage. c) Éléonore South Project
The Éléonore South project consists of two separate blocks of CDC’s, comprising a total of 282 claims covering approximately 147 km2 of the Opinaca area of James Bay, Québec. The Éléonore West block consists of 34 mineral claims covering approximately 17.8 km2, while the Éléonore South block contains 248 claims extending over an area of approximately 129.9 km2. The project is a 3-way joint arrangement agreement between Eastmain, Azimut Exploration Inc. (“Azimut”) and Les Mines Opinaca Ltée. (“Les Mines Opinaca”), a wholly-owned subsidiary of Goldcorp Inc. Project ownership is based on participation in the funding of annual exploration programs. As such, the project is currently held by the joint operation partners approximately as follows: Eastmain 38.70%; Les Mines Opinaca 38.69% and Azimut 22.61%. Under the terms of the agreement, Eastmain, as operator, charges management fees based on a percentage of exploration costs for work completed on this early-exploration-stage project.
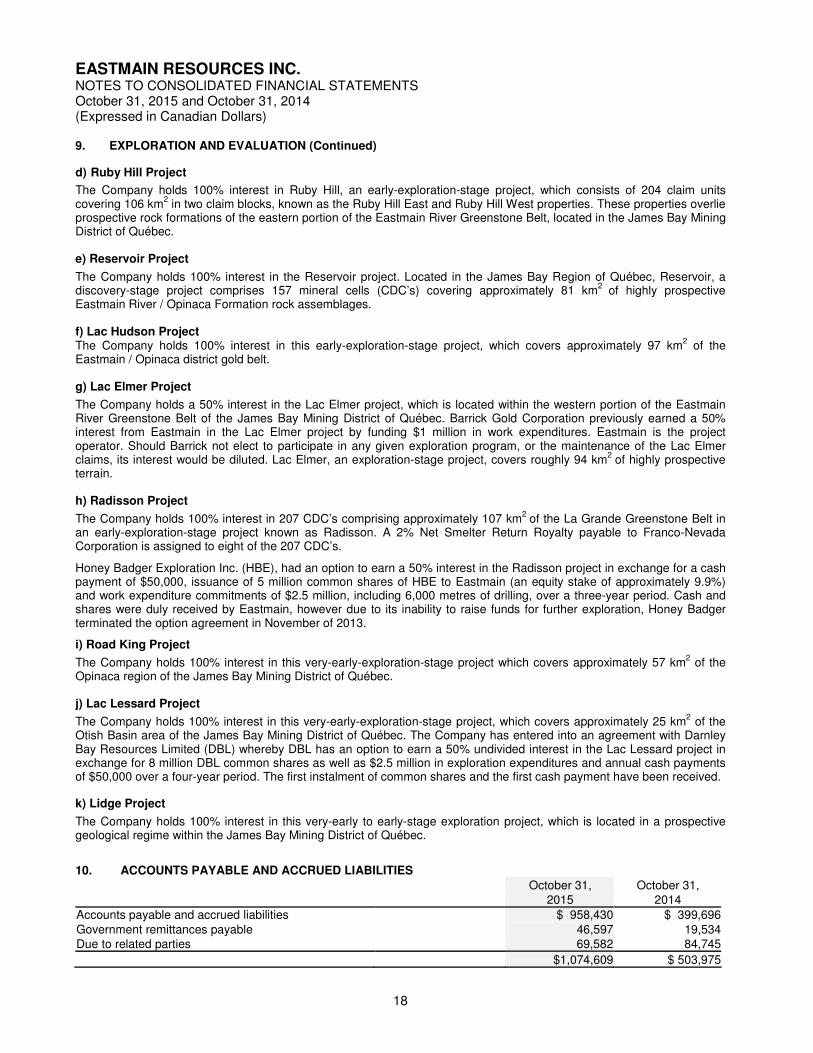
EASTMAIN RESOURCES INC. NOTES TO CONSOLIDATED FINANCIAL STATEMENTS October 31, 2015 and October 31, 2014 (Expressed in Canadian Dollars)
18
9. EXPLORATION AND EVALUATION (Continued) d) Ruby Hill Project
The Company holds 100% interest in Ruby Hill, an early-exploration-stage project, which consists of 204 claim units covering 106 km2 in two claim blocks, known as the Ruby Hill East and Ruby Hill West properties. These properties overlie prospective rock formations of the eastern portion of the Eastmain River Greenstone Belt, located in the James Bay Mining District of Québec. e) Reservoir Project
The Company holds 100% interest in the Reservoir project. Located in the James Bay Region of Québec, Reservoir, a discovery-stage project comprises 157 mineral cells (CDC’s) covering approximately 81 km2 of highly prospective Eastmain River / Opinaca Formation rock assemblages. f) Lac Hudson Project The Company holds 100% interest in this early-exploration-stage project, which covers approximately 97 km2 of the Eastmain / Opinaca district gold belt. g) Lac Elmer Project
The Company holds a 50% interest in the Lac Elmer project, which is located within the western portion of the Eastmain River Greenstone Belt of the James Bay Mining District of Québec. Barrick Gold Corporation previously earned a 50% interest from Eastmain in the Lac Elmer project by funding $1 million in work expenditures. Eastmain is the project operator. Should Barrick not elect to participate in any given exploration program, or the maintenance of the Lac Elmer claims, its interest would be diluted. Lac Elmer, an exploration-stage project, covers roughly 94 km2 of highly prospective terrain. h) Radisson Project
The Company holds 100% interest in 207 CDC’s comprising approximately 107 km2 of the La Grande Greenstone Belt in an early-exploration-stage project known as Radisson. A 2% Net Smelter Return Royalty payable to Franco-Nevada Corporation is assigned to eight of the 207 CDC’s.
Honey Badger Exploration Inc. (HBE), had an option to earn a 50% interest in the Radisson project in exchange for a cash payment of $50,000, issuance of 5 million common shares of HBE to Eastmain (an equity stake of approximately 9.9%) and work expenditure commitments of $2.5 million, including 6,000 metres of drilling, over a three-year period. Cash and shares were duly received by Eastmain, however due to its inability to raise funds for further exploration, Honey Badger terminated the option agreement in November of 2013.
i) Road King Project
The Company holds 100% interest in this very-early-exploration-stage project which covers approximately 57 km2 of the Opinaca region of the James Bay Mining District of Québec. j) Lac Lessard Project
The Company holds 100% interest in this very-early-exploration-stage project, which covers approximately 25 km2 of the Otish Basin area of the James Bay Mining District of Québec. The Company has entered into an agreement with Darnley Bay Resources Limited (DBL) whereby DBL has an option to earn a 50% undivided interest in the Lac Lessard project in exchange for 8 million DBL common shares as well as $2.5 million in exploration expenditures and annual cash payments of $50,000 over a four-year period. The first instalment of common shares and the first cash payment have been received. k) Lidge Project
The Company holds 100% interest in this very-early to early-stage exploration project, which is located in a prospective geological regime within the James Bay Mining District of Québec.
10. ACCOUNTS PAYABLE AND ACCRUED LIABILITIES October 31, October 31, 2015 2014 Accounts payable and accrued liabilities $ 958,430 $ 399,696 Government remittances payable 46,597 19,534 Due to related parties 69,582 84,745 $1,074,609 $ 503,975
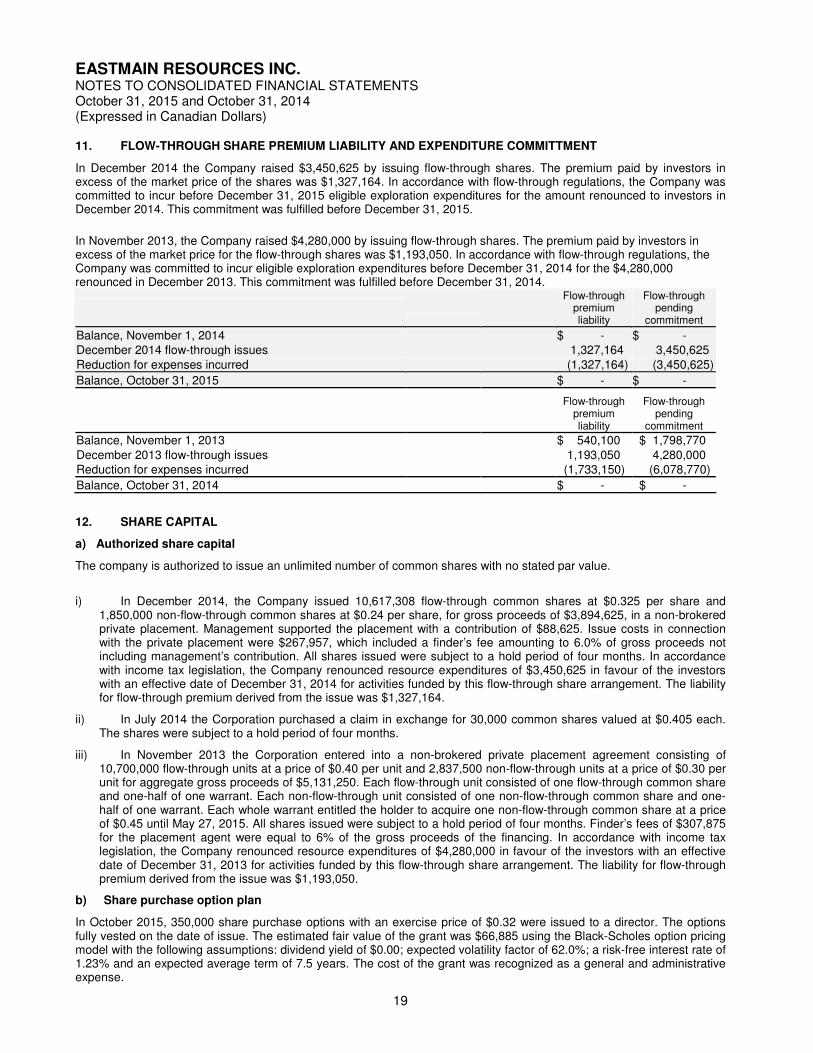
EASTMAIN RESOURCES INC. NOTES TO CONSOLIDATED FINANCIAL STATEMENTS October 31, 2015 and October 31, 2014 (Expressed in Canadian Dollars)
19
11. FLOW-THROUGH SHARE PREMIUM LIABILITY AND EXPENDITURE COMMITTMENT
In December 2014 the Company raised $3,450,625 by issuing flow-through shares. The premium paid by investors in excess of the market price of the shares was $1,327,164. In accordance with flow-through regulations, the Company was committed to incur before December 31, 2015 eligible exploration expenditures for the amount renounced to investors in December 2014. This commitment was fulfilled before December 31, 2015.
In November 2013, the Company raised $4,280,000 by issuing flow-through shares. The premium paid by investors in excess of the market price for the flow-through shares was $1,193,050. In accordance with flow-through regulations, the Company was committed to incur eligible exploration expenditures before December 31, 2014 for the $4,280,000 renounced in December 2013. This commitment was fulfilled before December 31, 2014.
Flow-through premium liability
Flow-through pending
commitment Balance, November 1, 2014 $ - $ - December 2014 flow-through issues 1,327,164 3,450,625 Reduction for expenses incurred (1,327,164) (3,450,625) Balance, October 31, 2015 $ - $ -
Flow-through premium liability
Flow-through pending
commitment Balance, November 1, 2013 $ 540,100 $ 1,798,770 December 2013 flow-through issues 1,193,050 4,280,000 Reduction for expenses incurred (1,733,150) (6,078,770) Balance, October 31, 2014 $ - $ -
12. SHARE CAPITAL
a) Authorized share capital
The company is authorized to issue an unlimited number of common shares with no stated par value.
i) In December 2014, the Company issued 10,617,308 flow-through common shares at $0.325 per share and 1,850,000 non-flow-through common shares at $0.24 per share, for gross proceeds of $3,894,625, in a non-brokered private placement. Management supported the placement with a contribution of $88,625. Issue costs in connection with the private placement were $267,957, which included a finder’s fee amounting to 6.0% of gross proceeds not including management’s contribution. All shares issued were subject to a hold period of four months. In accordance with income tax legislation, the Company renounced resource expenditures of $3,450,625 in favour of the investors with an effective date of December 31, 2014 for activities funded by this flow-through share arrangement. The liability for flow-through premium derived from the issue was $1,327,164.
ii) In July 2014 the Corporation purchased a claim in exchange for 30,000 common shares valued at $0.405 each. The shares were subject to a hold period of four months.
iii) In November 2013 the Corporation entered into a non-brokered private placement agreement consisting of 10,700,000 flow-through units at a price of $0.40 per unit and 2,837,500 non-flow-through units at a price of $0.30 per unit for aggregate gross proceeds of $5,131,250. Each flow-through unit consisted of one flow-through common share and one-half of one warrant. Each non-flow-through unit consisted of one non-flow-through common share and one-half of one warrant. Each whole warrant entitled the holder to acquire one non-flow-through common share at a price of $0.45 until May 27, 2015. All shares issued were subject to a hold period of four months. Finder’s fees of $307,875 for the placement agent were equal to 6% of the gross proceeds of the financing. In accordance with income tax legislation, the Company renounced resource expenditures of $4,280,000 in favour of the investors with an effective date of December 31, 2013 for activities funded by this flow-through share arrangement. The liability for flow-through premium derived from the issue was $1,193,050.
b) Share purchase option plan
In October 2015, 350,000 share purchase options with an exercise price of $0.32 were issued to a director. The options fully vested on the date of issue. The estimated fair value of the grant was $66,885 using the Black-Scholes option pricing model with the following assumptions: dividend yield of $0.00; expected volatility factor of 62.0%; a risk-free interest rate of 1.23% and an expected average term of 7.5 years. The cost of the grant was recognized as a general and administrative expense.

EASTMAIN RESOURCES INC. NOTES TO CONSOLIDATED FINANCIAL STATEMENTS October 31, 2015 and October 31, 2014 (Expressed in Canadian Dollars)
20
12. SHARE CAPITAL (Continued)
b) Share purchase option plan (Continued)
In June 2015, 1,200,000 share purchase options with an exercise price of $0.38 were issued to directors, employees and service providers. The options fully vested on the date of issue. The estimated fair value of the grant was $274,800 using the Black-Scholes option pricing model with the following assumptions: dividend yield of $0.00; expected volatility factor of 58.8%; a risk-free interest rate of 1.54% and an expected average term of 7.5 years. The portion of the cost related to general and administrative expenses was $137,400; the portion related to exploration and evaluation expense was $137,400.
In June 2014, 1,275,000 share purchase options with an exercise price of $0.30 were issued to directors, employees and service providers. The options fully vested on the date of issue. The estimated fair value of the grant was $219,810 using the Black-Scholes option pricing model with the following assumptions: dividend yield of $0.00; expected volatility factor of 53.9%; a risk-free interest rate of 2.03% and an expected average term of 7.5 years. The portion of the cost related to general and administrative expenses was $124,990; the portion related to exploration and evaluation expense was $94,820.
Stock options
Number of options Weighted average
exercise price
Outstanding, November 1, 2014 6,068,605 $ 0.78 Granted 1,550,000 $ 0.37
Outstanding, October 31, 2015
7,618,605
$ 0.69
Stock options
Number of options Weighted average exercise price
Outstanding, November 1, 2013 5,714,605 $ 0.95 Granted 1,275,000 $ 0.30
Expired (921,000) $ 1.20
Outstanding, October 31, 2014
6,068,605
$ 0.78
Options were outstanding and exercisable October 31, 2015
Stock options outstanding as at October 31, 2015
Black-Scholes Number of Exercise Expiry date value ($) Options price ($) January, 2016 397,000 250,000 0.72 June, 2017 102,080 168,605 0.78 June, 2017 60,300 100,000 0.77 April, 2020 192,750 250,000 1.35 June, 2020 536,250 750,000 1.27 September, 2020 41,600 50,000 1.46 April, 2021 224,250 250,000 1.51 June, 2021 395,850 650,000 1.15 April, 2022 158,250 250,000 1.05
Exercise price range
Number outstanding Weighted average remaining
contractual life
Weighted average exercise price
Number exercisable
$ 0.01 - $ 0.50 3,975,000 8.83 years $ 0.34 3,975,000
$ 0.51 - $ 1.00 1,443,605 6.24 years $ 0.84 1,443,605
$ 1.01 - $ 1.50 1,950,000 4.93 years $ 1.22 1,950,000
$ 1.51 - $ 2.00 250,000 5.49 years $ 1.51 250,000

EASTMAIN RESOURCES INC. NOTES TO CONSOLIDATED FINANCIAL STATEMENTS October 31, 2015 and October 31, 2014 (Expressed in Canadian Dollars)
21
12. SHARE CAPITAL (Continued)
Stock options outstanding as at October 31, 2015 (Continued)
June, 2022 384,200 850,000 0.88 September, 2022 35,925 75,000 0.96 June, 2023 170,000 1,000,000 0.33 September, 2023 27,900 150,000 0.36 June, 2024 219,810 1,275,000 0.30 June, 2025 274,800 1,200,000 0.38 October, 2025 66,885 350,000 0.32 3,287,850 7,618,605 0.69
c) Warrants
Number of warrants Weighted average exercise price
Outstanding, November 1, 2014 6,768,750 $ 0.45 Exercised (378,000) $ 0.45
Expired (6,390,750) $ 0.45
Outstanding, October 31, 2015
-
$ -
Number of warrants Weighted average exercise price
Outstanding, November 1, 2013 - $ - Issued 6,768,750 $ 0.45
Outstanding, October 31, 2014
6,768,750
$ 0.45 Warrants outstanding October 31, 2015: In November 2013, 6,768,750 share purchase warrants with an exercise price of $0.45 were issued as part of a private placement share issue. The estimated fair value of the warrants was $250,444 using the Black-Scholes option pricing model with the following assumptions: dividend yield of $0.00; expected volatility factor of 60.2%; a risk free interest rate of 1.07% and an expected term of 1.5 years. 378,000 warrants were exercised in 2015; the remainder expired unexercised. 13. CAPITAL MANAGEMENT
The Company’s objectives in managing capital are to ensure that there are adequate resources to sustain operations and to continue as a going concern, to maintain adequate levels of funding to support acquisition and exploration of mineral properties, to maintain investor and market confidence, and to provide returns to shareholders. The Company may manage its capital structure by issuing new shares, adjusting capital spending or disposing of assets. The Board of Directors does not establish quantitative return on capital criteria for management, but relies on management’s expertise to sustain future development of the business.
Exploration involves a high degree of risk and there are substantial uncertainties about the ultimate ability of the Company to achieve positive cash flow from operations. Consequently, management reviews its capital management approach on an ongoing basis, taking into consideration operating expenditures and other investing and financing activities. As a part of this review, management considers the cost of capital and the risks associated with each class of capital. Based on recommendations from management, the directors balance overall capital structure through new share issues.
Management intends to continue to use various strategies to minimize its dependence on equity capital, including the securing of joint arrangements where appropriate.
Management considers its capital structure to consist of equity attributable to equity holders of the Company, comprising issued share capital, contributed surplus, warrants and accumulated deficit, which at October 31, 2015 totalled $56,571,428
There were no changes in management’s approach to capital management during the year ended October 31, 2015. The Company is not subject to externally imposed capital requirements.
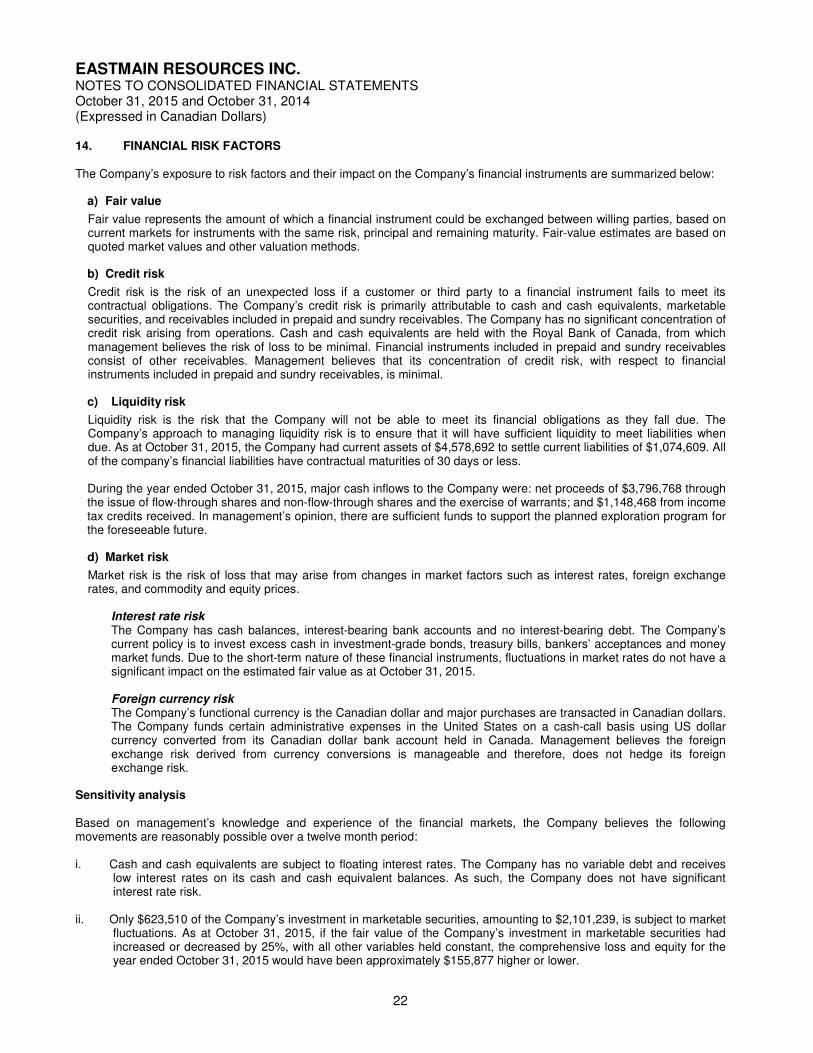
EASTMAIN RESOURCES INC. NOTES TO CONSOLIDATED FINANCIAL STATEMENTS October 31, 2015 and October 31, 2014 (Expressed in Canadian Dollars)
22
14. FINANCIAL RISK FACTORS
The Company’s exposure to risk factors and their impact on the Company’s financial instruments are summarized below: a) Fair value
Fair value represents the amount of which a financial instrument could be exchanged between willing parties, based on current markets for instruments with the same risk, principal and remaining maturity. Fair-value estimates are based on quoted market values and other valuation methods. b) Credit risk
Credit risk is the risk of an unexpected loss if a customer or third party to a financial instrument fails to meet its contractual obligations. The Company’s credit risk is primarily attributable to cash and cash equivalents, marketable securities, and receivables included in prepaid and sundry receivables. The Company has no significant concentration of credit risk arising from operations. Cash and cash equivalents are held with the Royal Bank of Canada, from which management believes the risk of loss to be minimal. Financial instruments included in prepaid and sundry receivables consist of other receivables. Management believes that its concentration of credit risk, with respect to financial instruments included in prepaid and sundry receivables, is minimal. c) Liquidity risk
Liquidity risk is the risk that the Company will not be able to meet its financial obligations as they fall due. The Company’s approach to managing liquidity risk is to ensure that it will have sufficient liquidity to meet liabilities when due. As at October 31, 2015, the Company had current assets of $4,578,692 to settle current liabilities of $1,074,609. All of the company’s financial liabilities have contractual maturities of 30 days or less. During the year ended October 31, 2015, major cash inflows to the Company were: net proceeds of $3,796,768 through the issue of flow-through shares and non-flow-through shares and the exercise of warrants; and $1,148,468 from income tax credits received. In management’s opinion, there are sufficient funds to support the planned exploration program for the foreseeable future. d) Market risk
Market risk is the risk of loss that may arise from changes in market factors such as interest rates, foreign exchange rates, and commodity and equity prices.
Interest rate risk The Company has cash balances, interest-bearing bank accounts and no interest-bearing debt. The Company’s current policy is to invest excess cash in investment-grade bonds, treasury bills, bankers’ acceptances and money market funds. Due to the short-term nature of these financial instruments, fluctuations in market rates do not have a significant impact on the estimated fair value as at October 31, 2015. Foreign currency risk The Company’s functional currency is the Canadian dollar and major purchases are transacted in Canadian dollars. The Company funds certain administrative expenses in the United States on a cash-call basis using US dollar currency converted from its Canadian dollar bank account held in Canada. Management believes the foreign exchange risk derived from currency conversions is manageable and therefore, does not hedge its foreign exchange risk.
Sensitivity analysis Based on management’s knowledge and experience of the financial markets, the Company believes the following movements are reasonably possible over a twelve month period: i. Cash and cash equivalents are subject to floating interest rates. The Company has no variable debt and receives
low interest rates on its cash and cash equivalent balances. As such, the Company does not have significant interest rate risk.
ii. Only $623,510 of the Company’s investment in marketable securities, amounting to $2,101,239, is subject to market
fluctuations. As at October 31, 2015, if the fair value of the Company’s investment in marketable securities had increased or decreased by 25%, with all other variables held constant, the comprehensive loss and equity for the year ended October 31, 2015 would have been approximately $155,877 higher or lower.

EASTMAIN RESOURCES INC. NOTES TO CONSOLIDATED FINANCIAL STATEMENTS October 31, 2015 and October 31, 2014 (Expressed in Canadian Dollars)
23
15. GENERAL AND ADMINISTRATIVE EXPENSES October 31, 2015 2014 Depreciation $ 22,813 $ 30,316 General and office 741,390 599,881 Professional fees 168,462 147,273 Stock option compensation 204,285 124,990
$1,136,950 $ 902,460 16. LOSS PER SHARE The calculation of basic and diluted loss per share for the year ended October 31, 2015 was based on the loss attributable to common-share holders of $853,496 (2014 – $9,193,660) and the weighted average number of common shares outstanding of 131,521,925 (2014 – 119,172,637). Diluted loss per share does not include the effect of 7,618,605 stock options (2014 – 6,068,605) and effect of warrants which was nil at October 31, 2015 (2014 – 6,768,750) as they are anti-dilutive. 17. RELATED-PARTY TRANSACTIONS Related parties include the Board of Directors, key management, close family members and enterprises that are controlled by these individuals. Related-party transactions conducted in the normal course of operations are measured at the amount established and accepted by the parties. a) Transactions with related parties Year ended October 31, 2015 2014 Donald Robinson (i) $ 238,800 $ 238,800 Shawonis Explorations and Enterprises Ltd. (ii) $ 194,985 $ 194,056 QB 2000 Inc. (iii) $ 58,500 $ 58,535 i. Donald Robinson is the President and Chief Executive Officer of Eastmain Resources Inc. and a member of the Board
of Directors of Eastmain Resources Inc. Fees paid to Donald Robinson are related to professional geological exploration and management services and office rental. As at October 31, 2015, $3,000 was due to Dr. Robinson (October 31, 2014 – $9,000).
ii. The Exploration Manager of Eastmain Resources Inc. is the president of Shawonis Explorations and Enterprises Ltd.
and is related to the Chief Executive Officer of Eastmain Resources Inc. Fees paid to Shawonis Explorations and Enterprises Ltd. are related to professional geological exploration and management services. As at October 31, 2015, $50,423 was due to Shawonis Explorations and Enterprises Ltd. (October 31, 2014 – $59,586).
iii. The Chief Financial Officer of Eastmain Resources Inc. is the president of QB 2000 Inc. Fees paid to QB 2000 Inc. are
related to functions of the Chief Financial Officer. As at October 31, 2015, the amount due to QB2000 Inc. was $16,159 (October 31, 2014 – $16,159).
Amounts due to related parties are included in accounts payable and other liabilities. b) Remuneration of directors and key management personnel other than consulting fees
2015 2014 Salaries and benefits $ 298,300 $ 288,800 Share-based compensation $ 238,635 $ 129,300 $ 536,935 $ 418,100 The Company considers its key management personnel to be the Board of Directors, CEO, CFO and Corporate Secretary. Certain officers have employment or service contracts with the Company. The Directors do not have any employment or service contracts. Officers and directors are entitled to share-purchase options and cash remuneration for their services.

EASTMAIN RESOURCES INC. NOTES TO CONSOLIDATED FINANCIAL STATEMENTS October 31, 2015 and October 31, 2014 (Expressed in Canadian Dollars)
24
18. PROVISION FOR INCOME TAXES
The income tax recovery varies from the amounts that would be computed applying the basic federal and provincial income tax rate aggregating 26.5% (2014 – 26.5%) to loss before income taxes as shown in the following: 2015 2014 Expected income tax $ 23,901 $ 2,474,678 Share based compensation (54,136) (33,122) Share issue costs 103,931 126,228 Effect of flow-through renunciation (707,982) 297,701 Gain (loss) on investments (82,148) 53,749 Other (11,560) (9,227) Impairment of exploration and evaluation assets (35,308) (2,765,260) Deferred income tax recovery (expense) $ (763,302) $ 144,747 Significant components of the Company’s deferred income tax assets and liabilities are as follows:
October 31, 2015
October 31, 2014
Non-capital losses carried forward $ 2,571,792 $ 2,436,779 Capital assets 174,449 168,404 Exploration and evaluation assets (7,964,807) (7,049,289) Share issue costs 188,464 221,386 Other 268,976 224,896 Future income taxes $(4,761,126) $(3,997,824) Non-capital loss carry forwards The company has reported non-capital losses available for deduction which expire as follows: 2026 $ 731,676 2027 682,717 2028 926,936 2029 879,515 2030 1,062,504 2031 940,879 2032 1,131,672 2033 1,074,604 2034 1,155,965 2035 1,118,408 $9,704,876 Other
a) Canadian exploration expenditures and Canadian development expenditures The Company has Canadian exploration and development expenditures available to reduce future years’ taxable income of approximately $27,000,000. The tax benefit of these amounts may be carried forward indefinitely.
b) Capital losses
The Company has unused capital losses of $438,844 which have no expiry date. These capital losses can only be used to reduce future income from capital gains.
19. SUBSEQUENT EVENTS
1. In accordance with the Company’s stock option compensation plan, 250,000 ten-year term stock options with an exercise price of $0.36 were granted to a director in November 2015. The estimated cost of these changes, using the Black-Scholes pricing model, is $53,250.
2. In December 2015 the Company issued 880,000 flow-through shares at $0.50 per share in a private placement for gross proceeds of $440,000. Issue costs in connection with the private placement are estimated to be $22,400. No brokerage commission or finder’s fee was paid. The flow-through premium associated with this issue was $149,600. In accordance with income tax legislation, the Company renounced resource expenditures of $440,000 in favour of the investors with an effective date of December 31, 2015 for activities funded by this flow-through share arrangement. The liability for flow-through premium derived from the issue was $149,600.
CORPORATE INFORMATION
Management and Directors
Donald J. Robinson, Ph.D., P. Geo President, CEO, Director
James L. Bezeau, BBA, CMA,
Chief Financial Officer
Catherine I. Butella, B.Sc. Exploration Manager
Jay Goldman, BA, MBA, LLB
Corporate Secretary
Laurie Curtis, Ph.D.* Chairman of the Board, Director
Michael Hoffman, P. Eng.
Director
David K. Joyce, Director
Claude Lemasson, P.Eng.*
Director
Murray Short, MBA, CPA, CA * Audit Committee Chair, Director
Serge Bureau, M.Sc., P.Eng.
Technical Advisor Development Group
John Hansuld, Ph.D. Technical Advisor
Dr. Ted Moses, (former Cree Grand Chief)
Special Advisor
Chad Steward Manager Communications
* Member of Audit Committee
Auditors
Stern & Lovrics LLP
1210 Sheppard Ave. East, Suite 302 Toronto , Ontario, Canada M2K 1E3
Corporate Services
DSA Corporate Services Inc.
36 Toronto Street, Suite 1000 Toronto, Ontario, Canada, M5C 2C5
Legal Counsel
Cassels Brock & Blackwell LLP 40 King Street West, Suite 2100 Toronto, Ontario, Canada, M5H 3C2
Transfer Agent Equity Financial Trust Company 200 University Avenue, Suite 300 Toronto, Ontario, Canada M5H 4H1 Shares Listed Symbol: ER The Toronto Stock Exchange Share Structure (as at Jan. 31, 2016)
Issued: 133,919,815 Options: 7,868,605 ($5,294,512) Warrants: nil Corporate Office 36 Toronto Street, Suite 1000 Toronto, Ontario, Canada M5C 2C5 Exploration Office 834572, 4th Line EHS Mono, Ontario Canada L9W 5Z6 Contacts Donald J. Robinson Catherine I. Butella Tel: (519)940-4870 Fax: (519)940-4871 Email: [email protected] Corporate Communications:
Chad Steward Tel: (604)669-5026 Email: [email protected] Website: www.eastmain.com
Exploration – Discovery – Profitability