quÉbec infrastructure plan - quebec.ca
TRANSCRIPT

QUÉBEC INFRASTRUCTURE PLAN 2021 • 2031
VOL. 6
EXPENDITUREBUDGET
2021 • 2022


QUÉBECINFRASTRUCTURE PLAN
2021 � 2031
VOL. 6
EXPENDITUREBUDGET
2021 � 2022
208855 001-164 int 4C_OK-Proofs.pdf_PG 1_Mars 21, 2021_18:27:43

This document does not satisfy the Québec government’s Web accessibility standards. However, an assistance service will nonetheless be available upon request to anyone wishing to consult the contents of the document. Please call 418-643-1529 or submit the request by email ([email protected]).
The masculine gender is used throughout this document solely to make the text easier to read and therefore applies to both men and women.
2021-2031 Québec Infrastructure Plan
Legal Deposit − March 2021 Bibliothèque et Archives nationales du Québec
ISBN: 978-2-550-88848-2 (Print Version) ISBN: 978-2-550-88849-9 (Online)
ISSN 2563-1225 (Print Version) ISSN 2563-1233 (Online)
© Gouvernement du Québec − 2021

MESSAGE FROM THE MINISTER RESPONSIBLEFOR GOVERNMENT ADMINISTRATIONAND CHAIR OF THE CONSEIL DU TRÉSOR
The 2021-2031 QIP sets at 135.0 billion, an increase of $4.5 billion compared withthe 2020 2030 QIP. Up nearly 35% since the 2019-2029 QIP, these substantialinvestments will make it possible to the Government to continue addressing his keypriorities, which are health, education, higher education, transportation and culture.
New significant investments will be devoted to health and social service establishmentwith the addition of seniors’ residences in the network in place, as well as expansionand upgrading of our CHSLD and hospitals. In education, investments will enablethe progressive launch of construction of a new generation of modern schools,the restoration of numerous buildings and the addition of classrooms. In highereducation, additional investments are planned to expand and renovate our CEGEPsand universities. In the transportation sector, the Government continues to invest inroad infrastructure, in particular to improve the state of roadways and ensure motorist
safety, as well as to enhance mobility and electrify public transit. The cultural sector will benefit from investments,notably to implement infrastructure in outlying regions, including the upgrading of heritage buildings.
The Government is strongly committed to accelerating infrastructure projects, in particular through the Act respecting theacceleration of certain infrastructure projects and translates this engagement in the 2021-2031 QIP. Indeed, investmentsof nearly $13.4 billion will be accelerated in the first five years of this plan, compared with the previous QIP, bringing$77.0 billion in investments for the next five years. These accelerations will make it possible to rapidly deploy manypriority infrastructure projects across Québec.
Furthermore, we will be able to maintain the existing public infrastructure portfolio in good condition, include some whichis aging and needs renovation, to which 60% of the QIP is dedicated. We will also be able to expand and construct newinfrastructure as needs evolve.
The planned 2021-2031 investments of $135.0 billion-in public infrastructure will definitely contribute to the economicgrowth needed given the impacts of the pandemic.
Improving our standard of living by maintaining and enhancing infrastructure offered to Quebecers is a primary concern.Our Government is taking concrete actions and honouring its commitments. The results are clear: planning and thelaunch of numerous projects are accelerating. Our whole society will benefit. And these benefits will also resonate forgenerations to come.
Sonia LeBelMinister responsible for Government Administrationand Chair of the Conseil du trésor
208855 001-164 int 4C_OK-Proofs.pdf_PG 3_Mars 21, 2021_18:27:43

208855 001-164 int 4C_OK-Proofs.pdf_PG 4_Mars 21, 2021_18:27:43

2021-2031 Québec Infrastructure Plan
Terms
Acronyms
Introduction
Highlights
Section APublic infrastructure central to the economic recovery
Section BPlanned investments by sector
Section CReport on the condition of public infrastructure
208855 001-164 int 4C_OK-Proofs.pdf_PG 5_Mars 21, 2021_18:27:43

208855 001-164 int 4C_OK-Proofs.pdf_PG 6_Mars 21, 2021_18:27:43

7
Terms
ADDITIONAcquisition or construction of new infrastructure.
IMPROVEMENTIncrease in the service potential of existing infrastructure.
ENHANCEMENTIncrease in the government service offer through the addition of a new infrastructure or the improvement ofan existing one.
ASSET MAINTENANCE DEFICITValue of the work required to restore the physical condition of infrastructure to satisfactory or better(government condition indicator of A, B or C) for the health and safety of individuals, and to ensure itscontinued use for its intended purposes and reduce the likelihood of breakdown or to counteract wear andtear.
DISPOSITIONAlienation of a building, civil engineering structure or equipment by sale, transfer or disposal.
MAINTENANCEWork of limited scope normally performed as part of an infrastructure's daily use. Maintenance work doesnot include asset maintenance.
SECTOR ENVELOPEEnvelope, under the responsibility of a government department or body, providing the government financialcontribution required to implement prioritized and authorized projects.
CENTRAL ENVELOPEEnvelope providing funding that will be required to implement the projects that have been selected andprioritized by the Government among those studied. Transfer to the sectors requires a Cabinet decision.
SURPLUS BUILDINGBuilding owned by a public body for which no use to provide a government service is planned.
INFRASTRUCTUREBuilding, equipment or civil engineering structure that is part of the Government's service supply.
PLANNED INVESTMENTValue of the financial contribution from the Gouvernement du Québec for a public infrastructure investmentlisted in the Québec Infrastructure Plan.
208855 001-164 int 4C_OK-Proofs.pdf_PG 7_Mars 21, 2021_18:27:43

8
PROBABLE INVESTMENTProbable cost of an investment from the Gouvernement du Québec for the government fiscal year that isending.
ACTUAL INVESTMENTReal cost of an investment from the Gouvernement du Québec for a government fiscal year that is closed.
ASSET MAINTENANCEValue of the work required to keep an infrastructure in satisfactory or better condition with the aim ofprotecting the health and safety of individuals, ensuring its continued use for its intended purposes, andreducing the likelihood of breakdown, or counteracting physical wear and tear.
INFRASTRUCTURE MAINTENANCEProvide for the sustainability of infrastructure by maintaining assets and managing the asset maintenancedeficit, as well replacing equipment and reconstructing buildings or civil engineering works.
MANAGING THE ASSET MAINTENANCE DEFICITInvestments (projects and portfolio maintenance envelope) allocated in the Québec Infrastructure Planidentified to decrease the listed infrastructure asset maintenance deficit that is presented in the AnnualManagement Plan for Public Infrastructure Investments.
MAJOR PROJECTPublic infrastructure project subject to the Directive sur la gestion des projects majeurs d'infrastructurepublique because its estimated cost is equal to or exceeds $50.0 million, or $100.0 million in the case ofroad infrastructure or public transit infrastructure projects. The Conseil du trésor can decide to considerany infrastructure project to be major if it deems appropriate.
REPLACEMENTAcquisition, construction or reconstruction of an infrastructure to replace an existing one, usually at the endof its useful life, to ensure continuity in service delivery.
REPLACEMENT VALUETotal investment required to build or acquire an infrastructure of the same dimensions and utility, withequivalent technical features, based on the construction techniques, building codes and materials ortechnical specifications in effect at the time of the estimate.
USEFUL LIFE (duration of)
Period over which an infrastructure or component should serve its intended purposes.
208855 001-164 int 4C_OK-Proofs.pdf_PG 8_Mars 21, 2021_18:27:43

9
AcronymsAMD Asset Maintenance DeficitAMP Autorité des marchés publicsAMPI Annual Management Plans for Public Infrastructure InvestmentsARQ Agence du revenu du QuébecARTM Autorité régionale de transport métropolitainCIB Canada Infrastructure BankCCQ Commission de la construction du QuébecCDPQ Infra Caisse de dépôt et placement du QuébecCERIU Centre d�expertise et de recherche en infrastructures urbainesCHSLD Residential and long-term care centresCISSS Integrated health and social services centreCLSC Local Community Service CentresGDP Gross domestic productDMAF Disaster Mitigation and Adaptation FundDirective Directive sur la gestion des projets majeurs d'infrastructure publiqueIBA Integrated Bilateral AgreementFIMEAU Fonds pour l'infrastructure municipale d'eauFRISSSS Health and Social Services Information Resources FundGHG Greenhouse gasHR Human ResourcesGCI Government Condition IndicatorIBA Integrated Bilateral AgreementITQ Infrastructures technologiques QuébecLEED Leadership in Energy and Environmental DesignMAMH Ministère des Affaires municipales et de l'HabitationMELCC Ministère de l�Environnement et de la Lutte contre les changements
climatiquesMEQ Ministère de l�ÉducationMES Ministère de l�Enseignement supérieurMSP Ministère de la Sécurité publiqueMSSS Ministère de la Santé et des Services sociauxMTESS Ministère du Travail, de l�Emploi et de la Solidarité socialeMTQ Ministère des TransportsMV Motor vesselPIA Public Infrastructure ActPGE Plan for a Green EconomyQIP Québec Infrastructure PlanRAMQ Régie de l'assurance maladie du QuébecREM Réseau express métropolitainRSSCE Réseau stratégique en soutien au commerce extérieurRSSS Health and Social Services Network
208855 001-164 int 4C_OK-Proofs.pdf_PG 9_Mars 21, 2021_18:27:43

10
RTC Réseau de transport de la CapitaleRTL Réseau de transport de LongueuilSCT Secrétariat du Conseil du trésorSépaq Société des établissements de plein air du QuébecSHQ Société d'habitation du QuébecSQI Société québécoise des infrastructuresSTL Société de transport de LavalSTM Société de transport de MontréalSTO Société de transport de l�OutaouaisSTQ Société des traversiers du QuébecTECQ Programs for the Gasoline Tax and for the Québec ContributionUBS Use of bus bypass shoulder
208855 001-164 int 4C_OK-Proofs.pdf_PG 10_Mars 21, 2021_18:27:43

11
Introduction
The Government has set the 2021-2031 QIP at $135.0 billion, an increase of $4.5 billion, compared withthe previous plan. This is the third consecutive increase, after two significant raises, each exceeding$15.0 billion, allocated by the 2020-2030 and 2019-2029 QIP. In the interest of sound public management,the impact this new substantial increase in investments will have on debt and public expenditures was takeninto account at the time it was determined.
Through these investments, the Government continues efforts to implement the key priorities it establishedin the 2019-2029 QIP. Be it through investments in Health and Social Services to add new seniors'residences and to expand and upgrade our CHSLD and hospitals, in Education to add new classroomsacross Québec and give us beautiful schools, in Higher Education to expand and renovate our CEGEPsand universities, in the Road network to restore of our roadways, or in public transit to improve mobility andelectrify our means of transport; or in culture, with the establishment of cultural infrastructures in regions,these priorities are the very heart of Government action.
To this end, the 20212031 QIP, which presents the Government's public infrastructure investment planningfor the next 10 years, reflects the pursuit of these key priorities and the acceleration of infrastructureinvestments to stimulate the economic growth of Québec.
Indeed, nearly $13.4 billion will be accelerated in the first five years of the 2021-2031 QIP compared withthe 2020-2030 QIP. Stepping up these investments will make it possible to rapidly deploy projects acrossQuébec to stimulate the economy affected by the COVID-19 pandemic. Bear in mind that publicinfrastructure investments are a powerful driver of economic development for all regions of Québec.
� Section A of the Plan presents the allocation of the funds available for the completion of newinvestments, and the effect of the planned QIP investments on the sustainability of infrastructure.
� Section B is comprised primarily of general and sector tables for the Plan investments, a list of projectsof $20.0 million or more, and investment strategies. It also includes reporting on investments made in2019-2020, an update on the investments planned for 2020-2021 and information about past QIPs.
� Section C presents a summary of the 2021-2022 AMPIs prepared by the main departments and bodies.These plans, which, in the future, will be published online1, allow the condition of public infrastructureand its AMDs to be tracked.
1 Website: https://www.tresor.gouv.qc.ca/public-infrastructures/public-infrastructures/?L=2
208855 001-164 int 4C_OK-Proofs.pdf_PG 11_Mars 21, 2021_18:27:43

208855 001-164 int 4C_OK-Proofs.pdf_PG 12_Mars 21, 2021_18:27:43

Highlights 13
Highlights
Investments of $135.0 billion during 2021-2031, including acceleration ofseveral projects to relaunch the economy
An extra $4.5 billion, an increase of 3.4% compared with the 2020-2030 QIP, adds to the twoincreases of more than $15.0 billion each granted in the previous two QIP.
The acceleration of nearly $13.4 billion in investments in the first five years of the 2021-2031to quickly deploy projects across Québec will bring investments to $77.0 billion over the nextfive years to relaunch the Québec economy.
Continued investment in priority sectorsAn extra $3.1 billion to add seniors' residences, expand and refurbish CHSLD and hospitals;
An extra $1.8 billion to restore schools and add classrooms across Québec, and $125.0 millionfor the Sports and Physical Activity Development Fund;
$811.8 million extra for CEGEP and university restoration and expansion projects;
Another $2.6 billion invested to maintain the road network, an asset essential to economicdevelopment;
$1.5 billion to improve mobility and electrify public transit, thereby helping to reduce GHG andadapt to climate change, including $453.0 million to the 2030 Plan for a Green Economy, whichrepresents the electrification and climate change policy framework;
$100.0 million for Culture, in particular to support heritage real estate and to implement culturalinfrastructure in outlying regions, including heritage buildings.
208855 001-164 int 4C_OK-Proofs.pdf_PG 13_Mars 21, 2021_18:27:43

208855 001-164 int 4C_OK-Proofs.pdf_PG 14_Mars 21, 2021_18:27:43

Sec
tionA
Public infrastructure central to the economic recovery A.1
A
Section A
Public infrastructure central to the economic recovery1. Continued investment in priority sectors ............................................................. 3
1.1 Additional availability of $12.2 billion......................................................................... 3
1.2 A diversified distribution of new availabilities............................................................. 4
1.3 Diversified investments of $135.0 billion ..................................................................16
1.4 A central envelope to carry out major projects under study......................................17
2. Significantly accelerating infrastructure investments....................................... 182.1 Accelerating a nearly $13.4 billion investment in the first five-year period............... 18
2.2 An Act respecting the acceleration of certain infrastructure projects ....................... 18
2.3 Action Plan for the Construction Sector : to support and develop theindustry's capacity .................................................................................................. 20
3. Planning investments to ensure the sustainability of existing infrastructure. 223.1 Prioritizing investments dedicated to infrastructure maintenance ............................ 22
3.2 An acceleration of investments to maintain the inventory in good condition ............ 24
3.3 An asset maintenance deficit addressed by 78% over 10 years.............................. 25
3.4 Anticipated improvement in the condition of public infrastructure in the comingyears....................................................................................................................... 26
Appendix 1 � Preparation of the 2021-2031 QIP ....................................................... 28Appendix 2 � Investments by type of body............................................................... 31Appendix 3 � Directive sur la gestion des projets majeurs d'infrastructure
publique ................................................................................................ 32
208855 001-164 int 4C_OK-Proofs.pdf_PG 15_Mars 21, 2021_18:27:43

208855 001-164 int 4C_OK-Proofs.pdf_PG 16_Mars 21, 2021_18:27:43

Sec
tionA
Public infrastructure central to the economic recovery A.3
A
1. Continued investment in priority sectors1.1 Additional availability of $12.2 billionTo continue implementing priorities it has set, the Government has established the 2021-2031 QIP at$135.0 billion, an increase of $4.5 billion.
Through this new enhanced plan, the Government will continue to meet its public infrastructurecommitments in the sectors it has prioritized: health, education, higher education, the road network, publictransit and culture.
This $4.5 billion increase is in addition to the $7.7 billion newly freed through the advancement andcompletion of several projects in the 2020-2021 fiscal year. Therefore, an additional $12.2 billion will bedevoted to new investments during the 2021-2031 period.
Additional availability in the 2021-2031 QIP(contribution of the Gouvernement du Québec, in millions of dollars)
Increase in level of the QIP 4,500.0
New availabilities1 7,725.5
Total 12,225.51 Appendix 1 presents the method used to calculate the new availabilities.
Distribution of Additional Availabilities by Sector(contribution of the Gouvernement du Québec, in millions of dollars)
Sectorenvelope
Centralenvelope1 Total
Health and social services 1,017.0 2,066.7 3,083.7Education 1,642.6 135.7 1,778.3Higher education 397.6 414.2 811.8Road network 1,359.4 1,196.0 2,555.4Public transit 920.2 571.8 1,492.0Culture 100.0 � 100.0Other sectors 1,984.8 419.5 2,404.3
Total 7,421.6 4,803.9 12,225.51 Refer to heading 1.4.
208855 001-164 int 4C_OK-Proofs.pdf_PG 17_Mars 21, 2021_18:27:43
A.4 2021-2031 QuébecInfrastructure Plan
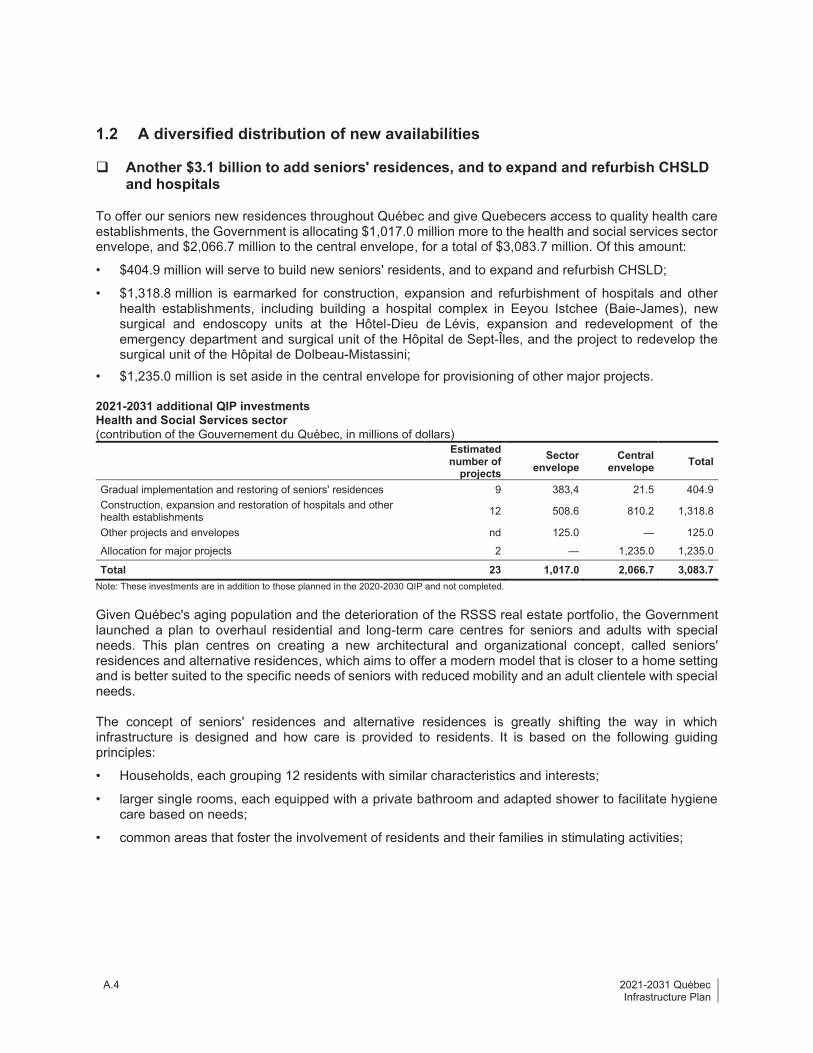
1.2 A diversified distribution of new availabilities
Another $3.1 billion to add seniors' residences, and to expand and refurbish CHSLDand hospitals
To offer our seniors new residences throughout Québec and give Quebecers access to quality health careestablishments, the Government is allocating $1,017.0 million more to the health and social services sectorenvelope, and $2,066.7 million to the central envelope, for a total of $3,083.7 million. Of this amount:
� $404.9 million will serve to build new seniors' residents, and to expand and refurbish CHSLD;
� $1,318.8 million is earmarked for construction, expansion and refurbishment of hospitals and otherhealth establishments, including building a hospital complex in Eeyou Istchee (Baie-James), newsurgical and endoscopy units at the Hôtel-Dieu de Lévis, expansion and redevelopment of theemergency department and surgical unit of the Hôpital de Sept-Îles, and the project to redevelop thesurgical unit of the Hôpital de Dolbeau-Mistassini;
� $1,235.0 million is set aside in the central envelope for provisioning of other major projects.
2021-2031 additional QIP investmentsHealth and Social Services sector(contribution of the Gouvernement du Québec, in millions of dollars)
Estimatednumber of
projectsSector
envelopeCentral
envelope Total
Gradual implementation and restoring of seniors' residences 9 383,4 21.5 404.9
Construction, expansion and restoration of hospitals and otherhealth establishments
12 508.6 810.2 1,318.8
Other projects and envelopes nd 125.0 � 125.0
Allocation for major projects 2 � 1,235.0 1,235.0
Total 23 1,017.0 2,066.7 3,083.7Note: These investments are in addition to those planned in the 2020-2030 QIP and not completed.
Given Québec's aging population and the deterioration of the RSSS real estate portfolio, the Governmentlaunched a plan to overhaul residential and long-term care centres for seniors and adults with specialneeds. This plan centres on creating a new architectural and organizational concept, called seniors'residences and alternative residences, which aims to offer a modern model that is closer to a home settingand is better suited to the specific needs of seniors with reduced mobility and an adult clientele with specialneeds.
The concept of seniors' residences and alternative residences is greatly shifting the way in whichinfrastructure is designed and how care is provided to residents. It is based on the following guidingprinciples:
� Households, each grouping 12 residents with similar characteristics and interests;
� larger single rooms, each equipped with a private bathroom and adapted shower to facilitate hygienecare based on needs;
� common areas that foster the involvement of residents and their families in stimulating activities;
208855 001-164 int 4C_OK-Proofs.pdf_PG 18_Mars 21, 2021_18:27:43

Sec
tionA
Public infrastructure central to the economic recovery A.5
A
� a dedicated area for caregivers to encourage visits and offer them respite, both day and night;
� a design that eliminates as much as possible any appearance of an institutional setting, by featuringhidden nurses' stations, for example;
� accessible, safe outdoor areas that are open to the community.
These new residential spaces will provide a more suitable and functional living environment, making theminteresting workplaces for their staff. The Government would like to implement this concept across Québecand is committed to developing 2,600 new spaces by September 2022 and to gradually renewingdeteriorated CHSLDs throughout Québec.
An extra $1.8 billion to restore schools and add classrooms across Québec
The Government will continue to invest in schools throughout Québec and plans additional investments of$1,642.6 million in the education sector as well as $135.7 million in the central envelope, for a total of$1,778.3 million. Of this amount:
� $446.4 million to ensure restoration of the real-estate portfolio, and healthier, safer places to learn;
� $884.7 million is allocated to numerous new non-major projects to add space to schools, as well asredevelopment and replacement of furniture to support the deployment of kindergarten for four-year-olds;
� $447.2 million has been added for six major projects currently in the "under study" or "planning"category.
2021-2031 additional QIP investmentsEducation sector(contribution of the Gouvernement du Québec, in millions of dollars)
Estimatednumber of
projectsSector
envelopeCentral
envelope Total
Asset maintenance envelopes 700 446.4 � 446.4
Allocation for non-major additional space projects 20 884.7 � 884.7
Allocation for major additional space projects 6 311.5 135.7 447.2
Total 726 1,642.6 135.7 1,778.3Note: These investments are in addition to those planned in the 2020-2030 QIP and not completed.
A large portion of these new sums will be used to continue renovating school network buildings, to providebeautiful schools throughout Québec and to fulfill the plan to deploy kindergarten for four-year-olds.
History of investment levels planned in the QIPEducation sector (excluding central envelope)(contribution of the Gouvernement du Québec, in millions of dollars)
2018-2028QIP
2019-2029QIP
2020-2030QIP
2021-2031QIP
Sector envelope 8,972.7 13,889.2 19,150.3 20,910.5
Increase in level and % 4,916.5 54.8 % 5,261.1 37.9 % 1,760.2 9.2 %
208855 001-164 int 4C_OK-Proofs.pdf_PG 19_Mars 21, 2021_18:27:43

A.6 2021-2031 QuébecInfrastructure Plan
For a third consecutive year, the Government will boost investments in the education sector, after twosubstantial increases of over $4.9 billion (54.8% increase) and nearly $5.3 billion (37.9% increase)allocated in the 2019-2029 and 2020-2030 QIP, respectively. The additional sums in this sector over thepast three years illustrate the importance the Government places on education.
Schools are important living environments for our young people. Schools must provide a healthy, safe,stimulating environment that is adapted to children's needs; schools must support learning anddevelopment of their potential. This is why a vision and architectural signature were developed to guideschool construction. In February 2020, the Government will unveil its new architectural concept for futureQuébec schools. Distinctive, functional, progressive and sustainable schools, new schools will be builtbased on best practices. They will be the fruit of careful consultation with numerous talented Québecarchitects and educators. Among other things, this vision proposes:
� collaboration spaces that focus on the new realities of young people;
� flexible and evolving educational spaces that can serve a variety of functions and adapt over time;
� schools that integrate into and are linked to their environment, open and accessible to theirneighbourhood;
� exemplary establishments in terms of environmental responsibility and sustainable development;
� environments that foster socialization and exchange;
� spaces where vegetation is present, cultivated and valued.
The architectural signature will make schools unique and readily identifiable, while simultaneouslyunderscoring the use of Québec materials. It will integrate:
� natural wood in school interiors;
� blue accents on the façade;
� aluminum;
� a distinctive look.
An additional $811.8 million allocated to higher education
The 2021-2031 QIP allocates additional investments of nearly $397.6 million to higher education and$414.2 million in the central envelope, for a total of $811.8 million. Of this amount:
� $200.0 million is earmarked for the college network, $78.0 million of this to restore the real estateportfolio and $87.0 million for new initiatives;
� $186.3 million is assigned to the university network, including $151.0 million to restore the real estateportfolio and $24.3 million for new initiatives;
� $295.8 million is allocated for two new major projects in the college network that are currently understudy:
� $157.0 million for the project to add space and redevelopment of school workshops at CégepÉdouard-Montpetit;
� $138.8 million for the project to add space and redevelop Collège Ahuntsic to deal with the lack ofteaching space.
208855 001-164 int 4C_OK-Proofs.pdf_PG 20_Mars 21, 2021_18:27:43

Sec
tionA
Public infrastructure central to the economic recovery A.7
A
� $118.4 million is allocated for two new major projects in the university network that are currently understudy:
� $60.5 million for a cost increase for the project to rejoin teaching and research activities at theUniversité du Québec en Outaouais and the Gatineau campus;
� $57.9 million for a cost increase for a real estate acquisition project, redevelopment of space andexpansion of Polytechnique.
2021-2031 additional QIP investmentsHigher Education sector(contribution of the Gouvernement du Québec, in millions of dollars)
Estimatednumber of
projectsSector
envelopeCentral
envelope Total
Asset maintenance envelope and addition of college network spaces(numerous non-major projects)
nd 200.0 � 200.0
Asset maintenance envelope and addition of college network spaces(numerous non-major projects)
nd 186.3 � 186.3
Other envelope for new initiatives 3 11.3 � 11.3
Allocation for major college-network projects 2 � 295.8 295.8
Allocation for major university-network projects 2 � 118.4 118.4
Total 7 397.6 414.2 811.8Note: These investments are in addition to those that were planned in the 2020-2030 QIP and not completed.
An additional $2.6 billion invested to ensure the good condition of the road network
The 2021-2031 QIP forecasts an additional $1,359.4 billion to the road network sector and $1,196.0 millionto the central envelope, for a total of $2,555.4 million. These investments include the construction of newreserved lanes that will also help improve public transit (see box p. A.10). Of this $2,555.4 million:
� $203.9 million is allocated to ensure restoration of roadways;
� $122.7 million is planned for new non-major projects, including:
� extension (urban boulevard) of Autoroute 73 in Saint-Georges;
� bypass in Saint-Lin-Laurentides.
� $934.7 million is forecast for major projects "in planning", including:
� redevelopment of Autoroute 55 between Bécancour and Sainte-Eulalie;
� widening of Route 117 between Labelle and Rivière-Rouge;
� the exchange between autoroutes 440 and 15, elevated ramp in Laval.
� $1,196.0 million is set aside in the central envelope for provisioning of other major projects.
208855 001-164 int 4C_OK-Proofs.pdf_PG 21_Mars 21, 2021_18:27:43

A.8 2021-2031 QuébecInfrastructure Plan
2021-2031 additional QIP investmentsRoad Network sector(contribution of the Gouvernement du Québec, in millions of dollars)
Estimatednumber of
projectsSector
envelopeCentral
envelope Total
Asset maintenance envelopes 50 203.9 � 203.9
Allocation for non-major projects 4 122.7 � 122.7
Allocation for preparatory work and construction lots 1 98.1 � 98.1
Allocation for major projects 13 934.7 1,196.0 2,130.7
Total 68 1,359.4 1,196.0 2,555.4Note: These investments are in addition to those that were planned for projects in the 2020-2030 QIP and not completed.
The road network under the responsibility of the MTQ alone accounts for over 31,000 kilometres of roadsand some 9,700 structures, including bridges and overpasses. This road infrastructure needs to beavailable for public mobility, be it by personal vehicle or public transit, as well as for the transportation offreight.
Investments required to maintain these strategic assets in good condition, essential to the economicdevelopment of Québec, are enormous, since the cost of roadway reconstruction and structures is high,considering the substantial area they cover across Québec. Furthermore, a significant portion of theportfolio was built between 1960 and 1970. Consequently, often they have reached the end of their usefullife, and substantial investments become necessary. The work will make it possible to ensure greaterresistance to climate variations.
� The Government is committed to a cycle of replacing and repairing a number of major structures, whichcalls for substantial investment. Several major projects are currently under study, in planning or inprogress.
The Government must continue to invest in the road infrastructure to ensure user safety, reduce its AMD,improve conditions and promote use by various modes of public transit.
� The AMD of the road infrastructure in poor condition (GCI of D or E) is assessed at $17.9 billion, or65.0% of the AMD of all public infrastructure under the Government's responsibility ($27.7 billion). Thisis mainly due to a lack of investment in maintaining assets over the past few decades.
Taking into account the additional investment of nearly $2.6 billion for the Road network sector, the$28.3 billion budgeted in the 2021-2031 QIP for this sector reflects the Government's will to improve theroad infrastructure. The majority of this investment, i.e. $23.5 billion (83.0%), is planned for maintenance(refer to heading 3.3).
208855 001-164 int 4C_OK-Proofs.pdf_PG 22_Mars 21, 2021_18:27:43

Sec
tionA
Public infrastructure central to the economic recovery A.9
A
DISTRIBUTION OF INVESTMENTS IN PUBLIC TRANSIT AND THE ROAD NETWORK
Distribution of investments by type in the 2021-2031 QIP
Public transit Road network
Furthermore, investments in the Road network sector include $471.41 million for construction of reservedlanes, which contribute to improving public transit (see box on next page for more details).
$1.5 billion to improve mobility and electrify public transit
To help make citizens more mobile, improve traffic flow and electrify public transit, investments of$920.2 million are dedicated to the Public transit sector and $571.8 million in the central envelope, for atotal of $1,492.0 million. Of this amount:
� $614.0 million is allocated to continue non-major public transit projects;
� $453.0 million will serve to implement an initial phase of the 2030 Plan for a Green Economy, the policyframework for electrification and climate change which engages Québec in an ambitious project thatlays the foundation for a green economy, resilient in the face of climate change, and more prosperousby 2030.
� $425.0 million is set aside in the central envelope for provisioning of other major projects.
2021-2031 QIP investmentsPublic Transit sector(contribution of the Gouvernement du Québec, in millions of dollars)
Estimatednumber of
projectsSector
envelopeCentral
envelope Total
Allocation for non-major projects 10 614.0 � 614.0
Envelope � 2030 Plan for a Green Economy 5 306.2 146.8 453.0
Allocation for major projects 1 � 425.0 425.0
Total 16 920.2 571.8 1.492.0Note: These investments are in addition to those that were planned for projects in the 2020-2030 QIP and not completed.
1 This amount excludes Road network projects that could include a portion of construction of reserved lanes within a comprehensive project. Thisamount includes only projects exclusively dedicated to the construction of reserved lanes.
Maintenance$3.0 billion
23%
Enhancement$9.9 billion
77% Maintenance$23.5 billion
83%
Enhancement$4.8 billion
17%
208855 001-164 int 4C_OK-Proofs.pdf_PG 23_Mars 21, 2021_18:27:43

A.10 2021-2031 QuébecInfrastructure Plan
RESERVED LANES
Furthermore, investments in the Road network sector include $471.4 million for construction of reservedlanes, which help improve public transit.
Reserved lanes can be used only by buses, taxis, electric vehicles and for carpooling. They foster usermobility by increasing people carried, with a reduced number of vehicles, on a targeted corridor. Byrestricting solo car trips, the reserved lanes encourage travel by public transit or carpooling. They arealso an incentive to purchase electric vehicles.
In the 2021-2031 QIP, nine reserved lane construction projects or bus bypass shoulders are planned,including:
� Autoroute 440 eastbound between Route 125 and Autoroute 25;
� Autoroute 25 northbound between Laval and Terrebonne;
� Autoroute 15 between Laval and Boisbriand;
� Autoroute 15 northbound between Boisbriand and Mirabel;
� Autoroute 30 between Brossard and Boucherville;
� The interchange between autoroutes 30 and 40;
� Autoroute 20 eastbound between Beloeil and Sainte-Julie;
� Autoroute 10 between Brossard and Carignan;
� Autoroutes 13, 20, 25, 440 and 640 and on Route 116.
In the 2020-2030 QIP, three new studies were added to transformative projects already under study or inplanning in the 2019-2029 QIP in the Public transit sector. Changes occurred during the year and arereflected in the 2021-2031 QIP (see box on next page for further details).
Bear in mind that Québec's contribution for these projects will be determined later, depending on theapproval date of their business file and contributions of partners such as CDPQ Infra, the FederalGovernment, the CIB and public transit corporations. Consequently, the funds needed to carry out theseprojects will be provided in a timely manner during the preparation of future QIPs.
208855 001-164 int 4C_OK-Proofs.pdf_PG 24_Mars 21, 2021_18:27:43

Sec
tionA
Public infrastructure central to the economic recovery A.11
A
TRANSFORMATIVE ELECTRIC PUBLIC TRANSIT PROJECTS
In the 2020-2030 QIP, three new studies were added to transformative projects already under study orin planning in the 2019-2029 QIP.
In the 2021-2031 QIP, the following changes are made:
� The project connecting the east, north east and south-west of Montréal to downtown was split in two,one to join east and north-east Montréal to downtown (4) and the other to link south-west Montréalto downtown (5). Given that CDPQ Infra has confirmed its interest in assuming the project to connecteast and north-east Montréal to downtown and that the Government will entrust it to that body, thisproject has been withdrawn from the 2021-2031 QIP.
� Based on the experience acquired in completing the REM, the Government asked CDPQ Infra tostudy two other public infrastructure projects (3 and 6).
� The project to link the REM on the South Shore to serve the Chambly / Saint-Jean-sur-Richelieusector has been withdrawn. In accordance with the provisions of the agreement between theGovernment and the Caisse de dépôt et placement du Québec, CDPQ Infra decided, on completionof the studies conducted, that it did not wish to pursue the project since the ridership studies did notjustify the implementation of a heavy public transit service. The need will be filled through completionof the project to construct a reserved lane on Autoroute 10 between autoroutes 35 and 30 andredevelop ramps on autoroutes 10 and 35.
2020-2030 QIP 2021-2031 QIP Outside QIP1
Ville de Québec, Réseau structurant detransport en commun � Construction;
1. Réseau structurant de transport en communde la Ville de Québec � Construction
(Body responsible: Ville de Québec)Transformative electric public transitproject between Gatineau's west end anddowntown Ottawa � Enhancement
2. Transformative electric public transit projectbetween Gatineau's west end and downtownOttawa � Enhancement
(body responsible: Société de transport del�Outaouais)
Transformative electric public transitprojects on Boulevard Taschereau andextension of the Métro's yellow line �Enhancement
3. Transformative electric public transit projectson Boulevard Taschereau and extension ofthe Métro's yellow line � Enhancement
(body potentially responsible: CDPQ Infra2)Transformative electric public transitprojects to link east, north east and south-west Montréal to downtown �Enhancement4
5. Transformative electric public transit projectsto link south-west Montréal to downtown(body responsible: ARTM)
4. Transformative electric publictransit projects to link east andnorth-east Montréal to downtown(body responsible: CDPQ Infra3)
Transformative electric public transitprojects to extend the REM to downtownLaval and link east and west Laval �Enhancement4
6. Transformative electric public transit projectsto extend the REM to downtown Laval and linkeast and west Laval � Enhancement (bodyresponsible: CDPQ Infra2)
Transformative electric public transitproject to link the REM on the South Shoreto serve theChambly / Saint-Jean sur Richelieu sector� Enhancement4
Project withdrawn5
7. REM in the Montréal area (Bodyresponsible: CDPQ Infra)
1 Projects managed by CDPQ Infra are outside the QIP, since the Government contributes in the form of acquisition of ownership equity with return.The QIP presents infrastructure investments, not holdings.
2 CDPQ Infra is studying this project (3 and 6).3 The Government will entrust CDPQ Infra with responsibility for this project since it has confirmed its interest in assuming it.4 Project under study in the 2020-2030 QIP.5 This project has been withdrawn, since the need will be filled through completion of the project to construct a reserved lane on Autoroute 10 between
autoroutes 35 and 30 and to redevelop ramps on autoroutes 10 and 35.
208855 001-164 int 4C_OK-Proofs.pdf_PG 25_Mars 21, 2021_18:27:43

A.12 2021-2031 QuébecInfrastructure Plan
54.9
Despite a reduction in the Public Transit sector envelope, which dropped from $13.6 billion in the2020-2030 QIP to $12.8 billion in the 2021-2031 QIP due to completion of investments in 2020-2021, theGovernment expects that over the next 10 years, investments in public transit will greatly exceed the$12.8 billion allocated for this sector in the 2021-2031 QIP.
Indeed, considering the completion of all projects under study and those done by CDPQ Infra, it is expectedthat investments in public transit could reach $49.0 billion, as follows:
� $28.9 billion for projects under the responsibility of public transit corporations, along with $1.4 billionreserved in the central envelope;
� $18.7 billion for projects under the responsibility of CDPQ Infra, including $6.5 billion to complete theREM in the Montréal region, currently underway.
The Government still projects that the investments dedicated to Public Transit estimated at $49.0 billion willbe comparable to those for the Road Network estimated at $48.9 billion. Taking into account the $5.9 billioninvestments for reserved lane development, Public Transit sector will reach $54.9 billion, much more thanthe investments planned for the Road Network sector.
Investments planned in the 2021-2031 QIP and those projected for public transit and the road network(in billions of dollars)
2021-2031 QIP Future QIPs Outside QIP Total
Public transit sector 12.8 16.1 � 28.9
Central envelope 1.4 � � 1.4
CDPQ-Infra � � 18.7 18.7
Total Public transit 14.2 16.1 18.7 49.0Construction of new reserved lanes 0.5 5.4 � 5.9
Road network sector1 27.8 10.4 � 38.2
Central envelope 4.8 � � 4.8
Total Road network 33.1 15.8 � 48.91 These investments for the Road network exclude amounts allocated to projects to develop reserved lanes.
208855 001-164 int 4C_OK-Proofs.pdf_PG 26_Mars 21, 2021_18:27:43

Sec
tionA
Public infrastructure central to the economic recovery A.13
A
An additional $100.0 million for culture
Additional investments of $100.0 million are planned for the Culture sector to support heritage real estateand implement cultural infrastructure in outlying regions. This amount is in addition to $394.0 million injectedinto this sector in the 2020-2030 QIP, of which $222.0 million is forecast to implement culturalinfrastructures in outlying regions. The latter will be comprised of heritage buildings, located in variousQuébec regions, which will be acquired, restored, converted and outfitted. While aiming to preserve andenhance Québec's built heritage, this infrastructure will serve, among other things, as hubs of culturaldistribution, creation and mediation to promote Québec�s cultural heritage.
An additional $2.4 billion for other sectors
Additional investments of $2,404.3 million will be allocated to other sectors, including $435.6 million for theSocial and Community Housing sector as well as $369.6 million for the Government Buildings sectorincluded in Government Administration. Refer to the general and detailed tables on investments set out inthe 2021-2031 QIP presented in section B of this document for further details.
208855 001-164 int 4C_OK-Proofs.pdf_PG 27_Mars 21, 2021_18:27:43

A.14 2021-2031 QuébecInfrastructure Plan
SUBSTANTIAL INVESTMENTS IN THE ENVIRONMENT FOCUS ON CLIMATE CHANGE AND ONSUPPORTING 2030 PLAN FOR A GREEN ECONOMY
Infrastructure investments contribute to transportation electrification, reducing GHG and to supportingaction on climate change, in line with the goals of the 2030 Plan for a Green Economy1, presented bythe MELCC in November 2020. The Plan for a Green Economy constitutes the electrification and climatechange policy framework. It engages Québec in an ambitious project that lays the foundation for a greeneconomy, resilient in the face of climate change, and more prosperous by 2030.
� The Plan for a Green Economy will guide Québec over the next decade in its transition toward a low-carbon economy and help it achieve the GHG emission targets that Québec has set for 2030,specifically a 37.5% reduction compared with 1990 levels.
� The measures of the Plan for a Green Economy will translate into an improvement in air quality andsignificant benefits for Quebecers' health and quality of life. Several departments and public bodiesof the Government will take part in deploying the measures planned.
� The 2021-2026 Implementation Plan of the Plan for a Green Economy2, also announced inNovember 2020, presents the actions and measures Québec aims to implement in the coming years.It is based on a financial framework that includes expenditures of $6.7 billion over five years. Theactions of the Plan for a Green Economy will be funded primarily from revenue from the Electrificationand Climate Change Fund and budget appropriations. This financial framework will becomplemented by infrastructure investments to support the Plan for a Green Economy, which areforecast, over the years, in the QIP.
Infrastructure investments to support the environment, and some for the Plan for a GreenEconomyWith infrastructure investments of $44.8 billion to support sustainable development and the environment,including those allocated in the 2021-2031 QIP and those subsequently forecast, the Governmentintends to contribute to reducing GHG and action on climate change.
� $14.2 billion in public transit is planned in the 2021-2031 QIP, with $12.8 billion in the Public Transitsector and $1.4 billion in the central envelope to increase access to public transit and modes ofelectric transportation, supporting in particular:
� The measures provided in the Plan for a Green Economy, such as transportation electrification,with investments of $453.0 million:
$188.6 million for the acquisition of over 250 electric buses and $21.1 million for electrificationof nearly 180 hybrid buses;
$146.8 million for the electrification project of the operations centre of the Réseau detransport de la Capitale and $96.5 million for the electrification of an EXO garage.
� the measures of the Sustainable Mobility Policy, in particular by investing in active transportationthrough the development of bicycle paths;
� the completion of large-scale projects, such as the extension of the Montréal Métro's blue lineand the new transformative public transit network in Québec City, to offer reliable and efficientoptions to cars;
� the Government's commitment to investing in projects related to the Greater Montréaldecongestion plan.
In addition to this $14.2 billion invested in public transit, another $16.1 billion is forecast in later QIP tocomplete projects currently under study, for a total of $30.3 billion in this sector, It is also expected thatother amounts, to be determined, will be added for the Plan for a Green Economy in subsequent QIP.
1 GOUVERNEMENT DU QUÉBEC, Plan pour une économie verte 2030 [https://www.quebec.ca/gouv/politiques-orientations/plan-economie-verte/].2 GOUVERNEMENT DU QUÉBEC Plan de mise en �uvre 2021-2026 du Plan pour une économie verte 2030 [https://www.quebec.ca/gouv/politiques-orientations/plan-economie-verte/]
208855 001-164 int 4C_OK-Proofs.pdf_PG 28_Mars 21, 2021_18:27:43

Sec
tionA
Public infrastructure central to the economic recovery A.15
A
� $5.9 billion for the development of reserved lanes on road network, which contributes to improvepublic transit.
� An investment of $957.4 million is provided for in the Environment sector of the 2021-2031 QIP,including funding for municipal biomethanization and composting projects, for ensuring thesustainability and safety of public dams that control water flow, and for work aimed at reducingGHG emissions and adapting to climate change.
� $7.6 billion for the Municipalities sector of the 2021-2031 QIP, primarily to support municipalities intheir construction, repair and expansion work on drinking water and wastewater treatmentinfrastructure and the replacement of pipes, as well as in projects completed as part of measurestargeting flood resilience and adaptation.
Bolstering these investments of $44.8 billion, CDPQ-Infra has added $18.7 billion and a federalcontribution of $6.9 billion is allocated to Québec under Phase 2 of the Investing in Canada InfrastructureProgram.
Taking into consideration all of these investments, in the coming years, $70.0 billion will be dedicated toreducing GHG and adapting to climate change.
Investments in Infrastructure Promoting the Reduction of GHG Emissions and Adaptation to Climate Change(in billions of dollars)
2021-2031 QIP Future QIPs Outside QIP TotalGouvernement du Québec
Public transit, excluding Plan for a Green Economy 13.7 16.1 � 29.8Public transit � Plan for a Green Economy 0.5 nd � 0.5
Subtotal � Public transit1 14.2 16.1 � 30.3Reserved lanes 0.5 5.4 � 5.9Environment 1.0 � � 1.0Municipalities 7.6 � � 7.6Subtotal 23.3 21.5 44.8
CDPQ-Infra � � 18.7 18.7Federal government �
Public transit (IBA) 4.4 � � 4.4Green infrastructure (IBA) 2.2 � � 2.2Disaster Mitigation and Adaptation Fund (DMAF) 0.3 � � 0.3
Subtotal 6.9 � � 6.9Total 30.2 21.5 18.7 70.4
1 The $14.2 billion for public transit includes $1.4 billion reserved in the central envelope.
In addition, particular attention has been paid to the reduction of GHG emissions and adaptation toclimate change in the investments planned in other sectors. Therefore, the design of new publicinfrastructure, such as school buildings, healthcare institutions and government buildings, must be in linewith the vision and orientations of the Government's 2021-2026 Sustainable Development Strategy,adopted under the Sustainable Development Act.
In January 2021, the Government also launched a public consultation on the possibilities of the green,smart building in Québec. The aim of this consultation is to validate the socio-economic andenvironmental benefits of building intelligence, and to mobilize all industry around a transformative publicprocess. A smart green building aims to consider its entire useful life in order to improve its impacts, inparticular in terms of layout of the site, water management, energy performance, GHG emissions, userexperience, productivity, use of materials and resources, costs and overall financial performance,resilience to climate change and quality of the indoor environment. With nearly 60% of its propertyportfolio being smart buildings, the SQI was assigned responsibility for undertaking this consultation.
208855 001-164 int 4C_OK-Proofs.pdf_PG 29_Mars 21, 2021_18:27:43

A.16 2021-2031 QuébecInfrastructure Plan
1.3 Diversified investments of $135.0 billion
The 2021-2031 QIP includes investments in all Government's activity sectors, as shown in the followingtable.
Summary of 2021-2031 QIP investments by sector(contribution of the Gouvernement du Québec, in millions of dollars and as a percentage)
Balance at start ofpreparing
2021-2031 QIPDistribution ofavailabilities
Finalenvelopes %
Health and social servicesHealth and social services 19,534.3 1,017.0 20,551.2 15.2
Education and CultureEducation 19,267.9 1,642.6 20,910.5 15.5Higher education 6,088.2 397.6 6,485.8 4.8Culture 1,919.7 100.0 2,019.7 1.5Development of sport 606.3 125.0 731.3 0.5
Economy and environmentRoad network 26,971.4 1,359.4 28,330.8 20.1Public transit 11,910.1 920.2 12,830.3 9.5Marine, air, rail and other transportation 3,556.3 15.4 3,571.7 2.6Municipalities 7,374.5 195.0 7,569.5 5.6Tourism and recreational activities 1,030.0 183.6 1,213.6 0.9Social and community housing 2,208.6 435.6 2,644.2 2.0Northern development 899.4 - 899.4 0.7Research 900.6 83.4 984.0 0.7Environment 905.1 52.3 957.4 0.7Agriculture, forests, fauna and other 742.1 181.4 923.5 0.7
Support for Individuals and FamiliesEducational childcare services 319.6 35.4 355.0 0.3
Administration and JusticeGovernment administration 3,727.2 470.7 4,197.9 3.1Information resources 7,004.7 207.0 7,211.7 5.3
Subtotal � Sector Envelopes 114,966.0 7,421.6 122,387.4 90.7Central envelope1 7,808.6 4,803.9 12,612.6 9.3Total 122,774.5 12,225.5 135,000.0 100.0
Note: Figures are rounded and the sum of the amounts may not correspond to the total indicated.1 Refer to heading 1.4.
General and detailed tables on investments set out in the 2021-2031 QIP are presented in section B of thisdocument.
208855 001-164 int 4C_OK-Proofs.pdf_PG 30_Mars 21, 2021_18:27:43

Sec
tionA
Public infrastructure central to the economic recovery A.17
A
1.4 A central envelope to carry out major projects under study
In accordance with section 7 of the Public Infrastructure Act, the 2021-2031 QIP provides for a centralenvelope to ensure the Government's financial contribution to projects under study prioritized for approvalof their opportunity case or business case by March 31 2022. Transfer of these sums from the centralenvelope of $12.6 billion to the sectors requires a Cabinet decision.
Amounts earmarked in the central envelope under the 2021-2031 QIP, by sector(contribution of the Gouvernement du Québec, in millions of dollars)
Health and social services 4,415.3
Road network 4,758.1
Other sectors 3,439.2
Total 12,612.6
Because of the considerable number of projects under review and some others at the planning stage in the2021-2031 QIP, for which an estimated $37.0 billion in government funding has not yet been madeavailable,12 the Gouvernement du Québec must plan for their gradual implementation in upcoming QIPs.The annual updates of future QIPs will make available new funds to constitute the necessary provisions toguarantee the completion of the projects that will be retained.
� Projects requiring a Québec government contribution of more than $1.0 billion will be funded graduallyfrom the central envelope, based on the expected approval date of their business case, in order to freeup funds between the date of the opportunity case and the date of the business case in order to includea greater number of projects and envelopes in the interim.
Projects that are funded from the central envelope are not made public, in order to respect the Cabinet'sdecision-making authority regarding their implementation and to reduce the risk of collusion in theirexecution.
1 In the 2020-2030 QIP, government contributions remaining to be provisioned were estimated at nearly $48.0 billion.2 This estimate does not include the money needed to fund the following two projects, for which CDPQ Infra could assume responsibility: "Transformative
electric public transit projects on Boulevard Taschereau and extension of the Métro's yellow line" and �Transformative electric public transit projects toextend the REM to downtown Laval and link east and west Laval � Enhancement."
208855 001-164 int 4C_OK-Proofs.pdf_PG 31_Mars 21, 2021_18:27:43

A.18 2021-2031 QuébecInfrastructure Plan
2. Significantly accelerating infrastructure investments
2.1 Accelerating a nearly $13.4 billion investment in the first five-year period
In an effort to deploy projects throughout Québec to stimulate the economy affected by the COVID-19pandemic, the government has chosen to accelerate infrastructure investments, particularly to supportprojects covered under the Act respecting the acceleration of certain infrastructure projects.
As part of its 10-year plan, the government will invest close to $13.4 billion more in the first five-year periodof the 2021-2031 QIP compared to that of the previous QIP. As a result, $77.0 billion will be invested in thenext five years, which will help stimulate the economy.
� 57% of the investments in the 2021-2031 QIP are planned for the next five years.
Annual investments(contribution of the Gouvernement du Québec, in billions of dollars and as a percentage)
2.2 An Act respecting the acceleration of certain infrastructure projects
On December 10, 2020, the National Assembly of Québec passed the Act respecting the acceleration ofcertain infrastructure projects, which is aimed at accelerating 180 infrastructure projects for an estimatedtotal cost of $55.0 billion.
� 51 projects under the responsibility of the MTQ or the public transit authorities (structuring electric publictransport projects, reserved bus lanes, reconstruction of roads, highways or bridges, seaways and railtracks);
� 81 projects under the responsibility of the MSSS (seniors' residences, CHSLD and hospitals);
13.5
16.0 16.515.5 15.5
13.512.0
11.0 10.8 10.7
2021-2022
2022-2023
2023-2024
2024-2025
2025-2026
2026-2027
2027-2028
2028-2029
2029-2030
2030-2031
57% 43%
208855 001-164 int 4C_OK-Proofs.pdf_PG 32_Mars 21, 2021_18:27:43

Sec
tionA
Public infrastructure central to the economic recovery A.19
A
� 35 projects under the responsibility of the MEQ (primary and secondary schools and adult educationand vocational training centres);
� 5 projects under the responsibility of the MES (CEGEPs and universities);
� 8 projects under the responsibility of the SQI (court houses and government buildings).
The purpose of this law is to streamline certain procedures, without diminishing the existing standards, inorder to get large infrastructure projects, including schools, seniors' residences, hospitals and road andpublic transit infrastructure, underway more quickly. It involves well-defined, limited and temporaryacceleration measures targeting expropriation, the domain of the State, the environment, and land useplanning and development.
These measures to accelerate the 180 infrastructure projects should have a quick impact on the economyseriously weakened by the health crisis posed by the spread of COVID-19.
The 2021-2031 QIP provides for the funds needed to complete 136 of the 180 infrastructure projectscovered by the Act respecting the acceleration of certain infrastructure projects, namely, the projectsunderway in 2021-2022. The funds needed to complete the other 44 projects will be provided in a timelymanner, during the preparation of future QIPs.
Since many infrastructure projects require approvals that take some time to obtain before going ahead, thelaw stipulates that temporary measures must be established to limit these delays in order to more quicklygenerate significant economic activity and to allow Quebecers to benefit from the use of this infrastructurein a more timely manner, without deviating from the high standards Québec has adopted in terms ofsustainable development and integrity.
� For example, the law aims to accelerate the assessment procedures while maintaining the samestandards of environmental protection. The Minister of the Environment and the Fight against ClimateChange therefore has the same powers to ensure the environmental compliance of a project, in additionto having rigorous oversight over the work to ensure that the environment is protected.
In the interests of transparency, the law requires semi-annual reports for each project benefiting fromacceleration measures as well as follow-up on the project's status. The law also states that the Minister ofthe Environment and the Fight against Climate Change will release a report on the enforcement ofacceleration measures relating to the environment. A report on the enforcement of the law will also betabled in the National Assembly in 2026.
To guarantee the integrity of the processes for awarding contracts, it confers on the AMP a greatermonitoring role regarding public contracts and subcontracts arising from those projects.
208855 001-164 int 4C_OK-Proofs.pdf_PG 33_Mars 21, 2021_18:27:43

A.20 2021-2031 QuébecInfrastructure Plan
ADDITIONAL POWERS FOR GREATER OVERSIGHTFOR PUBLIC INFRASTRUCTURE CONTRACTS
The Act respecting the acceleration of certain infrastructure projects confers on the AMP additionalfunctions and powers related to the oversight of public contracts arising from the 180 projects acceleratedby the legislation. In particular, the AMP can:
� examine those public contracts and subcontracts;
� order a public body to take corrective measures;
� suspend the performance of such contracts or terminate them if the seriousness of the breachesobserved justifies it.
The AMP can also investigate on its own initiative.
These additional powers given to the AMP will provide greater oversight over public infrastructureprojects.
2.3 Action Plan for the Construction Sector : to support and develop theindustry's capacity
On March 21, 2021, the government made its Action Plan for the Construction Sector public. The plan wasprepared by the SCT entitled To support and develop industry's capacity to complete priority infrastructureprojects for Québec. The purpose of this action plan is to get the most of the investments planned by theGouvernement du Québec, as part of the QIP, to help revive the economy in response to the extraordinarytimes we are living in during this health crisis.
In developing this action plan, the key players in the construction industry were consulted to obtain theirproposals, while the main departments and bodies most concerned with the situation helped to developconcrete measures. As a result, some 40 measures were developed and grouped into five areas of focus,in order to support and develop industry capacity to complete Québec's priority infrastructure projects.
� The first area of focus is to accelerate $2.9 billion of investments in the 2020-2021 QIP, to temporarilyloosen decision-making processes related to infrastructure projects, and to adopt new ways of doingthings, in particular through a draft by-law for professional service contracts and construction contracts,and enhancement of the electronic tendering system.
� The second area of focus is to more efficiently implement the QIP on an ongoing basis by taking actionon the terms and conditions of certain calls for tender and consolidating project management. Thismeasure will promote a rapid recovery of local economic activity;
� The third area of focus brings together the various initiatives aimed at reducing labour scarcity,specifically through better integration of workers belonging to groups of people underrepresented in theconstruction industry, as well as through more rapid and better-adapted training;
� The fourth area of focus is to increase industry productivity, particularly through building informationmodelling and the support of prefabrication in public construction projects;
� The fifth area of focus is to support growth of companies in the construction sector in order to increasethe number of companies that can participate in public tenders for major projects through guidance andthrough loans and loan guarantees.
208855 001-164 int 4C_OK-Proofs.pdf_PG 34_Mars 21, 2021_18:27:43
Sec
tionA
Public infrastructure central to the economic recovery A.21
A
In financial terms, and with regard to expenditures, the various measures retained will have a $95.3 millioncost in the 2020-2021, 2021-2022 and 2022-2023 fiscal years, that is, the fiscal years in the government'scurrent budget horizon�which does not take into account self-financing measures estimated at close to$25.0 million.
The economic recovery, in addressing activities in the construction sector, will trigger investments of$3.7 billion over those same fiscal years, including both accelerated investments ($3.5 billion) and newinvestments ($0.2 billion).
ACCELERATION OF INVESTMENTS IN 2020-2021
In May 2020, the Government announced the acceleration of $2.9 billion in investments forecast in the2020-2030 QIP with the aim of stimulating the economic relaunch of Québec, which was hit hard by thehealth crisis caused by the spread of COVID-19.
For 2020-2021, the QIP was therefore revised to plan investments of up to $13.9 billion, rather than the$11.0 billion originally allocated, making it possible to complete several infrastructure projects, primarilyin the health, education, higher education, road network and public transit sectors.
With this additional $2.9 billion, available starting in 2020-2021, a positive effect of 0.3% on Québec'sreal GDP is expected.
An accountability reporting on the acceleration of investments in 2020-2021 will be published in the2022-2032 QIP, once a full year of project completion has passed.
208855 001-164 int 4C_OK-Proofs.pdf_PG 35_Mars 21, 2021_18:27:43

A.22 2021-2031 QuébecInfrastructure Plan
3. Planning investments to ensure the sustainability of existinginfrastructure
3.1 Prioritizing investments dedicated to infrastructure maintenance
To strike an appropriate balance between investments in infrastructure maintenance and enhancement,60% overall of funds available under the 2021-2031 QIP is allocated to maintenance projects. Thisgovernment strategy benefits current and future generations, since it aims at balancing the sustainability ofthe existing portfolio with the development of new infrastructure.
The investments provided for under the QIP are made by two types of bodies:
� public bodies, such as departments, school service centres, and health and social services networkestablishments that own the infrastructure dedicated to public services directly under the Government'sresponsibility;
� subsidized bodies such as municipalities and public transit corporations that own infrastructure forwhich they receive government funding. These bodies provide the public services under theirresponsibility. Only the funding granted by the Government to the bodies considered subsidized isincluded in the QIP.
In the 2021-2031 QIP, 79% of planned investments are allocated to public bodies ($106.0 billion) and 21%to subsidized bodies ($29.0 billion).
2021-2031 QIP investmentsby type of investment and by body1
(contribution of the Gouvernement du Québec, in millions of dollars and as a percentage)
Public bodies % Subsidized bodies % Total %
Infrastructure maintenance 60,726.4 64 12,798.3 46 73,524.6 60
Portfolio enhancement 34,078.7 36 14,784.1 54 48,862.8 40
Subtotal 94,805.0 100 27,582.4 100 122,387.4 100
Central envelope2 11,219.5 1,393.1 12,612.6
Total 106,024.5 79 28,975.5 21 135,000.0 100Note: Figures are rounded and the sum of the amounts may not correspond to the total indicated.1 Details of investments by mission and sector set out in the 2021-2031 QIP are presented in Appendix 2 of section A.2 See heading 1.3.
For public bodies, the Government is prioritizing projects and envelopes that seek to address needsassociated with the physical deterioration of an aging asset portfolio, in particular the repair and rebuildingof infrastructure at the end of its useful life, primarily in the road and education network, health and socialservices, and higher education.
� The $60.7 billion allocated, representing 64% of the $94.8 billion total investment excluding the centralenvelope, will also serve to replace obsolete equipment and permit the functional development ofschools, hospitals, CHSLD and road infrastructure.
� On the other hand, the Government is allocating $34.1 million to meet the priority development needsof the public body portfolio, in particular the construction of new seniors' residences and alternativeresidences as well as new schools based on new architectural concepts developed by the Government.
208855 001-164 int 4C_OK-Proofs.pdf_PG 36_Mars 21, 2021_18:27:43

Sec
tionA
Public infrastructure central to the economic recovery A.23
A
Concerning subsidized bodies, the Government is focusing particularly on priority requests for investmentsto develop new infrastructure.
� $14.8 billion in investments, or 54% of the $27.6 billion total investment excluding the central envelope,are allocated to portfolio enhancements, primarily those of municipalities and public transitcorporations. Among other things, this approach supports citizen mobility, increased traffic flow andelectrification of modes of public transit.
� In tandem, $12.8 billion is earmarked to respond to maintenance needs for subsidized bodies' portfolio,which is in better condition (80% having a GCI of A, B or C) than the public bodies' inventory (60% ofwhich has a CGI of A, B or C).
The AMD of public body infrastructure is assessed at $27.7 billion in March 2021, which corresponds to theestimated level of investment necessary to restore infrastructure in poor condition (GCI of D or E) to goodcondition.
Regarding subsidized bodies, since their infrastructure does not belong to the Government and since theyare responsible for maintaining it in good condition, the cost of work required to restore their infrastructurein poor condition (GCI of D or E) is not included in the Government�s AMD.
PUBLIC AND SUBSIDIZED BODIES
Public bodies
The public bodies' portfolio primarily comprises government departments and bodies, school servicecentres,1 CEGEPs, universities,2 and health and social services establishments.
This inventory, which has a replacement value of more than $250.0 billion, includes:
� over 12,700 buildings, including schools and hospitals; and
� more than 31,000 kilometres of road and 9,700 bridges and overpasses.
Taking into account the anticipated impact of the investments planned in the 2021-2031 QIP, theproportion of infrastructure in good condition could rise from 60.1% to 66.4% by March 2031.
Subsidized bodies
The infrastructure portfolio of subsidized bodies mainly includes municipalities and public transitcorporations.
This inventory, which has a replacement value of more than $200.0 billion, includes:
� more than 97,800 kilometres of drinking, rain and wastewater pipes; and
� significant public transit infrastructure, including more than 500 kilometres of reserved lanes andcommuter rail and Montréal Métro lines.
Good condition (ABC)60% 2021-2031 QIP
$106,025 millionAMD$27,652 million
Good condition (ABC)80%
2021-2031 QIP$28,975 million
1 Includes 61 school service centres and 11 school boards2 While only the Université du Québec and its constituent universities are part of the government reporting entity, all Québec universities are
considered public bodies within the meaning of the PIA. Consequently, their infrastructure inventory is included in this category of body.
208855 001-164 int 4C_OK-Proofs.pdf_PG 37_Mars 21, 2021_18:27:43

A.24 2021-2031 QuébecInfrastructure Plan
3.2 An acceleration of investments to maintain the inventory in good condition
In the 2018-2028 QIP, the annual average of the first five years' investments allocated to maintain theGovernment portfolio was $5.9 billion. Given the significant investments required due to the advanced ageof some of its infrastructure and the maintenance backlogs that developed over the past two decades, thisforecast pace of repair and replacement work only made it possible to cover the anticipated naturaldeterioration of the inventory. It was therefore necessary to increase the level of annual investment setaside to maintain the portfolio in the first five years of the QIP to respond to anticipated needs to maintainthe infrastructure in good condition (CGI of A, B or C).
The Government increased this yearly average to $6.7 billion in the 2019-2029 QIP, allocating the majorityof the $15.1 billion, $8.6 billion (57%), to investments to maintain the portfolio.
In its 2019-2023 Strategic Plan, the SCT set an objective to gradually increase the average annualinvestment earmarked for inventory maintenance to $7.3 billion by the 2023-2033 QIP. This strategy aimsto provide a sufficient level of recurring investment to ensure the sustainability of the public infrastructureportfolio.
Considering the extent of remediation to be done and in order to stimulate an economy affected by theCOVID-19 pandemic, the Government decided to accelerate investments planned to maintain the portfolioin the first five years of the 2021-2031 QIP. Consequently, with an annual average of $7.8 billion for thefirst five years of the 2021-2031 QIP, the target of $7.3 billion in the Strategic Plan is exceeded.
2021-2031 QIP investmentsBy type and five-year period(contribution of the Gouvernement du Québec, in millions of dollars)
2021-2022 to 2025-2026 2026-2027 to 2030-2031Total QIP
Total Annualaverage Total
Infrastructure maintenance 38,995.4 7,799.1 34,529.2 73,524.6
Portfolio enhancement 34,960.6 6,992.1 13,902.2 48,862.8
Central envelope 3,054.7 610.9 9,557.9 12,612.6
Total 77,010.8 15,402.2 57,989.2 135,000.0Note: Figures are rounded and the sum of the amounts may not correspond to the total indicated.
Furthermore, in its 2019-2023 Strategic Plan, the SCT also committed to implement the means necessaryto maintain a proportion of at least 60% of infrastructure under the responsibility of public bodies in goodcondition (CGI of A, B or C) by the 2023-2033 QIP.
To ensure the sustainability of the public infrastructure, the Government will have to continue its efforts inthe coming years to increase the level of recurring investments to maintain the portfolio and develop moreeffective intervention strategies with all departments and bodies concerned.
208855 001-164 int 4C_OK-Proofs.pdf_PG 38_Mars 21, 2021_18:27:43

Sec
tionA
Public infrastructure central to the economic recovery A.25
A
3.3 An asset maintenance deficit addressed by 78% over 10 years
The AMD associated with infrastructures in poor condition (GCI of D or E) that belong to public bodies isassessed at $27.7 billion in March 2021. This deficit is explained by the fact that a vast number of Québec'spublic infrastructures, a large portion of which were built between 1960 and 1970, have reached or willreach the end of their useful life, which generally varies between 25 and 75 years, depending on theinfrastructure. This situation is especially true of road infrastructure and the education network real estateportfolio, the advanced age of which means that major investments are required to restore them to goodcondition (GCI of A, B or C).
Change in public body AMDBy sector(millions of dollars and per cent)
2020-2021AMPI
Naturaldeterioration
Newfindings Reduction Variation 2021-2022
AMPI %
Road network1 18,746.7 � (620.0) (203.2) (823.2) 17,923.5 65
Education 5,340.5 1,049.5 � (1,185.7) (136.2) 5,204.3 19
Other sectors 4,147.7 420.1 486.2 (530.1) 376.2 4,523.9 16
Total 28,234.9 1,469.6 (133.8) (1,919.0) (583.2) 27,651.7 1001 No natural degradation of road infrastructure was observed this year since the portrait of the road network is presented based on inspection data
from the previous year. Similarly, the effect of interventions completed in 2020-2021 may be reflected in the MTQ's 2022-2023 AMPI. However, theadvancement of certain major repair projects is taken into account, including the final commissioning of the Turcot complex reconstruction inMontréal.
Over the past year, the AMD decreased by $583.2 million. More specifically, this variation is due to:
� a $1.5 billion increase in the natural deterioration of infrastructure inspected, including inflation of thecost of work accumulated and not completed during the year;
� a decrease of $0.1 billion related to new findings, primarily a downward adjustment of the AMD forcertain major repair and reconstruction projects for structures in very poor condition (GCI of E) currentlyunder study;
� a $1.9 billion reduction for work completed in 2020-2021 in all sectors that made it possible to decreasethe AMD.
AMD managementBy sector(millions of dollars and per cent)
Total AMD AMDmanaged %
Road network 17,923.5 13,028.6 73
Education 5,204.3 5,204.3 100
Other sectors 4,523.9 3,450.0 76
Total 27,651.7 21,682.9 78
Investments planned in the 2021-2031 QIP manage 78% of the current AMD, over the next decade torepair, reconstruct or replace the most obsolete infrastructure.
Therefore, the Government plans to use a substantial portion of investments forecast in the2021-2031 QIP, nearly $21.7 billion, to complete work targeting the AMD associated with infrastructure inpoor condition (GCI of D or E) belonging to public bodies.
208855 001-164 int 4C_OK-Proofs.pdf_PG 39_Mars 21, 2021_18:27:43

A.26 2021-2031 QuébecInfrastructure Plan
3.4 Anticipated improvement in the condition of public infrastructure in thecoming years
For a second year, the SCT used a forecasting model to simulate, over a 10-year period, the evolution inthe condition of the AMD of public infrastructure to guide choices and establish measurable objectives.This exercise is based primarily on investment choices made for each sector in the 2021-2031 QIP as wellas on information recorded and anticipated in March 2021 about infrastructure inspected, the condition ofwhich is published in the 2021-2022 AMPI.1
This modelling exercise, which is updated annually, aims to track the progress of expected effects and toestablish the adjustments required in terms of inventory maintenance investment choices that will make itpossible to achieve the objectives sought. For public bodies, this simulation is also an input in determininga long-term AMD management strategy, particularly regarding the identification of foreseeable majorreconstruction or replacement projects based on the useful life of each infrastructure. Lastly, the convincingresults obtained by the model will continue to be refined and improved in coming QIP and could vary overtime.
Expected change in the proportion of public body infrastructure in good condition (CGI of A, B or C)(percentage)
The probable results of this simulation currently allow anticipation of an improvement in the generalcondition of infrastructure under the responsibility of public bodies given the expected level of investmentin inventory maintenance. Therefore, in March 2031, the proportion of infrastructure deemed in goodcondition will reach 66.4%, and the AMD will cease the progression observed in recent years, amountingto $22.1 billion. Taking inflation into account, this figure represent a substantial drop of $16.4 billion in realterms, adjusted to today's dollars.
1 GOUVERNEMENT DU QUÉBEC Plans annuels de gestion des investissements en infrastructures 2021-2022 [en ligne : https://https://www.tresor.gouv.qc.ca/infrastructures-publiques/publications//]
60.860.1
62.663.1
65.867.5
66.4
74.1
58.6
52
57
62
67
72
77Optimistic
Pessimistic
Probable
208855 001-164 int 4C_OK-Proofs.pdf_PG 40_Mars 21, 2021_18:27:43

Sec
tionA
Public infrastructure central to the economic recovery A.27
A
To consolidate the anticipated improvements and prevent a reduction in the results expected, continuationof the progressive increase in inventory maintenance investments will be necessary in upcoming QIP,especially in the second five years.
The results obtained could vary greatly depending on the investment choices made by the departmentsand bodies as well as on their capacity to complete the work planned, and that of the construction industryto respond. Furthermore, the actual deterioration of each infrastructure could differ from that expected, duein particular to climate change or usage conditions that can quickly change because of, for example,increased road traffic. Lastly, the completion of functional renovations to existing infrastructure that will beessential to respond to changes in the needs of clientele will demand use of an increasingly largerproportion of inventory maintenance investment envelopes available.
The modelling will also make it possible to forecast the expected effect of investments according to anoptimistic or pessimistic scenario by March 2031.
� The proportion of infrastructure in good condition could improve and reach 74.1%, and the AMD couldfall to $17.8 billion if, for example inventory maintenance projects are completed more quickly thanexpected.
� The proportion of infrastructure in good condition may not exceed 58.6%, and the AMD could increaseto $26.3 billion if, for example, the rate of deterioration or inflation is higher than expected.
Expected change in public body AMD(in billions of dollars)
28.2 27.7 28.0 28.7
26.3
22.3 22.1
17.8
26.3
15
17
19
21
23
25
27
29
Probable
Pessimistic
Optimistic
208855 001-164 int 4C_OK-Proofs.pdf_PG 41_Mars 21, 2021_18:27:43
A.28 2021-2031 QuébecInfrastructure Plan
Appendix 1 � Preparation of the 2021-2031 QIP
Appendix 1 � Preparation of the 2021-2031 QIP
Annual development of the QIP takes into account the state of progress on current projects, the needsexpressed by the departments and bodies and the Government's priorities. Starting with the previousyear�s plan, the following factors are considered.
Changes during 2020-2021 (first year of preceding QIP)
The starting point of the 2021-2031 QIP differs from that of the 2020-2030 QIP published. The followingelements must be taken into consideration to update the 2020-2030 QIP in order to reflect theoperations that took place in 2020-2021:
� Cabinet decisions in 2020-2021. For all major projects that Cabinet has approved for the yearunderway, funds allocated to these projects are transferred from the central envelope to theenvelopes of the departmental and body sectors responsible for these projects;
� Changes in the cost or contribution of partners on certain projects, which resulted in adjustments tothe planned Government contribution, particularly in the case of major projects;
� Withdrawal of the first year of the earlier plan (2020-2021) and the addition of the last year(2030-2031) for an equivalent sum, so that the 10-year level of investments remains constant.Nonetheless, the distribution among the sector and central envelopes for the year added is differentfrom the year removed;
� Indeed, for the year added (2030-2031), the funds allocated to sector envelopes primarilyrepresent recurring asset maintenance allowances. The balance not distributed consists of thefunds available to carry out new projects.
� The progress and completion of several projects frees amounts that become available for otherinvestments.
Consequently, the result of these operations made it possible to determine the balance available fromsector envelopes and the central envelope at the start of preparation of the 2021-2031 QIP.
Government decisions
Each year, the government sets the level of QIP investments based on needs and investment priorities,taking their impacts on public finances into account.
Lastly, the Government distributes all of the available $12.2 billion (available balance of $7.7 billion andincrease of $4.5 billion) either to sector envelopes to implement projects and programs under theirjurisdiction, or to the central envelope to set aside the funds that will be needed to carry out majorprojects in the future.
208855 001-164 int 4C_OK-Proofs.pdf_PG 42_Mars 21, 2021_18:27:43
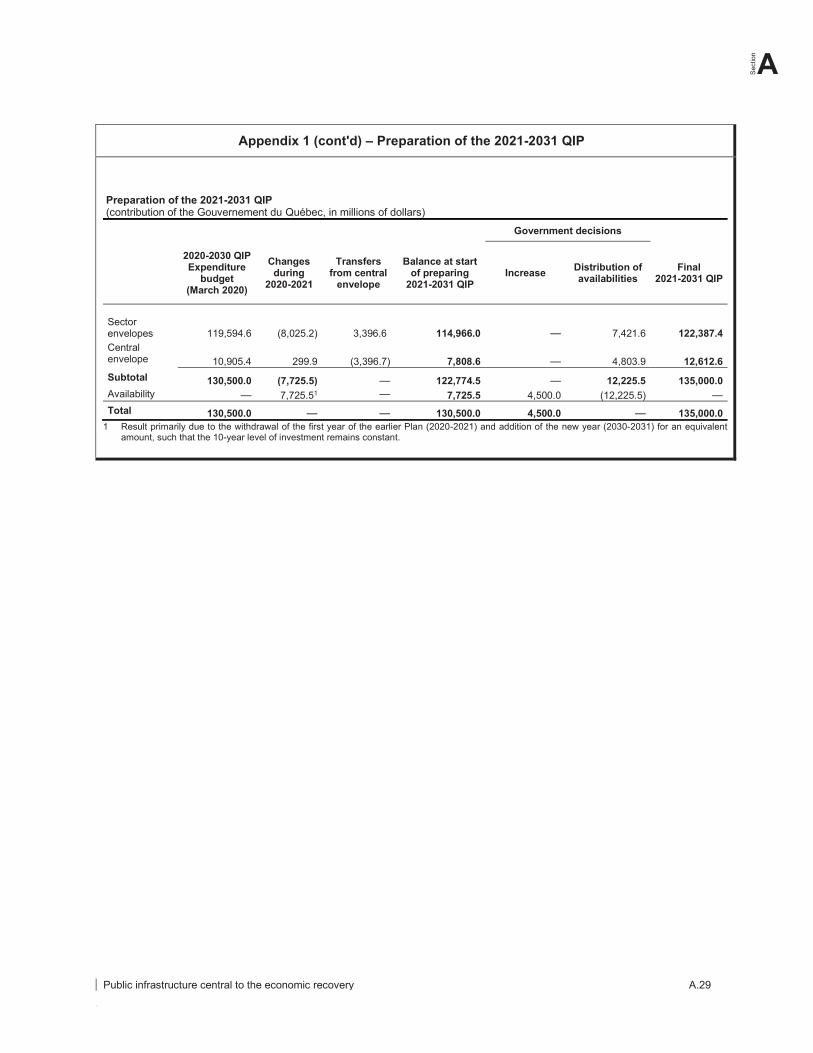
Sec
tionA
Public infrastructure central to the economic recovery A.29
A
Appendix 1 (cont'd) � Preparation of the 2021-2031 QIP
Preparation of the 2021-2031 QIP(contribution of the Gouvernement du Québec, in millions of dollars)
Government decisions
2020-2030 QIPExpenditure
budget(March 2020)
Changesduring
2020-2021
Transfersfrom central
envelope
Balance at startof preparing
2021-2031 QIPIncrease Distribution of
availabilitiesFinal
2021-2031 QIP
Sectorenvelopes 119,594.6 (8,025.2) 3,396.6 114,966.0 � 7,421.6 122,387.4Centralenvelope 10,905.4 299.9 (3,396.7) 7,808.6 � 4,803.9 12,612.6Subtotal 130,500.0 (7,725.5) � 122,774.5 � 12,225.5 135,000.0Availability � 7,725.51 � 7,725.5 4,500.0 (12,225.5) �Total 130,500.0 � � 130,500.0 4,500.0 � 135,000.0
1 Result primarily due to the withdrawal of the first year of the earlier Plan (2020-2021) and addition of the new year (2030-2031) for an equivalentamount, such that the 10-year level of investment remains constant.
208855 001-164 int 4C_OK-Proofs.pdf_PG 43_Mars 21, 2021_18:27:43

A.30 2021-2031 QuébecInfrastructure Plan
App
endi
x1
(con
t'd)�
Prep
arat
ion
of th
e 20
21-2
031
QIP
Dis
trib
utio
nof
avai
labi
litie
s(c
ontr
ibut
ion
ofth
eG
ouve
rnem
ent
du
Qu
ébec
,in
mill
ions
ofdo
llars
)
2020
-203
0Q
IP20
21-2
031
QIP
Cha
nge
inen
velo
pes
2021
-203
1Q
IPD
istr
ibut
ion
ofav
aila
bilit
ies
2020
Expe
nditu
reB
udge
t(M
arch
2020
)
Cha
nge
durin
gth
eye
ar20
20-2
0211
Tran
sfer
sfr
omce
ntra
len
velo
pe
Bal
ance
atst
arto
fpr
epar
ing
2021
-203
1Q
IPIn
crea
seD
istr
ibut
ion
ofav
aila
bilit
ies
Fina
len
velo
pes
Am
ount
sal
loca
ted
tose
ctor
enve
lope
s
Dis
trib
utio
nof
amou
nts
allo
cate
dto
cent
ral
enve
lope
2
Tota
lava
ilabl
eby
mis
sion
Hea
lthan
dso
cial
serv
ices
Hea
ltha
ndso
cial
serv
ices
20,4
62.6
(1,4
05.
9)
477.
519
,534
.3�
1,0
17.0
20,5
51.2
1,0
17.0
2,0
66.7
3,0
83.7
Educ
atio
nan
dC
ultu
reE
duca
tion
19,1
50.3
(1,3
04.
4)
1,4
22.0
19,2
67.
8�
1,6
42.6
20,9
10.
51,
642
.613
5.7
1,7
78.3
Hig
her
edu
catio
n6,
323
.4(3
05.5
)70
.36,
088
.2�
397.
66,
485
.839
7.6
414.
281
1.8
Cul
ture
1,9
63.5
(53.
2)
9.4
1,9
19.7
�10
0.0
2,0
19.7
100.
0-
100.
0
Dev
elop
me
nto
fsp
ort
653
.3(4
7.0
)�
606.
3�
125.
073
1.3
125.
0-
125.
0
Sub
tota
l28
,090
.6(1
,71
0.2
)1,
501
.727
,882
.1�
2,2
65.3
30,1
47.
32,
265
.354
9.9
2,8
15.2
Econ
omy
and
envi
ronm
ent
Roa
dn
etw
ork
26,8
32.1
(919
.2)
1,0
58.5
26,9
71.
4�
1,3
59.4
28,3
30.
81,
359
.41,
196
.02,
555
.4
Pub
lictr
ans
it13
,581
.2(1
,67
1.1
)�
11,9
10.
1�
920.
212
,83
0.3
920.
257
1.8
1,4
92.0
Mar
ine
.air
.rai
land
othe
rtr
ans
por
tatio
n4,
053
.9(5
01.3
)3.
73,
556
.3�
15.4
3,5
71.7
15.4
-15
.4
Mun
icip
aliti
es7,
536
.5(1
62.0
)�
7,3
74.5
�19
5.0
7,5
69.5
195.
0-
195.
0
Tou
rism
and
recr
eat
iona
lact
iviti
es1,
148
.5(2
04.7
)86
.21,
030
.0�
183.
61,
213
.618
3.6
126.
831
0.4
Soc
iala
ndco
mm
unity
hou
sing
2,5
10.0
(301
.4)
�2,
208
.6�
435.
62,
644
.243
5.6
-43
5.6
Nor
the
rnde
velo
pmen
t90
8.0
(8.6
)�
899.
4�
�89
9.4
-5.
05.
0
Res
ear
ch1,
006
.5(1
05.9
)�
900.
6�
83.4
984.
083
.4-
83.4
Env
ironm
ent
930
.6(3
7.2
)11
.790
5.1
�52
.395
7.4
52.3
-52
.3
Agr
icul
ture
.for
ests
.fa
una
and
othe
r84
5.4
(103
.3)
�74
2.1
�18
1.4
923.
518
1.4
-18
1.4
Sub
tota
l59
,352
.8(4
,01
4.6
)1,
160
.156
,49
8.2
�3,
426
.359
,92
4.4
3,4
26.3
1,8
99.6
5,3
25.9
Supp
ortf
orIn
divi
dual
san
dFa
mili
esE
duca
tion
alch
ildca
rese
rvic
es37
4.8
(55
.2)
�31
9.6
�35
.435
5.0
35.4
-35
.4
Adm
inis
trat
ion
and
Just
ice
Gov
ern
me
ntad
min
istr
atio
n3,
919
.6(3
87.7
)19
5.3
3,7
27.2
�47
0.7
4,1
97.9
470.
7-
470.
7In
form
atio
nre
sour
ces
7,3
94.3
(451
.6)
62.0
7,0
04.7
�20
7.0
7,2
11.7
207.
0-
207.
0
Sub
tota
l11
,313
.9(8
39.3
)25
7.3
10,7
31.
9�
677.
711
,40
9.6
677.
7-
677.
7
Subt
otal
sect
oren
velo
pes
119,
594.
6(8
,025
.2)
3,39
6.6
114,
966.
0�
7,42
1.6
122,
387.
47,
421.
64,
516.
211
,937
.8C
entr
alen
velo
pe10
,905
.429
9.9
(3,3
96.7
)7,
808.
6�
4,80
3.9
12,6
12.6
-28
7.73
287.
7A
vaila
bilit
y�
7,72
5.5
�7,
725.
54,
500.
0(1
2,22
5.5)
�-
-To
tal
130,
500.
0�
�13
0,50
0.0
4,50
0.0
�13
5,00
0.0
7,42
1.6
4,80
3.9
12,2
25.5
Not
e:F
igu
res
are
rou
nded
and
the
sum
ofth
eam
ount
sm
ay
not
corr
espo
nd
toth
eto
tali
ndi
cate
d.
1R
esul
tpr
ima
rily
due
toth
ew
ithdr
awal
oft
he
first
year
ofth
ee
arlie
rP
lan
(20
20-2
021)
and
add
ition
ofth
en
ewye
ar(2
030
-20
31)
for
an
equi
vale
ntam
ount
,suc
hth
atth
e10
-ye
arle
velo
fin
vest
men
trem
ains
cons
tan
t.2
Thi
sdi
strib
utio
nis
pre
sen
ted
sole
lyfo
rre
fere
nce
pur
pos
es,
ino
rde
rto
refle
ctp
ote
ntia
ltra
nsfe
rsfr
omth
ece
ntra
lenv
elop
eba
sed
on
the
stat
eof
pro
gre
ssof
pro
ject
s.T
he
tran
sfe
ro
fam
oun
tsto
the
sect
ors
will
requ
ire
aC
abi
net
dec
isio
nto
impl
em
ent,
amon
gth
ep
roje
cts
unde
rst
udy,
thos
eth
atth
eG
ove
rnm
ent
wis
hes
tore
tain
and
prio
ritiz
e.3
Cor
resp
onds
toth
eba
lanc
eo
fava
ilabi
litie
sn
otal
loca
ted
toth
ese
ctor
enve
lop
efo
rco
ntin
gen
cies
.
208855 001-164 int 4C_OK-Proofs.pdf_PG 44_Mars 21, 2021_18:27:43

Sec
tionA
Public infrastructure central to the economic recovery A.31
A
Appendix 2 � Investments by type of body2021-2031 QIP investmentsby mission, sector, type of body and investment(contribution of the Gouvernement du Québec, in millions of dollars)
Public bodies Subsidized bodiesTotal
Maintenance Enhancement Subtotal Maintenance Enhancement SubtotalHealth and social servicesHealth and social services 9,095.1 11,307.5 20,402.7 148.5 � 148.5 20,551.2
Education and CultureEducation 12,973.2 7,937.3 20,910.5 � � � 20,910.5
Higher education 5,876.3 598.2 6,474.5 � 11.3 11.3 6,485.8
Culture 327.5 178.4 505.9 976.1 537.7 1,513.8 2,019.7
Development of sport 31.0 312.2 343.2 7.7 380.3 388.1 731.3
Subtotal 19,208.0 9,026.1 28,234.1 983.8 929.4 1,913.2 30,147.3
Economy and environmentRoad network 23,518.5 4,812.3 28,330.8 � � � 28,330.8
Public transit � � � 2,969.5 9,860.8 12,830.3 12,830.3
Marine. air. rail and othertransportation
865.3 1,072.9 1,938.2 874.8 758.6 1,633.5 3,571.7
Municipalities � � � 6,757.8 811.7 7,569.5 7,569.5
Tourism and recreationalactivities
790.1 253.6 1,043.7 � 170.0 170.0 1,213.6
Social and communityhousing
898.3 98.2 996.5 525.3 1,122.4 1,647.7 2,644.2
Northern development 291.2 504.1 795.3 � 104.2 104.2 899.4
Research � 747.2 747.2 � 236.8 236.8 984.0
Environment 306.4 � 306.4 440.9 210.1 651.0 957.4
Agriculture. forests. faunaand other
228.3 456.5 684.8 3.3 235.4 238.7 923.5
Subtotal 26,898.2 7,944.5 34,842.8 11,571.7 13,510.0 25,081.7 59,924.4
Support for Individuals and FamiliesEducational childcareservices
� � � 91.8 263.2 355.0 355.0
Administration and Justice
Government administration 2,136.9 1,976.9 4,113.8 2.5 81.6 84.1 4,197.9
Information resources 3,388.1 3,823.6 7,211.7 � � � 7,211.7
Subtotal 5,525.0 5,800.5 11,325.5 2.5 81.6 84.1 11,409.6
Subtotal � Sectorenvelopes
60,726.4 34,078.7 94,805.0 12,798.3 14,784.1 27,582.4 122,387.4
Central envelope 3,734.2 7,485.3 11,219.5 � 1,393.1 1,393.1 12,612.6
Total 64,460.6 41,563.9 106,024.5 12,798.3 16,177.2 28,975.5 135,000.0Note: Figures are rounded and the sum of the amounts may not correspond to the total indicated.
208855 001-164 int 4C_OK-Proofs.pdf_PG 45_Mars 21, 2021_18:27:43

A.32 2021-2031 QuébecInfrastructure Plan
Appendix 3 � Directive sur la gestion des projets majeursd'infrastructure publique
An infrastructure project is subject to the Directive when its estimated cost is $50.0 million or more forreal estate projects or $100.0 million or more for roadway projects and, since a decision by the Conseildu trésor in July 2019, public transit projects.
� For a project to be considered under study in the QIP, a preliminary project sheet must be createdto describe and justify the need that the project must fulfill. Based on the priority assigned, Cabinetapproves, if applicable, the preliminary project sheet, and the project moves to the �under study�phase;
� During the study phase, an opportunity case must be developed to assess the project's relevanceand ensure the best option is recommended to meet the need and requirements determined. Oncompletion of this study, Cabinet approves the opportunity case, if applicable, and the project isauthorized as "in planning";
� During the planning phase, a business case must be developed to detail the option selected andset out its management plan. On completion of planning, Cabinet approves the business case, ifapplicable, and the project is then "in progress";
� During the execution phase, summary reports on progress must be written on March 31 andSeptember 30 of each year and sent to the SCT. During execution, Cabinet must authorize anysubstantial change to the project's scope, schedule, financing or cost.
� For a project to be deemed in service, the built, replaced or rehabilitated infrastructure must beproviding full service (or partial service when progressive start-up is planned). However, some workor acquisitions may remain to be done, and some disputes may not yet be fully settled.
� At closing, all of the work is completed to the satisfaction of the project owner, usually the MTQ orthe SQI, and the project has been delivering full service to the public for at least a year, leading toformal reception. A closing report must then be sent to the SCT. However, some work or acquisitionsmay remain to be done, and some disputes may not yet be fully settled.
208855 001-164 int 4C_OK-Proofs.pdf_PG 46_Mars 21, 2021_18:27:43

Sect
ionB
Planned Investments B.1by Sector
Section B
Planned investments by sector
1. Summary tables .....................................................................................................41.1 Investments by mission and by sector ................................................................ 41.2 Investments by mission, sector and by year ....................................................... 61.3 Investments by investment type and by year ...................................................... 81.4 Investments by mission, sector and by investment type ................................. 101.5 Authorized and announced projects of $20.0 million or more and other
2021-2031 QIP investments by mission, sector and by project and envelope 121.6 Investments by mission, sector and by administrative region......................... 14
2. Planned investments by sector ..........................................................................162.1 Health and social services .................................................................................. 18
2.1.1 2021-2031 QIP Investments......................................................................................18
2.1.2 Authorized and announced projects of $20.0 million or more, by progress status ...18
2.1.3 Portrait of infrastructure and investment strategies � Health and Social services ..25
2.2 Education ............................................................................................................. 282.2.1 2021-2031 QIP Investments......................................................................................28
2.2.2 Authorized and announced projects of $20.0 million or more, by progress status ...28
2.2.3 Portrait of infrastructure and investment strategies � Education.............................35
2.3 Higher education ................................................................................................. 392.3.1 2021-2031 QIP investments ......................................................................................39
2.3.2 Authorized and announced projects of $20.0 million or more, by progress status ...39
2.3.3 Portrait of infrastructure and investment strategies � Higher Education .................41
2.4 Road network....................................................................................................... 462.4.1 2021-2031 QIP investments ......................................................................................46
2.4.2 Authorized and announced projects of $20.0 million or more, by progress status ...46
2.4.3 Portrait of infrastructure and investment strategies � Road network.......................52
2.5 Public transit........................................................................................................ 582.5.1 2021-2031 QIP investments ......................................................................................58
2.5.2 Authorized and announced projects of $20.0 million or more, by progress status ...58
2.5.3 Portrait of infrastructure and investment strategies � Public transit ........................63
208855 001-164 int 4C_OK-Proofs.pdf_PG 47_Mars 21, 2021_18:27:43

B.2 2021-2031 QuébecInfrastructure Plan
2.6 Municipalities....................................................................................................... 662.6.1 2021-2031 QIP investments ......................................................................................66
2.6.2 Authorized and announced projects of $20.0 million or more, by progress status ...66
2.6.3 Portrait of infrastructure portfolio and investment strategies � Municipalities .........68
2.7 Governmental administration ............................................................................. 712.7.1 2021-2031 QIP investments ......................................................................................71
2.7.2 Authorized and announced projects of $20.0 million or more, by progress status ...71
2.7.3 Portrait of infrastructure and investment strategies � Société québécoise desinfrastructures............................................................................................................73
2.8 Culture.................................................................................................................. 762.8.1 2021-2031 QIP investments ......................................................................................76
2.8.2 Authorized and announced projects of $20.0 million or more, by progress status ...76
2.9 Development of sport.......................................................................................... 782.9.1 2021-2031 QIP investments ......................................................................................78
2.9.2 Authorized and announced projects of $20.0 million or more, by progress status ...78
2.10 Marine, air, rail and other transportation ........................................................... 802.10.1 2021-2031 QIP investments ......................................................................................80
2.10.2 Authorized and announced projects of $20.0 million or more, by progress status ...80
2.11 Tourism and recreational activities.................................................................... 822.11.1 2021-2031 QIP investments ......................................................................................82
2.11.2 Authorized and announced projects of $20.0 million or more, by progress status ...82
2.12 Social and community housing .......................................................................... 842.12.1 2021-2031 QIP investments ......................................................................................84
2.13 Northern development......................................................................................... 852.13.1 2021-2031 QIP investments ......................................................................................85
2.13.2 Authorized and announced projects of $20.0 million or more, by progress status ...85
2.14 Research .............................................................................................................. 872.14.1 2021-2031 QIP investments ......................................................................................87
2.14.2 Authorized and announced projects of $20.0 million or more, by progress status ...87
2.15 Environment......................................................................................................... 892.15.1 2021-2031 QIP investments ......................................................................................89
2.15.2 Authorized and announced projects of $20.0 million or more, by progress status ...89
2.16 Agriculture, forests, fauna and other ................................................................. 902.16.1 2021-2031 QIP investments ......................................................................................90
2.16.2 Authorized and announced projects of $20.0 million or more, by progress status ...90
208855 001-164 int 4C_OK-Proofs.pdf_PG 48_Mars 21, 2021_18:27:43

Sect
ionB
Planned Investments B.3by Sector
2.17 Educational childcare services........................................................................... 912.17.1 2021-2031 QIP investments ......................................................................................91
2.18 Information resources......................................................................................... 922.18.1 2021-2031 QIP investments ......................................................................................92
2.18.2 Authorized and announced projects of $20.0 million or more, by progress status ...92
3. Update of planned investments for 2020-2021 .................................................. 944. Report on investments made in 2019-2020........................................................ 96Appendix 1 � Investments made in 2019-2020 in relation to those planned for this
year in the 2019-2029 QIP ........................................................................ 97Appendix 2 � History of investments made compared to those planned for
2015-2016 to 2019-2020.......................................................................... 100Appendix 3 � History of investment levels planned in the Québec Infrastructure
Plan ......................................................................................................... 102Appendix 4 � Investments by mission, sector, type and by administrative region104
208855 001-164 int 4C_OK-Proofs.pdf_PG 49_Mars 21, 2021_18:27:43
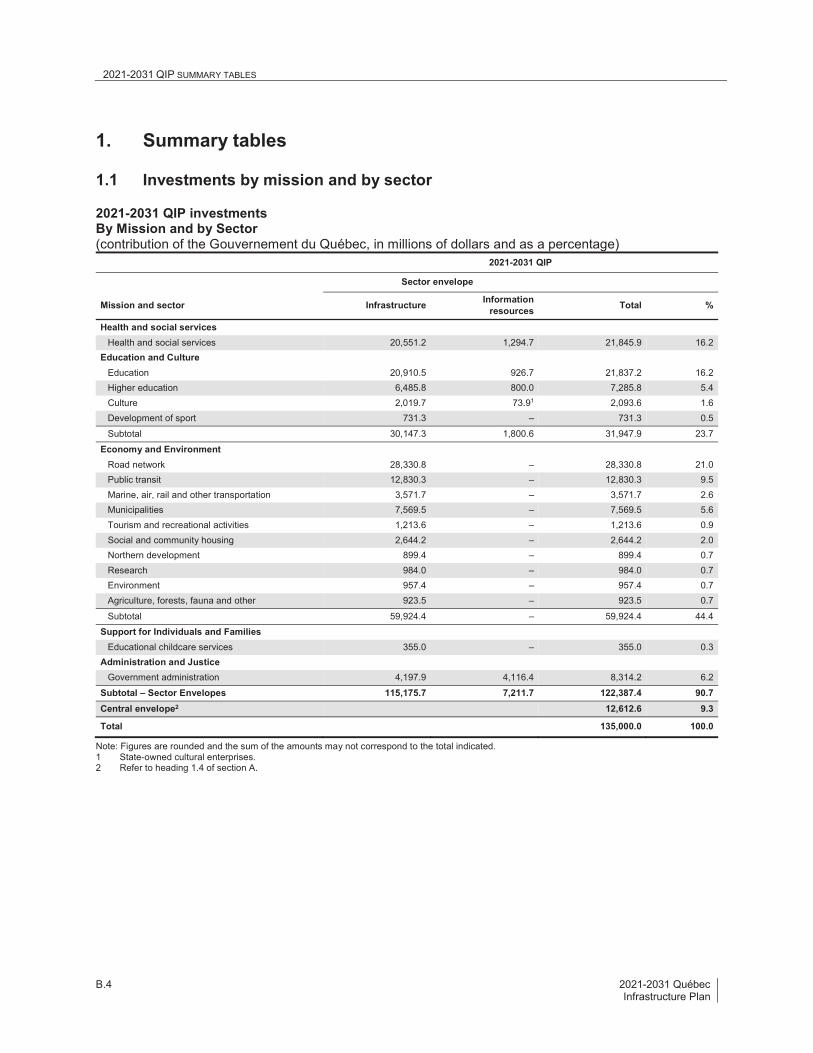
2021-2031 QIP SUMMARY TABLES B
B.4 2021-2031 QuébecInfrastructure Plan
1. Summary tables
1.1 Investments by mission and by sector
2021-2031 QIP investmentsBy Mission and by Sector(contribution of the Gouvernement du Québec, in millions of dollars and as a percentage)
2021-2031 QIP
Sector envelope
Mission and sector Infrastructure Informationresources Total %
Health and social servicesHealth and social services 20,551.2 1,294.7 21,845.9 16.2
Education and CultureEducation 20,910.5 926.7 21,837.2 16.2
Higher education 6,485.8 800.0 7,285.8 5.4
Culture 2,019.7 73.91 2,093.6 1.6
Development of sport 731.3 � 731.3 0.5
Subtotal 30,147.3 1,800.6 31,947.9 23.7
Economy and EnvironmentRoad network 28,330.8 � 28,330.8 21.0
Public transit 12,830.3 � 12,830.3 9.5
Marine, air, rail and other transportation 3,571.7 � 3,571.7 2.6
Municipalities 7,569.5 � 7,569.5 5.6
Tourism and recreational activities 1,213.6 � 1,213.6 0.9
Social and community housing 2,644.2 � 2,644.2 2.0
Northern development 899.4 � 899.4 0.7
Research 984.0 � 984.0 0.7
Environment 957.4 � 957.4 0.7
Agriculture, forests, fauna and other 923.5 � 923.5 0.7
Subtotal 59,924.4 � 59,924.4 44.4
Support for Individuals and FamiliesEducational childcare services 355.0 � 355.0 0.3
Administration and JusticeGovernment administration 4,197.9 4,116.4 8,314.2 6.2
Subtotal � Sector Envelopes 115,175.7 7,211.7 122,387.4 90.7Central envelope2 12,612.6 9.3
Total 135,000.0 100.0
Note: Figures are rounded and the sum of the amounts may not correspond to the total indicated.1 State-owned cultural enterprises.2 Refer to heading 1.4 of section A.
208855 001-164 int 4C_OK-Proofs.pdf_PG 50_Mars 21, 2021_18:27:43

Sect
ion
2021-2031 QIP SUMMARY TABLES B
Planned Investments B.5by Sector
2020-2030 QIP
Sector envelope
Infrastructure Information resources Total %
20,462.6 1,410.6 21,873.1 16.8
19,150.3 1,002.6 20,152.8 15.4
6,323.4 883.6 7,207.0 5.5
1,963.5 63.71 2,027.2 1.6
653.3 � 653.3 0.5
28,090.6 1,949.8 30,040.4 23.0
26,832.1 � 26,832.1 20.6
13,581.2 � 13,581.2 10.4
4,053.9 � 4,053.9 3.1
7,536.5 � 7,536.5 5.8
1,148.5 � 1,148.5 0.9
2,510.0 � 2,510.0 1.9
908.0 � 908.0 0.7
1,006.5 � 1,006.5 0.8
930.6 � 930.6 0.7
845.4 � 845.4 0.6
59,352.8 � 59,352.8 45.5
374.8 � 374.8 0.3
3,919.6 4,033.9 7,953.5 6.1
112,200.3 7,394.3 119,594.6 91.610,905.4 8.4
130,500.0 100.0
208855 001-164 int 4C_OK-Proofs.pdf_PG 51_Mars 21, 2021_18:27:43

2021-2031 QIP SUMMARY TABLES B
B.6 2021-2031 QuébecInfrastructure Plan
1.2 Investments by mission, sector and by year
2021-2031 QIP investmentsBy Mission, Sector and by Year(contribution of the Gouvernement du Québec, in millions of dollars)
Mission and sector 2021-2022 2022-2023 2023-2024 2024-2025 2025-2026 Subtotal2021-2026
Health and social services
Health and social services 2,349.1 2,624.9 2,754.6 2,750.2 2,209.1 12,687.9
Education and Culture
Education 2,493.0 3,078.2 3,200.8 3,073.6 2,411.3 14,256.9
Higher education 820.3 858.1 728.2 666.5 658.1 3,731.2
Culture 183.6 305.3 347.1 206.3 199.0 1,241.4
Development of sport 92.1 102.3 92.5 77.0 66.8 430.8
Subtotal 3,589.1 4,343.9 4,368.6 4,023.5 3,335.3 19,660.3
Economy and Environment
Road network 2,900.0 2,900.0 3,206.8 3,166.3 2,918.4 15,091.6
Public transit 895.2 1,663.1 2,266.8 2,069.4 1,420.5 8,315.1
Marine, air, rail and othertransportation
456.7 730.5 686.4 598.6 323.6 2,795.8
Municipalities 666.6 745.2 789.3 794.5 780.7 3,776.3
Tourism and recreationalactivities
324.3 285.1 228.6 116.4 46.4 1,000.8
Social and community housing 421.7 460.7 363.4 207.0 215.5 1,668.3
Northern development 159.7 120.5 119.5 111.4 53.7 564.8
Research 162.4 177.3 121.3 81.6 80.9 623.5
Environment 92.3 100.6 101.9 63.3 114.7 472.8
Agriculture, forests, fauna andother
170.0 146.5 93.8 92.3 71.0 573.7
Subtotal 6,249.0 7,329.5 7,977.9 7,300.8 6,025.4 34,882.6
Support for Individuals andFamilies
Educational childcare services 50.4 79.3 35.9 9.1 9.0 183.7
Administration and Justice
Government administration 413.8 642.0 536.7 462.9 377.9 2,433.4
Information resources 847.8 981.5 824.3 792.6 661.9 4,108.1
Subtotal 1,261.6 1,623.5 1,361.1 1,255.5 1,039.8 6,541.5
Subtotal � Sector Envelopes 13,499.1 16,001.0 16,498.1 15,339.2 12,618.6 73,956.0
Central envelope1 10.0 � � 163.5 2,881.2 3,054.7
Total 13,509.1 16,001.0 16,498.1 15,502.7 15,499.8 77,010.8
Note: Figures are rounded and the sum of the amounts may not correspond to the total indicated.1 Refer to heading 1.4 of section A.
208855 001-164 int 4C_OK-Proofs.pdf_PG 52_Mars 21, 2021_18:27:43

208855 001-164 int 4C_OK-Proofs.pdf_PG 53_Mars 21, 2021_18:27:43

2021-2031 QIP SUMMARY TABLES B
B.8 2021-2031 QuébecInfrastructure Plan
1.3 Investments by investment type and by year
2021-2031 QIP investmentsBy Type and by Year(contribution of the Gouvernement du Québec, in millions of dollars)
2021-2031 QIP
Investment type 2021-2022 2022-2023 2023-2024 2024-2025 2025-2026 Subtotal2021-2026
Infrastructure maintenance
Asset maintenance1 3,890.1 4,274.0 3,997.8 3,852.7 3,395.8 19,410.5
AMD management 2,430.8 2,570.2 2,777.1 2,546.1 2,394.8 12,719.0
Replacement 1,119.0 1,380.3 1,689.3 1,404.0 1,204.3 6,796.9
Studies 23.7 29.9 14.0 1.4 � 69.0
Subtotal 7,463.6 8,254.4 8,478.2 7,804.2 6,995.0 38,995.4
Bonification du parc
Addition and improvement 5,915.0 7,555.5 7,875.1 7,426.2 5,573.7 34,345.6
Studies 120.5 191.1 144.7 108.8 50.0 615.0
Subtotal 6,035.5 7,746.6 8,019.8 7,535.0 5,623.7 34,960.6
Central envelope2 10.0 � � 163.5 2,881.2 3,054.7
Total 13,509.1 16,001.0 16,498.1 15,502.7 15,499.8 77,010.8
Note: Figures are rounded and the sum of the amounts may not correspond to the total indicated.1 These funds, along with those allocated for replacement, may contribute to eliminating the AMD.2 Refer to heading 1.4 of section A.
208855 001-164 int 4C_OK-Proofs.pdf_PG 54_Mars 21, 2021_18:27:43

Sect
ion
2021-2031 QIP SUMMARY TABLES B
Planned Investments B.9by Sector
2021-2031 QIP 2020-2030 QIP
2026-2027 2027-2028 2028-2029 2029-2030 2030-2031 Subtotal2026-2031 Total Total
4,072.2 3,980.2 4,104.0 4,362.9 4,496.2 21,015.6 40,426.0 38,551.3
2,021.5 2,245.9 1,973.4 1,454.3 1,268.8 8,963.8 21,682.9 21,906.3
995.1 878.8 921.1 872.9 882.0 4,549.8 11,346.8 11,948.9
� � � � � � 69.0 65.9
7,088.9 7,104.8 6,998.5 6,690.1 6,647.0 34,529.2 73,524.6 72,472.3
3,998.1 2,970.6 2,418.7 2,201.3 2,167.2 13,755.9 48,101.5 46,244.7
37.6 36.6 30.8 12.0 29.3 146.2 761.3 877.6
4,035.7 3,007.2 2,449.5 2,213.3 2,196.5 13,902.2 48,862.8 47,122.3
2,361.1 1,891.7 1,554.7 1,850.2 1,900.2 9,557.9 12,612.6 10,905.4
13,485.7 12,003.6 11,002.7 10,753.6 10,743.7 57,989.2 135,000.0 130,500.0
208855 001-164 int 4C_OK-Proofs.pdf_PG 55_Mars 21, 2021_18:27:43

2021-2031 QIP SUMMARY TABLES B
B.10 2021-2031 QuébecInfrastructure Plan
1.4 Investments by mission, sector and by investment type
2021-2031 QIP investmentsBy Mission, Sector and by Type(contribution of the Gouvernement du Québec, in millions of dollars)
2021-2031 QIP
Infrastructure maintenance
Mission and sector Assetmaintenance1
Managementof the AMD Replacement Studies Subtotal
Health and social services
Health and social services 3,629.6 1,200.2 4,378.8 35.1 9,243.7
Education and Culture
Education 6,616.0 5,204.3 1,152.2 0.7 12,973.2
Higher education 3,339.8 1,312.9 1,223.5 � 5,876.3
Culture 953.0 74.6 275.9 0.1 1,303.6
Development of sport 38.8 � � � 38.8
Subtotal 10,947.6 6,591.9 2,651.7 0.7 20,191.8
Economy and Environment
Road network 10,482.7 13,028.6 � 7.3 23,518.5
Public transit 2,074.5 � 894.9 � 2,969.5
Marine, air, rail and other transportation 1,514.3 74.9 145.5 5.4 1,740.2
Municipalities 5,147.1 � 1,610.6 � 6,757.8
Tourism and recreational activities 517.2 266.2 6.7 � 790.1
Social and community housing 1,209.7 210.8 3.1 � 1,423.6
Northern development 291.2 � � � 291.2
Research - � � � �
Environment 603.9 53.3 90.1 � 747.3
Agriculture, forests, fauna and other 231.6 � � � 231.6
Subtotal 22,072.4 13,633.8 2,751.0 12.7 38,469.9
Support for Individuals and Families
Educational childcare services 91.8 � � � 91.8
Administration and Justice
Government administration 1,440.1 257.0 421.7 20.6 2,139.4
Information resources 2,244.6 � 1,143.5 � 3,388.1
Subtotal 3,684.7 257.0 1,565.2 20.6 5,527.5
Subtotal � Sector Envelopes 40,426.0 21,682.9 11,346.8 69.0 73,524.6
Central envelope2 3,729.2 � � 5.0 3,734.2
Total 44,155.3 21,682.9 11,346.8 74.0 77,258.9
Note: Figures are rounded and the sum of the amounts may not correspond to the total indicated.1 These funds, along with those allocated for replacement, may contribute to eliminating the AMD.2 Refer to heading 1.4 of section A.
208855 001-164 int 4C_OK-Proofs.pdf_PG 56_Mars 21, 2021_18:27:43

Sect
ion
2021-2031 QIP SUMMARY TABLES B
Planned Investments B.11by Sector
2021-2031 QIP 2020-2030 QIP
Portfolio enhancementTotal Maintenance
of the portfolioEnhancement
of the portfolio TotalAddition andimprovement Studies Subtotal
11,250.8 56.7 11,307.5 20,551.2 9,415.9 11,046.6 20,462.6
7,924.3 13.0 7,937.3 20,910.5 13,585.0 5,565.2 19,150.3
592.5 17.0 609.5 6,485.8 5,787.1 536.3 6,323.4
716.1 � 716.1 2,019.7 1,219.6 743.9 1,963.5
692.5 � 692.5 731.3 71.4 581.9 653.3
9,925.4 30.0 9,955.5 30,147.3 20,663.2 7,427.4 28,090.6
4,535.6 276.7 4,812.3 28,330.8 22,275.1 4,557.0 26,832.1
9,479.1 381.7 9,860.8 12,830.3 3,215.1 10,366.1 13,581.2
1,831.3 0.2 1,831.5 3,571.7 2,205.2 1,848.7 4,053.9
811.7 � 811.7 7,569.5 6,860.5 675.9 7,536.5
419.3 4.3 423.5 1,213.6 676.8 471.7 1,148.5
1,220.6 � 1,220.6 2,644.2 1,378.8 1,131.2 2,510.0
608.2 � 608.2 899.4 306.0 602.1 908.0
984.0 � 984.0 984.0 � 1,006.5 1,006.5
210.1 � 210.1 957.4 698.1 232.5 930.6
691.9 � 691.9 923.5 210.6 634.9 845.4
20,791.7 662.8 21,454.6 59,924.4 37,826.1 21,526.7 59,352.8
263.2 � 263.2 355.0 91.5 283.3 374.8
2,046.7 11.7 2,058.4 4,197.9 1,907.1 2,012.5 3,919.6
3,823.6 � 3,823.6 7,211.7 2,568.5 4,825.8 7,394.3
5,870.3 11.7 5,882.0 11,409.6 4,475.6 6,838.3 11,313.9
48,101.5 761.3 48,862.8 122,387.4 72,472.3 47,122.3 119,594.6
8,873.4 5.0 8,878.4 12,612.6 2,815.1 8,090.3 10,905.4
56,974.9 766.3 57,741.1 135,000.0 75,287.4 55,212.6 130,500.0
208855 001-164 int 4C_OK-Proofs.pdf_PG 57_Mars 21, 2021_18:27:43
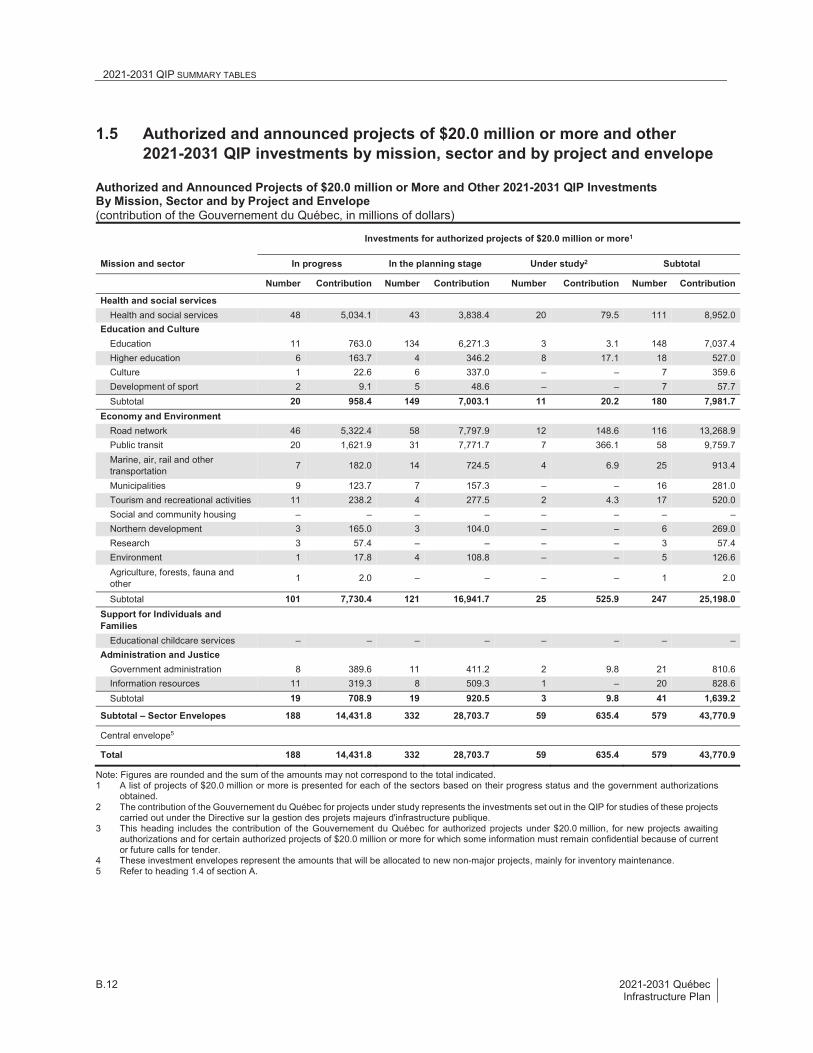
2021-2031 QIP SUMMARY TABLES B
B.12 2021-2031 QuébecInfrastructure Plan
1.5 Authorized and announced projects of $20.0 million or more and other2021-2031 QIP investments by mission, sector and by project and envelope
Authorized and Announced Projects of $20.0 million or More and Other 2021-2031 QIP InvestmentsBy Mission, Sector and by Project and Envelope(contribution of the Gouvernement du Québec, in millions of dollars)
Investments for authorized projects of $20.0 million or more1
Mission and sector In progress In the planning stage Under study2 Subtotal
Number Contribution Number Contribution Number Contribution Number Contribution
Health and social servicesHealth and social services 48 5,034.1 43 3,838.4 20 79.5 111 8,952.0
Education and CultureEducation 11 763.0 134 6,271.3 3 3.1 148 7,037.4
Higher education 6 163.7 4 346.2 8 17.1 18 527.0
Culture 1 22.6 6 337.0 � � 7 359.6
Development of sport 2 9.1 5 48.6 � � 7 57.7
Subtotal 20 958.4 149 7,003.1 11 20.2 180 7,981.7Economy and Environment
Road network 46 5,322.4 58 7,797.9 12 148.6 116 13,268.9
Public transit 20 1,621.9 31 7,771.7 7 366.1 58 9,759.7
Marine, air, rail and othertransportation
7 182.0 14 724.5 4 6.9 25 913.4
Municipalities 9 123.7 7 157.3 � � 16 281.0
Tourism and recreational activities 11 238.2 4 277.5 2 4.3 17 520.0
Social and community housing � � � � � � � �
Northern development 3 165.0 3 104.0 � � 6 269.0
Research 3 57.4 � � � � 3 57.4
Environment 1 17.8 4 108.8 � � 5 126.6
Agriculture, forests, fauna andother
1 2.0 � � � � 1 2.0
Subtotal 101 7,730.4 121 16,941.7 25 525.9 247 25,198.0Support for Individuals andFamilies
Educational childcare services � � � � � � � �
Administration and JusticeGovernment administration 8 389.6 11 411.2 2 9.8 21 810.6
Information resources 11 319.3 8 509.3 1 � 20 828.6
Subtotal 19 708.9 19 920.5 3 9.8 41 1,639.2
Subtotal � Sector Envelopes 188 14,431.8 332 28,703.7 59 635.4 579 43,770.9
Central envelope5
Total 188 14,431.8 332 28,703.7 59 635.4 579 43,770.9
Note: Figures are rounded and the sum of the amounts may not correspond to the total indicated.1 A list of projects of $20.0 million or more is presented for each of the sectors based on their progress status and the government authorizations
obtained.2 The contribution of the Gouvernement du Québec for projects under study represents the investments set out in the QIP for studies of these projects
carried out under the Directive sur la gestion des projets majeurs d'infrastructure publique.3 This heading includes the contribution of the Gouvernement du Québec for authorized projects under $20.0 million, for new projects awaiting
authorizations and for certain authorized projects of $20.0 million or more for which some information must remain confidential because of currentor future calls for tender.
4 These investment envelopes represent the amounts that will be allocated to new non-major projects, mainly for inventory maintenance.5 Refer to heading 1.4 of section A.
208855 001-164 int 4C_OK-Proofs.pdf_PG 58_Mars 21, 2021_18:27:43

Sect
ion
2021-2031 QIP SUMMARY TABLES B
Planned Investments B.13by Sector
Other investments
TotalOther projects3
Envelopes forinventory
maintenance4
Envelopes forinventory
enhancement4Subtotal
620.4 8,544.9 2,433.9 11,599.2 20,551.2
1,032.3 11,901.6 939.2 13,873.1 20,910.5
58.0 5,504.8 396.0 5,958.8 6,485.8
120.9 1,280.0 259.2 1,660.1 2,019.7
16.5 36.7 620.4 673.6 731.3
1,227.6 18,723.2 2,214.8 22,165.6 30,147.3
1,240.0 13,032.6 789.3 15,061.9 28,330.8
1,012.6 669.7 1,388.2 3,070.6 12,830.3
512.0 1,076.2 1,070.0 2,658.3 3,571.7
45.5 6,631.7 611.3 7,288.5 7,569.5
102.6 377.4 213.6 693.6 1,213.6
3.1 1,420.5 1,220.6 2,644.2 2,644.2
303.0 30.4 297.1 630.4 899.4
185.1 � 741.5 926.6 984.0
77.1 690.2 63.4 830.8 957.4
61.9 218.1 641.5 921.5 923.5
3,542.9 24,147.0 7,036.5 34,726.4 59,924.4
8.4 91.8 254.8 355.0 355.0
413.1 1,543.2 1,431.0 3,387.3 4,197.9
42.4 3,231.4 3,109.2 6,383.1 7,211.7
455.6 4,774.6 4,540.2 9,770.4 11,409.6
5,854.8 56,281.4 16,480.3 78,615.5 122,387.4
12,240.7 371.9 � 12,612.6 12,612.6
18,095.5 56,653.3 16,480.3 91,229.1 135,000.0
208855 001-164 int 4C_OK-Proofs.pdf_PG 59_Mars 21, 2021_18:27:44

2021-2031 QIP SUMMARY TABLES B
B.14 2021-2031 QuébecInfrastructure Plan
1.6 Investments by mission, sector and by administrative region
2021-2031 QIP investmentsBy Mission, Sector and by Administrative Region
Mission and sector
Region101 02 03 04 05 06 07 08
Health and social servicesHealth and social services 466.0 673.2 3,531.8 693.0 1,022.3 5,039.9 578.7 471.9
Education and CultureEducation 444.0 530.4 1,405.8 477.9 572.0 5,470.0 738.4 321.7
Higher education 119.5 162.9 833.2 198.8 413.6 3,096.4 173.8 88.1
Culture 60.6 63.3 237.7 66.9 63.7 828.4 58.5 28.6
Development of sport 16.6 29.0 59.4 21.6 30.2 191.7 30.4 12.4
Economy and EnvironmentRoad network 1,022.6 852.4 2,764.6 888.0 477.3 9,067.0 683.0 483.8
Public transit � 60.6 2,271.8 39.3 99.8 8,648.1 475.0 0.3
Marine, air, rail and other transportation 86.9 96.7 908.4 82.7 135.4 534.4 111.5 25.6
Municipalities 176.2 213.9 639.7 172.6 260.5 1,814.0 274.5 144.4
Tourism and recreational activities 20.7 45.2 250.4 8.9 35.1 582.6 36.8 14.5
Social and community housing 87.9 97.4 255.9 68.9 71.7 853.9 99.0 41.3
Northern development � � 9.9 � � 8.9 � �
Research 17.7 28.0 84.4 23.6 94.1 268.0 34.4 13.2
Environment 43.5 60.1 448.4 30.1 22.7 63.7 8.3 41.2
Agriculture, forests, fauna and other 99.8 55.1 248.6 35.1 17.2 51.1 30.4 26.6
Support for Individuals and FamiliesEducational childcare services 8.4 11.6 30.6 11.3 14.8 84.9 16.2 7.5
Administration and JusticeGovernment administration 54.5 107.9 1,276.9 89.0 99.0 1,087.3 89.1 115.2
Information resources 157.4 225.1 804.8 217.3 271.9 1,841.2 318.8 115.5
Subtotal 2,882.3 3,312.9 16,062.3 3,124.9 3,701.2 39,531.5 3,756.9 1,951.8
As a percentage 2.4 2.7 13.1 2.6 3.0 32.3 3.1 1.6
Central envelope (not broken down)2 � � � � � � � �
Total 2,882.3 3,312.9 16,062.3 3,124.9 3,701.2 39,531.5 3,756.9 1,951.8
Note: Figures are rounded and the sum of the amounts may not correspond to the total indicated.1 The sectoral investment envelopes that do not include a specific project were distributed among the various regions, based on the proportion of
the each region's population divided by that of Québec as a whole.2 Refer to heading 1.4 of section A.
Legend:
01: Bas-Saint-Laurent
02: Saguenay�Lac-Saint-Jean
03: Capitale-Nationale
04: Mauricie
05: Estrie
06: Montréal
07: Outaouais
08: Abitibi-Témiscamingue
09: Côte-Nord
10: Nord-du-Québec
11: Gaspésie�Îles-de-la-Madeleine
12: Chaudière-Appalaches
13: Laval
14: Lanaudière
15: Laurentides
16: Montérégie
17: Centre-du-Québec
Mission and sector
Region1
(contribution of the Gouvernement du Québec, in millions of dollars and as a percentage)
208855 001-164 int 4C_OK-Proofs.pdf_PG 60_Mars 21, 2021_18:27:44

Sect
ion
2021-2031 QIP SUMMARY TABLES B
Planned Investments B.15by Sector
09 10 11 12 13 14 15 16 17 OutsideQuébec Total
351.2 673.5 354.0 608.5 398.6 984.6 989.7 3,463.1 251.2 20,551.2
209.7 426.1 193.0 871.6 1,257.2 1,159.7 1,792.2 4,432.3 608.6 20,910.5 40.2 14.5 31.6 146.7 162.5 172.7 209.2 529.5 92.6 6,485.822.8 7.8 31.4 52.1 94.6 73.1 63.7 212.2 54.4 2,019.7 8.1 4.3 15.8 38.8 33.8 38.7 53.8 125.5 21.1 731.3
1,073.6 120.0 596.3 1,271.5 1,193.4 966.4 1,331.8 4,558.5 980.7 28,330.8 0.3 0.3 � 162.8 373.8 57.0 48.7 592.0 0.5 12,830.3
164.7 195.0 319.5 196.0 54.5 107.8 74.8 360.1 117.7 3,571.7 85.8 166.7 79.5 584.3 415.9 369.2 496.4 1,494.9 181.0 7,569.5
6.9 1.3 7.5 12.0 10.0 34.5 54.2 62.8 30.2 1,213.6 36.6 348.3 51.8 93.3 60.9 65.6 87.1 261.9 62.6 2,644.2390.2 490.4 � � � � � � � 899.4 25.2 3.7 34.9 44.9 37.4 51.3 64.3 134.8 24.1 984.015.3 3.7 13.6 66.8 39.4 13.6 28.7 53.4 5.0 957.440.7 59.9 22.7 14.5 13.3 20.0 29.8 144.6 14.0 923.5
4.1 3.2 4.0 17.6 17.8 22.2 25.6 64.6 10.5 355.0
43.9 118.9 86.1 123.4 124.5 87.0 125.5 457.1 57.8 54.7 4,197.977.5 35.6 74.6 346.1 352.5 413.8 495.4 1,263.9 196.9 3.4 7,211.7
2,596.6 2,672.9 1,916.5 4,651.0 4,640.3 4,637.1 5,970.9 18,211.2 2,709.1 58.1 122,387.4
2.1 2.2 1.6 3.8 3.8 3.8 4.9 14.9 2.2 � 100.0
� � � � � � � � � � 12,612.6
2,596.6 2,672.9 1,916.5 4,651.0 4,640.3 4,637.1 5,970.9 18,211.2 2,709.1 58.1 135,000.0
208855 001-164 int 4C_OK-Proofs.pdf_PG 61_Mars 21, 2021_18:27:44

PLANNED INVESTMENTS BY SECTOR B
B.16 2021-2031 QuébecInfrastructure Plan
2. Planned investments by sector
The investments set out in the 2021-2031 QIP are divided into 18 major sectors of government activity.
Activity sectors under the 2021-2031 QIP
Health and social services
1. Health and social services: institutions in the health and social services network
Education and Culture
2. Education : school service centre establishments1
3. Higher education: CEGEP and university institutions
4. Culture: museums, libraries, performance halls, cultural complexes
5. Development of sport: sports complexes and equipment
Economy and Environment
6. Road network: highways, roads, tunnels, bridges, interchanges and overpasses
7. Public transit: metro, buses, commuter trains, tramways, platforms, stations, garages, maintenancecentres, reserved lanes, tunnels, railway tracks
8. Marine, air, rail and other transportation: ferries, wharves, stations, airports, railways, local roads,rest stops, the Government's vehicle fleet
9. Municipalities: drinking water and wastewater treatment plants, aqueduct and sewer pipes, parksand municipal infrastructure, adapting to climate change program
10. Tourism and recreational activities: tourism facilities and complexes, conferences centres, nationalpark facilities
11. Social and community housing
12. Northern development: infrastructure funded by the Société du Plan Nord
13. Research: laboratories, research equipment and centres
14. Environment: biomethanization and composting plants, public and municipal dams, infrastructure formitigating the risks of coastal erosion and submergence and for adapting to climate change
15. Agriculture, forests, fauna and other: agricultural training and research facilities, multi-resource roadson public land, digital infrastructure across Québec
1 11 school boards are being added at more than 61 school service centres.
208855 001-164 int 4C_OK-Proofs.pdf_PG 62_Mars 21, 2021_18:27:44

Sect
ion
PLANNED INVESTMENTS BY SECTOR B
Planned Investments B.17by Sector
Support for Individuals and Families
16. Educational childcare services: childcare centre infrastructure
Administration and Justice
17. Government administration: office buildings, courthouses, detention facilities, Sûreté du Québecpolice stations, acquisitions of movable and immovable property by government departments andbodies
18. Information resources: information resource development and equipment in the various departmentsand bodies as well as the health and social services, education and higher education networks
The following pages present, for each of the 18 sectors, a summary table of investments and the list ofauthorized and announced projects with an estimated cost of $20.0 million or more for which investmentsare set out in the 2021-2031 QIP. The first seven notes at the bottom of each table presented in the projectlists are the same for all the sectors. Accordingly, some notes may not apply to a particular sector.Subsequent notes are specific to each sector, however.
Moreover, a portrait of the infrastructure portfolio and investment strategies for the sectors associated withpublic bodies is also presented.
A description of projects with an estimated cost of $50 million or more is also available in the onlineTableau de bord des projets d'infrastructures.2
More information regarding the information resource projects, the Government's online Tableau debord des projets en ressources informationnelles can be accessed online.3
The legend for Québec's 17 administrative regions is as follows:
01: Bas-Saint-Laurent
02: Saguenay�Lac-Saint-Jean
03: Capitale-Nationale
04: Mauricie
05: Estrie
06: Montréal
07: Outaouais
08: Abitibi-Témiscamingue
09: Côte-Nord
10: Nord-du-Québec
11: Gaspésie�Îles-de-la-Madeleine
12: Chaudière-Appalaches
13: Laval
14: Lanaudière
15: Laurentides
16: Montérégie
17: Centre-du-Québec
2 Website:https://www.tresor.gouv.qc.ca/infrastructures-publiques/tableau-de-bord/3 Website: https://www.tableaudebordprojetsri.gouv.qc.ca/tableau-de-bord/
208855 001-164 int 4C_OK-Proofs.pdf_PG 63_Mars 21, 2021_18:27:44
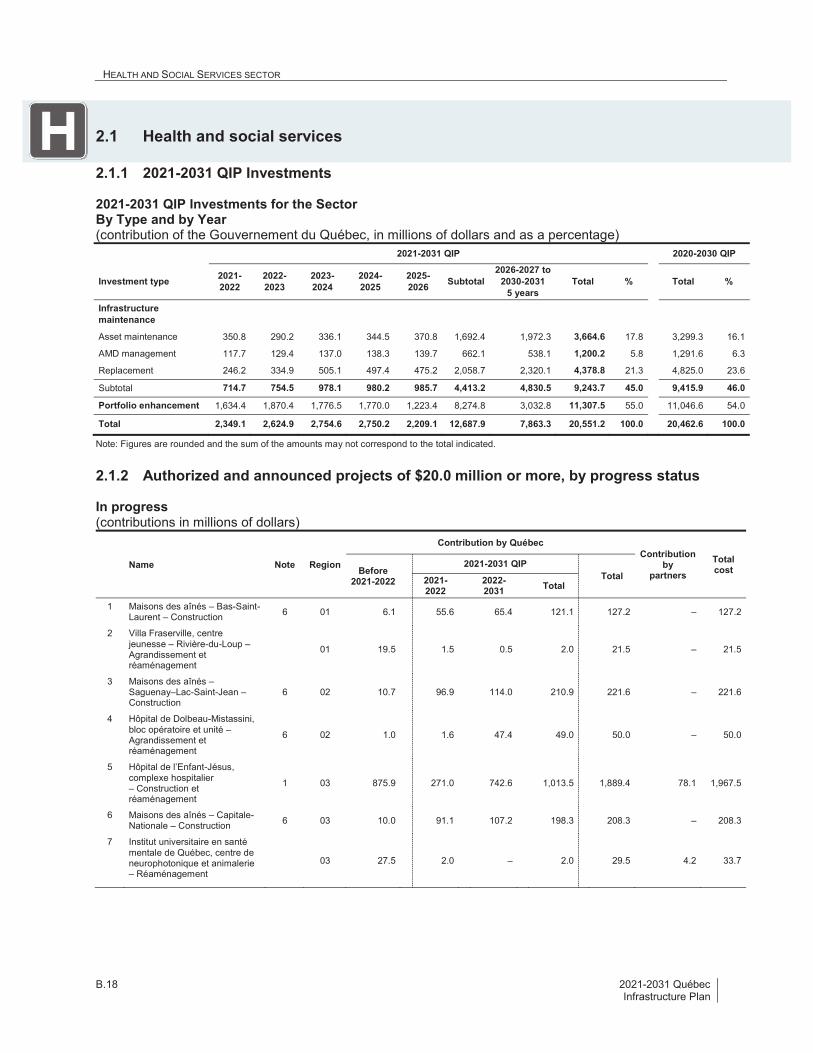
HEALTH AND SOCIAL SERVICES SECTOR B
B.18 2021-2031 QuébecInfrastructure Plan
2.1 Health and social services
2.1.1 2021-2031 QIP Investments
2021-2031 QIP Investments for the SectorBy Type and by Year(contribution of the Gouvernement du Québec, in millions of dollars and as a percentage)
2021-2031 QIP 2020-2030 QIP
Investment type 2021-2022
2022-2023
2023-2024
2024-2025
2025-2026 Subtotal
2026-2027 to2030-2031
5 yearsTotal % Total %
Infrastructuremaintenance
Asset maintenance 350.8 290.2 336.1 344.5 370.8 1,692.4 1,972.3 3,664.6 17.8 3,299.3 16.1
AMD management 117.7 129.4 137.0 138.3 139.7 662.1 538.1 1,200.2 5.8 1,291.6 6.3
Replacement 246.2 334.9 505.1 497.4 475.2 2,058.7 2,320.1 4,378.8 21.3 4,825.0 23.6
Subtotal 714.7 754.5 978.1 980.2 985.7 4,413.2 4,830.5 9,243.7 45.0 9,415.9 46.0
Portfolio enhancement 1,634.4 1,870.4 1,776.5 1,770.0 1,223.4 8,274.8 3,032.8 11,307.5 55.0 11,046.6 54.0
Total 2,349.1 2,624.9 2,754.6 2,750.2 2,209.1 12,687.9 7,863.3 20,551.2 100.0 20,462.6 100.0
Note: Figures are rounded and the sum of the amounts may not correspond to the total indicated.
2.1.2 Authorized and announced projects of $20.0 million or more, by progress status
In progress(contributions in millions of dollars)
Name Note Region
Contribution by QuébecContribution
bypartners
TotalcostBefore
2021-2022
2021-2031 QIPTotal2021-
20222022-2031 Total
1 Maisons des aînés � Bas-Saint-Laurent � Construction 6 01 6.1 55.6 65.4 121.1 127.2 � 127.2
2 Villa Fraserville, centrejeunesse � Rivière-du-Loup �Agrandissement etréaménagement
01 19.5 1.5 0.5 2.0 21.5 � 21.5
3 Maisons des aînés �Saguenay�Lac-Saint-Jean �Construction
6 02 10.7 96.9 114.0 210.9 221.6 � 221.6
4 Hôpital de Dolbeau-Mistassini,bloc opératoire et unité �Agrandissement etréaménagement
6 02 1.0 1.6 47.4 49.0 50.0 � 50.0
5 Hôpital de l�Enfant-Jésus,complexe hospitalier� Construction etréaménagement
1 03 875.9 271.0 742.6 1,013.5 1,889.4 78.1 1,967.5
6 Maisons des aînés � Capitale-Nationale � Construction 6 03 10.0 91.1 107.2 198.3 208.3 � 208.3
7 Institut universitaire en santémentale de Québec, centre deneurophotonique et animalerie� Réaménagement
03 27.5 2.0 � 2.0 29.5 4.2 33.7
208855 001-164 int 4C_OK-Proofs.pdf_PG 64_Mars 21, 2021_18:27:44

Sect
ion
HEALTH AND SOCIAL SERVICES SECTOR B
Planned Investments B.19by Sector
Name Note Region
Contribution by QuébecContribution
bypartners
TotalcostBefore
2021-2022
2021-2031 QIPTotal2021-
20222022-2031 Total
8 Institut universitaire decardiologie et de pneumologiede Québec � Unité deretraitement des dispositifsmédicaux � Agrandissement etréaménagement
6 03 1.9 9.0 10.2 19.2 21.1 3.0 24.1
9 Institut universitaire decardiologie et de pneumologiede Québec, bloc opératoire �Agrandissement etréaménagement
03 2.2 8.5 9.8 18.3 20.4 � 20.4
10 Maisons des aînés � Mauricieet Centre-du-Québec �Construction
6 04-17 7.9 71.7 84.3 156.0 163.9 � 163.9
11 Hôpital Fleurimont, centremère-enfant et serviced�urgence � Sherbrooke� Construction
05 33.3 25.0 274.0 299.0 332.3 12.0 344.3
12 Maisons des aînés � Estrie �Construction
6 05 8.9 80.8 95.0 175.8 184.7 � 184.7
13 Centre d�hébergement et desoins de longue durée � Lac-Mégantic � Construction
6 05 � 7.5 77.5 85.0 85.0 � 85.0
14 Centre hospitalier universitaireSainte-Justine, unitésspécialisées et recherche �Montréal � Agrandissement etréaménagement
1 06 767.6 35.0 59.4 94.4 862.0 77.7 939.6
15 Hôpital de Verdun, unités desoins et soins ambulatoires� Montréal � Agrandissement etréaménagement
2 06 22.1 29.3 213.5 242.8 264.9 � 264.9
16 Institut de cardiologie deMontréal, urgence, soinsambulatoires et centre deformation � Agrandissement etréaménagement
06 108.6 47.6 72.1 119.7 228.3 29.6 257.9
17 Hôpital du Sacré-C�ur deMontréal, traumatologie et unitémère-enfant � Agrandissementet réaménagement
1 06 105.6 25.0 12.1 37.1 142.7 12.4 155.1
18 Hôpital Santa Cabrini, blocopératoire � Montréal �Agrandissement etréaménagement
7 06 0.9 1.8 83.6 85.4 86.3 10.0 96.3
19 Maisons des aînés � Montréal �Construction 6 06 4.6 42.0 49.4 91.5 96.1 � 96.1
20 Hôpital de Lachine � Montréal �Agrandissement etréaménagement
06 2.0 1.0 92.0 93.0 95.0 � 95.0
21 Centre d�hébergement Henri-Bradet � Montréal �Agrandissement etréaménagement
6 06 0.1 1.4 83.6 85.0 85.0 � 85.0
22 Hôpital Maisonneuve-Rosemont, hémodialyse �Montréal � Construction
1 06 51.5 2.0 � 2.0 53.5 � 53.5
23 Centre de réadaptation pour lesjeunes en difficulté d�adaptationDominique-Savio � Montréal �Agrandissement etréaménagement
6 06 4.6 8.0 37.4 45.4 50.0 � 50.0
208855 001-164 int 4C_OK-Proofs.pdf_PG 65_Mars 21, 2021_18:27:44

HEALTH AND SOCIAL SERVICES SECTOR B
B.20 2021-2031 QuébecInfrastructure Plan
Name Note Region
Contribution by QuébecContribution
bypartners
TotalcostBefore
2021-2022
2021-2031 QIPTotal2021-
20222022-2031 Total
24 Hôpital Notre-Dame, unitéfamille-naissance � Montréal �Construction
6 06 3.0 8.0 12.0 20.0 23.0 � 23.0
25 Maisons des aînés � Outaouais� Construction
6 07 4.7 42.9 50.4 93.3 98.0 � 98.0
26 Centre d�hébergement et desoins de longue durée �Maniwaki � Construction
2 07 1.0 2.4 66.6 69.0 70.0 � 70.0
27 Université McGill, faculté etunité de médecine familiale �Gatineau � Agrandissement
1 07 22.4 9.0 1.0 10.0 32.4 � 32.4
28 Maisons des aînés � Abitibi-Témiscamingue � Construction 6 08 4.0 36.5 43.0 79.5 83.5 � 83.5
29 Centre d�hébergement et desoins de longue durée �Macamic � Agrandissement etréaménagement
08 6.5 15.5 43.1 58.5 65.0 � 65.0
30 Pavillon Sainte-Famille � Ville-Marie � Agrandissement etréaménagement
08 47.4 5.0 4.0 9.0 56.4 � 56.4
31 Hôpital de Rouyn-Noranda,radiothérapie � Agrandissement
1 08 18.9 15.0 16.0 31.0 49.9 � 49.9
32 Maison des aînés � Palmarolle� Construction
6 08 � 0.1 19.9 20.0 20.0 � 20.0
33 Maisons des aînés � Côte�Nord � Construction
6 09 4.7 43.1 50.7 93.8 98.5 � 98.5
34 Centre d�hébergement duRocher-Percé � Chandler �Agrandissement etréaménagement
2 11 0.1 0.5 59.4 59.9 60.0 � 60.0
35 Maison des aînés � Gaspésie �Construction
6 11 2.1 19.4 22.8 42.2 44.3 � 44.3
36 Hôpital de Gaspé, urgence etsoins intensifs �Agrandissement
11 14.7 10.0 7.0 17.0 31.7 � 31.7
37 Maisons des aînés � Îles-de-la-Madeleine � Construction
6 11 0.7 6.7 7.9 14.7 15.4 � 15.4
38 Maisons des aînés �Chaudière-Appalaches �Construction
6 12 7.4 67.5 79.4 146.9 154.3 � 154.3
39 Maisons des aînés � Laval �Construction
6 13 5.7 51.5 60.5 112.0 117.7 � 117.7
40 Maisons des aînés �Lanaudière � Construction
6 14 5.8 53.2 62.5 115.7 121.5 � 121.5
41 Buanderie du CISSS deLanaudière � Joliette �Construction
1 14 21.6 2.0 � 2.0 23.6 � 23.6
42 Maisons des aînés �Laurentides � Construction
6 15 10.3 93.8 110.2 204.0 214.3 � 214.3
43 Hôpital régional de Saint-Jérôme, santé mentale �Construction
15 76.0 25.0 9.4 34.4 110.4 � 110.4
44 Maisons des aînés �Montérégie-Centre �Construction
6 16 8.0 72.8 85.6 158.4 166.4 � 166.4
45 Maisons des aînés �Montérégie-Est � Construction
6 16 7.9 71.4 84.0 155.4 163.3 � 163.3
208855 001-164 int 4C_OK-Proofs.pdf_PG 66_Mars 21, 2021_18:27:44

Sect
ion
HEALTH AND SOCIAL SERVICES SECTOR B
Planned Investments B.21by Sector
Name Note Region
Contribution by QuébecContribution
bypartners
TotalcostBefore
2021-2022
2021-2031 QIPTotal2021-
20222022-2031 Total
46 Maisons des aînés �Montérégie-Ouest �Construction
6 16 6.6 59.8 70.3 130.1 136.7 � 136.7
47 Hôpital Honoré-Mercier,urgence � Saint-Hyacinthe �Agrandissement etréaménagement
16 24.1 20.0 25.0 45.0 69.1 � 69.1
48 Laboratoire serveur Optilab �Longueuil � Construction
16 1.6 2.0 63.8 65.9 67.5 � 67.5
Total 2,377.7 1,648.4 3,385.5 5,034.1 7,411.6 227.0 7,638.5
Note: Figures are rounded and the sum of the amounts may not correspond to the total indicated.
208855 001-164 int 4C_OK-Proofs.pdf_PG 67_Mars 21, 2021_18:27:44

HEALTH AND SOCIAL SERVICES SECTOR B
B.22 2021-2031 QuébecInfrastructure Plan
In planning
Name Note Region
1 Hôpital régional de Rimouski, pavillon d�enseignement � Construction 01
2 Hôpital et centre de réadaptation de Jonquière, urgence � Agrandissement et réaménagement 4 02
3 Centre d�hébergement Saint-Augustin � Québec � Reconstruction 3 03
4 Centre d�hébergement et de soins de longue durée � Wendake � Construction 03
5 Hôpital de La Malbaie, urgence et unités de soins � Agrandissement 03
6 Hôpital Saint-François d�Assise, santé mentale phase 1 � Québec � Agrandissement et réaménagement 4 03
7 Laboratoire serveur Optilab, pavillon Sainte-Marie � Trois-Rivières � Réaménagement et agrandissement 4 04
8 Laboratoire serveur Optilab � Sherbrooke � Construction 05
9 Centre d�hébergement de Dorval � Montréal � Reconstruction 4 06
10 Centre d�hébergement de LaSalle � Montréal � Construction 4 06
11 Centre d�hébergement et de soins de longue durée Benjamin-Victor-Rousselot � Montréal � Reconstruction 4 06
12 Centre d�hébergement et de soins de longue durée Denis-Benjamin-Viger � Montréal � Reconstruction 4 06
13 Centre d��hébergement et de soins de longue durée Jeanne-Le Ber 1 � Montréal � Reconstruction 4 06
14 Centre d�hébergement et de soins de longue durée Jeanne-Le Ber 2 � Montréal � Reconstruction 4 06
15 Centre d�hébergement et de soins de longue durée Nicolet � Montréal � Reconstruction 4 06
16 Centre de soins prolongés Grace Dart � Montréal � Construction 4 06
17 Centre d�hébergement Notre-Dame-de-la-Merci � Montréal � Réaménagement 06
18 Centres de la jeunesse et de la famille Batshaw � Westmount � Agrandissement et réaménagement 4 06
19 Hôpital du Sacré-C�ur de Montréal, médecine nucléaire et ajout d�un tomographe par émission de positrons �Agrandissement
06
20 Hôpital Fleury, urgence � Montréal � Agrandissement et réaménagement 3 06
21 Hôpital général juif (phase IV) � Montréal � Réaménagement 3 06
22 Hôpital Notre-Dame, service de psychiatrie � Montréal � Réaménagement 4 06
23 Centre d�hébergement de Vallée-de-la-Lièvre � Gatineau � Agrandissement 07
24 Hôpital de Gatineau, unité de périnatalité � Réaménagement 07
25 Hôpital d�Amos, urgence et soins intensifs � Agrandissement et réaménagement 4 08
26 Centre de santé d�Inuulitsivik et centre de santé Tulattavik, 62 logements � Nunavik � Construction 10
27 Centre Miyupimaatisiiun communautaire � Oujé-Bougoumou � Construction 10
28 Centre Miyupimaatisiiun communautaire � Waskaganish � Construction 10
29 Résidence Plaisance des Îles � Cap-aux-Meules � Construction 11
30 Hôpital de Thetford Mines, urgence � Réaménagement et agrandissement 4 12
31 Hôtel-Dieu de Lévis, pavillon d�enseignement � Construction 12
32 Laboratoire serveur Optilab � Laval � Construction 13
33 Centre d�hébergement et de soins de longue durée � Sainte-Élisabeth � Construction 4 14
34 Centre d�hébergement Saint-Eusèbe � Joliette � Construction 4 14
35 Centre d�hébergement Parphilia-Ferland � Saint-Charles-Borromée � Construction 4 14
36 Hôpital Pierre-Le Gardeur, unité de soins � Repentigny � Agrandissement et réaménagement 14
37 Centre de réadaptation pour jeunes en difficulté d�adaptation � Sainte-Thérèse � Construction 15
38 Centre d�hébergement et de soins de longue durée � Lachute � Construction 15
39 Hôpital de Mont-Laurier, soins de courte durée � Agrandissement et réaménagement 15
40 Maison des aînés � Labelle � Reconstruction 4 15
41 Centre hospitalier de Vaudreuil-Soulanges, complexe hospitalier � Construction 16
42 Hôpital Charles-Le Moyne, bloc opératoire et chirurgie d�un jour � Longueuil � Agrandissement et réaménagement 3 16
43 Hôtel-Dieu d�Arthabaska, urgence et bloc opératoire � Victoriaville � Agrandissement et réaménagement 17
Gouvernement du Québec contribution set out in the 2021-2031 QIP $3,838.4 M
208855 001-164 int 4C_OK-Proofs.pdf_PG 68_Mars 21, 2021_18:27:44

Sect
ion
HEALTH AND SOCIAL SERVICES SECTOR B
Planned Investments B.23by Sector
Under study (projects of $50.0 million or more)
Name Note Region
1 Hôpital régional de Rimouski, bloc opératoire et santé mentale � Maintien et bonification 01
2 Hôpital de Chicoutimi, bloc opératoire � Saguenay � Maintien et bonification 02
3 Hôtel-Dieu de Québec � Maintien et bonification 03
4 Hôpital du Centre-de-la-Mauricie, urgence � Shawinigan � Maintien et bonification 04
5 Centre hospitalier de St. Mary, unités de soins � Montréal � Maintien et bonification 06
6 Hôpital du Sacré-C�ur de Montréal, bloc opératoire et unités de soins (phase III) � Maintien et bonification 06
7 Hôpital général de Montréal, bloc opératoire et urgence � Maintien et bonification 06
8 Hôpital général du Lakeshore, urgence � Pointe-Claire � Maintien et bonification 06
9 Hôpital Maisonneuve-Rosemont � Montréal � Maintien et bonification 06
10 Institut national de psychiatrie légale Philippe-Pinel � Montréal � Maintien et bonification 06
11 Institut universitaire en santé mentale Douglas � Montréal � Maintien 06
12 Centre hospitalier de l�Outaouais, complexe hospitalier � Bonification 07
13 Hôpital de Sept-Îles, urgence et bloc opératoire � Maintien et bonification 09
14 Centre hospitalier régional d�Eeyou Istchee, Chisasibi, centre de santé régional � Bonification 10
15 Hôtel-Dieu de Lévis, blocs endoscopique et opératoire � Maintien et bonification 12
16 Hôpital de la Cité-de-la-Santé � Laval � Maintien et bonification 13
17 Hôpital de Saint-Eustache, urgence et unités de soins � Maintien et bonification 15
18 Hôpital régional de Saint-Jérôme, plateau technique chirurgical � Maintien et bonification 15
19 Hôpital Charles-Le Moyne, santé mentale � Longueuil � Maintien et bonification 16
20 Hôpital Pierre-Boucher, urgence et unités de soins � Longueuil � Maintien et bonification 16
Contribution by the Gouvernement du Québec planned for the 2021-2031 QIP (cost of studies) $79.5 M
Contribution by the Gouvernement du Québec planned for the 2021-2031 QIP for other projects and envelopes $11,599.2 M
Total for the sector $20,551.2 M
1 The infrastructure concerned with this project is partially or fully in service.2 Since publication of the 2020-2030 QIP, these projects have changed progress status in the list of published projects, moving from "in planning" to
"in progress".3 Since publication of the 2020-2030 QIP, these projects have changed progress status in the list of published projects, moving from "under study"
to "in planning".4 Since publication of the 2020-2030 QIP, these projects have been added to "in planning".5 Since publication of the 2020-2030 QIP, these projects have been added to "under study".6 Since publication of the 2020-2030 QIP, these projects have been added to "in progress".7 Since publication of the 2020-2030 QIP, these projects have changed progress status in the list of published projects, moving from "under study"
to "in progress".
Furthermore, in addition to these studies, during the next year the Ministère de la Santé et des Servicessociaux will submit an application to the Government to study three new projects.
208855 001-164 int 4C_OK-Proofs.pdf_PG 69_Mars 21, 2021_18:27:44

HEALTH AND SOCIAL SERVICES SECTOR B
B.24 2021-2031 QuébecInfrastructure Plan
Projects removed from the list of published projects in the 2021-2031 QIP
Name Note Region
1 Buanderie Partagec � Québec � Construction 1 03
2 Institut universitaire de cardiologie et de pneumologie de Québec, électrophysiologie � Agrandissement 1 03
3 Centre d�hébergement et de soins de longue durée East Angus � Construction 1 05
4 Centre hospitalier de l�Université de Montréal, complexe hospitalier � Construction 1 06
5 Centres d�hébergement et de soins de longue durée � Montréal (secteur est de l�île) � Maintien 2 06
6 Centres d�hébergement et de soins de longue durée � Montréal (secteur ouest de l�île) � Maintien 3 06
7 Centres d�hébergement et de soins de longue durée � Lanaudière � Maintien 4 14
8 Maisons des aînés et alternatives � Régions administratives du Québec � Construction 5 All
1 The infrastructure is in service and no investment is planned for the 2021-2031 period.2 This project is deployed in four projects from the "In planning" list (13,14,15,16).3 This project is deployed in four projects from the "In planning" list (9,10,11,12).4 This project is deployed in two projects from the "In planning" list (34 and 35).5 This project is deployed over 18 regional "In planning" Senior home projects" (1,3,6,10,12,19,25,28,33,35,37,38,39,40,42,44,45,46) from the Health
and Social Services sector, which forecast a total of 46 new senior homes.
208855 001-164 int 4C_OK-Proofs.pdf_PG 70_Mars 21, 2021_18:27:44

Sect
ion
HEALTH AND SOCIAL SERVICES SECTOR B
Planned Investments B.25by Sector
Maintenance45 %
Enhancement55 %
2.1.3 Portrait of infrastructure and investmentstrategies � Health and Social services
Portrait of the infrastructure
The HSSN�s portfolio comprises 2,737 buildings and 15,520 specialized medical devices. Across Québec,there are:
� 575 hospitals, including short-term care centres, health care centres and psychiatric centres;
� 462 residential and long-term care centres (CHSLD);
� 176 rehabilitation centres;
� 181 youth centres;
� 190 local community service centres (CLSC);
� 1,103 other buildings (staff and doctors' quarters, research centres, administrative spaces,warehouses, laundries and boiler rooms);
� 50 surplus buildings;
� 15,520 medical devices, including medical imaging, radiation therapy, medical biology, respiratorytherapy and surgical devices.
2021-2031 QIP investments
The 2021-2031 QIP total investments of almost $20.6 billion are allocated as follows:
� $9.3 billion for infrastructure maintenance, including:
$3.7 billion to maintain the existing infrastructure in good condition;
$1.2 billion to address the AMD;
$4.4 billion to replace obsolete infrastructure.
� $11.3 billion for new infrastructure to support development of the care offer.
2021-2031 QIP investmentsBy Type(contribution of the Gouvernement du Québec, in millions of dollars)
Public Private Total %
Infrastructure Maintenance
Asset Maintenance 3,516.1 148.5 3,664.6
AMD 1,200.2 � 1,200.2
Replacement 4,378.8 � 4,378.8
Subtotal 9,095.1 148.5 9,243.7 45
Infrastructure Enhancement 11,307.5 � 11,307.5 55
Total 20,402.7 148.5 20,551.2 100
Note: Figures are rounded and the sum of the amounts may not correspond to the total indicated.
Good condition (ABC)85% 2021-2031 QIP
$20,551 millionAMD$1,495 million
208855 001-164 int 4C_OK-Proofs.pdf_PG 71_Mars 21, 2021_18:27:44
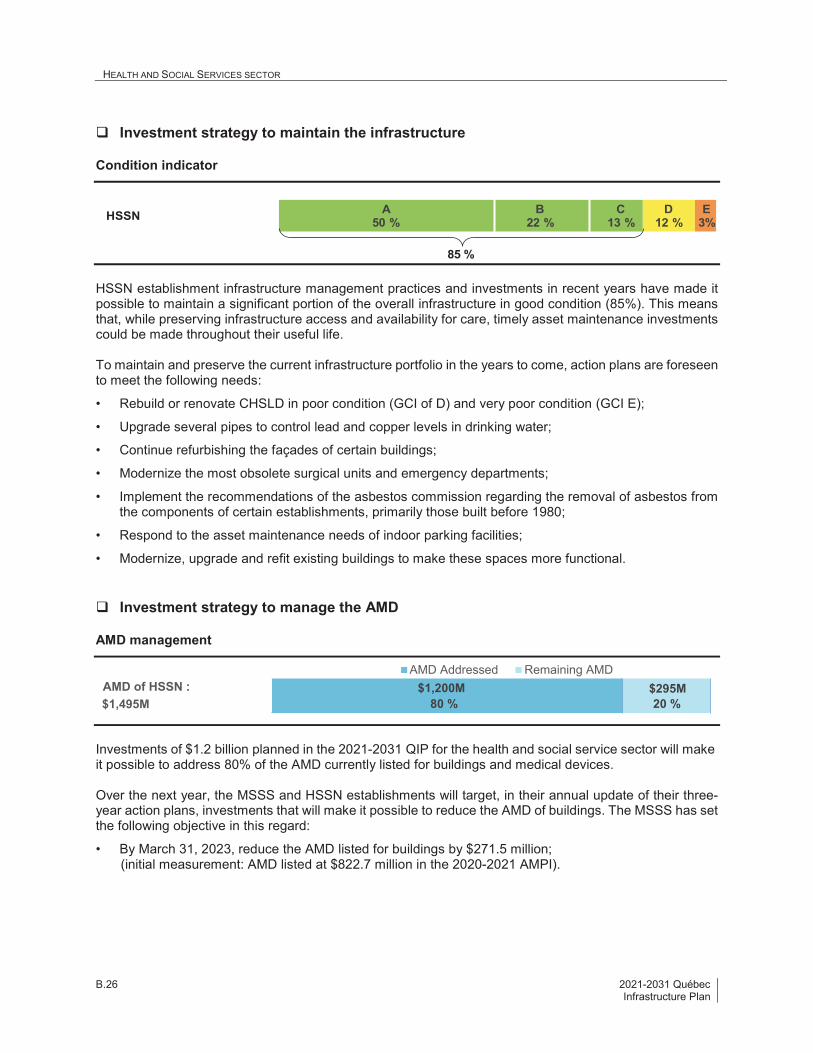
HEALTH AND SOCIAL SERVICES SECTOR B
B.26 2021-2031 QuébecInfrastructure Plan
Investment strategy to maintain the infrastructure
Condition indicator
HSSN establishment infrastructure management practices and investments in recent years have made itpossible to maintain a significant portion of the overall infrastructure in good condition (85%). This meansthat, while preserving infrastructure access and availability for care, timely asset maintenance investmentscould be made throughout their useful life.
To maintain and preserve the current infrastructure portfolio in the years to come, action plans are foreseento meet the following needs:
� Rebuild or renovate CHSLD in poor condition (GCI of D) and very poor condition (GCI E);
� Upgrade several pipes to control lead and copper levels in drinking water;
� Continue refurbishing the façades of certain buildings;
� Modernize the most obsolete surgical units and emergency departments;
� Implement the recommendations of the asbestos commission regarding the removal of asbestos fromthe components of certain establishments, primarily those built before 1980;
� Respond to the asset maintenance needs of indoor parking facilities;
� Modernize, upgrade and refit existing buildings to make these spaces more functional.
Investment strategy to manage the AMD
AMD management
Investments of $1.2 billion planned in the 2021-2031 QIP for the health and social service sector will makeit possible to address 80% of the AMD currently listed for buildings and medical devices.
Over the next year, the MSSS and HSSN establishments will target, in their annual update of their three-year action plans, investments that will make it possible to reduce the AMD of buildings. The MSSS has setthe following objective in this regard:
� By March 31, 2023, reduce the AMD listed for buildings by $271.5 million;(initial measurement: AMD listed at $822.7 million in the 2020-2021 AMPI).
A50 %
B22 %
C13 %
D12 %
E3%HSSN
85 %
$1,200M80 %
$295M20 %$1,495M
AMD of HSSN :AMD Addressed Remaining AMD
208855 001-164 int 4C_OK-Proofs.pdf_PG 72_Mars 21, 2021_18:27:44

Sect
ion
HEALTH AND SOCIAL SERVICES SECTOR B
Planned Investments B.27by Sector
As concerns the replacement of medical devices that have exceeded the predetermined standardizeduseful life, the MSSS has set the following objective:
� By March 31, 2023, reduce the AMD listed for medical equipment by $152.9 million;(initial measurement: AMD listed at $617.9 million in the 2020-2021 AMPI).
The MSSS will use the following means to achieve these AMD management objectives:
� Determine specific AMD reduction objectives under the management and accountability agreementsbetween the MSSS and each establishment;
� Continue the implementation of standardized technical inspections on a five-year basis to prioritizework that makes it possible to restore the condition of infrastructure;
� Accelerate acquisitions by favouring group purchases of medical equipment and push forwardapprovals of replacement projects by two years.
Investment strategy to enhance the infrastructure
The needs of Quebecers and the ways of delivering healthcare are changing rapidly. In the 2021-2031 QIP,the Government plans significant levels of investment to address it.
In the coming years, major investments will be made to undertake or continue several major projects, suchas:
� The construction of new seniors' residences and alternative residences for at least 2,600 new spacesby September 2022;
� The construction of new pavilions to implement new services and improve the quality of care provided;
� The expansion of emergency departments, ambulatory service units and surgical units in hospitals.
208855 001-164 int 4C_OK-Proofs.pdf_PG 73_Mars 21, 2021_18:27:44

EDUCATION SECTOR B
B.28 2021-2031 QuébecInfrastructure Plan
2.2 Education
2.2.1 2021-2031 QIP Investments
2021-2031 QIP Investments for the SectorBy Type and by Year(contribution of the Gouvernement du Québec, in millions of dollars and as a percentage)
2021-2031 QIP 2020-2030 QIP
Investment type 2021-2022
2022-2023
2023-2024
2024-2025
2025-2026 Subtotal
2026-2027 to2030-2031
5 yearsTotal % Total %
Infrastructuremaintenance
Asset maintenance 540.0 683.2 504.9 486.2 369.0 2,583.3 4,033.3 6,616.7 31.6 7,545.0 39.4
AMD management 813.8 983.5 844.7 625.0 413.3 3,680.3 1,524.0 5,204.3 24.9 5,340.5 27.9
Replacement 121.2 186.9 304.9 290.5 168.5 1,072.0 80.2 1,152.2 5.5 699.5 3.7
Subtotal 1,475.0 1,853.7 1,654.6 1,401.7 950.8 7,335.7 5,637.5 12,973.2 62.0 13,585.0 70.9
Portfolio enhancement 1,018.0 1,224.5 1,546.2 1,672.0 1,460.5 6,921.2 1,016.1 7,937.3 38.0 5,565.2 29.1
Total 2,493.0 3,078.2 3,200.8 3,073.6 2,411.3 14,256.9 6,653.6 20,910.5 100.0 19,150.3 100.0
Note: Figures are rounded and the sum of the amounts may not correspond to the total indicated.
2.2.2 Authorized and announced projects of $20.0 million or more, by progress status
In progress(contributions in millions of dollars)
Name Note Region
Contribution by QuébecContribution
bypartners
TotalcostBefore
2021-2022
2021-2031 QIPTotal2021-20
222022-20
31 Total
1 École secondaire du centre deservices scolaire Marguerite-Bourgeoys � Montréal(arrondissement de LaSalle) �Construction
2 06 7.5 7.5 135.8 143.3 150.8 � 150.8
2 École secondaire spécialiséeIrénée-Lussier du centre deservices scolaire de Montréal �Construction
2 06 3.0 3.7 70.4 74.1 77.1 � 77.1
3 École secondaire du centre deservices scolaire des Portages-de-l�Outaouais (secteur desRapides-Deschênes) �Gatineau � Construction
07 28.0 0.6 � 0.6 28.6 0.2 28.8
4 École primaire de lacommission scolaire crie �Chisasibi � Construction
6 10 6.8 3.7 8.6 12.3 19.1 36.9 56.0
5 École secondaire de lacommission scolaire Kativik �Inukjuak � Construction
10 19.1 0.3 6.5 6.8 25.9 8.6 34.5
6 École secondaire du centre deservices scolaire de Laval(secteur de Pont-Viau) �Construction
2 13 11.4 18.8 203.1 221.8 233.2 � 233.2
7 École secondaire du centre deservices scolaire de laSeigneurie-des-Mille-Îles �Mirabel � Construction
2 15 7.6 21.6 119.4 141.0 148.6 1.4 150.0
208855 001-164 int 4C_OK-Proofs.pdf_PG 74_Mars 21, 2021_18:27:44

Sect
ion
EDUCATION SECTOR B
Planned Investments B.29by Sector
Name Note Region
Contribution by QuébecContribution
bypartners
TotalcostBefore
2021-2022
2021-2031 QIPTotal2021-20
222022-20
31 Total
8 École secondaire de Chamblydu centre de services scolairedes Patriotes � Agrandissement
2 16 8.9 46.4 103.1 149.5 158.4 � 158.4
9 École Saint-Eugène du centrede services scolaire desHautes-Rivières � Saint-Jean-sur-Richelieu � Agrandissementet réaménagement
16 22.5 0.3 � 0.3 22.8 � 22.8
10 École primaire et secondairealternative du centre deservices scolaire Marie-Victorin� Longueuil � Construction
16 27.2 0.1 1.6 1.7 28.9 � 28.9
11 École primaire du centre deservices scolaire Marie-Victorin(secteur Sacré-C�ur) �Longueuil � Construction
16 9.2 1.4 10.2 11.6 20.8 � 20.8
Total 151.2 104.4 658.7 763.0 914.2 47.1 961.3
Note: Figures are rounded and the sum of the amounts may not correspond to the total indicated.
208855 001-164 int 4C_OK-Proofs.pdf_PG 75_Mars 21, 2021_18:27:44

EDUCATION SECTOR B
B.30 2021-2031 QuébecInfrastructure Plan
In planning
Name Note Region
1 École primaire du centre de services scolaire des Phares � Rimouski � Construction 01
2 École primaire du centre de services scolaire Kamouraska�Rivière-du-Loup � Rivière-du-Loup � Construction 4 01
3 École Félix-Antoine-Savard du centre de services scolaire de Charlevoix � La Malbaie � Reconstruction etagrandissement
4 03
4 École primaire du centre de services scolaire de la Capitale � Québec � Construction 4 03
5 École primaire du centre de services scolaire des Premières-Seigneuries � Québec (arrondissement de Beauport) �Construction
4 03
6 École primaire du centre de services scolaire des Premières-Seigneuries � Sainte-Brigitte-de-Laval � Construction 4 03
7 École primaire du centre de services scolaire des Premières-Seigneuries � Québec (arrondissement de Charlesbourg)� Construction
4 03
8 École secondaire du centre de services scolaire des Premières-Seigneuries � Québec (arrondissement deCharlesbourg) � Construction
03
9 École Marguerite-Bourgeois du centre de services scolaire Chemin-du-Roy � Trois-Rivières � Reconstruction etagrandissement
4 04
10 École secondaire du Triolet du centre de services scolaire de la Région-de-Sherbrooke � Sherbrooke �Réaménagement
4 05
11 École Allancroft du centre de services scolaire Lester-B.-Pearson � Beaconsfield � Agrandissement et réaménagement 06
12 École de la Fraternité du centre de services scolaire de la Pointe-de-l�Île � Montréal � Reconstruction etagrandissement
4 06
13 École FACE du centre de services scolaire de Montréal � Réfection et réaménagement 06
14 École Le Tournesol du centre de services scolaire de la Pointe-de-l�Île � Montréal � Agrandissement 06
15 École Les-Enfants-du-Monde du centre de services scolaire de Montréal (arrondissement de Côte-des-Neiges�Notre-Dame-de-Grâce) � Agrandissement
06
16 École primaire du centre de services scolaire de la Pointe-de-l�Île � Montréal (arrondissement de Montréal-Nord) �Construction
06
17 École primaire du centre de services scolaire de la Pointe-de-l�Île � Montréal (arrondissement de Rivières-des-Prairies�Pointe-aux-Trembles) � Construction
4 06
18 École primaire du centre de services scolaire de la Pointe-de-l�Île � Montréal (arrondissement d�Anjou) � Construction 4 06
19 École primaire du centre de services scolaire de Montréal (arrondissement de Côte-des-Neiges�Notre-Dame-de-Grâce) � Construction
4 06
20 École primaire du centre de services scolaire de Montréal (arrondissement de Mercier�Hochelaga-Maisonneuve) �Acquisition et réaménagement
06
21 École primaire du centre de services scolaire de Montréal (arrondissement de Rosemont�La Petite-Patrie) �Construction
4 06
22 École primaire du centre de services scolaire de Montréal (arrondissement de Saint-Laurent) � Construction 06
23 École primaire du centre de services scolaire de Montréal (secteur Griffintown) � Construction 06
24 École primaire du centre de services scolaire de Montréal (site du Grand-Séminaire) � Construction 06
25 École primaire du centre de services scolaire Marguerite-Bourgeoys � Montréal (arrondissement de Lachine) �Construction
4 06
26 École primaire du centre de services scolaire Marguerite-Bourgeoys � Montréal (arrondissement de Saint-Laurent) �Construction
4 06
27 École primaire du centre de services scolaire Marguerite-Bourgeoys � Montréal (arrondissement d�Outremont) �Construction
4 06
28 École primaire du centre de services scolaire Marguerite-Bourgeoys � Mont-Royal � Construction 06
29 École primaire et secondaire du centre de services scolaire Marguerite-Bourgeoys � Montréal (arrondissement deVerdun) � Construction
06
30 École primaire Jacques-Rousseau du centre de services scolaire de la Pointe-de-l�Île � Montréal (arrondissementd�Anjou) � Agrandissement
4 06
31 École primaire L�Eau-Vive du centre de services scolaire Marguerite-Bourgeoys � Montréal � Agrandissement 4 06
32 École secondaire (A) du centre de services scolaire de la Pointe-de-l�Île � Montréal (arrondissement d�Anjou) �Construction
06
208855 001-164 int 4C_OK-Proofs.pdf_PG 76_Mars 21, 2021_18:27:44

Sect
ion
EDUCATION SECTOR B
Planned Investments B.31by Sector
Name Note Region
33 École secondaire (B) du centre de services scolaire de la Pointe-de-l�Île � Montréal (arrondissement de Montréal-Nord)� Construction
06
34 École secondaire Académie Dunton du centre de services scolaire de Montréal (arrondissement de Mercier�Hochelaga-Maisonneuve) � Agrandissement
06
35 École secondaire d�Anjou du centre de services scolaire de la Pointe-de-l�Île � Agrandissement 06
36 École secondaire du centre de services scolaire de Montréal (arrondissement d�Ahuntsic-Cartierville) � Construction 4 06
37 École secondaire du centre de services scolaire de Marguerite-Bourgeoys � Montréal (arrondissement de Saint-Laurent) � Construction
06
38 École secondaire du centre de services scolaire Marguerite-Bourgeoys � Dorval � Construction 06
39 École secondaire du centre de services scolaire Marguerite-Bourgeoys � Montréal (arrondissement de L�Île-Bizard�Sainte-Geneviève) � Construction
06
40 École secondaire Mont-Royal du centre de services scolaire Marguerite-Bourgeoys � Agrandissement 4 06
41 École Sophie-Barat du centre de services scolaire de Montréal � Agrandissement, réfection et réaménagement 4 06
42 École transitoire primaire/secondaire du centre de services scolaire de Montréal (arrondissement de Rosemont � LaPetite-Patrie) � Construction
4 06
43 École primaire du centre de services scolaire des Draveurs � Gatineau � Construction 4 07
44 École primaire du centre de services scolaire des Portages-de-l�Outaouais � Pontiac � Construction 07
45 École primaire du centre de services scolaire des Portages-de-l�Outaouais � Gatineau � Construction 4 07
46 École primaire du centre de services scolaire des Portages-de-l�Outaouais (secteur Hull) � Gatineau � Construction 4 07
47 École secondaire du centre de services scolaire des Portages-de-l�Outaouais (secteur de l�Amérique-française) �Gatineau � Construction
07
48 École secondaire Mont-Bleu du centre de services scolaire des Portages-de-l�Outaouais � Gatineau - Réfection 4 07
49 Bâtiment administratif de la commission scolaire Kativik � Nord-du-Québec � Construction 4 10
50 École Ajagudak de la commission scolaire Kativik � Tasiujaq � Agrandissement 4 10
51 École Ikusik de la commission scolaire Kativik � Salluit � Agrandissement et réaménagement 10
52 École secondaire de la commission scolaire crie � Chisasibi � Construction 4 10
53 École Tukisiniarvik de la commission scolaire Kativik � Akulivik � Agrandissement 10
54 Logements de la commission scolaire de Kativik � Nord-du-Québec � Construction 4 10
55 Résidences et classes temporaires � Kuujjuaq � Construction 4 10
56 École Maribel du centre de services scolaire Beauce-Etchemin � Sainte-Marie � Reconstruction et agrandissement 4 12
57 École primaire de la commission scolaire Central Québec � Lévis � Construction 4 12
58 École primaire du centre de services scolaire des Navigateurs � Saint-Apollinaire � Construction 4 12
59 École primaire l�Accueil du centre de services scolaire de la Beauce-Etchemin � Scott � Reconstruction etagrandissement
4 12
60 Polyvalente de Saint-Georges du centre de services scolaire de la Beauce-Etchemin � Saint-Georges �Agrandissement
12
61 Centre de formation professionnelle en métallurgie du centre de services scolaire de Laval � Construction 4 13
62 École Alfred-Pellan du centre de services scolaire de Laval, pavillon Ulric-Debien � Agrandissement 4 13
63 École Cunard du centre de services scolaire de Laval � Réaménagement 4 13
64 École de la Mosaïque du centre de services scolaire de Laval (secteur Laval-des-Rapides) � Agrandissement 13
65 École primaire (A) du centre de services scolaire de Laval (secteur Chomedey) � Construction 4 13
66 École primaire (B) du centre de services scolaire de Laval (secteur Chomedey) � Construction 4 13
67 École primaire (C) du centre de services scolaire de Laval (secteur Chomedey) � Construction 4 13
68 École primaire Coursol du centre de services scolaire de Laval � Reconstruction et agrandissement 4 13
69 École primaire du centre de services scolaire de Laval (secteur des Mille-Îles) � Construction 4 13
70 École primaire du centre de services scolaire de Laval (secteur Laval-des-Rapides) � Construction 4 13
71 École primaire du centre de services scolaire de Laval (secteur est) � Construction 13
72 École primaire et secondaire spécialisée Jean-Piaget du centre de services scolaire de Laval � Construction 13
73 École primaire et secondaire du centre de services scolaire de Laval (secteur Val-Martin) � Construction 13
208855 001-164 int 4C_OK-Proofs.pdf_PG 77_Mars 21, 2021_18:27:44

EDUCATION SECTOR B
B.32 2021-2031 QuébecInfrastructure Plan
Name Note Region
74 École spécialisée du centre de services scolaire de Laval (secteur Laval-des-Rapides) � Construction 13
75 Projet Cunard du centre de services scolaires de Laval � Acquisition, démolition et réaménagement 4 13
76 Centre de formation professionnelle du centre de services scolaire des Affluents � Mascouche � Construction 4 14
77 École primaire (A) du centre de services scolaire de la Seigneurie-des-Mille-Îles � Terrebonne � Construction 4 14
78 École primaire (B) du centre de services scolaire de la Seigneurie-des-Mille-Îles � Terrebonne � Construction 4 14
79 École primaire du centre de services scolaire des Affluents (secteur Jardins du Coteau) � Mascouche � Construction 14
80 École primaire du centre de services scolaire des Samares � Saint-Lin-Laurentides � Construction 4 14
81 École primaire du centre de services scolaire Sir-Wilfrid-Laurier � Saint-Charles-Borromée � Construction 4 14
82 École secondaire Armand-Corbeil du centre de services scolaire des Affluents � Terrebonne � Agrandissement 14
83 École secondaire du centre de services scolaire des Affluents � Terrebonne � Construction 14
84 École secondaire Du Coteau du centre de services scolaire des Affluents � Mascouche � Agrandissement 14
85 École secondaire Félix-Leclerc du centre de services scolaire des Affluents � Repentigny � Agrandissement 4 14
86 École secondaire Jean-Baptiste-Meilleur du centre de services scolaire des Affluents � Repentigny � Agrandissement 14
87 Écoles primaires La Passerelle, Sainte-Marie-des-Anges et Saint-Jude du centre de services scolaire des Affluents �Charlemagne � Reconstruction
4 14
88 École primaire du centre de services scolaire de la Rivière-du-Nord � Mirabel � Construction 4 15
89 École primaire du centre de services scolaire de la Rivière-du-Nord � Sainte-Sophie � Construction 4 15
90 École primaire du centre de services scolaire de la Rivière-du-Nord (secteur 2) � Saint-Jérôme � Construction 15
91 École primaire du centre de services scolaire de la Rivière-du-Nord (secteur 3) � Saint-Jérôme � Construction 15
92 École primaire du centre de services scolaire de la Seigneurie-des-Mille-Îles � Blainville � Construction 4 15
93 École primaire du centre de services scolaire de la Seigneurie-des-Mille-Îles � Mirabel � Construction 4 15
94 École primaire du centre de services scolaire de la Seigneurie-des-Mille-Îles � Sainte-Anne-des-Plaines �Reconstruction
4 15
95 École primaire du centre de services scolaire de la Seigneurie-des-Mille-Îles � Sainte-Marthe-sur-le-Lac � Construction 4 15
96 École primaire du centre de services scolaire des Laurentides � Saint-Sauveur � Construction 15
97 École primaire du centre de services scolaire des Laurentides � Val-David � Construction 4 15
98 École primaire Sainte-Thérèse-de-l�Enfant-Jésus du centre de services scolaire de la Rivière-du-Nord � Saint-Jérôme �Reconstruction et agrandissement
4 15
99 École primaire Terre-des-Jeunes du centre de services scolaire de la Seigneurie-des-Mille-Îles � Saint-Eustache �Reconstruction
4 15
100 École primaire Terre-Soleil du centre de services scolaire de la Seigneurie-des-Mille-Îles � Sainte-Thérèse �Reconstruction
4 15
101 École Saint-Philippe du centre de services scolaire de la Rivière-du-Nord � Brownsburg-Chatham � Reconstruction etagrandissement
4 15
102 École secondaire du centre de services scolaire de la Rivière-du-Nord � Saint-Jérôme � Construction 15
103 École secondaire du Harfang du centre de services scolaire de la Seigneurie-des-Mille-Îles � Sainte-Anne-des-Plaines� Agrandissement
4 15
104 École de formation professionnelle de Châteauguay du centre de services scolaire des Grandes-Seigneuries �Construction
4 16
105 École Notre-Dame du centre de services scolaire des Patriotes � Otterburn Park � Reconstruction et agrandissement 4 16
106 École primaire (A) du centre de services scolaire Marie-Victorin � Brossard � Construction 16
107 École primaire (B) du centre de services scolaire Marie-Victorin � Brossard � Construction 4 16
108 École primaire du centre de services scolaire de Saint-Hyacinthe � Construction 16
109 École primaire du centre de services scolaire des Grandes-Seigneuries � Léry � Construction 16
110 École primaire du centre de services scolaire des Patriotes � Beloeil � Construction 4 16
111 École primaire du centre de services scolaire des Patriotes � Carignan � Construction 16
112 École primaire du centre de services scolaire des Trois-Lacs � Les Cèdres � Construction 4 16
113 École primaire du centre de services scolaire des Trois-Lacs � Vaudreuil-Dorion � Construction 16
114 École primaire du centre de services scolaire du Val-des-Cerfs � Shefford � Construction 4 16
208855 001-164 int 4C_OK-Proofs.pdf_PG 78_Mars 21, 2021_18:27:44

Sect
ion
EDUCATION SECTOR B
Planned Investments B.33by Sector
Name Note Region
115 École primaire du centre de services scolaire Marie-Victorin (secteur Saint-Hubert) � Longueuil � Construction 4 16
116 École primaire du centre de services scolaire Marie-Victorin (secteur Saint-Lambert) � Longueuil � Construction 16
117 École primaire du centre de services scolaire Marie-Victorin (secteur Vauquelin) � Longueuil (arrondissement du Vieux-Longueuil) � Construction
4 16
118 École primaire Georges-P.-Vanier du centre de services scolaire Marie-Victorin � Brossard � Agrandissement 4 16
119 École Saint-Michel-Archange du centre de services scolaire des Grandes-Seigneuries � Saint-Michel �Agrandissement et réaménagement
4 16
120 École secondaire Antoine-Brossard du centre de services scolaire Marie-Victorin � Brossard � Agrandissement 16
121 École secondaire Baie Saint-François du centre de services scolaire de la Vallée-des-Tisserands � Salaberry-de-Valleyfield � Agrandissement
4 16
122 École secondaire de la Magdeleine du centre de services scolaire des Grandes-Seigneuries � La Prairie �Agrandissement et réaménagement
16
123 Écoles secondaires Casavant et Fadette du centre de services scolaire de Saint-Hyacinthe � Agrandissement 16
124 École secondaire du centre de services scolaire des Trois-Lacs � Saint-Zotique � Construction 16
125 École secondaire du centre de services scolaire des Trois-Lacs � Vaudreuil-Dorion � Construction 16
126 École secondaire internationale Lucille-Teasdale du centre de services scolaire Marie-Victorin � Brossard �Agrandissement
4 16
127 École secondaire Jacques-Leber du centre de services scolaire des Grandes-Seigneuries � Saint-Constant� Agrandissement et réaménagement
16
128 École secondaire le Carrefour du centre de services scolaire des Patriotes � Varennes � Agrandissement 16
129 École secondaire Louis-Philippe-Paré du centre de services scolaire des Grandes-Seigneuries � Châteauguay �Construction
16
130 École secondaire Pierre-Bédard du centre de services scolaire des Grandes-Seigneuries � Saint-Rémi� Agrandissement et réaménagement
16
131 École secondaire Saint-Edmond du centre de services scolaire Marie-Victorin � Longueuil � Agrandissement 4 16
132 Immeuble Quinn du centre de services scolaire de la Marie-Victorin � Longueuil � Reconstruction et agrandissement 4 16
133 École primaire du centre de services scolaire des Chênes � Drummondville � Construction 17
134 École secondaire du centre de services scolaire des Chênes � Drummondville � Construction 17
Gouvernement du Québec contribution set out in the 2021-2031 QIP $6,271.3 M
Under study (projects of $50.0 million or more)
Name Note Region
1 École secondaire de la commission scolaire Central Québec � Québec (arrondissement de Sainte-Foy�Sillery�Cap-Rouge) � Maintien et bonification
03
2 Centre de formation professionnelle 24-Juin du centre de services scolaire de la Région-de-Sherbrooke � Bonification 05
3 École primaire ou secondaire de la commission scolaire Kativik � Quaqtaq � Construction 5 10
Contribution by the Gouvernement du Québec planned for the 2021-2031 QIP (cost of studies) $3.1 M
Contribution by the Gouvernement du Québec planned for the 2021-2031 QIP for other projects and envelopes $13,873.1 M
Total for the sector $20,910.5 M
1 The infrastructure concerned with this project is partially or fully in service.2 Since publication of the 2020-2030 QIP, these projects have changed progress status in the list of published projects, moving from "in planning" to
"in progress".3 Since publication of the 2020-2030 QIP, these projects have changed progress status in the list of published projects, moving from "under study"
to "in planning".4 Since publication of the 2020-2030 QIP, these projects have been added to "in planning".5 Since publication of the 2020-2030 QIP, these projects have been added to "under study".6 Since publication of the 2020-2030 QIP, these projects have been added to "in progress".7 Since publication of the 2020-2030 QIP, these projects have changed progress status in the list of published projects, moving from "under study"
to "in progress".
208855 001-164 int 4C_OK-Proofs.pdf_PG 79_Mars 21, 2021_18:27:44

EDUCATION SECTOR B
B.34 2021-2031 QuébecInfrastructure Plan
Furthermore, in addition to these studies, during the next year the Ministère de l�Éducation will submit anapplication to the Government to study six new projects for adding space at secondary schools.
Projects removed from the list of published projects in the 2021-2031 QIP
Name Note Region
1 Montréal school service centre elementary school (Ville-Marie borough) � Construction 2 06
2 Seigneurie-des-Mille-Îles school service centre Domaine Vert-Nord Elementary School � Mirabel � Construction 1 15
1 The infrastructure is in service and no investment is planned for the 2021-2031 period.2 This project is integrated with project no24 from the list of projects "In planning".
208855 001-164 int 4C_OK-Proofs.pdf_PG 80_Mars 21, 2021_18:27:44

Sect
ion
EDUCATION SECTOR B
Planned Investments B.35by Sector
Maintenance62 %
Enhancement38 %
2.2.3 Portrait of infrastructure and investmentstrategies � Education
Portrait of the infrastructure
The education network's real estate portfolio is made up of 4,089 buildings with a total area of 16.9-millionsquare metres in school organizations divided among 61 school service centres, nine English school boardsand two school boards with special status, broken down as follows:
� 2,307 preschools and primary schools;
� 468 secondary schools;
� 279 adult general education and vocational training centres;
� 890 administrative and other buildings (residences, workshops, warehouses and garages);
� 145 surplus buildings.
2021-2031 QIP investments
The Government plans to invest over $20.9 billion over the next 10 years in the education sector, 62% ofwhich, or nearly $13.0 billion, will be mainly dedicated to asset maintenance and AMD management of theschool infrastructure portfolio.
Furthermore, to meet growing educational needs, over $7.9 billion has been earmarked for planning andcarrying out construction, expansion or acquisition projects. These investments will make it possible torespond especially to new space needs reported by school organizations and recognized by the MEQ.
2021-2031 QIP investmentsBy Type(contribution of the Gouvernement du Québec, in millions of dollars)
Schoolorganizations %
Infrastructure MaintenanceAsset Maintenance 6,616.7
AMD 5,204.3
Replacement 1,152.2
Subtotal 12,973.2 62
Infrastructure Enhancement 7,937.3 38
Total 20,910.5 100
Note: Figures are rounded and the sum of the amounts may not correspond to the total indicated.
Good condition (ABC)44% 2021-2031 QIP
$20,911 millionAMD$5,204 million
208855 001-164 int 4C_OK-Proofs.pdf_PG 81_Mars 21, 2021_18:27:44

EDUCATION SECTOR B
B.36 2021-2031 QuébecInfrastructure Plan
Investment strategy to maintain the infrastructure
Condition Indicator
The current portrait reveals that a significant portion, or 56% of the education network's infrastructureportfolio is now in poor or very poor condition (GCI of D or E). This situation is mainly due to a period of lowinvestment in the 1990s and early 2000s. Moreover, as most of the schools were built between 1950 and1970, they have reached or will soon reach the end of their useful life. This means many of them will needmajor repairs or have to be rebuilt in the coming years.
Since education is a priority for Québec, the Government will continue to catch up on the backlog createdin the last decade by dedicating a substantial portion of the investments planned in the 2021-2031 QIP tothis sector. Total portfolio maintenance investments of nearly $13.0 billion will be used to offer more healthy,attractive and better-equipped schools and create settings conducive to learning and academic success,for the benefit of both students and staff.
The MEQ expects the level of maintenance investment planned for the next two years to increase theproportion of infrastructure in good condition (GCI of A, B or C) to 50% by 2022-2023 for all propertiesunder its responsibility.
To achieve this, the MEQ has adopted the following orientations for its future investment choices:
� Prioritize the work required to correct air and mould problems in schools;
� Rapidly replace or repair critical components at the end of their useful life, such as roofs, windows andheating and ventilation systems;
� Prioritize asset maintenance investments in schools in satisfactory condition (GCI of C) in order toprevent them from deteriorating further and ending up with a poor condition indicator (GCI of D).
A11 %
B16 %
C17 %
D37 %
E19 %School organizations
44 %
208855 001-164 int 4C_OK-Proofs.pdf_PG 82_Mars 21, 2021_18:27:44
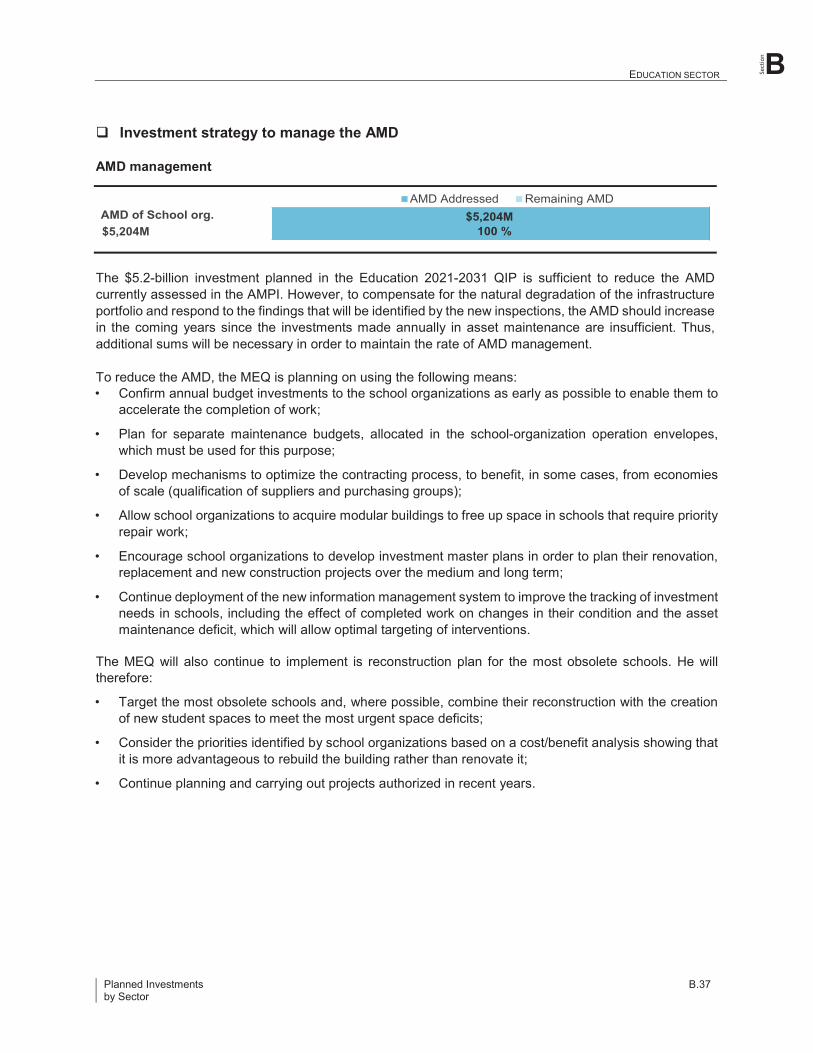
Sect
ion
EDUCATION SECTOR B
Planned Investments B.37by Sector
Investment strategy to manage the AMD
AMD management
The $5.2-billion investment planned in the Education 2021-2031 QIP is sufficient to reduce the AMDcurrently assessed in the AMPI. However, to compensate for the natural degradation of the infrastructureportfolio and respond to the findings that will be identified by the new inspections, the AMD should increasein the coming years since the investments made annually in asset maintenance are insufficient. Thus,additional sums will be necessary in order to maintain the rate of AMD management.
To reduce the AMD, the MEQ is planning on using the following means:� Confirm annual budget investments to the school organizations as early as possible to enable them to
accelerate the completion of work;
� Plan for separate maintenance budgets, allocated in the school-organization operation envelopes,which must be used for this purpose;
� Develop mechanisms to optimize the contracting process, to benefit, in some cases, from economiesof scale (qualification of suppliers and purchasing groups);
� Allow school organizations to acquire modular buildings to free up space in schools that require priorityrepair work;
� Encourage school organizations to develop investment master plans in order to plan their renovation,replacement and new construction projects over the medium and long term;
� Continue deployment of the new information management system to improve the tracking of investmentneeds in schools, including the effect of completed work on changes in their condition and the assetmaintenance deficit, which will allow optimal targeting of interventions.
The MEQ will also continue to implement is reconstruction plan for the most obsolete schools. He willtherefore:
� Target the most obsolete schools and, where possible, combine their reconstruction with the creationof new student spaces to meet the most urgent space deficits;
� Consider the priorities identified by school organizations based on a cost/benefit analysis showing thatit is more advantageous to rebuild the building rather than renovate it;
� Continue planning and carrying out projects authorized in recent years.
$5,204M100 %$5,204M
AMD of School org.AMD Addressed Remaining AMD
208855 001-164 int 4C_OK-Proofs.pdf_PG 83_Mars 21, 2021_18:27:44

EDUCATION SECTOR B
B.38 2021-2031 QuébecInfrastructure Plan
Investment strategy to enhance the infrastructure
By 2024-2025, excluding the impact of the opening of kindergarten for four-year-olds, the MEQ foresees adeficit of over 400 classrooms in primary schools. These schools are mainly in the Montérégie, Montréaland Capitale-Nationale regions. By 2029-2030, the MEQ also forecasts a deficit of over 23,000 studentspaces in secondary schools, mainly in the Montérégie, Laurentides, Capitale-Nationale, Lanaudière andOutaouais regions. Furthermore, to accommodate the introduction of universal kindergarten forfour-year-olds over the longer term, 1,000 classrooms are expected to be added in primary schools.
In response to growing needs in education, the Government is planning to invest over $7.9 billion in theQIP which will allow to:
� Continue the planning and completion of close to 300 additional space projects that have beenauthorized in recent years;
� Carry out new projects to build or expand schools, enabling more primary school classrooms andsecondary student spaces to be added, benefiting thousands of students by 2024-2025;
� Build the premises necessary to achieve the objective of the 4-year-old kindergarten development planby the end of the 2025-2026 school year, i.e. the opening of 2,600 new classes.
208855 001-164 int 4C_OK-Proofs.pdf_PG 84_Mars 21, 2021_18:27:44

Sect
ion
HIGHER EDUCATION SECTOR B
Planned Investments B.39by Sector
2.3 Higher education
2.3.1 2021-2031 QIP investments
2021-2031 QIP Investments for the SectorBy Type and by Year(contribution of the Gouvernement du Québec, in millions of dollars and as a percentage)
2021-2031 QIP 2020-2030 QIP
Investment type 2021-2022
2022-2023
2023-2024
2024-2025
2025-2026
Sub-total
2026-2027 to2030-2031
5 yearsTotal % Total %
Infrastructuremaintenance
Asset maintenance 346.3 441.2 400.7 362.6 360.6 1,911.3 1,428.5 3,339.8 51.5 3,302.5 52.2
AMD management 177.5 173.5 148.2 120.8 115.3 735.2 577.8 1,312.9 20.2 1,307.4 20.7
Replacement 121.4 124.7 128.4 128.0 126.1 628.6 594.9 1,223.5 18.9 1,177.2 18.6
Subtotal 645.1 739.4 677.3 611.4 602.0 3,275.1 2,601.1 5,876.3 90.6 5,787.1 91.5
Portfolio enhancement 175.2 118.7 50.9 55.1 56.1 456.1 153.4 609.5 9.4 536.3 8.5
Total 820.3 858.1 728.2 666.5 658.1 3,731.2 2,754.6 6,485.8 100.0 6,323.4 100.0
Note: Figures are rounded and the sum of the amounts may not correspond to the total indicated.
2.3.2 Authorized and announced projects of $20.0 million or more, by progress status
In progress(contributions in millions of dollars)
Name Note Region
Contribution by QuébecContribution
bypartners
TotalcostBefore
2021-2022
2021-2031 QIPTotal
2021-2022 2022-2031 Total
1 HEC Montréal (arrondissementVille-Marie) � Construction
06 59.3 31.1 18.1 49.2 108.5 126.7 235.2
2 Université McGill, pavillon dessciences biologiques Stewart �Montréal � Réfection
6 06 68.7 15.1 � 15.1 83.8 9.7 93.4
3 Université du Québec àMontréal, pavillon Sanguinet �Réfection et agrandissement
2 06 14.8 27.5 � 27.5 42.3 4.4 46.7
4 Université McGill, pavillonWilson � Montréal � Réfectionet réaménagement
2 06 8.9 9.3 27.0 36.3 45.1 � 45.1
5 Université Concordia, 4e étage� Montréal � Réfection etréaménagement
6 06 16.6 6.5 13.0 19.6 36.2 0.4 36.6
6 Université McGill, pavillonMacdonald-Stewart � Montréal� Réfection
06 10.2 9.6 6.4 16.0 26.2 � 26.2
Total 178.5 99.1 64.5 163.7 342.1 141.2 483.2
Note: Figures are rounded and the sum of the amounts may not correspond to the total indicated.
208855 001-164 int 4C_OK-Proofs.pdf_PG 85_Mars 21, 2021_18:27:44

HIGHER EDUCATION SECTOR B
B.40 2021-2031 QuébecInfrastructure Plan
In planning
Name Note Region
1 Cégep Maisonneuve � Montréal � Agrandissement 4 06
2 École de technologie supérieure, pavillon F � Montréal � Construction 06
3 Université de Montréal, pavillons Roger-Gaudry, Marie-Victorin, J.-A.-DeSève et Lionel-Groulx � Réaménagement 06
4 Université McGill, bibliothèque McLennan-Redpath � Montréal � Reconstruction 4 06
Gouvernement du Québec contribution set out in the 2021-2031 QIP $346.2 M
Under study (projects of $50.0 million or more)
Name Note Region
1 Collège Ahuntsic � Montréal � Bonification 06
2 Collège Dawson � Montréal � Bonification 06
3 École de technologie supérieure, complexe Dow � Montréal � Bonification 06
4 Polytechnique Montréal � Maintien et bonification 06
5 Université de Montréal, pavillon principal et complexe des sciences � Maintien et bonification 06
6 Université McGill sur une partie du site de l�ancien hôpital Royal Victoria � Montréal � Maintien 06
7 Université du Québec en Outaouais, campus de Gatineau � Bonification 07
8 Cégep Édouard-Montpetit, cliniques-écoles � Longueuil � Maintien et bonification 16
Contribution by the Gouvernement du Québec planned for the 2021-2031 QIP (cost of studies) $17.1 M
Contribution by the Gouvernement du Québec planned for the 2021-2031 QIP for other projects and envelopes $5,958.8 M
Total for the sector $6,485.8 M
1 The infrastructure concerned with this project is partially or fully in service.2 Since publication of the 2020-2030 QIP, these projects have changed progress status in the list of published projects, moving from "in planning" to
"in progress".3 Since publication of the 2020-2030 QIP, these projects have changed progress status in the list of published projects, moving from "under study"
to "in planning".4 Since publication of the 2020-2030 QIP, these projects have been added to "in planning".5 Since publication of the 2020-2030 QIP, these projects have been added to "under study".6 Since publication of the 2020-2030 QIP, these projects have been added to "in progress".7 Since publication of the 2020-2030 QIP, these projects have changed progress status in the list of published projects, moving from "under study"
to "in progress".
Furthermore, in addition to these studies, during the next year the Ministère de l�Enseignement supérieurwill submit an application to the Government to study three major new projects for adding space in thefrancophone college network.
Projects removed from the list of published projects in the 2021-2031 QIP
Name Note Region
1 Université de Montréal, complexe des sciences � Montréal � Construction 1 06
2 Université du Québec à Chicoutimi, École des arts numériques, de l�animation et du design � Montréal �Réaménagement
1 06
1 The infrastructure is in service and no investment is planned for the 2021-2031 period.
208855 001-164 int 4C_OK-Proofs.pdf_PG 86_Mars 21, 2021_18:27:44

Sect
ion
HIGHER EDUCATION SECTOR B
Planned Investments B.41by Sector
Maintenance91 %
Enhancement9 %
2.3.3 Portrait of infrastructure and investmentstrategies � Higher Education
Portrait of the infrastructure
The infrastructure portfolio recognized by the MES for funding purposes includes:
� 890 college network buildings with an area of roughly 2.6 million square metres distributed among48 colleges;
� 761 university network buildings with an area of roughly 3.6 million square metres distributed among19 universities.
The college and university networks own research equipment that make a major contribution to thedevelopment of know-how and knowledge, such as CT scanners, 3D printers, electron microscopes,spectroscopes, quantum computers, aircraft and road vehicles.
2021-2031 QIP investments
The Government will invest nearly $6.5 billion over the next 10 years in the college and university networks.Of this amount, 91.0% (i.e. more than $5.8 billion) will be dedicated mainly to maintaining and covering theAMD listed for buildings and for replacement of equipment at the end of its useful life.
In addition, investments of $609.5 million are planned to meet future needs for extra space or to improveexisting spaces in colleges and universities.
2021-2031 QIP investmentsBy Type(contribution of the Gouvernement du Québec, in millions of dollars)
CEGEPs Universities Other Total %
Infrastructure Maintenance
Asset Maintenance 1,315.4 2,022.4 2.0 3,339.8
AMD 280.6 1,032.3 - 1,312.9
Replacement 42.9 1,171.4 9.2 1,223.5
Subtotal 1,639.0 4,226.1 11.2 5,876.3 91Infrastructure Enhancement 307.7 282.2 19.6 609.5 9
Total 1,946.7 4,508.3 30.8 6,485.8 100
Note: Figures are rounded and the sum of the amounts may not correspond to the total indicated.
Good condition (ABC)63% 2021-2031 QIP
$6,486 millionAMD$1,420 million
208855 001-164 int 4C_OK-Proofs.pdf_PG 87_Mars 21, 2021_18:27:44

HIGHER EDUCATION SECTOR B
B.42 2021-2031 QuébecInfrastructure Plan
Investment strategy to maintain the infrastructure
CEGEPs
Condition indicator
The current portrait for CEGEPs shows that 59% of their network's infrastructure portfolio is in goodcondition (GCI of A, B or C). Among the most dilapidated infrastructures (GCI of D or E), which represent41% of the college building portfolio, 70% were built before 1980. Some of these infrastructures are heritagebuildings that should be rehabilitated or rebuilt over the next decade.
By March 31, 2026, the MES expects that planned network maintenance investments for CEGEPs will:
� Increase the proportion of college network infrastructure in good condition to 70% (GCI of A, B or C);
� Reduce the AMD, currently assessed at $326.2 million to a total of $210.5 million, a decrease of$115.7 million.
To achieve this, the MES has adopted the following orientations for its future investment choices:
� Prioritize projects with a significant impact on the condition of the building and that address the AMD;
� Increase the normalized envelopes by 20% to maintain the building inventory in good conditioncompared with the 2019-2029 QIP.
Furthermore, these investments will make it possible, among other things, to start or complete severalprojects, such as:
� Fitting out of the technological classroom at the Collège d�Alma;
� Asbestos removal from basement corridors of the central pavilion of the Cégep Marie-Victorin;
� Refurbishment of ventilation systems in Bloc C of the Cégep du Vieux Montréal.
Universities
Condition indicator
Most of the university infrastructure portfolio is in good condition. Nevertheless, 35% of buildings are in poorcondition (GCI of D or E). Most of the buildings are at the end of their useful life or have largely exceededit. Indeed, nearly 91% of the most dilapidated infrastructures (GCI of D or E) were constructed before 1980.Furthermore, several of these infrastructures are heritage buildings that will require major and complexrepair in the coming years, for which the costs are more expensive due to the cost of materials and the useof specialized labour.
A14 %
B21 %
C24 %
D35 %
E6 %
CEGEPs
59 %
A33 %
B18 %
C14 %
D16 %
E19 %Universities
65 %
208855 001-164 int 4C_OK-Proofs.pdf_PG 88_Mars 21, 2021_18:27:44

Sect
ion
HIGHER EDUCATION SECTOR B
Planned Investments B.43by Sector
By March 31, 2026, the MES expects that planned network maintenance investments for universities will:
� Increase the proportion of university network infrastructure in good condition to 75% (GCI of A, B or C);
� Reduce the AMD, currently assessed at $1,094.2 million, to a total of $692.1 million, a decrease of$402.1 million.
To achieve this, the MES has adopted the following orientations for its future investment choices:
� Prioritize projects with a significant impact on the condition of the building and that address the AMD;
� Increase the normalized envelopes by 20% to maintain the building inventory in good conditioncompared with the 2019-2029 QIP.
Furthermore, these investments will make it possible, among other things, to start or complete severalprojects, such as:
� Refurbishment of the Macdonald-Stewart Pavilion at McGill University;
� Renovation of Divinity House at Bishop's University.
Investment strategy to manage the AMD
AMD management
The $1,312.9 million investment planned in the 2021-2031 QIP for higher education will cover 92% of theAMD of colleges and universities that is currently assessed in the AMPI. However, future inspections willcontribute to identifying new priority work on critical components not listed to date, particularly for the oldestbuildings. This means additional funds will be required in the coming years to maintain theAMD management rate.
The MES will use the following means to address the AMD of colleges and universities:
� Prioritize the completion of repairs or replacement of critical components having reached the end oftheir useful life such as roofs, windows, and heating and ventilation systems;
� Working with the establishments, to develop plans to address their AMD;
� Update the inspections of their buildings so as to target priority work on their building inventory.
$1,313M92 %
$107M8 %$1,420M
AMD of Higher Education :AMD Addressed Remaining AMD
208855 001-164 int 4C_OK-Proofs.pdf_PG 89_Mars 21, 2021_18:27:44

HIGHER EDUCATION SECTOR B
B.44 2021-2031 QuébecInfrastructure Plan
Investment strategy to enhance the infrastructure
CEGEPs
Despite an overall space surplus of 36,327 net square metres, amounting to 2.9% of the net area availableof 1,247,827 net square metres, 16 CEGEPs distributed across five regions currently show a significantspace deficit:
� Capitale-Nationale (three CEGEPs out of five);
� Montréal (six CEGEPs out of 12);
� Laval (the only CEGEP in the region);
� Laurentides (both of the region's CEGEPs);
� Montérégie (four CEGEPs out of seven).
These five regions alone make up 71% of the province's entire student population.
Based on its demographic projection models for all of Québec, the MES expects a gradual rise to191,230 students by 2028, an overall increase of nearly 22% compared with 2018.
� In 2023, the MES estimates that the college network will have an overall space deficit of 18,500 netsquare metres, a deficit of 1.5% of the available net area. The number of regions with a space deficitwill rise from five to eight, with the addition of the Lanaudière, Estrie and Outaouais;
� In 2028, it is estimated that the overall space deficit could reach 109,000 net square metres,representing a deficit of 8.7% of the available net area. Overall, nine regions would be in a space deficit,with the addition of Centre-du-Québec;
� Major infrastructure investments will be necessary to accommodate this significant increase in clientele.
To remedy this situation, investments of nearly $307.7 million are planned in the 2021-2031 QIP for thecollege network alone. Furthermore, five projects currently under study, in planning or in progress, aim toreduce the overall space deficit of the Montréal and Montérégie regions in the medium and long term:
� A major expansion project in planning for Collège de Maisonneuve;
� Three major projects to add space are currently under study for Dawson College, Collège Ahunstic andCégep Édouard-Montpetit;
� An expansion project is underway at Cégep Gérald-Godin.
Universities
The university infrastructure portfolio shows an overall space deficit 133,225 net square metres, whichamounts to 5.8% of the total net portfolio of 2,290,651 m2. This overall space deficit takes into considerationthe teaching and research space surplus shown by the Université du Québec à Rimouski, Université Laval,Bishop�s University, the Institut national de la recherche scientifique and the École nationaled'administration publique.
� Excluding the effect of these surpluses, the space deficit of the university infrastructure portfolioamounts to 155,493 net square metres, 6.7% of the total area;
� To partially meet this need, the Government plans investments of nearly $282.2 million in the2021-2031 QIP.
208855 001-164 int 4C_OK-Proofs.pdf_PG 90_Mars 21, 2021_18:27:44

Sect
ion
HIGHER EDUCATION SECTOR B
Planned Investments B.45by Sector
At present, nine universities, mostly in the Montréal area, show a space deficit. Projects to add space arecurrently under study at:
� École de technologie supérieure;
� Polytechnique Montréal;
� Université de Montréal.
These projects will add approximately 58,520 net square metres of space and reduce the overall spacedeficit by 4.2% to a total of 96,973 net square metres.
Last, the project to refurbish the former Royal Victoria Hospital for McGill University is also under studyand, will add roughly 25,100 net square metres, reducing the overall space deficit from 4.2% to 3.1%, atotal of 71,873 net square metres.
Moreover, considering the significant increase in anticipated clienteles in the coming years, establishmentsin the college and university networks will be encouraged to identify real estate and non-real estatesolutions, in particular based on positive experiences of the increased use of digital technology.
208855 001-164 int 4C_OK-Proofs.pdf_PG 91_Mars 21, 2021_18:27:44

ROAD NETWORK SECTOR B
B.46 2021-2031 QuébecInfrastructure Plan
2.4 Road network
2.4.1 2021-2031 QIP investments
2021-2031 QIP Investments for the SectorBy Type and by Year(contribution of the Gouvernement du Québec, in millions of dollars and as a percentage)
2021-2031 QIP 2020-2030 QIP
Investment type 2021-2022
2022-2023
2023-2024
2024-2025
2025-2026 Subtotal
2026-2027 to2030-2031
5 yearsTotal % Total %
Infrastructuremaintenance
Asset maintenance 1,211.2 953.7 707.2 726.1 731.6 4,329.8 6,160.2 10,489.9 37.0 7,638.9 28.5
AMD management 1,150.0 1,141.6 1,534.9 1,579.4 1,649.3 7,055.1 5,973.5 13,028.6 46.0 13,107.0 48.8
Replacement � � � � � � � � � 1,529.2 5.7
Subtotal 2,361.1 2,095.3 2,242.1 2,305.5 2,380.9 11,384.9 12,133.7 23,518.5 83.0 22,275.1 83.0
Portfolio enhancement 538.9 804.7 964.7 860.8 537.6 3,706.7 1,105.6 4,812.3 17.0 4,557.0 17.0
Total 2,900.0 2,900.0 3,206.8 3,166.3 2,918.4 15,091.6 13,239.2 28,330.8 100.0 26,832.1 100.0
Note: Figures are rounded and the sum of the amounts may not correspond to the total indicated.
2.4.2 Authorized and announced projects of $20.0 million or more, by progress status
In progress(contributions in millions of dollars)
Name Note Region
Contribution by Québec9
Contributionby
partnersTotalcostBefore
2021-2022
2021-2031 QIPTotal
2021-2022 2022-2031 Total
Road network component
1 Autoroute 85 (Claude-Béchard)entre Saint-Antonin et Saint-Louis-du-Ha! Ha! (phase III) �Construction
01 142.4 64.9 345.8 410.8 553.2 389.7 942.9
2 Route 132 entre la voie ferrée etle cours d�eau Saint-Laurent �Val-Brillant � Réfection
01 22.1 14.0 � 14.0 36.1 � 36.1
3 Route 169, voie decontournement des quartiers deL�Isle-Maligne et de Delisle �Alma � Construction
1 02 56.7 1.0 3.4 4.4 61.1 0.1 61.1
4 Pont Dubuc entre Chicoutimi etChicoutimi-Nord, éléments dutablier � Saguenay � Réfection
02 39.7 5.0 � 5.0 44.8 � 44.8
5 Route d�Obedjiwan entre LaTuque et Lac-Ashuapmushuan� Réaménagement
1 02-04 25.8 14.0 37.4 51.3 77.2 � 77.2
6 Autoroute 73 (Henri-IV) entrel�autoroute 40 et l�autoroute 440� Québec � Élargissement
1 03 128.9 22.6 11.1 33.7 162.6 128.6 291.2
7 Pont d�étagement du chemindes Quatre-Bourgeois au-dessus de l�autoroute 73 �Québec � Reconstruction
2 03 5.0 14.1 58.6 72.7 77.7 6.8 84.5
8 Pont de l�Île-d�Orléans entreQuébec et l�Île-d�Orléans� Maintien
8 03 44.3 2.7 11.4 14.1 58.5 � 58.5
208855 001-164 int 4C_OK-Proofs.pdf_PG 92_Mars 21, 2021_18:27:44

Sect
ion
ROAD NETWORK SECTOR B
Planned Investments B.47by Sector
Name Note Region
Contribution by Québec9
Contributionby
partnersTotalcostBefore
2021-2022
2021-2031 QIPTotal
2021-2022 2022-2031 Total
9 Pont Pierre-Laporte entreQuébec et Lévis � Réfection
03-12 18.4 11.2 69.8 81.0 99.5 � 99.5
10 Pont de Québec entre Québecet Lévis, tablier � Maintien
8 03-12 40.9 1.0 2.2 3.3 44.1 � 44.1
11 Autoroute 410, voie decontournement (phase II) �Sherbrooke � Construction
1 05 42.6 0.6 4.7 5.3 48.0 37.3 85.2
12 Complexe Turcot � Montréal� Reconstruction
1 06 3,095.8 141.1 436.3 577.5 3,673.3 � 3,673.3
13 Tunnels Ville-Marie et Viger� Montréal � Réfection
06 65.1 91.1 1,894.7 1,985.8 2,050.9 � 2,050.9
14 Échangeur Dorval � Montréal� Réaménagement
1 06 202.4 11.4 16.8 28.2 230.6 103.6 334.2
15 Autoroute 40 (Métropolitaine)� Montréal � Maintien
8 06 187.0 12.4 32.8 45.2 232.2 � 232.2
16 Échangeur Saint-Pierre �Montréal � Maintien
8 06 133.5 9.2 52.6 61.8 195.3 � 195.3
17 Tunnels Ville-Marie et Viger� Montréal � Maintien
8 06 94.4 0.8 17.2 18.0 112.3 8.4 120.7
18 Structures de l�autoroute 720 �Montréal (arrondissement deVille-Marie) � Réfection
2 06 2.1 3.7 87.1 90.8 92.8 � 92.8
19 Échangeur de l�autoroute 13 etde l�autoroute 40, diversesstructures � Montréal �Réfection et reconstruction
06 74.4 15.0 � 15.0 89.4 � 89.4
20 Structures de l�autoroute 520(Côte-de-Liesse) entrel�autoroute 20 et l�autoroute 40 �Montréal et Dorval �Reconstruction
1 06 23.3 7.4 36.9 44.3 67.6 1.1 68.7
21 Échangeur des Sources entrePointe-Claire et Dorval �Réfection
06 5.5 10.3 31.6 41.8 47.3 1.9 49.2
22 Pont d�étagement du boulevarddes Galeries-d�Anjou au-dessusde l�autoroute 40 � Montréal �Reconstruction
6 06 3.4 4.6 23.4 28.0 31.4 9.6 41.0
23 Pont Pie-IX (route 125) entreMontréal et Laval � Réfection 06-13 17.8 42.3 55.6 97.9 115.7 82.9 198.6
24 Pont Louis-Bisson entreMontréal et Laval � Réfection
06-13 16.9 8.1 � 8.1 25.0 � 25.0
25 Tunnel Louis-Hippolyte-LaFontaine entre Montréal etLongueuil � Réfection
06-16 134.2 221.6 638.2 859.8 994.0 431.8 1,425.8
26 Pont Honoré-Mercier entreMontréal et Kahnawake �Maintien
8 06-16 205.2 14.3 65.2 79.5 284.7 � 284.7
27 Pont de l�Île-aux-Tourtes entreVaudreuil-Dorion et Senneville� Maintien
8 06-16 110.4 23.0 149.4 172.4 282.7 � 282.7
28 Autoroute 5 entre le chemin dela Rivière et la route 105 � LaPêche � Prolongement
1 07 80.6 0.1 21.6 21.6 102.2 76.1 178.3
29 Route 117, voie decontournement � Rouyn-Noranda � Construction
1 08 97.0 7.6 1.9 9.6 106.6 0.4 106.9
30 Route 117 � Réservoir-Dozois �Réfection
6 08 0.4 12.5 12.8 25.3 25.7 � 25.7
208855 001-164 int 4C_OK-Proofs.pdf_PG 93_Mars 21, 2021_18:27:44

ROAD NETWORK SECTOR B
B.48 2021-2031 QuébecInfrastructure Plan
Name Note Region
Contribution by Québec9
Contributionby
partnersTotalcostBefore
2021-2022
2021-2031 QIPTotal
2021-2022 2022-2031 Total
31 Route 389 (B) entre Baie-Comeau et la centrale Jean-Lesage (Manic-2) �Reconstruction
09 29.0 17.9 28.2 46.1 75.1 46.7 121.8
32 Route 138, côte Arsène Gagnon� Les Bergeronnes� Reconstruction
09 64.2 14.9 4.3 19.2 83.4 � 83.4
33 Route 389 (E) entre la centraleRené-Lévesque (Manic-3) et lebarrage Daniel-Johnson (Manic-5) � Reconstruction
6 09 11.5 0.1 37.0 37.1 48.6 � 48.6
34 Route 389 (C) au nord dubarrage Daniel-Johnson (Manic-5) � Reconstruction
6 09 21.0 2.0 � 2.0 23.0 15.8 38.8
35 Route 389 (D) entre la centraleJean-Lesage (Manic-2) et lacentrale René-Lévesque(Manic-3) � Reconstruction
6 09 17.1 � 15.2 15.2 32.4 3.1 35.4
36 Route 138, diverses sectionsentre Baie-Comeau et Port-Cartier � Reconstruction
09 25.3 5.0 � 5.0 30.3 � 30.3
37 Route 199, divers secteurs �Îles-de-la-Madeleine � Réfection 6 11 8.9 3.4 27.2 30.6 39.4 � 39.4
38 Route 132 entre Pabos Mills etNewport � Réfection
11 37.2 0.1 1.8 2.0 39.2 0.1 39.2
39 Réseau routier, divers sites �Îles-de-la-Madeleine � Réfection 11 3.3 13.9 10.4 24.3 27.7 � 27.7
40 Route 173 et route 277 � Saint-Henri � Réaménagement
12 74.1 10.8 0.4 11.2 85.2 � 85.2
41 Échangeur de l�autoroute 20 etde la route 171 � Lévis� Réaménagement
1 12 47.6 0.1 1.3 1.4 49.1 � 49.1
42 Autoroute 20 � Saint-Janvier-de-Joly � Reconstruction
12 14.1 10.8 10.3 21.1 35.2 � 35.2
43 Ponts d�étagement du cheminde Sainte-Anne-des-Lacs et duchemin du Moulin surl�autoroute 15 � Sainte-Adèle �Réfection
15 13.7 7.0 � 7.0 20.7 � 20.7
44 Autoroute 35 entre Saint-Sébastien et Saint-Armand(phase III) � Construction
16 16.7 48.4 75.7 124.1 140.8 82.1 222.9
45 Pont Gouin entre Saint-Jean-sur-Richelieu et Iberville �Reconstruction
1 16 77.0 17.3 � 17.3 94.3 32.0 126.3
5,576.9 939.3 4,330.3 5,269.8 10,846.9 1,458.1 12,304.5
Public transit component46 Autoroute 30 entre Brossard et
Boucherville, chaussée et UAB� Réfection et aménagement
6 16 16.0 16.9 35.7 52.6 68.6 � 68.6
Total 5,592.9 956.2 4,366.0 5,322.4 10,915.5 1,458.1 12,373.1
Note: Figures are rounded and the sum of the amounts may not correspond to the total indicated.
208855 001-164 int 4C_OK-Proofs.pdf_PG 94_Mars 21, 2021_18:27:44

Sect
ion
ROAD NETWORK SECTOR B
Planned Investments B.49by Sector
In planning
Name Note Region
Road network component
1 Pont Arthur-Bergeron et route 132 � Grand-Métis � Reconstruction et réaménagement 4 01
2 Pont de la route 132 au-dessus de la rivière Rimouski � Rimouski � Réfection 4 01
3 Route 293 � Notre-Dame-des-Neiges � Réaménagement 4 01
4 Autoroute 70 entre Grande-Anse et La Baie � Construction 02
5 Route 170 � L�Anse-Saint-Jean � Réaménagement 4 02
6 Route 170 à Saint-Bruno et route 169 vers Alma � Construction 3 02
7 Pont de l�Île-d�Orléans entre Québec et L�Île-d�Orléans � Reconstruction 03
8 Structures de l�autoroute 73 (Henri-IV) entre le pont Pierre-Laporte et le boulevard Laurier � Québec � Réfection 4 03
9 Pont de Québec entre Québec et Lévis, tablier � Reconstruction 03-12
10 Tunnel entre Québec et Lévis (volet réseau routier) � Construction 03-12
11 Pont de la route 138 au-dessus de la rivière Batiscan � Batiscan � Reconstruction 04
12 Pont Laviolette entre Trois-Rivières et Bécancour, dalle � Réfection 04-17
13 Autoroute 40 (Félix-Leclerc) direction est, entre Kirkland et Baie-d�Urfé � Reconstruction 06
14 Autoroute 40 (Métropolitaine) secteur est, entre les boulevards Provencher et Saint-Laurent � Montréal � Réfection 06
15 Avenue Souligny entre les rues Dickson et Notre-Dame (port de Montréal) � Réfection 06
16 Rue Notre-Dame Ouest entre le boulevard Angrignon et la rue De Courcelle (secteur de Turcot) � Montréal �Réaménagement
06
17 Tunnel Dorval (autoroute 13) entre Montréal et Dorval � Réfection 06
18 Pont Charles-de Gaulle entre Montréal et Terrebonne � Réfection 4 06-14
19 Pont de l�Île-aux-Tourtes entre Vaudreuil-Dorion et Senneville � Reconstruction 06-16
20 Pont Honoré-Mercier entre Montréal et Kahnawake � Reconstruction 06-16
21 Autoroute 50 entre Gatineau et L�Ange-Gardien � Élargissement 07
22 Pont Alonzo-Wright et approches est et ouest � Gatineau � Construction et réaménagement 07
23 Autoroute 50 entre L�Ange-Gardien et Mirabel � Élargissement et réaménagement 3 07-15
24 Route 138 � Traverse Tadoussac-Baie-Sainte-Catherine � Réaménagement 09
25 Route 389 (A) entre Fire Lake et Fermont � Reconstruction 09
26 Route 138 entre Kegaska et La Romaine � Construction 09
27 Route 138 entre Tête-à-la-Baleine et La Tabatière � Construction 09
28 Autoroute 20 direction est, entre Saint-Apollinaire et Laurier-Station � Reconstruction 4 12
29 Autoroute 20 entre la route du Président-Kennedy et l�accès au pont Pierre-Laporte � Lévis � Élargissement 12
30 Autoroute 73 (boulevard urbain) � Saint-Georges � Construction 4 12
31 Échangeur de l�autoroute 20 et de la route 173 � Lévis � Réfection et réaménagement 12
32 Échangeur des autoroutes 440 et 15, bretelle aérienne � Laval � Construction 4 13
33 Autoroute 19 entre Laval et Bois-des-Filion � Construction 13-15
34 Pont Gédéon-Ouimet (autoroute 15) entre Laval et Boisbriand � Reconstruction 3 13-15
35 Pont Vachon (autoroute 13) entre Laval et Boisbriand � Réfection 13-15
36 Autoroute 25 entre Saint-Esprit et Rawdon � Construction et réfection 4 14
37 Chemin de Manawan entre Lac-Matawin et Saint-Michel-des-Saints � Réfection 4 14
38 Pont Bailleul et route 341 entre l�autoroute 40 et la route 344 � L�Assomption � Reconstruction et élargissement 4 14
39 Pont Rivest � Repentigny � Reconstruction 4 14
40 Route 158 entre Saint-Alexis et Joliette � Réaménagement 14
41 Voie de contournement � Saint-Lin-Laurentides � Construction 4 14
42 Pont Boys Farm sur la route 117 � Prévost � Reconstruction 4 15
43 Route 117 entre Labelle et Rivière-Rouge � Élargissement 3 15
44 Autoroute 30 entre Brossard et Boucherville � Élargissement 3 16
208855 001-164 int 4C_OK-Proofs.pdf_PG 95_Mars 21, 2021_18:27:44

ROAD NETWORK SECTOR B
B.50 2021-2031 QuébecInfrastructure Plan
Name Note Region
45 Autoroute 35 entre Saint-Armand et la frontière américaine (phase IV) � Construction 16
46 Autoroute 20 entre Mont-Saint-Hilaire et Saint-Hyacinthe � Réfection 16
47 Échangeur Saint-Alexandre de l�autoroute 35 � Construction 4 16
48 Pont Maurice-Martel (autoroute 30) � Sorel-Tracy � Réfection 16
49 Route 104 (chemin de Saint-Jean) � La Prairie � Élargissement et réaménagement 4 16
50 Route 139 � Granby � Réfection et construction 16
51 Autoroute 55 entre Bécancour et Sainte-Eulalie � Élargissement et réaménagement 3 17
Public transit component
52 Autoroute 440, direction est, entre la route 125 et l�autoroute 25, voie réservée � Laval � Aménagement 4 13
53 Autoroute 25, direction nord, entre Laval et Terrebonne, voies réservées � Aménagement 4 13-14
54 Autoroute 15, chaussée et voies réservées � Laval et Boisbriand � Réfection et aménagement 3 13-15
55 Autoroute 15, direction nord, entre Boisbriand et Mirabel, voie réservée � Aménagement 4 15
56 Autoroute 10 entre Brossard et Carignan, voies réservées � Aménagement 4 16
57 Autoroute 20, direction est, entre Beloeil et Sainte-Julie, voies réservées � Aménagement 16
58 Échangeur des autoroutes 30 et 40, voie réservée � Vaudreuil-Dorion � Aménagement 4 16
Gouvernement du Québec contribution set out in the 2021-2031 QIP $7,797.9 M
208855 001-164 int 4C_OK-Proofs.pdf_PG 96_Mars 21, 2021_18:27:44

Sect
ion
ROAD NETWORK SECTOR B
Planned Investments B.51by Sector
Under study (projects of $100 million or more)
Name Note Region
Road network component
1 Autoroute 973 entre la sortie Lebourgneuf et la rue de la Croix-Rouge � Québec � Bonification 03
2 Échangeurs au nord des ponts Pierre-Laporte et de Québec intégrant des mesures pour le transport collectif � Maintien etbonification
03
3 Pont entre Tadoussac et Baie-Sainte-Catherine � Bonification 03-09
4 Autoroute 40 (Métropolitaine) secteur ouest, entre le boulevard Saint-Laurent et l�autoroute 520 � Montréal � Maintien 06
5 Boulevard Cavendish entre l�autoroute 13 et l�autoroute 15 � Montréal � Bonification 06
6 Échangeur Saint-Pierre � Montréal � Maintien 06
7 Route 138 entre La Romaine et Tête-à-la-Baleine � Bonification 09
8 Route 138 entre La Tabatière et Vieux-Fort � Bonification 09
9 Autoroute 13 entre Saint-Eustache et Mirabel � Bonification 15
10 Place Charles-Le Moyne � Longueuil � Bonification 16
11 Route 132 entre Delson et Sainte-Catherine � Saint-Constant � Bonification 16
Public transit component
12 Voies réservées sur les autoroutes 13, 20, 25, 440, 640 et la route 116 � Région métropolitaine de Montréal � Bonification 05-13-15-16
Contribution by the Gouvernement du Québec planned for the 2021-2031 QIP (cost of studies and preparatory work) $148.6 M
Contribution by the Gouvernement du Québec planned for the 2021-2031 QIP for other projects and envelopes $15,061.9 M
Total for the sector $28,330.8 M
1 The infrastructure concerned with this project is partially or fully in service.2 Since publication of the 2020-2030 QIP, these projects have changed progress status in the list of published projects, moving from "in planning" to
"in progress".3 Since publication of the 2020-2030 QIP, these projects have changed progress status in the list of published projects, moving from "under study"
to "in planning".4 Since publication of the 2020-2030 QIP, these projects have been added to "in planning".5 Since publication of the 2020-2030 QIP, these projects have been added to "under study".6 Since publication of the 2020-2030 QIP, these projects have been added to "in progress".7 Since publication of the 2020-2030 QIP, these projects have changed progress status in the list of published projects, moving from "under study"
to "in progress".8 A major reconstruction or repair project for this infrastructure is currently "Under study", "In planning" or "in progress.9 The contribution of the Gouvernement du Québec to projects in the �Road Network� sector is assumed by the Land Transportation Network Fund.
208855 001-164 int 4C_OK-Proofs.pdf_PG 97_Mars 21, 2021_18:27:44

ROAD NETWORK SECTOR B
B.52 2021-2031 QuébecInfrastructure Plan
Maintenance83 %
Enhancement17 %
2.4.3 Portrait of infrastructure and investmentstrategies � Road network
Portrait of the infrastructure
The road network infrastructure, under the responsibility of the MTQ, can be broken down as follows:
� 31,039 kilometres of paved roadways, including highways, and national, regional and collector roads;
� 5,475 highway structures4, including overpasses, bridges over watercourses, tunnels and retainingwalls;
� 4,265 bridges in the municipal network, which the MTQ has been in charge of managing since 2007;
� 61,814 culverts under 3 m wide, spread out across the highway system.
2021-2031 QIP investments
The Government plans to invest more than $28.3 billion in the road network over the next 10 years. Themajority of this investment will be to maintain and restore the condition of the current infrastructure portfolio.
More precisely, $23.5 billion, or 83% of total investments, will be allocated to maintaining assets and tomanaging the AMD of road network infrastructure. Furthermore, to continue developing the infrastructureportfolio and responding to the increased demand on certain areas of the road network, $4.8 billion ininvestments will be used to expand and extend several roadway segments, such as Autoroute (Henri-IV)in Québec City and extending Route 138 on the Côte-Nord. These investments will also be used to buildnew highway links needed to improve the network's functionality and traffic flow, such as the extension ofAutoroute 19 between Laval and Bois-des-Filion.
2021-2031 QIP investmentsBy Type(contribution of the Gouvernement du Québec, in millions of dollars and as a percentage)
Road Netword %
Infrastructure Maintenance
Asset Maintenance 10,489.9
AMD 13,028.6
Subtotal 23,518.5 83
Infrastructure Enhancement 4,812.3 17
Total 28,330.8 100
Note: Figures are rounded and the sum of the amounts may not correspond to the total indicated.
4 The highway system refers to the road network, which consists of highways, and national, regional, collector and resource access roads.
Good condition (ABC)54% 2021-2031 QIP
$28,331 millionAMD$17,924 million
208855 001-164 int 4C_OK-Proofs.pdf_PG 98_Mars 21, 2021_18:27:44

Sect
ion
ROAD NETWORK SECTOR B
Planned Investments B.53by Sector
Investment strategy to maintain the infrastructure
Condition indicator
A17 %
B21 %
C11 %
D22 %
E29 %Highway system roadways
49 %
The highway system's roadways are currently in good condition (GCI of A, B or C), at 49%. Thisassessment combines four indicators, i.e. ride comfort (measured by the international roughness index),rutting, cracking and vulnerability to freezing. This combination of indicators is used to assess conditionbased on investment requirements needed to ensure sustainability.
The roadway preservation planning strategy seeks to ensure users enjoy a high level of service and tomaximize the long-term benefits of roadway preservation investments. The challenge is to invest in the rightroadway at the right time using the proper technique through optimum planning of measures and to avoidthe "worst is first" reflex.
The strategy is open-ended and adapted to each MTQ territory depending on the condition and need forintervention on their network, financial parameters, the objectives defined in the AMPI and the targets setin the MTQ's strategic planning.
To achieve the target of 53% of roadways in good condition by 2023, the MTQ drew on modern principlesof sound road asset management to establish an intervention planning strategy built on five complementarycomponents:
� Immediately initiate work on roadways where the pavement condition could compromise safety;
� Perform preventive work to maintain the roadways in good condition and increase their useful life bymeans of economical measures;
� Complete minor preventive interventions with a high cost-benefit based on the residual useful life ofroadways;
� Complete major preventive interventions with a high cost-benefit based on the residual useful life ofroadways;
� Limit work that addresses other considerations and uncertainties through interventions that do not fallwithin other components.
In addition to the parameters stated above, the MTQ must strike a balance between investments in complexmeasures that remedy major deficiencies and high benefit-cost investments that remedy minor deficiencies.What is more, special attention is paid to heavily used road segments that display rutting.
208855 001-164 int 4C_OK-Proofs.pdf_PG 99_Mars 21, 2021_18:27:44

ROAD NETWORK SECTOR B
B.54 2021-2031 QuébecInfrastructure Plan
Structures condition indicator
Municipal bridges
By number
By value
By number
By value
A15 %
B12 %
C32 %
D9 %
E32 %
A11 %
B12 %
C35 %
D9 %
E33 %
A20 %
B27 %
C30 %
D8 %
E15 %
A9 %
B18 %
C26 %
D9 %
E38 %
Highway system
77 %
59 %
53 %
58 %
The intervention strategy to maintain structures in good condition (GCI of A, B or C) put forward by theMTQ's Direction générale des structures and deployed by its territorial divisions is built around the followingelements:
� Prioritize work on structures located on the strategic road network supporting external trade (RSSCE);5
� Target preventive maintenance measures and inexpensive repairs that make it possible to postponemajor interventions for five to 10 years;
� Limit the scope of structure repair projects to interventions that are strictly confined to structuraldeficiencies or other safety-related problems without adding �non-priority� measures;
� Optimize, in the medium- and long-terms, intervention planning for structures to lengthen the timeavailable to complete major repair work.
In a context where the ability to perform work is limited compared with the needs identified, this interventionstrategy prioritizes projects that ensure public safety and maximize the long-term sustainability of theinfrastructure portfolio. In its 2019-2023 Strategic Plan, the MTQ seeks to achieve the following objectivesby 2023:
� 79% of the number of highway system structures in good condition (compared with 76% in 2019 and77% in 2020);
� 61% of the number of bridges in the municipal network in good condition (compared with 58% in 2019and 59% in 2020).
5 Within its network, the MTQ has defined an RSSCE that supports most of Québec's trade with its commercial partners and serves the vast majority of
Quebecers.
208855 001-164 int 4C_OK-Proofs.pdf_PG 100_Mars 21, 2021_18:27:44

Sect
ion
ROAD NETWORK SECTOR B
Planned Investments B.55by Sector
Condition indicator
A49 %
B23 %
C11 %
D9 %
E8 %
Culverts under 3 m
83 %
By number
By value A51 %
B23 %
C10 %
D8 %
E8 %
84 %
Most of the road network culverts under 3 m wide, i.e. 83% (in proportion to the number), are in goodcondition and require no major intervention in the short term. Culverts in poor and very poor condition(GCI of D or E) are monitored very closely, since they will require repair, rehabilitation or reconstruction inthe coming years.
To improve this record, the 2020-2022 integrated strategy for culverts under 3 m wide aims to optimizeinterventions to ensure user safety, optimal use of resources and the sustainability of culverts while meetingthe following objectives:
� Intervene on culverts that pose a risk to user safety or to maintain the level of road network service;
� Intervene on culverts located below roadway projects;
� Intervene preventively on culverts in good condition (GCI of A, B or C);
� Intervene on culverts in poor or very poor condition (GCI of D or E) that require only minor work toreturn them to good condition.
Investment strategy to manage the AMD
AMD management1
1 Level of investments planned in the PQI 2021 2031 to carry out interventions on assets with AMD.
The AMD, with a total value of $17.9 billion, is the result of low investment in road infrastructuremaintenance, especially between 1980 and 2000. It is detailed as follows:
� Roadways in the highway system: $7.9 billion;
� Structures in the highway system: $8.4 billion;
� Bridges in the municipal network: $0.6 billion;
� Culverts under 3 m: $1.0 billion.
Since a high proportion of road network structures were built between 1960 and 1970, several are at theend of their useful life; reconstruction will require significant investments in the coming years.
$13,029M73 %
$4,895M27 %$17,924M
AMD of Road Network :AMD Addressed Remaining AMD
208855 001-164 int 4C_OK-Proofs.pdf_PG 101_Mars 21, 2021_18:27:44

ROAD NETWORK SECTOR B
B.56 2021-2031 QuébecInfrastructure Plan
In 2021-2031 QIP, investments of $13.0 billion to manage AMD are planned in order to carry outinterventions on assets, which could ultimately reduce up to 73% of all the AMD listed nowadays. However,the natural degradation of road infrastructure will influence the variation of the AMD in the coming years.
Although they are not included in their physical dilapidation, carrying out work related to functionaldevelopment on existing infrastructure, essential in particular for increasing road safety, traffic managementand adaptation to climate change requires use of an increasingly significant portion of the investmentenvelopes available in infrastructure maintenance. The MTQ will continue to clarify the effect of theseinterventions on the rate of management of the AMD in the coming years.
Highway system roadways
In its global roadway pavement maintenance intervention strategy, the MTQ plans to allocate the majorityof investments available to performing high benefit-cost corrective measures to restore roadways to goodcondition (GCI of A, B or C) and to manage the AMD. In prioritizing its interventions, the MTQ ensures thatit strikes a balance between major and minor repairs, the short-term objective being an optimal quantity ofmeasures that effectively increase useful life significantly and reduce the AMD.
Lastly, to optimize costs and reduce traffic impact, the MTQ prioritizes integrated asset management,including interventions on culverts in poor or very poor condition (GCI of D or E) when undertaking roadwayprojects.
Highway system structures and municipal bridges
The vast majority of the RSSCE structures were built between 1960 and 1980. Consequently, many are ator near the end of their useful life. Furthermore, a very large proportion of the AMD is found on a limitednumber of major structures.
Therefore, in its strategic planning for the work to be carried out in the coming years, the MTQ has plannedseveral major reconstruction and restoration projects on specific major structures in the highway systemthat are in very poor condition (GCI of E) that will have significant impact on decreasing the AMD. Theseprojects include, in particular:
� Reconstruction of the Honoré-Mercier, Île d'Orléans and Île-aux-Tourtes bridges;
� Repairs to the Pierre-Laporte and Laviolette bridges;
� Repair of the eastern sector of the Autoroute Métropolitain in Montréal;
� Repair of the Ville Marie and Viger tunnels;
� Repairs to the Louis-Hippolyte-La Fontaine tunnel.
Nonetheless, since the planning required before undertaking these major projects could take a number ofyears, investments are allocated to maintain these structures in service until the completion of major repairor reconstruction work.
� For example, for the project to rebuild the Île-d'Orléans bridge, now being planned and that will eliminatethe cumulative AMD of this structure, the current bridge is receiving investments to complete assetmaintenance work required until the new bridge is commissioned.
208855 001-164 int 4C_OK-Proofs.pdf_PG 102_Mars 21, 2021_18:27:44

Sect
ion
ROAD NETWORK SECTOR B
Planned Investments B.57by Sector
Investment strategy to enhance the infrastructure
To meet the increasing demand on the road network in certain areas that have reached the saturation point,the MTQ's investment strategy to enhance the portfolio in the coming years hinges on the followingintervention priorities:
� Improve user safety;
� Improve network functionality by optimizing traffic flow where congestion occurs;
� Increase the transportation network's resilience to natural hazards and climate change:
� The MTQ's 2019-2023 Strategic Plan provides for the completion of 25 roadway projects in answerto climate changes by 2023.
Furthermore, a significant quantity of infrastructure will have to be repaired or rebuilt in the coming years.For these projects, the MTQ will assess whether this infrastructure should be improved or upgraded basedon the intervention priorities listed above.
208855 001-164 int 4C_OK-Proofs.pdf_PG 103_Mars 21, 2021_18:27:44

PUBLIC TRANSIT SECTOR B
B.58 2021-2031 QuébecInfrastructure Plan
2.5 Public transit
2.5.1 2021-2031 QIP investments
2021-2031 QIP Investments for the SectorBy Type and by Year(contribution of the Gouvernement du Québec, in millions of dollars and as a percentage)
2021-2031 QIP 2020-2030 QIP
Investment type 2021-2022
2022-2023
2023-2024
2024-2025
2025-2026 Subtotal
2026-2027 to2030-2031
5 yearsTotal % Total %
InfrastructuremaintenanceAsset maintenance 182.5 448.3 483.2 381.0 230.8 1,725.6 348.9 2,074.5 16.2 2,070.3 15.2
AMD management � � � � � � � � � � �
Replacement 180.6 141.7 191.5 95.4 61.6 670.8 224.1 894.9 7.0 1,144.8 8.4
Subtotal 363.1 590.0 674.7 476.3 292.4 2,396.4 573.1 2,969.5 23.1 3,215.1 23.7Portfolio enhancement 532.2 1,073.1 1,592.2 1,593.1 1,128.1 5,918.7 3,942.1 9,860.8 76.9 10,366.1 76.3
Total 895.2 1,663.1 2,266.8 2,069.4 1,420.5 8,315.1 4,515.2 12,830.3 100.0 13,581.2 100.0
Note: Figures are rounded and the sum of the amounts may not correspond to the total indicated.
2.5.2 Authorized and announced projects of $20.0 million or more, by progress status
In progress(contributions in millions of dollars)
Name Note Region
Contribution by Québec8
Contributionby
partnersTotalcostBefore
2021-2022
2020-2030 QIPTotal
2021-2022 2022-2031 Total
1 Métro de Montréal. voitures demétro AZUR � Remplacement
1 06 1,389.6 16.8 119.5 136.2 1,525.8 507.8 2,033.6
2 Métro de Montréal. voitures demétro AZUR additionnelles� Acquisition
1 06 162.4 91.1 47.4 138.5 300.9 279.8 580.7
3 Métro de Montréal. programmeRéno-Systèmes (phase IV)� Maintien et bonification
1 06 181.0 66.4 146.8 213.2 394.1 175.9 570.0
4 Garage Côte-Vertu de la STM �Montréal � Construction 06 186.7 40.8 99.8 140.6 327.3 193.8 521.1
5 Métro de Montréal. programmeRéno-Systèmes (phase III)� Maintien et bonification
1 06 224.1 7.4 31.2 38.6 262.7 237.3 500.0
6 Centre de transport Bellechassede la STM � Montréal �Construction
2 06 68.3 107.4 83.7 191.1 259.4 110.9 370.3
7 Métro de Montréal. programmeAccessibilité des stations(phase I) � Bonification
1 06 63.8 90.5 108.6 199.1 262.9 96.2 359.1
8 Centre d�entretien Pointe-Saint-Charles d�exo � Montréal �Construction
06 184.7 2.9 21.4 24.3 209.1 102.6 311.7
9 Métro de Montréal. programmeRéno-Infrastructures (phase II)� Maintien et bonification
1 06 125.0 33.0 53.8 86.8 211.8 88.2 300.0
10 Complexe Crémazie de la STM� Montréal � Reconstruction
1 06 78.0 6.4 6.4 12.7 90.7 163.8 254.5
208855 001-164 int 4C_OK-Proofs.pdf_PG 104_Mars 21, 2021_18:27:44

Sect
ion
PUBLIC TRANSIT SECTOR B
Planned Investments B.59by Sector
Name Note Region
Contribution by Québec8
Contributionby
partnersTotalcostBefore
2021-2022
2020-2030 QIPTotal
2021-2022 2022-2031 Total
11 Métro de Montréal, programmeRéno-Infrastructures (phase I)� Maintien et bonification
1 06 166.0 11.2 � 11.2 177.2 72.8 250.0
12 Édicule et passerellepiétonnière au pôle multimodalVendôme � Montréal �Construction
06 67.9 8.1 34.4 42.5 110.3 � 110.3
13 Réseau de train de banlieued�exo, voitures passagers(type 2000) � Régionmétropolitaine de Montréal �Remplacement
06 44.0 21.2 9.2 30.4 74.4 28.8 103.2
14 Centre de transport Anjou de laSTM � Montréal �Agrandissement
2 06 40.7 14.6 2.8 17.5 58.2 20.8 79.0
15 Centre de transport Legendrede la STM � Montréal �Agrandissement
2 06 38.5 13.8 2.7 16.5 54.9 19.7 74.6
16 Centre d�attachement Viau de laSTM � Montréal �Agrandissement
2 06 0.8 19.3 3.8 23.1 23.9 47.4 71.3
17 Métro de Montréal, voitures demétro MR-73 � Maintien etbonification
1 06 33.8 8.3 8.2 16.5 50.2 18.8 69.0
18 Centre de transport Saint-Laurent de la STM � Montréal �Agrandissement
2 06 33.9 12.2 2.3 14.6 48.5 17.3 65.8
19 Réseau de train de banlieued�exo, voitures passagers (type2000) � Région métropolitainede Montréal � Acquisition
2 06 21.3 16.3 11.6 27.9 49.2 16.4 65.6
20 Service rapide par bus intégrésur le boulevard Pie-IX entreMontréal et Laval �Aménagement et construction
06-13 104.2 88.0 152.6 240.6 344.8 127.7 472.5
Total 3,214.7 675.7 946.2 1,621.9 4,836.3 2,326.0 7,162.3
Note : Les sommes ayant été arrondies, leur addition peut ne pas correspondre à la somme indiquée.
208855 001-164 int 4C_OK-Proofs.pdf_PG 105_Mars 21, 2021_18:27:44

PUBLIC TRANSIT SECTOR B
B.60 2021-2031 QuébecInfrastructure Plan
In planning
Name Note Region
1 Centre opérationnel Lebourgneuf du RTC � Québec � Agrandissement et réaménagement 4 03
2 Réseau structurant de transport en commun de la Ville de Québec � Construction 03
3 Tunnel entre Québec et Lévis (volet transport collectif) � Construction 03-12
4 Centre d�attachement nord-ouest de la STM � Montréal � Construction 06
5 Centre de transport de l�Est de la STM � Montréal � Construction 06
6 Centres de transport de la STM, programme d�électrification (phase I) � Montréal � Bonification et maintien 4 06
7 Garage au centre d�entretien Lachine d�exo � Montréal � Construction 4 06
8 Gare Lucien-L�Allier d�exo, quais � Montréal � Reconstruction 4 06
9 Métro de Montréal, ligne bleue de la station Saint-Michel à Anjou � Prolongement 06
10 Métro de Montréal, portes palières sur la ligne orange (phase I) � Acquisition 06
11 Métro de Montréal, postes abaisseurs pour l�alimentation électrique (phase I) � Réfection 06
12 Métro de Montréal, programme Accessibilité des stations (phase II) � Bonification 06
13 Métro de Montréal, programme Réno-Infrastructures (phase III) � Maintien et bonification 06
14 Métro de Montréal, programme Réno-Systèmes (phase V) � Maintien et bonification 06
15 Métro de Montréal, système de contrôle des trains sur la ligne bleue � Remplacement 06
16 Réseau de train de banlieue d�exo, locomotives diesel � Région métropolitaine de Montréal � Remplacement 06
17 Centre de transport de la STO - Gatineau � Agrandissement 4 07
18 Centre de transport de la STO, électrification � Gatineau � Agrandissement 4 07
19 Voies réservées du Rapibus de la STO (phase II) � Gatineau � Prolongement 4 07
20 Voies réservées du Rapibus de la STO (phase III) � Gatineau � Prolongement 07
21 Centre de services au Terminus Lagueux de la STLévis � Lévis - Construction 4 12
22 Mesures prioritaires pour le transport collectif sur le boulevard Guillaume-Couture � Lévis � Aménagement 12
23 Garage de la STL (phase IV) � Laval � Construction 13
24 Mesures prioritaires pour le transport collectif sur le boulevard Le Corbusier � Laval � Aménagement 4 13
25 Centre d�exploitation de Saint-Hubert du RTL � Longueuil � Construction 4 16
26 Centre d�exploitation de Saint-Hubert du RTL � Longueuil � Réfection 16
27 Centre d�exploitation du Vieux-Longueuil du RTL (phase I) � Longueuil � Réfection 16
28 Centre d�exploitation du Vieux-Longueuil du RTL (phase II) � Longueuil � Réfection 4 16
29 Gares de L�Île�Perrot d�exo � Montérégie � Réfection 4 16
30 Terminus Châteauguay d�exo, quais � Réfection 4 16
31 Voies réservées sur les boulevards Quartier Sud et Rome � Brossard et Longueuil � Aménagement 4 16
Gouvernement du Québec contribution set out in the 2021-2031 QIP $7,771.7 M
208855 001-164 int 4C_OK-Proofs.pdf_PG 106_Mars 21, 2021_18:27:44

Sect
ion
PUBLIC TRANSIT SECTOR B
Planned Investments B.61by Sector
Under study (projects of $100 million or more)
Name Note Region
1 Centre d�exploitation du RTC � Québec � Bonification 03
2 Centre Métrobus du RTC � Québec � Bonification 03
3 Projet structurant de transport collectif électrique pour relier le Sud-Ouest de Montréal au centre-ville � Bonification 06
4 Projets structurants de transport collectif électrique pour prolonger le REM vers le centre de Laval et relier l�Est etl�Ouest de Laval � Bonification
06-13
5 Projet structurant de transport collectif électrique entre l�ouest de Gatineau et le centre-ville d�Ottawa � Bonification 07
6 Projet structurant de transport collectif de type service rapide par bus dans l�axe des boulevards Notre-Dame et dela Concorde � Laval � Bonification
13
7 Projets structurants de transport collectif électrique dans les axes du boulevard Taschereau et du prolongement dela ligne jaune du réseau de métro � Bonification
16
Contribution by the Gouvernement du Québec planned in the 2021-2031 QIP (cost of studies) $366.1 M
Contribution by the Gouvernement du Québec planned for the 2021-2031 QIP for other projects and envelopes $3,070.6 M
Total for the sector $12,830.3 M
1 The infrastructure concerned with this project is partially or fully in service.2 Since publication of the 2020-2030 QIP, these projects have changed progress status in the list of published projects, moving from "in planning" to
"in progress".3 Since publication of the 2020-2030 QIP, these projects have changed progress status in the list of published projects, moving from "under study"
to "in planning".4 Since publication of the 2020-2030 QIP, these projects have been added to "in planning".5 Since publication of the 2020-2030 QIP, these projects have been added to "under study".6 Since publication of the 2020-2030 QIP, these projects have been added to "in progress".7 Since publication of the 2020-2030 QIP, these projects have changed progress status in the list of published projects, moving from "under study"
to "in progress".8 The contribution of the Gouvernement du Québec to projects in the �Public Transit� sector is assumed by the Land Transportation Network Fund.
Projects removed from the list of published projects in the 2021-2031 QIP
Name Note Region
1 Mesures prioritaires pour l�interconnexion du transport en commun entre Québec et Lévis � Québec � Bonification 2 03
2 Autobus hybrides de douze mètres de la STM � Montréal � Remplacement 1 06
3 Centre de transport Bellechasse de la STM � Montréal � Acquisition 3 06
4 Programme d�entretien des infrastructures de la STM (phase II) � Montréal � Maintien 4 06
5 Projet structurant de transport collectif électrique pour relier l�Est et le Nord-Est de Montréal au centre-ville � Bonification 5 06
6 REM, équipements de billettique � Région métropolitaine de Montréal � Acquisition 6 06
7 Autoroute 15, voies réservées � Laval - Bonification 7 13
8 Garage du RTL � Longueuil � Construction 8 16
9 Projet structurant de transport collectif électrique pour relier le REM sur la Rive-Sud pour desservir le secteur deChambly�Saint-Jean-sur-Richelieu � Bonification
9 16
10 UAB sur l�autoroute 30 entre Candiac et Boucherville � Aménagement 10 16
1 The infrastructure is in service and no investment is planned for the 2021-2031 period.2 This project is integrated with project no 2 from the "Under study" list of projects for the Road network sector.3 This project is integrated with project no 6 from the list of projects "in planning".4 This project has been removed because recurring investment programs do not constitute an infrastructure project.5 This project has been removed because CDPQ Infra has confirmed its interest in taking over and the Government has granted management to it.6 This project has been removed because equipment does not constitute an infrastructure project.7 This project is integrated with project no 54 from the "in planning" list of projects for the Road network sector.8 This project has been removed because the space needs have been integrated in project no 25 from the "in planning" list.9 This project has been removed because the need will be fulfilled by the implementation of project no 56 from the "icn planning" list for the Road
network sector.10 This project has been removed because its cost is now estimated to be below $20 million and the infrastructure is in service.
208855 001-164 int 4C_OK-Proofs.pdf_PG 107_Mars 21, 2021_18:27:44

PUBLIC TRANSIT SECTOR B
B.62 2021-2031 QuébecInfrastructure Plan
Projects managed by CDPQ Infra are outside the QIP, since the Government contributes in the form ofacquisition of ownership equity with return. The QIP presents infrastructure investments, not holdings. Asthe "Transformative electric public transit project to link the east and northeast of Montréal to downtown -Enhancement", including management, will be consigned to CDPQ Infra, it has been removed by the PQI.However, some amounts are available to the QIP for starting the analysis of needs tied to the revitalizationof the Rue Notre Dame, in order to determine whether a new project should be studied later.
208855 001-164 int 4C_OK-Proofs.pdf_PG 108_Mars 21, 2021_18:27:44
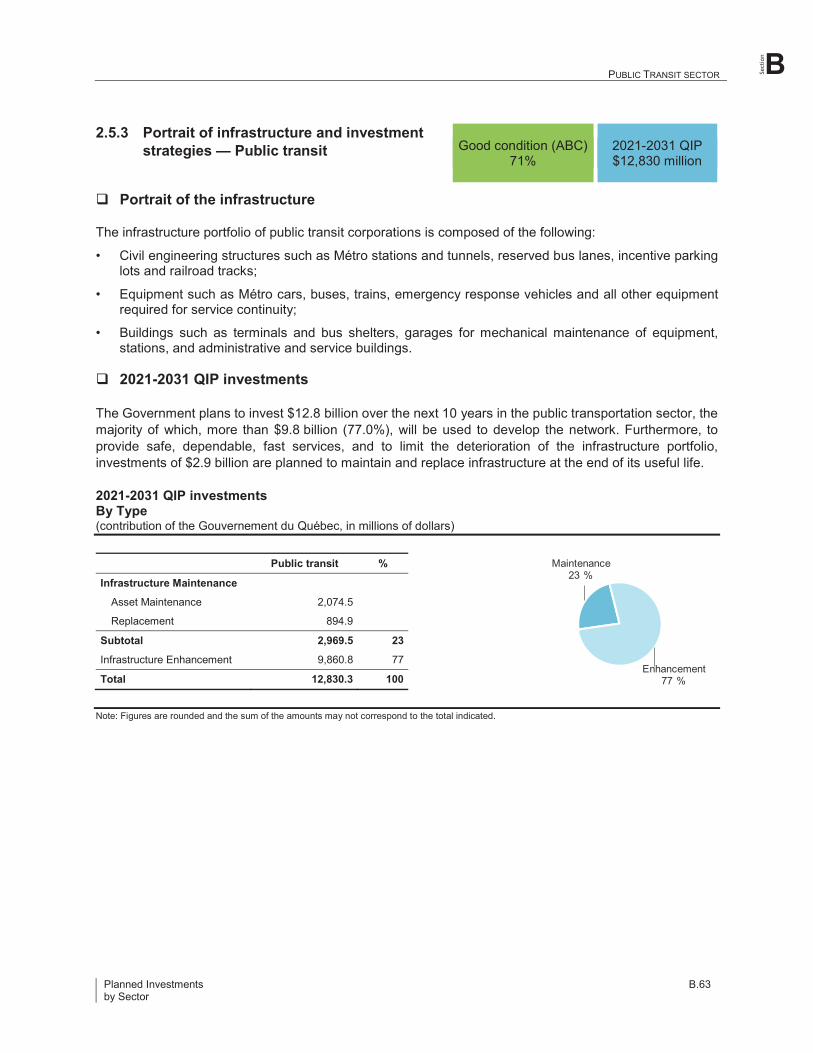
Sect
ion
PUBLIC TRANSIT SECTOR B
Planned Investments B.63by Sector
Maintenance23 %
Enhancement77 %
2.5.3 Portrait of infrastructure and investmentstrategies � Public transit
Portrait of the infrastructure
The infrastructure portfolio of public transit corporations is composed of the following:
� Civil engineering structures such as Métro stations and tunnels, reserved bus lanes, incentive parkinglots and railroad tracks;
� Equipment such as Métro cars, buses, trains, emergency response vehicles and all other equipmentrequired for service continuity;
� Buildings such as terminals and bus shelters, garages for mechanical maintenance of equipment,stations, and administrative and service buildings.
2021-2031 QIP investments
The Government plans to invest $12.8 billion over the next 10 years in the public transportation sector, themajority of which, more than $9.8 billion (77.0%), will be used to develop the network. Furthermore, toprovide safe, dependable, fast services, and to limit the deterioration of the infrastructure portfolio,investments of $2.9 billion are planned to maintain and replace infrastructure at the end of its useful life.
2021-2031 QIP investmentsBy Type(contribution of the Gouvernement du Québec, in millions of dollars)
Public transit %
Infrastructure MaintenanceAsset Maintenance 2,074.5
Replacement 894.9
Subtotal 2,969.5 23
Infrastructure Enhancement 9,860.8 77
Total 12,830.3 100
Note: Figures are rounded and the sum of the amounts may not correspond to the total indicated.
Good condition (ABC)71%
2021-2031 QIP$12,830 million
208855 001-164 int 4C_OK-Proofs.pdf_PG 109_Mars 21, 2021_18:27:44

PUBLIC TRANSIT SECTOR B
B.64 2021-2031 QuébecInfrastructure Plan
Investment strategy to maintain the infrastructure
Condition indicator
The majority of the infrastructure portfolio of public transit corporations is in good condition(GCI of A, B or C). This situation illustrates the efforts made by these corporations to maintain and developinfrastructure that delivers an efficient and a quality of service that meet the needs of Quebecers.
The portfolio maintenance strategy is based on the following priorities:
� Offer safe, high-quality services that endorse the current standards;
� Maintain existing assets in good condition (GCI of A, B or C) with continuous replacement andrefurbishment of equipment, transportation equipment and infrastructure that has reached the end ofits useful life.
In concrete terms, the key investment projects planned to maintain the portfolio aim to:
� Replace fixed Métro equipment, including escalators, ventilation, elevators and train control equipment;
� Perform general repairs to critical civil engineering structures such as electrical, mechanical andstructural systems;
� Reconstruct and upgrade buildings such as the Société de transport de Montréal's Complexe Crémazieand the Réseau de transport de Longueuil operations centre in Saint-Hubert;
� Replace transportation equipment, including trains, Métro cars and buses.
Investment strategy to enhance the infrastructure
The investment strategy to enhance public transport infrastructure consists in developing a network thatbrings solutions to congestion issues and addresses environmental concerns by reducing GHG emissions.
This strategy reinforces the 2030 Plan for a Green Economy and the 2021-2026 implementation planunveiled in November 2020 by the Gouvernement du Québec. The 2030 Plan for a Green Economy, whichrepresents the electrification and climate change policy framework, engages Québec in an ambitious projectthat lays the foundation for a green economy, resilient in the face of climate change, and more prosperousby 2030.
The investments allocated in the 2021-2031 QIP will contribute to achieving the objective of the 2030 Planfor a Green Economy of reducing the carbon footprint of each transport mode and will address the followingpriorities:
� Network expansion, primarily by:
Building a structuring public transit network in Québec City;
Adding an electric structuring public transport mode between Gatineau's west end and downtownOttawa;
Extending the Montréal Métro blue line from Saint-Michel station to Anjou.
A42 %
B17 %
C12 %
D18 %
E11 %Public transit
71 %
208855 001-164 int 4C_OK-Proofs.pdf_PG 110_Mars 21, 2021_18:27:44

Sect
ion
PUBLIC TRANSIT SECTOR B
Planned Investments B.65by Sector
� Service optimization by enhancing the technical and operational features of existing infrastructures:
Construction of new bus lanes;
Ticket booth automation;
Improvement of universal accessibility to public transit networks;
Addition of smart screens displaying bus arrival times in real time.
Furthermore, these investments are key elements that will help in attaining, by 2030, several targets of theGouvernement du Québec's Sustainable Mobility Policy � 2030, such as:
� Provide 70.0% of Quebecers with access to at least four sustainable mobility services;
� Reduce the average travel time between home and work by 20%;
� Reduce solo car trips throughout Québec by 20%;
� Reduce oil consumption in the transportation sector by 40% below the 2013 level;
� Reduce GHG emissions in the transportation sector by 37.5% below the 1990 level.
208855 001-164 int 4C_OK-Proofs.pdf_PG 111_Mars 21, 2021_18:27:44

MUNICIPALITIES SECTOR B
B.66 2021-2031 QuébecInfrastructure Plan
2.6 Municipalities
2.6.1 2021-2031 QIP investments
2021-2031 QIP Investments for the SectorBy Type and by Year(contribution of the Gouvernement du Québec, in millions of dollars and as a percentage)
2021-2031 QIP 2020-2030 QIP
Investment type 2021-2022
2022-2023
2023-2024
2024-2025
2025-2026 Subtotal
2026-2027 to2030-2031
5 yearsTotal % Total %
InfrastructuremaintenanceAsset maintenance 286.3 317.6 371.5 513.1 533.6 2,022.1 3,125.0 5,147.1 68.0 6,097.0 80.9
AMD management � � � � � � � � � � �
Replacement 200.0 261.9 264.4 162.0 191.0 1,079.2 531.4 1,610.6 21.3 763.6 10.1
Subtotal 486.3 579.5 635.8 675.1 724.6 3,101.4 3,656.4 6,757.8 89.3 6,860.5 91.0Portfolio enhancement 180.3 165.7 153.4 119.4 56.1 674.9 136.8 811.7 10.7 675.9 9.0
Total 666.6 745.2 789.3 794.5 780.7 3,776.3 3,793.2 7,569.5 100.0 7,536.5 100.0
Note: Figures are rounded and the sum of the amounts may not correspond to the total indicated.
2.6.2 Authorized and announced projects of $20.0 million or more, by progress status
In progress(contributions in millions of dollars)
Name Note Region
Contribution by QuébecContribution
bypartners
Totalcost
Before2021-2022
2021-2031 QIPTotal2021-
20222022-2031 Total
1 Centre de glaces � Québec� Construction
03 21.3 1.6 � 1.6 22.9 45.1 68.0
2 Écoquartier, îlot central dutechnopôle Angus � Montréal �Construction
2 06 13.1 2.7 4.7 7.4 20.5 229.5 250.0
3 Station d�épuration des eaux uséesJean-R.-Marcotte, unité dedésinfection � Montréal� Construction
06 26.0 37.8 � 37.8 63.8 86.3 150.0
4 Bassins de rétention des eauxusées Rockfield, Lavigne, Leduc etWilliam � Montréal � Construction
06 40.9 8.4 � 8.4 49.3 98.7 148.0
5 Oratoire Saint-Joseph � Montréal� Construction et réaménagement
06 10.7 11.0 9.1 20.1 30.8 48.4 79.2
6 Station de traitement des eauxusées, usine de productiond�oxygène � Montréal �Construction
6 06 0.5 4.3 8.9 13.2 13.7 18.5 32.1
7 Aéroport régional de Rouyn-Noranda � Agrandissement etréfection
08 9.9 2.5 � 2.5 12.4 24.8 37.2
8 Station d�épuration des eaux usées� Saint-Hyacinthe � Réfection
6 16 0.1 5.4 7.1 12.5 12.6 18.9 31.5
9 Réseau d�eau potable et d�eauxusées � Léry (secteur est) �Agrandissement et construction
16 0.1 10.0 10.2 20.2 20.3 10.1 30.4
Total 122.6 83.7 40.0 123.7 246.3 580.3 826.4
208855 001-164 int 4C_OK-Proofs.pdf_PG 112_Mars 21, 2021_18:27:44

Sect
ion
MUNICIPALITIES SECTOR B
Planned Investments B.67by Sector
In planning
Name Note Region
1 Bassins de rétention des eaux usées (Ouvrage Saint-Thomas) � Montréal � Construction 4 06
2 Bassins de rétention des eaux usées (ouvrage Turcot) � Montréal � Construction 4 06
3 Ouvrage de protection contre les inondations � Montréal (arrondissement Pierrefonds-Roxboro) � Construction 4 06
4 Ouvrage de protection contre les inondations � Rivière des Mille Îles � Construction 06
5 Ouvrage de protection contre les inondations � Lac des Deux Montagnes � Construction 06
6 Ouvrage de rétention � Ruisseau Wabassee � Construction 4 07
7 Réservoir Beaudet � Victoriaville � Réfection et construction 4 17
Contribution by the Gouvernement du Québec forecast for the 2021-2031 QIP $157.3 M
Contribution by the Gouvernement du Québec forecast for the 2021-2031 QIP for other projects and envelopes $7,288.5 M
Total for the sector $7,569.5 M
1 The infrastructure concerned with this project is partially or fully in service.2 Since publication of the 2020-2030 QIP, these projects have changed progress status in the list of published projects, moving from "in planning" to
"in progress".3 Since publication of the 2020-2030 QIP, these projects have changed progress status in the list of published projects, moving from "under study"
to "in planning".4 Since publication of the 2020-2030 QIP, these projects have been added to "in planning".5 Since publication of the 2020-2030 QIP, these projects have been added to "under study".6 Since publication of the 2020-2030 QIP, these projects have been added to "in progress".7 Since publication of the 2020-2030 QIP, these projects have changed progress status in the list of published projects, moving from "under study"
to "in progress".
Projects removed from the list of published projects in the 2021-2031 QIP
Name Note Region
1 Stations de traitement d�eau potable � Shawinigan � Construction 1 04
2 Gare de triage d�Outremont � Montréal � Réaménagement 1 06
3 Quartier des spectacles � Montréal � Réaménagement 1 06
4 Usine Atwater, prise d�eau potable � Montréal � Reconstruction 1 06
5 Aréna et glaces communautaires � Gatineau � Construction 1 07
6 Station d�épuration des eaux usées � Gatineau � Construction et reconstruction 1 07
7 Digue � Sainte-Marthe-sur-le-Lac � Réfection et construction 1 15
8 Réseau d�eaux pluviales � Saint-Lambert (rue Riverside) � Construction 1 16
1 The infrastructure is in service and no investment is planned for the 2021-2031 period.
208855 001-164 int 4C_OK-Proofs.pdf_PG 113_Mars 21, 2021_18:27:44

MUNICIPALITIES SECTOR B
B.68 2021-2031 QuébecInfrastructure Plan
2.6.3 Portrait of infrastructure portfolio andinvestment strategies � Municipalities
Portrait of the infrastructure
The infrastructure portfolio for municipal water and sewer infrastructures essentially consists of:
� 4,012 drinking water supply and production facilities
� 5,587 wastewater/stormwater treatment facilities
� 97,829 kilometres of drinking, rain and wastewater pipes
� 40,330 kilometres of roadways above pipes
2021-2031 QIP investments
The Government plans to invest over $7.5 billion in the next 10 years in the Municipalities sector, 89.0% ofwhich, or over $6.7 billion, will be dedicated to maintenance of the portfolio.
Most of the investments in portfolio maintenance projects will be allocated to repair or upgrade to standardsdrinking water and wastewater treatment facilities, or to replace water infrastructure, such as:
� Station d�épuration des eaux usées � Gatineau � Construction et reconstruction;
� Renouvellement de conduites � Sherbrooke;
� Station d�épuration des eaux usées Jean-R. Marcotte, unité de désinfection � Montréal � Construction;
� Bassins de rétention des eaux usées � Montréal � Construction.
In addition to these water infrastructure projects, investments are also planned to support completion ofcertain projects dedicated to municipal services including cultural, community, sports and leisure services.
Furthermore, to respond to new needs, investments of $0.8 billion are planned to enhance the infrastructureportfolio, such as:
� Mise en place d�un réseau d�égout sanitaire et prolongement du réseau d�aqueduc situé autour du lacà la Tortue � Shawinigan;
� Centre de glaces � Québec � Construction;
� Colisée de Trois-Rivières � Construction.
Good condition (ABC)82%
2021-2031 QIP$7,570.0 million
208855 001-164 int 4C_OK-Proofs.pdf_PG 114_Mars 21, 2021_18:27:44

Sect
ion
MUNICIPALITIES SECTOR B
Planned Investments B.69by Sector
Maintenance89 %
Enhancement11 %
2021-2031 QIP investmentsby Type(contribution of the Gouvernement du Québec, in millions of dollars)
Municipalities %
Infrastructure Maintenance
Asset Maintenance 5,147.1
Replacement 1,610.6
Subtotal 6,757.8 89
Infrastructure Enhancement 811.7 11
Total 7,569.5 100
Note: Figures are rounded and the sum of the amounts may not correspond to the total indicated.
Investment strategy to enhance the infrastructure
Condition indicator
In the process that led to the Portrait des infrastructures en eau des municipalités du Québec6, the CERIUcollected data from municipalities regarding the condition of their water and wastewater infrastructure. Oncecompleted, this portrait specified the highest-priority needs of municipalities that will require investment overthe next few years. The MAMH takes these high-priority needs into account in its financial assistanceprograms and investment priorities.
The portrait produced in 2020 indicates that 82% of the water infrastructure of municipalities is in goodcondition (GCI of A, B or C). This situation illustrates the positive impact that subsidy programs have hadon maintaining their condition. Despite this overall satisfactory assessment, 18% of the water and sewerinfrastructure in Québec municipalities is in poor or very poor condition (GCI of D or E) and will requiremajor investments to restore them to good condition (GCI of A, B or C). Furthermore, special attention mustbe paid to the significant amount of aging infrastructure with a moderate risk of failure (GCI of C) to ensurethat its service life is extended.
The MAMH's investment strategy thus materializes in the development and implementation of financialassistance programs to:
� Meet municipalities' highest-priority needs so they can maintain the basic services provided by theirwater and sewer infrastructure, thereby contributing to quality of life of their citizens;
� Allow municipalities to manage the accrued AMD for their water and sewer infrastructure;
� Prioritize projects that address regulatory compliance and public health and safety issues;
6 https://ceriu.qc.ca/bibliotheque/rapport-annuel-2020-du-portrait-infrastructures-eau-municipalites-du-quebec-piemq
A35 %
B28 %
C20 %
D7 %
E11 %Municipalities
82 %
208855 001-164 int 4C_OK-Proofs.pdf_PG 115_Mars 21, 2021_18:27:44

MUNICIPALITIES SECTOR B
B.70 2021-2031 QuébecInfrastructure Plan
� Ensure transparent and fair treatment of financial assistance applications from municipalities;
� Require municipalities to carry out a minimum amount of intervention on their own water infrastructure,without resorting to government subsidies.
To achieve its objectives, the MAMH relies on the terms and conditions of financial assistance programsthat set out the rules and assessment criteria that guide the MAMH when evaluating applications forassistance, in order to give priority to projects aimed at regulatory compliance or at rehabilitating poorinfrastructure.
Specifically, in 2019-2020, the MAMH announced two new programs making available $4.9 billion in totalgovernment financial assistance (from both Canada and Québec) to support high-priority municipalprojects. These programs are TECQ 2019-2023 ($3.4 billion) and FIMEAU ($1.5 billion).
Lastly, MAMH financial assistance programs provide additional financial support to smaller municipalitiesto help them carry out their investment projects, since they often have major needs but limited financialresources. These projects are often technically complex, so MAMH guides municipalities toward plausibleand cost-effective solutions to achieve the desired results.
208855 001-164 int 4C_OK-Proofs.pdf_PG 116_Mars 21, 2021_18:27:44

Sect
ion
GOVERNMENT ADMINISTRATION SECTOR B
Planned Investments B.71by Sector
2.7 Governmental administration
2.7.1 2021-2031 QIP investments
2021-2031 QIP Investments for the SectorBy Type and by Year(contribution of the Gouvernement du Québec, in millions of dollars and as a percentage)
2021-2031 QIP 2020-2030 QIP
Investment type 2021-2022
2022-2023
2023-2024
2024-2025
2025-2026 Subtotal
2026-2027 to2030-2031
5 yearsTotal % Total %
Infrastructuremaintenance
Asset maintenance 84.0 146.4 167.3 171.4 117.2 686.3 774.4 1,460.7 34.8 1,109.1 28.3
AMD management 39.5 62.8 47.7 24.3 19.7 194.0 62.9 257.0 6.1 399.8 10.2
Replacement 49.0 59.7 53.1 41.3 40.2 243.3 178.4 421.7 10.0 398.1 10.2
Subtotal 172.5 268.9 268.1 237.1 177.1 1,123.6 1,015.8 2,139.4 51.0 1,907.1 48.7
Portfolio enhancement 241.3 373.1 268.6 225.9 200.8 1,309.7 748.7 2,058.4 49.0 2,012.5 51.3
Total 413.8 642.0 536.7 462.9 377.9 2,433.4 1,764.5 4,197.9 100.0 3,919.6 100.0
Note: Figures are rounded and the sum of the amounts may not correspond to the total indicated.
2.7.2 Authorized and announced projects of $20.0 million or more, by progress status
In progress(contributions in millions of dollars)
Name Note Region
Contribution by QuébecContribution
bypartners
TotalcostBefore
2021-2022
2021-2031 QIPTotal
2021-2022 2022-2031 Total
1 Palais de justice de Roberval � Réfectionet agrandissement 02 19.5 15.8 30.8 46.6 66.2 � 66.2
2 Édifice Marie-Guyart, stationnement �Québec � Réfection
1 03 48.4 5.6 � 5.6 54.0 � 54.0
3 Édifice du 1000, rue Fullum, bloc C �Montréal � Réfection et réaménagement 6 06 3.7 11.5 60.7 72.2 75.9 � 75.9
4 ComplexeDesjardins � Montréal � Réaménagement
2 06 0.4 3.7 33.6 37.4 37.8 � 37.8
5 Palais de justice de Rouyn-Noranda �Agrandissement et réaménagement 6 08 0.1 1.0 83.9 84.9 85.0 � 85.0
6 Bâtiment d�hébergement temporaire �Puvirnituq � Agrandissement
10 13.0 9.9 � 9.9 23.0 � 23.0
7 Centre de services régionaux duministère des Transports � Gaspé� Acquisition et réaménagement
6 11 2.3 5.0 15.6 20.6 22.9 � 22.9
8 Palais de justice de Saint-Hyacinthe �Réaménagement
2 16 9.6 12.4 100.0 112.4 122.0 � 122.0
Total 97.0 64.9 324.6 389.6 486.8 � 486.8
Note: Figures are rounded and the sum of the amounts may not correspond to the total indicated.
208855 001-164 int 4C_OK-Proofs.pdf_PG 117_Mars 21, 2021_18:27:44
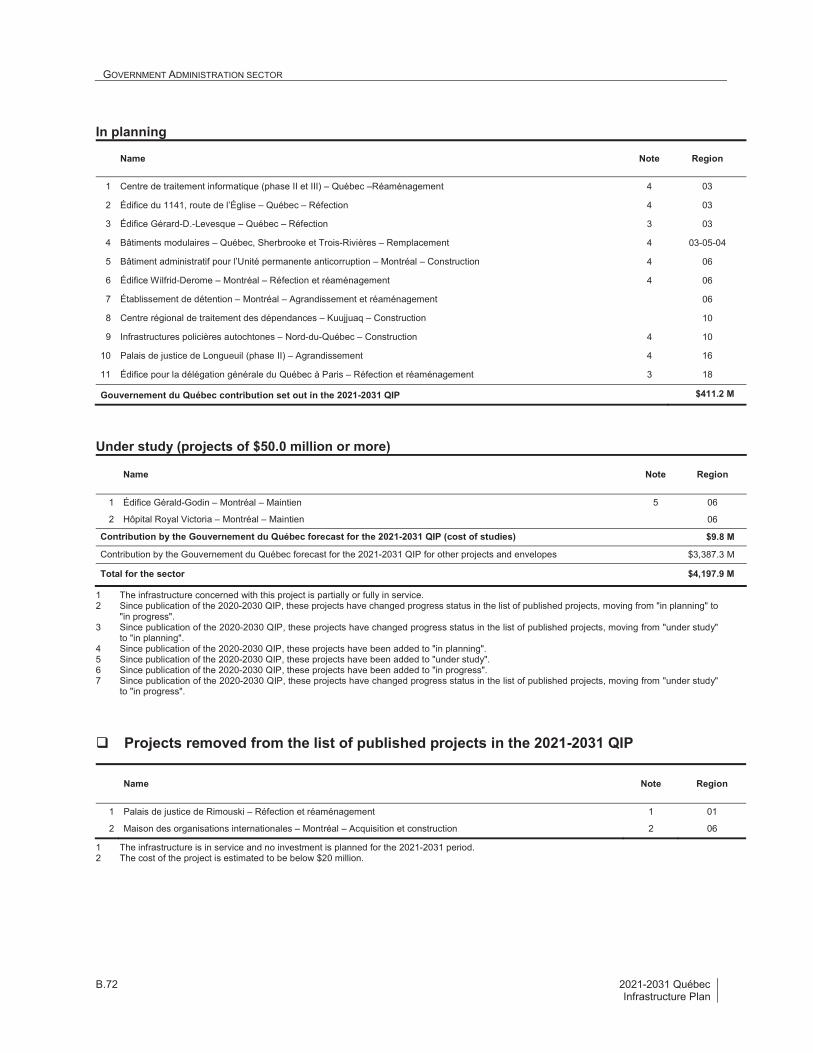
GOVERNMENT ADMINISTRATION SECTOR B
B.72 2021-2031 QuébecInfrastructure Plan
In planning
Name Note Region
1 Centre de traitement informatique (phase II et III) � Québec �Réaménagement 4 03
2 Édifice du 1141, route de l�Église � Québec � Réfection 4 03
3 Édifice Gérard-D.-Levesque � Québec � Réfection 3 03
4 Bâtiments modulaires � Québec, Sherbrooke et Trois-Rivières � Remplacement 4 03-05-04
5 Bâtiment administratif pour l�Unité permanente anticorruption � Montréal � Construction 4 06
6 Édifice Wilfrid-Derome � Montréal � Réfection et réaménagement 4 06
7 Établissement de détention � Montréal � Agrandissement et réaménagement 06
8 Centre régional de traitement des dépendances � Kuujjuaq � Construction 10
9 Infrastructures policières autochtones � Nord-du-Québec � Construction 4 10
10 Palais de justice de Longueuil (phase II) � Agrandissement 4 16
11 Édifice pour la délégation générale du Québec à Paris � Réfection et réaménagement 3 18
Gouvernement du Québec contribution set out in the 2021-2031 QIP $411.2 M
Under study (projects of $50.0 million or more)
Name Note Region
1 Édifice Gérald-Godin � Montréal � Maintien 5 06
2 Hôpital Royal Victoria � Montréal � Maintien 06
Contribution by the Gouvernement du Québec forecast for the 2021-2031 QIP (cost of studies) $9.8 M
Contribution by the Gouvernement du Québec forecast for the 2021-2031 QIP for other projects and envelopes $3,387.3 M
Total for the sector $4,197.9 M
1 The infrastructure concerned with this project is partially or fully in service.2 Since publication of the 2020-2030 QIP, these projects have changed progress status in the list of published projects, moving from "in planning" to
"in progress".3 Since publication of the 2020-2030 QIP, these projects have changed progress status in the list of published projects, moving from "under study"
to "in planning".4 Since publication of the 2020-2030 QIP, these projects have been added to "in planning".5 Since publication of the 2020-2030 QIP, these projects have been added to "under study".6 Since publication of the 2020-2030 QIP, these projects have been added to "in progress".7 Since publication of the 2020-2030 QIP, these projects have changed progress status in the list of published projects, moving from "under study"
to "in progress".
Projects removed from the list of published projects in the 2021-2031 QIP
Name Note Region
1 Palais de justice de Rimouski � Réfection et réaménagement 1 01
2 Maison des organisations internationales � Montréal � Acquisition et construction 2 06
1 The infrastructure is in service and no investment is planned for the 2021-2031 period.2 The cost of the project is estimated to be below $20 million.
208855 001-164 int 4C_OK-Proofs.pdf_PG 118_Mars 21, 2021_18:27:44

Sect
ion
GOVERNMENT ADMINISTRATION SECTOR B
Planned Investments B.73by Sector
Maintenance58 %
Enhancement42 %
2.7.3 Portrait of infrastructure and investmentstrategies � Société québécoise desinfrastructures
Portrait of the infrastructure
The SQI's wholly-owned building inventory comprises 370 buildings and civil engineering structurestotalling more than 1.9 million square metres of leasing area. Across Québec, there are:
� 62 office buildings used for government administration;
� 43 courthouses
� 14 detention facilities
� 74 Sûreté du Québec police stations
� 159 other specialized buildings, transportation centres, conservatories of music and dramatic art,laboratories, warehouses, non-rental or surplus buildings;
� 18 underground parking facilities and tunnels.
Other infrastructure of this sector comprises buildings, furniture and equipment belonging to over100 government organizations, including the ARQ, RAMQ and Héma-Québec.
2021-2031 QIP investments
Investments provided for in the 2021-2031 QIP for the SQI ensure a balance between amounts to maintainand those to enhance the infrastructure portfolio. This level of investment will enable the SQI to continueimplementing the Government's real estate vision and exercising its strategic role in maintaining anddeveloping the properties it operates.
For other bodies, the planned investments mainly aim at the acquisition or replacement of various types ofequipment.
2021-2031 QIP investmentsBy Type of investment and Body(contribution of the Gouvernement du Québec, in millions of dollars and percentage)
SQI % Other Total
Infrastructure Maintenance
Asset Maintenance 1,331.4 129.2 1,460.7
AMD 257.0 � 257.0Replacement 81.2 340.5 421.7
Subtotal 1,669.7 58 469.7 2,139.4
Infrastructure Enhancement 1,189.6 42 868.0 2,058.4
Total 2,859.3 100 1,337.8 4,197.9
Note: Figures are rounded and the sum of the amounts may not correspond to the total indicated.
Good condition (ABC)61% 2021-2031 QIP
$4,198 millionAMD$609 million
208855 001-164 int 4C_OK-Proofs.pdf_PG 119_Mars 21, 2021_18:27:44

GOVERNMENT ADMINISTRATION SECTOR B
B.74 2021-2031 QuébecInfrastructure Plan
Investment strategy to maintain the infrastructure
Condition indicator
SQI infrastructure management practices and investment choices in the past made it possible to maintainthe majority of buildings and parking facilities in good condition (GCI of A, B or C) to an overall level of 61%.
The SQI investment strategy, which is based on best practices for building operation and workplace design,aims to maintain the real estate portfolio under its responsibility in good condition. To this end, the SQIimplements various strategies to optimize infrastructure maintenance investments, such as grouping workon several sites into a single integrated project to optimize contractual management and thereby achieveeconomies of scale. In addition, building operation teams make it a priority to perform preventivemaintenance in order to extend the useful life of assets and lessen the need for asset maintenance.
To ensure the sustainability of the infrastructure portfolio, the SQI 2021-2031 QIP anticipates investmentsof close to $1.7 billion over 10 years to maintain government buildings. The aim of these investments is to:
� Offer Government bodies across Québec buildings and workspaces that improve their productivity andenable them to better provide their services to Quebecers;
� Ensure healthy, comfortable and safe conditions for occupancy are maintained while preserving andoptimally managing the real estate assets;
� Contribute to achieving Government orientations, particularly regarding sustainable development, thefight against climate change, construction material use and management, and the promotion of culturalheritage.
In this regard, the SQI has set the following objective:
� Achieve a proportion of rental buildings in good condition (GCI of A, B or C) of 71% by March 2024.
Investment strategy to manage the AMD
AMD management
The current AMD assessed on SQI infrastructure amounts to $608.5 million. This AMD level is explainedprimarily by the advanced age of several leasing buildings for which many components have reached theend of their useful life.
A28 %
B15 %
C18 %
D29 %
E10 %SQI
61 %
$257M42 %
$352M58 %$609M
AMD of SQI :AMD Addressed Remaining AMD
208855 001-164 int 4C_OK-Proofs.pdf_PG 120_Mars 21, 2021_18:27:44

Sect
ion
GOVERNMENT ADMINISTRATION SECTOR B
Planned Investments B.75by Sector
In order to address the AMD, the SQI is planning interventions targeting infrastructure in poor or very poorcondition (GCI of D or E) to carry out work that will improve their condition and reduce their AMD.
Concretely, $257.0 million in investments planned in the 2021-2031 QIP over the next 10 years will reducethe current AMD of $608.5 million by 42%. Furthermore, projects under study will be allocated investmentsprogressively in upcoming QIP as these investment will also contribute to addressing the AMD.
AMD investments will be as follows:
� Work required on building exteriors, such as curtain walls and the architectural components of certainoffice buildings and courthouses;
� Various upgrades, such as the replacement or addition of systems to protect people and assets, thereplacement of cooling systems or the completion of work to comply with various codes;
� Required upgrade and renovation work on certain detention facilities;
� Replacement of obsolete mechanical and electrical components;
� Replacement of abrasive warehouses that have reached the end of their useful life in several Ministèrede Transport service centres;
� The sale of surplus buildings in poor condition.
Although it is foreseeable that certain older buildings will accumulate AMD in the coming years due tonatural deterioration, the SQI has set the following objective:
� By March 2026, reduce the AMD of all infrastructures to $458.5 million, a decrease of $150.0 million(25% of the cumulative AMD) 7.
Investment strategy to enhance the infrastructure
The investment strategy to enhance the SQI real estate portfolio is based on the changing needs of publicbodies and the increase in the proportions of owned buildings to reduce the Government's cost of rentingover the long term. To this end, $1.2 billion allocated to enhance the portfolio over 10 years will, in particular,make it possible to:
� Acquire new properties to reduce the leasing area of the real estate portfolio;
� Construct new facilities or redesign existing building to improve regional services, in particular,construction of new Sûreté du Québec police stations and major renovations of various courthouses;
� Invest in existing buildings to optimize energy consumption and cut the use of fossil fuels in order tomeet the GHG reduction targets;
� Contribute to the electrification of transportation by installing charging stations in the parking facilitiesof buildings under SQI responsibility.
7 This objective does not take into account the future natural deterioration of infrastructures.
208855 001-164 int 4C_OK-Proofs.pdf_PG 121_Mars 21, 2021_18:27:44
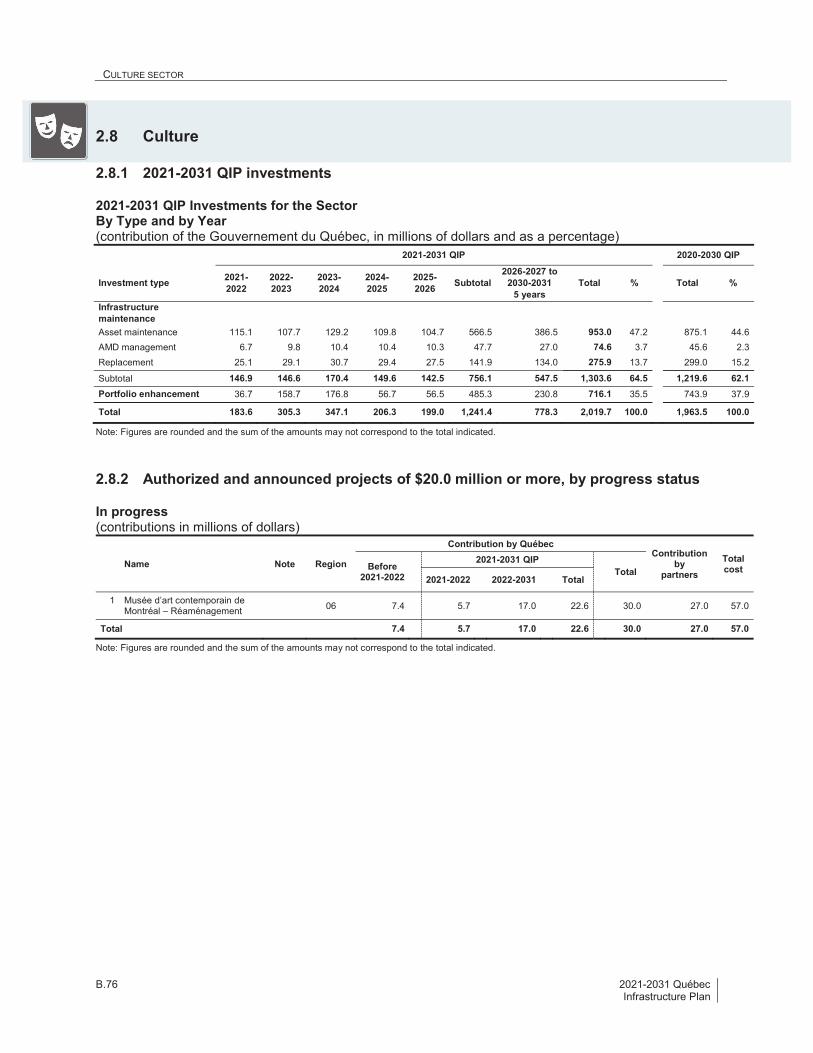
CULTURE SECTOR B
B.76 2021-2031 QuébecInfrastructure Plan
2.8 Culture
2.8.1 2021-2031 QIP investments
2021-2031 QIP Investments for the SectorBy Type and by Year(contribution of the Gouvernement du Québec, in millions of dollars and as a percentage)
2021-2031 QIP 2020-2030 QIP
Investment type 2021-2022
2022-2023
2023-2024
2024-2025
2025-2026 Subtotal
2026-2027 to2030-2031
5 yearsTotal % Total %
InfrastructuremaintenanceAsset maintenance 115.1 107.7 129.2 109.8 104.7 566.5 386.5 953.0 47.2 875.1 44.6
AMD management 6.7 9.8 10.4 10.4 10.3 47.7 27.0 74.6 3.7 45.6 2.3
Replacement 25.1 29.1 30.7 29.4 27.5 141.9 134.0 275.9 13.7 299.0 15.2
Subtotal 146.9 146.6 170.4 149.6 142.5 756.1 547.5 1,303.6 64.5 1,219.6 62.1Portfolio enhancement 36.7 158.7 176.8 56.7 56.5 485.3 230.8 716.1 35.5 743.9 37.9
Total 183.6 305.3 347.1 206.3 199.0 1,241.4 778.3 2,019.7 100.0 1,963.5 100.0
Note: Figures are rounded and the sum of the amounts may not correspond to the total indicated.
2.8.2 Authorized and announced projects of $20.0 million or more, by progress status
In progress(contributions in millions of dollars)
Name Note Region
Contribution by QuébecContribution
bypartners
TotalcostBefore
2021-2022
2021-2031 QIPTotal
2021-2022 2022-2031 Total
1 Musée d�art contemporain deMontréal � Réaménagement 06 7.4 5.7 17.0 22.6 30.0 27.0 57.0
Total 7.4 5.7 17.0 22.6 30.0 27.0 57.0
Note: Figures are rounded and the sum of the amounts may not correspond to the total indicated.
208855 001-164 int 4C_OK-Proofs.pdf_PG 122_Mars 21, 2021_18:27:44

Sect
ion
CULTURE SECTOR B
Planned Investments B.77by Sector
In planning
Name Note Region
1 Centre des collections et de conservation de Montréal � Construction 06
2 Musée de l�Holocauste Montréal � Construction 4 06
3 Théâtre du Nouveau Monde � Montréal � Réfection et Agrandissement 06
4 Bâtiment culturel multifonctionnel � Laval � Construction 4 13
5 Complexe culturel � Longueuil � Construction 16
6 Réseau d�infrastructures culturelles � Régions administratives du Québec � Construction 4 All
Contribution by the Gouvernement du Québec forecast for the 2021-2031 QIP $337.0 M
Contribution by the Gouvernement du Québec forecast for the 2021-2031 QIP for other projects and envelopes $1,660.1 M
Total for the sector $2,019.7 M
1 The infrastructure concerned with this project is partially or fully in service.2 Since publication of the 2020-2030 QIP, these projects have changed progress status in the list of published projects, moving from "in planning" to
"in progress".3 Since publication of the 2020-2030 QIP, these projects have changed progress status in the list of published projects, moving from "under study"
to "in planning".4 Since publication of the 2020-2030 QIP, these projects have been added to "in planning".5 Since publication of the 2020-2030 QIP, these projects have been added to "under study".6 Since publication of the 2020-2030 QIP, these projects have been added to "in progress".7 Since publication of the 2020-2030 QIP, these projects have changed progress status in the list of published projects, moving from "under study"
to "in progress".
Project removed from the list of published projects in the 2021-2031 QIP
Name Note Region
1 Grand Théâtre de Québec � Réfection 1 03
1 The infrastructure is in service and no investment is planned for the 2021-2031 period.
208855 001-164 int 4C_OK-Proofs.pdf_PG 123_Mars 21, 2021_18:27:44

DEVELOPMENT OF SPORT SECTOR B
B.78 2021-2031 QuébecInfrastructure Plan
2.9 Development of sport
2.9.1 2021-2031 QIP investments
2021-2031 QIP Investments for the SectorBy Type and by Year(contribution of the Gouvernement du Québec, in millions of dollars and as a percentage)
2021-2031 QIP 2020-2030 QIP
Investment type 2021-2022
2022-2023
2023-2024
2024-2025
2025-2026 Subtotal
2026-2027 to2030-2031
5 yearsTotal % Total %
InfrastructuremaintenanceAsset maintenance 8.8 5.0 5.0 5.0 5.0 28.8 10.0 38.8 5.3 71.4 10.9
AMD management � � � � � � � � � � �
Replacement � � � � � � � � � � �
Subtotal 8.8 5.0 5.0 5.0 5.0 28.8 10.0 38.8 5.3 71.4 10.9Portfolio enhancement 83.4 97.3 87.5 72.0 61.8 402.0 290.5 692.5 94.7 581.9 89.1
Total 92.1 102.3 92.5 77.0 66.8 430.8 300.5 731.3 100.0 653.3 100.0
Note: Figures are rounded and the sum of the amounts may not correspond to the total indicated.
2.9.2 Authorized and announced projects of $20.0 million or more, by progress status
In progress(contributions in millions of dollars)
Name Note Region
Contribution by QuébecContribution
bypartners
TotalcostBefore
2021-2022
2021-2031 QIPTotal
2021-2022 2022-2031 Total
1 Centre multisport � Saguenay �Construction 02 0.8 1.0 5.7 6.7 7.5 16.7 24.2
2 Centre sportif et communautaire� Mont-Royal � Construction
06 0.6 1.4 1.0 2.4 3.0 43.9 46.9
Total 1.4 2.4 6.7 9.1 10.5 60.6 71.1
Note: Figures are rounded and the sum of the amounts may not correspond to the total indicated.
208855 001-164 int 4C_OK-Proofs.pdf_PG 124_Mars 21, 2021_18:27:44

Sect
ion
DEVELOPMENT OF SPORT SECTOR B
Planned Investments B.79by Sector
In planning
Name Note Region
1 Complexe aquatique et récréatif � Montréal (arrondissement Pierrefonds-Roxboro) � Construction 06
2 Maison du loisir et du sport � Montréal � Construction 4 06
3 Complexe sportif multifonctionnel � Saint-Jérôme � Construction 15
4 Complexe multisport � Sainte-Catherine � Construction 16
5 Complexe sportif Girardin� Drummondville � Construction 17
Contribution by the Gouvernement du Québec forecast for the 2021-2031 QIP $48.6 M
Contribution by the Gouvernement du Québec forecast for the 2021-2031 QIP for other projects and envelopes $673.6 M
Total for the sector $731.3 M
1 The infrastructure concerned with this project is partially or fully in service.2 Since publication of the 2020-2030 QIP, these projects have changed progress status in the list of published projects, moving from "in planning" to
"in progress".3 Since publication of the 2020-2030 QIP, these projects have changed progress status in the list of published projects, moving from "under study"
to "in planning".4 Since publication of the 2020-2030 QIP, these projects have been added to "in planning".5 Since publication of the 2020-2030 QIP, these projects have been added to "under study".6 Since publication of the 2020-2030 QIP, these projects have been added to "in progress".7 Since publication of the 2020-2030 QIP, these projects have changed progress status in the list of published projects, moving from "under study"
to "in progress".
Project removed from the list of published projects in the 2021-2031 QIP
Name Note Region
1 Aréna Raymond-Bourque � Montréal � Réfection 1 06
1 The infrastructure is in service and no investment is planned for the 2021-2031 period.
208855 001-164 int 4C_OK-Proofs.pdf_PG 125_Mars 21, 2021_18:27:44

MARINE, AIR, RAIL AND OTHER TRANSPORTATION SECTOR B
B.80 2021-2031 QuébecInfrastructure Plan
2.10 Marine, air, rail and other transportation
2.10.1 2021-2031 QIP investments
2021-2031 QIP Investments for the SectorBy Type and by Year(contribution of the Gouvernement du Québec, in millions of dollars and as a percentage)
2021-2031 QIP 2020-2030 QIP
Investment type 2021-2022
2022-2023
2023-2024
2024-2025
2025-2026 Subtotal
2026-2027 to2030-2031
5 yearsTotal % Total %
InfrastructuremaintenanceAsset maintenance 209.8 343.2 295.4 263.0 112.8 1,224.1 295.6 1,519.7 42.5 1,994.6 49.2
AMD management 22.1 10.2 2.2 5.6 5.5 45.7 29.2 74.9 2.1 56.4 1.4
Replacement 21.4 42.0 37.2 29.7 11.5 141.8 3.8 145.5 4.1 154.2 3.8
Subtotal 253.3 395.4 334.8 298.3 129.8 1,411.6 328.6 1,740.2 48.7 2,205.2 54.4Portfolio enhancement 203.4 335.1 351.6 300.3 193.8 1,384.2 447.3 1,831.5 51.3 1,848.7 45.6
Total 456.7 730.5 686.4 598.6 323.6 2,795.8 775.9 3,571.7 100.0 4,053.9 100.0
Note: Figures are rounded and the sum of the amounts may not correspond to the total indicated.
2.10.2 Authorized and announced projects of $20.0 million or more, by progress status
In progress(contributions in millions of dollars)
Name Note Region
Contribution by QuébecContribution
bypartners
TotalcostBefore
2021-2022
2021-2031 QIPTotal
2021-2022 2022-2031 Total
1 NM Saaremaa I � Traverses del�est du Québec � Acquisition etréfection
1 01-03 45.8 3.0 � 3.0 48.8 � 48.8
2 Aérogare de Salluit et garage �Construction
1 10 31.2 2.9 � 2.9 34.1 � 34.1
3 Aérogare Kangiqsujuaq etgarage � Réfection 10 0.1 � 27.2 27.2 27.3 � 27.3
4 Réseau ferroviaire de laGaspésie entre Caplan et Port-Daniel�Gascons � Réfection etreconstruction
11 28.3 52.2 16.4 68.6 96.9 2.0 98.9
5 Réseau ferroviaire de laGaspésie entre Matapédia etCaplan � Réfection etreconstruction
1 11 20.1 11.2 23.2 34.4 54.5 � 54.5
6 Parcs routiers, aire de service �Lavaltrie � Réfection
14 10.7 4.1 2.3 6.4 17.1 5.0 22.1
7 Équipement avionique desavions CL415 � Plusieursrégions administratives �Modernisation
All 16.7 7.1 32.4 39.5 56.2 � 56.2
Total 152.9 80.5 101.5 182.0 334.9 7.0 341.9
Note: Figures are rounded and the sum of the amounts may not correspond to the total indicated.
208855 001-164 int 4C_OK-Proofs.pdf_PG 126_Mars 21, 2021_18:27:44

Sect
ion
MARINE, AIR, RAIL AND OTHER TRANSPORTATION SECTOR B
Planned Investments B.81by Sector
In planning
Name Note Region
1 Réseau ferroviaire, pont � Dolbeau-Mistassini � Construction 4 02
2 NM Joseph-Savard � Traverse L�Isle-aux-Coudres�Saint-Joseph-de-la-Rive � Réfection et réaménagement 03
3 Port de Québec, terminal de conteneurs (site Laurentia) � Construction 4 03
4 Navires � Traverses du centre du Québec � Acquisition 03-09-12-14-16
5 Pont des Grandes-Fourches au-dessus de la rivière Magog � Sherbrooke � Construction 4 05
6 Réseau ferroviaire, voie de contournement � Lac-Mégantic � Construction 05
7 Boulevard La Vérendrye entre le boulevard Gréber et la montée Paiement (phase I) et entre le boulevard Labrosse et leboulevard Lorrain (phase II) � Gatineau � Élargissement
4 07
8 Chemin Pink entre le boulevard des Grives et la rue Vanier � Gatineau � Élargissement 4 07
9 Aérogare Kangiqsualujjuaq et garage � Réfection 4 10
10 Réseau ferroviaire de la Gaspésie entre Port-Daniel�Gascons et Gaspé � Réfection et reconstruction 11
11 Chemin de fer Québec Central entre Vallée-Jonction et Thetford Mines � Réfection et reconstruction 4 12
12 Port de Montréal, terminal de conteneurs (site Contrec�ur) � Construction 4 16
13 Avion-ambulance � Régions administratives du Québec � Acquisition et réaménagement 4 All
14 Hélicoptères � Régions administratives du Québec � Acquisition 4 All
Gouvernement du Québec contribution set out in the 2021-2031 QIP $724.5 M
Under study (projects of $50.0 million or more)
Name Note Region
1 Infrastructures portuaires � Lien fluvial entre le Bas-Saint-Laurent et Charlevoix � Maintien et bonification 5 01-03
2 Infrastructures portuaires � Traverse L�Isle-aux-Coudres�Saint-Joseph-de-la-Rive � Maintien et bonification 5 03
3 Infrastructures portuaires � Traverse Sorel-Tracy�Saint-Ignace-de-Loyola � Bonification 14-16
4 Pôle logistique � Vaudreuil-Soulanges � Bonification 16
Contribution by the Gouvernement du Québec forecast for the 2021-2031 QIP (cost of studies) $6.9 M
Contribution by the Gouvernement du Québec forecast for the 2021-2031 QIP for other projects and envelopes $2,658.3 M
Total for the sector $3,571.7 M
1 The infrastructure concerned with this project is partially or fully in service.2 Since publication of the 2020-2030 QIP, these projects have changed progress status in the list of published projects, moving from "in planning" to
"in progress".3 Since publication of the 2020-2030 QIP, these projects have changed progress status in the list of published projects, moving from "under study"
to "in planning".4 Since publication of the 2020-2030 QIP, these projects have been added to "in planning".5 Since publication of the 2020-2030 QIP, these projects have been added to "under study".6 Since publication of the 2020-2030 QIP, these projects have been added to "in progress".7 Since publication of the 2020-2030 QIP, these projects have changed progress status in the list of published projects, moving from "under study"
to "in progress".
208855 001-164 int 4C_OK-Proofs.pdf_PG 127_Mars 21, 2021_18:27:44

TOURISM AND RECREATIONAL ACTIVITIES SECTOR B
B.82 2021-2031 QuébecInfrastructure Plan
2.11 Tourism and recreational activities
2.11.1 2021-2031 QIP investments
2021-2031 QIP Investments for the SectorBy Type and by Year(contribution of the Gouvernement du Québec, in millions of dollars and as a percentage)
2021-2031 QIP 2020-2030 QIP
Investment type 2021-2022
2022-2023
2023-2024
2024-2025
2025-2026 Subtotal
2026-2027 to2030-2031
5 yearsTotal % Total %
InfrastructuremaintenanceAsset maintenance 83.6 72.2 158.1 72.7 29.9 416.4 100.7 517.2 42.6 333.1 29.0
AMD management 76.5 27.6 24.1 16.4 15.3 159.9 106.3 266.2 21.9 133.1 11.6
Replacement 4.8 2.0 � � � 6.7 � 6.7 0.6 210.6 18.3
Subtotal 164.8 101.8 182.2 89.1 45.2 583.1 207.0 790.1 65.1 676.8 58.9Portfolio enhancement 159.4 183.4 46.4 27.3 1.2 417.7 5.8 423.5 34.9 471.7 41.1
Total 324.3 285.1 228.6 116.4 46.4 1,000.8 212.8 1,213.6 100.0 1,148.5 100.0
Note: Figures are rounded and the sum of the amounts may not correspond to the total indicated.
2.11.2 Authorized and announced projects of $20.0 million or more, by progress status
In progress(contributions in millions of dollars)
Name Note Region
Contribution by QuébecContribution
bypartners
TotalcostBefore
2021-2022
2021-2031 QIPTotal
2021-2022 2022-2031 Total
1 Zoo de Saint-Félicien, Centre deconservation de la biodiversité boréale(CCBB) inc.� Construction et acquisition
1 02 22.8 3.2 � 3.2 26.0 6.5 32.5
2 Promenade Samuel-De Champlain(phase III) � Québec � Construction
03 52.0 70.1 59.7 129.7 181.7 11.6 193.3
3 Installations d�accueil des croisiéristesinternationaux � Québec � Construction etacquisition
03 14.2 0.8 � 0.8 15.0 15.0 30.0
4 Nouvelles-Casernes � Québec � Réfection 03 13.0 3.6 3.4 7.0 20.0 1.0 21.0
5 Station touristique Owl�s Head �Mansonville � Construction et acquisition 1 05 2.1 5.5 12.8 18.3 20.4 141.5 161.9
6 Stade olympique, espaces touristiques de laTour � Montréal � Réfection
6 06 2.9 25.0 2.1 27.1 30.0 � 30.0
7 Stade olympique, funiculaire � Montréal �Réfection 2 06 2.7 20.5 1.8 22.3 25.0 � 25.0
8 Parc national d�Opémican � Laniel �Construction
1 08 26.5 4.4 5.1 9.5 36.0 � 36.0
9 Bromont, montagne d�expériences �Construction et acquisition 1 16 2.2 4.1 3.3 7.4 9.6 66.1 75.7
10 Zoo de Granby � Construction et acquisition 1 16 7.9 3.6 6.5 10.1 18.0 18.0 36.0
11 Parc Safari � Saint-Bernard-de-Lacolle �Construction et acquisition 1 16 9.2 2.8 � 2.8 12.0 12.0 24.0
Total 155.5 143.6 94.7 238.2 393.7 271.7 665.4
Note: Figures are rounded and the sum of the amounts may not correspond to the total indicated.
208855 001-164 int 4C_OK-Proofs.pdf_PG 128_Mars 21, 2021_18:27:44

Sect
ion
TOURISM AND RECREATIONAL ACTIVITIES SECTOR B
Planned Investments B.83by Sector
In planning
Name Note Region
1 Stade olympique, dalle � Montréal � Réfection 4 06
2 Stade olympique, espaces locatifs � Montréal � Réfection 4 06
3 Stade olympique, toiture � Montréal � Reconstruction 06
4 Route panoramique entre Saint-Donat et Saint-Michel-des-Saints � Réfection 4 14
Gouvernement du Québec contribution set out in the 2021-2031 QIP $277.5 M
Under study (projects of $50.0 million or more)
Name Note Region
1 Aquarium du Québec, pavillon des prédateurs � Québec � Bonification 03
2 Palais des congrès de Montréal � Bonification 06
Contribution by the Gouvernement du Québec forecast for the 2021-2031 QIP (cost of studies) $4.3 M
Contribution by the Gouvernement du Québec forecast for the 2021-2031 QIP for other projects and envelopes $693.6 M
Total for the sector $1,213.6 M
1 The infrastructure concerned with this project is partially or fully in service.2 Since publication of the 2020-2030 QIP, these projects have changed progress status in the list of published projects, moving from "in planning" to
"in progress".3 Since publication of the 2020-2030 QIP, these projects have changed progress status in the list of published projects, moving from "under study"
to "in planning".4 Since publication of the 2020-2030 QIP, these projects have been added to "in planning".5 Since publication of the 2020-2030 QIP, these projects have been added to "under study".6 Since publication of the 2020-2030 QIP, these projects have been added to "in progress".7 Since publication of the 2020-2030 QIP, these projects have changed progress status in the list of published projects, moving from "under study"
to "in progress".
Project removed from the list of published projects in the 2021-2031 QIP
Name Note Region
1 Gare maritime et jetée Alexandra � Montréal � Agrandissement et réfection 1 06
1 The infrastructure is in service and no investment is planned for the 2021-2031 period.
208855 001-164 int 4C_OK-Proofs.pdf_PG 129_Mars 21, 2021_18:27:44

SOCIAL AND COMMUNITY HOUSING SECTOR B
B.84 2021-2031 QuébecInfrastructure Plan
2.12 Social and community housing
2.12.1 2021-2031 QIP investments
2021-2031 QIP Investments for the SectorBy Type and by Year
(contribution of the Gouvernement du Québec, in millions of dollars and as a percentage)2021-2031 QIP 2020-2030 QIP
Investment type 2021-2022
2022-2023
2023-2024
2024-2025
2025-2026 Subtotal
2026-2027 to2030-2031
5 yearsTotal % Total %
InfrastructuremaintenanceAsset maintenance 120.3 125.9 96.8 103.7 111.1 557.9 651.8 1,209.7 45.8 1,198.3 47.7
AMD management 21.0 21.9 16.9 18.1 19.4 97.2 113.6 210.8 8.0 180.5 7.2
Replacement 2.9 0.2 � � � 3.1 � 3.1 0.1 � �
Subtotal 144.2 148.0 113.7 121.8 130.5 658.2 765.4 1,423.6 53.8 1,378.8 54.9Portfolio enhancement 277.5 312.6 249.7 85.2 85.0 1,010.1 210.5 1,220.6 46.2 1,131.2 45.1
Total 421.7 460.7 363.4 207.0 215.5 1,668.3 975.9 2,644.2 100.0 2,510.0 100.0
Note: Figures are rounded and the sum of the amounts may not correspond to the total indicated.
208855 001-164 int 4C_OK-Proofs.pdf_PG 130_Mars 21, 2021_18:27:44

Sect
ion
NORTHERN DEVELOPMENT SECTOR B
Planned Investments B.85by Sector
2.13 Northern development
2.13.1 2021-2031 QIP investments
2021-2031 QIP Investments for the SectorBy Type and by Year(contribution of the Gouvernement du Québec, in millions of dollars and as a percentage)
2021-2031 QIP 2020-2030 QIP
Investment type 2021-2022
2022-2023
2023-2024
2024-2025
2025-2026 Subtotal
2026-2027 to2030-2031
5 yearsTotal % Total %
InfrastructuremaintenanceAsset maintenance 83.1 49.2 44.1 40.9 15.6 233.0 58.2 291.2 32.4 306.0 33.7
AMD management � � � � � � � � � � �
Replacement � � � � � � � � � � �
Subtotal 83.1 49.2 44.1 40.9 15.6 233.0 58.2 291.2 32.4 306.0 33.7Portfolio enhancement 76.5 71.2 75.5 70.5 38.1 331.8 276.4 608.2 67.6 602.1 66.3
Total 159.7 120.5 119.5 111.4 53.7 564.8 334.6 899.4 100.0 908.0 100.0
Note: Figures are rounded and the sum of the amounts may not correspond to the total indicated.
2.13.2 Authorized and announced projects of $20.0 million or more, by progress status
In progress(contributions in millions of dollars)
Name Note Region
Contribution by QuébecContribution
bypartners
TotalcostBefore
2021-2022
2021-2031 QIPTotal
2021-2022 2022-2031 Total
1 Installations de la Société ferroviaireet portuaire de Pointe-Noire �Réaménagement et construction
1 09 60.0 20.0 � 20.0 80.0 100.0 180.0
2 Route Billy-Diamond (Route de laBaie-James) � Nord-du-Québec �Réfection
10 119.7 54.5 48.4 102.9 222.7 111.2 333.9
3 Réseau de télécommunication �Nunavik � Construction 10 20.5 36.0 6.1 42.1 62.6 63.1 125.7
Total 200.2 110.5 54.5 165.0 365.3 274.3 639.6
Note: Figures are rounded and the sum of the amounts may not correspond to the total indicated.
208855 001-164 int 4C_OK-Proofs.pdf_PG 131_Mars 21, 2021_18:27:44

NORTHERN DEVELOPMENT SECTOR B
B.86 2021-2031 QuébecInfrastructure Plan
In planning
Name Note Region
1 Complexe scientifique de l�Institut nordique du Québec � Québec � Construction 03-06-10
2 Installations de la Société ferroviaire et portuaire de Pointe-Noire (phase 2) � Réaménagement 4 09
3 Route entre Schefferville et Kawawachikamach � Réfection 09
Contribution by the Gouvernement du Québec forecast for the 2021-2031 QIP $104.0 M
Contribution by the Gouvernement du Québec forecast for the 2021-2031 QIP for other projects and envelopes $630.4 M
Total for the sector $899.4 M
1 The infrastructure concerned with this project is partially or fully in service.2 Since publication of the 2020-2030 QIP, these projects have changed progress status in the list of published projects, moving from "in planning" to
"in progress".3 Since publication of the 2020-2030 QIP, these projects have changed progress status in the list of published projects, moving from "under study"
to "in planning".4 Since publication of the 2020-2030 QIP, these projects have been added to "in planning".5 Since publication of the 2020-2030 QIP, these projects have been added to "under study".6 Since publication of the 2020-2030 QIP, these projects have been added to "in progress".7 Since publication of the 2020-2030 QIP, these projects have changed progress status in the list of published projects, moving from "under study"
to "in progress".
Furthermore, over the next year, the Ministère de l�Énergie et des Ressources naturelles will submit anapplication for the study of a new project to the government for approval.
208855 001-164 int 4C_OK-Proofs.pdf_PG 132_Mars 21, 2021_18:27:44

Sect
ion
RESEARCH SECTOR B
Planned Investments B.87by Sector
2.14 Research
2.14.1 2021-2031 QIP investments
2021-2031 QIP Investments for the SectorBy Type and by Year(contribution of the Gouvernement du Québec, in millions of dollars and as a percentage)
2021-2031 QIP 2020-2030 QIP
Investment type 2021-2022
2022-2023
2023-2024
2024-2025
2025-2026 Subtotal
2026-2027 to2030-2031
5 yearsTotal % Total %
InfrastructuremaintenanceAsset maintenance � � � � � � � � � � �
AMD management � � � � � � � � � � �
Replacement � � � � � � � � � � �
Subtotal � � � � � � � � � � �
Portfolio enhancement 162.4 177.3 121.3 81.6 80.9 623.5 360.4 984.0 100.0 1,006.5 100.0
Total 162.4 177.3 121.3 81.6 80.9 623.5 360.4 984.0 100.0 1,006.5 100.0
Note: Figures are rounded and the sum of the amounts may not correspond to the total indicated.
2.14.2 Authorized and announced projects of $20.0 million or more, by progress status
In progress(contributions in millions of dollars)
Name Note Region
Contribution by QuébecContribution
bypartners
TotalcostBefore
2021-2022
2021-2031 QIPTotal
2021-2022 2022-2031 Total
1 Université de Sherbrooke, pavillon demédecine personnalisée et derecherche translationnelle �Construction
05 2.2 6.7 26.6 33.3 35.5 3.9 39.4
2 École de technologie supérieure,pavillon principal � Montréal �Réaménagement
06 6.5 10.2 5.0 15.2 21.8 14.6 36.4
3 Université du Québec à Trois-Rivières,pavillon sur le campus deDrummondville � Construction
6 17 10.0 8.8 0.1 8.9 19.0 12.5 31.5
Total 18.7 25.7 31.7 57.4 76.3 31.0 107.3
Contribution by the Gouvernement du Québec forecast for the 2021-2031 QIP for other projects and envelopes $926.6 M
Total for the sector $984.0 M
Note: Figures are rounded and the sum of the amounts may not correspond to the total indicated.1 The infrastructure concerned with this project is partially or fully in service.2 Since publication of the 2020-2030 QIP, these projects have changed progress status in the list of published projects, moving from "in planning" to
"in progress".3 Since publication of the 2020-2030 QIP, these projects have changed progress status in the list of published projects, moving from "under study"
to "in planning".4 Since publication of the 2020-2030 QIP, these projects have been added to "in planning".5 Since publication of the 2020-2030 QIP, these projects have been added to "under study".6 Since publication of the 2020-2030 QIP, these projects have been added to "in progress".7 Since publication of the 2020-2030 QIP, these projects have changed progress status in the list of published projects, moving from "under study"
to "in progress".
208855 001-164 int 4C_OK-Proofs.pdf_PG 133_Mars 21, 2021_18:27:44

RESEARCH SECTOR B
B.88 2021-2031 QuébecInfrastructure Plan
Projects removed from the list of published projects in the 2021-2031 QIP
Name Note Region
1 Université de Sherbrooke, équipements de recherche sur la prospérité numérique � Sherbrooke � Acquisition 1 05
2 Université McGill, espaces et équipements de recherche � Montréal � Réaménagement et acquisition 1 06
1 The infrastructure is in service and no investment is planned for the 2021-2031 period.
208855 001-164 int 4C_OK-Proofs.pdf_PG 134_Mars 21, 2021_18:27:44

Sect
ion
ENVIRONMENT SECTOR B
Planned Investments B.89by Sector
2.15 Environment
2.15.1 2021-2031 QIP investments
2021-2031 QIP Investments for the SectorBy Type and by Year(contribution of the Gouvernement du Québec, in millions of dollars and as a percentage)
2021-2031 QIP 2020-2030 QIP
Investment type 2021-2022
2022-2023
2023-2024
2024-2025
2025-2026 Subtotal
2026-2027 to2030-2031
5 yearsTotal % Total %
InfrastructuremaintenanceAsset maintenance 35.0 27.4 47.4 40.5 77.6 227.9 376.0 603.9 63.1 541.7 58.2
AMD management 6.1 9.8 11.0 7.8 7.1 41.8 11.6 53.3 5.6 44.5 4.8
Replacement 5.2 20.8 11.5 6.7 6.9 51.0 39.1 90.1 9.4 111.9 12.0
Subtotal 46.3 57.9 69.8 55.0 91.6 320.7 426.6 747.3 78.1 698.1 75.0Portfolio enhancement 46.0 42.7 32.1 8.3 23.1 152.1 58.0 210.1 21.9 232.5 25.0
Total 92.3 100.6 101.9 63.3 114.7 472.8 484.6 957.4 100.0 930.6 100.0
Note: Figures are rounded and the sum of the amounts may not correspond to the total indicated.
2.15.2 Authorized and announced projects of $20.0 million or more, by progress status
In progress(contribution in millions of dollars)
Name Note Region
Contribution by QuébecContribution
bypartners
TotalcostBefore
2021-2022
2021-2031 QIPTotal
2021-2022 2022-2031 Total
1 Usine de biométhanisation � Québec �Construction
2 03 25.8 9.8 8.0 17.8 43.6 174.2 217.9
Total 25.8 9.8 8.0 17.8 43.6 174.2 217.9
Note: Figures are rounded and the sum of the amounts may not correspond to the total indicated.
In planning
Name Note Region
1 Barrage Mathieu-D�Amours � Matane � Reconstruction 01
2 Incinérateur de Québec, valorisation des vapeurs � Construction 03
3 Usine de biométhanisation � Montréal � Construction 06
4 Usine de biométhanisation � Laval � Construction 13
Contribution by the Gouvernement du Québec forecast for the 2021-2031 QIP $108.8 M
Contribution by the Gouvernement du Québec forecast for the 2021-2031 QIP for other projects and envelopes $830.8 M
Total for the sector $957.4 M
1 The infrastructure concerned with this project is partially or fully in service.2 Since publication of the 2020-2030 QIP, these projects have changed progress status in the list of published projects, moving from "in planning" to
"in progress".3 Since publication of the 2020-2030 QIP, these projects have changed progress status in the list of published projects, moving from "under study"
to "in planning".4 Since publication of the 2020-2030 QIP, these projects have been added to "in planning".5 Since publication of the 2020-2030 QIP, these projects have been added to "under study".6 Since publication of the 2020-2030 QIP, these projects have been added to "in progress".7 Since publication of the 2020-2030 QIP, these projects have changed progress status in the list of published projects, moving from "under study"
to "in progress".
208855 001-164 int 4C_OK-Proofs.pdf_PG 135_Mars 21, 2021_18:27:44

AGRICULTURE, FORESTS, FAUNA AND OTHER SECTOR B
B.90 2021-2031 QuébecInfrastructure Plan
2.16 Agriculture, forests, fauna and other
2.16.1 2021-2031 QIP investments
2021-2031 QIP Investments for the SectorBy Type and by Year(contribution of the Gouvernement du Québec, in millions of dollars and as a percentage)
2021-2031 QIP 2020-2030 QIP
Investment type 2021-2022
2022-2023
2023-2024
2024-2025
2025-2026 Subtotal
2026-2027 to2030-2031
5 yearsTotal % Total %
InfrastructuremaintenanceAsset maintenance 30.6 29.8 22.8 15.5 14.1 112.8 118.8 231.6 25.1 208.6 24.7
AMD management � � � � � � � � � � �
Replacement � � � � � � � � � 2.0 0.2
Subtotal 30.6 29.8 22.8 15.5 14.1 112.8 118.8 231.6 25.1 210.6 24.9Portfolio enhancement 139.4 116.7 70.9 76.8 57.0 460.8 231.1 691.9 74.9 634.9 75.1
Total 170.0 146.5 93.8 92.3 71.0 573.7 349.9 923.5 100.0 845.4 100.0
Note: Figures are rounded and the sum of the amounts may not correspond to the total indicated.
2.16.2 Authorized and announced projects of $20.0 million or more, by progress status
In progress(contributions in millions of dollars)
Name Note Region
Contribution by QuébecContribution
bypartners
TotalcostBefore
2021-2022
2021-2031 QIPTotal
2021-2022 2022-2031 Total
1 Réseau de télécommunication par fibreoptique � Eeyou (sud-jamésien) �Construction
4 10 7.9 2.0 � 2.0 10.0 11.2 21.2
Total 7.9 2.0 � 2.0 10.0 11.2 21.2
Contribution by the Gouvernement du Québec forecast for the 2021-2031 QIP for other projects and envelopes $921.5 M
Total for the sector $923.5 M
Note: Figures are rounded and the sum of the amounts may not correspond to the total indicated.1 The infrastructure concerned with this project is partially or fully in service.2 Since publication of the 2020-2030 QIP, these projects have changed progress status in the list of published projects, moving from "in planning" to
"in progress".3 Since publication of the 2020-2030 QIP, these projects have changed progress status in the list of published projects, moving from "under study"
to "in planning".4 Since publication of the 2020-2030 QIP, these projects have been added to "in planning".5 Since publication of the 2020-2030 QIP, these projects have been added to "under study".6 Since publication of the 2020-2030 QIP, these projects have been added to "in progress".7 Since publication of the 2020-2030 QIP, these projects have changed progress status in the list of published projects, moving from "under study"
to "in progress".
Project removed from the list of published projects in the 2021-2031 QIP
Name Note Region
1 Infrastructures numériques � MRC d�Antoine-Labelle � Construction 1 15
1 The infrastructure is in service and no investment is planned for the 2021-2031 period.
208855 001-164 int 4C_OK-Proofs.pdf_PG 136_Mars 21, 2021_18:27:44

Sect
ion
EDUCATIONAL CHILDCARE SERVICES SECTOR B
Planned Investments B.91by Sector
2.17 Educational childcare services
2.17.1 2021-2031 QIP investments
2021-2031 QIP Investments for the SectorBy Type and by Year(contribution of the Gouvernement du Québec, in millions of dollars and as a percentage)
2021-2031 QIP 2020-2030 QIP
Investment type 2021-2022
2022-2023
2023-2024
2024-2025
2025-2026 Subtotal
2026-2027 to2030-2031
5 yearsTotal % Total %
InfrastructuremaintenanceAsset maintenance 9.2 9.7 10.0 9.0 9.0 46.9 44.9 91.8 25.9 91.5 24.4
AMD management � � � � � � � � � � �
Replacement � � � � � � � � � � �
Subtotal 9.2 9.7 10.0 9.0 9.0 46.9 44.9 91.8 25.9 91.5 24.4Portfolio enhancement 41.2 69.6 25.9 0.1 � 136.8 126.4 263.2 74.1 283.3 75.6
Total 50.4 79.3 35.9 9.1 9.0 183.7 171.3 355.0 100.0 374.8 100.0
Note: Figures are rounded and the sum of the amounts may not correspond to the total indicated.
208855 001-164 int 4C_OK-Proofs.pdf_PG 137_Mars 21, 2021_18:27:44

INFORMATION RESOURCES SECTOR B
B.92 2021-2031 QuébecInfrastructure Plan
2.18 Information resources
2.18.1 2021-2031 QIP investments
2021-2031 QIP Investments for the SectorBy Type and by Year(contribution of the Gouvernement du Québec, in millions of dollars and as a percentage)
2021-2031 QIP 2020-2030 QIP
Investment type 2021-2022
2022-2023
2023-2024
2024-2025
2025-2026 Subtotal
2026-2027 to2030-2031
5 yearsTotal % Total %
InfrastructuremaintenanceAsset maintenance 217.3 253.3 232.2 209.1 202.5 1,114.4 1,130.3 2,244.6 31.1 1,934.7 26.2
AMD management � � � � � � � � � � �
Replacement 141.3 176.5 162.6 123.6 95.7 699.7 443.8 1,143.5 15.9 633.8 8.6
Subtotal 358.6 429.7 394.8 332.7 298.2 1,814.0 1,574.1 3,388.1 47.0 2,568.5 34.7Portfolio enhancement 489.3 551.8 429.5 459.9 363.6 2,294.1 1,529.5 3,823.6 53.0 4,825.8 65.3
Total 847.8 981.5 824.3 792.6 661.9 4,108.1 3,103.6 7,211.7 100.0 7,394.3 100.0
Note: Figures are rounded and the sum of the amounts may not correspond to the total indicated.
2.18.2 Authorized8 and announced projects of $20.0 million or more, by progress status
In progress(contributions in millions of dollars)
Name Note Region
Contribution by QuébecContribution
bypartners
TotalcostBefore
2021-2022
2021-2031 QIPTotal
2021-2022 2021-2031 Total
1 Programme de consolidation descentres de traitement informatique etde l�optimisation du traitement et dustockage � ITQ
� 6.6 13.1 138.4 151.5 158.0 � 158.0
2 Système d�information de laboratoireunique � SIL CoreLab � FRISSSS
� 12.7 25.0 33.9 58.9 71.6 � 71.6
3 Université de Sherbrooke � ProjetVéo 2 � 48.9 4.0 3.4 7.4 56.3 � 56.3
4 Système d�information en finance eten ressources humaines � Universitéde Concordia
6 � 40.9 3.0 � 3.0 43.9 � 43.9
5 Mise à niveau de l�infrastructureréseau � Université McGill 6 � 19.5 4.8 7.3 12.0 31.5 � 31.5
6 Gestion partagée de la prestation deservices � MTESS
� 6.3 5.3 16.4 21.7 28.0 � 28.0
7 Facturation obligatoire SolutionÉvolutive � Transport rémunéré depersonnes � ARQ
� 17.3 9.0 � 9.0 26.3 � 26.3
8 SQIN � Accès bonifié aux prestationsélectroniques de services Entrepriseset Citoyens
2 � 7.8 10.6 7.0 17.7 25.5 � 25.5
9 Dépôt des actes de procédures etdes demandes � MJQ 6 � 0.6 9.1 13.7 22.9 23.5 � 23.5
8 Although investments in the "Information Resources" sector are subject to the Public Infrastructure Act, the management of its projects is subject to
the Act respecting the governance and management of the information resources of public bodies and government enterprises.
208855 001-164 int 4C_OK-Proofs.pdf_PG 138_Mars 21, 2021_18:27:44

Sect
ion
INFORMATION RESOURCES SECTOR B
Planned Investments B.93by Sector
Name Note Region
Contribution by QuébecContribution
bypartners
TotalcostBefore
2021-2022
2021-2031 QIPTotal
2021-2022 2021-2031 Total
10 Modernisation du réseau detélécommunication (RÉSUL 5) �Université Laval
6 � 7.2 2.6 6.2 8.7 16.0 5.7 21.7
11 Plateforme partagée de services desbibliothèques universitairesquébécoises � Université deMontréal
6 � 14.3 4.3 2.2 6.5 20.8 � 20.8
Total 182.1 90.8 228.5 319.3 501.4 5.7 507.1
Note: Figures are rounded and the sum of the amounts may not correspond to the total indicated.
In planning
Name Note Region
1 Dossier santé numérique (DSN) 4 �
2 Facturation obligatoire dans le secteur de la restauration et des bars (FO-RB) � ARQ �
3 Modernisation du recouvrement à Revenu Québec � Gérer le dossier de recouvrement 4 �
4 Modernisation du système de mission des Services correctionnels (Horizon) � MSP �
5 Programme visant à moderniser les infrastructures technologiques des donneurs d�ouvrage en construction 4 �
6 Projet Urbain de Radiocommunication (PUR) � ITQ 4 �
7 Solution d�affaires en gestion intégrée des ressources (SAGIR) � Phase SGR7 (Système de paie) �
8 Système unifié d�information en ressources humaines (SIU-RH) � FRISSSS �
Gouvernement du Québec contribution set out in the 2021-2031 QIP $509.3 M
Under study (projects of $50.0 million or more)
Name Note Region
1 Solution d�affaires en gestion intégrée des ressources (SAGIR) � Phase SGR4 (Système de comptabilité) �
Contribution by the Gouvernement du Québec forecast for the 2021-2031 QIP (cost of studies) �
Contribution by the Gouvernement du Québec forecast for the 2021-2031 QIP for other projects and envelopes $6,383.1 M
Total for the sector $7,211.7 M
1 The infrastructure concerned with this project is partially or fully in service.2 Since publication of the 2020-2030 QIP, these projects have changed progress status in the list of published projects, moving from "in planning" to
"in progress".3 Since publication of the 2020-2030 QIP, these projects have changed progress status in the list of published projects, moving from "under study"
to "in planning".4 Since publication of the 2020-2030 QIP, these projects have been added to "in planning".5 Since publication of the 2020-2030 QIP, these projects have been added to "under study".6 Since publication of the 2020-2030 QIP, these projects have been added to "in progress".7 Since publication of the 2020-2030 QIP, these projects have changed progress status in the list of published projects, moving from "under study"
to "in progress".
More information regarding the information resource projects, the Government's online Tableau de borddes projets en ressources informationnelles can be accessed online.9
9 Website: https://www.tableaudebordprojetsri.gouv.qc.ca/tableau-de-bord/
208855 001-164 int 4C_OK-Proofs.pdf_PG 139_Mars 21, 2021_18:27:44

PROBABLE INVESTMENTS FOR 2020-2021 B
B.94 2021-2031 QuébecInfrastructure Plan
3. Update of planned investments for 2020-2021Probable Investments for 2020-2021(contribution of the Gouvernement du Québec, in millions of dollars and as a percentage)
Mission and sectorInfrastructure maintenance Portfolio
enhancement Sub-total
Adjust-ment2 Total
Probablecompletion
rate3Assetmaintenance1
AMDmanagement
Repla-cement
Sub-total
Addition andimprovement
Health and socialservices
Health and socialservices
Forecast 290.8 115.8 495.0 901.6 1,342.1 2,243.6 � 2,243.685.8%Probable 472.8 112.7 593.2 1,178.7 733.3 1,912.1 12.1 1,924.1
Education and Culture
EducationForecast4 677.3 551.3 91.4 1,320.0 817.5 2,137.5 � 2,137.5
95.1%Probable 430.9 290.3 41.0 762.2 1,270.3 2,032.5 � 2,032.5
Higher educationForecast4 357.6 141.6 125.9 625.2 206.2 831.4 � 831.4
122.2%Probable 503.5 162.7 139.6 805.8 206.9 1,012.7 3.7 1,016.4
CultureForecast 76.7 9.0 35.4 121.0 41.8 162.9 � 162.9
101.1%Probable 63.4 8.8 38.5 110.8 53.8 164.6 � 164.6
Development of sportForecast4 38.5 - - 38.5 78.8 117.3 � 117.3
69.2%Probable 30.2 � � 30.2 50.9 81.1 � 81.1Economy andEnvironment
Road networkForecast4 725.9 1,056.2 278.3 2,060.4 481.0 2,541.4 � 2,541.4
92.5%Probable 1,044.0 883.4 � 1,927.4 422.3 2,349.6 � 2,349.6
Public transitForecast4 93.9 - 174.1 268.0 1,428.3 1,696.3 � 1,696.3
61.5%Probable 146.8 � 277.9 424.8 619.0 1,043.8 � 1,043.8Marine, air, rail andother transportation
Forecast4 416.1 10.0 19.8 445.9 241.3 687.2 � 687.264.0%Probable 157.5 4.4 18.5 180.4 259.7 440.1 � 440.1
MunicipalitiesForecast 338.1 - 85.2 423.3 163.7 587.0 � 587.0
99.9%Probable 165.0 � 210.8 375.7 210.5 586.2 � 586.2Tourism andrecreational activities
Forecast 62.3 41.6 9.9 113.7 166.8 280.5 � 280.568.0%Probable 57.8 25.9 5.0 88.8 102.0 190.7 � 190.7
Social and communityhousing
Forecast 116.4 19.6 - 135.9 306.3 442.2 � 442.283.6%Probable 102.8 17.9 12.8 133.6 236.2 369.8 � 369.8
Northern developmentForecast 84.4 - - 84.4 32.5 116.9 � 116.9
85.6%Probable 51.3 � � 51.3 48.8 100.1 � 100.1
ResearchForecast � � � � 175.9 175.9 � 175.9
97.9%Probable � � � � 172.3 172.3 � 172.3
EnvironmentForecast 4.7 8.5 5.8 19.0 38.7 57.7 � 57.7
88.2%Probable 8.1 4.4 3.6 16.2 34.7 50.9 � 50.9Agriculture, forests,fauna and other
Forecast 37.3 - 2.0 39.3 151.9 191.2 � 191.280.1%Probable 25.6 � 2.0 27.6 125.7 153.3 � 153.3
Support for Individualsand Families
Educational childcareservices
Forecast 8.7 - - 8.7 54.5 63.2 � 63.256.0%Probable 10.7 � � 10.7 24.7 35.4 � 35.4
Administration andJustice
Governmentadministration
Forecast 153.9 20.6 39.2 213.7 373.7 587.4 � 587.466.6%Probable 127.6 8.2 30.5 166.3 225.0 391.3 � 391.3
Information resourcesForecast4 256.3 - 114.5 370.7 608.8 979.6 � 979.6
125.7%Probable 342.8 � 205.1 547.9 683.5 1,231.5 � 1,231.5
Central envelopeForecast 5.0 � � 5.0 5.0 10.0 � 10.0
-Probable � � � � � � � �
Total Forecast4 3,744.0 1,974.0 1,476.4 7,194.4 6,714.9 13,909.2 � 13,909.2 88.7%Probable 3,740.9 1,518.7 1,578.6 6,838.2 5,479.7 12,317.9 15.7 12,333.6Note: Figures are rounded and the sum of the amounts may not correspond to the total indicated.1 These funds, along with those allocated for replacement, may contribute to eliminating the AMD.2 The investments presented for 2020-2021 were standardized on the same bases.3 A probable completion rate of over 100% may be explained by work that is ahead of schedule or being completed at a faster rate than anticipated.4 Before moving up investments of $2,901.2 million in 2020-2021, the amount was set at $11,008.0 million as submitted for the 2020-2030 QIP,
namely:$1,560.6 million in Health and Social services, before the moving up of $683.0 million;$1,096.1 million in Education, before the moving up of $1,041.3 million;
208855 001-164 int 4C_OK-Proofs.pdf_PG 140_Mars 21, 2021_18:27:44

Sect
ion
PROBABLE INVESTMENTS FOR 2020-2021 B
Planned Investments B.95by Sector
$731.4 million in Higher Education, before the moving up of $100.0 million;$99.6 million for Development of sport, before the moving up of $17.6 million;$2,271.7 million for the Road network, before the moving up of $269.7 million;$1,082.3 million in Public transit, before the moving up of $614.0 million;$587.2 million in Marine, air, rail and other transportation, before the moving up of $100.0 million;$904.0 million in Information resources, before the moving up of $75.6 million.
208855 001-164 int 4C_OK-Proofs.pdf_PG 141_Mars 21, 2021_18:27:44

INVESTMENTS MADE IN 2019-2020 B
B.96 2021-2031 QuébecInfrastructure Plan
4. Report on investments made in 2019-2020Investments Made in 2019-2020(contribution of the Gouvernement du Québec, in millions of dollars and as a percentage)
Mission and sectorInfrastructure maintenance Enhancement
of the park Sub-total
Adjust-ment2 Total Completion
rate3Assetmaintenance1
AMDmanagement
Repla-cement
Sub-total
Addition andimprovement
Health and socialservices
Health and socialservices
Probable 275.1 107.1 426.8 809.0 773.5 1,582.5 12.0 1,594.596.6%Actual 293.3 142.9 522.3 958.4 562.0 1,520.5 19.3 1,539.8
Education and CultureEducation
Probable 490.1 139.4 34.5 663.9 720.9 1,384.8 � 1,384.8124.8%Actual 827.6 341.9 16.3 1,185.7 542.8 1,728.6 � 1,728.6
Higher educationProbable 478.9 180.6 160.4 819.9 212.9 1,032.8 53.7 1,086.5
61.3%Actual 304.7 119.1 155.6 579.4 83.0 662.4 3.7 666.1
CultureProbable 91.1 18.7 34.7 144.5 37.2 181.7 3.9 185.6
92.6%Actual 85.5 16.9 36.1 138.5 33.3 171.8 � 171.8
Development of sportProbable 29.6 - - 29.6 67.4 97.1 � 97.1
75.6%Actual 22.9 � � 22.9 50.5 73.4 � 73.4Economy andEnvironment
Road networkProbable 705.2 921.1 486.6 2,113.0 439.3 2,552.3 � 2,552.3
93.5%Actual 1,315.8 736.2 0.1 2,052.0 335.6 2,387.6 � 2,387.6
Public transitProbable 149.7 - 251.5 401.2 541.8 943.0 � 943.0
76.6%Actual 148.8 � 192.8 341.6 380.8 722.4 � 722.4Marine, air, rail andother transportation
Probable 339.4 - 5.9 345.2 264.0 609.3 � 609.382.0%Actual 277.1 � 6.6 283.6 216.1 499.7 � 499.7
MunicipalitiesProbable 156.8 - 163.0 319.8 272.3 592.1 � 592.1
94.3%Actual 139.4 � 143.0 282.4 276.3 558.6 � 558.6Tourism andrecreational activities
Probable 88.3 34.8 8.9 132.0 116.4 248.3 � 248.391.7%Actual 86.3 28.4 2.4 117.1 110.8 227.8 � 227.8
Social and communityhousing
Probable 122.7 20.6 19.1 162.4 243.7 406.1 � 406.162.0%Actual 111.3 25.2 9.7 146.1 105.7 251.8 � 251.8
Northern developmentProbable 54.3 - - 54.3 21.1 75.4 � 75.4
86.6%Actual 44.1 � � 44.1 21.2 65.3 � 65.3
ResearchProbable � � � � 121.3 121.3 � 121.3
93.0%Actual � � � � 112.9 112.9 � 112.9
EnvironmentProbable 1.0 7.6 2.6 11.2 23.1 34.3 � 34.3
71.2%Actual 3.0 6.1 2.3 11.4 13.0 24.4 � 24.4Agriculture, forests,fauna and other
Probable 21.9 - 2.5 24.4 176.6 201.0 � 201.069.3%Actual 16.0 � 2.5 18.5 120.8 139.3 � 139.3
Support for Individualsand Families
Educational childcareservices
Probable 8.6 - - 8.6 21.3 29.9 � 29.974.7%Actual 8.5 � � 8.5 13.9 22.3 � 22.3
Administration andJustice
Governmentadministration
Probable 130.5 3.3 29.0 162.8 298.4 461.2 � 461.286.2%Actual 92.3 5.0 19.9 117.2 280.5 397.7 � 397.7
Information resourcesProbable 155.7 - 57.5 213.3 566.3 779.6 � 779.6
91.4%Actual 175.2 � 95.8 271.0 441.4 712.3 � 712.3
Central envelopeProbable � � � � � � � �
�Actual � � � � � � � �
Total Probable 3,298.9 1,433.2 1,682.9 6,415.0 4,917.8 11,332.8 69.5 11,402.3 90.3%Actual 3,951.5 1,421.7 1,205.3 6,578.5 3,700.4 10,278.8 23.0 10,301.8Note: Figures are rounded and the sum of the amounts may not correspond to the total indicated.1 These funds, along with those allocated for replacement, may contribute to eliminating the AMD.2 The investments presented for 2019-2020 were standardized on the same bases. In the 2020-2030 QIP, a probable amount of $11.4 billion was
planned for 2019-2020, after adjustment for standardization on the same bases. Before adjustment, an amount of $11.3 billion had been stipulated.3 A completion rate of over 100% may be explained by work that is ahead of schedule or being completed at a faster rate than anticipated.
208855 001-164 int 4C_OK-Proofs.pdf_PG 142_Mars 21, 2021_18:27:44

Sect
ion
INVESTMENTS MADE IN 2019-2020 COMPARED TO THOSE FORECAST B
Planned Investments B.97by Sector
Appendix 1 � Investments made in 2019-2020 in relation to those planned for thisyear in the 2019-2029 QIP
Investments Made in 2019-2020in relation to those planned for this year in the 2019-2029 QIP(contribution of the Gouvernement du Québec, in millions of dollars and as a percentage)
Mission and sectorInfrastructure maintenance Enhancement
of the park Sub-total
Adjust-ment2 Total Completion
rate3Assetmaintenance1
AMDmanagement
Repla-cement
Sub-total
Addition andimprovement
Health and socialservices
Health and socialservices
Forecast4 172.7 73.7 266.2 512.5 789.9 1,302.5 �118.2%Actual 293.3 142.9 522.3 958.4 562.0 1,520.5 19.3
Education and Culture
EducationForecast 394.9 167.2 35.2 597.3 719.3 1,316.6 �
131.3%Actual 827.6 341.9 16.3 1185.7 542.8 1,728.6 �
Higher educationForecast5 448.3 169.2 159.2 776.7 217.1 993.7 � 993,7
67.0%Actual 304.7 119.1 155.6 579.4 83.0 662.4 3.7 666,1
CultureForecast 67.6 16.0 35.3 118.9 48.6 167.5 � 167,5
102.6%Actual 85.5 16.9 36.1 138.5 33.3 171.8 � 171,8
Development of sportForecast 34.4 � � 34.4 67.6 102.0 � 102,0
71.9%Actual 22.9 � � 22.9 50.5 73.4 � 73,4Economy andEnvironment
Road networkForecast 402.5 1,009.8 397.6 1,809.9 556.1 2,366.0 �
100.9%Actual 1,315.8 736.2 0.1 2,052.0 335.6 2,387.6 �
Public transitForecast 97.5 � 208.5 306.0 736.1 1,042.1 �
69.3%Actual 148.8 � 192.8 341.6 380.8 722.4 � 722,4Marine, air, rail andother transportation
Forecast 210.3 � 26.3 236.5 272.6 509.2 � 509,298.1%Actual 277.1 � 6.6 283.6 216.1 499.7 � 499,7
MunicipalitiesForecast 265.6 � 103.0 368.6 224.0 592.6 � 592,6
94.3%Actual 139.4 � 143.0 282.4 276.3 558.6 � 558,6Tourism andrecreational activities
Forecast 46.9 35.7 12.4 95.1 219.6 314.7 � 314,772.4%Actual 86.3 28.4 2.4 117.1 110.8 227.8 � 227,8
Social and communityhousing
Forecast 118.4 25.0 15.1 158.5 204.5 363.1 � 363,169.3%Actual 111.3 25.2 9.7 146.1 105.7 251.8 � 251,8
Northerndevelopment
Forecast 70.0 � � 70.0 70.0 140.0 � 140,046.6%Actual 44.1 � � 44.1 21.2 65.3 � 65,3
ResearchForecast � � 16.5 16.5 132.7 149.2 � 149,2
75.6%Actual � � � � 112.9 112.9 � 112,9
EnvironmentForecast 2.7 7.8 9.4 19.9 43.8 63.7 � 63,7
38.4%Actual 3.0 6.1 2.3 11.4 13.0 24.4 � 24,4Agriculture, forests,fauna and other
Forecast 29.2 � 2.5 31.7 95.6 127.3 � 127,3109.4%Actual 16.0 � 2.5 18.5 120.8 139.3 � 139,3
Support for Individualsand Families
Educational childcareservices
Forecast 8.1 � � 8.1 27.9 36.0 � 36,062.1%Actual 8.5 � � 8.5 13.9 22.3 � 22,3
Administration andJustice
Governmentadministration
Forecast 161.4 7.1 43.4 211.9 376.9 588.8 � 588,867.5%Actual 92.3 5.0 19.9 117.2 280.5 397.7 � 397,7
Information resourcesForecast6 263.3 � 200.3 463.6 377.9 841.5 � 841,5
84.7%Actual 175.2 � 95.8 271.0 441.4 712.3 � 712,3
Central envelopeForecast 5.0 � � 5.0 5.0 10.0 � 10,0
�Actual � � � � � � � �
Total Forecast 2,798.9 1,511.5 1,530.8 5,841.2 5,185.2 11,026.4 � 11,026.4 93.4%Actual 3,951.5 1,421.7 1,205.3 6,578.5 3,700.4 10,278.8 23.0 10,301.8Note: Figures are rounded and the sum of the amounts may not correspond to the total indicated.
208855 001-164 int 4C_OK-Proofs.pdf_PG 143_Mars 21, 2021_18:27:44

INVESTMENTS MADE IN 2019-2020 COMPARED TO THOSE FORECAST B
B.98 2021-2031 QuébecInfrastructure Plan
1 These funds, along with those allocated for replacement, may contribute to eliminating the AMD.2 The investments presented for 2019-2020 were standardized on the same bases.3 A completion rate of over 100% may be explained by work that is ahead of schedule or being completed at a faster rate than anticipated.4 Taking into account the amount of $49.6 million from the "Health and Social Services" sector transferred to the "Information Resources" sector, this
amount was set at $1,352.0 million, as presented in the 2019-2029 QIP.5 Taking into account the amount of $5.0 million from the "Higher education" sector transferred to the "Information Resources" sector, this amount
was set at $998.7 million, as presented in the 2019-2029 QIP.6 Before the transfers of $49.6 million and $5.0 million, this amount was set at $786.9 million as submitted for the 2019-2029 QIP.
208855 001-164 int 4C_OK-Proofs.pdf_PG 144_Mars 21, 2021_18:27:44

208855 001-164 int 4C_OK-Proofs.pdf_PG 145_Mars 21, 2021_18:27:44

HISTORY OF INVESTMENTS MADE B
B.100 2021-2031 QuébecInfrastructure Plan
Appendix 2 � History of investments made compared to those planned for2015-2016 to 2019-2020
History of Investments Made Compared to Those Plannedfor 2015-2016 to 2019-2020(contribution of the Gouvernement du Québec, in millions of dollars and as a percentage)
Mission and sector2015-2016
(2015-2025 QIP)2016-2017
(2016-2026 QIP)
Forecast Actual % Forecast Actual %
Health and social servicesHealth and social services1,2 1,425.9 1,424.2 99.9 1,180.2 1,032.1 87.5
Education and CultureEducation1.2 1,296.2 1,065.4 82.2 1,483.3 1,290.8 87.0
Higher education1.2 357.4 489.1 136.8 542.4 490.7 90.5
Culture1.2 212.7 224.4 105.5 223.6 182.3 81.5
Development of sport 66.0 45.7 69.2 59.8 43.2 72.2
Economy and EnvironmentRoad network 2,342.7 2,032.7 86.8 2,042.2 1,920.5 94.0
Public transit 948.1 457.8 48.3 1,133.7 644.1 56.8
Marine, air, rail and other transportation 365.3 352.7 96.6 366.6 184.8 50.4
Municipalities 709.7 567.0 79.9 623.6 489.4 78.5
Tourism and recreational activities 112.6 94.8 84.2 160.3 93.0 58.0
Social and community housing 285.1 241.8 84.8 278.2 164.5 59.1
Northern development 112.0 140.3 125.3 92.5 86.7 93.7
Research 94.3 70.1 74.3 114.1 99.9 87.6
Environment 57.9 31.4 54.2 72.8 58.4 80.2
Agriculture, forests, fauna and other 35.0 11.9 34.0 34.2 44.4 129.8
Support for Individuals and FamiliesEducational childcare services 80.7 59.4 73.6 75.8 33.6 44.3
Administration and JusticeGovernment administration 691.4 512.0 74.1 463.1 317.8 68.6
Information resources1,2 657.3 380.1 57.8 640.0 352.2 55.0
Central envelope3 61.1 � � 10.0 � �
Total 9,911.5 8,200.8 82.7 9,596.3 7,528.4 78.5
Note: Figures are rounded and the sum of the amounts may not correspond to the total indicated.1 The investments presented include the adjustment for standardization on the same basis.2 For purposes of comparison with the years 2018-2019 and 2019-2020, investments in information resources of the health and social services
network, the Health and Social Services Information Resources Fund, the education and higher education networks, and state-owned culturalenterprises were reclassified to the "Information Resources" sector.
3 Refer to heading 1.4 of section A.
208855 001-164 int 4C_OK-Proofs.pdf_PG 146_Mars 21, 2021_18:27:44

Sect
ion
HISTORY OF INVESTMENTS MADE B
Planned Investments B.101by Sector
2017-2018(2017-2027 QIP)
2018 2019(2018-2028 QIP)
2019-2020(2019-2029 QIP)
Average2015-2016 to 2019-2020
Forecast Actual % Forecast Actual % Forecast Actual % Forecast Actual %
1,343.8 1,136.9 84.6 1,247.2 1,431.4 114.8 1,302.5 1,539.8 118.2 1,299.9 1,312.9 101.0
1,158.2 1,240.5 107.1 941.1 1,295.5 137.7 1,316.6 1,728.6 131.3 1,239.1 1,324.2 106.9
696.7 566.1 81.3 696.5 661.8 95.0 993.7 666.1 67.0 657.3 574.8 87.4
146.0 160.8 110.1 184.9 185.8 100.5 167.5 171.8 102.6 186.9 185.0 99.0
81.5 50.0 61.3 72.3 41.9 58.0 102.0 73.4 71.9 76.3 50.8 66.6
2,159.4 1,796.7 83.2 2,185.8 2,216.7 101.4 2,366.0 2,387.6 100.9 2,219.2 2,070.8 93.3
825.9 887.4 107.4 1,096.4 704.3 64.2 1,042.1 722.4 69.3 1,009.2 683.2 67.7
321.5 228.3 71.0 502.8 426.2 84.8 509.2 499.7 98.1 413.1 338.3 81.9
800.3 768.7 96.1 784.3 642.5 81.9 592.6 558.6 94.3 702.1 605.2 86.2
177.8 152.0 85.5 232.7 143.2 61.5 314.7 227.8 72.4 199.6 142.2 71.2
253.1 177.8 70.2 274.3 223.5 81.5 363.1 251.8 69.3 290.8 211.9 72.9
68.1 44.4 65.2 105.3 36.0 34.2 140.0 65.3 46.6 103.6 74.5 72.0
174.0 126.1 72.5 153.5 151.2 98.5 149.2 112.9 75.6 137.0 112.0 81.8
51.2 33.8 65.9 36.2 45.4 125.3 63.7 24.4 38.4 56.4 38.7 68.6
95.0 50.5 53.1 127.5 93.6 73.4 127.3 139.3 109.4 83.8 67.9 81.1
80.2 26.2 32.7 54.7 16.7 30.5 36.0 22.3 62.1 65.5 31.6 48.3
506.3 233.3 46.1 625.2 291.3 46.6 588.8 397.7 67.5 575.0 350.4 60.9
636.5 566.2 89.0 698.6 531.3 76.1 841.5 712.3 84.7 694.8 508.4 73.2
48.0 � � 10.0 � � 10.0 � � 27.8 � �
9,623.5 8,245.6 85.7 10,029.2 9,138.2 91.1 11,026.4 10,301.8 93.4 10,037.4 8,683.0 86.5
208855 001-164 int 4C_OK-Proofs.pdf_PG 147_Mars 21, 2021_18:27:44

HISTORY OF INVESTMENT LEVELS PLANNED IN THE QIP B
B.102 2021-2031 QuébecInfrastructure Plan
Appendix 3 � History of investment levels planned in the Québec InfrastructurePlan
History of investment levels planned in the QIP(contribution of the Gouvernement du Québec, in millions of dollars and as a percentage)
Mission and sector 2013-2023QIP
2014-2024QIP
2015-2025QIP
2016-2026QIP
Health and social servicesHealth and social services1,2 18,632.0 16,257.5 13,795.5 13,994.6
Education and CultureEducation3 7,440.3 7,315.4 8,077.7 8,253.3
Higher education3 4,951.8 4,884.5 5,291.9 5,756.9
Culture4 1,938.0 1,904.5 1,596.8 1,546.3
Development of sport 334.1 371.3 329.7 360.1
Economy and EnvironmentRoad network 22,410.8 20,423.6 16,655.3 17,322.0
Public transit 6,426.2 7,615.0 7,247.7 7,059.9
Marine, air, rail and other transportation 2,775.6 2,023.8 2,164.7 2,755.7
Municipalities 6,087.5 6,933.2 6,939.5 6,977.5
Tourism and recreational activities 1,046.6 616.1 573.8 667.5
Social and community housing 2,640.5 2,279.4 2,013.5 1,964.3
Northern development 1,353.6 1,159.1 901.5 888.9
Research 800.0 786.7 815.5 831.7
Environment 682.2 666.9 578.4 615.7
Agriculture, forests, fauna and other 407.0 351.3 299.0 364.3
Support for Individuals and FamiliesEducational childcare services 1,036.1 807.9 807.9 605.5
Administration and JusticeGovernment administration 5,978.5 4,480.4 4,535.7 3,554.0
Information resources1, 2, 3, 4 5,542.1 4,865.2 5,125.3 5,166.8
Central envelope5 1,817.1 6,558.1 10,650.8 10,015.0
Total 92,300.0 90,300.0 88,400.0 88,700.0
Note: Figures are rounded and the sum of the amounts may not correspond to the total indicated.1 For purposes of comparison with the 2020-2030 QIP et seq., investments in information resources of the health and social services networks
planned for the 2013-2023 to 2019-2029 QIPs have been reclassified to the "Information Resources" sector.2 For purposes of comparison with the 2019-2029 QIP et seq., investments in information resources of the Health and Social Services Information
Resources Fund (FRISSSS) planned for the 2013-2023 to 2018-2028 QIPs had been reclassified to the "Information Resources" sector.3 For purposes of comparison with the 2019-2029 QIP et seq., investments in information resources of the education and higher education networks
planned for the 2013-2023 to 2018-2028 QIPs had been reclassified to the "Information Resources" sector.4 For purposes of comparison with the 2019-2029 et seq., investments in information resources of state-owned cultural enterprises planned for the
2013-2023 to 2018-2028 QIPs were reclassified to the "Information Resources" sector.5 Refer to heading 1.4 of section A.
208855 001-164 int 4C_OK-Proofs.pdf_PG 148_Mars 21, 2021_18:27:44

Sect
ion
HISTORY OF INVESTMENT LEVELS PLANNED IN THE QIP B
Planned Investments B.103by Sector
2017-2027QIP
2018-2028QIP
2019-2029QIP
2020-2030QIP
2021-2031QIP
16,318.6 17,812.1 19,407.4 20,462.6 20,551.2
8,175.7 8,972.7 13,889.2 19,150.3 20,910.5
5,916.1 6,090.7 6,325.6 6,323.4 6,485.8
1,468.4 1,515.2 1,575.6 1,963.5 2,019.7
392.5 468.2 718.0 653.3 731.3
17,901.0 20,027.5 24,580.0 26,832.1 28,330.8
7,059.9 9,002.4 9,040.3 13,581.2 12,830.3
2,654.3 3,089.8 2,935.6 4,053.9 3,571.7
7,003.9 7,296.4 7,216.7 7,536.5 7,569.5
769.4 1,001.3 1,114.3 1,148.5 1,213.6
2,082.5 2,320.1 2,442.4 2,510.0 2,644.2
826.2 823.1 1,018.3 908.0 899.4
863.9 917.3 985.8 1,006.5 984.0
574.0 577.8 627.7 930.6 957.4
561.2 706.7 700.1 845.4 923.5
529.8 456.5 401.8 374.8 355.0
3,719.9 3,872.5 3,881.0 3,919.6 4,197.9
5,507.2 5,548.9 6,578.1 7,394.3 7,211.7
8,775.4 9,900.9 11,962.1 10,905.4 12,612.6
91,100.0 100,400.0 115,400.0 130,500.0 135,000.0
208855 001-164 int 4C_OK-Proofs.pdf_PG 149_Mars 21, 2021_18:27:44

INVESTMENTS BY ADMINISTRATIVE REGION B
B.104 2021-2031 QuébecInfrastructure Plan
Appendix 4 � Investments by mission, sector, type and by administrative region2021-2031 QIP investmentsby Mission, Sector, Type and by Administrative Region
Mission and sectorRegion1
01 02 03 04 05 06 07 08
Health and social services
Health and social servicesInfrastructure maintenance 263.3 312.4 1,374.2 409.6 439.5 3,483.8 243.1 246.7
Portfolio enhancement 202.7 360.8 2,157.6 283.4 582.8 1,556.1 335.6 225.2
Education and Culture
EducationInfrastructure maintenance 367.1 482.4 1,010.3 416.2 474.2 3,092.0 518.7 297.3
Portfolio enhancement 76.9 48.0 395.4 61.6 97.8 2,378.0 219.6 24.5
Higher educationInfrastructure maintenance 111.5 152.6 783.5 179.1 385.0 2,773.7 160.3 61.8
Portfolio enhancement 8.0 10.2 49.7 19.7 28.6 322.7 13.5 26.3
CultureInfrastructure maintenance 38.5 43.1 181.5 50.2 48.5 525.6 33.3 16.6
Portfolio enhancement 22.1 20.2 56.2 16.7 15.3 302.8 25.3 12.0
Development of sportInfrastructure maintenance 1.0 1.3 3.1 1.2 1.5 10.1 1.4 0.7
Portfolio enhancement 15.6 27.7 56.4 20.4 28.7 181.6 28.9 11.7
Economy and Environment
Road networkInfrastructure maintenance 552.4 563.0 2,514.2 842.3 446.1 8,724.3 457.5 440.2
Portfolio enhancement 470.2 289.4 250.4 45.7 31.2 342.7 225.5 43.6
Public transitInfrastructure maintenance � 37.1 134.7 7.5 79.8 2,203.4 44.2 �
Portfolio enhancement � 23.5 2,137.1 31.7 20.0 6,444.7 430.7 0.3
Marine, air, rail and othertransportation
Infrastructure maintenance 48.2 66.0 138.6 45.7 56.2 249.0 41.5 16.5
Portfolio enhancement 38.7 30.7 769.7 37.1 79.2 285.3 70.0 9.1
MunicipalitiesInfrastructure maintenance 158.5 196.3 582.5 153.0 239.5 1,633.6 229.3 129.6
Portfolio enhancement 17.7 17.6 57.2 19.6 21.0 180.4 45.2 14.8
Tourism and recreationalactivities
Infrastructure maintenance 13.8 27.7 89.1 2.0 8.1 524.6 21.8 2.2
Portfolio enhancement 6.9 17.5 161.3 6.9 27.0 58.0 15.0 12.4
Social and community housingInfrastructure maintenance 48.3 65.3 125.0 48.3 38.4 389.2 58.2 25.6
Portfolio enhancement 39.6 32.0 130.9 20.6 33.3 464.7 40.8 15.8
Northern developmentInfrastructure maintenance � � � � � � � �
Portfolio enhancement � � 9.9 � � 8.9 � �
ResearchInfrastructure maintenance � � � � � � � �
Portfolio enhancement 17.7 28.0 84.4 23.6 94.1 268.0 34.4 13.2
EnvironmentInfrastructure maintenance 41.9 57.9 408.7 11.5 20.2 14.4 5.4 40.0
Portfolio enhancement 1.6 2.1 39.7 18.6 2.5 49.3 2.9 1.2
(
Mission and sectorRegion1
(contribution of the Gouvernement du Québec, in millions of dollars and as a percentage)
208855 001-164 int 4C_OK-Proofs.pdf_PG 150_Mars 21, 2021_18:27:44

Sect
ion
INVESTMENTS BY ADMINISTRATIVE REGION B
Planned Investments B.105by Sector
09 10 11 12 13 14 15 16 17 OutsideQuébec Total
185.1 87.2 158.4 320.8 209.7 250.2 435.1 792.4 32.3 � 9,243.7166.1 586.3 195.7 287.7 188.9 734.3 554.6 2,670.6 219.0 � 11,307.5
202.3 110.2 184.5 708.9 595.1 654.6 932.7 2,559.4 367.3 � 12,973.27.3 315.8 8.5 162.8 662.1 505.1 859.5 1,873.0 241.3 � 7,937.3
31.6 13.2 28.9 134.2 149.8 157.9 189.8 484.3 79.1 � 5,876.38.6 1.2 2.7 12.5 12.7 14.7 19.4 45.2 13.6 � 609.5
15.2 2.9 21.1 42.7 32.3 49.8 42.2 127.0 33.1 � 1,303.67.5 4.9 10.2 9.4 62.3 23.3 21.4 85.2 21.3 � 716.10.4 0.2 0.5 3.1 1.9 1.9 2.6 6.6 1.2 � 38.87.7 4.0 15.4 35.7 31.9 36.8 51.1 118.9 19.9 � 692.5
822.6 114.5 488.6 882.4 652.9 612.2 942.7 3,850.8 611.8 � 23,518.5250.9 5.5 107.7 389.1 540.6 354.2 389.0 707.7 368.9 � 4,812.3
� � � 53.8 131.4 � � 277.5 � � 2,969.50.3 0.3 � 109.0 242.5 57.0 48.7 314.5 0.5 � 9,860.8
61.5 124.8 315.7 155.0 41.4 62.0 59.0 221.4 37.7 � 1,740.2103.2 70.2 3.9 41.0 13.1 45.8 15.9 138.7 80.0 � 1,831.574.0 41.6 67.5 531.4 395.9 343.4 463.3 1,352.2 166.1 � 6,757.811.7 125.1 12.0 52.9 20.0 25.8 33.1 142.7 14.9 � 811.7
3.4 0.4 3.2 2.3 2.2 24.8 30.6 15.0 18.8 � 790.13.5 0.9 4.4 9.6 7.8 9.7 23.6 47.8 11.4 � 423.5
25.6 255.7 30.1 49.7 28.4 29.8 41.2 127.8 36.9 � 1,423.611.0 92.6 21.7 43.6 32.5 35.7 45.9 134.0 25.6 � 1,220.6
126.0 165.2 � � � � � � � � 291.2264.1 325.2 � � � � � � � � 608.2
� � � � � � � � � � �25.2 3.7 34.9 44.9 37.4 51.3 64.3 134.8 24.1 � 984.014.5 3.3 12.6 63.6 3.0 9.9 24.3 12.8 3.2 � 747.3
0.8 0.3 1.0 3.2 36.4 3.7 4.4 40.6 1.8 � 210.1
208855 001-164 int 4C_OK-Proofs.pdf_PG 151_Mars 21, 2021_18:27:44

INVESTMENTS BY ADMINISTRATIVE REGION B
B.106 2021-2031 QuébecInfrastructure Plan
2021-2031 QIP investmentsBy Mission, Sector, Type and by Administrative Region (cont'd)
Mission and sectorRegion1
01 02 03 04 05 06 07 08
Agriculture, forests, fauna andother
Infrastructure maintenance 50.4 17.0 28.1 10.0 6.0 0.2 9.5 10.3
Portfolio enhancement 49.3 38.2 220.5 25.2 11.2 50.9 20.9 16.3
Support for Individuals andFamilies
Educational childcare servicesInfrastructure maintenance 2.1 3.0 8.2 2.9 3.6 22.3 4.4 1.7
Portfolio enhancement 6.3 8.7 22.5 8.3 11.2 62.6 11.8 5.8
Administration and Justice
Government administrationInfrastructure maintenance 24.9 33.7 714.1 59.8 43.0 619.2 46.0 16.1
Portfolio enhancement 29.7 74.2 562.8 29.3 56.0 468.1 43.1 99.0
Information resourcesInfrastructure maintenance 74.8 106.1 417.3 102.9 125.2 810.1 150.8 54.7
Portfolio enhancement 82.6 119.1 387.5 114.4 146.7 1,031.1 167.9 60.8
Subtotal 2,882.3 3,312.9 16,062.3 3,124.9 3,701.2 39,531.5 3,756.9 1,951.8
As a percentage 2.4 2.7 13.1 2.6 3.0 32.3 3.1 1.6
Central envelope (not brokendown)2
Infrastructure maintenance � � � � � � � �Portfolio enhancement � � � � � � � �
Total 2,882.3 3,312.9 16,062.3 3,124.9 3,701.2 39,531.5 3,756.9 1,951.8
1 The sectoral investment envelopes that do not include a specific project were distributed among the various regions, based on the proportion ofthe each region's population divided by that of Québec as a whole.
2 Refer to heading 1.4 of section A.
Legend:
01: Bas-Saint-Laurent
02: Saguenay�Lac-Saint-Jean
03: Capitale-Nationale
04: Mauricie
05: Estrie
06: Montréal
07: Outaouais
08: Abitibi-Témiscamingue
09: Côte-Nord
10: Nord-du-Québec
11: Gaspésie�Îles-de-la-Madeleine
12: Chaudière-Appalaches
13: Laval
14: Lanaudière
15: Laurentides
16: Montérégie
17: Centre-du-Québec
(
Mission and sectorRegion1
(contribution of the Gouvernement du Québec, in millions of dollars and as a percentage)
208855 001-164 int 4C_OK-Proofs.pdf_PG 152_Mars 21, 2021_18:27:44

Sect
ion
INVESTMENTS BY ADMINISTRATIVE REGION B
Planned Investments B.107by Sector
))
09 10 11 12 13 14 15 16 17 OutsideQuébec Total
19.5 4.6 13.4 1.4 0.1 2.5 4.7 53.6 0.4 � 231.621.1 55.4 9.2 13.2 13.2 17.5 25.2 91.0 13.6 � 691.9
1.0 0.7 1.0 4.6 4.6 5.5 6.4 16.7 3.1 � 91.8 3.1 2.5 3.0 13.0 13.2 16.8 19.2 48.0 7.4 � 263.2
26.4 3.6 64.7 72.6 81.4 43.1 70.7 155.4 35.0 29.7 2,139.417.5 115.3 21.4 50.8 43.1 43.9 54.8 301.7 22.8 25.0 2,058.437.4 17.7 35.3 163.9 166.7 195.8 234.4 599.0 93.2 2.7 3,388.1 40.1 17.9 39.3 182.2 185.7 218.0 261.0 664.9 103.7 0.6 3,823.6
2,596.6 2,672.9 1,916.5 4,651.0 4,640.3 4,637.1 5,970.9 18,211.2 2,709.1 58.1 122,387.4
2.1 2.2 1.6 3.8 3.8 3.8 4.9 14.9 2.2 � 100.0
� � � � � � � � � � 3,734.2 � � � � � � � � � � 8,878.4
2,596.6 2,672.9 1,916.5 4,651.0 4,640.3 4,637.1 5,970.9 18,211.2 2,709.1 58.1 135,000.0
208855 001-164 int 4C_OK-Proofs.pdf_PG 153_Mars 21, 2021_18:27:44

208855 001-164 int 4C_OK-Proofs.pdf_PG 154_Mars 21, 2021_18:27:44

Sec
tionC
Annual Management Plans for C.1Public infrastructure investments 2021-2022
Section C
Report on the condition of public infrastructure
1. A long-term vision of Government investments .................................................. 3
2. Highlights of the 2021-2022 AMPIs........................................................................ 52.1 Majority of Infrastructure Deemed in Good Condition................................................ 5
2.2 The Asset Maintenance Deficit Is Assessed at $27.7 Billion ..................................... 7
3. 2021-2022 Annual Management Plans for Public InfrastructureInvestments........................................................................................................... 10
208855 001-164 int 4C_OK-Proofs.pdf_PG 155_Mars 21, 2021_18:27:44

208855 001-164 int 4C_OK-Proofs.pdf_PG 156_Mars 21, 2021_18:27:44

Sec
tionC
Annual Management Plans for C.3Public infrastructure investments 2021-2022
1. A long-term vision of Government investmentsTo assess and continually monitor the condition of the public infrastructure portfolio and the AMD, theGovernment has developed a GCI to establish and plan investment priorities in order to protectinfrastructure sustainability.
The indicator, which is based on best infrastructure investment management practices, provides acomprehensive, comparative and relative basis for assessing the condition of various categories ofinfrastructure. The primary basis is quantitative, that is, an evaluation of the investment required in the nextfive years for each existing infrastructure. This is then combined with a risk management factor based onthe service potential of the infrastructure. The GCI guides the level of recurring investment required tomaintain the QIP portfolio.
The GCI comprises five possible conditions, ranging from very good to very poor, as well as a thresholdbelow which infrastructure is no longer deemed in satisfactory condition. When the condition of aninfrastructure drops below this threshold, it generally entails an AMD.
Government Condition Indicator
Indicator Condition Description
A Very good The infrastructure is generally new or has been refurbished. It provides service free ofinterruption or slowdowns. It requires little asset maintenance work.
B GoodThe infrastructure shows a low level of degradation and defect. It requires some assetmaintenance work. Generally, the infrastructure is in the second third of its useful life.Interruptions or service slowdowns may occasionally occur.
C SatisfactoryThe infrastructure shows a moderate level of degradation and defect. It requires regularasset maintenance work. Generally, the infrastructure is in the final third of its useful life.Interruptions or service slowdowns occasionally occur. Risk mitigation measures areimplemented as needed.
Condition threshold
D PoorThe infrastructure shows a high level of degradation and defect. It requires significant,and sometimes urgent, asset maintenance work. Generally, the infrastructure hassurpassed its useful life. Interruptions or service slowdowns occur often. Significant riskmitigation measures are implemented as needed.
E Very poorThe infrastructure shows a very high level of degradation and defect. It requires verysignificant, and often urgent, asset maintenance work. Generally, the infrastructure hasclearly surpassed its useful life. Interruptions and service slowdowns occur very often.Very significant risk mitigation measures are implemented.
208855 001-164 int 4C_OK-Proofs.pdf_PG 157_Mars 21, 2021_18:27:44

C.4 Québec Infrastructure Plan2021-2031
The AMD represents an estimate of the value of the investments required to return the infrastructure to asatisfactory or better condition or to replace it. Regardless of the condition of the infrastructure, the bodyresponsible for it must ensure that human health and safety are not compromised, failing which theinfrastructure must be decommissioned. The GCI and the AMD help guide the Government's choices in thedevelopment of the QIP.
INVESTMENTS UNDER QIP
________________________________________________________________________________
GOVERNMENT CONDITION INDICATOR
AMD : Assessment of the required investmentsto restore the physical condition of infrastructure to a satisfactory condition or better.
DPoor
EVery poor
ABCSatisfactory condition or better
Assetmaintenance AMD
CONDITION
THRESHOLD
AMD
208855 001-164 int 4C_OK-Proofs.pdf_PG 158_Mars 21, 2021_18:27:44

Sec
tionC
Annual Management Plans for C.5Public infrastructure investments 2021-2022
2. Highlights of the 2021-2022 AMPIs2.1 Majority of Infrastructure Deemed in Good Condition
60% of the Infrastructure of Public Bodies Is Deemed in Good Condition
Overall, 60% of infrastructure under the responsibility of public bodies is deemed to be in satisfactory orbetter condition (GCI of A, B or C).
Condition Indicators of Public BodiesBy Infrastructure Category
80% of the Infrastructure of Subsidized Bodies Is Deemed in Good Condition
Overall, 80 % of infrastructure under the responsibility of subsidized bodies is deemed to be in satisfactoryor better condition (GCI of A, B or C).
Condition Indicators of Subsidized BodiesBy Infrastructure Category
A30 %
B18 %
C15 %
D26 %
E11 %Buildings
A16 %
B19 %
C19 %
D16 %
E30 %
Civil EngineeringWorks
A33 %
B27 %
C20 %
D16 %
E4%Equipments
A25 %
B19 %
C16 %
D22 %
E18 %Public Bodies
60 %
63 %Civil EngineeringWorks
54 %
80 %
A24 %
B34 %
C25 %
D10 %
E7 %Buildings
A38 %
B25 %
C16 %
D9 %
E12 %
A42 %
B19 %
C10 %
D28 %
E1%Equipments
A36 %
B26 %
C18 %
D9 %
E11 %b Subsidized Bodies
80 %
83 %
79 %
71 %
Civil EngineeringWorks
208855 001-164 int 4C_OK-Proofs.pdf_PG 159_Mars 21, 2021_18:27:45

C.6 Québec Infrastructure Plan2021-2031
Overall Condition of the Public Infrastructure PortfolioBy Sector and Body(percentage)
1 Proportion of condition indicator according to replacement value.
2020-2021AMPI
2021-2022 AMPI1
ABC A B C ABC D E
Public Bodies Infrastructures 61 25 19 16 60 22 18Health and Social Services
Establishments of the HSSN 84 50 22 13 85 12 3
EducationSchool organizations 46 11 16 17 44 37 19
Higher EducationCEGEPs 70 14 21 24 59 35 6
Universities 63 33 18 14 65 16 19
Total � Higher Education 66 25 20 18 63 24 13
CultureGovernment Bodies and Corporations under theAuthority of the MCC
60 29 9 18 56 25 19
Road NetworkMinistère des Transports
Roadways 49 17 21 11 49 22 29
Structures � Highway System 53 9 18 26 53 9 38
Structures � Municipal Bridges 58 11 12 35 58 9 33
Culverts 83 51 23 10 84 8 8
Total � Road Netw ork 54 16 19 19 54 15 31
Marine, Air, Rail and other TransportationSociété des traversiers du Québec 81 54 22 4 80 18 2
Tourism and Recreational ActivitiesParc olympique 30 8 20 2 30 55 15
Social and Community HousingSociété d'habitation du Québec 79 37 20 18 75 19 6
EnvironmentMinistère de l'Environnement et de la Lutte contre leschangements climatiques
49 26 10 12 48 52 0
Government AdministrationSociété québécoise des infrastructures 69 28 15 18 61 29 10
Subsidized Bodies Infrastructures 80 36 26 17 80 10 11
Public TransitPublic Transit Corporations 75 42 17 12 71 18 11
MunicipalitiesMunicipalities 80 35 28 19 82 7 11
Social and Community HousingBodies Funded by the SHQ 78 37 22 16 75 17 8
208855 001-164 int 4C_OK-Proofs.pdf_PG 160_Mars 21, 2021_18:27:45

Sec
tionC
Annual Management Plans for C.7Public infrastructure investments 2021-2022
2.2 The Asset Maintenance Deficit Is Assessed at $27.7 Billion
In 2020-2021, the AMD of Government infrastructure stands at $27.7 billion, a gross increase of $0.5 billioncompared with the previous year. The AMD is attributable to:
� the Road network sector (65%);
� the Education sector (19%);
� other sectors (16%).
It is incumbent upon each public body designated by the Government to develop an AMPI to assess theAMD. The AMD represents the value of investments required to return public body infrastructure with a GCIof poor (D) or very poor (E) to satisfactory or better condition. Since the infrastructure of subsidized bodiesdoes not belong to the Gouvernement du Québec, they are responsible for maintaining it, including its AMD.Consequently, the AMD of subsidized organizations is not considered in that of the Government.
Distribution of Public Body AMDBy Body(in millions of dollars)
Transports17,923.564,8%
Schoolorganizations
5,204.318.8%
Establishmentsof the HSSN
1,495.25.4%
Universities1,049.24.0%
SQI608.52.2%
Parc olympique491.01.8%
CEGEPs326.21.2%
SHQ249.40.9%
STQ129.50.5%
MCC74.60.3%
MELCC55.30.2%
Others4,523.916.4%
208855 001-164 int 4C_OK-Proofs.pdf_PG 161_Mars 21, 2021_18:27:45

C.8 Québec Infrastructure Plan2021-2031
The Net Reduction in the AMD Stands at $0.4 Billion
The change in the AMD stems from three main causes: the natural deterioration of infrastructure over itsuseful life, including the increased cost of cumulative work not done during the year, new needs identifiedin recent inspections and investments made to reduce the AMD during the period.
Compared to last year's AMD ($28.2 billion), there is a net decrease of $0.4 billion for 2021-2022, after theeffect of new needs identified during the year in the amount of $0.1 billion. Therefore, reduction workcompleted over the year exceeded the natural deterioration of infrastructure in poor condition.
More specifically, changes in the AMD for 2021-2022 stem from:
� The natural deterioration of infrastructure, which contributed to an increase of nearly $1.5 billion,including:
$1.2 billion related to the aging of buildings, especially those in the education network;
$0.3 billion related to new needs to replace medical devices that had exceeded their useful life.
� New findings observed during the period for a reduction of $0.1 billion:
$0.6 billion reduction for the road network resulting from:
� a downward variation of $1.1 billion related to an adjustment of the AMD for certain repairand reconstruction projects for structures in very poor condition (GCI of E) currently understudy;
� an upward variation of $0.5 billion associated with increase factors due to the cost of sometypes of roadway repairs, including management of traffic maintenance during work,professional fees, mitigation measures as well as contingencies;
a $0.5 billion increase for new work listed, primarily in the higher education and governmentadministration sectors.
� Investments made during the period reduced the overall AMD by $1.9 billion, including:
$1.5 billion for work and upgrades of critical components, mainly in obsolete buildings in theeducation and higher education networks as well as in the Parc olympique;
$0.2 billion associated with the final commissioning of the Turcot complex reconstructionproject in Montréal;
$0.2 billion to replace outdated medical devices in the health and social services network.
208855 001-164 int 4C_OK-Proofs.pdf_PG 162_Mars 21, 2021_18:27:45

Sec
tionC
Annual Management Plans for C.9Public infrastructure investments 2021-2022
Change in Public Body AMDBy Sector and Body(millions of dollars)
1. No natural degradation of road infrastructure was observed this year since the portrait of the road network is presented based on inspection datafrom the previous year. Similarly, the effect of interventions completed in 2020-2021 may be reflected in the MTQ's 2022-2023 AMPI. However,the advancement of certain major repair projects is taken into account, including the final commissioning of the Turcot complex reconstruction inMontréal.
2020-2021AMPI
NaturalDegradation
NewFindings
Decrease 2021-2022AMPI
Total AMD of Public Bodies 28,234.9 1,469.6 (133.8) (1,919.0) 27,651.7
Health and Social ServicesEstablishments of the HSSN 1,440.6 303.4 30.1 (278.9) 1,495.2
EducationSchool organizations 5,340.5 1,049.5 � (1,185.7) 5,204.3
Higher EducationCEGEPs 194.3 16.0 144.5 (28.6) 326.2
Universities 1,126.0 4.7 54.1 (90.6) 1,094.2
CultureGovernment Bodies and Corporations under theAuthority of the MCC
53.4 4.6 31.6 (15.0) 74.6
Road NetworkMinistère des Transports
Roadways 7,401.0 � 513.0 � 7,914.0
Structures � Highway System 9,527.2 � (879.2) (203.2) 8,444.8
Structures � Municipal Bridges 785.7 � (172.5) � 613.2
Culverts 1,032.8 � (81.3) � 951.5
Total 18,746.7 � (620.0) (203.2) 17,923.5
Marine, Air, Rail and other TransportationSociété des traversiers du Québec 117.5 10.6 5.8 (4.4) 129.5
Tourism and Recreational ActivitiesParc olympique 478.1 5.4 57.2 (49.7) 491.0
Social and Community HousingSociété d'habitation du Québec 180.5 41.3 41.5 (13.9) 249.4
EnvironmentMinistère de l'Environnement et de la Lutte contreles changements climatiques
44.5 5.3 9.6 (4.1) 55.3
Government AdministrationSociété québécoise des infrastructures 512.8 28.8 111.8 (44.9) 608.5
208855 001-164 int 4C_OK-Proofs.pdf_PG 163_Mars 21, 2021_18:27:45

C.10 Québec Infrastructure Plan2021-2031
3. 2021-2022 Annual Management Plans for Public InfrastructureInvestments
Since 2015-2016, the AMPI of bodies designated by the Government have reported on the inventory andcondition of most of the infrastructure under their responsibility. The implementation of AMPIs is the firststep in a process to provide optimal planning of the infrastructure investments set out in the QIP, bearingin mind the requisite balance between infrastructure maintenance and development needs and the public'sability to pay.
The following 2021-2022 AMPIs will be available on the website of the Secrétariat du Conseil du trésor1 byApril 23, 2021.
Organizations Designated by the Government to Produce AMPIs
1 Website: https://www.tresor.gouv.qc.ca/public-infrastructures/public-infrastructures/?L=2
Budgetary portfolio/QPI sector Bodies
Affaires municipales et HabitationMunicipalities Municipalities
Social and community housing Société d'habitation du Québec
Bodies funded by the Société d'habitation du Québec
Conseil du trésor et Administrationgouvernementale
Government Administration Société québécoise des infrastructures
Culture et des CommunicationsCulture Bodies and government corporations reporting to the Minister of
Culture and CommunicationsEnvironnement et Lutte contre leschangements climatiques
Environment Ministère de l'Environnement et de la Lutte contre leschangements climatiques
Éducation et enseignement supérieurEducation School organizations
Higher Education CEGEPS
Universities
Santé et Services sociauxHealth and social services Establishments of the HSSN
Tourisme
Tourism and recreational activities Parc olympique
TransportsRoad netw ork Ministère des Transports
Public transit Public transit corporations
Marine, air, rail and other transportation Société des traversiers du Québec
208855 001-164 int 4C_OK-Proofs.pdf_PG 164_Mars 21, 2021_18:27:45

