quartz radiofluorescence: a modelling approachchenr/pubs/friedrich.pdfquartz radiofluorescence: a...
TRANSCRIPT

Journal of Luminescence 186 (2017) 318–325
Contents lists available at ScienceDirect
Journal of Luminescence
http://d0022-23
n Corr
journal homepage: www.elsevier.com/locate/jlumin
Quartz radiofluorescence: a modelling approach
Johannes Friedrich a,n, Vasilis Pagonis b, Reuven Chen c, Sebastian Kreutzer d,Christoph Schmidt a
a Chair of Geomorphology & BayCEER, University of Bayreuth, 95440 Bayreuth, Germanyb Physics Department, McDaniel College, Westminster, MD 21157, USAc Raymond and Beverly Sackler School of Physics and Astronomy, Tel-Aviv University, Tel-Aviv 69978, Israeld IRAMAT-CRP2A, Université Bordeaux Montaigne, Maison de l'Archéologie, Esplanade des Antilles, 33607 Pessac Cedex, France
a r t i c l e i n f o
Article history:Received 21 November 2016Accepted 17 February 2017Available online 20 February 2017
Keywords:LuminescenceRadiofluorescenceQuartzRSimulationKinetic model
x.doi.org/10.1016/j.jlumin.2017.02.03913/& 2017 Elsevier B.V. All rights reserved.
esponding author.
a b s t r a c t
Modelling (natural) quartz luminescence (TL/OSL) phenomena appears to be quite common nowadays.The corresponding simulations are capable of giving valuable insights into the charge transport system.By contrast, simulating radiofluorescence (RF) of quartz has rather been neglected in the past. Here wepresent and discuss (1) the RF signals of natural quartz measured in the UV band and (2) simulations ofthese experiments executed using a three-energy-level model to explain the experimentally obtainedresults.
Two natural quartz samples were investigated at room temperature (RT) following different preheatprocedures: (a) consecutively increasing preheat temperatures from 50 °C to 700 °C and (b) repeating a500 °C preheat with subsequent UV-RF measurement at RT for eleven times. Based on the measurementand modelling results, we finally confirm theoretically the dependency of the UV-RF signal of quartz onthe burial dose.
& 2017 Elsevier B.V. All rights reserved.
1. Introduction
Numerical simulations pave the way for a better understanding ofluminescence phenomena, such as thermally stimulated and opti-cally stimulated luminescence (TL, OSL) of various dosimeters (e.g.,[1–8]). By contrast, simulating radioluminescence / radiofluorescence(henceforth radiofluorescence: RF) of natural quartz appears to havebeen neglected in the past.
RF is the luminescence emitted during exposure to ionizing ra-diation and for quartz believed to result from direct recombinationof electrons with holes captured in recombination centres [9, cf. fora review]. While quartz RF spectra are reported in the literature(e.g., [7,10–13]) simulation studies for a specific emission wave-length are missing so far. One recent study on simulating RF waspublished by Pagonis et al. [14], but it is limited to Al2O3:C.
While the comprehensive quartz model developed by Bailey[15] is capable of successfully simulating common TL and OSL lu-minescence phenomena (such as dose response, dose quenching,phototransfer, thermal activation) for the UV band, it fails for si-mulating experimentally obtained quartz RF signals.
The results obtained by Bailey [15, Section 3.4.4.] suggest thatthe shape of the simulated RF is correlated to the population of the
so called reservoir centres. In more recent publications a link be-tween the pre-dose effect [16] and the RF behaviour is mentioned[13,17]. The successful simulation of pre-dose effects on TL signalswas published by, e.g., Adamiec [18], Pagonis and Carty [19], Itohet al. [20] but not the effect of different preheat treatments on theRF signal.
This study is separated into two parts. The first part presentsexperimental results obtained by measuring quartz RF in the UVband (UV-RF) for different preheat temperatures as well as re-peated cycles of heating and subsequent UV-RF measurement for apreheat temperature of 500 °C for two natural quartz samples. Inthe second part the empirical results are complemented by nu-merical simulations, i.e., three parameters from the original model[15] are adapted and modified to reproduce the signal dynamicsseen in the experiments. To allow an understanding of the chargetransport during heating and UV-RF, a simplified one-trap-two-centres model was developed.
Our numerical simulations demonstrate the potential of quartzUV-RF as a method of retrospective dosimetry, which so far hasbeen almost neglected. While the study by Marazuev et al. [21]appears to successfully demonstrate its general applicability, anelaborated explanation to understand the physical background ofthe obtained results is still missing.
To the best of our knowledge, the RF signal dynamics in the UVand the burial dose estimation for natural quartz samples using RF

0/s]
2.5 50 °C
300 °C
J. Friedrich et al. / Journal of Luminescence 186 (2017) 318–325 319
signals have not been simulated and presented in the literaturebefore.
204
Time [s]
RF
sign
al [1
0 k
cts.
1 10 100 1000 10000
3010
0 2000 4000 6000 8000 10000
1.0
1.5
2.0
Time [s]
Nor
mal
ized
RF
sign
al
350 °C400 °C450 °C500 °C550 °C600 °C650 °C700 °C
Fig. 1. UV-RF signal for sample BT586 for different preheat temperatures (hold for120 s) prior to the RF measurements. For each temperature a new aliquot was used.The values are normalized to the last data point of each measurement and the totalabsorbed dose is 600 Gy during each RF measurement. For the sake of clarity theUV-RF curves for preheat temperatures from 100 °C to 250 °C were removed, be-cause no change was observed. The inset shows the same data as the main figurebut with absolute values and a logarithmic x-axis.
2. Material and methods
2.1. Quartz samples
Two natural quartz samples were chosen for the measure-ments: (1) the quartz fraction of sample BT586 was extracted froma colluvial sample originating from the Trebgast valley in thenorth-west of Bayreuth (Germany) [22]. For this sample a pa-laeodose of ∼24 Gy was obtained. (2) a second quartz sample(BT1195) was extracted from the quartz ridge ‘Pfahl’ (BavarianForest, Germany), which is one of the largest hydrothermal quartzveins in Germany. This sample was extracted under daylightconditions and subsequently gently crushed with a steel mortarwith frequent sieving in between. Subsequent chemical treat-ments followed routine preparation procedures for luminescencedating samples (e.g. [23]). These are: HCl (30 %), H2O2 (30 %),density separation using sodium-polytungstate, HF (40 % for60 min). In contrast to BT586 the sample BT1195 was bleached in ahome made solar simulator (2 h with an Osram Duluxstar lamp).For both samples the used grain size fraction is 90–200 μm. Twodifferent pretreatments (natural and bleached) were used to in-vestigate differences in the RF behaviour concerning thesepretreatments.
2.2. Measurement conditions
RF measurements were carried out on a Freiberg Instrumentslexsyg research reader [24] at the luminescence laboratory inBayreuth. The reader is equipped with a 90Sr/90Y β-source(∼3.6 Gy min�1), calibrated for coarse grain quartz on stainlesssteel cups. The β-source is specifically designed for RF measure-ments [25]. Luminescence was detected through a Chroma BP 365/50 EX interference filter in front of a Hamamatsu H7360-02 pho-tomultiplier tube allowing for a detection of the UV-RF signalbetween 315 nm and 415 nm. All measurements were performedin a nitrogen atmosphere. If not reported otherwise, preheating ofthe samples was performed with a constant heating rate of5 K s�1. The channel time for the RF measurements was set to 1 s.The experimental data presented in this study are the arithmeticmean of two aliquots for each measurement. Reproducibility of RFsignals using different aliquots was better than 5%.
Further details on the UV-RF experiments are given in the textbelow.
2.3. Data analysis
Data analyses were carried out using the statistical program-ming environment R [26] and the R package ‘Luminescence’[27,28]. For simulating the UV-RF signals the R package ‘RLum-Model’ [29,30] was used. The code for the simulations presentedhere can be found in the supplementary material. Simulation re-sults were cross-checked with Mathematica™ and MATLAB™.
3. Quartz UV-RF measurements
3.1. Preheat experiments
Martini et al. [13,31] reported that samples annealed at tem-peratures between 400 °C and 600 °C are showing an enhance-ment in the UV-RF intensity. To determine and better understand
the correlation between preheat temperature and UV-RF signalintensity, UV-RF measurements were carried out for 10,000 s atroom temperature (∼20 °C) after preheating the samples to tem-peratures ranging from 50 °C to 700 °C using increments of 50 °C.The total absorbed dose after 10,000 s was ∼600 Gy.
We expected a successive increase of the initial RF signal, trig-gered by the pre-dose effect, as described in Zimmerman [16] andMarazuev et al. [21]. A study by Krbetschek and Trautmann [32]showed that high temperature annealing of quartz up to 700 °C canlead to a UV-RF signal characterized by an exponential increasefollowed by a linear decrease. This behaviour was not observed inany of the studies by Martini et al. [31], although they used evenhigher temperatures (than reported by Krbetschek and Trautmann[32], up to 1100 °C). In these studies no exponential increase at thebeginning of the measurement was observed, just a decrease of theUV-RF signal directly after starting the measurement.
Fig. 1 shows the UV-RF signals for sample BT586 after differentpreheat temperatures normalized to the final data point. For pre-heat temperatures from 50 °C to 350 °C no substantial differenceswithin the signal shapes are visible and for the sake of clarity onlythe UV-RF curve for 50 °C is shown. The changes in these tem-perature interval are limited to a small decrease of the UV-RFsignal in the first seconds followed by a stable signal until the endof the measurements.
In the range from 400 °C to 550 °C an increase by a factor of∼1.2 (400 °C) to ∼2.6 (550 °C) of the initial UV-RF signal was ob-served. From 600 °C to 700 °C the signal dynamics decreased by afactor of 2 (600 °C) down to 1 (700 °C).
For the RF signal at 700 °C the maximum signal intensity is notobserved at the very beginning of the measurements, but thesignal builds up in the first channels (up to 3,000 s) and thendecreases. A similar behaviour was described by Krbetschek andTrautmann [32] for a quartz sample, after annealing it for 3 hoursat 700 °C followed by γ-irradiation.
The inset in Fig. 1 shows all measured data, but on a logarith-mic x-axis and not normalized. The strong increase in the firstchannel is caused by the opening of the shutter of the β-source.This takes up to ∼0.5 s and thus, the first channel comprises less

0 2000 4000 6000 8000 10000
1.0
1.2
1.4
1.6
1.8
2.0
Time [s]
Nor
mal
ized
RF
sign
al
48
1216
Time [s]
RF
sign
al [1
0 k
cts.
/s]
1 10 100 1000 10000
50 °C300 °C350 °C400 °C450 °C500 °C550 °C600 °C650 °C700 °C
Fig. 2. UV-RF signal for sample BT1195 for different preheat temperatures (holdingfor 120 s). The values are normalized to the last data point of each measurement.The total absorbed dose was 600 Gy during each RF measurement. For the sake ofclarity the UV-RF curves for preheat temperatures from 100 °C to 250 °C were re-moved, because no change was observed. The inset shows the same data as themain figure but with absolute values and a logarithmic x-axis.
0 2000 4000 6000 8000 10000
1.0
1.5
2.0
2.5
3.0
Time [s]
Nor
mal
ized
RF
sign
al
Cycle 1Cycle 2Cycle 3Cycle 4Cycle 5Cycle 6Cycle 7Cycle 8Cycle 9Cycle 10Cycle 1120
3040
5060
70
Time [s]
RF
sign
al [1
0 k
cts.
/s]
1 10 100 1000 10000
Increasingcycle number
Fig. 4. UV-RF signals for sample BT586 for 11 cycles for a preheat at 500 °C for120 s between each cycle. The total absorbed dose was 600 Gy for each RF cycle.The curves are normalized to the last data point. The inset shows the same data asthe main figure but with absolute values and a logarithmic x-axis.
J. Friedrich et al. / Journal of Luminescence 186 (2017) 318–325320
counts than the following ones. Note the very high signal in-tensities and the behaviour of the RF signal at 700 °C.
Fig. 3 shows the initial signal of the RF curves from Figs. 1 and 2normalized to the highest signal at 550 °C. Here all measuredpreheat temperatures are used and no differences are observed forpreheat temperatures from 100 °C to 250 °C. For both samples astrong peak at 550 °C is observable. The sharp increase and de-crease at lower and higher temperatures, respectively, indicate achange in the RF signal behaviour. The term ‘initial signal’ is usedas the difference between the second and the last data pointmeasured.
A similar behaviour to that of sample BT586 was observed forsample BT1195 (see Fig. 2). However, both samples show a slightlydifferent behaviour as the signals with a preheat temperature from50 °C to 250 °C first increase and at temperatures from 350 °C to650 °C the decrease is getting steeper the higher the temperaturesbecome. Such a rapid change in the signal dynamics is not ob-served for sample BT586 and the decrease of the signal is faster
100 200 300 400 500 600 700
0.0
0.2
0.4
0.6
0.8
1.0
Preheat temperature [°C]
Nor
mal
ized
initi
al R
F si
gnal
BT586BT1195
Fig. 3. Initial UV-RF signal for different preheat temperatures (holding for 120 s)for samples BT586 and BT1195 normalized to the initial signal at 550 °C.
than for BT586. The differences between 650 °C and 700 °C aremuch smaller than for BT586. The inset in Fig. 2 shows that thesignal intensities are lower by a factor ∼3 (for 550 °C) in contrastto sample BT586.
3.2. Signal stability tests
To test the UV-RF signal stability for repeated measurementcycles, a second experiment was designed measuring the RF signal11 times with a constant preheat of 500 °C (5 K s�1, holding time120 s) prior to each signal readout.
A similar measurement was performed by Martini et al. [13,Fig. 4] and they observed an enhancement of the 3.44 eV(360 nm) band after each cycle. In contrast to Martini et al. [13]we did not measure a spectrum, but measured only the UV wa-velength region (see Section 2.2). Fig. 4 shows the results of thesemeasurements, again normalized to the last data point. The firsttwo cycles show different slopes than the other ones. For cycles3 to 11 the slope of the curves is not changing, only the signalintensity increases. The inset shows the same data as in the mainfigure, but on a logarithmic x-axis and with absolute count valuesfor the RF signal. Here the successive increase of the initial signalby a factor of ∼3 over 11 cycles is observed as well as similarcurve shapes. Analogue UV-RF signal behaviour was found forsample BT1195 (not shown here). Our results are in accordancewith the results by Martini et al. [13] and show an increase of theinitial signal intensity.
4. Quartz UV-RF simulations
4.1. Defining the model
In a first simulation attempt to reproduce the obtained ex-perimental results, the comprehensive quartz model developed byBailey [15] was used with minor modifications (see Table 2), sinceit is successful in simulating several TL and OSL phenomena inquartz. These modifications were necessary in order to simulatethe RF curves obtained from our experiments.
Fig. 5 shows the energy-band diagram the model is based on.To better understand the modifications applied later, the mainaspects of the model by Bailey [15] are listed briefly; for a detailed

Fig. 5. Schematic diagram of the comprehensive Bailey [15] model for quartz.
Table 1Description of the abbreviations used in the differential equations.
Abbreviation Description Unit
nc Concentration of electrons in the conduction band −cm 3
nv Concentration of holes in the valence band −cm 3
Ni Concentration of electron traps −cm 3
ni Concentration of trapped electrons −cm 3
si Frequency factor for electron traps −s 1
Ei Electron trap depth below the conduction band eVNj Concentration of hole centres −cm 3
nj Concentration of trapped holes in centres −cm 3
sj Frequency factor for hole centres −s 1
Ej Hole depth above the valence band eVAi Conduction band to electron trap transition
probability−cm s3 1
Aj Valence band to hole centre transition probability −cm s3 1
Bj Conduction band to hole centre transitionprobability
−cm s3 1
P Stimulation photon fluxs0i Photo eviction constant s�1
EthiThermal assistance energy eV
kB Boltzmann constant −eV K 1
T Absolute temperature KR Ionisation rate (pair production rate) − −cm s3 1
t Time s
J. Friedrich et al. / Journal of Luminescence 186 (2017) 318–325 321
explanation of the levels, the reader is referred to Bailey [15]:
� Level 1 represents the 110 °C TL shallow electron trap, whichgives rise to a TL peak at ∼100 °C when measured with aheating rate of 5 K s�1,
� level 2 represents a generic 230 °C TL level, as found in manysedimentary quartz samples. Photo-excitation of charge fromthis level is not allowed,
� levels 3 and 4 are usually termed ‘fast’ and ‘medium’ OSLcomponents (e.g., [33]) and yield TL peaks at ∼330 °C as well asgive rise to the OSL emission used for dating,
� level 5 is a deep, thermally disconnected electron trap. This wasproposed in order to explain several TL and OSL phenomenabased on competition between energy levels,
� levels 6–9 are hole trapping centres acting as recombinationcentres for optically or thermally released electrons or forelectrons which recombine directly after they reached theconduction band. Levels 6 and 7 are defined as thermally un-stable, non-radiative recombination centres, similar to the holereservoirs first introduced by Zimmerman [34,16] in order toexplain the pre-dose sensitization phenomenon in quartz. Level8 is a thermally stable, radiative recombination centre termedthe ‘luminescence’ (L) centre. Level 9 is defined as a thermallystable, non-radiative recombination centre termed ‘killer’(K) centre. Holes can be thermally transferred from the twohole reservoirs (levels 6 and 7, R1 and R2) into the luminescencecentre and the killer centre via the valence band.
Pagonis et al. [35] stated that the levels 1, 6, 7 and 8 play afundamental role for the pre-dose phenomenon, while we willargue in Section 4.3 that levels 5, 6 and 8 are vital for reproducingthe UV-RF experimental results shown in Section 3 with thechosen model of Bailey [15].
The following differential Eqs. (1)–(4) describe the charge flowin quartz in the context of luminescence production and are to besolved in this study. The total number of equations that need to besolved depends on the number of electron traps (q) and holecentres (r). For the case of the complete Bailey [15] model q¼5 andr¼4. In Section 4.3 we use a simplified model with q¼1 and r¼2.
σ= ·( − )· − · · · − · · ( )− ( · ) − ( · )n
tn N n A n P e n s e
dd 1
ic i i i i i
E k Ti i
E k T0
/ /thi B i B
= ·( − )· − · · − · · ( )− ( · )n
tn N n A n s e n n B
d
d 2j
v j j j j jE k T
c j j/j B
( )∑ ∑= − − · ·( )= = +
+nt
Rnt
n n Bdd
dd 3
c
i
qi
j q
q r
c j j1 1
⎛⎝⎜
⎞⎠⎟
( )∑ ∑= − − · ·( )= +
+
= +
+nt
Rn
tn n B
dd
d
d 4
v
j q
q rj
j q
q r
c j j1 1
⎛⎝⎜
⎞⎠⎟
A short description of the used abbreviations is given in Table 1and in detail in Bailey [15].
Table 3 shows in schematic form the steps simulated for theexperiments shown in Section 2. After each excitation stage in thesimulations a relaxation period is introduced in which the tem-perature of the sample is kept constant at 20 °C for 60 s after theexcitation has stopped (R¼0), and the concentrations of nc and nvdecay to negligible values. When the temperature of the next si-mulation step is not the same as in the current step, the numericalsolution simulates a cooling or heating period with a constant rateof β¼5 K s�1.
Bailey [15] originally administered the burial dose at an ele-vated temperature of 220 °C and used a very high dose rate of0.01 Gy s�1 (step 7 in Table 3). In the modified step 7 above, weused a much lower dose rate of 10�11 Gy s�1 for the burial dose.This dose rate is closer to the typical environmental dose ratevalues, and an irradiation temperature of 20 °C [36]. Step 1 inTable 3 is simulated with a dose rate of 1 Gy s�1 in order to reducecomputation times. Step 3 (‘geological time’) is used to emptyshallow electron traps and hole centres. Thus, thermally unstabletraps and centres are minimally populated after step 3. Theseconditions are supported by measurements of natural quartzsamples (for details see [15], Section 2.5).
It is well known for quartz that thermal transfer can take placefrom the hole reservoirs (level 6 and 7 in Table 2) into the L-centre(level 8 in Table 2), causing sensitivity changes in general andspecifically the pre-dose effect [16,34].
As discussed in Bailey [15], the ionization rate R depends on theexact experimental conditions, namely the strength of the irradiationsource and the irradiation geometry. The choice of the R value in theBailey [15] model is arbitrary; hence we adjusted this value so thatthe simulated RF results are similar to our experimental RF data.
For the simulations shown here we used the same ionizationrate as Bailey [15], except for step 10 of the simulation sequence(Table 3), where we employed a dose rate of 0.006 Gy s�1, which
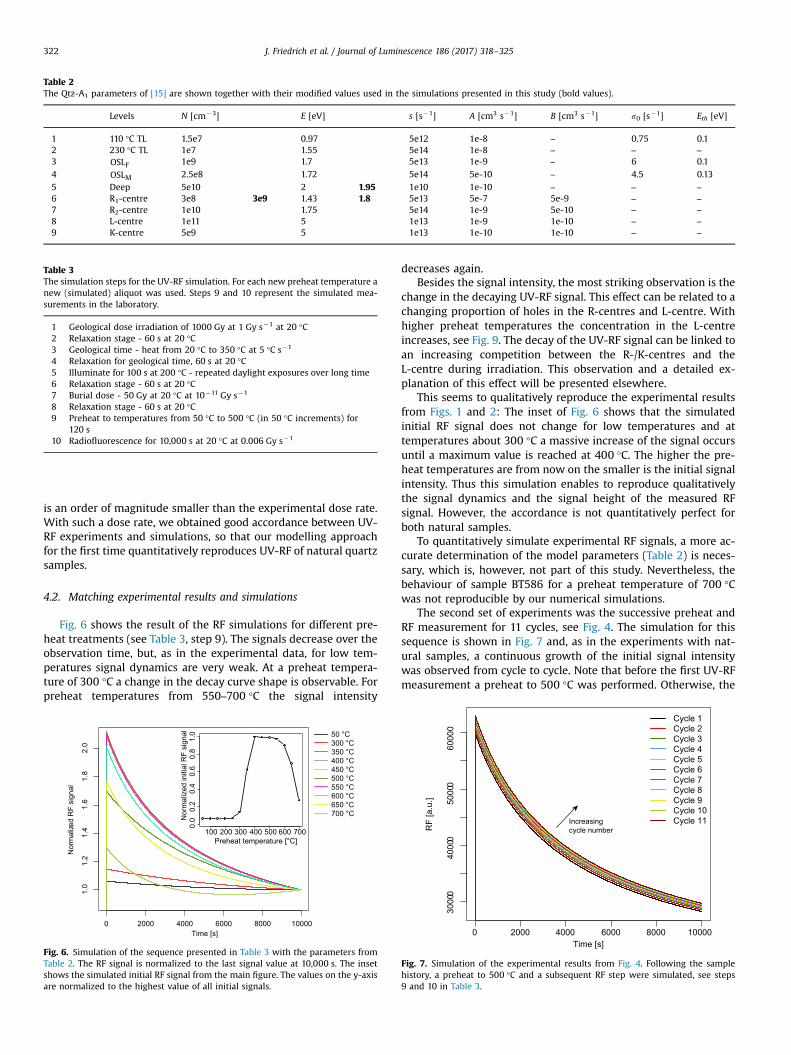
Table 2The Qtz-A1 parameters of [15] are shown together with their modified values used in the simulations presented in this study (bold values).
Levels N [cm�3] E [eV] s [s�1] A [cm3 s�1] B [cm3 s�1] s0 [s�1] Eth [eV]
1 110 °C TL 1.5e7 0.97 5e12 1e-8 – 0.75 0.12 230 °C TL 1e7 1.55 5e14 1e-8 – – –
3 OSLF 1e9 1.7 5e13 1e-9 – 6 0.14 OSLM 2.5e8 1.72 5e14 5e-10 – 4.5 0.135 Deep 5e10 2 1.95 1e10 1e-10 – – –
6 R1-centre 3e8 3e9 1.43 1.8 5e13 5e-7 5e-9 – –
7 R2-centre 1e10 1.75 5e14 1e-9 5e-10 – –
8 L-centre 1e11 5 1e13 1e-9 1e-10 – –
9 K-centre 5e9 5 1e13 1e-10 1e-10 – –
Table 3The simulation steps for the UV-RF simulation. For each new preheat temperature anew (simulated) aliquot was used. Steps 9 and 10 represent the simulated mea-surements in the laboratory.
1 Geological dose irradiation of 1000 Gy at 1 Gy s�1 at 20 °C2 Relaxation stage - 60 s at 20 °C3 Geological time - heat from 20 °C to 350 °C at 5 °C s�1
4 Relaxation for geological time, 60 s at 20 °C5 Illuminate for 100 s at 200 °C - repeated daylight exposures over long time6 Relaxation stage - 60 s at 20 °C7 Burial dose - 50 Gy at 20 °C at 10�11 Gy s�1
8 Relaxation stage - 60 s at 20 °C9 Preheat to temperatures from 50 °C to 500 °C (in 50 °C increments) for
120 s10 Radiofluorescence for 10,000 s at 20 °C at 0.006 Gy s�1
J. Friedrich et al. / Journal of Luminescence 186 (2017) 318–325322
is an order of magnitude smaller than the experimental dose rate.With such a dose rate, we obtained good accordance between UV-RF experiments and simulations, so that our modelling approachfor the first time quantitatively reproduces UV-RF of natural quartzsamples.
4.2. Matching experimental results and simulations
Fig. 6 shows the result of the RF simulations for different pre-heat treatments (see Table 3, step 9). The signals decrease over theobservation time, but, as in the experimental data, for low tem-peratures signal dynamics are very weak. At a preheat tempera-ture of 300 °C a change in the decay curve shape is observable. Forpreheat temperatures from 550–700 °C the signal intensity
100 200 300 400 500 600 700
0.0
0.2
0.4
0.6
0.8
1.0
Preheat temperature [°C]
Nor
mal
ized
initi
al R
F si
gnal
0 2000 4000 6000 8000 10000
1.0
1.2
1.4
1.6
1.8
2.0
Time [s]
Nor
mal
ized
RF
sign
al
50 °C300 °C350 °C400 °C450 °C500 °C550 °C600 °C650 °C700 °C
Fig. 6. Simulation of the sequence presented in Table 3 with the parameters fromTable 2. The RF signal is normalized to the last signal value at 10,000 s. The insetshows the simulated initial RF signal from the main figure. The values on the y-axisare normalized to the highest value of all initial signals.
decreases again.Besides the signal intensity, the most striking observation is the
change in the decaying UV-RF signal. This effect can be related to achanging proportion of holes in the R-centres and L-centre. Withhigher preheat temperatures the concentration in the L-centreincreases, see Fig. 9. The decay of the UV-RF signal can be linked toan increasing competition between the R-/K-centres and theL-centre during irradiation. This observation and a detailed ex-planation of this effect will be presented elsewhere.
This seems to qualitatively reproduce the experimental resultsfrom Figs. 1 and 2: The inset of Fig. 6 shows that the simulatedinitial RF signal does not change for low temperatures and attemperatures about 300 °C a massive increase of the signal occursuntil a maximum value is reached at 400 °C. The higher the pre-heat temperatures are from now on the smaller is the initial signalintensity. Thus this simulation enables to reproduce qualitativelythe signal dynamics and the signal height of the measured RFsignal. However, the accordance is not quantitatively perfect forboth natural samples.
To quantitatively simulate experimental RF signals, a more ac-curate determination of the model parameters (Table 2) is neces-sary, which is, however, not part of this study. Nevertheless, thebehaviour of sample BT586 for a preheat temperature of 700 °Cwas not reproducible by our numerical simulations.
The second set of experiments was the successive preheat andRF measurement for 11 cycles, see Fig. 4. The simulation for thissequence is shown in Fig. 7 and, as in the experiments with nat-ural samples, a continuous growth of the initial signal intensitywas observed from cycle to cycle. Note that before the first UV-RFmeasurement a preheat to 500 °C was performed. Otherwise, the
0 2000 4000 6000 8000 10000
3000
040
000
5000
060
000
Time [s]
RF
[a.u
.]
Cycle 1Cycle 2Cycle 3Cycle 4Cycle 5Cycle 6Cycle 7Cycle 8Cycle 9Cycle 10Cycle 11Increasing
cycle number
Fig. 7. Simulation of the experimental results from Fig. 4. Following the samplehistory, a preheat to 500 °C and a subsequent RF step were simulated, see steps9 and 10 in Table 3.

Fig. 8. (a) Same simulation as for Figs. 6 and 7 (b) but using the simplified model with energy levels 5, 6 and 8 only (see Table 2).
100 200 300 400 500 600 700
0.0
0.2
0.4
0.6
0.8
1.0
Preheat temperature [°C]
Nor
mal
ized
con
cent
ratio
n
deep trapR−centreL−centre
Fig. 9. The concentration of electrons in the deep trap and holes in the R-centreand the L-centre after the preheat step (step 9 in Table 3) for the simplified three-energy-level model. The values are normalized to the total amount of electrons.
J. Friedrich et al. / Journal of Luminescence 186 (2017) 318–325 323
signal for the first cycle would not decrease over time. In contrastto the experimental data, the signal for cycle 1 has the same cur-vature as all other cycles and so only the signal height is changingfor each new cycle.
4.3. Further simulation results
In order to understand the charge movements of the UV-RFsignal with different preheat temperatures, we simplified the usedquartz model down to three energy levels, which produces ap-proximately the same results as the complete model, but is easierto interpret.
For this purpose the deep electron trap, the R1-centre and theL-centre were chosen. Figs. 8(a) and (b) show the same simula-tions as Figs. 6 and 7 but with only three energy levels and theresults appear to be in very good accordance with the results ob-tained for the comprehensive Bailey [15] model. Signal intensitiesfrom this simplified three-energy-level model are ∼30% higherthan compared to the complete parameter set in the originalmodel, which can be explained by the absence of competing trapsin which electrons can be captured. Thus, the probability of a di-rect recombination with the L-centre is higher and consequently ahigher signal intensity is observed. The curve shape after nor-malizing to the last value of the RF signal is in very good agree-ment with Fig. 6, justifying the application of the simplified modelfor further analyses.
In the following we used the simplified three-energy-levelmodel. To better understand the dynamics of the charge flows inthe system, a closer look at the numerical solutions is necessary.For this we investigated the concentrations of the deep trap andthe two hole centres at the beginning of the RF step (see Table 3,step 10).
Fig. 9 shows the concentration of electrons in the deep trap andholes in the R-centre and the L-centre for the simplified model as afunction of the preheat temperature after the preheat step andhence before the beginning of the RF simulation. The concentra-tions are normalized to the total amount of electrons in the sys-tem. The results of Fig. 9 strongly indicate that the modelsuccessfully describes the pre-dose activation process, which isbelieved to result from holes transferring from the R-centre intothe L-centre during the heating of the sample in the temperaturerange 300–400 °C [16]. If the preheat temperature increases, theconcentration of holes in the L-centre is increased, while thecorresponding concentration of holes in the hole reservoir R
decreases by the same total amount. The results of Fig. 9 also showthat an activation temperature in the region of 300–400 °C issufficiently high to transfer all holes from the hole reservoir R intothe luminescence centre L. In contrast to the simulations by Pa-gonis et al. [35], Fig. 2b, the concentration of electrons does notremain constant during even higher temperatures, but decreasesand so does the number of holes in the L-centre. This is possiblebecause the temperatures are high enough to release electronsfrom the deep electron trap and charge neutrality forces thenumber of available holes to decrease; consequently the intensityof the luminescence signal decreases. This mechanism may ex-plain the measured and simulated initial RF signal in Figs. 3 and 6and it is capable of explaining why the decrease of the UV-RFsignal is much weaker at temperatures above 550 °C.
Furthermore we investigated the behaviour for the initial UV-RFsignal for different burial doses (see step 7 in Table 3). Fig. 10(a) showsthe initial signal for different preheat temperatures from 50 °C to500 °C and for different simulated burial doses in step 7 in the samplehistory of the quartz sample (see Table 3). The higher the simulatedburial dose, the higher are the initial signals as well as the peak at400 °C. A detailed view is provided by Fig. 10(b): The initial RF signal at

Fig. 10. Simulations for different burial doses for step 7 in the sample history (see step 7 in Table 3). (a) shows initial RF signals for different preheat temperatures and for6 different burial doses. (b) is a detailed view on the initial RF signal at 450 °C. The initial signal was plotted against the simulated burial dose.
J. Friedrich et al. / Journal of Luminescence 186 (2017) 318–325324
a preheat temperature of 450 °C is plotted against the simulated burialdose and an increasing dose-response curve can be extracted from thesimulated data. Note that Fig. 10(a) only provides 6 different burialdoses. Fig. 10(b) shows the numerical solution for burial doses from0 Gy to 10,000 Gy using increments of 500 Gy.
In summary, the results of these simulations show that theinitial signal of the quartz UV-RF depends on the burial dose. Amultiple aliquot additive dose (MAAD) protocol with convenientpreheat temperatures might be used for determining the burialdose. Marazuev et al. [21] first used this technique to determinethe equivalent dose of quartz extracted from bricks in Chernobyl,but they used X-ray excitation. In their experiments, they focusedon the difference between the initial signal and the signal after acertain time, the final kinetic equilibrium, and they used a preheatof 510 °C for 10 minutes. In contrast to our simulation findings,they observed a linearity in their dose-response curve for very lowdoses only. Nevertheless, our results indicate that with the UV-RFtechnique a determination of the equivalent dose in quartz ispossible and needs to be (re-)investigated in a separate study.
5. Discussion
‘Modeling is important for the purpose of determining if sug-gested mechanisms can indeed produce the effects observed in thepractice’ [37]. The presented model and the interpretation of theresults show indeed the accordance of model predictions andexperimental results. Nevertheless it is important to test themodel to determine ‘what is possible with the model, and what isnot possible’ [37]. We have run several tests with the parameterset presented in Table 2 (TL peak shift with different heating rates,thermal activation characteristics, dose-recovery tests, OSL beha-viour; see supplementary material) and all investigated phenom-ena produced meaningful results.
Nevertheless, simulated results should always be handled withcare, as they describe a phenomenological point of view. To usethe dependency of the initial signal height on the burial dose as adating method one important requirement is the zeroing of theluminescence signal. From Fig. 10 one can deduce that a non zerosignal of the initial RF signal for a preheat temperature of 450 °C isobtained in simulations for a burial dose equal to zero. The growthof the initial RF signal with the burial dose is a result of the dose
dependence of the hole concentration in the luminescence centres(see Fig. 5). The concentration of this centre, however, is growingalso before the zeroing event and optical bleaching is not sufficientto reduce it down to zero. Fig. 9 shows that this is in principlepossible when heating a sample to very high temperatures. This isin accordance with the published literature for determining anequivalent dose with quartz UV-RF [21], because they used bricksto determine the radiation dose related to the Chernobyl accident[21]. When burning these bricks all electron traps and hole centreswere emptied and the requirement of a complete zeroing thesignal was fulfilled. Nevertheless, Marazuev et al. [21] also de-termined equivalent doses for natural quartzes but they alsomentioned that this UV-RF approach will work for small dosesonly. Investigating this in detail is not part of this contribution.
As described in Schmidt et al. [9], RF offers new insights into therecombination centres, due to the fact that quartz RF signals are be-lieved to correspond to the direct recombination of electrons from theconduction band. Schmidt et al. [9] argue that the RF technique pro-vides information primarily on the recombination centres involved.Our results seem to confirm these ideas, since the increase of the in-itial RF signal appears to be a consequence of the movement oftrapped holes from the reservoir centres to luminescence centres. Inaddition, our preheat experiments and simulations indicate that thedeep traps play a fundamental role in the description of quartz RFsignals. At high temperatures the deep traps get emptied and so doesthe concentration of holes in the luminescence centres (see Fig. 9).
It should also be noted that the rapid change in the initial RFheight occurs after the transition from α- to β- quartz at a tem-perature of 573 °C (at normal pressure). Due to the fact that all RFmeasurements were performed at RT and the samples were cooleddown from the preheat temperatures to RT in nitrogen atmo-sphere, a transition back from β- to α- quartz appears to be likely.This transition is not part of the simulations but in the simulationsthis behaviour is indicated by emptying the deep electron traps.
6. Conclusions
A systematic investigation of UV-RF signals on two quartzsamples (BT586 and BT1196) after preheat temperatures rangingfrom 50 °C to 700 °C was presented. For both samples the beha-viour was similar: for low temperatures no differences in the UV-

J. Friedrich et al. / Journal of Luminescence 186 (2017) 318–325 325
RF signal dynamics and in the initial signal height was observed.For preheat temperatures > °400 C a significant rise in the initialheight was noticeable as well as a decreasing signal. The initialsignal was increasing until a peak was reached at a preheat of550 °C. From this temperature on, the signal intensity was de-creasing rapidly. For sample BT586 a change in the signal dy-namics was detected for very high preheat temperatures: thesignal is not decreasing during the complete stimulation time butbuilds up until 3,000 s and then decreases. Note that BT1195 wascompletely bleached before the measurements and BT586 stillcarries its natural dose. Nevertheless, both samples show a verysimilar behaviour.
Another preheat experiment showed that the initial RF signalsare rising, if repeated cycles of preheating to 500 °C for 120 s andsubsequent RF measurements were executed. These dynamics aresimilar to what is already known as the ‘pre-dose’ effect in quartz.This observation was similar for both samples.
In order to simulate these experimental results, a slightly modifiedBailey [15] model was used successfully. The different initial signalintensities and dynamics of the UV-RF signal could be simulated withgood accordance between numerical and experimental results.
In addition to the successful simulation of the experimentaldata, we used a simplified model with three energy levels to ob-tain further insights. A theoretical explanation of the observeddecrease of the initial signal height for high preheat temperaturesis given, because the deep electron traps are emptied and theavailable concentration of holes in the luminescence centre L isdecreasing and so are the signal intensities. Simulations ad-ditionally showed that the height of the RF signal depends on theburial dose of the sample. Brik et al. [38] and Marazuev et al. [21]reported this and used this fact to determine the burial dose.However, further experiments and studies are needed to establishthis pre-dose method.
Acknowledgements
Initial UV-RF measurements and preparation of the samplesBT586 and BT1195 were carried out within the framework of theproject “Radiofluorescence of quartz: Challenges towards a datingapplication” (DFG, 2013–2015, SCHM 3051/2-1 und FU 417/16-1and DAAD-PPP USA, 2013–2014, Prof. Dr. Markus Fuchs, id:56022859). JF is gratefully supported by the DFG (2015–2018,“Modelling quartz luminescence signal dynamics relevant for datingand dosimetry”, SCHM 3051/4-1). SK was supported by the ANR(no. ANR-10-LABX-52). We also thank the two anonymous re-viewers for their helpful suggestions.
Appendix A. Supplementary data
Supplementary data associated with this article can be found inthe online version at http://dx.doi.org/10.1016/j.jlumin.2017.02.039.
References
[1] R. Chen, S.W.S. McKeever, Theory of Thermoluminescence and Related Phe-nomena, World Scientific, Singapore, 1997.
[2] V. Pagonis, G. Kitis, R. Chen, Applicability of the Zimmerman predose model inthe thermoluminescence of predosed and annealed synthetic quartz samples,Radiat. Meas. 37 (2003) 267–274.
[3] R. Chen, V. Pagonis, Modelling thermal activation characteristics of the sensitizationof thermoluminescence in quartz, J. Phys. D: Appl. Phys. 37 (2004) 159.
[4] A. Chruścińska, Modelling the thermal bleaching of OSL signal in the case of acompetition between recombination centres, Radiat. Meas. 44 (2009)329–337.
[5] B. Subedi, G. Kitis, V. Pagonis, Simulation of the influence of thermal
quenching on thermoluminescence glow-peaks, physica status solidi (a) 207,2010, pp. 1216–1226.
[6] R. Chen, V. Pagonis, Thermally and Optically Stimulated Luminescence: A Si-mulation Approach, John Wiley & Sons, Chichester, 2011.
[7] V. Pagonis, M.L. Chithambo, R. Chen, A. Chruścińska, M. Fasoli, S.H. Li,M. Martini, K. Ramseyer, Thermal dependence of luminescence lifetimes andradioluminescence in quartz, J. Lumin. 145 (2014) 38–48.
[8] E.O. Oniya, Dependence of heating rates of thermal activation on thermalactivation characteristics of 110 °C C TL peak of quartz: a simulation approach,Radiat. Phys. Chem. 115 (2015) 171–178.
[9] C. Schmidt, S. Kreutzer, R. DeWitt, M. Fuchs, Radiofluorescence of quartz: areview, Quat. Geochronol. 27 (2015) 66–77.
[10] H. Fujita, T. Hashimoto, Influence of radioluminescence on optically stimulatedluiminescence from natural quartz grains, Radioisotopes 55 (2006) 117–123.
[11] N. Shimizu, N. Mitamura, A. Takeuchi, T. Hashimoto, Dependence of radi-oluminescence on TL-properties in natural quartz, Radiat. Meas. 41 (2006)831–835.
[12] M. Martini, M. Fasoli, A. Galli, I. Villa, P. Guibert, Radioluminescence of syn-thetic quartz related to alkali ions, J. Lumin. 132 (2012) 1030–1036.
[13] M. Martini, M. Fasoli, I. Villa, P. Guibert, Radioluminescence of synthetic andnatural quartz, Radiat. Meas. 47 (2012) 846–850.
[14] V. Pagonis, J.L. Lawless, R. Chen, C. Andersen, Radioluminescence in Al O : C2 3 -analytical and numerical simulation results, J. Phys. D: Appl. Phys. 42 (2009)175107.
[15] R.M. Bailey, Towards a general kinetic model for optically and thermally sti-mulated luminescence of quartz, Radiat. Meas. 33 (2001) 17–45.
[16] J. Zimmerman, The radiation-induced increase of the 100° C thermo-luminescence sensitivity of fired quartz, J. Phys. C: Solid State Phys. 4 (1971)3265–3276.
[17] M. Fasoli, M. Martini, The composite nature of the thermoluminescence UVemission of quartz, J. Lumin. 173 (2016) 120–126.
[18] G. Adamiec, Investigation of a numerical model of the pre-dose mechanism inquartz, Radiat. Meas. 39 (2005) 175–189.
[19] V. Pagonis, H. Carty, Simulation of the experimental pre-dose technique forretrospective dosimetry in quartz, Radiat. Prot. Dosim. 109 (2004) 225–234.
[20] N. Itoh, D. Stoneham, A.M. Stoneham, The predose effect in thermo-luminescent dosimetry, J. Phys.: Condens. Matter 13 (2001) 2201.
[21] Y.A. Marazuev, A.B. Brik, V.Y. Degoda, Radioluminescent dosimetry of α-quartz, Radiat. Meas. 24 (1995) 565–569.
[22] T. Kolb, M. Fuchs, L. Zöller, Deciphering fluvial landscape evolution by lumi-nescence dating of river terrace formation: a case study from Northern Ba-varia, Germany. Z. für Geomorphol. (Suppl. 60) (2016) 29–48.
[23] F. Preusser, D. Degering, M. Fuchs, A. Hilgers, A. Kadereit, N. Klasen,M. Krbetschek, D. Richter, J.Q.G. Spencer, Luminescence dating: basics,methods and applications, Quat. Sci. J. 57 (2008) 95–149.
[24] D. Richter, A. Richter, K. Dornich, Lexsyg - A new system for luminescenceresearch, Geochronometria 40 (2013) 220–228.
[25] D. Richter, R. Pintaske, K. Dornich, M. Krbetschek, A novel beta source designfor uniform irradiation in dosimetric applications, Anc. TL 30 (2012) 57–63.
[26] R Development Core Team, R: A language and environment for statisticalcomputing. Vienna, Austria, 2016.
[27] S. Kreutzer, C. Schmidt, M.C. Fuchs, M. Dietze, M. Fischer, M. Fuchs, Introdu-cing an R package for luminescence dating analysis, Anc. TL 30 (2012) 1–8.
[28] S. Kreutzer, M. Dietze, C. Burow, M. C. Fuchs, C. Schmidt, M. Fischer, J. Frie-drich, N. Mercier, R. K. Smedley, J. Durcan, G. King, Luminescence: Compre-hensive Luminescence Dating Data Analysis, CRAN version 0.6.2, 2016. De-veloper version on GitHub: ⟨https://github.com/R-Lum/Luminescence⟩.
[29] J. Friedrich, S. Kreutzer, C. Schmidt, RLumModel: Modelling Ordinary Differ-ential Equations Leading to Luminescence, CRANversion 0.1.2, 2016. Developerversion on GitHub: ⟨https://github.com/R-Lum/RLumModel⟩.
[30] J. Friedrich, S. Kreutzer, C. Schmidt, Solving ordinary differential equations tounderstand luminescence: RLumModel, an advanced research tool for simu-lating luminescence in quartz using R, Quat. Geochronol. 35 (2016) 88–100.
[31] M. Martini, M. Fasoli, I. Villa, Defect studies in quartz: Composite nature of theblue and UV emissions, Nucl. Instruments Methods Phys. Res. Sect. B: BeamInteract. Mater. Atoms 327 (2014) 15–21.
[32] M. Krbetschek, T. Trautmann, A spectral radioluminescence study for datingand dosimetry, Radiat. Meas. 32 (2000) 853–857.
[33] R.M. Bailey, B.W. Smith, E.J. Rhodes, Partial bleaching and the decay formcharacteristics of quartz OSL, Radiat. Meas. 27 (1997) 123–136.
[34] J. Zimmerman, The radiation-induced increase of thermoluminescence sen-sitivity of the dosimetry phosphor LiF (TLD-100), J. Phys. C: Solid State Phys. 4(1971) 3277–3291.
[35] V. Pagonis, E. Balsamo, C. Barnold, K. Duling, S. McCole, Simulations of thepredose technique for retrospective dosimetry and authenticity testing, Ra-diat. Meas. 43 (2008) 1343–1353.
[36] V. Pagonis, G. Adamiec, C. Athanassas, R. Chen, A. Baker, M. Larsen,Z. Thompson, Simulations of thermally transferred OSL signals in quartz: ac-curacy and precision of the protocols for equivalent dose evaluation, Nucl.Instruments Methods Phys. Res. Sect. B: Beam Interact. Mater. atoms 269(2011) 1431–1443.
[37] S.W.S. McKeever, R. Chen, Luminescence models, Radiat. Meas. 27 (1997)625–661.
[38] A.B. Brik, V.Y. Degoda, Y.A. Marazuev, X-ray luminescence dosimetry of irra-diated quartz, J. Appl. Spectrosc. 60 (1994) 398–400.