quarterly update fy17 third quarter - investors | …/media/files/j/...6 johnson controls plc. –...
TRANSCRIPT

1 Johnson Controls plc. – July 27, 2017
Quarterly UpdateFY17 Third Quarter
July 27, 2017

2 Johnson Controls plc. – July 27, 2017
Johnson Controls International plc Cautionary Statement Regarding Forward-Looking Statements
Johnson Controls International plc has made statements in this communication that are forward-looking and therefore are subject to risks and uncertainties. All statements in this document other than statements of historical fact are, or could be, “forward-looking statements” within the meaning of the Private Securities Litigation Reform Act of 1995. In this communication, statements regarding Johnson Controls’ future financial position, sales, costs, earnings, cash flows, other measures of results of operations, synergies and integration opportunities, capital expenditures and debt levels are forward-looking statements. Words such as “may,” “will,” “expect,” “intend,” “estimate,” “anticipate,” “believe,” “should,” “forecast,” “project” or “plan” and terms of similar meaning are also generally intended to identify forward-looking statements. However, the absence of these words does not mean that a statement is not forward-looking. Johnson Controls cautions that these statements are subject to numerous important risks, uncertainties, assumptions and other factors, some of which are beyond Johnson Controls’ control, that could cause Johnson Controls’ actual results to differ materially from those expressed or implied by such forward-looking statements, including, among others, risks related to: any delay or inability of Johnson Controls to realize the expected benefits and synergies of recent portfolio transactions such as the merger with Tyco and the spin-off of Adient, changes in tax laws, regulations, rates, policies or interpretations, the loss of key senior management, the tax treatment of recent portfolio transactions, significant transaction costs and/or unknown liabilities associated with such transactions, the outcome of actual or potential litigation relating to such transactions, the risk that disruptions from recent transactions will harm Johnson Controls’ business, the strength of the U.S. or other economies, automotive vehicle production levels, mix and schedules, energy and commodity prices, the availability of raw materials and component products, currency exchange rates, and cancellation of or changes to commercial arrangements. A detailed discussion of risks related toJohnson Controls’ business is included in the section entitled “Risk Factors” in Johnson Controls’ Annual Report on Form 10-K for the 2016 fiscal year filed with the SEC on November 23, 2016, and in the quarterly reports on Form 10-Q filed with the SEC aftersuch date, and available at www.sec.gov and www.johnsoncontrols.com under the “Investors” tab. Shareholders, potential investorsand others should consider these factors in evaluating the forward-looking statements and should not place undue reliance on such statements. The forward-looking statements included in this communication are made only as of the date of this document, unless otherwise specified, and, except as required by law, Johnson Controls assumes no obligation, and disclaims any obligation, toupdate such statements to reflect events or circumstances occurring after the date of this communication.

3 Johnson Controls plc. – July 27, 2017
Non GAAP Financial Information
This presentation contains financial information regarding adjusted earnings per share, which is a non-GAAP performance measure.The adjusting items include mark-to-market for pension plans, transaction/integration/separation costs, restructuring and impairment costs, nonrecurring purchase accounting impacts related to the Tyco merger and discrete tax items. Financial information regarding adjusted sales, organic sales, adjusted segment EBITA, adjusted segment EBITA margin and adjusted free cash flow are also presented, which are non-GAAP performance measures. Adjusted segment EBITA excludes special items such as transaction/integration/separation costs and nonrecurring purchase accounting impacts because these costs are not considered to be directly related to the operating performance of its business units. Management believes that, when considered together withunadjusted amounts, these non-GAAP measures are useful to investors in understanding period-over-period operating results and business trends of the Company. Management may also use these metrics as guides in forecasting, budgeting and long-term planning processes and for compensation purposes. These metrics should be considered in addition to, and not as replacements for, the most comparable GAAP measure. Reconciliations of non-GAAP performance measures can be found in the attached footnotes.

4 Johnson Controls plc. – July 27, 2017
Agenda
Third quarter highlightsAlex Molinaroli, Chairman and Chief Executive Officer
IntroductionAntonella Franzen, Vice President, Investor Relations
Financial review & guidanceBrian Stief, Executive Vice President and Chief Financial Officer
Q&A
2
4
5
1
Integration update & business resultsGeorge Oliver, President and Chief Operating Officer3
4 Johnson Controls plc. – July 27, 2017

5 Johnson Controls plc. – July 27, 2017
Continuing To Execute Despite Slower Top-line Growth
Solid quarter of earnings per share growth
Strong margin expansion
Integration and productivity savings continue to track to high-end of range
Slower than expected top-line growth
Cash conversion below planned levels
Full Year guided to low-end of previous range- $2.60 to $2.62, reflecting 13% increase year-over-year
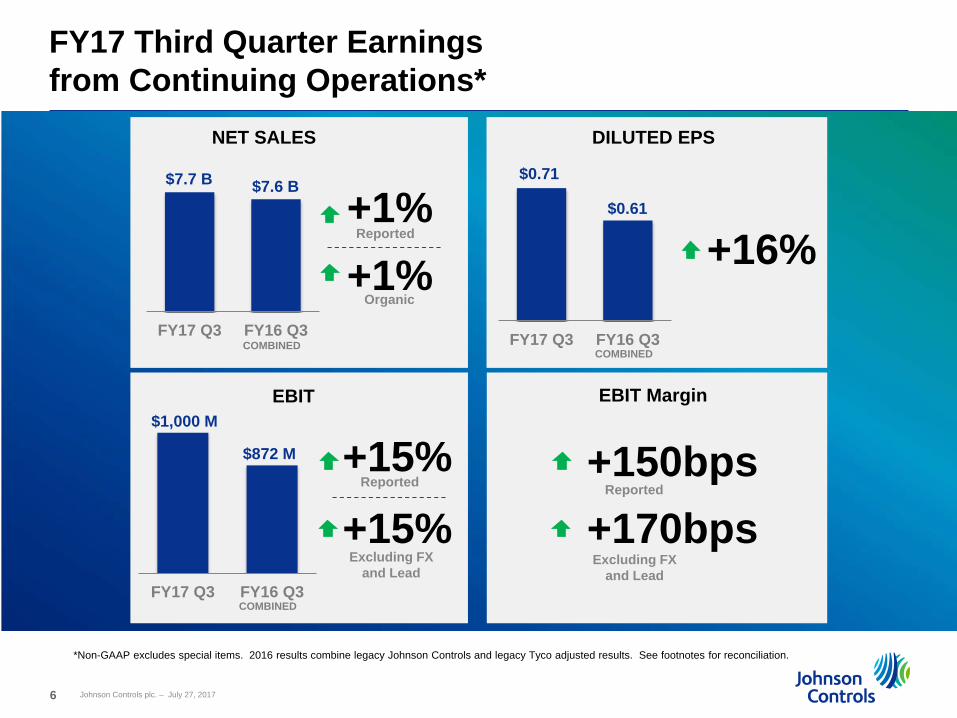
6 Johnson Controls plc. – July 27, 2017
FY17 Third Quarter Earnings from Continuing Operations*
+1%+1%
FY17 Q3 FY16 Q3
$7.7 B $7.6 B
NET SALES
FY17 Q3 FY16 Q3
$1,000 M
$872 M
EBIT
+15%
+16%
DILUTED EPS
FY17 Q3 FY16 Q3
$0.71
$0.61
Organic
COMBINED
COMBINED
COMBINED
Reported
*Non-GAAP excludes special items. 2016 results combine legacy Johnson Controls and legacy Tyco adjusted results. See footnotes for reconciliation.
Reported
+15% Excluding FX
and Lead
EBIT Margin
Reported
+170bps Excluding FX
and Lead
+150bps
7 Johnson Controls plc. – July 27, 2017
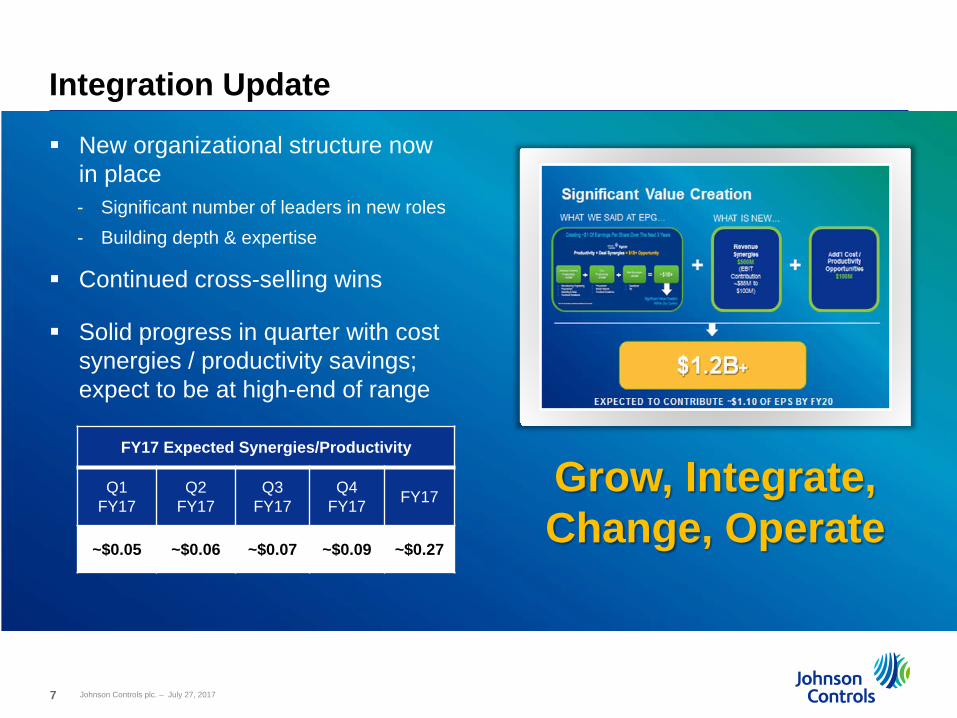
Integration Update
New organizational structure now in place- Significant number of leaders in new roles- Building depth & expertise
Continued cross-selling wins
Solid progress in quarter with cost synergies / productivity savings; expect to be at high-end of range
Grow, Integrate, Change, Operate
FY17 Expected Synergies/Productivity
Q1 FY17
Q2 FY17
Q3 FY17
Q4 FY17 FY17
~$0.05 ~$0.06 ~$0.07 ~$0.09 ~$0.27

8 Johnson Controls plc. – July 27, 2017
Building Technologies & Solutions*Strong Margin Expansion
Flat+2%
FY17 Q3 FY16 Q3
$6.1B
NET SALES
+7%
FY17 Q3 FY16 Q3
$908 M $845 M
SEGMENT EBITA
Organic
Organic sales growth of +2%
Field +1% - Applied HVAC up mid-single digits- Fire & Security down low-single digits
Products +4%- Resi / light-commercial HVAC up high-single digits- Hitachi up high-single digits- Fire & Security flat
Segment EBITA margin +110bps Productivity savings and cost synergies Modest volume leverage and favorable mix Product and channel investments
COMBINED
COMBINED
Reported
Excluding FX
Reported
+8%
*Non-GAAP excludes special items. 2016 results combine legacy Johnson Controls and legacy Tyco adjusted results. See footnotes for reconciliation.
$6.1B

9 Johnson Controls plc. – July 27, 2017
Building Technologies & SolutionsOrders & Backlog
Orders secured +1% vs prior year (ex. FX and M&A) - Field flat- Products +4%
Backlog $8.4B, +3% vs prior year (ex. FX and M&A)
Q3 FY17COMBINED
Q3 FY16Y-o-Y
Ex. FX and M&A
Backlog $8.4B $8.2B +3%

10 Johnson Controls plc. – July 27, 2017
Power Solutions*Increased Profitability and Margins
Segment EBITA margin +40 bps;(+160 bps excluding lead)
Lower volumes Favorable product mix Productivity savings
+6%(2%)
FY17 Q3 FY16 Q3
$1.6 B$1.5 B
NET SALES
FY17 Q3 FY16 Q3
$304 M
$281 M
SEGMENT EBITA
OE shipments (down 6%); lower production in US and EMEA
Aftermarket (down 2%); market expectation for lead price reductions
Global shipments of start-stop +17%- China +79%- Americas +47%- EMEA (3%)
Organic
Reported
*Non-GAAP excludes special items. See footnotes for reconciliation.
+8%+7%
Excluding FX and Lead
Reported
11 Johnson Controls plc. – July 27, 2017
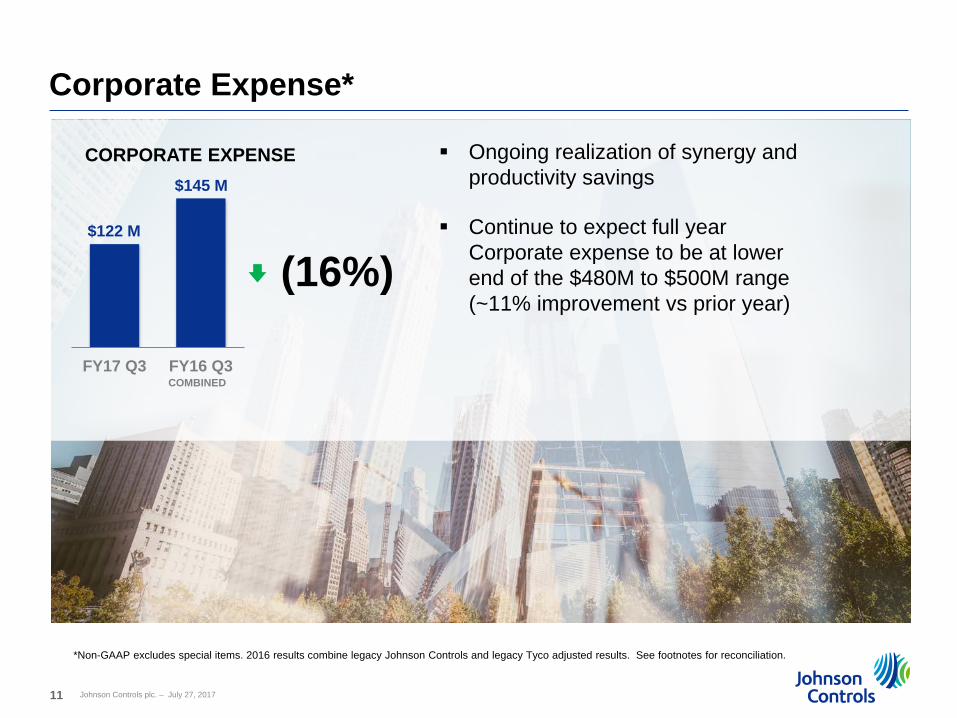
Corporate Expense*
Ongoing realization of synergy and productivity savings
Continue to expect full year Corporate expense to be at lower end of the $480M to $500M range (~11% improvement vs prior year)
(16%)
FY17 Q3 FY16 Q3
$122 M
$145 M
CORPORATE EXPENSE
COMBINED
*Non-GAAP excludes special items. 2016 results combine legacy Johnson Controls and legacy Tyco adjusted results. See footnotes for reconciliation.

12 Johnson Controls plc. – July 27, 2017
FY17 Third QuarterFinancial Highlights (continuing operations)
(in millions)2017GAAP
2017 *NON-GAAP
COMBINED2016 *NON-GAAP
% Change
Sales $7,683 $7,669 $7,597 1%
Gross profit% of sales
2,43131.6%
2,42031.6%
2,41231.7%
-
SG&A expenses 1,609 1,489 1,585 (6%)
Restructuring & impairment costs 49 - -
Equity income 69 69 45 53%
EBIT $842 $1,000 $872 15%
11.0% 13.0% 11.5%
SG&A expenses Ongoing productivity and synergy savings
Equity income Increase due to Power & Hitachi JVs
EBIT margin +150 bps reflects realization of cost synergies and productivity savings, partially offset by higher lead prices; +170bps adjusted for FX and lead
*Non-GAAP excludes special items. 2016 results combine legacy Johnson Controls and legacy Tyco adjusted results. See footnotes for reconciliation.

13 Johnson Controls plc. – July 27, 2017
(in millions, except earnings per share)2017GAAP
2017 *NON-GAAP
COMBINED2016 *NON-GAAP
EBIT $842 $1,000 $872
Net financing charges 124 124 110
Income before income taxes 718 876 762
Income tax provision 89 131 130
Net income 629 745 632
Income attributable to noncontrolling interests 74 74 56
Net income attributable to JCI $555 $671 $576
Diluted EPS $0.59 $0.71 $0.61
FY17 Third QuarterFinancial Highlights (continuing operations)
Net financing charges Increase due to second quarter debt issuances
Income tax provision Tax rate of 15% in 2017 and 17% in 2016
Noncontrolling interests Increase due to improved performance in consolidated Hitachi JVs
*Non-GAAP excludes special items. 2016 results combine legacy Johnson Controls and legacy Tyco adjusted results. See footnotes for reconciliation.
14 Johnson Controls plc. – July 27, 2017
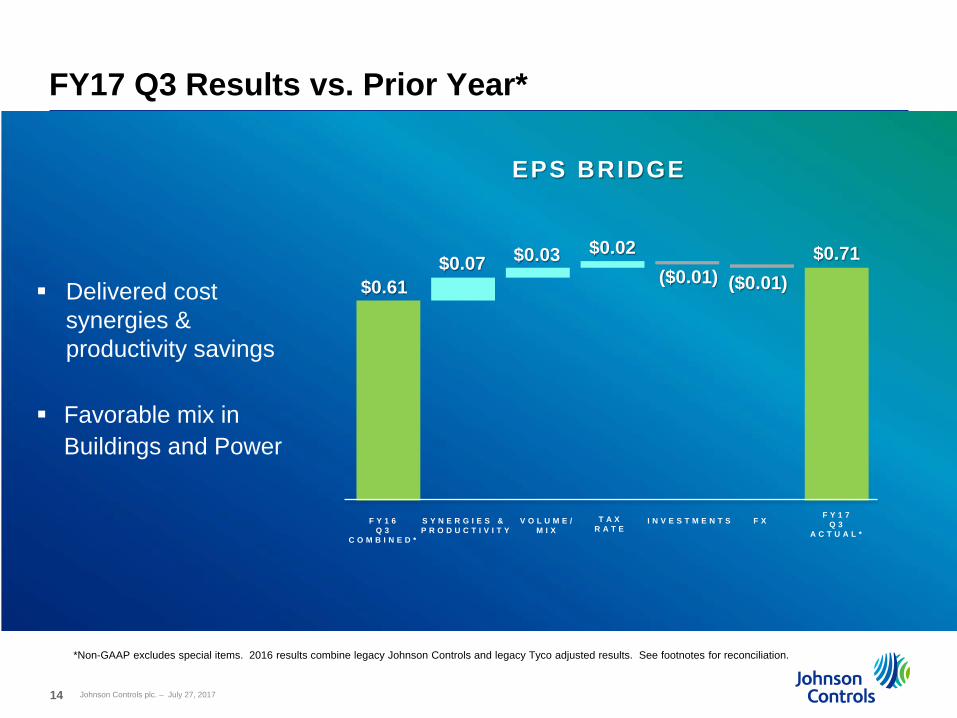
FY17 Q3 Results vs. Prior Year*
Delivered cost synergies & productivity savings
Favorable mix in Buildings and Power
*Non-GAAP excludes special items. 2016 results combine legacy Johnson Controls and legacy Tyco adjusted results. See footnotes for reconciliation.
$0.71 ($0.01) ($0.01)
$0.07 $0.03 $0.02
$0.61
EPS BRIDGE
F Y 1 6 Q 3
C O M B I N E D *
S Y N E R G I E S &P R O D U C T I V I T Y
V O L U M E /M I X
I N V E S T M E N T SF Y 1 7
Q 3A C T U A L *
F XT A XR A T E

15 Johnson Controls plc. – July 27, 2017
$ In billions
Free Cash Flow
Adjusted free cash flow of $0.2 billion year-to-date; impacted by several items- Continued PS inventory build of $0.4B- Deferred compensation equity hedge $0.1B- Timing of equity affiliate dividends $0.1B
Capex in-line with expectations
Ongoing restructuring and integration costs incurred to deliver cost synergies and productivity savings
Expect FY17 Q4 adjusted free cash flow of ~$0.9B
FY17Q3 Q3 YTD
Cash (used) / provided by operating activities $ 0.2 $(1.3)
Capital expenditures (0.3) (1.0)Reported free cash flow (0.1) (2.3)
Adjustments:
Transaction tax payments 0.1 1.4Adient cash outflow - 0.3
Transaction related restructuring and change in control pension distributions 0.1 0.4
Transaction/integration/separation costs 0.1 0.4
Adjusted free cash flow $ 0.2 $ 0.2
16 Johnson Controls plc. – July 27, 2017
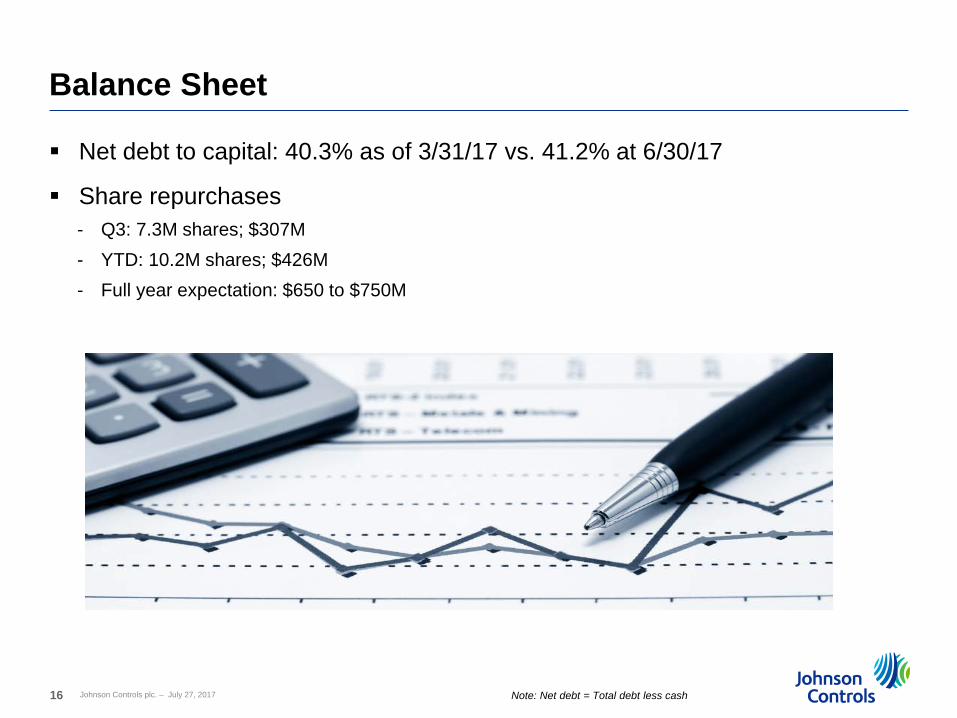
Balance Sheet
Net debt to capital: 40.3% as of 3/31/17 vs. 41.2% at 6/30/17
Share repurchases- Q3: 7.3M shares; $307M- YTD: 10.2M shares; $426M- Full year expectation: $650 to $750M
Note: Net debt = Total debt less cash

17 Johnson Controls plc. – July 27, 2017
Other Items
Q4 Special items- Restructuring and impairment costs- Transaction / integration costs- Pension / OPEB mark-to-market- Income taxes
Buildings reportable segment change expected in Q4- Will provide quarterly new segments for fiscal 2017 with Q4 earnings
Previously announced divestiture of Scott Safety expected to close in Q1 of fiscal 2018

18 Johnson Controls plc. – July 27, 2017
FY17 Q4 Guidance vs. Prior Year*
FY17 Q4 OUTLOOK
Sales $8.1B to $8.2B
Organic Growth 2% to 3%
FX Headwind neutral
Net M&A ActivityIncl. Divestiture ~($70M)
EBIT Margin Expansion +70 to 90 bps
Diluted Shares ~940M
EPS* $0.86 to $0.88(+13% to +16% Y-o-Y)
$0.86 -$0.88
($0.01) $0.09 $0.01 $0.02
$0.76
EPS BRIDGE
F Y 1 6 Q 4
C O M B I N E D *
S Y N E R G I E S &P R O D U C T I V I T Y
V O L U M E /M I X
I N V E S T M E N T S F Y 1 7 Q 4
G U I D A N C E *
T A XR A T E
*Non-GAAP excludes special items. 2016 results combine legacy Johnson Controls and legacy Tyco adjusted results.

19 Johnson Controls plc. – July 27, 2017
2017 Full Year Guidance
APRIL GUIDANCE CURRENT GUIDANCE
Sales $30.0B to $30.2B $30.1B to $30.2B
Organic Growth ~3% ~2%
FX Headwind ~($380M) ~($160M)
Net M&A ActivityIncl. Divestiture ~($250M) ~($250M)
EBIT Margin Expansion +80 to 110bps ~90bps
Diluted Shares ~945M ~945M
EPS* $2.60 to $2.68(+13% to +16% Y-o-Y)
$2.60 to $2.62(+13% Y-o-Y)
*Non-GAAP excludes special items.

20 Johnson Controls plc. – July 27, 2017
Appendix

21 Johnson Controls plc. – July 27, 2017
Building Technologies & SolutionsSegment Detail
Sales Growth (Organic)
Orders Growth (Organic)
FY17 Q3 FY17 Q3
Building EfficiencySystems & Services North America 2% (1%)
Products North America 2% 3%
Asia 9% 11%
Rest of World 1% 2%
4% 5%
Tyco (1%) (4%)
Buildings 2% 1%
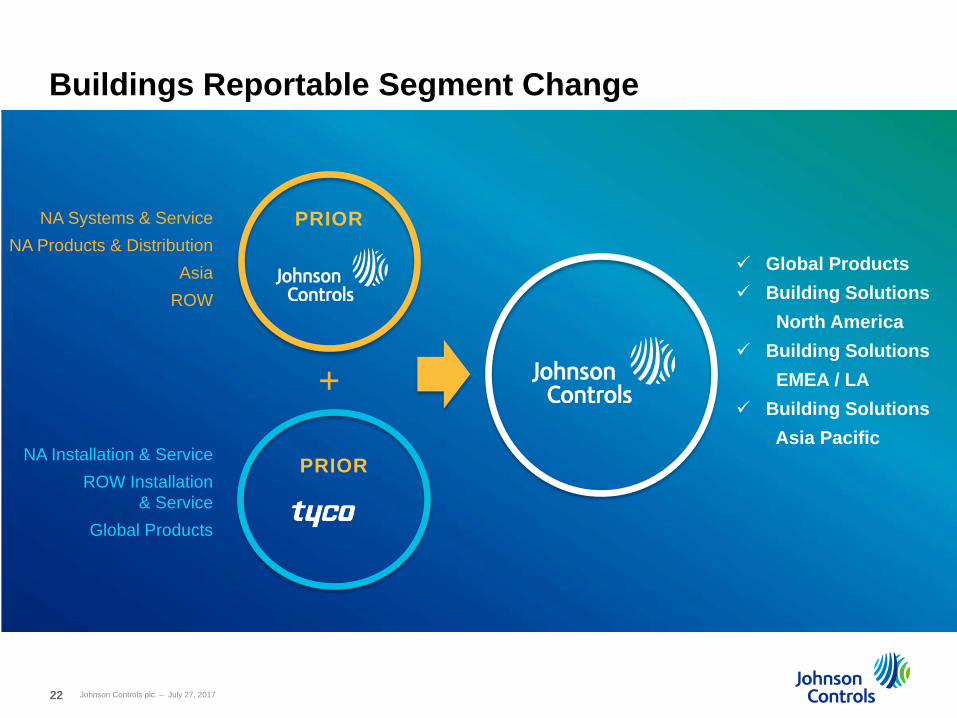
22 Johnson Controls plc. – July 27, 2017
PRIORNA Systems & ServiceNA Products & Distribution
AsiaROW
PRIORNA Installation & ServiceROW Installation
& ServiceGlobal Products
+
Global Products Building Solutions
North America Building Solutions
EMEA / LA Building Solutions
Asia Pacific
Buildings Reportable Segment Change

23 Johnson Controls plc. – July 27, 2017
Special Items (continuing operations)
Q3 Pre-tax Income (Expense)
Tax (Expense) Benefit
NCI (Expense) Benefit
After-tax Income (Expense) EPS Impact*
Transaction Costs ($16) $2 $- ($14) ($0.01)
Integration Costs (54) 9 - (45) (0.05)
Restructuring & Impairment Costs (49) 15 - (34) (0.04)
Non-Recurring Purchase Accounting 6 (2) - 4 -
Pension Mark-to-Market (45) 18 - (27) (0.03)
Total ($158) $42 $- ($116) ($0.12)
$ In millions, except EPS
*May not sum due to rounding
Q3 YTD Pre-tax Income (Expense)
Tax (Expense) Benefit
NCI (Expense) Benefit
After-tax Income (Expense) EPS Impact*
Transaction/Separation Costs ($113) $12 $- ($101) ($0.11)
Integration Costs (229) 41 - (188) (0.20)
Restructuring & Impairment Costs (226) 49 - (177) (0.19)
Non-Recurring Purchase Accounting (135) 36 - (99) (0.10)
Pension Mark-to-Market 90 (36) - 54 0.06
Discrete Income Tax Items - (356) - (356) (0.38)
Total ($613) ($254) $- ($867) ($0.92)

24 Johnson Controls plc. – July 27, 2017
Third Quarter YTD FY17 Restructuring and Impairment Costs
Restructuring and Non-cash Impairment Charges Primarily Related to Workforce Reductions and Asset Impairments
Business Unit Cash Non-cash TotalQ3 YTD Q3 YTD Q3 YTD
Building Technologies & Solutions $6 $94 $27 $49 $33 $143
Power Solutions - - 4 4 4 4
Corporate 12 62 - 17 12 79
Total pre-tax charge $18 $156 $31 $70 $49 $226
Tax impact (15) (49)
Total after-tax charge $34 $177
$ In millions

25 Johnson Controls plc. – July 27, 2017
2017 Full Year Foreign Exchange Impact
April FX GuidanceFY17 Q2 Earnings Call
Current FX GuidanceFY17 Q3 Earnings Call
2017 SalesHeadwind
($380M)(~1%)
($160M)(~1%)
2017 EPS Headwind ($0.05) ($0.03)
Top Foreign Currency ExposuresMarch FX Rates
FY17 Q2 Earnings CallCurrent FX Rates
FY17 Q3 Earnings Call
EUR/USD 1.07 1.15
USD/JPY 113.00 112.00
USD/CNY 6.89 6.75
USD/CAD 1.34 1.26
GBP/USD 1.23 1.30
USD/MXN 19.30 17.50

26 Johnson Controls plc. – July 27, 2017
johnsoncontrols.com/investors@JCI_IR

July 27, 2017
2017 2016
Net sales 7,683$ 5,154$ Cost of sales 5,252 3,732
Gross profit 2,431 1,422
Selling, general and administrative expenses (1,609) (895) Restructuring and impairment costs (49) (27) Net financing charges (124) (65) Equity income 69 45
Income from continuing operations before income taxes 718 480
Income tax provision 89 78
Income from continuing operations 629 402
Income from discontinued operations, net of tax - 57
Net income 629 459
Less: Income from continuing operationsattributable to noncontrolling interests 74 55
Less: Income from discontinued operationsattributable to noncontrolling interests - 21
Net income attributable to JCI 555$ 383$
Income from continuing operations 555$ 347$ Income from discontinued operations - 36
Net income attributable to JCI 555$ 383$
Diluted earnings per share from continuing operations 0.59$ 0.53$ Diluted earnings per share from discontinued operations - 0.06Diluted earnings per share 0.59$ 0.59$
Diluted weighted average shares 944.4 649.7 Shares outstanding at period end 932.4 637.7
JOHNSON CONTROLS INTERNATIONAL PLC
CONDENSED CONSOLIDATED STATEMENTS OF INCOME(in millions, except per share data; unaudited)
Three Months Ended June 30,
27

July 27, 2017
2017 2016
Net sales 22,036$ 14,583$ Cost of sales 15,210 10,617
Gross profit 6,826 3,966
Selling, general and administrative expenses (4,905) (2,641) Restructuring and impairment costs (226) (87) Net financing charges (376) (202) Equity income 177 127
Income from continuing operations before income taxes 1,496 1,163
Income tax provision 570 202
Income from continuing operations 926 961
Loss from discontinued operations, net of tax (34) (481)
Net income 892 480
Less: Income from continuing operationsattributable to noncontrolling interests 147 116
Less: Income from discontinued operationsattributable to noncontrolling interests 9 61
Net income attributable to JCI 736$ 303$
Income from continuing operations 779$ 845$ Loss from discontinued operations (43) (542)
Net income attributable to JCI 736$ 303$
Diluted earnings per share from continuing operations 0.82$ 1.30$ Diluted loss per share from discontinued operations (0.05) (0.83) Diluted earnings per share * 0.78$ 0.47$
Diluted weighted average shares 946.8 651.5 Shares outstanding at period end 932.4 637.7
* May not sum due to rounding.
JOHNSON CONTROLS INTERNATIONAL PLC
CONDENSED CONSOLIDATED STATEMENTS OF INCOME(in millions, except per share data; unaudited)
Nine Months Ended June 30,
28

July 27, 2017
June 30, September 30,2017 2016
ASSETSCash and cash equivalents 458$ 579$ Accounts receivable - net 6,443 6,394 Inventories 3,384 2,888 Assets held for sale 2,082 5,812 Other current assets 1,595 1,436
Current assets 13,962 17,109
Property, plant and equipment - net 5,870 5,632 Goodwill 19,619 21,024 Other intangible assets - net 6,727 7,540 Investments in partially-owned affiliates 1,159 990 Noncurrent assets held for sale - 7,374 Other noncurrent assets 3,349 3,510
Total assets 50,686$ 63,179$
LIABILITIES AND EQUITYShort-term debt and current portion of long-term debt 2,499$ 1,706$ Accounts payable and accrued expenses 4,768 5,333 Liabilities held for sale 247 4,276 Other current liabilities 4,001 5,016
Current liabilities 11,515 16,331
Long-term debt 11,772 11,053 Other noncurrent liabilities 6,595 6,583 Noncurrent liabilities held for sale - 3,888 Redeemable noncontrolling interests 189 234 Shareholders' equity attributable to JCI 19,731 24,118 Noncontrolling interests 884 972
Total liabilities and equity 50,686$ 63,179$
CONDENSED CONSOLIDATED STATEMENTS OF FINANCIAL POSITION(in millions; unaudited)
JOHNSON CONTROLS INTERNATIONAL PLC
29
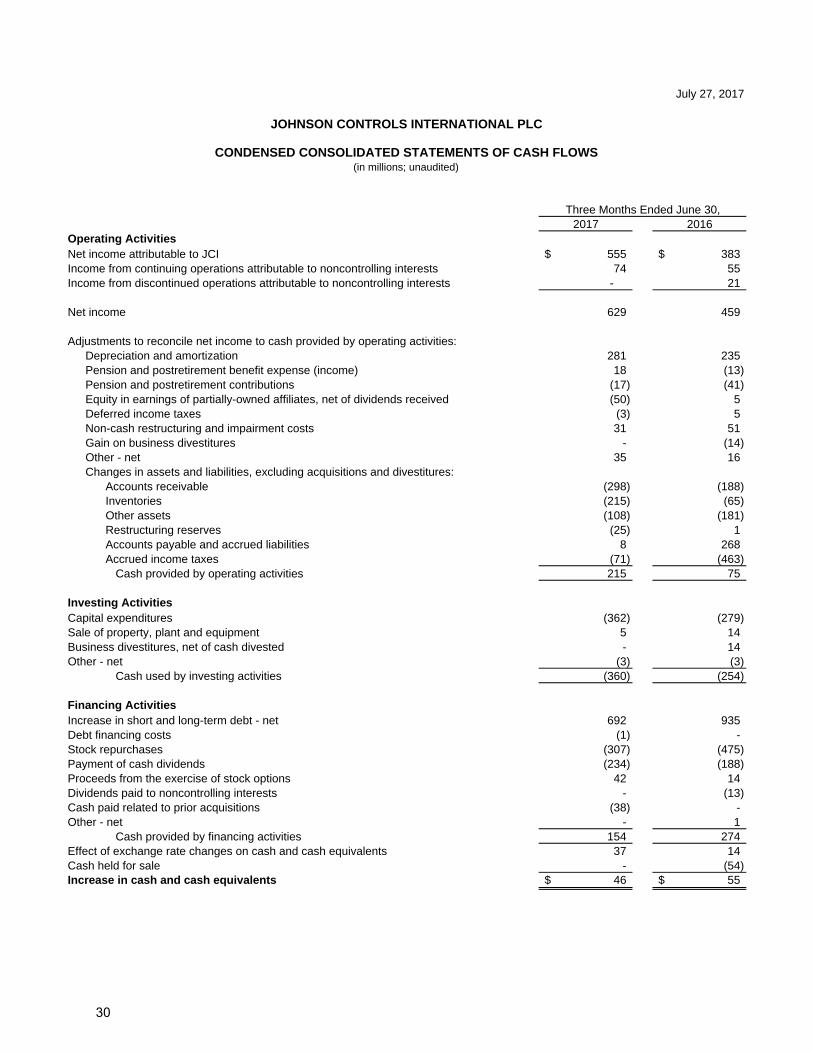
July 27, 2017
Three Months Ended June 30,2017 2016
Operating ActivitiesNet income attributable to JCI 555$ 383$ Income from continuing operations attributable to noncontrolling interests 74 55 Income from discontinued operations attributable to noncontrolling interests - 21
Net income 629 459
Adjustments to reconcile net income to cash provided by operating activities:Depreciation and amortization 281 235 Pension and postretirement benefit expense (income) 18 (13) Pension and postretirement contributions (17) (41) Equity in earnings of partially-owned affiliates, net of dividends received (50) 5 Deferred income taxes (3) 5 Non-cash restructuring and impairment costs 31 51 Gain on business divestitures - (14) Other - net 35 16 Changes in assets and liabilities, excluding acquisitions and divestitures:
Accounts receivable (298) (188) Inventories (215) (65) Other assets (108) (181) Restructuring reserves (25) 1 Accounts payable and accrued liabilities 8 268 Accrued income taxes (71) (463)
Cash provided by operating activities 215 75
Investing ActivitiesCapital expenditures (362) (279) Sale of property, plant and equipment 5 14 Business divestitures, net of cash divested - 14 Other - net (3) (3)
Cash used by investing activities (360) (254)
Financing ActivitiesIncrease in short and long-term debt - net 692 935 Debt financing costs (1) - Stock repurchases (307) (475) Payment of cash dividends (234) (188) Proceeds from the exercise of stock options 42 14 Dividends paid to noncontrolling interests - (13) Cash paid related to prior acquisitions (38) - Other - net - 1
Cash provided by financing activities 154 274 Effect of exchange rate changes on cash and cash equivalents 37 14 Cash held for sale - (54) Increase in cash and cash equivalents 46$ 55$
JOHNSON CONTROLS INTERNATIONAL PLC
CONDENSED CONSOLIDATED STATEMENTS OF CASH FLOWS(in millions; unaudited)
30

July 27, 2017
Nine Months Ended June 30,2017 2016
Operating ActivitiesNet income attributable to JCI 736$ 303$ Income from continuing operations attributable to noncontrolling interests 147 116 Income from discontinued operations attributable to noncontrolling interests 9 61
Net income 892 480
Adjustments to reconcile net income to cash provided (used) by operating activities:Depreciation and amortization 919 680 Pension and postretirement benefit income (184) (47) Pension and postretirement contributions (275) (94) Equity in earnings of partially-owned affiliates, net of dividends received (166) (202) Deferred income taxes 1,056 336 Non-cash restructuring and impairment costs 70 80 Gain on business divestitures - (14) Other - net 117 68 Changes in assets and liabilities, excluding acquisitions and divestitures:
Accounts receivable (319) (113) Inventories (585) (233) Other assets (258) (47) Restructuring reserves 22 68 Accounts payable and accrued liabilities (608) (43) Accrued income taxes (2,002) (223)
Cash provided (used) by operating activities (1,321) 696
Investing ActivitiesCapital expenditures (996) (822) Sale of property, plant and equipment 23 28 Acquisition of businesses, net of cash acquired (6) (133) Business divestitures, net of cash divested 180 54 Other - net (33) 2
Cash used by investing activities (832) (871)
Financing ActivitiesIncrease in short and long-term debt - net 1,468 1,261 Debt financing costs (18) - Stock repurchases (426) (475) Payment of cash dividends (469) (544) Proceeds from the exercise of stock options 130 34 Dividends paid to noncontrolling interests (78) (240) Dividend from Adient spin-off 2,050 - Cash transferred to Adient related to spin-off (665) - Cash paid related to prior acquisitions (75) - Other - net (2) 4
Cash provided by financing activities 1,915 40 Effect of exchange rate changes on cash and cash equivalents 12 5 Cash held for sale 105 (76) Decrease in cash and cash equivalents (121)$ (206)$
JOHNSON CONTROLS INTERNATIONAL PLC
CONDENSED CONSOLIDATED STATEMENTS OF CASH FLOWS(in millions; unaudited)
31

July 27, 2017FOOTNOTES
1. Financial Summary
(in millions; unaudited)
ActualAdjusted
Non-GAAP ActualAdjusted
Non-GAAP ActualAdjusted
Non-GAAP ActualAdjusted
Non-GAAPNet sales (1)Building Technologies & Solutions 6,074$ 6,060$ 3,635$ 3,635$ 16,831$ 16,797$ 9,741$ 9,741$ Power Solutions 1,609 1,609 1,519 1,519 5,205 5,205 4,842 4,842 Net sales 7,683$ 7,669$ 5,154$ 5,154$ 22,036$ 22,002$ 14,583$ 14,583$
Segment EBITA (1)Building Technologies & Solutions 912$ 908$ 440$ 447$ 2,000$ 2,114$ 915$ 940$ Power Solutions 304 304 280 281 996 997 922 923 Segment EBITA 1,216 1,212 720 728 2,996 3,111 1,837 1,863 Corporate expenses (2) (172) (122) (126) (94) (605) (358) (323) (237) Amortization of intangible assets (3) (108) (90) (22) (22) (383) (285) (62) (62) Mark-to-market gain (loss) for pension plans (4) (45) - - - 90 - - - Restructuring and impairment costs (5) (49) - (27) - (226) - (87) - EBIT (6) 842 1,000 545 612 1,872 2,468 1,365 1,564 Net financing charges (7) (124) (124) (65) (65) (376) (359) (202) (202) Income from continuing operations before income taxes 718 876 480 547 1,496 2,109 1,163 1,362 Income tax provision (8) (89) (131) (78) (94) (570) (316) (202) (235) Income from continuing operations 629 745 402 453 926 1,793 961 1,127 Income from continuing operations attributable to noncontrolling interests (9) (74) (74) (55) (57) (147) (147) (116) (131) Net income from continuing operations attributable to JCI 555$ 671$ 347$ 396$ 779$ 1,646$ 845$ 996$
In the first quarter of fiscal 2017, the Company began evaluating the performance of its business units primarily on segment earnings before interest, taxes and amortization (EBITA), which represents income from continuing operations before income taxes and noncontrolling interests, excluding general corporate expenses, intangible asset amortization, net financing charges, significant restructuring and impairment costs, and the net mark-to-market adjustments related to pension and postretirement plans. Historical information has been revised to present the comparable periods on a consistent basis. Also in the first quarter of fiscal 2017, the Company began reporting the Automotive Experience business as a discontinued operation, which required retrospective application to previously reported financial information. As a result, the segment EBITA amounts shown below are for continuing operations and exclude the Automotive Experience business. In addition, the financial results for the three and nine months ended June 30, 2016 exclude the Tyco business.
Nine Months Ended June 30,2017 2016
Three Months Ended June 30,2016
Building Technologies & Solutions - Provides facility systems and services including comfort, energy and security management for the non-residential buildings market, and provides heating, ventilating, and air conditioning products and services, security products and services, fire detection and suppression products and services, and life safety products for the residential and non-residential building markets.
2017
Power Solutions - Services both automotive original equipment manufacturers and the battery aftermarket by providing advanced battery technology, coupled with systems engineering, marketing and service expertise.
32

July 27, 2017
(in millions)2017 2016 2017 2016 2017 2016
Net sales as reported 6,074$ $ 3,635 1,609$ $ 1,519 7,683$ $ 5,154
Adjusting items: Nonrecurring purchase accounting impacts (14) - - - (14) -
Adjusted net sales 6,060$ 3,635$ 1,609$ 1,519$ 7,669$ 5,154$
Segment EBITA as reported 912$ 440$ 304$ 280$ 1,216$ 720$ Segment EBITA margin as reported 15.0% 12.1% 18.9% 18.4% 15.8% 14.0%
Adjusting items: Transaction costs 6 - - 1 6 1 Integration costs 14 7 - - 14 7 Nonrecurring purchase accounting impacts (24) - - - (24) -
Adjusted segment EBITA 908$ 447$ 304$ 281$ 1,212$ 728$ Adjusted segment EBITA margin 15.0% 12.3% 18.9% 18.5% 15.8% 14.1%
(in millions)2017 2016 2017 2016 2017 2016
Net sales as reported 16,831$ $ 9,741 5,205$ $ 4,842 22,036$ $ 14,583
Adjusting items: Nonrecurring purchase accounting impacts (34) - - - (34) -
Adjusted net sales 16,797$ 9,741$ 5,205$ 4,842$ 22,002$ 14,583$
Segment EBITA as reported 2,000$ 915$ 996$ 922$ 2,996$ 1,837$ Segment EBITA margin as reported 11.9% 9.4% 19.1% 19.0% 13.6% 12.6%
Adjusting items: Transaction costs 33 10 1 1 34 11 Integration costs 44 15 - - 44 15 Nonrecurring purchase accounting impacts 37 - - - 37 -
Adjusted segment EBITA 2,114$ 940$ 997$ 923$ 3,111$ 1,863$ Adjusted segment EBITA margin 12.6% 9.6% 19.2% 19.1% 14.1% 12.8%
Building Technologies & Solutions
(2) Adjusted Corporate expenses for the three months ended June 30, 2017 excludes $40 million of integration costs and $10 million of transaction costs. Adjusted Corporate expenses for the nine months ended June 30, 2017 excludes $185 million of integration costs, $58 million of transaction costs and $4 million of separation costs. Adjusted Corporate expenses for the three months ended June 30, 2016 excludes $21 million of transaction costs and $11 million of separation costs. Adjusted Corporate expenses for the nine months ended June 30, 2016 excludes $46 million of separation costs and $40 million of transaction costs.
Power Solutions Consolidated JCI plc
The following is the nine months ended June 30, 2017 and 2016 reconciliation of net sales, segment EBITA and segment EBITA margin as reported to adjusted net sales, adjusted segment EBITA and adjusted segment EBITA margin (unaudited):
Building Technologies & Solutions Power Solutions Consolidated JCI plc
(3) Adjusted amortization of intangible assets for the three and nine months ended June 30, 2017 excludes $18 million and $98 million, respectively, of nonrecurring asset amortization related to Tyco purchase accounting.
The following is the three months ended June 30, 2017 and 2016 reconciliation of net sales, segment EBITA and segment EBITA margin as reported to adjusted net sales, adjusted segment EBITA and adjusted segment EBITA margin (unaudited):
(1) The Company's press release contains financial information regarding adjusted net sales, adjusted segment EBITA and adjusted segment EBITA margins, which are non-GAAP performance measures. The Company's definition of adjusted segment EBITA excludes special items because these costs are not considered to be directly related to the underlying operating performance of its business units. Management believes these non-GAAP measures are useful to investors in understanding the ongoing operations and business trends of the Company.
33

July 27, 2017
2. 2016 Supplemental Combined Information
(5) The three and nine months ended June 30, 2017 restructuring and impairment charges of $49 million and $226 million, respectively, are excluded from the adjusted non-GAAP results. The three and nine months ended June 30, 2016 restructuring and impairment charges of $27 million and $87 million, respectively, are excluded from the adjusted non-GAAP results.
(7) Adjusted net financing charges for the nine months ended June 30, 2017 exclude $17 million of transaction costs related to the debt exchange offers.
(8) Adjusted income tax provision for the three months ended June 30, 2017 excludes the tax benefits of the pension mark-to-market loss of $18 million, restructuring and impairment costs of $15 million, integration costs of $9 million and transaction costs of $2 million, partially offset by the tax provision for Tyco nonrecurring purchase accounting impacts of $2 million. Adjusted income tax provision for the nine months ended June 30, 2017 excludes the non-cash tax charge of $457 million related to establishment of a deferred tax liability on the outside basis difference of the Company’s investment in certain subsidiaries of the Scott Safety business and the tax provision for the pension mark-to-market net gain of $36 million, partially offset by the tax benefits of changes in entity tax status of $101 million, restructuring and impairment costs of $49 million, integration costs of $41 million, Tyco nonrecurring purchase accounting impacts of $36 million and transaction costs of $12 million. Adjusted income tax provision for the three months ended June 30, 2016 excludes the tax benefits of restructuring and impairment costs of $12 million, transaction costs of $3 million and integration costs of $1 million. Adjusted income tax provision for the nine months ended June 30, 2016 excludes the tax benefits of restructuring and impairment costs of $24 million, transaction costs of $6 million, integration costs of $2 million and separation costs of $1 million.
(9) Adjusted income from continuing operations attributable to noncontrolling interests for the three months ended June 30, 2016 excludes $2 million for the noncontrolling interest impact of integration costs. Adjusted income from continuing operations attributable to noncontrolling interests for the nine months ended June 30, 2016, excludes $9 million for the noncontrolling interest impact of transaction/integration costs and $6 million for the noncontrolling interest impact of restructuring and impairment costs.
(6) Management defines earnings before interest and taxes (EBIT) as income from continuing operations before net financing charges, income taxes and noncontrolling interests.
(4) The three months ended June 30, 2017 pension mark-to-market loss of $45 million and the nine months ended June 30, 2017 pension mark-to-market gain of $90 million due to lump sum payouts for certain U.S. pension plans are excluded from the adjusted non-GAAP results.
As a result of the reverse merger between JCI and Tyco, which closed on September 2, 2016, the Company is providing supplemental combined financial information. As supplemental information that management believes will be useful to investors, the Company has provided unaudited selected historical information which combines JCI’s historical Building Efficiency business with historical Tyco results of operations as if these businesses had been operated together during the periods presented.
The merger is accounted for as a reverse acquisition with JCI considered to be acquiring Tyco for accounting purposes. As a result, the amounts reflected in Column A in the below table present the historical results of JCI, revised for the reporting changes described within footnote 1 above. The amounts in Column B reflect the impact of the special items, as set forth in the notes to the table and within footnote 1 above. The amounts in Column C reflect the inclusion of Tyco’s historical results for the period prior to the merger on an adjusted basis.
For the avoidance of doubt, this supplemental combined information is not intended to be, and was not, prepared on a basis consistent with the unaudited pro forma condensed combined financial information in Exhibit 99.3 to the Company’s Current Report on Form 8-K/A filed October 3, 2016 with the U.S. Securities and Exchange Commission (the “Pro Forma 8-K/A Filing”), which provides the pro forma financial information required by Item 9.01(b) of Form 8-K. The supplemental combined information is intentionally different from, but does not supersede, the pro forma financial information in the Pro Forma 8-K/A Filing.
In addition, the supplemental combined information does not purport to indicate the results that actually would have been obtained had the JCI and Tyco businesses been operated together on the basis of the new segment structure during the periods presented, or which may be realized in the future.
34
July 27, 2017
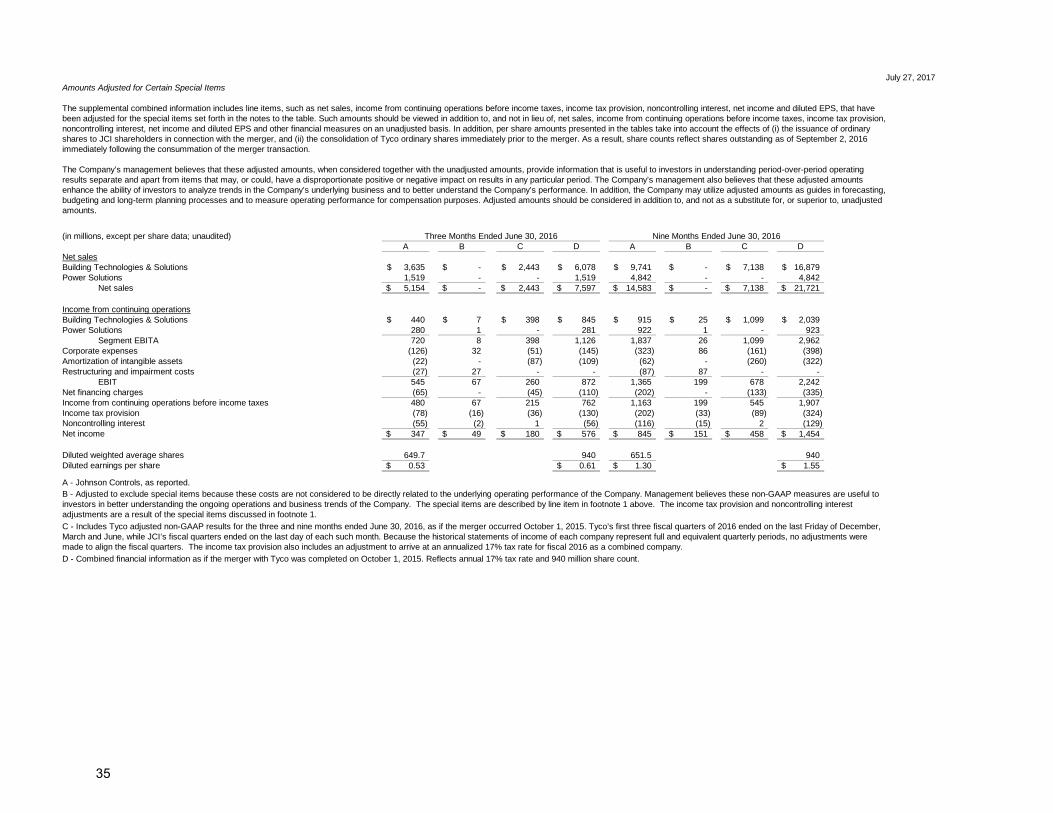
(in millions, except per share data; unaudited)A B C D A B C D
Net salesBuilding Technologies & Solutions 3,635$ -$ 2,443$ 6,078$ 9,741$ -$ 7,138$ 16,879$ Power Solutions 1,519 - - 1,519 4,842 - - 4,842 Net sales 5,154$ -$ 2,443$ 7,597$ 14,583$ -$ 7,138$ 21,721$
Income from continuing operationsBuilding Technologies & Solutions 440$ 7$ 398$ 845$ 915$ 25$ 1,099$ 2,039$ Power Solutions 280 1 - 281 922 1 - 923 Segment EBITA 720 8 398 1,126 1,837 26 1,099 2,962 Corporate expenses (126) 32 (51) (145) (323) 86 (161) (398) Amortization of intangible assets (22) - (87) (109) (62) - (260) (322) Restructuring and impairment costs (27) 27 - - (87) 87 - - EBIT 545 67 260 872 1,365 199 678 2,242 Net financing charges (65) - (45) (110) (202) - (133) (335) Income from continuing operations before income taxes 480 67 215 762 1,163 199 545 1,907 Income tax provision (78) (16) (36) (130) (202) (33) (89) (324) Noncontrolling interest (55) (2) 1 (56) (116) (15) 2 (129) Net income 347$ 49$ 180$ 576$ 845$ 151$ 458$ 1,454$
Diluted weighted average shares 649.7 940 651.5 940 Diluted earnings per share 0.53$ 0.61$ 1.30$ 1.55$
C - Includes Tyco adjusted non-GAAP results for the three and nine months ended June 30, 2016, as if the merger occurred October 1, 2015. Tyco’s first three fiscal quarters of 2016 ended on the last Friday of December, March and June, while JCI’s fiscal quarters ended on the last day of each such month. Because the historical statements of income of each company represent full and equivalent quarterly periods, no adjustments were made to align the fiscal quarters. The income tax provision also includes an adjustment to arrive at an annualized 17% tax rate for fiscal 2016 as a combined company.D - Combined financial information as if the merger with Tyco was completed on October 1, 2015. Reflects annual 17% tax rate and 940 million share count.
Three Months Ended June 30, 2016 Nine Months Ended June 30, 2016
Amounts Adjusted for Certain Special Items
The supplemental combined information includes line items, such as net sales, income from continuing operations before income taxes, income tax provision, noncontrolling interest, net income and diluted EPS, that have been adjusted for the special items set forth in the notes to the table. Such amounts should be viewed in addition to, and not in lieu of, net sales, income from continuing operations before income taxes, income tax provision, noncontrolling interest, net income and diluted EPS and other financial measures on an unadjusted basis. In addition, per share amounts presented in the tables take into account the effects of (i) the issuance of ordinary shares to JCI shareholders in connection with the merger, and (ii) the consolidation of Tyco ordinary shares immediately prior to the merger. As a result, share counts reflect shares outstanding as of September 2, 2016 immediately following the consummation of the merger transaction.
The Company’s management believes that these adjusted amounts, when considered together with the unadjusted amounts, provide information that is useful to investors in understanding period-over-period operating results separate and apart from items that may, or could, have a disproportionate positive or negative impact on results in any particular period. The Company’s management also believes that these adjusted amounts enhance the ability of investors to analyze trends in the Company’s underlying business and to better understand the Company’s performance. In addition, the Company may utilize adjusted amounts as guides in forecasting, budgeting and long-term planning processes and to measure operating performance for compensation purposes. Adjusted amounts should be considered in addition to, and not as a substitute for, or superior to, unadjusted amounts.
A - Johnson Controls, as reported.B - Adjusted to exclude special items because these costs are not considered to be directly related to the underlying operating performance of the Company. Management believes these non-GAAP measures are useful to investors in better understanding the ongoing operations and business trends of the Company. The special items are described by line item in footnote 1 above. The income tax provision and noncontrolling interest adjustments are a result of the special items discussed in footnote 1.
35

July 27, 2017 3. Organic Adjusted Net Sales Growth Reconciliation
(in millions)Building Technologies & Solutions (76)$ -1.3% (68)$ -1.1% -$ - 126$ 2.1% 6,060$ -0.3%Power Solutions (5) -0.3% - - 124 8.2% (29) -1.9% 1,609 5.9%Total net sales (81)$ -1.1% (68)$ -0.9% 124$ 1.6% 97$ 1.3% 7,669$ 0.9%
(in millions)Building Technologies & Solutions (143)$ -0.8% (169)$ -1.0% -$ - 230$ 1.4% 16,797$ -0.5%Power Solutions (20) -0.4% - - 298 6.2% 85 1.8% 5,205 7.5%Total net sales (163)$ -0.8% (169)$ -0.8% 298$ 1.4% 315$ 1.5% 22,002$ 1.3%
4. Diluted Earnings Per Share Reconciliation
2017 2016 2017 2016 2017 2016 2017 2016
Earnings per share as reported for JCI plc 0.59$ 0.59$ 0.59$ 0.53$ 0.78$ 0.47$ 0.82$ 1.30$
Adjusting items: Transaction costs 0.02 0.03 0.02 0.03 0.12 0.07 0.12 0.07
Related tax impact - - - - (0.01) (0.01) (0.01) (0.01) Integration costs 0.06 0.01 0.06 0.01 0.24 0.02 0.24 0.02
Related tax impact (0.01) - (0.01) - (0.04) - (0.04) - Separation costs - 0.21 - 0.02 0.09 0.51 - 0.07
Related tax impact - (0.02) - - - (0.04) - - Nonrecurring purchase accounting impacts (0.01) - (0.01) - 0.14 - 0.14 -
Related tax impact - - - - (0.04) - (0.04) - Mark-to-market loss (gain) for pension plans 0.05 - 0.05 - (0.10) - (0.10) -
Related tax impact (0.02) - (0.02) - 0.04 - 0.04 - Restructuring and impairment costs 0.05 0.16 0.05 0.04 0.24 0.50 0.24 0.12
Related tax impact (0.02) (0.04) (0.02) (0.02) (0.05) (0.06) (0.05) (0.04) Discrete tax items - 0.13 - - 0.40 1.33 0.38 -
Adjusted earnings per share for JCI plc* 0.71$ 1.07$ 0.71$ 0.61$ 1.80$ 2.78$ 1.74$ 1.53$
* May not sum due to rounding.
Adjusted Net Sales for the Three Months Ended
June 30, 2017
Three Months Ended
The components of the changes in adjusted net sales for the nine months ended June 30, 2017 versus the nine months ended June 30, 2016, including organic net sales, is shown below (unaudited):
Combined Adjusted Net Sales for the Nine
Months Ended June 30, 2016 Foreign Currency
Acquisitions/Divestitures, Net Lead Impact Organic Net Sales
Adjusted Net Sales for the Nine Months Ended
June 30, 2017
A reconciliation of diluted earnings per share as reported to diluted adjusted earnings per share for the respective periods is shown below (unaudited):
Lead Impact Organic Net Sales
16,879$
Combined Adjusted Net Sales for the Three
Months Ended June 30, 2016
Net Income Attributable to JCI plc
Net Income Attributable to JCI plc from Continuing
Operations Net Income Attributable to
JCI plc
Net Income Attributable to JCI plc from Continuing
Operations
Acquisitions/Divestitures, Net
The Company's press release contains financial information regarding adjusted earnings per share, which is a non-GAAP performance measure. The adjusting items include transaction/integration/separation costs, nonrecurring purchase accounting impacts related to the Tyco merger, mark-to-market gain or loss for pension plans, restructuring and impairment costs, and discrete tax items. The Company excludes these items because they are not considered to be directly related to the underlying operating performance of the Company. Management believes these non-GAAP measures are useful to investors in understanding the ongoing operations and business trends of the Company.
7,597$ 1,519 6,078$
Foreign Currency
June 30, June 30,Three Months Ended Nine Months Ended Nine Months Ended
June 30, June 30,
The components of the changes in adjusted net sales for the three months ended June 30, 2017 versus the three months ended June 30, 2016, including organic net sales, is shown below (unaudited):
4,842 21,721$
36

July 27, 2017
The following table reconciles the denominators used to calculate basic and diluted earnings per share for JCI plc (in millions; unaudited):
2017 2016 2017 2016Weighted Average Shares Outstanding for JCI plcBasic weighted average shares outstanding 935.4 644.9 937.2 647.0 Effect of dilutive securities: Stock options, unvested restricted stock
and unvested performance share awards 9.0 4.8 9.6 4.5 Diluted weighted average shares outstanding 944.4 649.7 946.8 651.5
5. Mark-to-Market of Pension and Postretirement Plans
6. Acquisitions and Divestitures
7. Income Taxes
8. Restructuring
Three Months EndedJune 30,
The Company's effective tax rate from continuing operations before consideration of the transaction/integration/separation costs, nonrecurring purchase accounting impacts related to the Tyco merger, mark-to-market gains or losses for pension plans, restructuring and impairment costs, and discrete tax items for the three months ending June 30, 2017 and 2016 is approximately 15 percent and 17 percent, respectively. The three months ended June 30, 2016 includes a non-cash tax charge of $85 million ($0.13) in discontinued operations related to changes in entity tax status associated with the spin-off of the Automotive Experience business.
On October 31, 2016, the Company completed the spin-off of its Automotive Experience business by way of the transfer of the Automotive Experience business from JCI plc to Adient plc and the issuance of ordinary shares of Adient plc directly to holders of JCI plc ordinary shares on a pro rata basis. Following the separation, Adient plc is now an independent public company trading on the New York Stock Exchange (NYSE) under the symbol "ADNT." The Company did not retain any equity interest in Adient plc. Beginning in the first quarter of fiscal 2017, Adient’s historical financial results are reflected in the Company’s consolidated financial statements as a discontinued operation.
On September 2, 2016, JCI Inc. and Tyco completed their combination which was announced on January 25, 2016. The merger is accounted for as a reverse acquisition using the acquisition method of accounting in accordance with Accounting Standards Codification (ASC) 805, "Business Combinations." JCI Inc. is the accounting acquirer for financial reporting purposes. Accordingly, the historical consolidated financial statements of JCI Inc. for periods prior to this transaction are considered to be the historical financial statements of the Company. The total fair value of the consideration transferred was $19.7 billion. As part of the transaction in the fiscal 2016 fourth quarter, the Company recorded $16.4 billion of goodwill and $6.2 billion of intangible assets, of which $3.9 billion are subject to amortization.
The three and nine months ended June 30, 2017 includes restructuring and impairment costs of $49 million and $226 million, respectively, related primarily to workforce reductions, plant closures and asset impairments in the Building Technologies & Solutions and Power Solutions businesses, and at Corporate. The three and nine months ended June 30, 2016 restructuring and impairment costs of $27 million and $87 million, respectively, related primarily to workforce reductions, plant closures and asset impairments in the Building Technologies & Solutions business and at Corporate.
On October 1, 2015, the Company formed a joint venture with Hitachi to expand its legacy Building Efficiency product offerings. The Company acquired a 60 percent ownership stake in the new entity for approximately $133 million ($563 million purchase price less cash acquired of $430 million).
The pension and postretirement mark-to-market gain or loss for each period is excluded from adjusted diluted earnings per share. The three months ended June 30, 2017 pension mark-to-market loss of $45 million and the nine months ended June 30, 2017 pension mark-to-market gain of $90 million are due to lump sum payouts for certain U.S. pension plans. There was no mark-to-market gain or loss for pension and postretirement plans in the three or nine months ended June 30, 2016.
On March 16, 2017, the Company announced that it signed a definitive agreement to sell its Scott Safety business to 3M for approximately $2.0 billion. Net cash proceeds from the transaction are expected to approximate $1.8 to $1.9 billion. Scott Safety is a leader in the design, manufacture and sale of high performance respiratory protection, gas and flame detection, thermal imaging and other critical products for fire services, law enforcement, industrial, oil and gas, chemical, armed forces, and homeland defense end markets. The transaction is expected to close in the first quarter of fiscal 2018, subject to customary closing conditions including required regulatory approval. The Scott Safety business is included within assets held for sale and liabilities held for sale in the accompanying condensed consolidated statement of financial position as of June 30, 2017.
Nine Months EndedJune 30,
The Company has presented forward-looking statements regarding adjusted EPS from continuing operations for the fourth quarter of 2017 and the full fiscal year of 2017, which is a non-GAAP financial measure. This non–GAAP financial measure is derived by excluding certain amounts, expenses or income from the corresponding financial measure determined in accordance with GAAP. The determination of the amounts that are excluded from this non-GAAP financial measure is a matter of management judgment and depends upon, among other factors, the nature of the underlying expense or income amounts recognized in a given period, including but not limited to the high variability of the net mark-to-market adjustments related to pension and post-retirement plans. We are unable to present a quantitative reconciliation of the aforementioned forward-looking non-GAAP financial measure to its most directly comparable forward-looking GAAP financial measure because such information is not available and management cannot reliably predict all of the necessary components of such GAAP measure without unreasonable effort or expense. The unavailable information could have a significant impact on the Company’s fourth quarter 2017 and full year 2017 GAAP financial results.
37