quarterly statement 3rd quarter of fiscal year 2016/2017 · 2019-10-22 · 3rd quarter of fiscal...
TRANSCRIPT

QUARTERLY STATEMENT 3RD QUARTER OF FISCAL YEAR 2016/2017 1 JUNE 2016 – 28 FEBRUARY 2017
KEY PERFORMANCE INDICATORS
* Reporting date and reference to the comparative period in the 2015/2016 fiscal year is 29 February 2016.
Please note that where sums and percentages in the report have been rounded, differences may arise as a result of commercial rounding.Further information can be found in the financial information for the quarter and in the further notes.
28 February 2017 29 February 2016
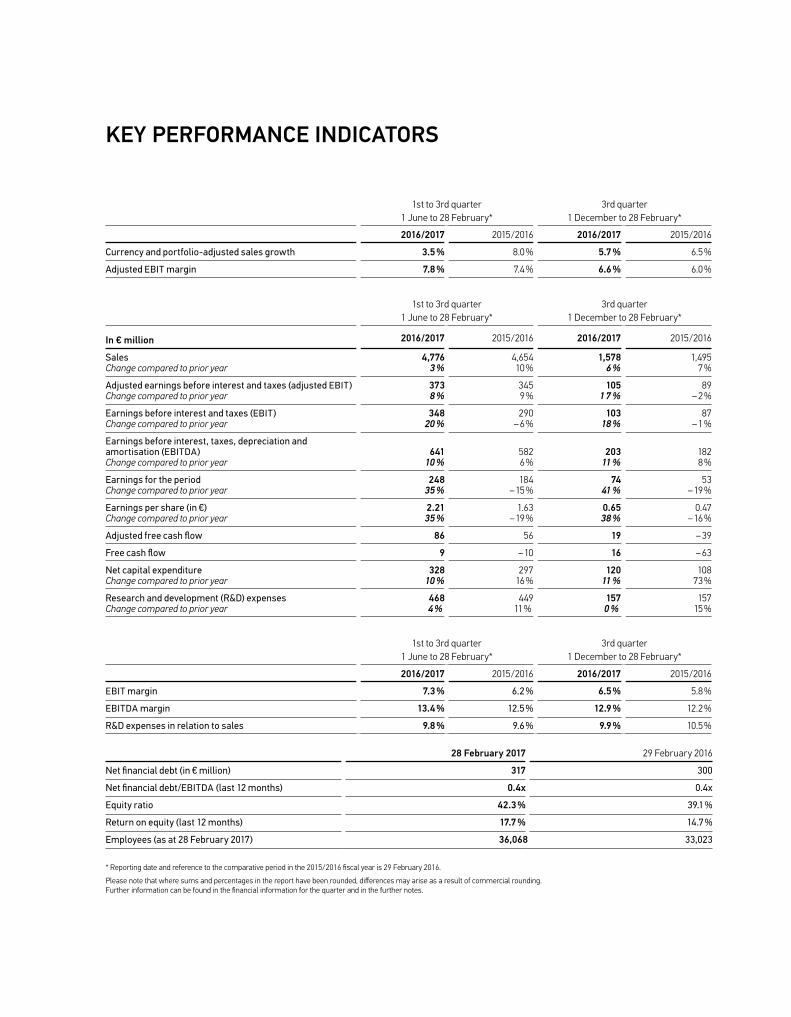
Net financial debt (in € million) 317 300
Net financial debt/EBITDA (last 12 months) 0.4x 0.4x
Equity ratio 42.3 % 39.1 %
Return on equity (last 12 months) 17.7 % 14.7 %
Employees (as at 28 February 2017) 36,068 33,023
1st to 3rd quarter1 June to 28 February*
3rd quarter1 December to 28 February*
2016/2017 2015/2016 2016/2017 2015/2016
Currency and portfolio-adjusted sales growth 3.5 % 8.0 % 5.7 % 6.5 %
Adjusted EBIT margin 7.8 % 7.4 % 6.6 % 6.0 %
1st to 3rd quarter1 June to 28 February*
3rd quarter1 December to 28 February*
In € million 2016/2017 2015/2016 2016/2017 2015/2016
Sales Change compared to prior year
4,776 3 %
4,654 10 %
1,578 6 %
1,495 7 %
Adjusted earnings before interest and taxes (adjusted EBIT)Change compared to prior year
3738 %
3459 %
1051 7 %
89– 2 %
Earnings before interest and taxes (EBIT)Change compared to prior year
34820 %
290– 6 %
103 18 %
87– 1 %
Earnings before interest, taxes, depreciation and amortisation (EBITDA)Change compared to prior year
64110 %
5826 %
20311 %
1828 %
Earnings for the periodChange compared to prior year
24835 %
184– 15 %
7441 %
53– 19 %
Earnings per share (in €)Change compared to prior year
2.2135 %
1.63– 19 %
0.6538 %
0.47– 16 %
Adjusted free cash flow 86 56 19 – 39
Free cash flow 9 – 10 16 – 63
Net capital expenditureChange compared to prior year
32810 %
297 16 %
12011 %
10873 %
Research and development (R&D) expensesChange compared to prior year
4684 %
44911 %
157 0 %
15715 %
1st to 3rd quarter1 June to 28 February*
3rd quarter1 December to 28 February*
2016/2017 2015/2016 2016/2017 2015/2016
EBIT margin 7.3 % 6.2 % 6.5 % 5.8 %
EBITDA margin 13.4 % 12.5 % 12.9 % 12.2 %
R&D expenses in relation to sales 9.8 % 9.6 % 9.9 % 10.5 %

1INDUSTRY DEVELOPMENT AND BUSINESS DEVELOPMENT OF THE GROUP
HELLA Quarterly Statement 3rd Quarter of Fiscal Year 2016/2017 1 June 2016 – 28 February 2017
2 SECTOR PERFORMANCE AND BUSINESS PERFORMANCE OF THE GROUP
10 FINANCIAL INFORMATION FOR THE QUARTER
10 Consolidated income statement 11 Segment reporting 12 Consolidated balance sheet 13 Consolidated cash flow statement
14 FURTHER NOTES
22 GLOSSARY

2 SECTOR PERFORMANCE AND BUSINESS PERFORMANCE OF THE GROUP
Sector performanceIn the first nine months (1 June 2016 to 28 February 2017) of the HELLA fiscal year 2016/2017, the global light vehicle production increased by a total of 6.0 % to 69.9 million units (prior year: 66 million units) according to IHS Automotive Light Vehicle Pro-duction data. Positive development was reported in all of the core regions of Europe, China and North and South America that are relevant for HELLA. China was once again a key driver of growth, with a 16.2 % increase in the volume of new vehicles produced to 20.6 million (prior year: 17.8 million units). The vol-ume of new vehicle production in Europe rose by a total of 1.8 % during the reporting period to 15.8 million units (prior year: 15.5 million units) and by 0.8 % in North and South America to 15.4 million units (prior year: 15.2 million units). Within Europe, production figures in Germany fell slightly during the reporting period by 1.4 % to 4.36 million units (prior year: 4.42 million units) on the other hand.
Based on the third quarter (1 December 2016 to 28 February 2017), the number of new light vehicles produced worldwide rose by 4.2 % year-on-year, thus falling slightly short of the growth rates of the first two quarters. This is due, among other things, to the slight easing of the growth momentum of the Chi-nese market, which had grown by 6.3 % year-on-year in the third quarter.
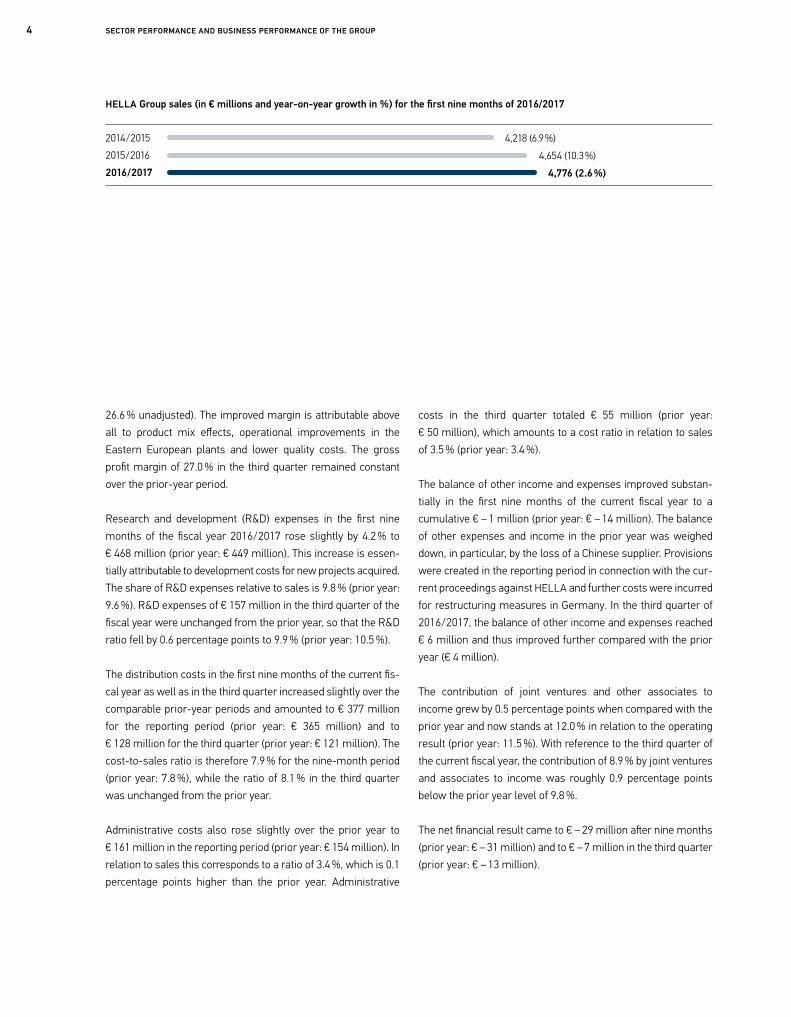
Business performanceCurrency and portfolio-adjusted sales rise by 3.5 % Growth momentum in the third quarter, especially in the Automotive segmentIn the reporting period (1 June 2016 to 28 February 2017), cur-rency and portfolio-adjusted sales for the HELLA Group climbed by 3.5 %. Taking into account negative exchange-rate effects (– 0.6 percentage points) and the effects of the divestment of the Industries and Airport Lighting business activities (– 0.2 per-centage points), reported sales rose by a total of 2.6 % to € 4,776 million. The increase in sales throughout the Group was driven especially by the growth momentum in the third quarter (1 December 2016 to 28 February 2017), in the Automotive segment in particular, thanks to new production ramp-ups. Reported consolidated sales during this period increased by 5.5 % (+5.7 % adjusted for currency and portfolio effects) to € 1,578 million (prior year: € 1,495 million). Exchange effects made a positive impact of 0.1 percentage points, while portfolio optimisation in the Special Applications segment adversely affected sales growth in the Group by 0.3 percentage points.
SECTOR PERFORMANCE AND BUSINESS PERFORMANCE OF THE GROUPfor the first nine months of fiscal year 2016/2017→ Currency and portfolio-adjusted sales rise by 3.5 % in the first nine months → Growth momentum strengthened in the third quarter, especially in the Automotive segment→ Adjusted earnings before interest and taxes improved by 8.1 %→ Adjusted EBIT margin rose from 7.4 % to 7.8 % → Adjusted free cash flow after three quarters at € 86 million

3SECTOR PERFORMANCE AND BUSINESS PERFORMANCE OF THE GROUP
Results of operationsRise of 8.1 % in adjusted earnings before interest and taxesThe profitability of the HELLA Group improved in the reporting period. Adjusted earnings before interest and taxes (adjusted EBIT) increased by 8.1 % in the first nine months of fiscal year 2016/2017 to € 373 million (prior year: € 345 million). This resulted in a higher adjusted EBIT margin of 7.8 % (prior year: 7.4 %). This development is primarily attributable to the higher gross profit margin in the Automotive segment. The prior year’s result was weighed down by restructuring costs in Germany (€ 8 million) and, in particular, costs totaling € 47 million in con-nection with the loss of a Chinese supplier; by contrast, in the reporting period exceptional charges were incurred due to pro-visions in connection with the proceedings the European Com-mission has initiated against the HELLA Group due to possible fines, potential claims for third-party damages and legal expenses (totaling € 16 million) and restructuring measures in Germany (€ 9 million). Earnings before interest and taxes (EBIT) improved by 20.2 % to € 348 million in the first nine months of fiscal year 2016/2017 over the same period of the previous year (prior year: € 290 million), so that the EBIT margin rose to 7.3 % (prior year: 6.2 %).
Not taking into account the divested business segments of Industries and Airport Lighting, the adjusted EBIT margin in the reporting period would have risen from 7.6 % to 8.1 % which corresponds to an adjusted EBIT of € 384 million (prior year: € 354 million).
In the third quarter of the fiscal year, adjusted earnings before interest and taxes (adjusted EBIT) of the HELLA Group increased by 17.2 % to € 105 million (prior year: € 89 million), simultan-eously with new production ramp-ups in the Automotive seg-ment in particular. This equates to an adjusted EBIT margin of 6.6 % (prior year: 6.0 %). Taking special effects into account, earnings before interest and taxes (EBIT) rose to € 103 million in the third quarter (prior year: € 87 million). This equates to an increase of 18.4 % and an EBIT margin of 6.5 % (prior year: 5.8 %).
Not taking into account the divested business activities of Indus-tries and Airport Lighting, adjusted earnings before interest and taxes for the third quarter would total € 107 million (prior year: € 93 million), which would equate to an adjusted EBIT margin of 6.8 % (prior year: 6.2 %).
Gross profit for the first nine months of the fiscal year reported a positive performance compared with the prior year and amounted to € 1,313 million in the reporting period (prior year: € 1,264 million adjusted and € 1,237 million unadjusted). Special charges were incurred in the same period of the prior year due to the loss of a Chinese supplier; no adjustments were made in the reporting period. Consequently, the gross profit margin in the reporting period was 27.5 % (prior year: 27.2 % adjusted and
4 SECTOR PERFORMANCE AND BUSINESS PERFORMANCE OF THE GROUP
HELLA Group sales (in € millions and year-on-year growth in %) for the first nine months of 2016/2017
2014/ 20152015/ 20162016/ 2017
26.6 % unadjusted). The improved margin is attributable above all to product mix effects, operational improvements in the Eastern European plants and lower quality costs. The gross profit margin of 27.0 % in the third quarter remained constant over the prior-year period.
Research and development (R&D) expenses in the first nine months of the fiscal year 2016/2017 rose slightly by 4.2 % to € 468 million (prior year: € 449 million). This increase is essen-tially attributable to development costs for new projects acquired. The share of R&D expenses relative to sales is 9.8 % (prior year: 9.6 %). R&D expenses of € 157 million in the third quarter of the fiscal year were unchanged from the prior year, so that the R&D ratio fell by 0.6 percentage points to 9.9 % (prior year: 10.5 %).
The distribution costs in the first nine months of the current fis-cal year as well as in the third quarter increased slightly over the comparable prior-year periods and amounted to € 377 million for the reporting period (prior year: € 365 million) and to € 128 million for the third quarter (prior year: € 121 million). The cost-to-sales ratio is therefore 7.9 % for the nine-month period (prior year: 7.8 %), while the ratio of 8.1 % in the third quarter was unchanged from the prior year.
Administrative costs also rose slightly over the prior year to € 161 million in the reporting period (prior year: € 154 million). In relation to sales this corresponds to a ratio of 3.4 %, which is 0.1 percentage points higher than the prior year. Administrative
costs in the third quarter totaled € 55 million (prior year: € 50 million), which amounts to a cost ratio in relation to sales of 3.5 % (prior year: 3.4 %).
The balance of other income and expenses improved substan-tially in the first nine months of the current fiscal year to a cumulative € – 1 million (prior year: € – 14 million). The balance of other expenses and income in the prior year was weighed down, in particular, by the loss of a Chinese supplier. Provisions were created in the reporting period in connection with the cur-rent proceedings against HELLA and further costs were incurred for restructuring measures in Germany. In the third quarter of 2016/2017, the balance of other income and expenses reached € 6 million and thus improved further compared with the prior year (€ 4 million).
The contribution of joint ventures and other associates to income grew by 0.5 percentage points when compared with the prior year and now stands at 12.0 % in relation to the operating result (prior year: 11.5 %). With reference to the third quarter of the current fiscal year, the contribution of 8.9 % by joint ventures and associates to income was roughly 0.9 percentage points below the prior year level of 9.8 %.
The net financial result came to € – 29 million after nine months (prior year: € – 31 million) and to € – 7 million in the third quarter (prior year: € – 13 million).
4,776 (2.6 %)
4,218 (6.9 %)4,654 (10.3 %)

5SECTOR PERFORMANCE AND BUSINESS PERFORMANCE OF THE GROUP
Expenses for income taxes amounted to around € 71 million in the reporting period (prior year: € 74 million) and € 21 million in the third quarter as in the prior year.
The result for the period thus stood at € 248 million in the first nine months of the fiscal year (prior year: € 184 million) and at € 74 million in the third quarter (prior year: € 53 million). This corresponds to a substantially higher return on sales of 5.2 % in the reporting period (prior year: 4.0 %), while the return on sales in the third quarter came to 4.7 % (prior year: 3.5 %). Earnings per share rose accordingly by 35 % to € 2.21 during the nine-month period (prior year: € 1.63) and by 38 % to € 0.65 in the third quarter (prior year: € 0.47).
Results of operations of the segmentsSales growth in the Automotive business and a significant increase in earningsSales in the Automotive segment rose by 2.6 % over the prior year to € 3,646 million (prior year: € 3,556 million). This increase
is attributable in particular to the greater growth momentum in the third quarter of the fiscal year. Segment sales in this period have thus increased by 6.5 % over the prior year to € 1,217 mil-lion (prior year: € 1,143 million). Automotive growth was driven especially by the strong demand for innovative lighting solu-tions and for electronic products, for example in the area of energy management. The growth was also driven by the good market development in China and NAFTA, and in the third quar-ter also in Europe.
In the nine-month period, earnings before interest and taxes (EBIT) for the segment grew by 12.7 % relative to the adjusted EBIT of the prior-year period to € 314 million (prior year: € 279 million, adjusted). No adjustments were made in the Automotive segment during the reporting period; correspond-ingly, EBIT climbed by 35.6 % in the first nine months of the fiscal year (prior year: € 232 million). The EBIT margin in relation to segment sales thus comes to 8.6 % after 7.8 % (adjusted) and 6.5 % (unadjusted) in the prior year.
Adjusted earnings before interest and taxes (adjusted EBIT; in € millions and as a % of sales) for the first nine months of 2016/2017
2014/ 20152015/ 20162016/ 2017 373 (7.8 %)
318 (7.5 %)345 (7.4 %)
Sales by segment for the first nine months (1 June to 28 February*) of fiscal years 2016/2017 and 2015/2016
Automotive Aftermarket Special ApplicationsIn € million 2016/2017 2015 /2016 2016/2017 2015 /2016 2016/2017 2015 /2016
Sales with third-party companies 3,610 2.4 % 3,527 923 5.5 % 875 217 – 4.6 % 228
Intersegment sales 36 29 29 38 0.5 0.6
Segment sales 3,646 2.6 % 3,556 952 4.2 % 914 218 – 4.9 % 229
* Reporting date and reference to the comparative period in the 2015/2016 fiscal year is 29 February 2016.
Segment sales: sales with third-party companies and other business segments (intersegment sales). Where sums and percentages in the report have been rounded, differences may arise as a result of commercial rounding.
6 SECTOR PERFORMANCE AND BUSINESS PERFORMANCE OF THE GROUP
In the context of several simultaneous production ramp-ups, the results of operations of the Automotive segment improved in the third quarter compared with the prior-year period. EBIT in this period rose by 16.8 % over the prior-year period to € 87 mil-lion (prior year: € 74 million). The EBIT margin in relation to seg-ment sales thus comes to 7.1 % after 6.5 % in the prior year. No adjustments were made in the third quarter of the current fiscal year nor in the same period of the prior year.
Segment sales in the Aftermarket segment in the nine-month period increased by 4.2 % over the prior year to € 952 million (prior year: € 914 million). All of the Aftermarket business activ-ities made a positive contribution to the sales growth during the reporting period. In the reporting period, EBIT for the segment also grew by 4.5 % to € 58 million (prior year: € 56 million). In relation to segment sales, this corresponds to an EBIT margin that remained constant over the prior year at 6.1 %.
The Aftermarket segment continued its growth in the third quar-ter of the current fiscal year. Thus sales in this period rose by 4.1 % over the prior-year period to € 302 million (prior year: € 290 million). The main growth driver was spare parts trade. As a result of a higher share of purchased parts, earnings before interest and taxes declined by 9.1 % in the third quarter to € 16 million, after € 18 million in the prior year. The EBIT margin in relation to segment sales thus comes to 5.5 % (prior year: 6.3 %).
Segment sales in the Special Applications segment declined by 4.9 % to € 218 million (prior year: € 229 million) in the first nine months of the fiscal year 2016/2017. However, adjusted for the divested business activities of Industries and Airport Lighting, sales of the remaining business activities declined only slightly by 0.1 % in the reporting period within a difficult market environ-ment in the agricultural sector. The positive performance of the
7SECTOR PERFORMANCE AND BUSINESS PERFORMANCE OF THE GROUP
business for trailers continued. Earnings before interest and taxes of the segment amounted to € 2 million in the reporting period (prior year: € 12 million); hence, the EBIT margin in rela-tion to segment sales was 1.0 % (prior year: 5.1 %). The effects in particular from the wind-down of the divested business activ-ities of Industries and Airport Lighting, as well as the costs incurred from relocating a plant to Eastern Europe impacted earnings by € – 12 million and € – 3 million, respectively.
Sales in the Special Applications segment declined by 3.9 % to € 71 million in the third quarter (prior year: € 74 million). Adjusted for portfolio effects, sales of the remaining business activities on the other hand increased by 1.3 %. Besides the business for trailers, the performance of the business for cara-vans in particular was positive in this quarter. EBIT for the seg-ment declined to € 1.7 million in the third quarter (prior year: € 2.0 million). The EBIT margin in relation to segment sales is therefore 2.4 % (prior year: 2.8 %). Expenses incurred in wind-ing down the business segments of Industries and Airport Light-ing in particular had a negative effect of € – 3 million on the result in this period.
Financial statusAdjusted free cash flow after three quarters at € 86 million In the first nine months of the fiscal year 2016/2017, cash flow from operating activities rose by € 64 million to € 422 million when compared with the prior-year period. The increase was attributable to the significantly higher earnings. At € 25 million, the payments in conjunction with the operational expansion of working capital were lower than the prior-year figure of € 28 million. This was counteracted by the discontinuation of the factoring programme in the first quarter of the current fiscal year, the volume of which amounted to € 70 million at the end of May 2016.
The prior year’s cash flow from operating activities included payments in connection with the loss of a Chinese supplier amounting to € 34 million.
In the third quarter of the fiscal year 2016/2017, cash flow from operating activities grew by € 105 million to € 162 million.

8 SECTOR PERFORMANCE AND BUSINESS PERFORMANCE OF THE GROUP
Compared with the first nine months of the prior year, net capi-tal expenditures as the balance of the net payment flows for the acquisition or sale of non-current assets (€ 419 million, prior year: € 369 million) and the corresponding customer reimburse-ments (€ 91 million, prior year: € 72 million) rose by € 31 million to € 328 million. Net capital expenditures of the third quarter were up € 12 million over the prior-year period to € 120 million.
The free cash flow came to € 9 million, after € – 10 million in the prior year. Adjusted for costs for restructuring measures in Ger-many, the increase in receivables from the termination of the factoring programme and the special payments resulting from the loss of the Chinese supplier in the prior year, the adjusted free cash flow was € 86 million, after € 56 million in the prior year.
Adjusted free cash flow rose by € 59 million to € 19 million com-pared with the third quarter of the prior year.
The acquisition of a 100 % stake in online vehicle parts trader iParts in Poland accounted for a total of € 5 million.
The annual general meeting on 29 September 2016 decided on a dividend of € 0.77 per share, which came to a total € 86 million paid out to shareholders.
Financial positionCompared to the end of the prior fiscal year, cash and cash equivalents and current financial assets decreased by € 139 mil-lion to € 775 million. The total of current and non-current finan-cial liabilities fell to € 1,092 million, equivalent to a decline of € 60 million compared to 31 May 2016 (€ 1,152 million). Net financial debt as the balance of cash and cash equivalents and current financial assets together with current and non-current financial liabilities increased by € 80 million to € 317 million in the first nine months compared with the end of the prior fiscal year. At the reporting date, the ratio of net financial debt to EBITDA for the last twelve months was 0.4, and therefore unchanged from the prior year (end February 2016: 0.4). The ratio was 0.3 at the end of the prior fiscal year. The corporate rating issued by Moody’s remains in the investment grade seg-ment at Baa2 with a stable outlook. Moody’s last updated its credit opinion in July 2016.

9SECTOR PERFORMANCE AND BUSINESS PERFORMANCE OF THE GROUP
Opportunity and risk report
There were no significant changes in the opportunities and risks during the reporting period. Details of the significant opportuni-ties and risks may be found in our statements in the 2015/2016 consolidated financial report and in the six month report as at 30 November 2016.
Forecast report
Sector outlookAccording to the most recent IHS Light Vehicle Production Fore-cast, global light vehicle production is expected to rise slightly in 2017 by 1.9 % to 94.8 million new vehicles produced. The Chi-nese car market is forecast to rise by 2.5 % to 27.7 million new vehicles produced (prior year: 27.1 million). A stable production level of around 20.6 million units is expected for the North and
Southern American region, as was the case in the prior year. Growth in Europe is expected to rise by a total of 1.7 % to 21.8 million units (prior year: 21.5 million), whereas the volume of new vehicles produced in the selective German market should fall by 0.9 % to 5.9 million units (prior year: 6 million).
Company outlookAfter the first nine months of fiscal year 2016/2017, the com-pany outlook is still in line with the 2015/2016 annual report. For the fiscal year 2016/2017 we thus still project a currency and portfolio-adjusted sales growth and a rise in adjusted EBIT in the mid-single-digit percentage range. Consequently, we forecast an adjusted EBIT margin at the prior year level.

10
Consolidated income statement
1st to 3rd quarter 1 June to 28 February*
3rd quarter1 December to 28 February*
€ thousand 2016 /2017 2015 /2016 2016 /2017 2015 /2016
Sales 4,775,659 4,654,392 1,577,973 1,495,263
Cost of sales – 3,462,239 – 3,417,107 – 1,151,655 – 1,091,647
Gross profit 1,313,420 1,237,285 426,318 403,616
Research and development costs – 467,631 – 448,675 – 156,694 – 157,316
Distribution costs – 377,309 – 365,227 – 127,640 – 121,372
Administrative costs – 161,284 – 153,531 – 54,509 – 50,319
Other income and expenses – 1,204 – 13,568 6,005 3,564
Result of investments accounted for using the equity method 41,896 33,178 9,197 8,559
Other income from investments 277 212 260 187
Earnings before interest and taxes (EBIT) 348,166 289,674 102,936 86,919
Financial income 17,331 23,984 1,377 8,373
Financing costs – 46,324 – 55,450 – 8,728 – 21,429
Net financial result – 28,993 – 31,466 – 7,351 – 13,056
Earnings before income taxes (EBT) 319,173 258,208 95,585 73,863
Taxes on income – 71,495 – 74,209 – 21,411 – 21,228
Earnings for the period 247,678 183,999 74,174 52,635
of which attributable:
to the owners of the parent company 245,180 180,716 72,191 52,313
to non-controlling interests 2,498 3,283 1,983 322
Undiluted earnings per ordinary share in € 2.21 1.63 0.65 0.47
Diluted earnings per ordinary share in € 2.21 1.63 0.65 0.47
FINANCIAL INFORMATION FOR THE QUARTER
* Reporting date and reference to the comparative period in the 2015/2016 fiscal year is 29 February 2016.

11
Segment reporting
The segment information for the first nine months (1 June to 28 February*) of fiscal years 2016/2017 and 2015/2016 is as follows:
Automotive Aftermarket Special Applications
€ thousand 2016/2017 2015/2016 2016/2017 2015/2016 2016/2017 2015/2016
Sales with third-party companies 3,610,390 3,526,735 923,158 875,237 217,383 227,959
Intersegment sales 35,960 28,866 29,258 38,381 504 1,125
Cost of sales – 2,726,996 – 2,714,880 – 625,250 – 600,696 – 150,653 – 145,726
Gross profit 919,354 840,721 327,166 312,922 67,234 83,358
Research and development costs – 442,535 – 420,827 – 14,448 – 15,333 – 9,483 – 12,320
Distribution costs – 89,269 – 83,366 – 242,156 – 231,843 – 45,814 – 49,941
Administrative costs – 127,055 – 130,875 – 26,998 – 23,627 – 12,915 – 11,645
Other income and expenses 16,781 – 3,086 9,745 9,591 3,259 2,345
Result of investments accounted for using the equity method 37,081 29,272 4,815 3,905 0 0
Earnings before interest and taxes (EBIT) 314,358 231,839 58,123 55,615 2,281 11,797
Additions to non-current assets 350,440 285,937 18,671 19,333 7,294 8,978
Reconciliation of the segment results with consolidated net profit / loss:
Sales reconciliation:
€ thousand 2016/2017 2015/2016
EBIT of the reporting segments 374,762 299,251
EBIT of other divisions – 1,939 – 1,428
Unallocated income – 24,658 – 8,149
Consolidated EBIT 348,166 289,674
Net financial result – 28,993 – 31,466
Consolidated EBT 319,173 258,208
* Reporting date and reference to the comparative period in fiscal year 2015/2016 is 29 February 2016.
€ thousand 2016/2017 2015/2016
Total sales of the reporting segments 4,816,653 4,698,303
Sales in other divisions 63,270 67,532
Elimination of intersegment sales – 104,264 – 111,443
Consolidated sales 4,775,659 4,654,392

12
€ thousand 28 February 2017 31 May 2016 29 February 2016
Cash and cash equivalents 461,527 585,134 485,457
Financial assets 313,193 328,790 333,514
Trade receivables 999,252 937,471 889,313
Other receivables and non-financial assets 146,343 146,376 137,541
Inventories 696,868 607,584 675,307
Current tax assets 37,147 26,783 49,384
Non-current assets held for sale – 2,924 2,924
Current assets 2,654,332 2,635,062 2,573,440 Intangible assets 240,511 225,021 227,767
Property, plant and equipment 1,764,331 1,697,539 1,588,766
Financial assets 16,376 17,033 18,245
Investments accounted for using the equity method 292,381 261,448 259,868
Deferred tax assets 124,943 122,954 116,829
Other non-current assets 43,045 36,244 46,598
Non-current assets 2,481,588 2,360,239 2,258,073 Assets 5,135,920 4,995,301 4,831,513
Financial liabilities 25,035 86,880 50,913
Trade payables 656,677 633,818 603,409
Current tax liabilities 57,672 57,923 62,563
Other liabilities 515,543 558,043 516,041
Provisions 92,601 65,259 55,040
Current liabilities 1,347,529 1,401,923 1,287,966 Financial liabilities 1,066,977 1,064,789 1,067,876
Deferred tax liabilities 42,533 25,767 42,304
Other liabilities 179,740 193,284 189,788
Provisions 328,474 330,888 352,113
Non-current liabilities 1,617,724 1,614,728 1,652,081 Subscribed capital 222,222 222,222 222,222
Reserves and unappropriated surplus 1,943,090 1,750,563 1,663,354
Equity before non-controlling interests 2,165,312 1,972,785 1,885,576 Non-controlling interests 5,355 5,865 5,890
Equity 2,170,667 1,978,650 1,891,466 Equity and liabilities 5,135,920 4,995,301 4,831,513
Consolidated balance sheet

13
€ thousand 2016/2017 2015/2016
Earnings before income taxes (EBT) 319,173 258,208+ Depreciation and amortisation 292,693 292,676
+ / – Change in provisions 21,288 – 21,429
+ Payments received for series production 90,906 71,606
– Non-cash sales transacted in previous periods – 86,486 – 74,448
+/– Other non-cash income and expenses – 52,905 – 37,385
+ /– Profits/losses from the sale of non-current assets 3,969 – 372
+ Net financial result 28,993 31,466
+/– Change in trade receivables and other assets not attributable to investing or financing activities – 67,060 – 74,001
+/– Change in inventories – 84,027 – 92,239
+/– Change in trade payables and other liabilities not attributable to investing or financing activities 20,465 71,579
+/– Net interest payments – 20,345 – 25,664
+/– Net tax payments – 71,468 – 73,215
+ Dividends received 26,644 31,299
= Net cash flow from operating activities 421,840 358,081+ Cash proceeds from the sale of property, plant and equipment and intangible assets 9,162 7,334
– Payments for the purchase of property, plant and equipment and intangible assets – 427,893 – 375,963
+/– Net payments and loans issued to investments 250 732
+ /– Net payments from changes in equity to investments 0 2,766
+ Cash proceeds from the sale or liquidation of investments, less cash and cash equivalents 5,607 107
– Payments for the acquisition of subsidiaries, less cash received – 4,921 0
= Net cash flow from investing activities – 417,794 – 365,024+/– Net payments from borrowing/repayment of financial liabilities – 62,453 – 19,591
+ / – Net payments made for the sale and purchase of securities 17,522 60,440
– Payments made for acquiring shares of non-controlling interests 0 – 57,789
– Dividend paid – 86,762 – 86,612
= Net cash flow from financing activities – 131,693 – 103,552= Net change in cash and cash equivalents – 127,647 – 110,495+ Cash and cash equivalents as at 1 June 585,134 602,744
+ / – Effect of exchange rate fluctuations on cash and cash equivalents 4,040 – 6,792
= Cash and cash equivalents as at 28 February* 461,527 485,457
Consolidated cash flow statementfor the period from 1 June to 28 February*
* Reporting date and reference to the comparative period in the 2015/2016 fiscal year is 29 February 2016.

14 FURTHER NOTES
Reporting date Average 1st – 3rd quarter Reporting date28 February 2017 29 February 2016 2016/2017 2015/2016 31 May 2016 31 May 2015
€ 1 = US dollar 1.0597 1.0888 1.0930 1.1046 1.1154 1.0970
€ 1 = Czech koruna 27.0210 27.0570 27.0309 27.0841 27.0220 27.4010
€ 1 = Japanese yen 118.8300 123.1400 117.4817 133.5226 123.8300 135.9500
€ 1 = Mexican peso 21.0800 19.8005 21.3587 18.5828 20.5185 16.8433
€ 1 = Chinese renminbi 7.2780 7.1351 7.3863 7.0446 7.3363 6.7994
€ 1 = South Korean won 1,194.2400 1,347.5400 1,254.3626 1,290.1485 1,326.1100 1,220.3100
€ 1 = Romanian leu 4.5202 4.4757 4.4950 4.4597 4.5108 4.4425
1 € = Danish krone 7.4332 7.4602 7.4391 7.4613 7.4376 7.4597
Currency translation differences arising from the translation of earnings and balance sheet items of all Group companies which have a functional currency deviating from the euro are reported within the currency translation reserves.
The exchange rates used to translate the main currencies for the HELLA Group were as follows:
FURTHER NOTES
01 Basic information
02 Currency translation
The financial information of the quarterly report is prepared in euros (€). Amounts are stated in thousands of euros (€ thou-sand). The quarterly report is prepared using accounting poli-cies that are applied consistently within the Group on the basis of amortised historical cost. This does not apply to assets that are available for sale and derivative financial instruments, which are measured at fair value. The consolidated income statement is prepared using the cost-of-sales method. The current/non- current distinction is observed in the consolidated statement of financial position. The amounts stated under current assets and liabilities are for the most part due for settlement within twelve months. Accordingly, non-current items are mainly due for settle ment in more than twelve months. In order to enhance the clarity of the presentation, items of the consolidated statement of financial position and consolidated income statement have been grouped together where this is appropriate and possible. Please note that where sums and percentages in the report have been rounded, differences may arise as a result of com-mercial rounding.
HELLA KGaA Hueck & Co. (HELLA) and its subsidiaries (collect-ively referred to as the “HELLA Group”) develop and manufac-ture lighting technology and electronics components and systems for the automotive industry. Also, joint venture companies pro-duce in addition to the development and manufacture of compo-nents complete vehicle modules and air conditioning systems. HELLA Group’s production and manufacturing sites are located across the globe; its most significant sales markets are in Europe, the USA and Asia, particularly Korea and China. In addition, HELLA has its own international sales network for all kinds of vehicle accessories.
The Company is a listed stock corporation, which was founded and is based in Lippstadt, Germany. The address of the Compa-ny’s registered office is Rixbecker Str. 75, Lippstadt.

15FURTHER NOTES
03 Adjustment of special effects in earnings before interest and taxes
For this reason, the adjusted EBIT margin has been defined as one of the most important key performance indicators for the steering of the Group’s activities. The adjusted EBIT margin as a key performance indicator is not defined in the International Financial Reporting Standards. Rather it is reported by the HELLA Group as additional information in its financial reporting because it is also used for internal management and because, from the Company’s perspective, it presents the results of operations – adjusted for special effects – in a more transparent form and facilitates a comparison over time.
In the current reporting period, the costs for the restructuring measures in Germany are adjusted in EBIT. In addition, provi-sions of € 16,000 thousand have been created for any fines imposed in conjunction with the current proceedings the Euro-pean Commission has initiated against the HELLA Group due to possible fines, potential claims for third-party damages and legal expenses. The corresponding expenses are not allocated to any segment. Reported earnings for fiscal year 2015/2016 were adjusted for restructuring costs and the effects connected with the loss of a Chinese supplier, which was first reported in September 2015.
The HELLA Group is managed by the Management Board through financial key performance indicators. The key perform-ance indicators of sales growth and adjusted EBIT margin take on prominent importance compared to the other financial key performance indicators in the management of the HELLA Group. A major guideline in assessing the suitability of manage-ment indicators is that they have to provide a transparent pic-ture of operational performance. In this process, the non-recur-ring or exceptional effects in their type or size, referred to as special effects, can lead to distortions with regard to the EBIT margin, for example, and thus adversely affect the ability to assess the Company’s performance.
Special effects are non-recurring or exceptional effects in their type and size which are clearly differentiated from the usual operational business. They are tracked uniformly and consist-ently in the Group and the method used to calculate adjusted earnings figures must not vary over the course of time in order to facilitate periodic comparison.

16 FURTHER NOTES
€ thousand
2015/2016 as reported
Restructuring
Loss of supplier 2015/2016 adjusted
Sales 4,654,392 4,654,392
Cost of sales – 3,417,107 27,070 – 3,390,038
Gross profit 1,237,285 27,070 1,264,355
Research and development costs – 448,675 – 448,675
Distribution costs – 365,227 – 365,227
Administrative costs – 153,531 337 – 153,194
Other income and expenses – 13,568 8,149 19,789 14,370
Result of investments accounted for using the equity method 33,178 33,178
Other income from investments 212 212
Earnings before interest and taxes (EBIT) 289,674 8,149 47,196 345,019
€ thousand
2016/2017 as reported
Restructuring Legal affairs 2016/2017 adjusted
Sales 4,775,659 4,775,659
Cost of sales – 3,462,239 – 3,462,239
Gross profit 1,313,420 1,313,420
Research and development costs – 467,631 – 467,631
Distribution costs – 377,309 – 377,309
Administrative costs – 161,284 – 161,284
Other income and expenses – 1,204 8,658 16,000 23,454
Result of investments accounted for using the equity method 41,896 41,896
Other income from investments 277 277
Earnings before interest and taxes (EBIT) 348,166 8,658 16,000 372,824
The corresponding reconciliation statement for the first nine months (June to February) of fiscal years 2016/2017 and 2015/2016 is as follows:

17FURTHER NOTES
04 Adjustment of special effects in the segment results
impairment of € 5,611 thousand. The income statement for the Automotive segment was not adjusted for the first nine months of fiscal year 2016/2017. As a result, the EBIT margin also cor-responds to the adjusted EBIT margin.
The prior year’s adjusted income statement for the Automo-tive segment in the first nine months (June to February) is as follows:
The negative effects on earnings resulting from the loss of a Chinese supplier was reported in the Automotive segment in the prior year (see Note 03). This resulted in a strain on earnings before income and taxes in the past reporting period, which has been adjusted to ensure better comparability with the current reporting period. The cost of sales included higher production and logistics costs, as well as expense for expected further losses, while other income and expenses included a goodwill
Automotive
€ thousand
2015/2016 as reported
Loss of supplier 2015/2016 adjusted
Sales with third-party companies 3,526,735 3,526,735
Intersegment sales 28,866 28,866
Cost of sales – 2,714,880 27,070 – 2,687,810
Gross profit 840,721 27,070 867,791
Research and development costs – 420,827 – 420,827
Distribution costs – 83,366 – 83,366
Administrative costs – 130,875 337 – 130,537
Other income and expenses – 3,086 19,789 16,703
Result of investments accounted for using the equity method 29,272 29,272
Earnings before interest and taxes (EBIT) 231,839 47,196 279,035

18 FURTHER NOTES
05 Adjustment of special effects in free cash flow
The programme comprises genuine sales without any rights of recourse, resulting in a reduction in balance sheet receivables of € 70,000 thousand as at the end of May 2016. Accordingly, the trade liabilities rose during the current reporting period. In add-ition, the cash flows (€ 7,298 thousand) attributable to the restructuring measures in Germany are adjustedin adjusted free cash flow.
Besides the special effects from the factoring programme (€ 20,000 thousand) and the restructuring measures (€ 12,245 thousand), the adjusted free cash flows were adjusted in par-ticular for the cash-relevant loss of the Chinese supplier (€ 33,735 thousand).
The performance of the adjusted free cash flow for the first nine months (June to February) of fiscal years 2016/2017 and 2015/2016 is shown in the following tables:
Adjusted free cash flow was used as a performance indicator for internal HELLA Group management. The adjusted free cash flow as a performance indicator is not defined in the International Financial Reporting Standards. Rather it is reported by the HELLA Group as additional information in its financial reporting because it is also used for internal management and because, from the Company’s perspective, it presents the cash flows from the operating activities – adjusted for special effects – in a more transparent form and facilitates a comparison over time.
Cash flow from operating activities after capital expenditure and cash inflows from the sale or liquidation of investments are used for this purpose and adjusted for non-recurring cash flows.
The increase in trade receivables from the discontinuation of the factoring programme is adjusted in the current reporting period.

19FURTHER NOTES
€ thousand
2016/2017 as reported
Reduction in factoring
Restructuring 2016/2017 adjusted
Earnings before income taxes (EBT) 319,173 8,658 327,831
+ Depreciation and amortisation 292,693 292,693
+/– Change in provisions 21,288 – 1,360 19,928
+ Payments received for series production 90,906 90,906
– Non-cash sales transacted in previous periods – 86,486 – 86,486
+/– Other non-cash income and expenses – 52,905 – 52,905
+/– Profits/losses from the sale of non-current assets 3,969 3,969
+ Net financial result 28,993 28,993
+/–
Change in trade receivables and other assets not attributable to investing or financing activities – 67,060 70,000 2,940
+/– Change in inventories – 84,027 – 84,027
+/– Change in trade payables and other liabilities not attributable to investing or financing activities 20,465 20,465
+/– Net interest payments – 20,345 – 20,345
+/– Net tax payments – 71,468 – 71,468
+ Dividends received 26,644 26,644
= Net cash flow from operating activities 421,840 70,000 7,298 499,138+ Cash proceeds from the sale of property,
plant and equipment and intangible assets 9,162 9,162
– Payments for the purchase of property, plant and equipment and intangible assets – 427,893 – 427,893
+ Cash proceeds from the sale or liquidation of investments, less cash and cash equivalents 5,607 5,607
= Free cash flow 8,717 70,000 7,298 86,015

20 FURTHER NOTES
€ thousand
2015/2016 as reported
Loss of supplier Reduction in factoring
Restructuring 2015/2016 adjusted
Earnings before income taxes (EBT) 258,208 47,196 8,149 313,553
+ Depreciation and amortisation 292,676 – 13,500 279,176
+/– Change in provisions – 21,429 4,096 – 17,333
+ Payments received for series production 71,606 71,606
– Non-cash sales transacted in previous periods – 74,448 – 74,448
+/– Other non-cash income and expenses – 37,385 – 37,385
+/– Profits/losses from the sale ofnon-current assets – 372 – 372
+ Net financial result 31,466 31,466
+/–
Change in trade receivables and other assets not attributable to investing or financing activities – 74,001 1,528 20,000 – 52,473
+/– Change in inventories – 92,239 – 1,587 – 93,826
+/–
Change in trade payables and other liabilities not attributable to investing or financing activities 71,579 6,077 77,656
+/– Net interest payments – 25,664 – 25,664
+/– Net tax payments – 73,215 – 6,979 – 80,194
+ Dividends received 31,299 31,299
= Net cash flow from operating activities 358,081 32,735 20,000 12,245 423,060
+
Cash proceeds from the sale of property, plant and equipment and intangible assets 7,334 7,334
–
Payments for the purchase of property, plant and equipment and intangible assets – 375,963 1,000 – 374,963
+
Cash proceeds from the sale or liquidation of investments, less cash and cash equivalents 107 107
= Free cash flow – 10,441 33,735 20,000 12,245 55,538
21FURTHER NOTES
Lippstadt, 27 March 2017
The Managing General Partners of HELLA KGaA Hueck & Co.
Dr. Jürgen Behrend
HELLA Geschäftsführungsgesellschaft mbH
Dr. Rolf Breidenbach (President and CEO)
Bernard Schäferbarthold
Markus Bannert
Dr. Matthias Schöllmann
Stefan Osterhage

22 GLOSSARY
GLOSSARY
Adjusted free cash flowFree cash flow adjusted for special effects
AfSAvailable-for-sale financial assets
Asia / Pacific / RoWThe Asia / Pacific region comprises the countries of Asia as well as Australia and New Zealand. “Rest of world” (RoW) is the term used to cover all other countries outside of those regions mentioned specifically, such as the African states.
AssociatesAssociates are companies over which the Group exercises significant influence but no control.
At equityInclusion in the consolidated financial statements using the equity method with proportional equity
ComplianceCompliance with regulations and social norms
EBIT (earnings before interest and taxes)Earnings before interest payments and income taxes
EBIT marginReturn on sales (ratio of EBIT to sales)
EBITDA (earnings before interest, taxes, depreciation and amortisation) Earnings before depreciation, amortisation, interest and income taxes
EBITDA marginRatio of EBITDA to sales
EBT (earnings before taxes)Earnings before income taxes
EmployeesUnless defined otherwise, the employees are permanent staff.
FLACFinancial Liabilities at Amortised Cost, i.e. financial liabilities that are measured at amortised cost.
Free cash flowThe cash flow from operating activities after capital expenditure and cash inflows from the sale or liquidation of investments
HfTHeld for Trading, i.e. financial assets held for trading purposes
IFRS (International Financial Reporting Standards)International accounting rules for company financial state-ments to guarantee international comparability of annual and consolidated financial statements
Joint venturesJoint ventures are joint arrangements in which HELLA exercises joint control together with other partners and also has rights to the arrangement’s equity.
KGaA Acronym for “Kommanditgesellschaft auf Aktien”, a partner-ship limited by shares. The KGaA combines the elements of a stock corporation with those of a limited partnership.

23GLOSSARY
LaRLoans and receivables
NAFTA Acronym for “North American Free Trade Agreement”. The North American Free Trade Agreement is a trade association between Canada, the USA and Mexico, and forms a free trade zone in North America.
Net capital expenditures Payments for the acquisition of property, plant and equipment and intangible assets less cash proceeds from the sale of property, plant and equipment and intangible assets as well as payments received for series production.
Net financial debt Net financial debt is the total of the balance of cash and cash equivalents, current financial assets as well as current and non-current financial liabilities.
North and South America This region comprises all countries of North and South America.
Rating In terms of financial accounting, the rating is a method for classifying creditworthiness. This rating is issued by independ-ent rating agencies on the basis of a company analysis.
Rest of Europe This region comprises all countries in Europe including Turkey and Russia but excluding Germany.
Return on equity The return on equity is a ratio calculated by dividing net income by shareholders’ equity.
R&DResearch and development
Segment sales Sales with third-party companies and other business segments
Segment sales of the business divisionSales with third-party companies, other business segments and other business divisions of the same business segment
Special effectsSpecial effects are non-recurring or exceptional effects in their type and size which are clearly differentiated from the usual operational business. They are tracked uniformly and consist-ently in the Group and the method used to calculate adjusted earnings figures must not vary over the course of time in order to facilitate periodic comparison.
SOE, Special OE (Special Original Equipment) Designation of “Special Original Equipment” at HELLA. Inthis division HELLA systematically taps customer target groups outside the automotive original equipment market, such as manufacturers of caravans, agricultural machinery and construction machinery.
Tier-1 supplierFirst-level supplier
Working capitalHoldings plus trade receivables less trade payables

24 CONSOLIDATED FINANCIAL STATEMENT
HELLA KGaA Hueck & Co.Rixbecker Straße 7559552 Lippstadt / GermanyPhone: + 49 2941 38-0Fax + 49 2941 [email protected]
© HELLA KGaA Hueck & Co., LippstadtPrinted in Germany