quarterly report for the three months … · sales from our analog product category increased 28.8%...
TRANSCRIPT
ASIA-DOCS\9946680.5
QUARTERLY REPORT FOR THE THREE MONTHS ENDED MARCH 31, 2017
GLOBAL A&T ELECTRONICS LTD.
April 20, 2017

1 ASIA-DOCS\9946680.5
TABLE OF CONTENTS
Page
CERTAIN DEFINITIONS AND CONVENTIONS ..................................................................................................... 2
INCORPORATION OF CERTAIN DOCUMENTS BY REFERENCE ...................................................................... 3
CAUTIONARY STATEMENT REGARDING FORWARD-LOOKING INFORMATION ....................................... 4
MATERIAL RECENT DEVELOPMENTS SINCE MARCH 31, 2017 ....................................................................... 5
RISK FACTORS ........................................................................................................................................................... 6
MANAGEMENT’S DISCUSSION AND ANALYSIS OF FINANCIAL CONDITION AND RESULTS OF
OPERATIONS ....................................................................................................................................................... 7
UNAUDITED CONSOLIDATED CONDENSED INTERIM FINANCIAL INFORMATION ................................ 16
2 ASIA-DOCS\9946680.5
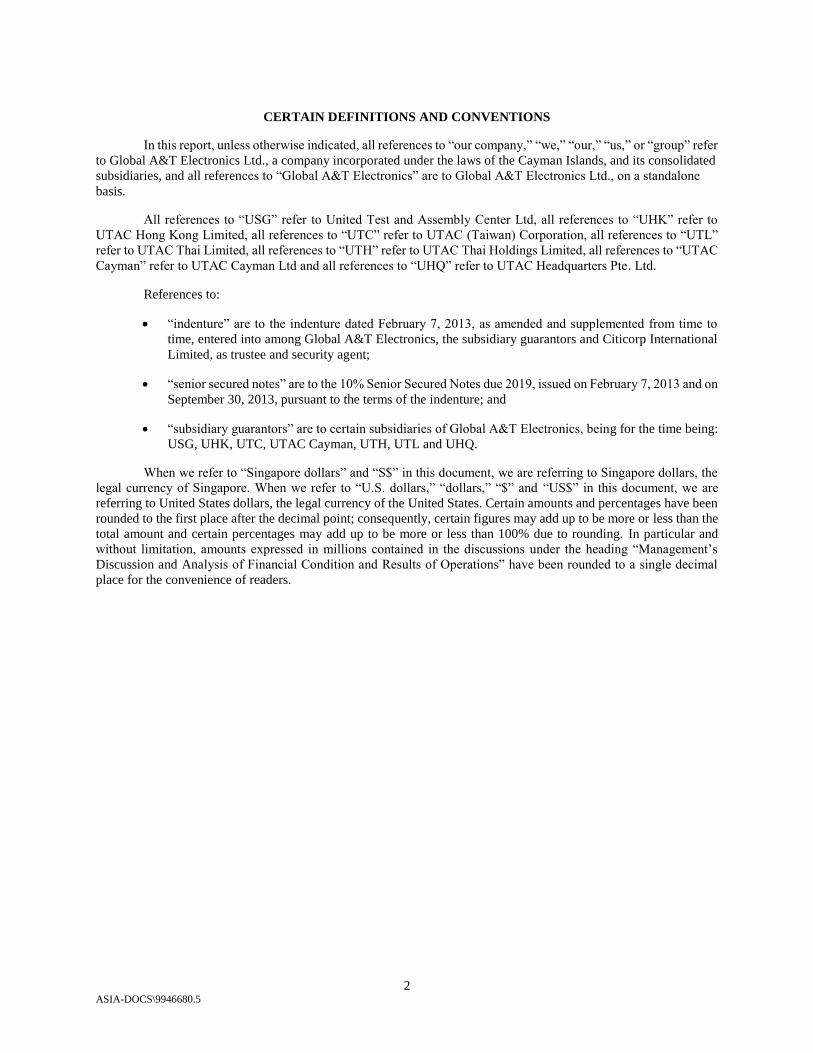
CERTAIN DEFINITIONS AND CONVENTIONS
In this report, unless otherwise indicated, all references to “our company,” “we,” “our,” “us,” or “group” refer
to Global A&T Electronics Ltd., a company incorporated under the laws of the Cayman Islands, and its consolidated
subsidiaries, and all references to “Global A&T Electronics” are to Global A&T Electronics Ltd., on a standalone
basis.
All references to “USG” refer to United Test and Assembly Center Ltd, all references to “UHK” refer to
UTAC Hong Kong Limited, all references to “UTC” refer to UTAC (Taiwan) Corporation, all references to “UTL”
refer to UTAC Thai Limited, all references to “UTH” refer to UTAC Thai Holdings Limited, all references to “UTAC
Cayman” refer to UTAC Cayman Ltd and all references to “UHQ” refer to UTAC Headquarters Pte. Ltd.
References to:
“indenture” are to the indenture dated February 7, 2013, as amended and supplemented from time to
time, entered into among Global A&T Electronics, the subsidiary guarantors and Citicorp International
Limited, as trustee and security agent;
“senior secured notes” are to the 10% Senior Secured Notes due 2019, issued on February 7, 2013 and on
September 30, 2013, pursuant to the terms of the indenture; and
“subsidiary guarantors” are to certain subsidiaries of Global A&T Electronics, being for the time being:
USG, UHK, UTC, UTAC Cayman, UTH, UTL and UHQ.
When we refer to “Singapore dollars” and “S$” in this document, we are referring to Singapore dollars, the
legal currency of Singapore. When we refer to “U.S. dollars,” “dollars,” “$” and “US$” in this document, we are
referring to United States dollars, the legal currency of the United States. Certain amounts and percentages have been
rounded to the first place after the decimal point; consequently, certain figures may add up to be more or less than the
total amount and certain percentages may add up to be more or less than 100% due to rounding. In particular and
without limitation, amounts expressed in millions contained in the discussions under the heading “Management’s
Discussion and Analysis of Financial Condition and Results of Operations” have been rounded to a single decimal
place for the convenience of readers.

3 ASIA-DOCS\9946680.5
INCORPORATION OF CERTAIN DOCUMENTS BY REFERENCE
We incorporate by reference into this quarterly report, Global A&T Electronics’ annual report for the year
ended December 31, 2016, dated April 20, 2017. Any document incorporated by reference is current only as of the
date of such document, and the incorporation by reference of such document should not create any implication that
there has been no change in our affairs since such date. The information incorporated by reference is considered to be
part of this quarterly report. Information in this quarterly report supersedes any information incorporated by reference
that was delivered to you prior to the date of this quarterly report. In other words, in the case of a conflict or
inconsistency between information contained in this quarterly report and any information incorporated by reference
into this quarterly report, you should rely on the information contained in the document that was delivered to you later.

4 ASIA-DOCS\9946680.5
CAUTIONARY STATEMENT REGARDING FORWARD-LOOKING INFORMATION
This quarterly report includes statements that are, or may be deemed to be, “forward-looking statements”
within the meaning of U.S. securities laws. The terms “anticipates,” “expects,” “may,” “will,” “should” and other
similar expressions identify forward-looking statements. These statements appear in a number of places throughout
this quarterly report and include statements regarding our intentions, beliefs or current expectations concerning,
among other things, our results of operations, financial condition, liquidity, prospects, growth, strategies and the
industry in which we operate.
By their nature, forward-looking statements involve risks and uncertainties because they relate to events and
depend on circumstances that may or may not occur in the future. Forward-looking statements are not guarantees of
future performance and our actual results of operations, financial condition and liquidity, and the development of the
semiconductor industry may differ materially from those made in or suggested by the forward-looking statements
contained in this quarterly report. Important factors that could cause those differences include, but are not limited to:
our history of substantial losses;
our significant indebtedness affecting our operations, and our ability to repay or refinance our
indebtedness as it falls due;
the cyclicality of the semiconductor industry;
our reliance on certain major customers;
our ability to manage our geographically diverse manufacturing facilities and expand our business;
increased competition from other companies and our ability to maintain and increase our market share;
pending litigation by certain holders of our senior secured notes, litigation relating to our intellectual
property and other potential legal liabilities;
our ability to successfully develop new technologies;
our ability to acquire equipment and supplies necessary to meet our business needs;
our ability to generate sufficient cash to meet our capital expenditure requirements;
our ability to hire and maintain qualified personnel;
fires, natural disasters, acts of terrorism and other developments outside our control;
the political stability of our local region; and
general local and global economic conditions.
Forward-looking statements include, but are not limited to, statements regarding our strategy and future
plans, future business condition and financial results, our capital expenditure plans, our expansion plans, technological
upgrades, investment in research and development, future market demand and future regulatory or other developments
in our industry. Please see “Risk Factors” for a further discussion of certain factors that may cause actual results to
differ materially from those indicated by our forward-looking statements.

5 ASIA-DOCS\9946680.5
MATERIAL RECENT DEVELOPMENTS SINCE MARCH 31, 2017
Other than as disclosed elsewhere in this quarterly report, there have been no material developments in our
business since March 31, 2017.

6 ASIA-DOCS\9946680.5
RISK FACTORS
Other than as disclosed elsewhere in this quarterly report, there have been no material changes to the risk
factors previously disclosed under the heading “Risk Factors” in our annual report for the year ended December 31,
2016.

7 ASIA-DOCS\9946680.5
MANAGEMENT’S DISCUSSION AND ANALYSIS OF FINANCIAL CONDITION AND RESULTS OF
OPERATIONS
You should read the following discussion of our results of operations in conjunction with our unaudited
consolidated condensed interim financial information as of and for the three months ended March 31, 2017 and the
related notes thereto included elsewhere in this quarterly report.
This discussion contains forward-looking statements that reflect our current views with respect to future
events and financial performance. Our actual results may differ materially from those anticipated in these
forward-looking statements as a result of factors such as those set forth under “Risk Factors” in our annual report for
the year ended December 31, 2016 and elsewhere in this quarterly report. See “Cautionary Statement Regarding
Forward-looking Information.” Our unaudited consolidated condensed interim financial information are reported in
U.S. dollars and have been prepared in accordance with Singapore Financial Reporting Standards, or SFRS, which
may differ in certain significant respects from generally accepted accounting principles in other countries.
Overview
We are a leading independent provider of semiconductor assembly and test services for a broad range of
integrated circuits with diversified uses, including in communications devices (such as smartphones, Bluetooth and
WiFi), consumer devices, computing devices, automotive applications and industrial and medical applications. We
provide assembly and test services primarily for three key semiconductor product categories, namely, analog,
mixed-signal and logic, and memory.
Our customers are primarily fabless companies, integrated device manufacturers and wafer foundries. Our
expertise in assembly and test services accumulated through years of engineering experience has allowed us to
develop long-standing and well-established relationships with our customers, many of whom are leaders in their
respective product categories.
The table below shows, for the periods indicated, the amount and percentage of our sales attributable to each
of our assembly services and test services:
The following table sets forth our sales by product category as a percentage of sales, which has been prepared
based on our management’s determination of the product categories that are served by our customers:
Product category
Three months ended March 31,
2016 2017
Amount
($ in millions)
Percentage
of sales
Amount
($ in millions)
Percentage
of sales
Analog ................................................... 68.1 43.4% 87.7 53.0%
Mixed-signal and logic .......................... 72.4 46.1% 61.0 36.9%
Memory ................................................. 16.5 10.5% 16.7 10.1%
Total ...................................................... 157.0 100.0% 165.4 100.0%
Sales from our analog product category increased 28.8% to $87.7 million in the three months ended March
31, 2017 from $68.1 million in the three months ended March 31, 2016 primarily due to increased demand from
existing analog customers, primarily in UTL.
Service type
Three months ended March 31,
2016 2017
Amount
($ in millions)
Percentage
of sales
Amount
($ in millions)
Percentage
of sales
Assembly ............................................... 108.2 68.9% 118.0 71.3%
Test ........................................................ 48.8 31.1% 47.5 28.7%
Total ...................................................... 157.0 100.0% 165.4 100.0%
8 ASIA-DOCS\9946680.5
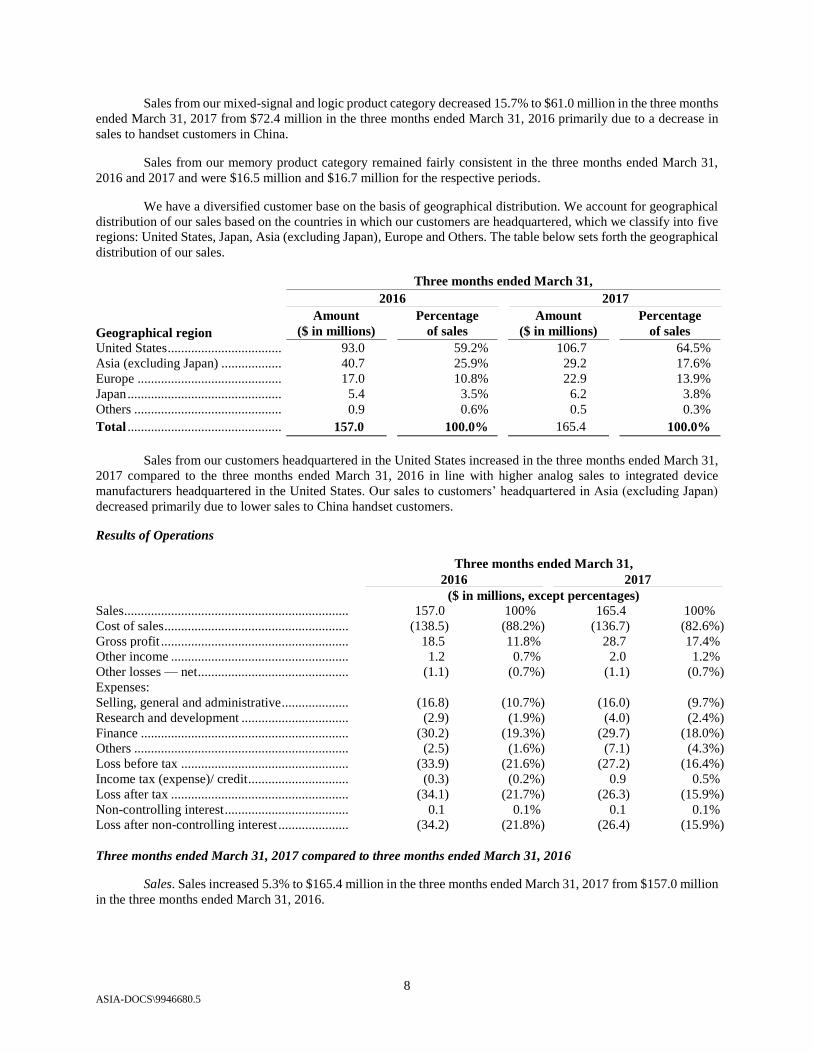
Sales from our mixed-signal and logic product category decreased 15.7% to $61.0 million in the three months
ended March 31, 2017 from $72.4 million in the three months ended March 31, 2016 primarily due to a decrease in
sales to handset customers in China.
Sales from our memory product category remained fairly consistent in the three months ended March 31,
2016 and 2017 and were $16.5 million and $16.7 million for the respective periods.
We have a diversified customer base on the basis of geographical distribution. We account for geographical
distribution of our sales based on the countries in which our customers are headquartered, which we classify into five
regions: United States, Japan, Asia (excluding Japan), Europe and Others. The table below sets forth the geographical
distribution of our sales.
Geographical region
Three months ended March 31,
2016 2017
Amount
($ in millions)
Percentage
of sales
Amount
($ in millions)
Percentage
of sales
United States .......................................... 93.0 59.2% 106.7 64.5%
Asia (excluding Japan) .......................... 40.7 25.9% 29.2 17.6%
Europe ................................................... 17.0 10.8% 22.9 13.9%
Japan ...................................................... 5.4 3.5% 6.2 3.8%
Others .................................................... 0.9 0.6% 0.5 0.3%
Total ...................................................... 157.0 100.0% 165.4 100.0%
Sales from our customers headquartered in the United States increased in the three months ended March 31,
2017 compared to the three months ended March 31, 2016 in line with higher analog sales to integrated device
manufacturers headquartered in the United States. Our sales to customers’ headquartered in Asia (excluding Japan)
decreased primarily due to lower sales to China handset customers.
Results of Operations
Three months ended March 31,
2016 2017
($ in millions, except percentages)
Sales ................................................................... 157.0 100% 165.4 100%
Cost of sales ....................................................... (138.5) (88.2%) (136.7) (82.6%)
Gross profit ........................................................ 18.5 11.8% 28.7 17.4%
Other income ..................................................... 1.2 0.7% 2.0 1.2%
Other losses — net ............................................. (1.1) (0.7%) (1.1) (0.7%)
Expenses:
Selling, general and administrative .................... (16.8) (10.7%) (16.0) (9.7%)
Research and development ................................ (2.9) (1.9%) (4.0) (2.4%)
Finance .............................................................. (30.2) (19.3%) (29.7) (18.0%)
Others ................................................................ (2.5) (1.6%) (7.1) (4.3%)
Loss before tax .................................................. (33.9) (21.6%) (27.2) (16.4%)
Income tax (expense)/ credit .............................. (0.3) (0.2%) 0.9 0.5%
Loss after tax ..................................................... (34.1) (21.7%) (26.3) (15.9%)
Non-controlling interest ..................................... 0.1 0.1% 0.1 0.1%
Loss after non-controlling interest ..................... (34.2) (21.8%) (26.4) (15.9%)
Three months ended March 31, 2017 compared to three months ended March 31, 2016
Sales. Sales increased 5.3% to $165.4 million in the three months ended March 31, 2017 from $157.0 million
in the three months ended March 31, 2016.

9 ASIA-DOCS\9946680.5
Our assembly service sales increased 9.1% to $118.0 million in the three months ended March 31, 2017 from
$108.2 million in the three months ended March 31, 2016 primarily due to an increase in sales of analog products,
which was partially offset by a decrease in sales of mixed-signal and logic products. Our test services sales decreased
to $47.5 million in the three months ended March 31, 2017 from $48.8 million in the three months ended March 31,
2016 primarily due to lower orders from mobile products customers.
Cost of sales. Cost of sales decreased 1.3% to $136.7 million in the three months ended March 31, 2017 from
$138.5 million in the three months ended March 31, 2016 primarily due to lower material costs of our inventory that
we wrote down to their net realizable value in 2016, a shift in product mix within our analog and mixed-signal and
logic product categories, lower depreciation expense and lower cost of utilities. Our cost of sales as a percentage of
sales decreased to 82.6% in the three months ended March 31, 2017 compared to 88.2% in the three months ended
March 31, 2016 for the same reasons.
Gross profit. Gross profit increased 55.1% to $28.7 million in the three months ended March 31, 2017 from
$18.5 million in the three months ended March 31, 2016. Gross profit as a percentage of sales, or gross profit margin,
was 17.4% in the three months ended March 31, 2017 compared to 11.8% in the three months ended March 31, 2016.
The increases in our gross profit and gross profit margin were primarily due to higher assembly sales and lower cost of
sales due to lower material costs of our inventory that we wrote down to their net realizable value in 2016, a shift in
product mix within our analog and mixed-signal and logic product categories, lower depreciation expense and lower
cost of utilities.
Other income. Other income increased to $2.0 million in the three months ended March 31, 2017 from $1.2
million in the three months ended March 31, 2016 primarily due to an increase in sales of scraps.
Other losses - net. Other losses – net remained constant in the three months ended March 31, 2016 and 2017
and were $1.1 million in each period and primarily related to foreign currency losses in each period.
Selling, general and administrative expenses. Selling, general and administrative expenses decreased 4.8% to
$16.0 million in the three months ended March 31, 2017 from $16.8 million in the three months ended March 31, 2016
primarily due to lower depreciation expense related to corporate assets, including computers, equipment and furniture.
Research and development expenses. Research and development expenses increased 35.7% to $4.0 million in
the three months ended March 31, 2017 from $2.9 million in the three months ended March 31, 2016 primarily due to
higher depreciation expense related to plant and equipment used for research and development purposes.
Finance expenses. Finance expenses were $29.7 million in the three months ended March 31, 2017 compared
to $30.2 million in the three months ended March 31, 2016 and primarily relate to the interest charges on our long term
borrowings, which were fairly consistent in the two comparative periods.
Other expenses. Other expenses were $7.1 million in the three months ended March 31, 2017 compared to
$2.5 million in the three months ended March 31, 2016. The increase in the three months ended March 31, 2017 was
primarily due to a provision for severance costs of $5.4 million relating to the closure of USC during the period.
Loss before tax. Our loss before tax was $27.2 million in the three months ended March 31, 2017 compared to
a loss before tax of $33.9 million in the three months ended March 31, 2016.
Income tax (expense)/ credit. Our income tax credit was $0.9 million in the three months ended March 31,
2017 compared to income tax expense of $0.3 million in the three months ended March 31, 2016 because our income
tax credit on movement of temporary difference for the three months ended March 31, 2017 was greater than our
income tax provision for the same period.
Non-SFRS Measures
EBITDA and adjusted EBITDA may not be comparable to similarly titled measures reported by other
companies due to potential inconsistencies in the method of calculation.

10 ASIA-DOCS\9946680.5
We have included EBITDA because we believe it is an indicative measure of our operating performance and
is used by investors and analysts to evaluate companies in our industry. We define EBITDA as loss after tax adjusted
for (i) income tax expense; (ii) finance expenses; and (iii) depreciation and amortization, which represent depreciation
of property, plant and equipment and amortization of intangible assets.
We have included adjusted EBITDA because we believe it is a more indicative measure of our baseline
performance as it excludes certain charges that our management considers to be outside of our core operating results.
We define adjusted EBITDA as EBITDA adjusted for extraordinary items including, for the periods under review, (i)
restructuring costs; (ii) gain on disposal of non-current asset held for sale; (iii) settlement fees to Tessera; (iv) legal and
professional fees which relate to corporate activities; (v) impairment and provisions related to the closure of our
Shanghai production facility; and (vi) fair value gain on derivative financial instruments.
EBITDA and adjusted EBITDA are not measures of financial performance or liquidity under SFRS or U.S.
GAAP and should not be considered as alternatives to total profit, operating profit or any other performance measures
derived in accordance with SFRS or U.S. GAAP or as an alternative to cash flow from operating activities as a
measure of liquidity.
The following table reconciles our loss after tax to EBITDA and adjusted EBITDA, in each case, for the
periods indicated:
Three months ended March 31,
2016 2017
($ in millions)
Loss after tax ...................................................................................................... (34.1) (26.3)
Add/(deduct):
Income tax expense/(credit) ................................................................................. 0.3 (0.9)
Finance expenses ................................................................................................. 30.2 29.7
Depreciation of property, plant and equipment ................................................... 27.6 25.8
Amortization of intangible assets ........................................................................ 4.0 2.6
EBITDA .............................................................................................................. 28.0 30.9
Add/(deduct):
Restructuring costs .............................................................................................. 2.4 0.2
Fair value gain on derivative financial instruments ............................................. - (0.2)
Legal and professional fees relate to corporate activities .................................... - 1.3
Gain on disposal of non-current asset held for sale ............................................. (0.4) -
Settlement fee to Tessera ..................................................................................... 0.1 -
Impairment and provisions relating to Shanghai production facility closure ...... - 5.5
Adjusted EBITDA ............................................................................................. 30.1 37.7
Liquidity and Capital Resources
Our operations are capital intensive. We have funded our operations and growth primarily through a mixture
of short and long-term loans and cash flows from operations. As of March 31, 2017, our primary sources of liquidity
included cash and bank deposits of $77.4 million and our undrawn credit facilities of $11.5 million and unutilized
bank guarantee facilities of $0.7 million.
We have assessed our cash flow projections for the 15-month period ending March 31, 2018, and anticipate
that we may have insufficient liquidity to meet our interest payment obligations when due after considering our
working capital requirements and capital expenditure that is necessary to sustain our operations for such period and the
cash savings from the cost reduction measures that have been implemented. As a result, in February 2017, we engaged
investment banking firm Moelis & Company and law firm Kirkland & Ellis to explore and develop strategic options
concerning possible changes to our capital, including a potential restructuring of our senior secured notes. We are
confident that we will be able to engage constructively with the holders of our senior secured notes in relation to our
interest payment obligations.

11 ASIA-DOCS\9946680.5
We continue to review various measures to improve our operating performance and liquidity. In particular,
we have implemented extensive costs reduction measures and, in February 2017, announced the decision to shut down
the loss-making operations of USC to improve our working capital position.
The following table sets forth our consolidated cash flows with respect to operating activities, investing
activities and financing activities for the periods indicated.
Three Months ended March 31,
2016 2017
($ in millions)
Net cash provided by operating activities ..................................................... 29.2 44.4
Net cash used in investing activities ............................................................. (19.8) (19.2)
Net cash used in financing activities............................................................. (58.4) (56.5)
Net decrease in cash and cash equivalents .................................................... (49.0) (31.2)
Cash and cash equivalents at beginning of financial period ......................... 183.9 108.6
Cash and cash equivalents at end of financial period ................................... 134.9 77.4
Cash Flows from Operating Activities
We generated $44.4 million in net cash from our operating activities for the three months ended March 31,
2017. Our cash flows generated from operating activities are calculated by adjusting our loss after tax of $26.3 million
by (i) non-cash and other items, such as $25.8 million of depreciation of property, plant and equipment, $29.7 million
in finance expense, $2.6 million of amortization of intangible assets and $0.9 million in income tax credit, and (ii)
changes in working capital described below.
Working capital sources of cash in the three months ended March 31, 2017 included primarily a $0.1 million
decrease in cash from our trade and other payables and inventories of $0.9 million, which was offset by the increase in
cash from trade and other receivables of $14.6 million.
We generated $29.2 million in net cash from our operating activities for the three months ended March 31,
2016. Our cash flows generated from operating activities are calculated by adjusting our loss after tax of $34.1 million
by (i) non-cash and other items, such as $27.6 million of depreciation of property, plant and equipment, $30.2 million
in finance expense, $4.0 million of amortization of intangible assets, $0.3 million in income tax expense, and (ii)
changes in working capital described below.
Working capital sources of cash in the three months ended March 31, 2016 included primarily a $6.0 million
increase in cash from our trade and other receivables which was partially offset by the working capital use of cash of
$1.9 million in trade and other payables and $0.9 million in inventories. For the three months ended March 31, 2016,
we made cash payments of $0.1 million in respect of income tax expenses.
Cash Flows from Investing Activities
Net cash used in investing activities was $19.2 million during the three months ended March 31, 2017. The
principal component of the cash outflow was $19.6 million used for purchases of property, plant and equipment,
which was partially offset by proceeds of $0.2 million from the disposal of property, plant and equipment and interest
income receipt of $0.2 million.
Net cash used in investing activities was $19.8 million during the three months ended March 31, 2016. Cash
flows from investing activities consisted primarily of $25.6 million used for the purchases of property, plant and
equipment and $0.9 million used for purchases of intangible assets, which were partially offset by proceeds of $5.9
million from the disposal of our plant and equipment and proceeds of $0.6 million from the disposal of certain of our
plant and equipment classified under non-current assets held for sale.

12 ASIA-DOCS\9946680.5
Cash Flows from Financing Activities
Net cash used in financing activities during the three months ended March 31, 2017 was $56.5 million, which
principally included $56.4 million in interest payments and $0.1 million in repayment of finance lease liabilities.
Net cash used in financing activities during the three months ended March 31, 2016 was $58.4 million, which
principally included $56.9 million in interest payments, $0.1 million in repayment of finance lease liabilities and $1.4
million in dividends paid to minority shareholders of UTL.
Capital Expenditures
We had cash outflows in respect of capital expenditures, or cash capital expenditures, of $19.6 million for the
three months ended March 31, 2017 compared to $26.5 million for the three months ended March 31, 2016.
More than 90.0% of our cash capital expenditures of $19.6 million for the three months ended March 31,
2017 related to purchase commitments from 2016. Our cash capital expenditures of $19.6 million primarily related to
assembly capacity expansion in UTL. Subject to market conditions and our financial performance in 2017, we
currently expect cash capital expenditure for 2017 to be higher than 2016.
We plan our capital expenditure based on the expected sales and seek to invest only when we believe there
are opportunities to generate certain expected returns on investment. We expect to fund our budgeted capital
expenditure through existing cash, cash generated from operations, and asset sales. We periodically review our
budgeted capital expenditure during the financial year. We may adjust our capital expenditures based on market
conditions, the progress of our expansion plans and cash flow from operations.
Total Borrowings
As of March 31, 2017, the total amount outstanding under our long-term and short-term borrowings was
$1,113.4 million (after deducting unamortized loan facility and related issuance costs).
Long-Term Borrowings
The following table sets out certain details relating to our long-term borrowings (without including finance
leases):
Facility
Borrower/
Issuer
Amount
outstanding as
of March 31,
2017
Total
committed
amount Interest rate Maturity
($ in millions)
Senior secured notes .............. Global A&T
Electronics
1,127.3(1)
1,127.3 10.0% February 2019
_______________ Notes: (1) This amount represented the total indebtedness outstanding under the senior secured notes as of March 31, 2017, without deducting
unamortized loan facility and related issuance costs of $14.4 million.
Sales of our subsidiaries (who are not guarantors of the senior secured notes) accounted for approximately
$7.3 million, or 4.4%, of our total sales for the three months ended March 31, 2017, and assets accounted for
approximately $39.7 million, or 3.0%, of our total assets, and liabilities accounted for approximately $23.1 million, or
1.8%, of our total liabilities, in each case as of March 31, 2017.
Sales of our subsidiaries (who are not guarantors of the senior secured notes) accounted for approximately
$17.0 million, or 10.8%, of our total sales for the three months ended March 31, 2016, and assets accounted for
approximately $84.3 million, or 5.9%, of our total assets, and liabilities accounted for approximately $28.3 million, or
2.2%, of our total liabilities, in each case as of March 31, 2016.

13 ASIA-DOCS\9946680.5
Assets of our subsidiaries who are not guarantors of the senior secured notes decreased to $39.7 million as of
March 31, 2017 compared to $84.3 million as of March 31, 2016 primarily due to impairment charges over their
property, plant and equipment during the year ended December 31, 2016.
Short-Term Borrowings
Our short-term borrowings comprise primarily of revolving credit facilities and trade financing facilities.
UTL currently has a revolving credit facility of up to 175.0 million Thai Baht (approximately $5.1 million as
of March 31, 2017) with Siam Commercial Bank Public Company Limited, or Siam Commercial Bank, which may be
utilized for working capital purposes. As of March 31, 2017, this facility has not been utilized.
UTL also currently has bank guarantee facilities for an aggregate of up to 85.0 million Thai Baht
(approximately $2.5 million as of March 31, 2017) provided by Siam Commercial Bank, which may be utilized for
working capital purposes. As of March 31, 2017, guarantees of an aggregate amount of 60.5 million Thai Baht
(approximately $1.8 million) have been issued under these facilities.
UTC has a letter of credit facility in the amount of $7.0 million with Ta Chong Bank, which has an undrawn
balance of $6.4 million as of March 31, 2017.
Finance leases
We have leased certain plant and equipment under finance leases. As of March 31, 2017, our total finance
lease obligations were $0.5 million. Lease terms generally range from one to four years with options to purchase at the
end of the lease term. Lease terms generally do not contain restrictions concerning dividends, additional debts or
further leasing and do not provide for contingent rents. The liabilities under the leases are secured on the plant and
equipment, which are the subject of the finance lease contracts.
Off-balance Sheet Arrangements
As of March 31, 2017, other than disclosed in elsewhere of this document, we do not have other off-balance
sheet arrangements.
Contingent Liabilities
From time to time, we are subject to claims that arise in the normal course of business. These claims may
include allegations of infringement of intellectual property rights of others, environmental liability, labor, products, as
well as other claims of liability.
Complaints filed by certain noteholders
In February 2014, a complaint was filed in the Supreme Court of the State of New York, New York County,
by certain holders of our senior secured notes, alleging certain claims in relation to the issuance of the $502.3 million
in aggregate principal amount of senior secured notes on September 30, 2013. The plaintiffs allege that the September
30, 2013 exchange transaction caused an event of default under the indenture and seek monetary damages and other
relief, including an injunction “unwinding” the September 30, 2013 transaction and/or “subordinating the liens”
securing the senior secured notes issued on September 30, 2013 to the liens on those senior secured notes issued on
February 7, 2013. On July 14, 2015, the court granted Global A&T Electronics’ motion to dismiss and dismissed the
February 2014 complaint in its entirety. On July 21, 2015, certain plaintiffs appealed the court’s decision to the
Appellate Division of the Supreme Court of the State of New York. On May 3, 2016, the Appellate Division reinstated
certain of the noteholders’ claims against Global A&T Electronics’ for breach of the indenture and the intercreditor
agreement in connection with the September 30, 2013 exchange transaction. On October 7, 2016, certain noteholders
filed an amended complaint that asserted the claims reinstated by the Appellate Division. On October 31, 2016, Global
A&T Electronics filed a motion to dismiss that complaint based on standing grounds. The briefing for the motion has
been completed, and a hearing has been scheduled for April 27, 2017. We continue to be of the view that the
September 30, 2013 exchange transaction fully complied with the intercreditor agreement and the indenture and will
vigorously oppose the noteholders’ claims. Any adverse ruling from this litigation could have a material and adverse
effect on our business, financial condition and results of operations.

14 ASIA-DOCS\9946680.5
On March 31, 2017, a complaint was filed in the Supreme Court of the State of New York, New York
County, by certain holders of our senior secured notes, alleging claims which appear similar to the claims asserted by
other holders of our senior secured notes in the complaint filed in the New York State Supreme Court in February
2014. We believe that the claims alleged are without merit and intend to vigorously defend our interests in this suit.
Suit filed by Amkor Technology
On April 4, 2014, Amkor Technology, Inc., or Amkor, filed a complaint against Global A&T Electronics and
certain of its subsidiaries in the Superior Court of Arizona. The suit relates to patent licenses between Amkor and
certain of Global A&T Electronics’ subsidiaries. We filed a motion to dismiss Amkor’s complaint on August 12, 2014
and on January 5, 2015, the court dismissed seven out of the nine claims made by Amkor in the complaint. On
February 13, 2015, Amkor filed an amended complaint in which it reasserted the two claims that were not dismissed
and one of the claims that had been dismissed. The remaining three claims made by Amkor relate to the payment of
royalties by one of our subsidiaries, a claim that certain alleged events triggered a right for Amkor to seek the purchase
of certain patents belonging to ASAT Limited (now known as UHK) and a breach of an implied covenant of good faith
and fair dealing. On March 24, 2015, we filed a motion to dismiss the claims against UHK (formerly ASAT Limited)
and an answer to the other claims. In addition, on July 28, 2015, we filed a motion for partial summary judgment
against Amkor’s royalty claim against UTL on the basis that UTL ceased to be covered by the royalty-bearing license
when it ceased to be a subsidiary of USG in September 2010. On December 20, 2016, the court granted our motion for
partial summary judgment, ruling that UTL ceased to be covered by the agreement between USG and Amkor, or the
USG-Amkor Agreement, in September 2010. The court therefore ruled that UTL’s products are not subject to
contractual royalties under the USG-Amkor Agreement. The court further ruled that Amkor cannot assert a claim
against UTL for breach of the implied covenant of good faith and fair dealing under the USG-Amkor Agreement,
because UTL is not a party to that agreement, and also that Amkor cannot use a claim under the UHK-Amkor
Cross-License to collect royalties from UTL and accordingly no royalties are owed under that license for products
made by UTL. With respect to our motion to dismiss the claims against UHK, the court granted our motion with
respect to Amkor’s claim that UHK had transferred or assigned the UHK-Amkor Cross-License to UTL and Amkor’s
claim that UHK had breached the confidentiality obligations under the UHK-Amkor Cross-License, and accordingly it
dismissed those claims with prejudice. The court declined to dismiss Amkor’s claims that certain alleged events
triggered a right for Amkor to seek the purchase of certain patents belonging to UHK, and the action is ongoing with
respect to this claim. We will continue to vigorously defend our interests in this suit. Any adverse ruling from this
litigation could have a material and adverse effect on our business, financial condition and results of operations.
Critical Accounting Policies
Our critical accounting policies are disclosed in our annual report for the year ended December 31, 2016.
During the three months ended March 31, 2017, there have been no significant changes in our critical accounting
policies.
Recent Accounting Pronouncements under SFRS
New Accounting Standards and SFRS Interpretations Effective 2016
Certain new standards, amendments and interpretations to existing standards that have been published, and
are relevant for Global A&T Electronics’ accounting periods beginning on or after January 1, 2017 or later periods and
which Global A&T Electronics has not already adopted. We anticipate that the adoption of these Financial Reporting
Standards, or FRS, International Financial Reporting Standards and amendments to the FRS in the future periods will
not have a material impact on the financial statements of the Global A&T Electronics in the period of their initial
adoption.
15 ASIA-DOCS\9946680.5
Quantitative and Qualitative Disclosures about Market Risk
Market risk is the risk of loss related to adverse changes in market prices, including interest rates and foreign
exchange rates, of financial instruments. We are exposed to various financial market risks in our ordinary course
business transactions, primarily from interest rate movements on non-current variable rate borrowings and exchange
rate movements. For details of quantitative and qualitative disclosures about market risk, see “Management’s
Discussion and Analysis of Financial Condition and Results of Operations — Quantitative and Qualitative Disclosures
about Market Risk” in our annual report for the year ended December 31, 2016.

16 ASIA-DOCS\9946680.5
UNAUDITED CONSOLIDATED CONDENSED INTERIM FINANCIAL INFORMATION
1 ........... Global A&T Electronics Ltd. Unaudited Consolidated Condensed Interim Financial Information for the three
months ended March 31, 2017

17 ASIA-DOCS\9946680.5
GLOBAL A&T ELECTRONICS LTD. AND ITS SUBSIDIARIES
UNAUDITED CONSOLIDATED CONDENSED INTERIM STATEMENT OF COMPREHENSIVE
INCOME
For the three months ended March 31, 2017
Three months
ended March 31,
2016 2017
US$’000 US$’000 Sales ................................................................................................................................... 157,034 165,418
Cost of sales ....................................................................................................................... (138,505) (136,681)
Gross profit ........................................................................................................................ 18,529 28,737
Other income ..................................................................................................................... 1,150 1,983
Other loss – net .................................................................................................................. (1,067) (1,121)
Expenses ............................................................................................................................
Selling, general and administrative .................................................................................... (16,782) (15,983)
Research and development ................................................................................................ (2,910) (3,950)
Finance .............................................................................................................................. (30,245) (29,746)
Other ................................................................................................................................. (2,529) (7,100)
Loss before tax ................................................................................................................... (33,854) (27,180)
Income tax expense ............................................................................................................ (260) 870
Loss after tax .................................................................................................................... (34,114) (26,310)
Other comprehensive income:
Items that may be reclassified subsequently to profit or loss: Cash flow hedges
- Fair value gains Items that will not be reclassified to profit or loss: Remeasurements on post-employment benefit obligation ................................................. 15 12
Other comprehensive income, net of tax ........................................................................ 15 55
Total comprehensive loss ................................................................................................. (34,099) (26,255)
(Loss)/profit attributable to:
Equity holders of the Company ......................................................................................... (34,168) (26,410)
Non-controlling interests ................................................................................................... 54 100
(34,114) (26,310)
Total comprehensive (loss)/income attributable to:
Equity holders of the Company ......................................................................................... (34,154) (26,355)
Non-controlling interests ................................................................................................... 55 100
(34,099) (26,255)

18 ASIA-DOCS\9946680.5
GLOBAL A&T ELECTRONICS LTD. AND ITS SUBSIDIARIES
UNAUDITED CONSOLIDATED CONDENSED INTERIM STATEMENT OF FINANCIAL POSITION
As of March 31, 2017
December 31,
2016 March 31, 2017
US$’000 US$’000
ASSETS
Current assets
Cash and bank deposits................................................................................................. 108,634 77,411
Trade and other receivables .......................................................................................... 125,795 111,352
Inventories .................................................................................................................... 43,086 44,012
Other assets .................................................................................................................. 7,578 7,812
285,093 240,587
Non-current assets held-for-sale ................................................................................... 297 48
285,390 240,635
Non-current assets
Other assets .................................................................................................................. 2,130 1,931
Deferred income tax assets ........................................................................................... 3,082 4,442
Available-for-sale financial assets ................................................................................ 983 983
Property, plant and equipment ...................................................................................... 410,100 401,352
Goodwill ....................................................................................................................... 643,405 643,405
Intangible assets ........................................................................................................... 18,596 16,346
1,078,296 1,068,459
Total assets ....................................................................................................................... 1,363,686 1,309,094
LIABILITIES
Current liabilities
Trade and other payables .............................................................................................. 162,494 124,414
Current income tax liabilities........................................................................................ 2,105 3,478
Deferred income ........................................................................................................... 56 53
Borrowings ................................................................................................................... 257 249
Provisions ..................................................................................................................... 8,307 14,290
Derivative financial instruments ................................................................................... 57 -
173,276 142,484
Non-current liabilities
Trade and other payables .............................................................................................. 5,176 5,311
Borrowings ................................................................................................................... 1,111,414 1,113,143
Deferred income tax liabilities ...................................................................................... 9,339 8,953
Long term benefit obligations ....................................................................................... 22,149 23,126
1,148,078 1,150,533
Total liabilities .................................................................................................................. 1,321,354 1,293,017
NET ASSETS ................................................................................................................... 42,332 16,077
EQUITY
Capital and reserves attributable to the equity holder of the Company
Share capital ................................................................................................................. * *
Capital contribution ...................................................................................................... 698,000 698,000
Other reserves ............................................................................................................... (7,354) (7,299)
Accumulated losses ...................................................................................................... (652,709) (679,120)
37,397 11,581
Non-controlling interests .............................................................................................. 4,395 4,496
Total equity ................................................................................................................. 42,332 16,077
* Denotes amount less than US$1,000
19 ASIA-DOCS\9946680.5
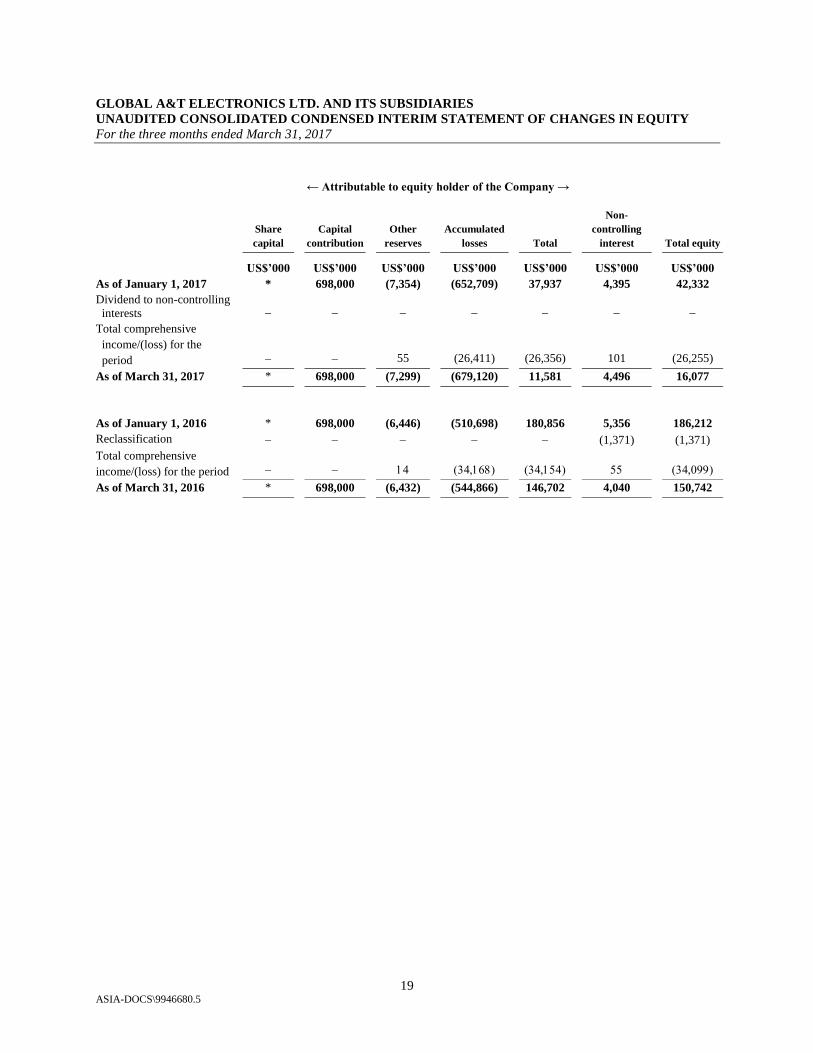
GLOBAL A&T ELECTRONICS LTD. AND ITS SUBSIDIARIES
UNAUDITED CONSOLIDATED CONDENSED INTERIM STATEMENT OF CHANGES IN EQUITY
For the three months ended March 31, 2017
← Attributable to equity holder of the Company →
Share
capital
Capital
contribution
Other
reserves
Accumulated
losses Total
Non-
controlling
interest Total equity
US$’000 US$’000 US$’000 US$’000 US$’000 US$’000 US$’000
As of January 1, 2017 * 698,000 (7,354) (652,709) 37,937 4,395 42,332
Dividend to non-controlling
interests
Total comprehensive
income/(loss) for the
period 55 (26,411) (26,356) 101 (26,255)
As of March 31, 2017 * 698,000 (7,299) (679,120) 11,581 4,496 16,077
As of January 1, 2016 * 698,000 (6,446) (510,698) 180,856 5,356 186,212
Reclassification (1,371) (1,371)
Total comprehensive
income/(loss) for the period
As of March 31, 2016 * 698,000 (6,432) (544,866) 146,702 4,040 150,742

20 ASIA-DOCS\9946680.5
GLOBAL A&T ELECTRONICS LTD. AND ITS SUBSIDIARIES
UNAUDITED CONSOLIDATED CONDENSED INTERIM STATEMENT OF CASH FLOWS
For the three months ended March 31, 2017
Three months ended March 31,
2016 2017
US$’000 US$’000
Cash flows from operating activities
Loss after tax ....................................................................................................................... (34,114) (26,310)
Adjustments for:
- Income tax expense ....................................................................................................... 260 (870)
- Depreciation of property, plant and equipment.............................................................. 27,588 25,768
- Amortization of intangible assets .................................................................................. 3,993 2,627
- Net gain on disposal of property, plant and equipment .................................................. (10) 7
- Net gain on disposal of non-current asset held for sale .................................................. (393) -
- Finance expense ............................................................................................................. 30,245 29,746
- Interest income .............................................................................................................. (244) (105)
- Government grant income ............................................................................................. (65) (89)
- Fair value gain on derivative financial instruments ....................................................... - (157)
27,260 30,617
Change in working capital
- Trade and other receivables ........................................................................................... 6,034 14,560
- Inventories ..................................................................................................................... (991) (927)
- Derivative financial instruments .................................................................................... - 150
- Other assets .................................................................................................................... (447) (352)
- Trade and other payables ............................................................................................... (1,887) (118)
- Long term benefit obligations ........................................................................................ (638) 973
- Currency translation difference ..................................................................................... (51) (546)
Government grant received ................................................................................................. 62 86
Income tax paid ................................................................................................................... (98) (38)
Net cash provided by operating activities ........................................................................ 29,244 44,405
Cash flows from investing activities
Payment for acquisition of property, plant and equipment .................................................. (25,551) (19,581)
Payment for acquisition of intangible assets ........................................................................ (938) -
Proceeds from disposal of property, plant and equipment ................................................... 5,882 241
Proceeds from disposal of non-current assets held for sale ................................................. 632 -
Interest received .................................................................................................................. 147 164
Net cash used in investing activities ................................................................................. (19,828) (19,176)
Cash flows from financing activities
Repayment of finance lease liabilities ................................................................................. (98) (89)
Interest paid ......................................................................................................................... (56,915) (56,363)
Dividend paid to a non-controlling interest ......................................................................... (1,371) -
Net cash used in financing activities ................................................................................. (58,384) (56,452)
Net decrease in cash and cash equivalents ....................................................................... (48,968) (31,223)
Cash and cash equivalents at the beginning of the financial period ..................................... 183,900 108,634
Cash and cash equivalents at the end of the financial period ........................................ 134,932 77,411
Net cash provided by/(used in):
Operating activities ........................................................................................................ 29,244 44,405
Investing activities ......................................................................................................... (19,828) (19,176)
Financing activities ........................................................................................................ (58,384) (56,452)
Total .............................................................................................................................. (48,968) (31,223)
21 ASIA-DOCS\9946680.5
GLOBAL A&T ELECTRONICS LTD. AND ITS SUBSIDIARIES
NOTES TO THE UNAUDITED CONSOLIDATED CONDENSED INTERIM FINANCIAL INFORMATION
For the three months ended March 31, 2017
1. Basis of preparation
The Consolidated Financial Information and related disclosures as of March 31, 2016 and 2017 and for the
three months ended March 31, 2016 and 2017 are unaudited. The December 31, 2016 consolidated statement of
financial position was derived from the audited financial statements, but does not include all the disclosures required
to be prepared in accordance with SFRS.
Certain information and footnote disclosures normally included in financial statements prepared in
accordance with SFRS have been condensed or omitted for the purposes of the interim financial information.
Intercompany accounts and transactions have been eliminated. The preparation of these Consolidated Financial
Information requires our management to make estimates and assumptions that affect the amounts reported in these
Consolidated Financial Information. Actual results could differ materially from those estimates. The unaudited
consolidated condensed financial information should be read in conjunction with the audited consolidated financial
statements and related notes thereto for the financial year ended December 31, 2016.
The results of operations for interim periods are not necessarily indicative of the results of operations that
may be expected for the full financial year.
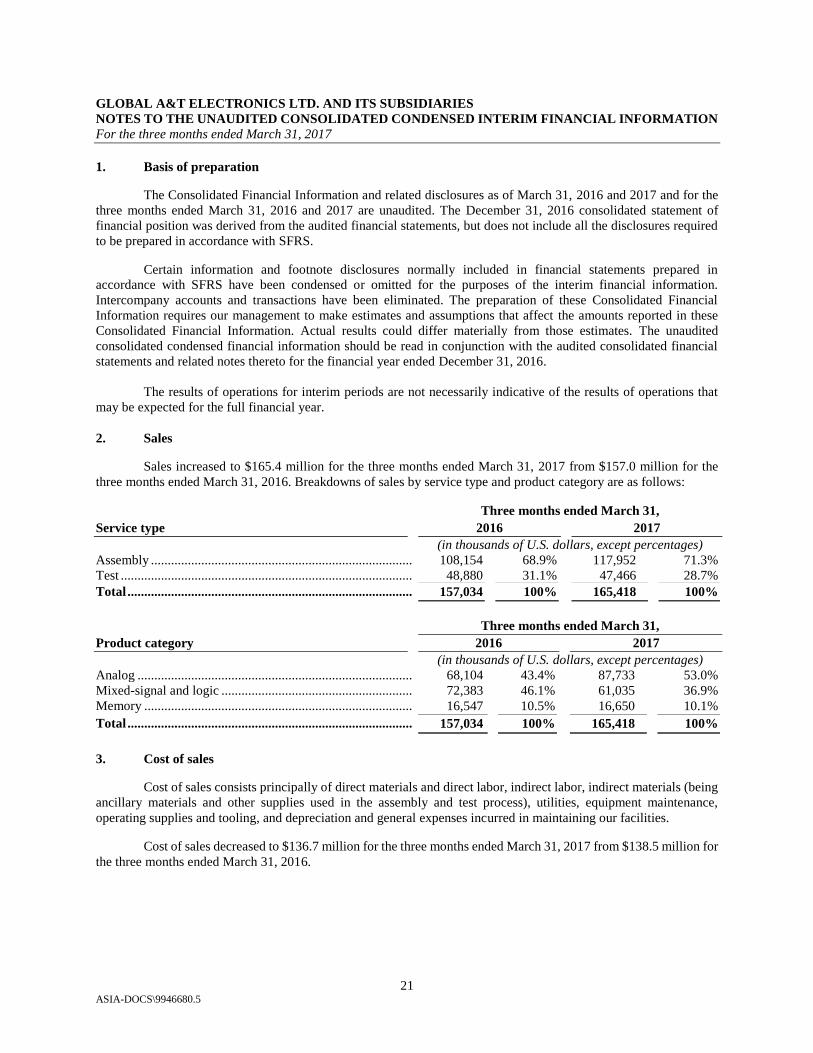
2. Sales
Sales increased to $165.4 million for the three months ended March 31, 2017 from $157.0 million for the
three months ended March 31, 2016. Breakdowns of sales by service type and product category are as follows:
Three months ended March 31,
Service type 2016 2017
(in thousands of U.S. dollars, except percentages)
Assembly .................................................................................. 108,154 68.9% 117,952 71.3%
Test ........................................................................................... 48,880 31.1% 47,466 28.7%
Total ......................................................................................... 157,034 100% 165,418 100%
Three months ended March 31,
Product category 2016 2017
(in thousands of U.S. dollars, except percentages)
Analog ........................................................................................ 68,104 43.4% 87,733 53.0%
Mixed-signal and logic ............................................................... 72,383 46.1% 61,035 36.9%
Memory ...................................................................................... 16,547 10.5% 16,650 10.1%
Total ........................................................................................... 157,034 100% 165,418 100%
3. Cost of sales
Cost of sales consists principally of direct materials and direct labor, indirect labor, indirect materials (being
ancillary materials and other supplies used in the assembly and test process), utilities, equipment maintenance,
operating supplies and tooling, and depreciation and general expenses incurred in maintaining our facilities.
Cost of sales decreased to $136.7 million for the three months ended March 31, 2017 from $138.5 million for
the three months ended March 31, 2016.

22 ASIA-DOCS\9946680.5
GLOBAL A&T ELECTRONICS LTD. AND ITS SUBSIDIARIES
NOTES TO THE UNAUDITED CONSOLIDATED CONDENSED INTERIM FINANCIAL INFORMATION
For the three months ended March 31, 2017
4. Cash and bank deposits
Cash and bank deposits
As of December
31, 2016
As of March 31,
2017
(in thousands of U.S. dollars)
Cash at bank and on hand ....................................................................................... 62,599 71,375
Short-term bank deposits ........................................................................................ 46,035 6,036
Total ........................................................................................................................ 108,634 77,411
At the balance sheet date, the carrying amounts of cash and cash equivalents approximated their fair values.
5. Trade and other receivables
Trade and other receivables
As of December
31, 2016
As of March
31, 2017
(in thousands of U.S. dollars)
Current
Trade receivables – non-related parties .................................................................. 118,899 104,521
Trade receivables – related corporation .................................................................. 87 -
Less: Allowance for impairment of receivables - non-related parties .................... (77) (77)
118,909 104,444
Non-trade receivables
- non-related parties ............................................................................................. 4,325 2,926
- immediate holding corporation ......................................................................... 1,528 1,500
- a related corporation ......................................................................................... 1,033 2,482
Total ........................................................................................................................ 125,795 111,352
Amount due from immediate holding corporation and a related corporation are unsecured, non-interest
bearing and repayable on demand.
6. Trade and other payables
Trade and other payables
As of
December 31,
2016
As of March
31, 2017
(in thousands of U.S. dollars)
Trade payables to non-related parties
- Purchase of property, plant and equipment ................................................. 15,051 13,129
- Other purchases .......................................................................................... 45,609 41,455
60,660 54,584
Other payables – non-related parties ................................................................ 5,210 4,153
Accrued interest payable .................................................................................. 46,969 18,474
Other accrual for operating expenses ............................................................... 36,296 33,576
Deposits and advances from customers ............................................................ 7,359 7,627
Deferred payment on legal settlement to a third party ...................................... 6,000 6,000
Total for current portion ................................................................................... 162,494 124,414
Non-current
Deferred payment on legal settlement to a third party ...................................... 5,176 5,311
23 ASIA-DOCS\9946680.5
GLOBAL A&T ELECTRONICS LTD. AND ITS SUBSIDIARIES
NOTES TO THE UNAUDITED CONSOLIDATED CONDENSED INTERIM FINANCIAL INFORMATION
For the three months ended March 31, 2017
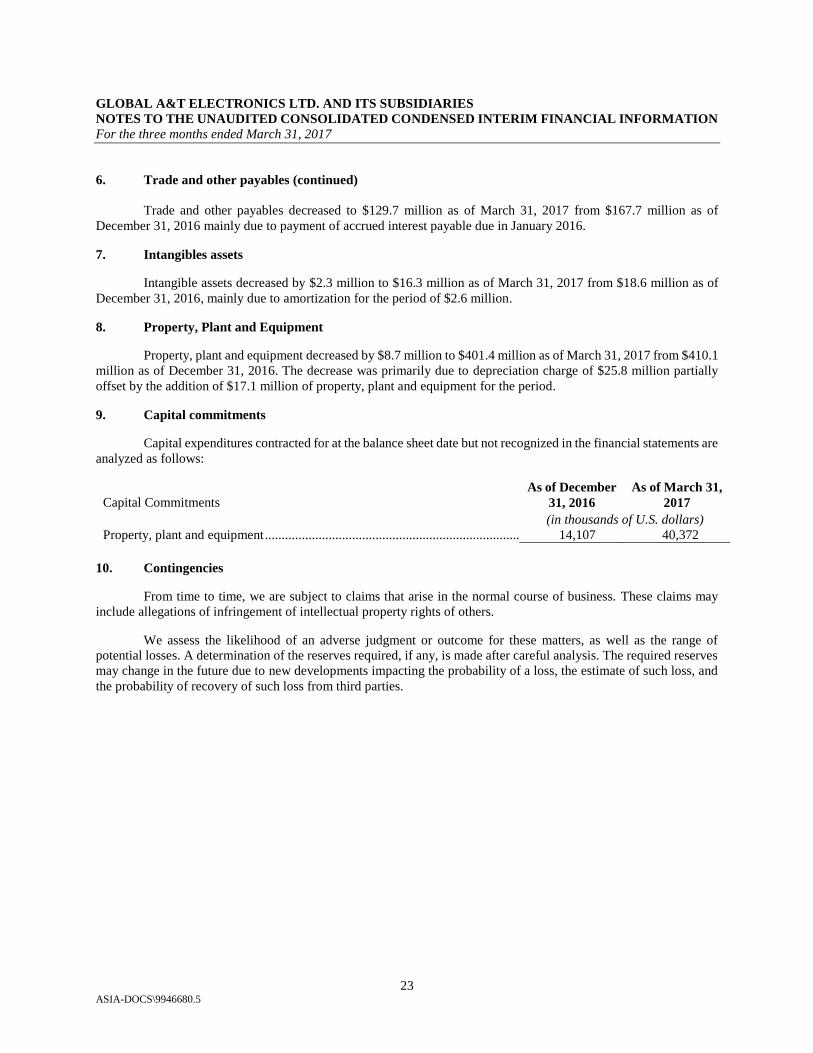
6. Trade and other payables (continued)
Trade and other payables decreased to $129.7 million as of March 31, 2017 from $167.7 million as of
December 31, 2016 mainly due to payment of accrued interest payable due in January 2016.
7. Intangibles assets
Intangible assets decreased by $2.3 million to $16.3 million as of March 31, 2017 from $18.6 million as of
December 31, 2016, mainly due to amortization for the period of $2.6 million.
8. Property, Plant and Equipment
Property, plant and equipment decreased by $8.7 million to $401.4 million as of March 31, 2017 from $410.1
million as of December 31, 2016. The decrease was primarily due to depreciation charge of $25.8 million partially
offset by the addition of $17.1 million of property, plant and equipment for the period.
9. Capital commitments
Capital expenditures contracted for at the balance sheet date but not recognized in the financial statements are
analyzed as follows:
Capital Commitments
As of December
31, 2016
As of March 31,
2017
(in thousands of U.S. dollars)
Property, plant and equipment ................................................................................. 14,107 40,372
10. Contingencies
From time to time, we are subject to claims that arise in the normal course of business. These claims may
include allegations of infringement of intellectual property rights of others.
We assess the likelihood of an adverse judgment or outcome for these matters, as well as the range of
potential losses. A determination of the reserves required, if any, is made after careful analysis. The required reserves
may change in the future due to new developments impacting the probability of a loss, the estimate of such loss, and
the probability of recovery of such loss from third parties.

24 ASIA-DOCS\9946680.5
GLOBAL A&T ELECTRONICS LTD. AND ITS SUBSIDIARIES
NOTES TO THE UNAUDITED CONSOLIDATED CONDENSED INTERIM FINANCIAL INFORMATION
For the three months ended March 31, 2017
11. Segment Information
Three months ended Assembly Test Total
March 31, 2017 (in thousands of U.S. dollars)
Segment sales/ Sales to external parties 117,952 47,466 165,418
Segment gross profit 19,492 9,245 28,737
March 31, 2016
Segment sales/ Sales to external parties 108,154 48,880 157,034
Segment gross profit 9,949 8,580 18,529
Reconciliation
A reconciliation of segment gross profit to loss before income tax is as follows:
Three months ended March 31,
2016 2017
(in thousands of U.S. dollars)
Segment gross profit of reportable segments .......................................................... 18,529 28,737
Other income 1,150 1,983
Other loss – net ....................................................................................................... (1,067) (1,121)
Selling, general and administrative expenses ......................................................... (16,782) (15,983)
Research and development costs ............................................................................ (2,910) (3,950)
Finance costs .......................................................................................................... (30,245) (29,746)
Other expenses ........................................................................................................ (2,529) (7,100)
Loss before income tax ........................................................................................... (33,854) (27,180)