quarterly ongestion analysis report for the altimore ... · quarterly ongestion analysis report for...
TRANSCRIPT
Quarterly Congestion Analysis Report for the Baltimore Region Top 10 Bottleneck Locations
3rd Quarter 2016

1
Table of Contents
About the region .................................................................................................................................................................................................................... 2
How bottleneck conditions are tracked .................................................................................................................................................................................. 4
Bottleneck ranking incident icons ........................................................................................................................................................................................... 6 Top 10 Bottleneck Map .......................................................................................................................................................................................................... 7 Top 10 Bottleneck List ............................................................................................................................................................................................................ 8 #1-10 Ranked Bottlenecks with Maps, Occurrence Times and Notes ................................................................................................................................... 9-28 AM Peak Period Speed Map for the Baltimore Region ........................................................................................................................................................... 29 PM Peak Period Speed Map for the Baltimore Region ........................................................................................................................................................... 30 Credits ................................................................................................................................................................................................................................. 31

2
About the Region
Located in the heart of the Mid-Atlantic on the east coast, the Baltimore region includes:
The Baltimore region is the nation's 19th largest market, with over 2.5 million people. The market also ranks among the top 20 in the
country in the number of households, total effective buying income and retail sales.

3
4
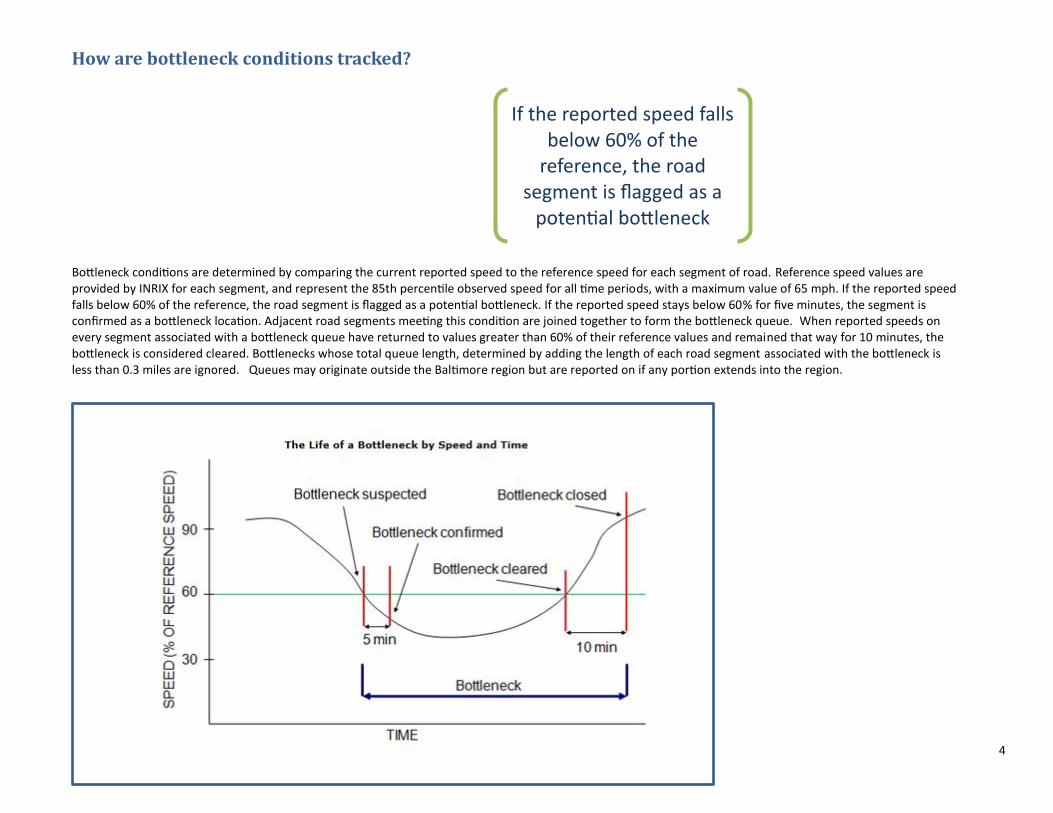
How are bottleneck conditions tracked? Bottleneck conditions are determined by comparing the current reported speed to the reference speed for each segment of road. Reference speed values are provided by INRIX for each segment, and represent the 85th percentile observed speed for all time periods, with a maximum value of 65 mph. If the reported speed falls below 60% of the reference, the road segment is flagged as a potential bottleneck. If the reported speed stays below 60% for five minutes, the segment is confirmed as a bottleneck location. Adjacent road segments meeting this condition are joined together to form the bottleneck queue. When reported speeds on every segment associated with a bottleneck queue have returned to values greater than 60% of their reference values and remained that way for 10 minutes, the bottleneck is considered cleared. Bottlenecks whose total queue length, determined by adding the length of each road segment associated with the bottleneck is less than 0.3 miles are ignored. Queues may originate outside the Baltimore region but are reported on if any portion extends into the region.
If the reported speed falls below 60% of the
reference, the road segment is flagged as a
potential bottleneck

5
How are bottleneck conditions tracked?
Bottleneck Ranking Table
The Bottleneck Ranking Table will display a list of locations identified as being bottlenecks along with some additional information for each
location, including:
Rank - The ranked position of the location according to the current table ordering (Impact by default)
Impact - The aggregation of queue length over time for congestion originating at each location in mile-minutes. For
example, if at time t1 an element has congestion covering one mile of the roadway, it has an impact of 1. If the
congestion then grows at time t2 to cover 2 miles, the location will now have an impact of 3. If at time t3 congestion
shrinks to 1 mile, and at t4 there is no congestion, the element will have a final impact of 4.
Average max length - The average maximum length, in miles, of queues formed by congestion originating at the location
Average daily duration - The average amount of time per day that congestion is identified originating at the location
Total duration - The total amount of time congestion was identified at the location
All Events/Incidents - The number of traffic events and incidents that occurred within the space of the bottleneck at any
time during the time period being analyzed

6
Bottleneck Ranking Incident Icons
When showing event/incident icons on some of the graphs in the Bottleneck Ranking tool a minimalist approach has been taken. In order to reduce clutter and confusion on the
graphs, icons have been simplified down to single shape and color. Each represents the following:
Red — Severe events and incidents
Emergency Roadwork
Injury
Medical Emergency
Orange — Roadwork
Yellow — All other events and incidents
More detailed icons may be used at times when a major incident was the cause of a bottleneck.
Incident/Event Icons
7
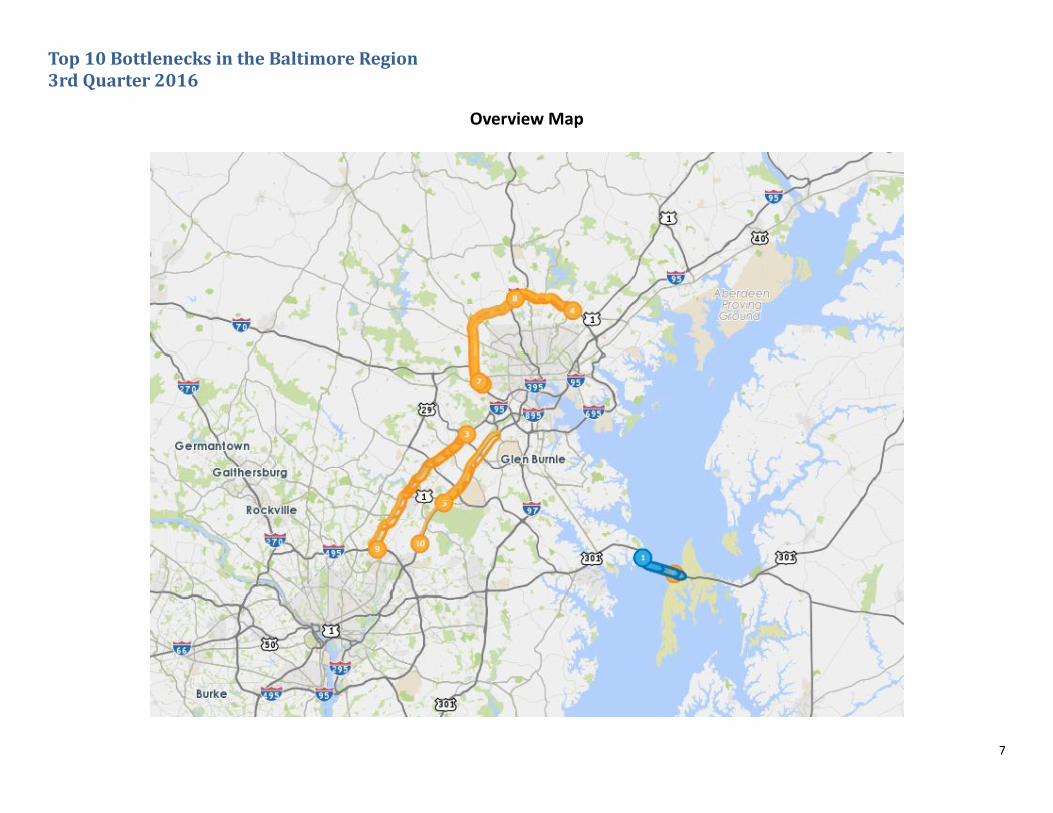
Top 10 Bottlenecks in the Baltimore Region 3rd Quarter 2016
Overview Map
8
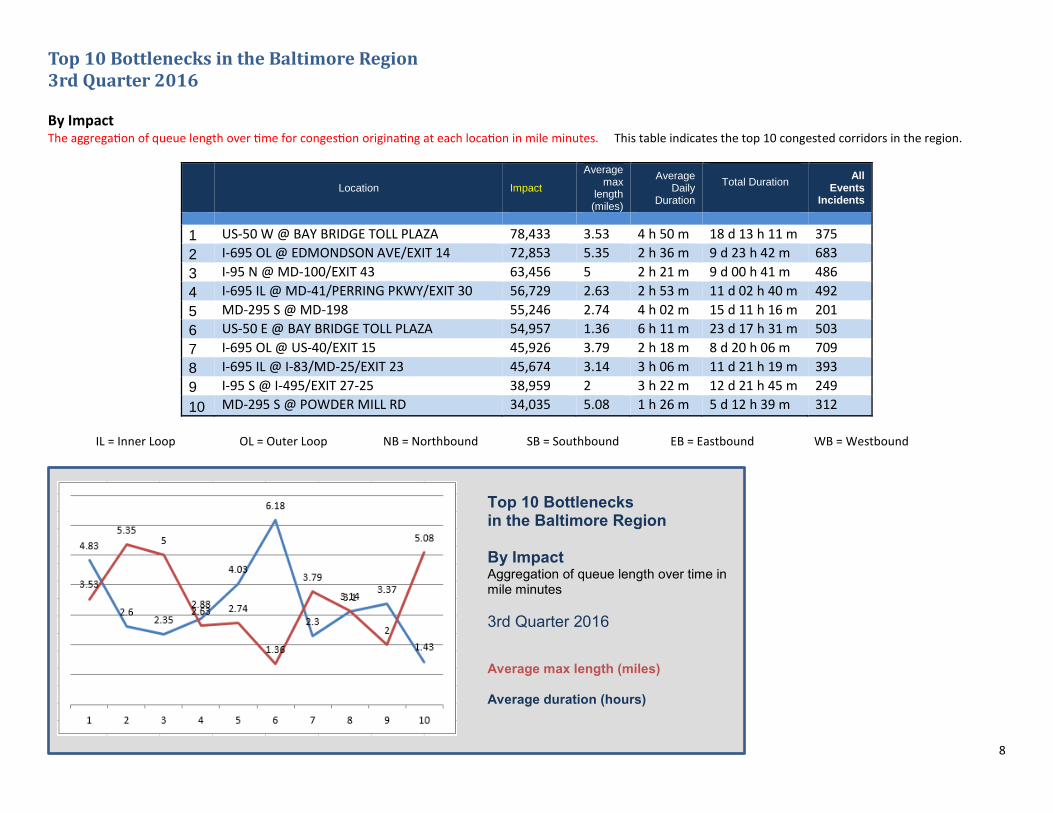
Top 10 Bottlenecks in the Baltimore Region 3rd Quarter 2016 By Impact The aggregation of queue length over time for congestion originating at each location in mile minutes. This table indicates the top 10 congested corridors in the region.
Location Impact
Average max
length (miles)
Average Daily
Duration
Total Duration
All Events
Incidents
1 US-50 W @ BAY BRIDGE TOLL PLAZA 78,433 3.53 4 h 50 m 18 d 13 h 11 m 375
2 I-695 OL @ EDMONDSON AVE/EXIT 14 72,853 5.35 2 h 36 m 9 d 23 h 42 m 683
3 I-95 N @ MD-100/EXIT 43 63,456 5 2 h 21 m 9 d 00 h 41 m 486
4 I-695 IL @ MD-41/PERRING PKWY/EXIT 30 56,729 2.63 2 h 53 m 11 d 02 h 40 m 492
5 MD-295 S @ MD-198 55,246 2.74 4 h 02 m 15 d 11 h 16 m 201
6 US-50 E @ BAY BRIDGE TOLL PLAZA 54,957 1.36 6 h 11 m 23 d 17 h 31 m 503
7 I-695 OL @ US-40/EXIT 15 45,926 3.79 2 h 18 m 8 d 20 h 06 m 709
8 I-695 IL @ I-83/MD-25/EXIT 23 45,674 3.14 3 h 06 m 11 d 21 h 19 m 393
9 I-95 S @ I-495/EXIT 27-25 38,959 2 3 h 22 m 12 d 21 h 45 m 249
10 MD-295 S @ POWDER MILL RD 34,035 5.08 1 h 26 m 5 d 12 h 39 m 312
IL = Inner Loop OL = Outer Loop NB = Northbound SB = Southbound EB = Eastbound WB = Westbound
Top 10 Bottlenecks in the Baltimore Region By Impact Aggregation of queue length over time in mile minutes
3rd Quarter 2016
Average max length (miles) Average duration (hours)
9
#1 Ranked Bottleneck in the Baltimore Region – 3rd Quarter 2016
Location Impact Average max length (miles) Average Daily Duration Total Duration
All Events/Incidents
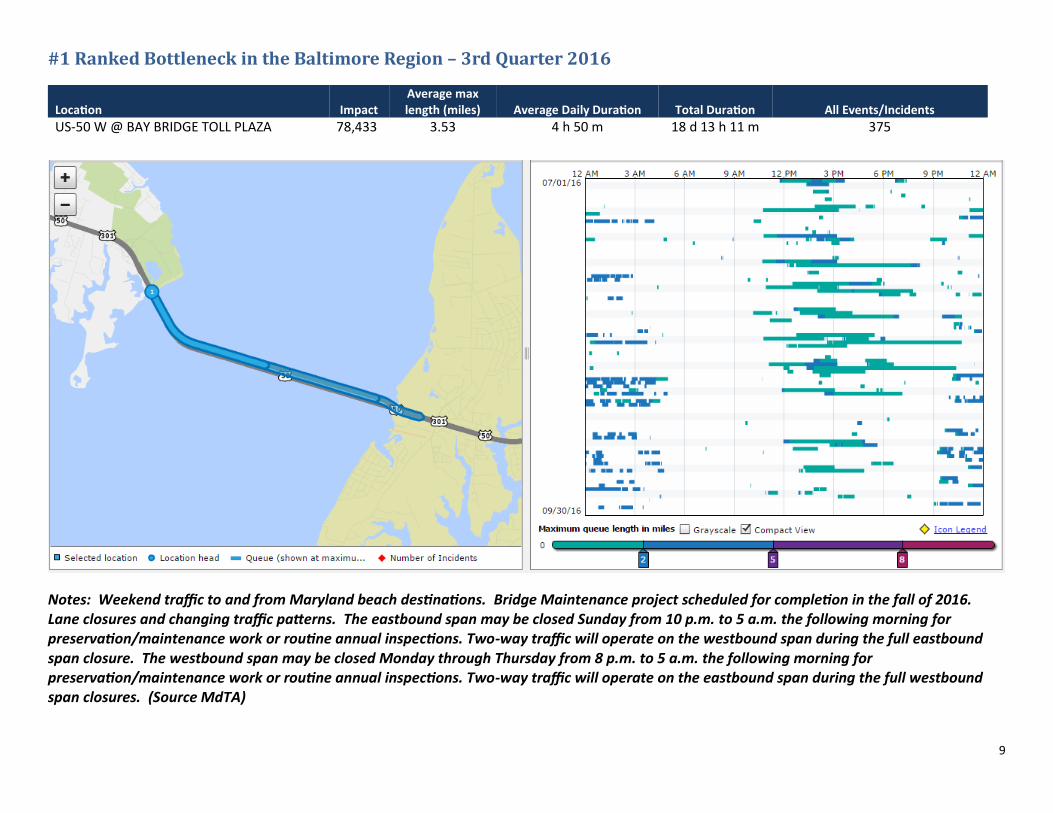
US-50 W @ BAY BRIDGE TOLL PLAZA 78,433 3.53 4 h 50 m 18 d 13 h 11 m 375
Notes: Weekend traffic to and from Maryland beach destinations. Bridge Maintenance project scheduled for completion in the fall of 2016. Lane closures and changing traffic patterns. The eastbound span may be closed Sunday from 10 p.m. to 5 a.m. the following morning for preservation/maintenance work or routine annual inspections. Two-way traffic will operate on the westbound span during the full eastbound span closure. The westbound span may be closed Monday through Thursday from 8 p.m. to 5 a.m. the following morning for preservation/maintenance work or routine annual inspections. Two-way traffic will operate on the eastbound span during the full westbound span closures. (Source MdTA)

10
#1 Ranked Bottleneck in the Baltimore Region – 3rd Quarter 2016
Location Impact Average max length (miles) Average Daily Duration Total Duration
All Events/Incidents
US-50 W @ BAY BRIDGE TOLL PLAZA 78,433 3.53 4 h 50 m 18 d 13 h 11 m 375
Traffic Volumes – Average Annual Daily Traffic (AADT) STATION_DESCRIPTION US 50 at William Preston Lane Jr. Memorial Bridge

11
#2 Ranked Bottleneck in the Baltimore Region – 3rd Quarter 2016
Location Impact Average max length (miles) Average Daily Duration Total Duration
All Events/Incidents
I-695 OL @ EDMONDSON AVE/EXIT 14 72,853 5.35 2 h 36 m 9 d 23 h 42 m 683
Notes: Longstanding bottleneck on the outer loop of the beltway primarily during the morning rush. High traffic volume area. Delays extend back as far as MD-26/Liberty Rd. Also contributing to congestion in the area is a beltway widening project which began in February. “The plan is for crews to add a fourth lane to the outer loop and widen the median in anticipation of a possible fifth lane. The bridges over Ingleside and Edmondson avenues will be replaced to increase the clearance height.” (Source: The Baltimore Sun 2/23/15)

12
#2 Ranked Bottleneck in the Baltimore Region – 3rd Quarter 2016
Location Impact Average max length (miles) Average Daily Duration Total Duration
All Events/Incidents
I-695 OL @ EDMONDSON AVE/EXIT 14 72,853 5.35 2 h 36 m 9 d 23 h 42 m 683
Traffic Volumes – Average Annual Daily Traffic (AADT) STATION_DESCRIPTION 695 - South of Ingleside Ave (ATR#32)

13
#3 Ranked Bottleneck in the Baltimore Region – 3rd Quarter 2016
Location Impact Average max length (miles) Average Daily Duration Total Duration
All Events/Incidents
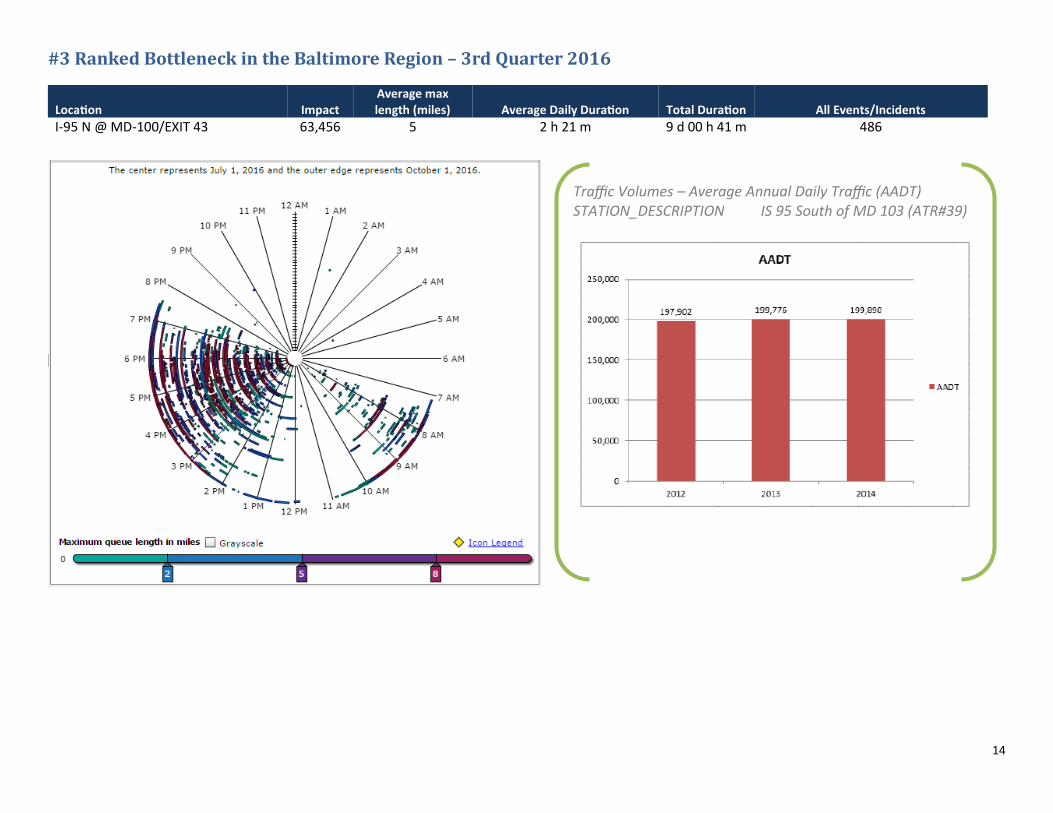
I-95 N @ MD-100/EXIT 43 63,456 5 2 h 21 m 9 d 00 h 41 m 486
Notes: Congestion in the afternoon rush hour. Contributing factors include traffic entering at MD-175, weaving to exit at MD-100, and the half-mile uphill grade midway between MD-175 and MD-100.
14
#3 Ranked Bottleneck in the Baltimore Region – 3rd Quarter 2016
Location Impact Average max length (miles) Average Daily Duration Total Duration
All Events/Incidents
I-95 N @ MD-100/EXIT 43 63,456 5 2 h 21 m 9 d 00 h 41 m 486
Traffic Volumes – Average Annual Daily Traffic (AADT) STATION_DESCRIPTION IS 95 South of MD 103 (ATR#39)
15
#4 Ranked Bottleneck in the Baltimore Region – 3rd Quarter 2016
Location Impact
Average max length (miles) Average Daily Duration Total Duration
All Events/Incidents
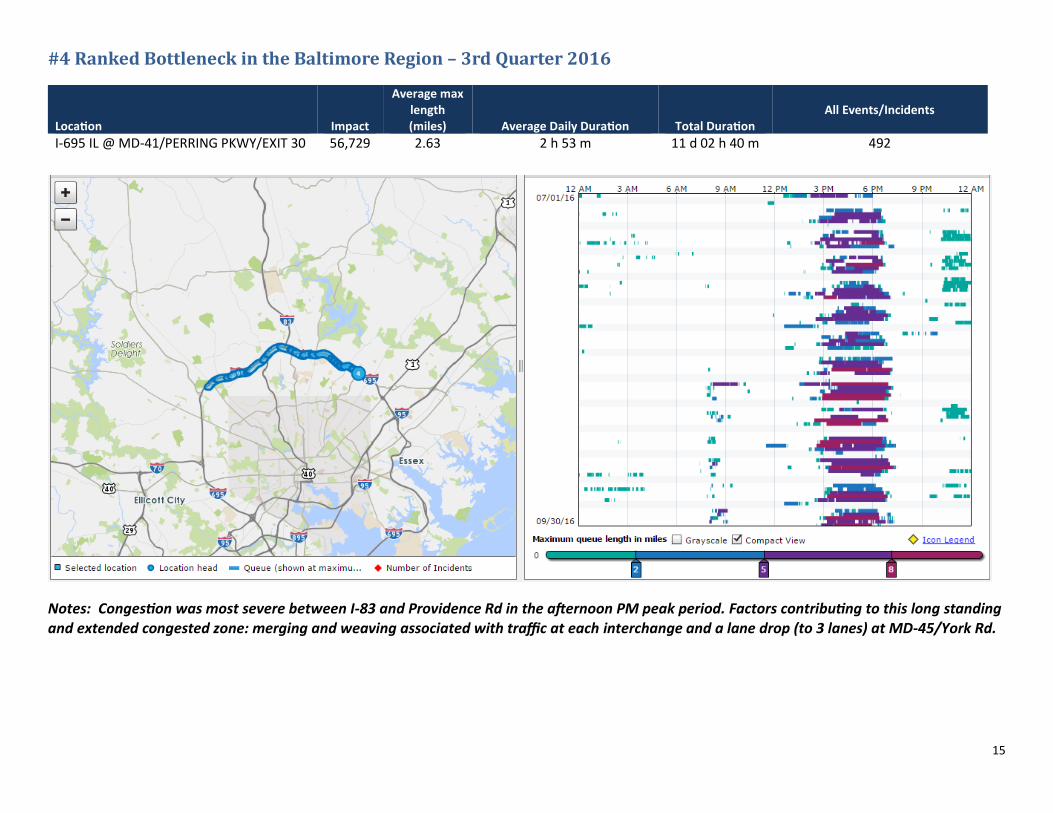
I-695 IL @ MD-41/PERRING PKWY/EXIT 30 56,729 2.63 2 h 53 m 11 d 02 h 40 m 492
Notes: Congestion was most severe between I-83 and Providence Rd in the afternoon PM peak period. Factors contributing to this long standing and extended congested zone: merging and weaving associated with traffic at each interchange and a lane drop (to 3 lanes) at MD-45/York Rd.

16
#4 Ranked Bottleneck in the Baltimore Region – 3rd Quarter 2016
Location Impact
Average max length (miles) Average Daily Duration Total Duration
All Events/Incidents
I-695 IL @ MD-41/PERRING PKWY/EXIT 30 56,729 2.63 2 h 53 m 11 d 02 h 40 m 492
Traffic Volumes – Average Annual Daily Traffic (AADT) STATION_DESCRIPTION IS695-.20 MI E OF MD542

17
#5 Ranked Bottleneck in the Baltimore Region – 3rd Quarter 2016
Location Impact Average max length (miles) Average Daily Duration Total Duration
All Events/Incidents
MD-295 S @ MD-198 55,246 2.74 4 h 02 m 15 d 11 h 16 m 201
Notes: Southbound PM congestion extending from Powder Mill Rd just barely extending into the southern portion of the Baltimore region near Fort Meade occurring during both the morning and afternoon peak periods.

18
#5 Ranked Bottleneck in the Baltimore Region – 3rd Quarter 2016
Location Impact Average max length (miles) Average Daily Duration Total Duration
All Events/Incidents
MD-295 S @ MD-198 55,246 2.74 4 h 02 m 15 d 11 h 16 m 201
Traffic Volumes – Average Annual Daily Traffic (AADT) STATION_DESCRIPTION MD295-.50 MI S OF MD32

19
#6 Ranked Bottleneck in the Baltimore Region – 3rd Quarter 2016
Location Impact Average max length (miles) Average Daily Duration Total Duration
All Events/Incidents
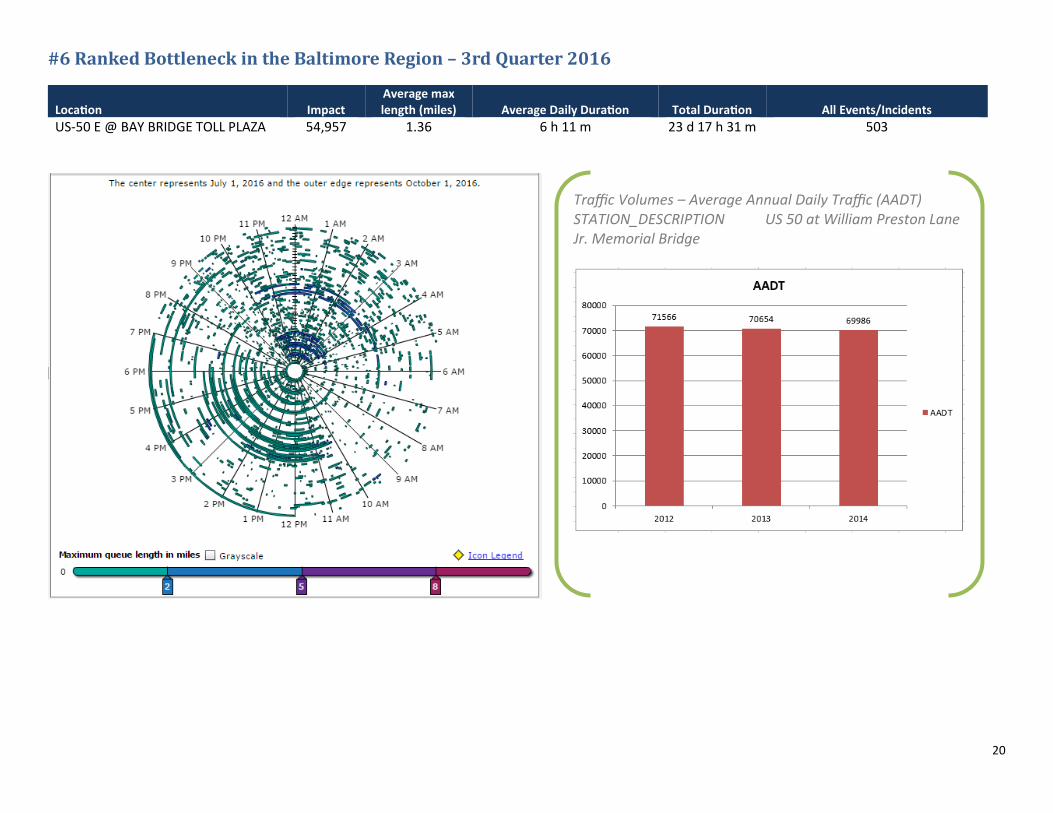
US-50 E @ BAY BRIDGE TOLL PLAZA 54,957 1.36 6 h 11 m 23 d 17 h 31 m 503
Notes: Weekend traffic to and from Maryland beach destinations. Bridge Maintenance project scheduled for completion in the fall of 2016. Lane closures and changing traffic patterns. The eastbound span may be closed Sunday from 10 p.m. to 5 a.m. the following morning for preservation/maintenance work or routine annual inspections. Two-way traffic will operate on the westbound span during the full eastbound span closure. The westbound span may be closed Monday through Thursday from 8 p.m. to 5 a.m. the following morning for preservation/maintenance work or routine annual inspections. Two-way traffic will operate on the eastbound span during the full westbound span closures. (Source MdTA)
20
#6 Ranked Bottleneck in the Baltimore Region – 3rd Quarter 2016
Location Impact Average max length (miles) Average Daily Duration Total Duration
All Events/Incidents
US-50 E @ BAY BRIDGE TOLL PLAZA 54,957 1.36 6 h 11 m 23 d 17 h 31 m 503
Traffic Volumes – Average Annual Daily Traffic (AADT) STATION_DESCRIPTION US 50 at William Preston Lane Jr. Memorial Bridge

21
#7 Ranked Bottleneck in the Baltimore Region – 3rd Quarter 2016
Location Impact Average max length (miles) Average Daily Duration Total Duration
All Events/Incidents
I-695 OL @ US-40/EXIT 15 45,926 3.79 2 h 18 m 8 d 20 h 06 m 709
Notes: Delays found in both the morning and afternoon. Longstanding bottleneck on the outer loop of the beltway primarily during the morning rush. High traffic volume area. Also contributing to congestion in the area is a beltway widening project.

22
#7 Ranked Bottleneck in the Baltimore Region – 3rd Quarter 2016
Location Impact Average max length (miles) Average Daily Duration Total Duration
All Events/Incidents
I-695 OL @ US-40/EXIT 15 45,926 3.79 2 h 18 m 8 d 20 h 06 m 709
Traffic Volumes – Average Annual Daily Traffic (AADT) STATION_DESCRIPTION IS695-.50 MI S OF IS70

23
#8 Ranked Bottleneck in the Baltimore Region – 3rd Quarter 2016
Location Impact Average max length (miles) Average Daily Duration Total Duration
All Events/Incidents
I-695 IL @ I-83/MD-25/EXIT 23 45,674 3.14 3 h 06 m 11 d 21 h 19 m 393
Notes: Rush hour congestion more severe during the AM peak period. The lane drop approaching the ramp to southbound I-83 is a contributing factor, as are merging and weaving at the interchanges in this segment.

24
#8 Ranked Bottleneck in the Baltimore Region – 3rd Quarter 2016
Location Impact Average max length (miles) Average Daily Duration Total Duration
All Events/Incidents
I-695 IL @ I-83/MD-25/EXIT 23 45,674 3.14 3 h 06 m 11 d 21 h 19 m 393
Traffic Volumes – Average Annual Daily Traffic (AADT) STATION_DESCRIPTION IS695-.50 MI N OF GREENSPRING AVE

25
#9 Ranked Bottleneck in the Baltimore Region – 3rd Quarter 2016
Location Impact Average max length (miles) Average Daily Duration Total Duration
All Events/Incidents
I-95 S @ I-495/EXIT 27-25 38,959 2 3 h 22 m 12 d 21 h 45 m 249
Notes: I-95 merge with the Capital Beltway I-495. Congestion seen in the morning and afternoon rush hour sometimes extending into the southern portion of the Baltimore region.
26
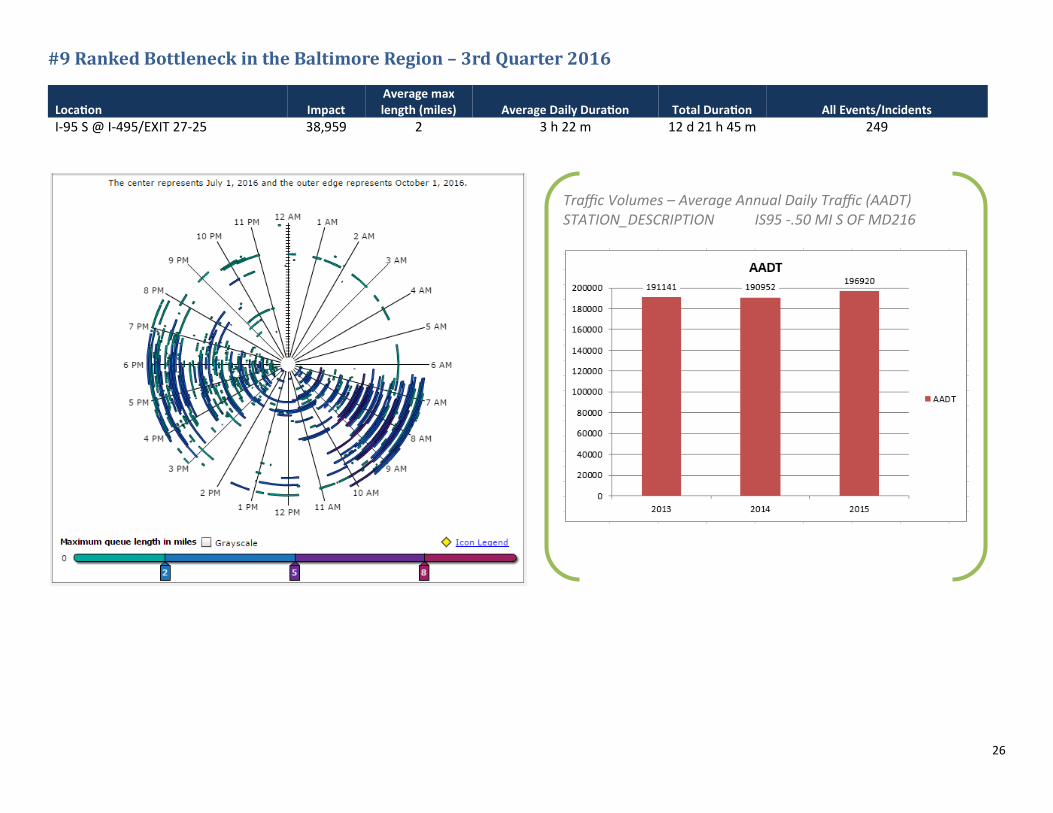
#9 Ranked Bottleneck in the Baltimore Region – 3rd Quarter 2016
Location Impact Average max length (miles) Average Daily Duration Total Duration
All Events/Incidents
I-95 S @ I-495/EXIT 27-25 38,959 2 3 h 22 m 12 d 21 h 45 m 249
Traffic Volumes – Average Annual Daily Traffic (AADT) STATION_DESCRIPTION IS95 -.50 MI S OF MD216

27
#10 Ranked Bottleneck in the Baltimore Region – 3rd Quarter 2016
Location Impact Average max length (miles) Average Daily Duration Total Duration
All Events/Incidents
MD-295 S @ POWDER MILL RD 34,035 5.08 1 h 26 m 5 d 12 h 39 m 312
Notes: Southbound AM and PM congestion extending from Powder Mill Rd just barely extending into the southern portion of the Baltimore region near Fort Meade occurring during both the morning and afternoon peak periods.

28
#10 Ranked Bottleneck in the Baltimore Region – 3rd Quarter 2016
Location Impact Average max length (miles) Average Daily Duration Total Duration
All Events/Incidents
MD-295 S @ POWDER MILL RD 34,035 5.08 1 h 26 m 5 d 12 h 39 m 312
Traffic Volumes – Average Annual Daily Traffic (AADT) STATION_DESCRIPTION MD295-.60 MI S OF MD197

29
Average Speed Maps – AM Peak Period 8:00-9:00 Weekdays: 3rd Quarter 2016

30
Average Speed Maps – PM Peak Period 5:00-6:00 Weekdays: 3rd Quarter 2016

31
The Vehicle Probe Project Data and graphics in this report were generated from the Vehicle Probe Project suite. The Vehicle Probe Project (VPP) is a groundbreaking initiative and collaborative effort among the I-95 Corridor Coalition, University of Maryland, INRIX, HERE and Tom Tom and has been providing comprehensive and continuous real-time travel information for more than seven years. Member agencies like the Baltimore Metropolitan Council have found numerous uses for the data beyond simply travel information. There are now 7,000 centerline freeway miles, more than 20,000 freeway and arterial miles in all, including continuous coverage of the I-95 corridor from New Jersey through Florida. Coverage also exists in Rhode Island. The network includes full coverage of freeways and major arterials in North Carolina and the Tidewater area of Virginia, full or nearly full coverage of limited access roads in New Jersey, Maryland and South Carolina and the northern and eastern portions of Florida. In addition, coverage now includes ramps at 160 major highway-to- highway interchanges, with all states having interchanges included except Georgia. Agency Participation As the value of the data from the Vehicle Probe Project is realized through the various applications and the continued quality via the validation efforts, the member states have increased their commitment to this project. In fact, all of the participating states have committed their own funds to continue this project and many have increased their coverage far beyond the initial core area. Numerous Uses for the Data I-95 Corridor Coalition member agencies have found many uses for the vehicle probe data, including:
Travel Information for 511 (web and phone) Systems, Dynamic Message Signs, and Kiosks
Travel Time Calculations for Message Boards
Performance Measures and Travel Time Reliability Support
Traffic Pattern Observations (in-state and multi-state)
Trip Planning (www.i95travelinfo.net)
Performance Measures Tool – Continuing the momentum in performance analysis, the newest initiative from the Coalition is the Vehicle Probe Project Suite. The basic tools include: Bottleneck and Incident dashboard Massive Raw Data Downloader Historical Data Visualizations and Performance Measures (Congestion Scan) UMD CATT Lab made the VPP suite available to participating agencies. For the training video, please visit http://vpp.ritis.org/suite/screencast/ Should you have any questions, please contact:
For general project questions, Marygrace Parker at 518-852-4083 or [email protected] For the Vehicle Probe Project Suite, Michael L. Pack at 301-405-0722 or [email protected]

32
Project Manager Victor Henry Author Edward Stylc Data Collection Contributors I-95 Corridor Coalition University of Maryland CATT Lab INRIX Skycomp
Mike Kelly, Executive Director Todd Lang, Director of Transportation Planning Regina Aris, Assistant Director of Transportation Planning
Offices @ McHenry Row | 1500 Whetstone Way, Suite 300 | Baltimore, Maryland 21230
www.baltometro.org