quarterly financial statements for the third quarter ended ... · notes to consolidated financial...
TRANSCRIPT

Quarterly Financial Statements for the Third Quarter Ended December 31, 2017
And Outlook for the Fiscal Year Ending March 31, 2018
February 2, 2018 Sony Corporation
Quarterly Financial Statements (Unaudited) F-1 Consolidated Balance Sheets F-1 Consolidated Statements of Income (Three months ended December 31) F-2 Consolidated Statements of Comprehensive Income (Three months ended December 31) F-2 Consolidated Statements of Income (Nine months ended December 31) F-3 Consolidated Statements of Comprehensive Income (Nine months ended December 31) F-3 Consolidated Statements of Cash Flows (Nine months ended December 31) F-4 Notes to Consolidated Financial Statements F-5
- Business Segment Information F-5 - Going Concern Assumption F-12 - Significant Changes in Shareholders’ Equity
F-12
- Accounting Policies and Other Information F-12 Outlook for the Fiscal Year Ending March 31, 2018 1 Outlook for the Fiscal Year Ending March 31, 2018 1
Cautionary Statement 4
All amounts are presented on the basis of Generally Accepted Accounting Principles in the U.S. (“U.S. GAAP”).
Sony Corporation and its consolidated subsidiaries are together referred to as “Sony”.

F-1
(Unaudited)Consolidated Financial StatementsConsolidated Balance Sheets
Current assets:Cash and cash equivalents \ 960,142 \ 1,328,925 \ +368,783Marketable securities 1,051,441 1,221,687 +170,246Notes and accounts receivable, trade 1,006,961 1,535,912 +528,951Allowance for doubtful accounts and sales returns (53,150) (62,135) -8,985Inventories 640,835 753,658 +112,823Other receivables 223,632 234,002 +10,370Prepaid expenses and other current assets 525,861 548,742 +22,881 Total current assets 4,355,722 5,560,791 +1,205,069
Film costs 336,928 365,783 +28,855Investments and advances:
Affiliated companies 149,371 155,303 +5,932Securities investments and other 9,962,422 10,401,319 +438,897
10,111,793 10,556,622 +444,829Property, plant and equipment:
Land 117,293 114,967 -2,326Buildings 666,381 685,576 +19,195Machinery and equipment 1,842,852 1,855,459 +12,607Construction in progress 28,779 45,041 +16,262
2,655,305 2,701,043 +45,738Less-Accumulated depreciation 1,897,106 1,909,436 +12,330
758,199 791,607 +33,408Other assets:
Intangibles, net 584,185 571,027 -13,158Goodwill 522,538 552,336 +29,798Deferred insurance acquisition costs 568,837 595,180 +26,343Deferred income taxes 98,958 91,452 -7,506Other 323,396 335,878 +12,482
2,097,914 2,145,873 +47,959 Total assets \ 17,660,556 \ 19,420,676 \ +1,760,120
Current liabilities:Short-term borrowings \ 464,655 \ 537,443 \ +72,788Current portion of long-term debt 53,424 245,646 +192,222Notes and accounts payable, trade 539,900 658,250 +118,350Accounts payable, other and accrued expenses 1,394,758 1,621,542 +226,784Accrued income and other taxes 106,037 213,874 +107,837Deposits from customers in the banking business 2,071,091 2,159,747 +88,656Other 591,874 585,348 -6,526 Total current liabilities 5,221,739 6,021,850 +800,111
Long-term debt 681,462 594,195 -87,267Accrued pension and severance costs 396,715 403,663 +6,948Deferred income taxes 432,824 428,147 -4,677Future insurance policy benefits and other 4,834,492 5,104,322 +269,830Policyholders’ account in the life insurance business 2,631,073 2,854,660 +223,587Other 314,771 284,283 -30,488 Total liabilities 14,513,076 15,691,120 +1,178,044Redeemable noncontrolling interest 12,058 14,609 +2,551Equity:Sony Corporation’s stockholders’ equity:
Common stock 860,645 864,078 +3,433Additional paid-in capital 1,275,337 1,279,422 +4,085Retained earnings 984,368 1,476,194 +491,826Accumulated other comprehensive income (618,769) (575,320) +43,449Treasury stock, at cost (4,335) (4,481) -146
2,497,246 3,039,893 +542,647Noncontrolling interests 638,176 675,054 +36,878 Total equity 3,135,422 3,714,947 +579,525 Total liabilities and equity \ 17,660,556 \ 19,420,676 \ +1,760,120
Change fromDecember 31(Millions of yen)
March 31, 2017
LIABILITIES AND EQUITY
ASSETS 2017 2017March 31

F-2
Consolidated Statements of Income
Sales and operating revenue:Net sales \ 2,059,578 \ 2,279,714 \ +220,136Financial services revenue 317,342 371,498 +54,156Other operating revenue 20,579 21,105 +526
2,397,499 2,672,317 +274,818
Costs and expenses:Cost of sales 1,495,036 1,607,962 +112,926Selling, general and administrative 411,652 415,532 +3,880Financial services expenses 286,740 315,404 +28,664Other operating (income) expense, net 113,013 (13,119) -126,132
2,306,441 2,325,779 +19,338
Equity in net income of affiliated companies 1,314 4,299 +2,985
Operating income 92,372 350,837 +258,465
Other income:Interest and dividends 2,502 3,519 +1,017Gain on sale of securities investments, net 92 833 +741Other 189 1,531 +1,342
2,783 5,883 +3,100
Other expenses:Interest 3,749 3,536 -213Loss on devaluation of securities investments 4,810 1,324 -3,486Foreign exchange loss, net 18,420 5,888 -12,532Other 1,949 2,853 +904
28,928 13,601 -15,327
Income before income taxes 66,227 343,119 +276,892
Income taxes 36,956 28,234 -8,722
Net income 29,271 314,885 +285,614
Less - Net income attributable to noncontrolling interests 9,640 18,988 +9,348
Net income attributable to Sony Corporation’s stockholders \ 19,631 \ 295,897 \ +276,266
Per share data:Net income attributable to Sony Corporation’s stockholders — Basic \ 15.55 \ 234.08 \ +218.53 — Diluted 15.24 228.91 +213.67
Net income \ 29,271 \ 314,885 \ +285,614
Other comprehensive income, net of tax –Unrealized gains (losses) on securities (8,314) 11,688 +20,002Unrealized gains (losses) on derivative instruments 3,430 (79) -3,509Pension liability adjustment 3,250 2,365 -885Foreign currency translation adjustments 112,440 3,655 -108,785
Total comprehensive income 140,077 332,514 +192,437
Less - Comprehensive income attributable to noncontrolling interests 2,152 21,603 +19,451
Comprehensive income attributable to Sony Corporation’s stockholders \ 137,925 \ 310,911 \ +172,986
2016 2017
(Millions of yen, except per share amounts)
Three months ended December 31Change
Consolidated Statements of Comprehensive Income
2016 2017Three months ended December 31
(Millions of yen)
Change

F-3
Consolidated Statements of Income
Sales and operating revenue:Net sales \ 4,834,013 \ 5,573,273 \ +739,260Financial services revenue 806,954 950,292 +143,338Other operating revenue 58,679 69,396 +10,717
5,699,646 6,592,961 +893,315
Costs and expenses:Cost of sales 3,559,927 3,957,700 +397,773Selling, general and administrative 1,088,096 1,159,190 +71,094Financial services expenses 693,537 810,967 +117,430Other operating (income) expense, net 165,454 (40,131) -205,585
5,507,014 5,887,726 +380,712
Equity in net income of affiliated companies 1,679 7,441 +5,762
Operating income 194,311 712,676 +518,365
Other income:Interest and dividends 7,859 16,556 +8,697Gain on sale of securities investments, net 155 1,479 +1,324Other 1,906 2,529 +623
9,920 20,564 +10,644
Other expenses:Interest 11,902 10,782 -1,120Loss on devaluation of securities investments 4,860 1,803 -3,057Foreign exchange loss, net 19,230 25,154 +5,924Other 4,476 4,923 +447
40,468 42,662 +2,194
Income before income taxes 163,763 690,578 +526,815
Income taxes 80,931 138,481 +57,550
Net income 82,832 552,097 +469,265
Less - Net income attributable to noncontrolling interests 37,193 44,477 +7,284
Net income attributable to Sony Corporation’s stockholders \ 45,639 \ 507,620 \ +461,981
Per share data:Net income attributable to Sony Corporation’s stockholders — Basic \ 36.17 \ 401.76 \ +365.59 — Diluted 35.43 393.05 +357.62
Net income \ 82,832 \ 552,097 \ +469,265
Other comprehensive income, net of tax –Unrealized gains (losses) on securities (25,645) 7,030 +32,675Unrealized gains on derivative instruments 3,690 150 -3,540Pension liability adjustment 9,297 7,009 -2,288Foreign currency translation adjustments 5,377 33,742 +28,365
Total comprehensive income 75,551 600,028 +524,477
Less - Comprehensive income attributable to noncontrolling interests 21,307 48,959 +27,652
Comprehensive income attributable to Sony Corporation’s stockholders \ 54,244 \ 551,069 \ +496,825
(Millions of yen)Nine months ended December 31
2016 2017 Change
Consolidated Statements of Comprehensive Income
(Millions of yen, except per share amounts)
Nine months ended December 312016 2017 Change

F-4
Consolidated Statements of Cash Flows
Cash flows from operating activities:Net income \ 82,832 \ 552,097Adjustments to reconcile net income to net cashprovided by operating activities:
Depreciation and amortization, including amortization of deferred insurance acquisition costs 259,554 258,187 Amortization of film costs 190,539 259,709 Accrual for pension and severance costs, less payments 7,270 3,948 Other operating (income) expense, net 165,454 (40,131) Loss on sale or devaluation of securities investments, net 4,706 324 Gain on revaluation of marketable securities held in the financial services business for trading purposes, net (42,727) (109,888) Loss on revaluation or impairment of securities investments held in the financial services business, net 29 213 Deferred income taxes 4,450 (4,551) Equity in net (income) loss of affiliated companies, net of dividends 5,770 (2,125) Changes in assets and liabilities: Increase in notes and accounts receivable, trade (372,978) (488,285) Increase in inventories (18,622) (88,954) Increase in film costs (242,875) (279,082) Increase in notes and accounts payable, trade 87,698 90,484 Increase in accrued income and other taxes 65,951 70,983 Increase in future insurance policy benefits and other 336,157 424,084 Increase in deferred insurance acquisition costs (70,070) (65,248) Increase in marketable securities held in the financial services business for trading purposes (60,868) (64,727) Increase in other current assets (46,705) (25,633) Increase in other current liabilities 55,453 189,524 Other (97,766) (20,600) Net cash provided by operating activities 313,252 660,329
Cash flows from investing activities:Payments for purchases of fixed assets (260,457) (189,780) Proceeds from sales of fixed assets 9,134 15,095 Payments for investments and advances by financial services business (943,712) (671,982) Payments for investments and advances (other than financial services business) (7,487) (16,526) Proceeds from sales or return of investments and collections of advances by financial services business 212,624 256,652 Proceeds from sales or return of investments and collections of advances (other than financial services business) 13,837 5,404 Proceeds from sales of businesses 3,262 44,624 Other (8,715) (10,400)
Net cash used in investing activities (981,514) (566,913)
Cash flows from financing activities:Proceeds from issuance of long-term debt 255,416 92,833 Payments of long-term debt (182,670) (20,570) Increase in short-term borrowings, net 275,084 72,913 Increase in deposits from customers in the financial services business, net 254,279 154,374 Dividends paid (25,308) (27,750) Payment for purchase of Sony/ATV shares from noncontrolling interests (76,565) -Other (32,385) (6,612)
Net cash provided by financing activities 467,851 265,188
Effect of exchange rate changes on cash and cash equivalents (11,525) 10,179
Net increase (decrease) in cash and cash equivalents (211,936) 368,783 Cash and cash equivalents at beginning of the fiscal year 983,612 960,142
Cash and cash equivalents at end of the period \ 771,676 \ 1,328,925
2016 2017
(Millions of yen)Nine months ended December 31

F-5
Notes to Consolidated Financial StatementsBusiness Segment Information(Business Segments)
Sales and operating revenueGame & Network Services
Customers \ 596,997 \ 681,649 \ +84,652Intersegment 20,702 36,317 +15,615Total 617,699 717,966 +100,267
MusicCustomers 173,218 214,267 +41,049Intersegment 5,289 4,162 -1,127Total 178,507 218,429 +39,922
PicturesCustomers 224,771 260,050 +35,279Intersegment 385 267 -118Total 225,156 260,317 +35,161
Home Entertainment & SoundCustomers 351,983 429,604 +77,621Intersegment 1,442 243 -1,199Total 353,425 429,847 +76,422
Imaging Products & SolutionsCustomers 165,260 179,112 +13,852Intersegment 1,859 1,990 +131Total 167,119 181,102 +13,983
Mobile CommunicationsCustomers 247,173 215,141 -32,032Intersegment 1,424 2,402 +978Total 248,597 217,543 -31,054
SemiconductorsCustomers 205,021 218,303 +13,282Intersegment 28,847 32,627 +3,780Total 233,868 250,930 +17,062
Financial ServicesCustomers 317,342 371,498 +54,156Intersegment 1,800 1,773 -27Total 319,142 373,271 +54,129
All OtherCustomers 109,933 96,611 -13,322Intersegment 21,713 11,971 -9,742Total 131,646 108,582 -23,064
Corporate and elimination (77,660) (85,670) -8,010Consolidated total \ 2,397,499 \ 2,672,317 \ +274,818
Game & Network Services \ 50,028 \ 85,364 \ +35,336Music 27,982 39,342 +11,360Pictures (106,774) 10,489 +117,263Home Entertainment & Sound 25,934 46,213 +20,279Imaging Products & Solutions 21,101 25,982 +4,881Mobile Communications 21,218 15,801 -5,417Semiconductors 27,166 60,558 +33,392Financial Services 28,996 56,287 +27,291All Other (2,049) 2,255 +4,304Total 93,602 342,291 +248,689Corporate and elimination (1,230) 8,546 +9,776Consolidated total \ 92,372 \ 350,837 \ +258,465
(Millions of yen)Three months ended December 31
(Millions of yen)Three months ended December 31
The 2016 segment disclosure above has been reclassified to reflect the change in the business segment classification.Operating income (loss) is sales and operating revenue less costs and expenses, and includes equity in net income (loss) ofaffiliated companies.Corporate and elimination includes headquarters restructuring costs and certain other corporate expenses, including theamortization of certain intellectual property assets such as the cross-licensing of intangible assets acquired from Ericsson at thetime of the Sony Mobile Communications acquisition, which are not allocated to segments.
2016 2017
Operating income (loss) 2016 2017
Game & Network Services (“G&NS”) intersegment amounts primarily consist of transactions with All Other.Semiconductors intersegment amounts primarily consist of transactions with the Mobile Communications (“MC”) segment, theG&NS segment and the Imaging Products & Solutions (“IP&S”) segment.All Other intersegment amounts primarily consist of transactions with the Pictures segment, the Music segment and the G&NSsegment.Corporate and elimination includes certain brand and patent royalty income.
Change
Change

F-6
(Business Segments)
Sales and operating revenueGame & Network Services
Customers \ 1,212,613 \ 1,418,955 \ +206,342Intersegment 55,345 80,277 +24,932Total 1,267,958 1,499,232 +231,274
MusicCustomers 458,256 582,180 +123,924Intersegment 12,366 11,387 -979Total 470,622 593,567 +122,945
PicturesCustomers 599,920 709,458 +109,538Intersegment 665 673 +8Total 600,585 710,131 +109,546
Home Entertainment & SoundCustomers 820,799 986,839 +166,040Intersegment 3,422 808 -2,614Total 824,221 987,647 +163,426
Imaging Products & SolutionsCustomers 419,662 488,399 +68,737Intersegment 5,055 5,058 +3Total 424,717 493,457 +68,740
Mobile CommunicationsCustomers 598,855 564,025 -34,830Intersegment 4,435 6,746 +2,311Total 603,290 570,771 -32,519
SemiconductorsCustomers 484,332 584,389 +100,057Intersegment 87,714 99,165 +11,451Total 572,046 683,554 +111,508
Financial ServicesCustomers 806,954 950,292 +143,338Intersegment 5,417 5,363 -54Total 812,371 955,655 +143,284
All OtherCustomers 276,660 286,307 +9,647Intersegment 57,113 44,335 -12,778Total 333,773 330,642 -3,131
Corporate and elimination (209,937) (231,695) -21,758Consolidated total \ 5,699,646 \ 6,592,961 \ +893,315
Game & Network Services \ 113,051 \ 157,847 \ +44,796Music 60,373 96,878 +36,505Pictures (114,207) 8,688 +122,895Home Entertainment & Sound 63,731 93,183 +29,452Imaging Products & Solutions 43,467 68,056 +24,589Mobile Communications 25,331 16,964 -8,367Semiconductors (20,567) 165,370 +185,937Financial Services 111,106 139,109 +28,003All Other (41,604) (6,004) +35,600Total 240,681 740,091 +499,410Corporate and elimination (46,370) (27,415) +18,955Consolidated total \ 194,311 \ 712,676 \ +518,365The 2016 segment disclosure above has been reclassified to reflect the change in the business segment classification.Operating income (loss) is sales and operating revenue less costs and expenses, and includes equity in net income (loss) ofaffiliated companies.Corporate and elimination includes headquarters restructuring costs and certain other corporate expenses, including theamortization of certain intellectual property assets such as the cross-licensing of intangible assets acquired from Ericsson at thetime of the Sony Mobile Communications acquisition, which are not allocated to segments.
(Millions of yen)Nine months ended December 31
Operating income (loss) 2016 2017 Change
G&NS intersegment amounts primarily consist of transactions with All Other.Semiconductors intersegment amounts primarily consist of transactions with the MC segment, the G&NS segment and the IP&Ssegment.All Other intersegment amounts primarily consist of transactions with the Pictures segment, the Music segment and the G&NSsegment.Corporate and elimination includes certain brand and patent royalty income.
(Millions of yen)Nine months ended December 31
2016 2017 Change

F-7
(Sales to Customers by Product Category)
Sales and operating revenue (to external customers)
Game & Network ServicesHardware \ 279,858 \ 270,653 \ -9,205Network 212,701 300,407 +87,706Other 104,438 110,589 +6,151Total 596,997 681,649 +84,652
MusicRecorded Music 114,833 128,239 +13,406Music Publishing 15,549 18,334 +2,785Visual Media and Platform 42,836 67,694 +24,858Total 173,218 214,267 +41,049
PicturesMotion Pictures 96,427 106,931 +10,504Television Productions 73,044 82,227 +9,183Media Networks 55,300 70,892 +15,592Total 224,771 260,050 +35,279
Home Entertainment & SoundTelevisions 244,421 301,476 +57,055Audio and Video 106,916 127,303 +20,387Other 646 825 +179Total 351,983 429,604 +77,621
Imaging Products & SolutionsStill and Video Cameras 110,962 121,156 +10,194Other 54,298 57,956 +3,658Total 165,260 179,112 +13,852
Mobile Communications 247,173 215,141 -32,032
Semiconductors 205,021 218,303 +13,282
Financial Services 317,342 371,498 +54,156
All Other 109,933 96,611 -13,322
Corporate 5,801 6,082 +281Consolidated total \ 2,397,499 \ 2,672,317 \ +274,818
The above table includes a breakdown of sales and operating revenue to external customers for certain segments shown in theBusiness Segment Information on page F-5. Sony management views each segment as a single operating segment. However, Sonybelieves that the breakdown of sales and operating revenue to external customers for the segments in this table is useful to investorsin understanding sales by product category.
In the G&NS segment, Hardware includes home and portable game consoles; Network includes network services relating to game,video and music content provided by Sony Interactive Entertainment; Other includes packaged software and peripheral devices. Inthe Music segment, Recorded Music includes the distribution of physical and digital recorded music and revenue derived fromartists’ live performances; Music Publishing includes the management and licensing of the words and music of songs; VisualMedia and Platform includes the production and distribution of animation titles, including game applications based on theanimation titles, and various service offerings for music and visual products. In the Pictures segment, Motion Pictures includes theworldwide production, acquisition and distribution of motion pictures and direct-to-video content; Television Productions includesthe production, acquisition and distribution of television programming; Media Networks includes the operation of television anddigital networks worldwide. In the Home Entertainment & Sound (“HE&S”) segment, Televisions includes LCD and OLEDtelevisions; Audio and Video includes Blu-ray disc players and recorders, home audio, headphones and memory-based portableaudio devices. In the IP&S segment, Still and Video Cameras includes interchangeable lens cameras, compact digital cameras,consumer video cameras and video cameras for broadcast; Other includes display products such as projectors and medicalequipment.
(Millions of yen)Three months ended December 31
2016 2017 Change

F-8
(Sales to Customers by Product Category)
Sales and operating revenue (to external customers)
Game & Network ServicesHardware \ 505,409 \ 506,366 \ +957Network 504,868 718,695 +213,827Other 202,336 193,894 -8,442Total 1,212,613 1,418,955 +206,342
MusicRecorded Music 294,296 337,238 +42,942Music Publishing 46,791 54,693 +7,902Visual Media and Platform 117,169 190,249 +73,080Total 458,256 582,180 +123,924
PicturesMotion Pictures 265,701 302,005 +36,304Television Productions 168,661 201,514 +32,853Media Networks 165,558 205,939 +40,381Total 599,920 709,458 +109,538
Home Entertainment & SoundTelevisions 579,811 700,403 +120,592Audio and Video 239,770 284,664 +44,894Other 1,218 1,772 +554Total 820,799 986,839 +166,040
Imaging Products & SolutionsStill and Video Cameras 267,962 326,362 +58,400Other 151,700 162,037 +10,337Total 419,662 488,399 +68,737
Mobile Communications 598,855 564,025 -34,830
Semiconductors 484,332 584,389 +100,057
Financial Services 806,954 950,292 +143,338
All Other 276,660 286,307 +9,647
Corporate 21,595 22,117 +522Consolidated total \ 5,699,646 \ 6,592,961 \ +893,315
The above table includes a breakdown of sales and operating revenue to external customers for certain segments shown in theBusiness Segment Information on page F-6. Sony management views each segment as a single operating segment. However, Sonybelieves that the breakdown of sales and operating revenue to external customers for the segments in this table is useful to investorsin understanding sales by product category.
In the G&NS segment, Hardware includes home and portable game consoles; Network includes network services relating to game,video and music content provided by Sony Interactive Entertainment; Other includes packaged software and peripheral devices. Inthe Music segment, Recorded Music includes the distribution of physical and digital recorded music and revenue derived fromartists’ live performances; Music Publishing includes the management and licensing of the words and music of songs; VisualMedia and Platform includes the production and distribution of animation titles, including game applications based on theanimation titles, and various service offerings for music and visual products. In the Pictures segment, Motion Pictures includes theworldwide production, acquisition and distribution of motion pictures and direct-to-video content; Television Productions includesthe production, acquisition and distribution of television programming; Media Networks includes the operation of television anddigital networks worldwide. In the HE&S segment, Televisions includes LCD and OLED televisions; Audio and Video includesBlu-ray disc players and recorders, home audio, headphones and memory-based portable audio devices. In the IP&S segment, Stilland Video Cameras includes interchangeable lens cameras, compact digital cameras, consumer video cameras and video camerasfor broadcast; Other includes display products such as projectors and medical equipment.
(Millions of yen)Nine months ended December 31
2016 2017 Change

F-9
(Condensed Financial Services Financial Statements)
Condensed Balance Sheets
Current assets:Cash and cash equivalents \ 268,382 \ 427,384 \ 691,760 \ 901,541 \ 960,142 \ 1,328,925 Marketable securities 1,051,441 1,221,687 - - 1,051,441 1,221,687 Notes and accounts receivable, trade 10,931 14,896 947,602 1,463,359 953,811 1,473,777 Inventories - - 640,835 753,658 640,835 753,658 Other receivables 56,807 60,167 167,127 174,005 223,632 234,002 Prepaid expenses and other current assets 112,085 139,288 414,420 410,142 525,861 548,742 Total current assets 1,499,646 1,863,422 2,861,744 3,702,705 4,355,722 5,560,791
Film costs - - 336,928 365,783 336,928 365,783 Investments and advances 9,904,576 10,343,208 285,965 291,155 10,111,793 10,556,622 Investments in Financial Services, at cost - - 133,514 133,514 - -
Property, plant and equipment 21,323 29,106 735,590 761,215 758,199 791,607 Other assets:
Intangibles, net 30,643 31,306 553,542 539,721 584,185 571,027 Goodwill 2,375 7,225 520,163 545,111 522,538 552,336 Deferred insurance acquisition costs 568,837 595,180 - - 568,837 595,180 Deferred income taxes 1,868 1,093 97,090 90,359 98,958 91,452 Other 34,607 35,447 292,529 304,178 323,396 335,878
638,330 670,251 1,463,324 1,479,369 2,097,914 2,145,873 Total assets \ 12,063,875 \ 12,905,987 \ 5,817,065 \ 6,733,741 \ 17,660,556 \ 19,420,676
Current liabilities:Short-term borrowings \ 411,643 \ 481,150 \ 106,437 \ 301,939 \ 518,079 \ 783,089 Notes and accounts payable, trade - - 539,900 658,250 539,900 658,250 Accounts payable, other and accrued expenses 31,486 29,261 1,364,042 1,592,858 1,394,758 1,621,542 Accrued income and other taxes 13,512 29,252 92,525 184,622 106,037 213,874 Deposits from customers in the banking business 2,071,091 2,159,747 - - 2,071,091 2,159,747 Other 173,853 167,598 422,916 422,512 591,874 585,348 Total current liabilities 2,701,585 2,867,008 2,525,820 3,160,181 5,221,739 6,021,850
Long-term debt 75,511 175,188 609,692 422,749 681,462 594,195 Accrued pension and severance costs 31,289 32,358 365,427 371,305 396,715 403,663 Deferred income taxes 317,043 320,602 115,781 107,545 432,824 428,147 Future insurance policy benefits and other 4,834,492 5,104,322 - - 4,834,492 5,104,322 Policyholders’ account in the life insurance business 2,631,073 2,854,660 - - 2,631,073 2,854,660 Other 21,825 19,202 317,980 289,109 314,771 284,283 Total liabilities 10,612,818 11,373,340 3,934,700 4,350,889 14,513,076 15,691,120 Redeemable noncontrolling interest - - 12,058 14,609 12,058 14,609 Equity:Stockholders’ equity of Financial Services 1,449,605 1,531,043 - - - -Stockholders’ equity of Sony without Financial Services - - 1,770,632 2,262,025 - -Sony Corporation’s stockholders’ equity - - - - 2,497,246 3,039,893 Noncontrolling interests 1,452 1,604 99,675 106,218 638,176 675,054 Total equity 1,451,057 1,532,647 1,870,307 2,368,243 3,135,422 3,714,947 Total liabilities and equity \ 12,063,875 \ 12,905,987 \ 5,817,065 \ 6,733,741 \ 17,660,556 \ 19,420,676
The following schedules show unaudited condensed financial statements for the Financial Services segment and all other segments excluding FinancialServices. These presentations are not in accordance with accounting principles generally accepted in the United States of America (“U.S. GAAP”), whichis used by Sony to prepare its consolidated financial statements. However, because the Financial Services segment is different in nature from Sony’s othersegments, Sony believes that a comparative presentation may be useful in understanding and analyzing Sony’s consolidated financial statements.Transactions between the Financial Services segment and Sony without the Financial Services segment, including noncontrolling interests, are included inthose respective presentations, then eliminated in the consolidated figures shown below.
December 312017 2017 2017 2017 2017 2017
March 31 December 31 March 31 December 31 March 31
Consolidated
ASSETS
LIABILITIES AND EQUITY
(Millions of yen)
Financial Services Sony withoutFinancial Services
F-10
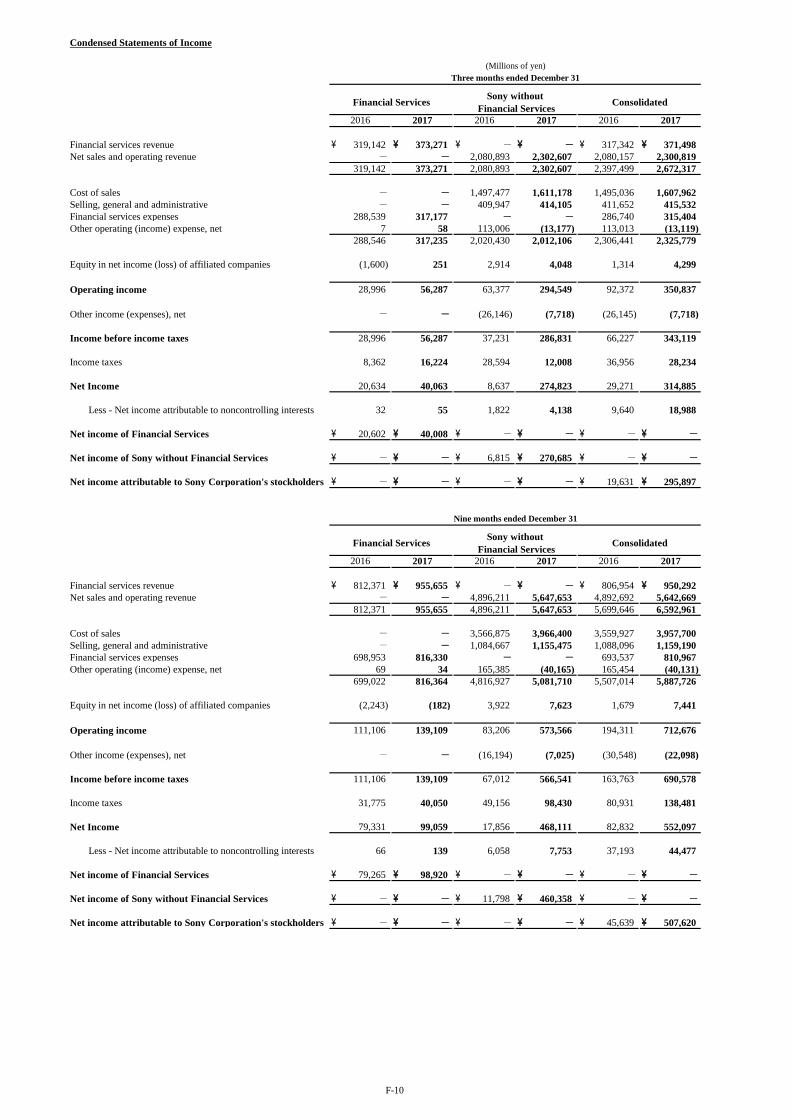
Condensed Statements of Income
Financial services revenue \ 319,142 \ 373,271 \ - \ - \ 317,342 \ 371,498 Net sales and operating revenue - - 2,080,893 2,302,607 2,080,157 2,300,819
319,142 373,271 2,080,893 2,302,607 2,397,499 2,672,317
Cost of sales - - 1,497,477 1,611,178 1,495,036 1,607,962 Selling, general and administrative - - 409,947 414,105 411,652 415,532 Financial services expenses 288,539 317,177 - - 286,740 315,404 Other operating (income) expense, net 7 58 113,006 (13,177) 113,013 (13,119)
288,546 317,235 2,020,430 2,012,106 2,306,441 2,325,779
Equity in net income (loss) of affiliated companies (1,600) 251 2,914 4,048 1,314 4,299
Operating income 28,996 56,287 63,377 294,549 92,372 350,837
Other income (expenses), net - - (26,146) (7,718) (26,145) (7,718)
Income before income taxes 28,996 56,287 37,231 286,831 66,227 343,119
Income taxes 8,362 16,224 28,594 12,008 36,956 28,234
Net Income 20,634 40,063 8,637 274,823 29,271 314,885
Less - Net income attributable to noncontrolling interests 32 55 1,822 4,138 9,640 18,988
Net income of Financial Services \ 20,602 \ 40,008 \ - \ - \ - \ -
Net income of Sony without Financial Services \ - \ - \ 6,815 \ 270,685 \ - \ -
Net income attributable to Sony Corporation's stockholders \ - \ - \ - \ - \ 19,631 \ 295,897
Financial services revenue \ 812,371 \ 955,655 \ - \ - \ 806,954 \ 950,292 Net sales and operating revenue - - 4,896,211 5,647,653 4,892,692 5,642,669
812,371 955,655 4,896,211 5,647,653 5,699,646 6,592,961
Cost of sales - - 3,566,875 3,966,400 3,559,927 3,957,700 Selling, general and administrative - - 1,084,667 1,155,475 1,088,096 1,159,190 Financial services expenses 698,953 816,330 - - 693,537 810,967 Other operating (income) expense, net 69 34 165,385 (40,165) 165,454 (40,131)
699,022 816,364 4,816,927 5,081,710 5,507,014 5,887,726
Equity in net income (loss) of affiliated companies (2,243) (182) 3,922 7,623 1,679 7,441
Operating income 111,106 139,109 83,206 573,566 194,311 712,676
Other income (expenses), net - - (16,194) (7,025) (30,548) (22,098)
Income before income taxes 111,106 139,109 67,012 566,541 163,763 690,578
Income taxes 31,775 40,050 49,156 98,430 80,931 138,481
Net Income 79,331 99,059 17,856 468,111 82,832 552,097
Less - Net income attributable to noncontrolling interests 66 139 6,058 7,753 37,193 44,477
Net income of Financial Services \ 79,265 \ 98,920 \ - \ - \ - \ -
Net income of Sony without Financial Services \ - \ - \ 11,798 \ 460,358 \ - \ -
Net income attributable to Sony Corporation's stockholders \ - \ - \ - \ - \ 45,639 \ 507,620
2016 2017 2016 2017
Three months ended December 31(Millions of yen)
Financial Services Sony without Financial Services Consolidated
Nine months ended December 31
Financial Services Sony without Financial Services Consolidated
2016 2017
2016 20172016 2017 2016 2017

F-11
Condensed Statements of Cash Flows
Cash flows from operating activities:Net income (loss) \ 79,331 \ 99,059 \ 17,856 \ 468,111 \ 82,832 \ 552,097 Adjustments to reconcile net income (loss) to net cashprovided by (used in) operating activities:
Depreciation and amortization, including amortization of 52,350 47,887 207,204 210,300 259,554 258,187 deferred insurance acquisition costsAmortization of film costs - - 190,539 259,709 190,539 259,709 Other operating (income) expense, net 69 33 165,385 (40,165) 165,454 (40,131)(Gain) loss on sale or devaluation of securities 29 213 4,706 324 4,735 537 investments, net(Gain) loss on revaluation of marketable securities held (42,727) (109,888) - - (42,727) (109,888) for trading purposes, netChanges in assets and liabilities: (Increase) decrease in notes and accounts (2,261) (3,165) (371,914) (484,877) (372,978) (488,285) receivable, trade (Increase) decrease in inventories - - (18,622) (88,954) (18,622) (88,954) (Increase) decrease in film costs - - (242,875) (279,082) (242,875) (279,082) Increase (decrease) in notes and accounts - - 87,698 90,484 87,698 90,484 payable, trade Increase (decrease) in future insurance policy 336,157 424,084 - - 336,157 424,084 benefits and other (Increase) decrease in deferred insurance (70,070) (65,248) - - (70,070) (65,248) acquisition costs (Increase) decrease in marketable securities held (60,868) (64,727) - - (60,868) (64,727) for trading purposesOther (46,339) (32,631) 40,605 242,971 (5,577) 211,546 Net cash provided by (used in) operating activities 245,671 295,617 80,582 378,821 313,252 660,329
Cash flows from investing activities:Payments for purchases of fixed assets (10,452) (10,553) (250,005) (179,240) (260,457) (189,780)Payments for investments and advances (943,712) (671,982) (7,410) (16,456) (951,199) (688,508)Proceeds from sales or return of investments and 213,629 257,582 13,837 5,404 226,461 262,056 collections of advancesOther 1,256 157 2,425 49,167 3,681 49,319
Net cash provided by (used in) investing activities (739,279) (424,796) (241,153) (141,125) (981,514) (566,913)
Cash flows from financing activities:Increase (decrease) in borrowings, net 319,188 157,271 28,914 (12,094) 347,830 145,176 Increase (decrease) in deposits from customers, net 254,279 154,374 - - 254,279 154,374 Dividends paid (23,926) (23,921) (25,308) (27,750) (25,308) (27,750)Other 1,355 457 (100,734) 1,750 (108,950) (6,612)
Net cash provided by (used in) financing activities 550,896 288,181 (97,128) (38,094) 467,851 265,188
Effect of exchange rate changes on cash and cash equivalents - - (11,525) 10,179 (11,525) 10,179
Net increase (decrease) in cash and cash equivalents 57,288 159,002 (269,224) 209,781 (211,936) 368,783 Cash and cash equivalents at beginning of the fiscal year 233,701 268,382 749,911 691,760 983,612 960,142
Cash and cash equivalents at end of the period \ 290,989 \ 427,384 \ 480,687 \ 901,541 \ 771,676 \ 1,328,925
20172017
Nine months ended December 31
2016 2017 2016 2016
(Millions of yen)
Sony without Financial Services ConsolidatedFinancial Services

F-12
Going Concern Assumption Not Applicable
Significant Changes in Shareholders' Equity Not Applicable
Accounting Policies and Other Information (Number of Consolidated Subsidiaries and Affiliated Companies)
As of December 31, 2017, Sony had 1,308 consolidated subsidiaries (including variable interest entities) and 109 affiliated companies accounted for under the equity method.
(Weighted-average Number of Outstanding Shares Used for the Computation of EPS of Common Stock)
(Thousands of shares) Three months ended December 31 Net income attributable to Sony Corporation’s stockholders 2016 2017
— Basic 1,262,223 1,264,083 — Diluted 1,288,372 1,292,615
(Thousands of shares) Nine months ended December 31 Net income attributable to Sony Corporation’s stockholders 2016 2017
— Basic 1,261,862 1,263,485 — Diluted 1,288,061 1,291,497
The dilutive effect in the weighted-average number of outstanding shares for the three months and nine months ended December 31, 2016 and 2017 primarily resulted from convertible bonds which were issued in July 2015.
(Segmentation)
Sony realigned its business segments from the first quarter of the fiscal year ending March 31, 2018. As a result of this realignment, the operation of the former Components segment is now included in All Other. In connection with this realignment, the sales and operating revenue and operating income (loss) of each segment for the comparable period have been reclassified to conform to the current presentation. The G&NS segment includes the manufacture and sales of home gaming products, network services businesses and production and sales of software. The Music segment includes the Recorded Music, Music Publishing and Visual Media and Platform businesses. The Pictures segment includes the Motion Pictures, Television Productions and Media Networks businesses. The HE&S segment includes Televisions as well as Audio and Video businesses. The IP&S segment includes the Still and Video Cameras business. The MC segment includes the manufacture and sales of mobile phones and Internet-related service businesses. The Semiconductors segment includes the image sensors business. The Financial Services segment primarily represents individual life insurance and non-life insurance businesses in the Japanese market and a bank business in Japan. All Other consists of various operating activities, including the overseas disc manufacturing, recording media and battery businesses. Sony’s products and services are generally unique to a single operating segment.

F-13
(Accounting Methods Used Specifically for Interim Consolidated Financial Statements) Income Taxes - Sony estimates the annual effective tax rate (“ETR”) derived from a projected annual net income before taxes and calculates the interim period income tax provision based on the year-to-date income tax provision computed by applying the ETR to the year-to-date net income before taxes at the end of each interim period. The income tax provision based on the ETR reflects anticipated income tax credits and net operating loss carryforwards; however, it excludes the income tax provision related to significant unusual or infrequent transactions. Such income tax provision is separately reported from the provision based on the ETR in the interim period in which it occurs.
(Reclassifications) Certain reclassifications of the financial statements and accompanying footnotes for the three and nine months ended December 31, 2016 have been made to conform to the presentation for the three and nine months ended December 31, 2017.

1
Outlook for the Fiscal Year Ending March 31, 2018 The forecast for consolidated results for the fiscal year ending March 31, 2018, as announced on October 31, 2017, has been revised as follows: (Billions of yen)
Change from October Forecast
March 31, 2017 Results
October Forecast
February Forecast
Sales and operating revenue ¥7,603.3 ¥8,500 ¥8,500 - - Operating income 288.7 630 720 +¥90 billion +14.3% Income before income taxes 251.6 600 690 +¥90 billion +15.0% Net income attributable to Sony
Corporation’s stockholders 73.3 380 480 +¥100 billion +26.3%
Assumed foreign exchange rates for the remainder of the fiscal year ending March 31, 2018 are the following: Assumed foreign exchange
rates for the three months ending March 31, 2018
(For your reference) Assumed foreign exchange rates for the six months ending
March 31, 2018 at the time of the October forecast 1 U.S. dollar approximately 113 yen approximately 112 yen 1 Euro approximately 134 yen approximately 130 yen The consolidated sales and operating revenue (“sales”) forecast for the fiscal year ending March 31, 2018 remains unchanged from the October forecast primarily due to expected increases in sales in the Financial Services and Music segments, substantially offset by expected decreases in sales in the Game & Network Services, Mobile Communications and Semiconductors segments. Consolidated operating income is expected to be higher than the October forecast mainly due to the absence of allocations for contingencies incorporated into the October forecast for All Other, Corporate and elimination, as well as expected increases in operating income in the Music, Semiconductors, Financial Services, and Home Entertainment & Sound segments. Restructuring charges for the Sony Group are expected to be approximately 15 billion yen in the fiscal year ending March 31, 2018, which remains unchanged from the October forecast, compared to 60.2 billion yen recorded in the fiscal year ended March 31, 2017. Restructuring charges are recorded as an operating expense and are included in the above-mentioned forecast for operating income. Net income attributable to Sony Corporation’s stockholders is expected to be higher than the October forecast mainly due to the above-mentioned higher-than-expected consolidated operating income and an expected decrease in income tax expense mainly due to the recording of a tax benefit, as a result of tax reform in the U.S., in the third quarter ended December 31, 2017.

2
The forecast for each business segment for the fiscal year ending March 31, 2018 has been revised as follows: (Billions of yen) March 31, 2017
Results October Forecast
February Forecast
Game & Network Services (G&NS) Sales and operating revenue ¥1,649.8 ¥2,000 ¥1,940 Operating income 135.6 180 180 Music Sales and operating revenue 647.7 730 780 Operating income 75.8 94 110 Pictures Sales and operating revenue 903.1 1,020 1,020 Operating income (loss) (80.5) 39 39 Home Entertainment & Sound (HE&S) Sales and operating revenue 1,039.0 1,200 1,200 Operating income 58.5 76 80 Imaging Products & Solutions (IP&S) Sales and operating revenue 579.6 650 650 Operating income 47.3 72 72 Mobile Communications (MC) Sales and operating revenue 759.1 780 740 Operating income 10.2 5 5 Semiconductors Sales and operating revenue 773.1 880 850 Operating income (loss) (7.8) 150 155 Financial Services Financial services revenue 1,087.5 1,170 1,250 Operating income 166.4 170 175 All Other, Corporate and elimination Operating loss (116.7) (156) (96) Consolidated Sales and operating revenue 7,603.3 8,500 8,500 Operating income 288.7 630 720 Game & Network Services Sales are expected to be lower than the October forecast primarily due to the impact of a change in launch dates of certain software titles, as well as the impact of higher-than-expected sales of hardware at promotional prices during the holiday season. The forecast for operating income remains unchanged primarily due to a reduction in selling, general and administrative expenses, substantially offset by the impact of the above-mentioned decrease in sales. Music Sales and operating income are expected to be higher than the October forecast primarily due to higher-than-expected Recorded Music sales as well as Visual Media and Platform sales. Pictures The forecasts for sales and operating income remain unchanged from the October forecast, primarily due to the stronger-than-expected theatrical performance of Jumanji: Welcome to the Jungle being substantially offset by lower-than-expected home entertainment revenues for Motion Pictures. Home Entertainment & Sound The forecast for sales remains unchanged from the October forecast. Operating income is expected to be higher than the October forecast mainly due to an improvement in product mix and a reduction in fixed costs and other operating costs, both in home audio and video.

3
Mobile Communications Sales are expected to be lower than the October forecast primarily due to an expected decrease in smartphone unit sales. The forecast for operating income remains unchanged as the impact of the above-mentioned expected decrease in sales is expected to be offset by a reduction in operating costs. Semiconductors Sales are expected to be lower than the October forecast primarily due to an expected decrease in unit sales of image sensors for mobile products. Operating income is expected to be higher than the October forecast primarily due to higher-than-expected profits resulting from sales of assets and cost reductions, partially offset by the above-mentioned expected decrease in sales. Financial Services Financial services revenue and operating income are expected to be higher than the October forecast because results in the third quarter ended December 31, 2017 exceeded expectations. The effects of future gains and losses on investments held by the Financial Services segment due to market fluctuations have not been incorporated within the above forecast as it is difficult for Sony to predict market trends in the future. Accordingly, future market fluctuations could further impact the current forecast. The forecasts for sales and operating income for the IP&S segment remain unchanged from the October forecast. The forecasts for additions to long-lived assets, depreciation and amortization, and research and development expenses for the current fiscal year remain unchanged from the October forecast: Consolidated (Billions of yen) March 31, 2017
Results February Forecast
Additions to Long-lived Assets* ¥272.2 ¥330 [additions to property, plant and equipment (included above) 184.0 235] [additions to intangible assets (included above) 88.2 95] Depreciation and amortization** 327.0 355 [for property, plant and equipment (included above) 169.3 175] [for intangible assets (included above) 157.8 180] Research and development expenses 447.5 450 * Excluding additions from business combinations. ** Including amortization expenses for deferred insurance acquisition costs.
Sony without Financial Services (Billions of yen) March 31, 2017
Results February Forecast
Additions to Long-lived Assets* ¥257.6 ¥310 [additions to property, plant and equipment (included above) 179.3 230] [additions to intangible assets (included above) 78.3 80] Depreciation and amortization 280.0 280 [for property, plant and equipment (included above) 167.4 170] [for intangible assets (included above) 112.6 110] * Excluding additions from business combinations.
The above forecast is based on management’s current expectations and is subject to uncertainties and changes in circumstances. Actual results may differ materially from those included in this forecast due to a variety of factors. See “Cautionary Statement” below.

4
Notes about Financial Performance of the Music, Pictures and Financial Services segments The Music segment results include the yen-translated results of Sony Music Entertainment and Sony/ATV Music Publishing, both U.S.-based operations which aggregate the results of their worldwide subsidiaries on a U.S. dollar basis, and the results of Sony Music Entertainment (Japan) Inc., a Japan-based music company which aggregates its results in yen. The segment also includes equity in net income (loss) for EMI Music Publishing (“EMI”), an affiliated company accounted for under the equity method for which Sony records 39.8% of EMI’s net income in the segment operating income. The results presented in Pictures are a yen-translation of the results of Sony Pictures Entertainment Inc., a U.S.-based operation that aggregates the results of its worldwide subsidiaries on a U.S. dollar basis. The Financial Services segment results include Sony Financial Holdings Inc. (“SFH”) and SFH’s consolidated subsidiaries such as Sony Life Insurance Co., Ltd. (“Sony Life”), Sony Assurance Inc. and Sony Bank Inc. The results of Sony Life discussed in the Financial Services segment differ from the results that SFH and Sony Life disclose separately on a Japanese statutory basis. Cautionary Statement Statements made in this release with respect to Sony’s current plans, estimates, strategies and beliefs and other statements that are not historical facts are forward-looking statements about the future performance of Sony. Forward-looking statements include, but are not limited to, those statements using words such as “believe,” “expect,” “plans,” “strategy,” “prospects,” “forecast,” “estimate,” “project,” “anticipate,” “aim,” “intend,” “seek,” “may,” “might,” “could” or “should,” and words of similar meaning in connection with a discussion of future operations, financial performance, events or conditions. From time to time, oral or written forward-looking statements may also be included in other materials released to the public. These statements are based on management’s assumptions, judgments and beliefs in light of the information currently available to it. Sony cautions investors that a number of important risks and uncertainties could cause actual results to differ materially from those discussed in the forward-looking statements, and therefore investors should not place undue reliance on them. Investors also should not rely on any obligation of Sony to update or revise any forward-looking statements, whether as a result of new information, future events or otherwise. Sony disclaims any such obligation. Risks and uncertainties that might affect Sony include, but are not limited to: (i) the global economic and political environment in which Sony operates and the economic and political conditions in Sony’s markets,
particularly levels of consumer spending; (ii) foreign exchange rates, particularly between the yen and the U.S. dollar, the euro and other currencies in which Sony makes significant
sales and incurs production costs, or in which Sony’s assets and liabilities are denominated; (iii) Sony’s ability to continue to design and develop and win acceptance of, as well as achieve sufficient cost reductions for, its products
and services, including image sensors, game and network platforms, smartphones and televisions, which are offered in highly competitive markets characterized by severe price competition and continual new product and service introductions, rapid development in technology and subjective and changing customer preferences;
(iv) Sony’s ability and timing to recoup large-scale investments required for technology development and production capacity; (v) Sony’s ability to implement successful business restructuring and transformation efforts under changing market and regulatory
conditions; (vi) changes in laws, regulations and government policies in the markets in which Sony operates, including those related to taxation and
corporate social responsibility; (vii) Sony’s ability to implement successful hardware, software, and content integration strategies, and to develop and implement successful
sales and distribution strategies in light of new technologies and distribution platforms; (viii) Sony’s continued ability to devote sufficient resources to research and development and, with respect to capital expenditures, to
prioritize investments correctly (particularly in the electronics businesses); (ix) Sony’s ability to maintain product quality and customer satisfaction with its products and services; (x) the effectiveness of Sony’s strategies and their execution, including but not limited to the success of Sony’s acquisitions, joint ventures
and other strategic investments; (xi) significant volatility and disruption in the global financial markets or a ratings downgrade; (xii) Sony’s ability to forecast demands, manage timely procurement and control inventories; (xiii) Sony's reliance on external business partners, including for the procurement of parts, components, software and network services for its
products or services, the manufacturing, supply and distribution of its products, and its other business operations; (xiv) the outcome of pending and/or future legal and/or regulatory proceedings; (xv) shifts in customer demand for financial services such as life insurance and Sony’s ability to conduct successful asset liability
management in the Financial Services segment; (xvi) the impact of changes in interest rates and unfavorable conditions or developments (including market fluctuations or volatility) in the
Japanese equity markets on the revenue and operating income of the Financial Services segment; (xvii) the ability of Sony, its third-party service providers or business partners to anticipate and manage cybersecurity risk, including the risk
of unauthorized access to Sony’s business information, potential business disruptions or financial losses; and (xviii) risks related to catastrophic disasters or similar events. Risks and uncertainties also include the impact of any future events with material adverse impact.