quarter 3 • july–september 2016 q1 q2 q3...
TRANSCRIPT

Q2Q1Q3 Q4
Eastern Partnership Risk Analysis Network Quarterly Quarter 3 • July–September 2016
Eastern Partnership Risk Analysis Network Quarterly Quarter 3 • July–September 2016

Frontex official publications fall into four main categories: risk analysis, training, operations and research, each marked with a distinct graphic identifier. Risk analysis publications bear a triangular symbol formed by an arrow drawing a triangle, with a dot at the centre. Metaphorically, the arrow represents the cyclical nature of risk analysis processes and its orientation towards an appropriate operational response. The triangle is a symbol of ideal proportions and knowledge, reflecting the pursuit of factual exactness, truth and exhaustive analysis. The dot at the centre represents the intelligence factor and the focal point where information from diverse sources converges to be processed, systematised and shared as analytical products. Thus, Frontex risk analysis is meant to be at the centre and to form a reliable basis for its operational activities.
Plac Europejski 6 00-844 Warsaw, PolandT +48 22 205 95 00 F +48 22 205 95 01 [email protected] www.frontex.europa.eu
Warsaw, March 2017 Risk Analysis Unit Frontex reference number: 4363 / 2017
OPOCE Catalogue number TT-AK-16-003-EN-N ISSN 2467-3684
© Frontex, 2017 All rights reserved. Reproduction is authorised provided the source is acknowledged.
DISCLAIMERSThis is a Frontex staff working document. Its contents do not imply the expression of any opinion whatsoever on the part of Frontex concerning the legal status of any country, territory or city or its authorities, or concerning the delimitation of its frontiers or boundaries. All charts included in this report are the sole property of Frontex and any unauthorised use is prohibited.
ACKNOWLEDGMENTSThe Eastern Partnership Risk Analysis Network Quarterly has been prepared by the Frontex Risk Analysis Unit. During the course of developing this product, many colleagues at Frontex and from the EaP-RAN contributed to it and their assistance is hereby acknowledged with gratitude.

Table of contents Introduction #3
I. Situational overview #4
Summary of EaP-RAN indicators #5
Situation at the border #6
Border surveillance #6
Border checks #8
Situation in the Eastern Partnership region #9
Illegal stay in EaP-RAN countries #9
II. Statistical annex #10
1 of 13
EaP-RAN · Q3 2016
2 of 13
FRAN · q1 2015
List of abbreviations used
BCP border-crossing pointCIS Community of Independent StatesEaP Eastern PartnershipEaP-RAN Eastern Partnership Risk Analysis NetworkEB-RAN Eastern European Borders Risk Analysis NetworkEDF European Union Document-FraudEU European UnionFRAN Frontex Risk Analysis NetworkFrontex European Border and Coast Guard Agency (formerly European Agency for the Management of Operational Co-
operation at the External Borders of the Member States of the European Union)ID identification documentn.a. not availableQ/Qtr quarter of the yearRAU Frontex Risk Analysis UnitSAC Schengen Associated Countries
2 of 13

3 of 13
FRAN · q1 2015
Introduction
In January 2016, three new countries joined the Eastern Borders Risk Analysis Net-work (EB-RAN) operating under the EU-funded Eastern Partnership Integrated Border Management Capacity Building Project: Armenia, Azerbaijan and Geor-gia. Upon this extension, the network has been renamed as the Eastern Partner-ship Risk Analysis Network (EaP-RAN). The current issue of the Eastern Partner-ship Risk Analysis Network Quarterly is the third following the extension of the net-work with new members.
Concept
The Eastern Partnership Risk Analysis Network (EaP-RAN) performs monthly exchanges of statistical data and informa-tion on the most recent irregular migra-tion trends. This information is compiled at the level of the Frontex Risk Analysis Unit (RAU) and analysed in cooperation
with the regional partners on a quarterly and annual basis. The annual reports of-fer a more in-depth analysis of the occur-ring developments and phenomena which impact the regional and common bor-ders while the quarterly reports are meant to provide regular updates and identify emerging trends in order to maintain sit-uational awareness. Both types of reports are aimed at offering support for strategic and operational decision making.
Methodology
The Eastern Partnership Quarterly statis-tical overview is focused on quarterly de-velopments for the seven key indicators of irregular migration: (1) detections of ille-gal border-crossing between BCPs; (2) de-tections of illegal border-crossing at BCPs; (3) refusals of entry; (4) detections of ille-gal stay; (5) asylum applications; (6) de-
tections of facilitators; and (7) detections of fraudulent documents.1
The backbone of this overview are monthly statistics provided within the framework of the EaP-RAN (Armenia2, Azerbaijan, Be-larus, Georgia, Moldova and Ukraine) and reference period statistics from common border sections of the neighbouring EU Member States and Schengen Associated Countries (Norway, Finland, Estonia, Lat-via, Lithuania, Poland, Slovakia, Hungary and Romania). The data are processed, checked for errors and merged into an Ex-cel database for further analysis.
Structure
The general Situational overview is bro-ken down by main areas of work of bor-der-control authorities and police activities related to irregular migration.
1 Please note that the analysis of this indicator is now limited to EaP countries only given that EU Member States have transitioned to the European Union Document-Fraud (EDF) reporting scheme.
2 Data for Armenia not included in Q3 2016 due to technical reasons.
3 of 13
EaP-RAN · Q3 2016

Featured Risk Analyses
4 of 13
I. Situational overview
Source: Frontex RAU Analytics Team
Skopje
Zahony
Medininkai
Dorohusk
Korczowa
Medyka
Kuznica
Galati
AlbitaSculeni
Ubla
Vysne Nemecke
Terehova
Narva
Terespol
PulemetsDomanove
Dolsk
Vystupovych
Novi Yarylovych
Sokyriany
Mohyliv Podilskyi
Tudora
Palanca
Guguti
Red Bridge
Sadakhlo
SarpiLagodeekhi
Vale
Kazbegi
Niirala
ImatraNuijamaa
Vaalimaa
Warsaw
Chisinau
Athens
Yerevan
Sofia
Riga
Kyiv
Helsinki
Minsk
Budapest
BakuTirana
BelgradeBucharest
Podgorica
Tallinn
Ankara
Moscow
Vilnius
TbilisiGeorgia
BELARUS
Ukraine
Azerbaijan
Az.
Armenia
Moldova
Iraq
Kazakhstan
Russian Federation
Russian Federation
Russian Federation
Bulgaria
Greece
Syria
Turkey
Hungary
Poland
Slovakia
Estonia
Finland
Latvia
Lithuania
Romania
Iran
Serbia
Norway
Finland
Storskog
Salla
Raja-Jooseppi
National capitals
Main BCPs
Main BCPs of the EaP-RAN countries
Borders covered by EU/SAC data only
Main roads
External borders of EaP countries
Eastern Partnership (EaP) borders
Common borders
Eastern Partnership countries
Figure 1. Geographical scope of the Eastern Partnership Risk Analysis NetworkNote on definitions: the term ‘common borders’ refers both to borders between EU Member States and Belarus, Moldova and Ukraine (covered by both sides) and borders of EU Member States/Schengen Associated Countries with the Russian Federation (covered only by the EU/Schengen Associated Country side of the border)
Summary of EaP-RAN indicators
5 of 13
EaP-RAN · Q3 2016
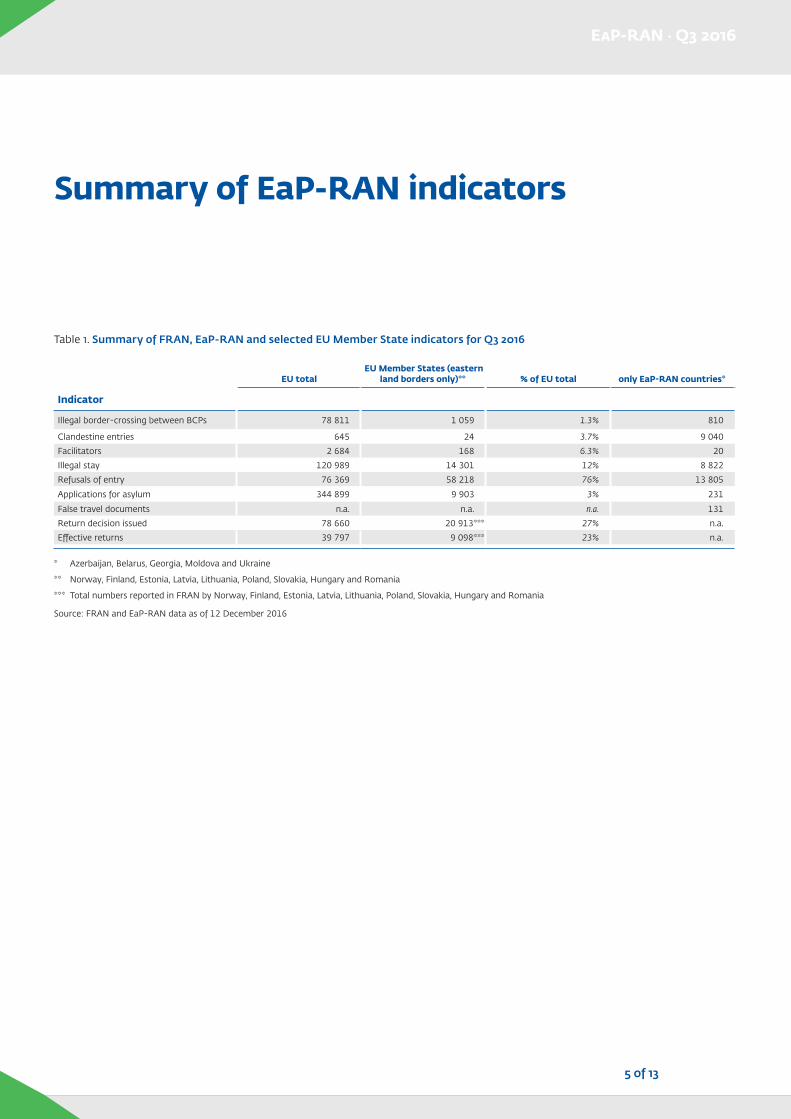
Table 1. Summary of FRAN, EaP-RAN and selected EU Member State indicators for Q3 2016
EU total EU Member States (eastern
land borders only)** % of EU total only EaP-RAN countries*
Indicator
Illegal border-crossing between BCPs 78 811 1 059 1.3% 810
Clandestine entries 645 24 3.7% 9 040Facilitators 2 684 168 6.3% 20Illegal stay 120 989 14 301 12% 8 822Refusals of entry 76 369 58 218 76% 13 805
Applications for asylum 344 899 9 903 3% 231
False travel documents n.a. n.a. n.a. 131Return decision issued 78 660 20 913*** 27% n.a.Effective returns 39 797 9 098*** 23% n.a.
* Azerbaijan, Belarus, Georgia, Moldova and Ukraine
** Norway, Finland, Estonia, Latvia, Lithuania, Poland, Slovakia, Hungary and Romania
*** Total numbers reported in FRAN by Norway, Finland, Estonia, Latvia, Lithuania, Poland, Slovakia, Hungary and Romania
Source: FRAN and EaP-RAN data as of 12 December 2016

Featured Risk Analyses
Illegal border-crossing
During the third quarter of 2016, 1 201 per-sons were detected for illegal border-cross-ing between BCPs by member countries of the Eastern Partnership Risk Analysis Net-work (EaP-RAN).1 Ukraine re ported the highest number of detections (46% in total), followed by Belarus, Hungary and Latvia.
Almost 57% of detections involved regional nationals (citizens of EaP and CIS coun-tries), in majority Ukrainians, Moldovans and Russians. The vast majority of these cases (79%) were reported to be linked ei-ther to smuggling or other reasons not re-lated to migration.
Non-regional migrants constituted 47% of all detected cases, mostly involving Vi-etnamese, Afghans and Indians. Irregu lar migration was the main reason for cross-ing the border illegally.
At the common borders, detections of il-legal border-crossing between BCPs (in-creased by 36% compared with the second quarter of 2016 and dropped by 41% in re-lation to the same quarter of 2015.
At the Eastern Partnership and external borders1, 446 cases of illegal border-cross-ing were detected. More than 85% of the detections took place at Ukrainian bor-ders, involving mostly regional migrants, i.e. Ukrainians and Moldovans. Non-re-gional migrants from a variety of countries were detected in low numbers.
Facilitators
The number of detected facilitators at the common borders decreased by 32% in the third quarter of 2016 compared with the second quarter of 2016 and was 39% lower than in the same period of 2015.
As regards nation alities, the facilitators were mostly citizens of the Russian Fed-eration (from the Caucasus region), Bela-rus and Ukraine.
1 Data for Armenia not included for technical reasons.
Border surveillance
Situation at the border
6 of 13
I. Situational overview
Detections of illegal border-crossing between BCPs
in Q3 2016
@
@
@
@
@
@
@
@
@
@
@
@
@
@
@
@
@
@
@
Poland
Belarus
Finland
Romania
Latvia
Bulgaria
Hungary
Lithuania
Estonia
Slovakia
Sweden
Croatia
n.a.
-79%
-50%
-60%
-95%
39%
-53% -37%
-16%
-44%
-49%
-23%
-19%
-11%
-20%
85%
-60%
-53%
-4%
@
@
@
n.a. n.a.
n.a.
RussianFederation
Ukraine
Serbia
Moldova
Armenia
Az
RussianFederation
TurkeyAzerbaijan
Iran
Georgia
Kazakhstan
@
@@
Source: Frontex Analytics 2016
Figure 2. Detections of illegal border-crossing between BCPs reported by EaP-RAN members at all borders show that the highest pressure in Q3 2016 was recorded at the Latvian-Russian and Hungarian-Ukrainian border sections, even though the numbers dropped when compared with Q3 2015Detections of illegal border-crossing between BCPs at all borders covered by the EaP-RAN in Q3 2016
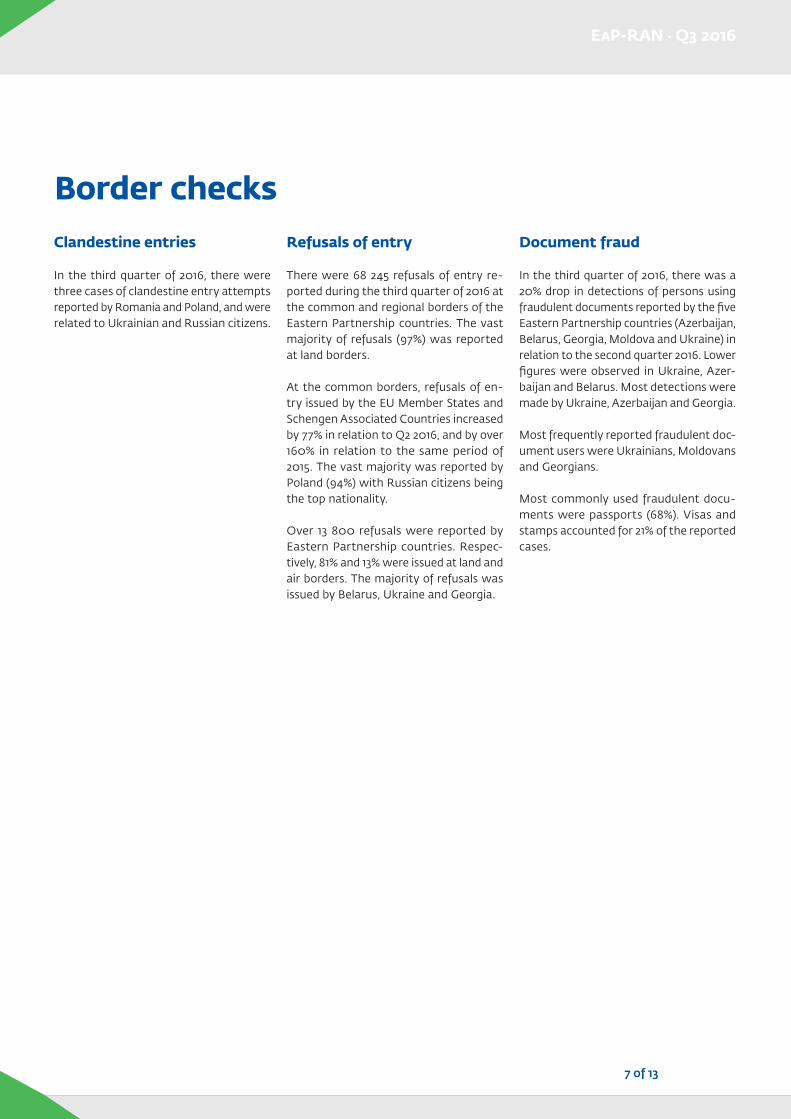
Clandestine entries
In the third quarter of 2016, there were three cases of clandestine entry attempts re ported by Romania and Poland, and were related to Ukrainian and Russian citizens.
Refusals of entry
There were 68 245 refusals of entry re-ported during the third quarter of 2016 at the common and regional borders of the Eastern Partnership countries. The vast majority of refusals (97%) was reported at land borders.
At the common borders, refusals of en-try issued by the EU Member States and Schengen Associated Countries increased by 77% in relation to Q2 2016, and by over 160% in relation to the same period of 2015. The vast majority was reported by Poland (94%) with Russian citizens being the top nationality.
Over 13 800 refusals were reported by Eastern Partnership countries. Respec-tively, 81% and 13% were issued at land and air borders. The majority of refusals was issued by Belarus, Ukraine and Georgia.
Document fraud
In the third quarter of 2016, there was a 20% drop in detections of persons using fraudulent documents reported by the five Eastern Partnership countries (Azerbaijan, Belarus, Georgia, Moldova and Ukraine) in relation to the second quarter 2016. Lower figures were observed in Ukraine, Azer-baijan and Belarus. Most detections were made by Ukraine, Azerbaijan and Georgia.
Most frequently reported fraudulent doc-ument users were Ukrainians, Moldovans and Georgians.
Most commonly used fraudulent docu-ments were passports (68%). Visas and stamps accounted for 21% of the reported cases.
Border checks
7 of 13
EaP-RAN · Q3 2016
Featured Risk Analyses
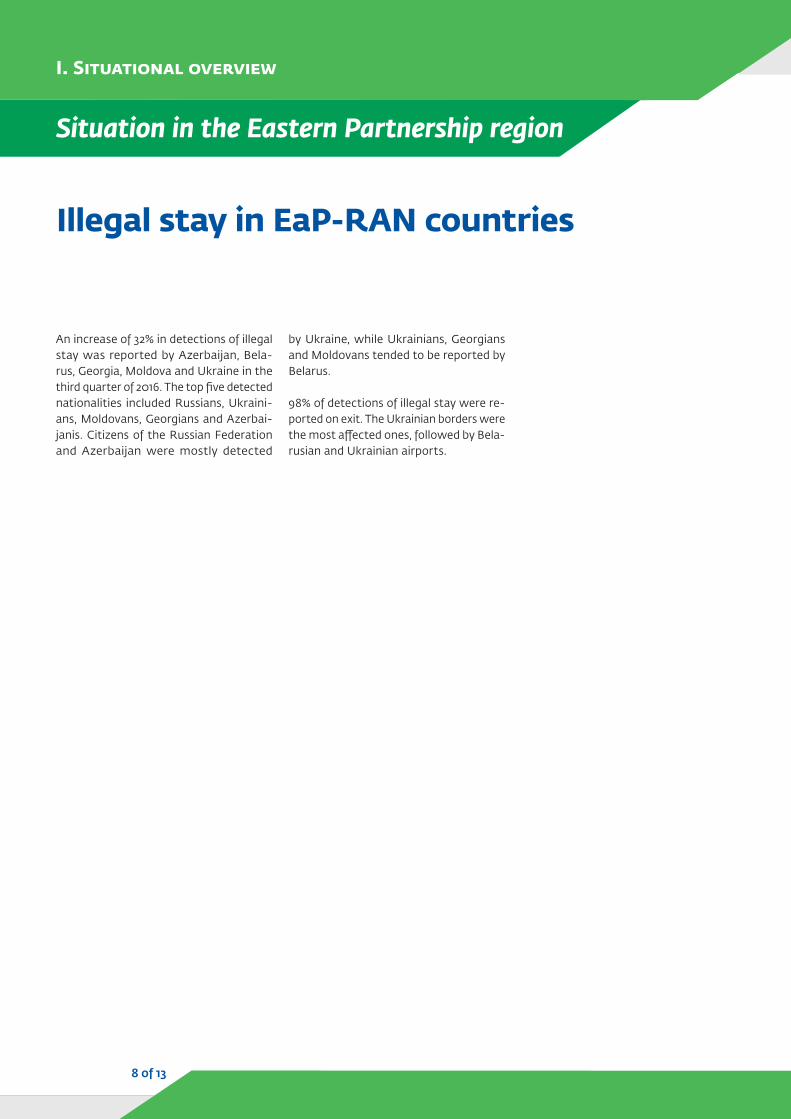
An increase of 32% in detections of illegal stay was re ported by Azerbaijan, Bela-rus, Georgia, Moldova and Ukraine in the third quarter of 2016. The top five detected nationalities included Russians, Ukraini-ans, Moldovans, Georgians and Azerbai-janis. Citizens of the Russian Federation and Azerbaijan were mostly detected
by Ukraine, while Ukrain ians, Georgians and Moldovans tended to be reported by Belarus.
98% of detections of illegal stay were re-ported on exit. The Ukrainian borders were the most affected ones, followed by Bela-rusian and Ukrainian airports.
Situation in the Eastern Partnership region
Illegal stay in EaP-RAN countries
8 of 13
I. Situational overview

II. Statistical annex
LEGEND
Symbols and abbreviations: n.a. not applicable : data not available
Source: EaP-RAN and FRAN data as of 12 December 2016, unless otherwise indicated
9 of 13
EaP-RAN · Q3 2016

10 of 13
FRAN · q1 2015
Annex Table 1. Illegal border-crossing between BCPsDetections reported by EaP-RAN countries and neighbouring EU Member States, by purpose of illegal border-crossing and top ten nationalities
2016 Q3
2015 2016 % change on per cent of totalQ2 Q3 Q4 Q1 Q2 Q3 year ago previous Qtr
Purpose of Illegal Border-Crossing
Irregular migration 762 944 607 377 400 621 -34 55 52Other 322 560 239 274 289 436 -22 51 36Smuggling of goods 169 133 93 97 139 144 8.3 3.6 12Not specified 161 250 166 55 80 0 n.a. n.a.
Top Ten Nationalities
Ukraine 335 483 236 246 277 422 -13 52 35
Vietnam 283 254 122 66 158 187 -26 18 16
Moldova 88 107 70 93 92 87 -19 -5.4 7.2Russian Federation 82 111 61 65 82 76 -32 -7.3 6.3Afghanistan 212 277 241 99 59 66 -76 12 5.5India 17 11 2 16 21 51 364 143 4.2Bangladesh 12 13 7 4 18 34 162 89 2.8Georgia 107 145 25 23 30 32 -78 6.7 2.7Belarus 24 38 23 21 30 26 -32 -13 2.2Not specified 14 32 24 16 14 24 -25 71 2.0Others 240 416 294 154 127 196 -53 54 16
Total 1 414 1 887 1 105 803 908 1 201 -36 32 100
Annex Table 2. Illegal border-crossing at BCPsDetections reported by EaP-RAN countries and neighbouring EU Member States, by purpose of illegal border-crossing and top ten nationalities
2016 Q3
2015 2016 % change on per cent of totalQ2 Q3 Q4 Q1 Q2 Q3 year ago previous Qtr
Purpose of Illegal Border-Crossing
Other 6 035 4 574 4 001 3 101 3 800 8 893 94 134 98Smuggling of goods 98 93 96 118 128 128 38 0.0 1.4Irregular migration 44 32 26 26 20 16 -50 -20 0.2
Not specified 1 0 1 14 10 3 n.a. -70 0.0
Top Ten Nationalities
Ukraine 5 893 4 423 3 832 2 992 3 706 8 814 99 138 98Moldova 207 129 141 181 181 161 25 -11 1.8Romania 13 28 26 18 33 24 -14 -27 0.3Russian Federation 19 47 37 23 14 13 -72 -7.1 0.1Belarus 6 6 18 3 3 4 -33 33 0.0Not specified 5 5 2 5 2 3 -40 50 0.0Bulgaria 1 3 7 2 2 3 0.0 50 0.0Turkey 2 2 5 1 0 2 0.0 n.a. 0.0China 0 0 0 0 0 2 n.a. n.a. 0.0Israel 1 2 1 1 1 1 -50 0.0 0.0Others 31 54 55 33 16 13 -76 -19 0.1
Total 6 178 4 699 4 124 3 259 3 958 9 040 92 128 100
10 of 13

11 of 13
FRAN · q1 2015
Annex Table 3. FacilitatorsDetections reported by EaP-RAN countries and neighbouring EU Member States, by place of detection and top ten nationalities
2016 Q3
2015 2016 % change on per cent of totalQ2 Q3 Q4 Q1 Q2 Q3 year ago previous Qtr
Place of Detection
Land 33 59 47 205 49 36 -39 -27 100Air 1 0 0 1 4 0 n.a. n.a.
Top Ten Nationalities
Russian Federation 14 24 12 11 22 14 -42 -36 39Belarus 2 0 7 5 11 7 n.a. -36 19Ukraine 2 11 6 5 3 5 -55 67 14Slovakia 0 1 2 0 2 2 100 0.0 5.6Georgia 1 0 1 0 1 2 n.a. 100 5.6Lithuania 1 3 7 0 0 2 -33 n.a. 5.6Afghanistan 0 0 0 42 0 2 n.a. n.a. 5.6France 0 0 0 0 0 1 n.a. n.a. 2.8Moldova 0 1 1 0 0 1 0.0 n.a. 2.8Not specified 1 1 2 0 0 0 n.a. n.a.Others 13 18 9 143 14 0 n.a. n.a.
Total 34 59 47 206 53 36 -39 -32 100
Annex Table 4. Illegal stayDetections reported by EaP-RAN countries and neighbouring EU Member States, by place of detection and top ten nationalities
2016 Q32015 2016 % change on per cent
of totalQ2 Q3 Q4 Q1 Q2 Q3 year ago previous Qtr
Place of Detection
Land 7 426 9 904 9 890 7 160 8 438 11 417 15 35 83Air 1 640 1 703 1 341 1 267 1 492 2 032 19 36 15Sea 101 101 60 46 76 108 6.9 42 0.8Between BCPs 60 155 57 22 41 77 -50 88 0.6Inland 25 24 30 12 25 49 104 96 0.4
Top Ten Nationalities
Ukraine 3 060 4 625 4 981 3 019 4 137 5 470 18 32 40Russian Federation 1 829 2 202 1 748 1 505 1 349 2 219 0.8 64 16Moldova 775 852 1 019 840 1 098 1 349 58 23 9.9Georgia 792 743 448 381 498 735 -1.1 48 5.4Belarus 318 455 346 315 341 457 0.4 34 3.3Azerbaijan 330 402 466 338 303 441 9.7 46 3.2Turkey 153 169 189 281 236 277 64 17 2.0Armenia 198 225 201 96 142 242 7.6 70 1.8Poland 177 230 168 143 148 188 -18 27 1.4Israel 69 113 75 104 134 182 61 36 1.3Others 1 551 1 871 1 737 1 485 1 686 2 123 13 26 16
Total 9 252 11 887 11 378 8 507 10 072 13 683 15 36 100
11 of 13
EaP-RAN · Q3 2016

FRAN · q1 2015
Annex Table 5. Refusals of entryRefusals reported by EaP-RAN countries and neighbouring EU Member States, by border type and top ten nationalities
2016 Q32015 2016 % change on per cent
of totalQ2 Q3 Q4 Q1 Q2 Q3 year ago previous Qtr
Border Type
Land 24 330 30 643 28 602 21 885 39 898 65 192 113 63 97Air 2 190 1 198 1 405 1 017 1 276 1 323 10 3.7 2.0Sea 933 817 1 222 692 729 730 -11 0.1 1.1
Top Ten Nationalities
Russian Federation 6 979 8 147 7 655 6 174 20 572 43 829 438 113 65Ukraine 7 989 6 499 7 186 7 804 8 938 10 402 60 16 15Tajikistan 1 418 2 112 1 512 1 751 2 666 2 739 30 2.7 4.1Moldova 1 590 1 869 1 777 1 433 1 762 1 633 -13 -7.3 2.4Belarus 1 139 2 170 2 035 1 399 1 238 1 506 -31 22 2.2Armenia 604 1 774 1 870 742 1 231 962 -46 -22 1.4Georgia 1 424 1 362 1 748 531 599 709 -48 18 1.1Lithuania 696 657 707 496 594 642 -2.3 8.1 1.0Azerbaijan 860 1 108 1 275 541 553 507 -54 -8.3 0.8Kazakhstan 148 751 635 150 429 429 -43 0.0 0.6Others 4 606 6 209 4 829 2 573 3 321 3 887 -37 17 5.8
Total 27 453 32 658 31 229 23 594 41 903 67 245 106 60 100
Annex Table 6. Applications for asylumApplications for international protection reported by EaP-RAN countries and neighbouring EU Member States, by top ten nationalities
2016 Q32015 2016 % change on per cent
of totalQ2 Q3 Q4 Q1 Q2 Q3 year ago previous Qtr
Top Ten Nationalities
Russian Federation 1 397 2 971 2 887 1 764 3 501 2 082 -30 -41 21Afghanistan 14 403 30 239 9 690 2 090 7 184 1 902 -94 -74 19Syria 9 206 57 870 7 056 912 3 166 1 748 -97 -45 18Iraq 3 068 18 241 10 834 1 543 1 886 998 -95 -47 10Pakistan 2 757 11 881 557 1 566 1 972 415 -97 -79 4.2Ukraine 698 658 481 370 435 319 -52 -27 3.2Eritrea 1 119 1 560 785 163 128 261 -83 104 2.6Iran 518 1 420 1 619 692 563 236 -83 -58 2.4Morocco 225 139 105 747 223 199 43 -11 2.0Somalia 684 1 485 392 337 353 151 -90 -57 1.5Others 6 883 11 484 3 948 3 176 2 463 1 623 -86 -34 16
Total 40 958 137 948 38 354 13 360 21 874 9 934 -93 -55 100
12 of 13

13 of 13
FRAN · q1 2015
Annex Table 7. Document fraudDetections reported by EaP-RAN countries, by border type, document type, fraud type, top ten nationalities and top ten countries of issuance
2016 Q32015 Q4 2016 % change on per cent
of totalQ2 Q3 Q4 Q1 Q2 Q3 year ago previous Qtr
Border TypeLand 72 37 31 25 58 40 8.1 -31 48Air 53 54 50 45 33 35 -35 6.1 42Sea 6 10 11 9 12 7 -30 -42 8.4Not specified 0 6 4 0 0 1 -83 n.a. 1.2
Document typePassports 113 95 81 66 99 79 -17 -20 95Visas 13 8 2 6 0 3 -63 n.a. 3.6Not specified 3 2 5 1 0 1 -50 n.a. 1.2Residence permits 0 1 0 0 0 0 n.a. n.a.Stamps 0 0 2 3 1 0 n.a. n.a.ID cards 2 1 6 3 3 0 n.a. n.a.
Top Ten NationalitiesUkraine 13 12 13 28 39 25 108 -36 30Moldova 60 25 20 19 24 20 -20 -17 24Tajikistan 2 0 3 0 1 6 n.a. 500 7.2India 1 4 5 2 4 5 25 25 6.0Russian Federation 5 6 5 4 1 4 -33 300 4.8Georgia 1 6 7 0 2 4 -33 100 4.8Armenia 6 1 4 0 1 3 200 200 3.6Syria 5 8 4 2 3 2 -75 -33 2.4Azerbaijan 3 2 1 0 1 2 0.0 100 2.4China 0 2 1 1 0 2 0.0 n.a. 2.4Others 35 41 33 23 27 10 -76 -63 12
Top Ten Countries of Issuance of DocumentsMoldova 54 23 12 12 23 20 -13 -13 24Ukraine 15 16 10 11 30 17 6.3 -43 20Tajikistan 4 2 4 1 2 6 200 200 7.2Hungary 0 2 1 16 7 6 200 -14 7.2France 3 2 1 1 0 4 100 n.a. 4.8India 1 4 5 2 4 4 0.0 0.0 4.8Armenia 0 1 3 0 1 3 200 200 3.6Lithuania 3 2 1 2 1 3 50 200 3.6Russian Federation 5 0 0 1 0 3 n.a. n.a. 3.6Bulgaria 0 2 5 0 4 3 50 -25 3.6Others 46 53 54 33 31 14 -74 -55 17
Total 131 107 96 79 103 83 -22 -19 100
Detections reported by Member States for indicators Illegal border-crossing be-tween BCPs, Illegal border-crossing at BCPs, Refusals of entry and Document fraud are detections at the common land borders on entry only. For Facilitators, detections at the common land borders on entry and exit are included. For Illegal stay, detections at the common land bor-
ders on exit only are included. For Asylum, all applications (land, sea, air and inland) are included.
For EaP-RAN countries, all indicators – save for Refusals of entry – include de-tections (applications) on exit and entry at the land, sea and air borders.
Each section in the table (Border type, Place of detection, Top five border sec-tion and Top ten nationalities, etc.) refers to total detections reported by EaP-RAN countries and to land border detections reported by neighbouring Member States.
Explanatory note
13 of 13
EaP-RAN · Q3 2016

Featured Risk Analyses
Plac Europejski 6 00-844 Warsaw, Poland
T +48 22 205 95 00 F +48 22 205 95 01
[email protected] www.frontex.europa.eu
For Public Release
Risk Analysis Unit
Reference number: 4363 / 2017
TT-AK-16-003-EN-N ISSN 2467-3684
Warsaw, March 2017