quarter 2, 2011 - worldwide | nielsen€¦ · media, tv channels and daily coupons. from the west...
TRANSCRIPT

QUARTER 2, 2011

1
Timeshifted TV ushered in a new era of consumer control of
media, with emerging technologies driving an explosion of content
options—online video, mobile video, over-the-top access, live
streaming to TVs and video on demand. Regardless of the way
audiences tune in, consumers now expect their entertainment
content wherever, whenever and however they want it.
Viewing Wherever—By Device
From the bed to the bus, the living room to the laundry room,
consumers are embracing all the various video platforms available
to them. Roughly half (48%) of Americans now watch video online,
compared to 10 percent for mobile and 97 percent for traditional
TV. Mobile subscribers watching video on their phone increased
approximately 36 percent since Q2 2010, and watching video on
the Internet continued to flourish. Even with already pervasive
usage levels, traditional TV viewing saw an increase of 2 hours
43 minutes per month.
The rise in timeshifted video consumption is also matched by an
increase in video game console usage, as many game consoles
have become the means to stream video straight to the TV. Game
console penetration in TV homes grew nearly four percent over Q2
2010, with average daily time spent per home on any game console
increasing by 14 percent.
Viewing Whenever—Across Time
If online and mobile video represent new options for “timeshifted”
viewing, timeshifting on a TV remains the standard. Americans
spend more than quadruple the time per week watching timeshifted
content on a TV (via DVR, video on demand or DVD playback)
as they do online video. Over the past two years, since Q2 2009,
timeshifted TV viewing jumped 31 percent with near-constant
growth—potentially augmented by expanded video on demand
capabilities increasingly offered by cable or satellite providers.
Since Q2 2010, timeshifted TV viewing rose 11 percent among all TV
homes. Interestingly, this is the result of increased DVR penetration,
not an increase in time spent by DVR households. The number of
homes with a DVR increased nearly 13 percent since last year, with
39 percent of TV households now home to the technology.
Americans 25-64 spend the most time watching timeshifted
content but Americans 65+ and kids 2-11 are catching up, with
heightened growth in time spent in recent quarters. Both groups
experienced double-digit growth in time spent over last year, while
those middle demographics remained relatively the same. White
consumers are the most likely to have a DVR and, compared to all
DVR households, timeshift more content than other ethnicities.
Viewing However—By Distribution
Subscription shifts underscore that Americans are putting a new
emphasis on broadband. Nearly three-fourths (72%) of U.S. TV
homes pay for both broadband Internet and a cable-plus TV
subscription (cable, satellite or Telco). In fact, households with
both cable-plus and broadband saw year-over-year growth of
roughly 7 percent.
Though the number of households paying for just cable-plus
and going without broadband remains significantly higher than
households with broadcast only and broadband—18 percent
compared to five percent—broadcast-only/broadband households
are on the rise while cable-plus/no Internet households are declining.
THE CONTINUING GROWTH OF ANYTIME, ALL-THE-TIME VIDEO ENTERTAINMENT

2
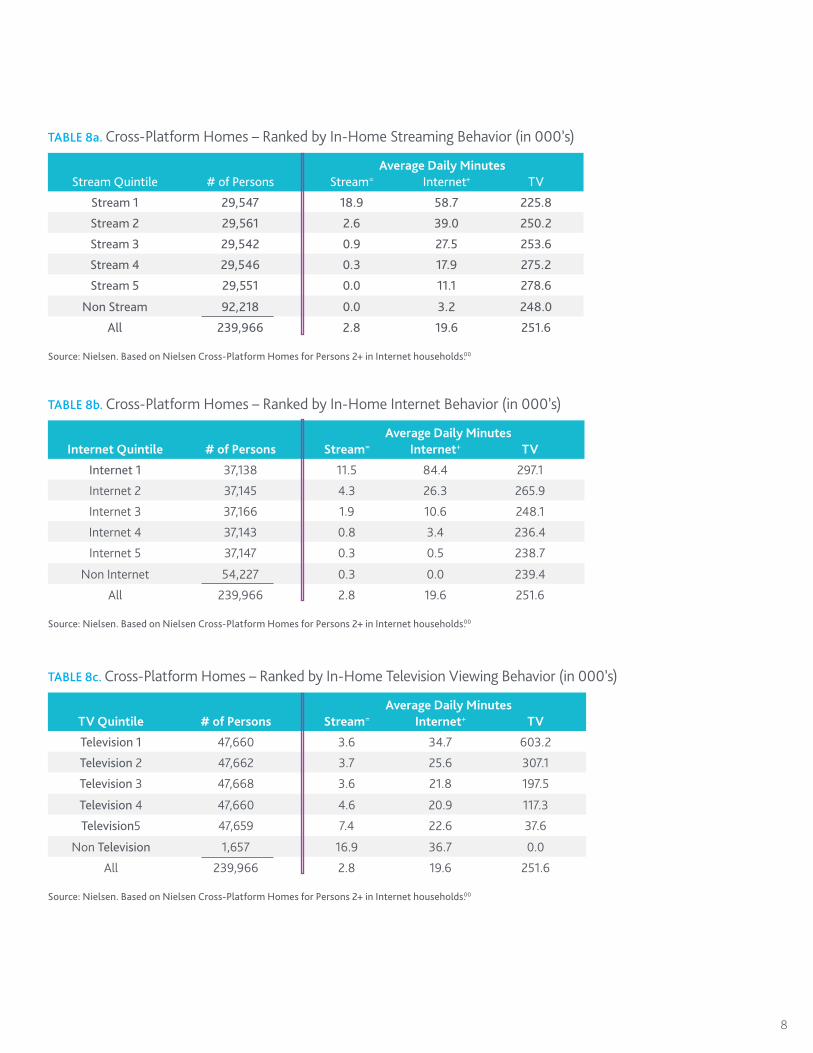
Are consumers becoming content-specific and device agnostic?
Although TV viewing remains an almost universal activity, a
pattern first reported in Q1 2011—of heaviest at-home streamers
consuming slightly less TV and lightest TV users being the heaviest
streamers—continues. Streaming is still a highly concentrated
behavior, with 83 percent of all streaming taking place among the
top quintile of consumers who stream. Alternatively, television
usage continues to have a broader distribution across the quintiles
(with just 48% of TV watched by the top quintile).
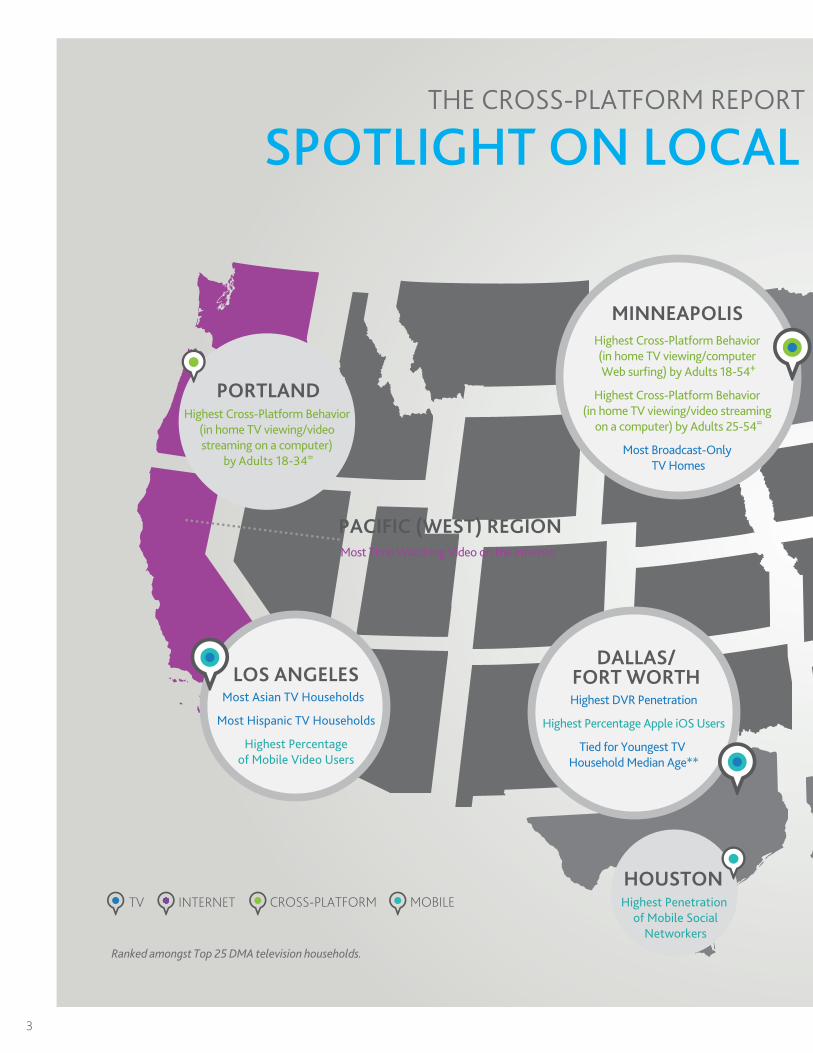
“LOCAL”
In a twist for the age of globalization, “local” is the buzzword of
the day as media and marketers tap into the trend of renewed
hyperlocal offerings—spearheaded by blogs, news sites, social
media, TV channels and daily coupons. From the West Coast to
the East Coast, southern-most Florida to the tip of Alaska, no two
markets are alike in terms of media consumption.
This edition of the Nielsen Cross-Platform Report includes a
special feature highlighting those differences, including:
The south spends the most time watching primetime TV, with •
New Orleans taking the top spot.
Baltimore has the highest video game console penetration.•
Dallas has the highest DVR penetration.•
Consumers in the East South Central Region spend the most •
time on the Internet.
Miamians are most likely to have a mobile phone in •
their pockets.
Bostonians have the highest Internet-enabled •
computer penetration.
THE CONTINUING GROWTH OF ANYTIME, ALL-THE-TIME VIDEO ENTERTAINMENT
STAY TUNED… DEVELOPMENTS TO WATCHUPDATE: THE EVOLVING RELATIONSHIP BETWEEN STREAMING CONTENT & TV VIEWING
6.6%
PAYING FOR BOTH CABLE-PLUS AND BROADBAND SAW
YEAR-OVER-YEAR GROWTH OF
HOUSEHOLDS
3
TV CROSS-PLATFORMINTERNET MOBILE
Ranked amongst Top 25 DMA television households. * Tied with Orlando-Daytona Beach-Melbourne Market** Tied with Houston Market
EAST SOUTH CENTRAL REGION
Most Time Spent on the Internet+
PACIFIC (WEST) REGIONMost Time Watching Video on the Internet=
PORTLANDHighest Cross-Platform Behavior
(in home TV viewing/video streaming on a computer)
by Adults 18-34=
Most Asian TV Households
Most Hispanic TV Households
Highest Percentageof Mobile Video Users
LOS ANGELES
MINNEAPOLIS Highest Cross-Platform Behavior (in home TV viewing/computer Web surfing) by Adults 18-54+
Highest Cross-Platform Behavior (in home TV viewing/video streaming
on a computer) by Adults 25-54=
Most Broadcast-Only TV Homes
HOUSTON Highest Penetration
of Mobile SocialNetworkers
DALLAS/FORT WORTHHighest DVR Penetration
Highest Percentage Apple iOS Users
Tied for Youngest TV Household Median Age**
MIAMIHighest Mobile
Phone Penetration
CHICAGO Highest Percentage
of Android OS Penetration
NEW ORLEANSMost Primetime
TV Viewers
BALTIMOREHighest Video
Game Penetration
PITTSBURGH Tied for Oldest TV
Household Median Age*
NEW YORKMost African-American
TV Households
Highest Digital Cable Distribution
Highest Cross-Platform Behavior (in home TV viewing/video streaming on a
computer) by Adults 18-49=
Highest Percentage of Cable (any) Households
Highest Penetration ofComputers with Internet Access
BOSTONTHE CROSS-PLATFORM REPORT GOES CROSS COUNTRY
SPOTLIGHT ON LOCAL MEDIA BEHAVIORS

4
TV CROSS-PLATFORMINTERNET MOBILE
Ranked amongst Top 25 DMA television households. * Tied with Orlando-Daytona Beach-Melbourne Market** Tied with Houston Market
EAST SOUTH CENTRAL REGION
Most Time Spent on the Internet+
PACIFIC (WEST) REGIONMost Time Watching Video on the Internet=
PORTLANDHighest Cross-Platform Behavior
(in home TV viewing/video streaming on a computer)
by Adults 18-34=
Most Asian TV Households
Most Hispanic TV Households
Highest Percentageof Mobile Video Users
LOS ANGELES
MINNEAPOLIS Highest Cross-Platform Behavior (in home TV viewing/computer Web surfing) by Adults 18-54+
Highest Cross-Platform Behavior (in home TV viewing/video streaming
on a computer) by Adults 25-54=
Most Broadcast-Only TV Homes
HOUSTON Highest Penetration
of Mobile SocialNetworkers
DALLAS/FORT WORTHHighest DVR Penetration
Highest Percentage Apple iOS Users
Tied for Youngest TV Household Median Age**
MIAMIHighest Mobile
Phone Penetration
CHICAGO Highest Percentage
of Android OS Penetration
NEW ORLEANSMost Primetime
TV Viewers
BALTIMOREHighest Video
Game Penetration
PITTSBURGH Tied for Oldest TV
Household Median Age*
NEW YORKMost African-American
TV Households
Highest Digital Cable Distribution
Highest Cross-Platform Behavior (in home TV viewing/video streaming on a
computer) by Adults 18-49=
Highest Percentage of Cable (any) Households
Highest Penetration ofComputers with Internet Access
BOSTONTHE CROSS-PLATFORM REPORT GOES CROSS COUNTRY
SPOTLIGHT ON LOCAL MEDIA BEHAVIORS

5
TABLE 1. A Week in the Life – Weekly Time Spent in Hours: Minutes – By Age Demographic for Entire US Population
K 2-11
T 12-17
A 18-24
A 25-34
A 35-49
A 50-64
A 65+
P 2+
Hispanic 2+
African-American 2+
On Traditional TV* 24:52 22:24 24:17 28:08 32:58 41:04 46:16 32:47 28:41 45:11
Watching Timeshifted TV*
1:50 1:29 1:30 2:57 3:07 2:42 1:42 2:21 1:27 1:44
Using the Internet on a Computer**+
0:30 1:25 4:02 6:03 5:50 4:58 2:38 3:58 3:03 3:33
Watching Video on Internet**=
0:07 0:21 0:45 0:50 0:35 0:23 0:12 0:27 0:31 0:30
Mobile Subscribers Watching Video on a Mobile Phone^
NA 0:20^^ 0:17 0:12 0:05 0:01 <0:01 0:07 0:04 0:04
Source: Nielsen. Table 1 is uniquely based on the Total Population in the US—all 297 million Americans over age 2—whether or not they have the technology.
TABLE 2. Overall Usage – Number of Users 2+ (in 000’s) – Monthly Reach
Q2 11 Q1 11 Q2 10 % Diff Yr to Yr
Watching TV in the Home° 288,256 288,500 286,648 0.6%
Watching Timeshifted TV° (all TV homes)
110,547 107,065 97,914 12.9%
Using the Internet on a Computer**+ 192,395 190,913 192,128 0.1%
Watching Video on Internet**= 143,002 142,437 139,338 2.6%
Using a Mobile Phone^ 231,355 231,000 229,375 0.9%
Mobile Subscribers Watching Video on a Mobile Phone^ 29,916 28,538 21,957 36.2%
Source: Nielsen.
TABLE 3. Monthly Time Spent in Hours: Minutes – Per User 2+ of Each Medium
Q2 11 Q1 11 Q2 10 % Diff Yr to Yr
Hrs:Min Diff Yr to Yr
Watching TV in the Home* 146:20 158:47 143:37 1.9% 2:43
Watching Timeshifted TV* (all TV homes) 10:30 10:46 9:27 11.1% 1:03
DVR Playback (only in homes with DVRs) 24:29 26:14 24:27 0.1% 0:02
Using the Internet on a Computer**+ 24:25 25:33 25:07 -2.8% -0:42
Watching Video on Internet**= 4:26 4:33 3:52 14.7% 0:34
Mobile Subscribers Watching Video on a Mobile Phone^ 4:20 4:20 3:37 19.8% 0:43
Source: Nielsen. Unlike Table 1, this table is based on total users of each medium. Additional Note: TV viewing patterns in the US tend to be seasonal, with usage
patterns different in winter months than summer months—sometimes leading to declines/increases in quarter to quarter usage.
HOW PEOPLE WATCH

6
TABLE 4a. Monthly Time Spent in Hours: Minutes – Age Demographic
K 2-11
T 12-17
A 18-24
A 25-34
A 35-49
A 50-64
A 65+
P 2+
On Traditional TV* 110:17 99:36 113:09 126:50 146:02 181:17 205:28 146:20
Watching Timeshifted TV (all TV homes) 8:08 6:37 7:03 13:19 13:49 11:55 7:35 10:30
DVR Playback (only in homes with DVRs) 17:30 15:03 18:09 28:15 28:44 28:14 25:49 24:29
Using the Internet on a Computer**+ 5:10 10:33 24:56 31:32 28:52 27:17 21:39 24:25
Watching Video on Internet**= 2:14 4:00 7:28 6:30 4:27 3:19 2:35 4:26
Mobile Subscribers Watching Video on a Mobile Phone^
N/A 7:13 5:25 3:54 2:53 2:10 1:27 4:20
Source: Nielsen. Unlike Table 1, this table is based on total users of each medium. Traditional TV and timeshifted viewing estimates are based on persons in TV
households (295 million); DVR Playback based on persons in DVR households (124 million).
TABLE 4b. Continuation of Table 4a with Additional Demo Breaks
A 18-34
A 18-49
A 25-54
A 55+
On Traditional TV* 121:11 133:14 144:10 197:10
Watching Timeshifted TV (all TV homes) 10:44 12:14 13:21 9:37
DVR Playback (only in homes with DVRs) 24:36 26:42 28:25 27:23
Using the Internet on a Computer**+ 29:06 28:59 29:48 24:03
Watching Video on Internet**= 6:51 5:38 5:03 2:42
Mobile Subscribers Watching Video on a Mobile Phone^ 4:20 4:20 3:15 2:10
Source: Nielsen. Unlike Table 1, this table is based on total users of each medium. Traditional TV and Timeshifted viewing estimates are based on persons in TV
Households (295 million) DVR Playback based on persons in DVR Households (124 million).
TABLE 5. Video Audience Composition – Monthly Time Spent By Gender
M2-17 F2-17 M 18-49 F 18-49 M 50+ F 50+ M2+ F2+
On TV* 105:15 107:27 128:06 138:16 178:07 202:15 138:26 153:52
On the Internet**+ 3:24 2:47 6:38 4:47 3:18 2:54 5:05 3:53
On Mobile Phones^^ NA NA 4:20 3:37 2:10 2:10 4:20 3:37
Source: Nielsen. (Based on total users of each medium.)

7
TABLE 7a. Video Audience Composition – Age Demographic
K2-11 T12-17 A 18-24 A 25-34 A 35-49 A 50-64 A 65+
On TV* 11% 6% 7% 12% 21% 24% 19%
On the Internet**+ 8% 7% 10% 17% 27% 22% 10%
On Mobile Phones^ NA 13% 23% 28% 25% 9% 2%
Source: Nielsen. (Based on total users of each medium.)
TABLE 7b. Continuation of Table 7a with Additional Demo Breaks
A 18-34
A 18-49
A 25-54
A 55+
On TV* 19% 40% 42% 35%
On the Internet**+ 26% 53% 52% 24%
On Mobile Phones^ 51% 76% 57% 7%
Source: Nielsen. (Based on total users of each medium.)
TABLE 6. Video Audience Composition – Monthly Time Spent in Hours: Minutes – Ethnicity & Race
White African-American
Hispanic Asian
On Traditional TV* 141:56 201:46 126:54 96:31
Watching Timeshifted TV (all TV homes) 11:35 7:44 6:27 8:08
DVR Playback (only in homes with DVRs) 25:26 20:54 21:58 21:53
Watching Video on Internet**= 3:50 5:58 6:15 9:11
Mobile Subscribers Watching Video on a Mobile Phone^ 3:37 5:25 4:20 6:30
Source: Nielsen. (Based on total users of each medium for Persons 2+.)
4xAMERICANS SPEND
THE TIME PER WEEK WATCHING TIMESHIFTED
CONTENT ON THEIRTV AS THEY DO WATCHING ONLINE VIDEO
MORE THAN
8
TABLE 8a. Cross-Platform Homes – Ranked by In-Home Streaming Behavior (in 000’s)
Stream Quintile # of Persons Stream= Internet+ TV
Stream 1 29,547 18.9 58.7 225.8
Stream 2 29,561 2.6 39.0 250.2
Stream 3 29,542 0.9 27.5 253.6
Stream 4 29,546 0.3 17.9 275.2
Stream 5 29,551 0.0 11.1 278.6
Non Stream 92,218 0.0 3.2 248.0
All 239,966 2.8 19.6 251.6
Source: Nielsen. Based on Nielsen Cross-Platform Homes for Persons 2+ in Internet households.00
Average Daily Minutes
TABLE 8b. Cross-Platform Homes – Ranked by In-Home Internet Behavior (in 000’s)
Internet Quintile # of Persons Stream= Internet+ TV
Internet 1 37,138 11.5 84.4 297.1
Internet 2 37,145 4.3 26.3 265.9
Internet 3 37,166 1.9 10.6 248.1
Internet 4 37,143 0.8 3.4 236.4
Internet 5 37,147 0.3 0.5 238.7
Non Internet 54,227 0.3 0.0 239.4
All 239,966 2.8 19.6 251.6
Source: Nielsen. Based on Nielsen Cross-Platform Homes for Persons 2+ in Internet households.00
Average Daily Minutes
TABLE 8c. Cross-Platform Homes – Ranked by In-Home Television Viewing Behavior (in 000’s)
TV Quintile # of Persons Stream= Internet+ TV
Television 1 47,660 3.6 34.7 603.2
Television 2 47,662 3.7 25.6 307.1
Television 3 47,668 3.6 21.8 197.5
Television 4 47,660 4.6 20.9 117.3
Television5 47,659 7.4 22.6 37.6
Non Television 1,657 16.9 36.7 0.0
All 239,966 2.8 19.6 251.6
Source: Nielsen. Based on Nielsen Cross-Platform Homes for Persons 2+ in Internet households.00
Average Daily Minutes
AMERICANS SPEND
THE TIME PER WEEK
CONTENT ON THEIR
MORE THAN

9
TABLE 12. Devices in TV Households (in 000’s)
Q2 11 Q1 11 Q2 10
Any DVD Player ‡ 99,747 99,898 100,581
Any DVR 45,297 43,661 40,216
Any High Definition TV 79,043 75,535 66,418
Any Video Game 50,992 49,687 49,074
‡ BluRay included in count
Source: Nielsen. Based on Universe Estimates for the entire quarter.
TABLE 13. Mobile Device Penetration by Ethnicity^^^
White African-American
Hispanic Asian
Smartphone 35% 43% 45% 54%
Feature phone 65% 57% 55% 46%
Source: Nielsen.
TABLE 11. Television Distribution Sources by Ethnicity
White African-American
Hispanic Asian
Broadcast Only 9% 10% 15% 11%
Wired Cable 54% 56% 45% 53%
Telco 7% 7% 6% 11%
Satellite 31% 26% 35% 27%
Source: Nielsen. Based on scaled installed counts for the entire quarter.
TABLE 9. Television Distribution Sources - Number of Households (in 000’s)
Market Break Q2 11 Q1 11 Q2 10
Broadcast Only 11,140 11,193 10,947
Wired Cable 62,042 62,651 64,355
Telco 8,028 7,654 6,430
Satellite 34,480 34,297 33,443Source: Nielsen. Based on the Universe Estimates for the 15th of each month within the quarter.
CHART 1. Source Distribution
0
20
40
60
80
100
Quarter 2, 2010
Quarter 1, 2011
Quarter 2, 2011
Broadcast Only Wired Cable Telco Satellite
6.3
30.5 30.2 29.7
6.9 6.7 5.6
53.4 53.8 55.4
9.2 9.4 9.3
Source: Nielsen National People Meter, data from the 15th of each month, based on scaled installed counts.
CHART 2. Cable/Satellite with Internet Status Tracking
0
20
40
60
80
100
Quarter 2, 2010
Quarter 1, 2011
Quarter 2, 2011
Broadcast Only and Broadband
Cable/Satellite and Broadband
Broadcast Only and Narrowband/No Internet
Cable/Satellite and Narrowband/No Internet
4.5 4.7 5.24.6 4.4 3.8
18.1 19.6 22.1
71.7 70.1 67.5
Source: Nielsen National People Meter, data from the 15th of each month, based on scaled installed counts. Please see “Note” definitions in footnotes section on Page 10.
TABLE 10. Cable/Satellite with Internet Status - Number of Households (in 000’s)
Q2 11 Q1 11 Q2 10
Broadcast Only and Broadband 4,949 4,665 3,881
Broadcast Only and No Internet/Narrowband
5,813 6,089 6,377
Cable Plus and Broadband 79,216 75,952
Cable Plus and No Internet/Narrowband
22,849 24,625 27,243
Source: Nielsen. Based on the Universe Estimates for the 15th of each month within the quarter.
Please see “Note” definitions in footnotes section on Page 10.
80,944
DEVICE AND DELIVERY PENETRATION

10
FOOTNOTES FOR CHARTS:
° Watching TV in the home includes those viewing at least one minute (reach) within the measurement period. This includes Live viewing plus any playback within the measurement period. Second Quarter 2011 Television data is based on the following measurement interval: 3/28/2011-6/26/2011. Due to methodological improvements, the data for Q1 2011 is based on duration weighted averages. January data is based on Television Usage plus Live DVR Playback and February and March data is based on Television Usage only, because the DVR Playback has been incorporated into the Persons Television Usage (PUT) Statistic.
° ° In response to client requests for the ability to recreate these quintiles of time spent, for Q2 2011 the production of the underlying data has been fully migrated to the NPOWER system. In addition to allowing clients that subscribe to the Cross-Platform Homes to generate these and associated reports, it also incorporates production sample weighting (detailed in Chapter 3 of the National Reference Supplement) and universe projections.
* TV in the home includes Live usage plus any playback viewing within the measurement period. Timeshifted TV is playback primarily on a DVR but includes playback from VOD, DVD recorders, server based DVR’s and services like Start Over.
** Internet figures are from home and work. Hours:minutes for Internet and video use are based on the universe of persons who used the Internet/watched online video via their computers. All Internet figures are weekly or monthly averages over the course of the quarter. Data for Q2 2010 (Tables 2 &3) have been corrected to include restated data. Data for NetView were restated from February 2010 through October 2010 and VideoCensus were restated from March 2010 through November 2010 due to technological issues which understated time spent metrics. All data were computed via custom analyses reports using Nielsen NetView and Nielsen Video Census data.
^ Video user projection, time spent and composition data based on survey analysis of past 30 day use during the period. The mobile video audience figures in this report include mobile phone users (aged 13+) who access mobile video through any means (including mobile Web, subscription-based, downloads and applications).
^^ Nielsen’s mobile survey reports mobile video usage for those users 13 and older. Thus, 12-17 is T13-17 for all mobile data.
^^^ Beginning here in Q2, unacculturated Hispanics are now included in Smartphone/Feature phone distribution. The Hispanic smartphone penetration therefore is not trendable.
A SPECIAL NOTE ON INTERNET AUDIENCES:
+ Due to a change in the type of call used behind Facebook’s AJAX interface, Nielsen NetView data for Facebook page views and duration were underreported for June and July. This was corrected with August-forward reporting. This affects the “Using the Internet on a Computer” and “Internet” time spent figures provided in this report.
= Due to a change in the format of Netflix stream URLs, streaming for the Netflix brand was not reported in the April and May VideoCensus reports. This was corrected with June-forward reporting. This affects the “Watching Video on the Internet” and “Stream” figures for this report.
NOTE: Definitions of Narrowband and Broadband. Narrowband (often referred to as Dial Up) is defined as a household that accesses the Internet via a telephone line. Broadband (often referred to as High Speed) is defined as a household that access the Internet via DSL, Cable Internet through cable provider, Fiber-Optic Service, U-Verse, Satellite Internet, Data Card (aircard that connects to a cellular phone network) or PC tethered to cell phone (cellular phone network). Lastly, if the household has multiple connection speeds then the fastest connection speed is reported for that household.

Copyright © 2011 The Nielsen Company. All rights reserved. Nielsen and the Nielsen logo are
trademarks or registered trademarks of CZT/ACN Trademarks, L.L.C. 11/3847
www.nielsen.com
COMING