quantitative!assessment!of!the outcomeofanti1vascular ...etheses.whiterose.ac.uk/11140/1/final_re...
TRANSCRIPT

Quantitative Assessment of the outcome of Anti-‐Vascular Endothelial Growth Factor Treatment for Neovascular Macular Degeneration
Richard Peter Gale BSc MBChB MRCP MRCOphth MEd
PhD
University of York
Psychology
May 2015

2
Abstract
Neovascular Macular Degeneration is a significant cause of blindness world–
wide. Anti-‐Vascular Endothelial Growth Factor medication injected directly
into the eye has halved the disease burden in recent years.
Being able to adequately quantify the outcome of neovascular AMD
treatment gives perspective not only on appropriate intervention for
individual patients, but also the understanding of the science behind the
disease, its therapeutics and design of future clinical trials.
Assessment tools can be either subjective or objective, and often interrogate
either efficacy or safety endpoints. Although patient reported Quality of Life
utilities give the ultimate assessment of treatment success for an individual,
surrogate biomarkers are more effective in judging short-‐term response.
Visual acuity assessment is useful in analyzing cohorts of individuals, but its
subjective nature means that it is not particularly useful in determining
individual retreatment decisions. An objective morphological assessment of
the macular architecture does provide a good way of assessing short-‐term
response however. Retinal sensitivity also demonstrates usefulness as an
endpoint for clinical trials, but as of yet is too cumbersome a technique for
high volume clinical work. Functional imaging of the visual cortex remains a
research tool at present, but provides promise as a new objective endpoint.
Importantly this thesis has confirmed that that cortex is able to regain
function after a short period of compromise due to neovascular macular
degeneration.
Measurement tools to assess the outcome of treatment are best selected,
often in composite, with regards to the prime reason for assessment being
undertaken.

3
Contents Page
Abstract 2
Contents 3
List of Figures 10
List of Tables 13
Acknowledgements 19
Author’s Declaration 20
Preface 22
Text
Chapter 1: An Introduction to Macular Degeneration and the
assessment of treatment of neovascular disease 23
1. Overview 23
1.1 The Macula and vision 23
1.1.1 Microscopic ocular anatomy 23
1.1.2 Microscopic retinal anatomy 24
1.1.3 The visual pathway 25
1.1.4 The visual cortex 25
1.2 Macular degeneration 26
1.2.1 Classification of macular degeneration 26
1.2.1.1 Age-‐related Macular Degeneration 27
1.2.1.1.1 Dry Age-‐related Macular 27
Degeneration
1.2.1.1.2 Neovascular Age-‐related
Macular Degeneration 29
1.2.1.1.2.1 The Treatment of
Neovascular Age-‐ related
Macular Degeneration 33
1.2.1.2 The pathogenesis of macular degeneration 36

4
1.2.1.3 Myopic Macular Degeneration 37
1.2.1.3.1 Atrophic Myopic Degeneration 38
1.2.1.3.2 Neovascular Myopic Degeneration 38
1.2.1.3.2.1 The Treatment of
Neovascular Myopic Degeneration 38
1.3 Measuring outcomes of treatment of neovascular macular
degeneration 39
1.3.1 Anatomical outcomes of treatment of neovascular
macular degeneration 39
1.3.1.1 Angiography 40
1.3.1.2 Optical Coherence Tomography derived outcomes 40
1.3.2 Functional outcomes of treatment of neovascular
macular degeneration 41
1.3.2.1 Visual Acuity 42
1.3.2.2 Retinal sensitivity as measured by Microperimetry 43
1.3.2.3 The BOLD response as measured by Functional
Magnetic Resonance Imaging 44
1.3.2.4 Patient reported outcomes 46
1.4 Measuring the adverse effects of treating nvAMD 47
1.4.1 Adverse effects of the pharmacological agents 47
1.4.2 Adverse effects of the intravitreal injection procedure 48
1.5 The Aim of this Thesis 48
Chapter 2. Visual Acuity as an Outcome measure of anti-‐VEGF
treatment of Neovascular Age-‐related Macular Degeneration 50
2.1 Introduction 50
2.2 Background 50
2.3 Aims 52
2.4 Study Design 52
2.5 Results 55
2.6 Discussion 57
2.6.1 The implications of the Visual Acuity results 57

5
2.6.2 The use of visual acuity as a measurement tool 60
2.7 Conclusion
66
Chapter 3. Visual acuity and Ocular Coherence Tomography
as Outcome measures of anti-‐VEGF treatment of
Pathological Myopia associated Neovascular Macular
Degeneration 68
3.1 Introduction 68
3.2 Background 68
3.2.2 Treatments for Choroidal Neovascular Membrane
associated Pathological Myopia 69
3.2.2.1 Laser based therapies 69
3.2.2.2 Verteporfin-‐ photodynamic therapy 70
3.2.2.3 Anti-‐ Vascular Endothelial Growth Factor
therapies 70
3.3. The aims of this study 71
3.4 Methods 71
3.4.1 Patient Selection 72
3.4.2 Ranibizumab dosing regimen 73
3.4.3 Outcome Measures 74
3.4.4 Endpoints 74
3.4.4.1 Primary endpoints 74
3.4.4.2 Secondary endpoints 75
3.4.5 Statistical analysis 75
3.5 Results 76
3.5.1 Demographic and baseline characteristics 76
3.5.2 Primary endpoint 77
3.5.3 Secondary endpoints 81
3.6 Discussion 84
3.6.1 The efficacy and safety of ranibizumab as a
treatment for CNV associated with Pathological Myopia 84
3.6.2 Visual acuity and OCT as outcome measures of

6
the ranibizumab in treatment of CNV secondary
to pathological myopia 86
3.6.2.1 Visual acuity 86
3.6.2.2 Ocular Coherence Tomography 87
3.7 Conclusion 89
Chapter 4. Patient Reported Outcomes as Outcome Measures
of anti-‐VEGF treatment of Pathological Myopia associated
Neovascular Macular Degeneration 90
4.1 Introduction 90
4.2 Background 91
4.2.1 The W-‐BQ12 Well-‐being questionnaire 92
4.2.2 The MacTSQ Treatment satisfaction questionnaire 93
4.3 Methods 93
4.3.1 Statistical analysis 94
4.4 Results 94
4.4.1 W-‐BQ12 Well-‐being questionnaire 95
4.4.2 MacTSQ Treatment satisfaction questionnaire
97
4.4.3 Correlations between visual acuity, well-‐being
and treatment satisfaction 99
4.5 Discussion 100
4.5.1 Patient reported outcome measurements in
the treatment of myopic CNV with ranibizumab 100
4.5.2 The use of PROMS as an outcome measure 102
4.6 Conclusion 103

7
Chapter 5. Change in retinal sensitivity following
treatment of nvAMD using anti-‐VEGF therapy: using
a lesion-‐guided microperimetry retinal sensitivity as
an outcome measure 104
5.1 Introduction 104
5.2 Background 104
5.3 Methods 106
5.3.1 Patient population and treatment 107
5.3.2 Best Corrected Visual Acuity assessment technique 107
5.3.3 Retinal Sensitivity assessment by Microperimetry 108
5.3.4 Central Retinal thickness assessment with Optical
coherence tomography 108
5.3.5 Identification of the Area of Interest 109
5.3.6 Fixation stability assessment 109
5.3.7 Statistical analysis 109
5.4 Results 110
5.4.1 Best Corrected Visual Acuity 111
5.4.2 Central retinal thickness 113
5.4.3 Retinal sensitivity 115
5.4.4 Fixation stability 118
5.4.5 Correlation between VA, CRT and retinal sensitivity
5.6 Discussion 119
5.6.1 The use of lesion-‐guided microperimetry retinal
sensitivity as an outcome measure 119
5.6.2 The evaluation of fixation stability as on outcome
measure 123
5.6.7 Conclusion 124

8
Chapter 6. Functional MRI Blood Oxygen Level Dependency
response as an outcome measure of visual function following
the treatment of neovascular Age-‐related Macular
Degeneration: restoration of primary visual cortex activity
125
6.1 Introduction 125
6.2 Background 125
6.3 Methods 128
6.3.1 Patient population and treatment 128
6.3.2 Visual acuity technique 128
6.3.3 Ocular coherence tomography 129
6.3.4 Functional MRI technique 129
6.4.5 Statistical analysis 131
6.5 Results 131
6.5.1 Visual acuity 132
6.5.2 Central Retinal Thickness 134
6.5.3 Vector mean projected amplitude of BOLD
responses 136
6.5.4 Correlations between psychophysical and
anatomical measures 140
6.6 Discussion 142
6.7 Conclusion 145
Chapter 7. Quantifying the adverse effects of macular
degeneration treatment: Short term intraocular pressure
trends following intravitreal Ranibizumab injections for
neovascular Age-‐related Macular Degeneration and
the role of oral Acetazolamide in protecting glaucoma
patients 146
7.1. Introduction 146
7.2. Background 146
7.3. Methods 149

9
7.3.1 Participant selection 149
7.3.2 Trial design 150
7.3.3 Statistical methodology 151
7.4 Results 151
7.5 Discussion 155
7.6 Conclusion 158
Chapter 8. Summary and Conclusions: Quantification
of neovascular macular degeneration treatment 159
8.1 Overview of the context 159
8.2 Overview of the findings 160
8.2.1 Visual acuity as an outcome measure 160
8.2.2 Central retinal thickness as an outcome measure 161
8.2.3 The use of Patient Reported Outcome Measures 162
8.2.4 The use of microperimetry as tool for outcome
measurement 163
8.2.4.1 Retinal sensitivity 163
8.2.4.2 Fixation stability 164
8.2.5 Functional MRI and the BOLD response 164
8.2.6 Measuring the side effects of treatment. The
amelioration of short-‐term intraocular pressure
fluctuations with oral acetazolamide 166
8.3 Outcome measures of neovascular Macular Degeneration
not addressed in this thesis 167
8.3.1 Near (reading) visual acuity and reading speed 167
8.4.2. Contrast sensitivity 168
8.4 Conclusions 168
Appendices 170
Definitions 174
List of References 177

10
List of Figures
Page
Figure 1. A Fundus Fluorescein angiogram demonstrating a
predominantly classic Choroidal neovascular membrane. 32
Figure 2. A spectral domain OCT image of normal macula
anatomy 33
Figure 3. A Spectral domain OCT image through the
central macula demonstrating neovascular
age-‐related macular degeneration 41
Figure 4. Mean visual acuity with 95% confidence intervals at the 6
visits in the base hospital and the 6 visits in the community eye
clinic. The shaded area (TRANSFER) represents the time between
the last visit at the base hospital and the first visit at the
community eye clinic. 55
Figure 5. The percentage of patients receiving a ranibizumab
injection for active nvAMD as a proportion of total assessments
per month. For comparison the mean ETDRS visual acuity is
plotted in the same axis. The shaded area (TRANSFER) represents
the time between the last visit at the base hospital and the first
visit at the community eye clinic. 57
Figure 6. The algorithm used to determine retreatment in the PM
treatment study 73
Figure 7. The mean change in visual acuity from baseline
for the local cohort of 7 participants in the PM treatment
study. All 7 participants contributed to the mean at each
visit. Visit number is displayed on the X-‐axis and absolute

11
ETDRS BCVA on the Y-‐axis. 79
Figure 8. The mean change in visual acuity from baseline
for the UK cohort of 62 participants in the PM treatment
study Visit number is displayed on the X-‐axis and absolute
ETDRS BCVA on the Y-‐axis. 81
Figure 9. The local cohort mean change in central retinal
thickness from baseline is demonstrated for the PM treatment
study. Visit number on the X-‐axis and mean change in
central retinal thickness (micrometres) on the Y-‐axis. 82
Figure 10. The UK cohort mean change in central retinal
thickness from baseline is demonstrated for the PM treatment
study. Visit number on the X-‐axis and mean change in
central retinal thickness (micrometres) on the Y-‐axis. 83
Figure 11. Mean visual acuity (y-‐axis, ETDRS letter score) at
visit 1 (baseline) to visit 3 (x-‐axis). Data from the treated
eye is displayed in blue and data from the untreated eye in red. 113
Figure 12. Mean 1mm2 central subfield retinal
thickness (y-‐axis, micormetres) at visit 1 (baseline) to visit 3
(x-‐axis). Data from the treated eye is displayed in blue and
data from the untreated eye in red. 115
Figure 13. Mean percentage of points that increased
retinal sensitivity by 2dB or more (blue) and 4 dB (Red) or
more (y-‐axis) for the 8 participants over the 2 follow up
sessions 1 and 2 (x-‐axis). The basline (visit 1) data has not
been displayed as it is defined as zero for all
participants and change between baslein and first follow
up may be affected by a significant learning effect (Wu et al, 2013). 117

12
Figure 14. Mean visual acuity (y-‐axis, ETDRS letter score)
at visit 1 (baseline) to visit 4 (x-‐axis) for the 10 participants.
Treated data in blue and untreated data in red. 134
Figure 15. Mean 1mm2 central subfield retinal
thickness (y-‐axis, micrometres) at visit 1 (baseline) to visit
4 (x-‐axis) for the 10 participants. Treated data in blue and
untreated data in red. 136
Figure 16. Mean BOLD response (y-‐axis) at visit 1
(baseline) to visit 4 (x-‐axis). Treated data in blue and
untreated data in red. 138
Figure 17. Mean BOLD response (treated over untreated,
y-‐axis) at visit 1 (baseline) to visit 4 (x-‐axis). 139
Figure 18. A scatter plot of the Pearson correlation coefficients
between the treated eye ETDRS Visual Acuity (number of
letters) and the CRT (micrometres). 140
Figure 19. A scatter plot of the Pearson correlation coefficients
between the treated eye the BOLD response and the ETDRS
Visual Acuity (number of letters). 141
Figure 20. A scatter plot of the Pearson correlation coefficients
between the treated eye BOLD response and the CRT
(micrometres). 141
Figure 21. Mean (SD) intraocular pressure (mmHg, y axis)
for time points TB, T0, T5, T10, T30 (minutes, x axis). 154

13
List of Tables
Page
Table 1. A summary of the classification of macular degeneration 27
Table 2. A summary of the Pathogenesis of Age-‐related
Macular Degeneration 37
Table 3. The mean coefficient of repeatability by diagnosis,
from Patel et al 2008. 63
Table 4. Patients were excluded from enrolment to the PM
treatment study if they met the above criteria. 72
Table 5. Participant demographic data in the PM treatment study. 77
Table 6. The mean (standard deviation) BCVA
(ETDRS letters) and CRT (micrometres) for the local cohort of
7 participants in the PM treatment study. Figures are given for
assessments at baseline, the mandatory treatment and
subsequent as required visits. 78
Table 7. The mean (standard deviation) BCVA
(ETDRS letters) and CRT (micrometres) for the UK cohort
of 62 participants in the PM treatment study. Figures
are given for assessments at baseline, the mandatory
treatment and subsequent as required visits. 80
Table 8. The baseline and time point scores of the
general well-‐being and subscales. 95
Table 9. The baseline and time point general well-‐being
scores for the better and worse seeing eye. Note that

14
there were 6 eyes where the baseline was neither better
nor worse than the fellow eye (within 5 ETDRS letters of each
other) and so total analysis was performed on 59 participants. 96
Table 10. General well-‐being score over the course of the
study, sub-‐grouped into baseline VA. 97
Table 11 The baseline and time point changes in
overall treatment satisfaction and subscales scores. 98
Table 12. The MacTSQ score over the course of the study,
sub-‐grouped by the number of treatments received. 99
Table 13. The correlation co-‐efficients and two tailed
probability tests for correlations between VA, CRT, W-‐BQ12
and MacTSQ. 99
Table 14 The baseline (visit 1) characteristics of the 8
partictipants (BCVA= best corrected visaul acuuity in
ETDRS letters, CRT= central 1mm2 subfield retinal thickness
in micrometers, and number points in the area of
interest. Note that participant 8 had no baseline
microperimetry performed so the area of interest
was mapped onto the retinal senitivity map at visit 2. 111
Table 15. Treated and untreated eye visual acuity
(ETDRS letters) for the 8 participants over the 2 follow
up sessions. A blank cell represents missing data. 112
Table 16. Treated and untreated mean and standard
deviation (SD) of best corrected visual acuity
(ETDRS letters) for the 8 participants over the 3 sessions,
visit 1 (baseline) to visit 3. The number of sessions
analysed (n) was 8 in all cases except for visit 3 when

15
the figure was 7 due to missing data. 112
Table 17. Treated and untreated CRT (central
1mm2 subfield retinal thickness, micrometres) for
the 8 participants over the 2 follow up sessions. 114
Table 18. Treated and untreated mean and standard
deviation (SD) CRT (central 1mm2 subfield retinal
thickness, micrometres) for the 8 participants
over the 3 sessions, visit 1 (baseline) to visit 3. 114
Table 19. Number of microperimetry points in the
area of interest. Percentage and number of points
that increased retinal sensitivity by 2dB or more and 4 dB
or more for the 8 participants over the 2 follow up
sessions. A blank cell represents missing data. n = the
number of sessions analysed. 116
Table 20. Mean percentage and standard deviation of
points that increased retinal sensitivity by 2dB or more
and 4 dB or more for the 8 participants over the 2
follow up sessions. A blank cell represents missing
data. n = the number of sessions analysed. 117
Table 21. Fixation stability at baseline (visit 1), visit 2
and visit 3. S = stable fixation, R = relatively unstable
fixation, U = unstable fixation (Fujii et al, 2003). 118
Table 22. Correlations between visual acuity of
the treated eye (VA), central 1mm2 subfield retinal
thickness of the treated eye (CRT) and percentage
increase in retinal sensitivity of 2dB or more or
4dB or more (N= sample size). 119

16
Table 23. The baseline (visit 1) characteristics of the
10 participants treated and untreated eyes (BCVA=
Best Corrected Visual Acuity in ETDRS letters, CRT=
central 1mm2 subfield retinal thickness in
micrometers, BOLD = Vector mean projected amplitude
of Blood Oxygen Dependency Level). 132
Table 24. Treated and untreated eye visual acuity
(ETDRS letters) for the participants, 1-‐10 over the 3
follow up sessions. A blank cell represents missing data. 133
Table 25. Treated and untreated mean and standard
deviation (SD) visual acuity (ETDRS letters) for the
participants 1-‐10 over all 4 sessions, visit 1 (baseline)
to visit 4. The number of sessions analysed (n) was 10
in all cases except for visit three when the figure was 9
due to missing data. 133
Table 26. Treated and untreated CRT (central 1mm2
subfield retinal thickness, micrometres) for the participants,
1-‐10 over the 3 follow up sessions. 135
Table 27. Treated and untreated mean and standard
deviation (SD) CRT (central 1mm2 subfield retinal
thickness, micrometres) for the participants 1-‐10
over all 4 sessions, visit 1 (baseline) to visit 4. 135
Table 28. Treated and untreated BOLD (vector mean
projected amplitude of BOLD responses) for the
participants, 1-‐10 over the three follow up sessions.
A blank cell represents missing data. The number
of participants analysed (n) was less than ten
across all sessions after baseline due to missing data. 137

17
Table 29. Treated and untreated mean and standard
deviation (SD) BOLD (vector mean projected amplitude
of BOLD responses) for the participants 1-‐10 over the
3 follow up sessions. Following the baseline
assessment, the number of participants analysed
(n) was less than ten across the remaining sessions
due to missing data. 137
Table 30. Mean treated and mean untreated BOLD
(vector mean projected amplitude of BOLD responses)
for the participants 1-‐10 over the 3 follow up
sessions. A blank cell represents missing data.
Following the baseline assessment, the number of
sessions analysed (n) was less than ten across the
remaining sessions due to missing data. 138
Table 31. Mean and standard deviation (SD)
treated / untreated BOLD (vector mean
projected amplitude of BOLD responses) for the
participants 1-‐10 over the four sessions,
visit 1 (baseline) to visit 4. Following the baseline
assessment, the number of sessions analysed (n)
was less than ten across the remaining sessions
due to missing data. 139
Table 32. The Inclusion and exclusion criteria for
participation in the IOP rise prophylaxis study. 150
Table 33. Baseline characteristics of study participants
in the acetazolamide treated and non-‐treated groups. 152
Table 34. Intraocular pressures in the acetazolamide
and control group over each time point

18
summarised with descriptive statistics. 153
Table 35. A comparison in the change in IOP from
baseline to T0, T5, T 10 and T30 between the treated
and untreated groups. 155

19
Acknowledgments
I would like to acknowledge the help and guidance of the team at the York
Neuroimaging Centre led by Prof. Tony Morland (my academic supervisor),
Dr. Heidi Baseler, Andre Gouws and Rachel Woodall. Thanks also to Dr.
Victoria Allgar from the York Clinical Trials Unit.
The research team at York Teaching Hospital also deserve particular thanks:
Dr. Colin Murray, Dr. Patrizia Tschour, Dr. Archana Airody, Dr. Divya
Venugopal, Dr. Alexandra Mankowska, Debbie Wood Alison Grice-‐Holt, and
Srilakshmi Gollapothu.
Particular thanks go to my family Valerie, Aurelie and William Gale for their
support and patience.

20
Author’s Declaration
The following statement clarifies the nature and extent of contribution to
the research by colleagues. Otherwise the work is my own and has not been
submitted previously for any other degree at this or any other university.
Chapter 2.
Data collection was assisted by Dr. Patrizia Tschour, Dr. Divya Venugopal
and statistical evaluation verified by Dr. Victoria Allgar. These data formed a
manuscript, which is now in print (Tschour P., Pilly B., Venogopal D., Gale R.
(2013). Optimising assessment intervals improves visual outcomes in
ranibizumab treated age-‐related neovascular macular degeneration: using
the stability phase as benchmark. Graefes Arch Clin Exp Ophth, 251(10),
2327-‐30.).
Chapter 3.
I was the Principal Investigator with site level responsibility for the study.
Data collection was assisted by Dr. Patrizia Tschour. These data contributed
to a national data set, which resulted in two publications (Tufail A.,
Narendran N., Patel P., Sivaprasad S., Amoaku W, Gale R., et al. (2013b)
Ranibizumab in myopic choroidal neovascularization: the 12-‐month results
from the REPAIR study. Ophthalmology, 120, 1944-‐1945 e1941; Tufail A.,
Patel P., Sivaprasad S., Amoaku., Browning A. Gale R., et al. (2013a).
Ranibizumab for the treatment of choroidal neovascularisation secondary to
pathological myopia: interim analysis of the REPAIR study. Eye, 27, 709-‐
715.).
Chapter 4.
I was the principal Investigator with site level responsibilities. Data
collection was assisted by Dr. Patrizia Tschour. The data contributed to a

21
national dataset, which is now published (Amoaku W., Gale R., Lotery A.,
Geeta M., Sivaprasad S., Petrillo J., et al. (2015). Treatment Satisfaction and
Well-‐being in Patients With Myopic Choroidal Neovascularization Treated
With Ranibizumab in the REPAIR Study. Plos one, accepted for publication.).
Chapter 5.
Prof. Antony Morland was the chief investigator for this study. Data
collection was assisted by Dr. Patrizia Tschour, Dr. Archana Airody and
Debbie Wood. Statistical analysis was assisted by Dr. Alexandra Mankowska.
Data has been presented at The Association for Research in Vision and
Ophthalmology congress 2015 (Mankowska A., Airody A., Baseler H.,
Morland A., Gale R. (2015). Analysis of an area of interest (choroidal
neovascular membrane and sequelae) using microperimetry demonstrates
significant increase in retinal sensitivity following anti-‐VEGF therapy for
neovascular Age-‐related Macular Degeneration (nvAMD). ARVO. Program no
2772, Poster no B0154.)
Chapter 6.
Prof. Antony Morland was the chief investigator for this study. Data
collection and management was assisted by Dr. Patrizia Tschour, Dr.
Archana Airody, Andre Gouws and Rachel Woodall.
Chapter 7.
I was the chief investigator for this study. Data collection was assisted by Dr.
Colin Murray and Debbie Wood. Statistical support was given from Dr.
Victoria Allgar.

22
Preface
Neovascular or ‘wet’ macular degeneration is a devastating condition, which
left untreated leads to irreversible and severe central visual loss. Although
typically presenting in one eye it affects the fellow eye in around half of the
time within 5 years. Thankfully injectable treatments into the eye that target
the key chemical driver of the disease are available, and these often give
partial visual recovery with long-‐term stability. Blind registration has
reduced by half.
Being able to quantify the outcome of treatment, both in terms of safety and
efficacy, are paramount. There are many ways of being able to assess
treatment outcomes, the principle way being measuring of visual acuity. But
is visual acuity a good representation of visual function? Ideally an outcome
measure should be objective, reproducible, easy to acquire and relevant to
those affected. A greater understanding of outcome tools will allow the
clinical and scientific community to appropriately select a technique to
assess current and future treatments.
Through a series of 6 studies, each asking questions about the efficacy or
safety of treatment of neovascular macular degeneration, different outcome
measures are explored.

23
Chapter 1: An Introduction to Macular Degeneration and the
Assessment of Treatment of Neovascular Disease.
1. Overview
Treatments for the blinding disease ‘Wet’ Macular Degeneration took a
significant step forward a decade ago with the introduction of a new class of
ocular therapy, Vascular Endothelial Growth Factor Inhibitors. Being able to
measure the response to treatment accurately not only increases our
understanding of the science behind such treatments but also helps
establish suitable treatment endpoints.
After a brief introduction to essential ocular anatomy and the visual
pathway this chapter details Macular Degeneration, its subtypes, diagnosis
and treatments, all of which are topics essential to the understanding of this
thesis. Furthermore, this chapter discusses the commonly used outcome
measures of treatments and a selection of research tools, before formulating
the aims of this thesis.
1.1 The Macula and vision
Essential aspects of both macro and microscopic anatomy core to the
understanding of this thesis are detailed here.
1.1.1 Macroscopic ocular anatomy
The basic concept of the anatomy of the eye is similar to a camera with light
rays being refracted at the optical surfaces of the eye, primarily the lens and
cornea anteriorly, being focused on the light sensitive tissue, the retina,
posteriorly. Between the lens and the retina lies the transparent vitreous
gel, which is attached to the retina at the pars plana, 3-‐4 mm posterior to the
cornea.

24
1.1.2 Microscopic retinal anatomy
Principally three types of cell form the commencement of the visual
pathways within the retina; the photoreceptors in the outermost aspect of
the neurosensory retina, which synapse with the bipolar cells, which in turn
synapse with the retinal ganglion cells at the innermost retina (Snell &
Lemp, 1998). In addition, horizontal and amacrine cells provide lateral
connectivity between cells within layers, and Muller cells provide glial
support across layers.
Light energy is transduced into electrical signals by the retinal
photoreceptors in the photo-‐transduction cycle. The photoreceptors are of
two types: rods which are located principally in the peripheral part of the
retina and responsible for non-‐colour, peripheral and low light vision, and
cones which are located centrally and are responsible for vision in high
illumination settings allowing high acuity. There are three types of cones
which have maximal sensitivity in the short, medium and long parts of the
visible electromagnetic spectrum often referred to as the blue, green and
red cones. It is these cells that are responsible for colour perception at a
retinal level. Horizontal cells work ‘laterally’ in the retina providing support
in the form of inhibition and immunomodulation between the
photoreceptors and bipolar cells. Amacrine cells play a similar supporting
role within the retina acting between the bipolar and retinal ganglion cells
(Snell & Lemp, 1998).
There are a number of cells that support the neurosensory aspect of the
retina. The Retinal Pigment Epithelium (RPE) lies external to the
photoreceptor layer and has a number of functions including supporting the
photo-‐transduction cycle, light absorption, phagocytosis (engulfing foreign
material) and ion buffering,. Beneath the RPE is a vascular layer, the
choriocapillaris. The choriocapillaris supplies the oxygen and nutrient
requirement to the outer layers of the retina. Its innermost layer, the
basement membrane termed Bruch’s membrane, is shared with the

25
outermost layer of the RPE and serves as a physical barrier between the
vascular system and the retina (Snell & Lemp, 1998).
The macula is the central part of the retina, usually defined as the area
located with the principle retinal vascular anatomy and is often mentioned
in disease terminology. It is the central part of the macula, the fovea, that has
the very highest density of cone photoreceptors and is responsible for our
finest visual acuity enabling tasks such as reading (Snell & Lemp, 1998).
1.1.3 The visual pathway
Following their synapse with the bipolar cells, the ganglion cells, of which
there are approximately 1 million per eye at birth, form the nerve fibre layer
on the inner most aspect of the retina. The axons of the ganglion cells form
the optic nerve, which passes posteriorly through the orbit. At the optic
chiasm the nasally located fibres decussate and with the temporal fibres of
the fellow eye form the optic tracts, which then synapse in the lateral
geniculate nuclei (LGN). The onward nerve fibres from the LGN form the
optic radiations that ultimately pass into the visual cortex in the posterior
aspect of the occipital lobe of the cerebral tissue (Snell & Lemp, 1998).
1.1.4 The visual cortex
The visual cortex is the aspect of the cerebral tissue that is responsible for
processing the input from the retina to establish visual perception. The
primary visual cortex (which is also called V1 or the striate cortex) is the
region of the visual cortex that first receives information from the LGN. A
cortical hierarchy of areas termed V2, V3, V4 and V5, collectively known as
the extrastriate cortex, then further processes the information. These
cortical regions serve different purposes in interpreting the world. For
example neurons in V1 and V2 respond selectively to bars of specific
orientations and are believed to support edge and corner detection. In
addition basic information about color and motion is processed here. (Jessel,

26
Schwartz and James, 2000). Other areas appear to establish specific
functional roles in motion (V5) and colour perception (V4) (Born & Bradley,
2005).
1.2 Macular degeneration
Macular degeneration is a pathological process affecting the central retinal
tissues and encompasses a number of well-‐defined diseases. The term
‘degeneration’ refers to the ‘loss of specialist structure and function’ of a
tissue, and is a very broad definition that could incorporate most diseases,
but is often used when the process is poorly understood and associated with
ageing (Underwood, 1992). As knowledge about macular degeneration has
grown it transpires that there is a genetic explanation for some of its forms;
in the age-‐related type there are currently 20 known genetic loci
responsible for approximately half of disease heritability (Fritsche, et al.
2014). This calls into question the nomenclature ‘macular degeneration’,
and indeed whether in the future it maybe be better suited to being labeled
as a form of ‘macular dystrophy’, a term often reserved for a collection of
macular pathologies that have a strong genetic influence (Kanski, 1999).
Nonetheless, macular degeneration is a condition with characteristic
phenotypes.
1.2.1 Classification of macular degeneration
The commonest form of macular degeneration is Age-‐related Macular
Degeneration (AMD). It is the commonest cause of blindness in the elderly
population in the western world, being a condition diagnosed over the age
of 50 years (Ferris et al 2013; Klien et al 2007). The second commonest
form of macular degeneration is Myopic Macular Degeneration (MMD), often
occurring earlier in life. Table 1 illustrates a summary of macular
degeneration classification detailed in the following sections.

27
Macular Degeneration
A. Age-‐related Macular Degeneration B. Non Age-‐related Macular
Degeneration e.g. Myopic,
Hereditary, Inflammatory
1. Dry 2. Wet (or
‘neovascular’)
1. Dry 2. Wet (or
‘neovascular’)
a. Early Late
(a. Choroidal
neovascular
membrane,
b. Retinal
Angiomatous
proliferation or
c. Polypoidal
choroidal,
Vasculopathy)
Atrophic
Choroidal
neovascular
membrane
b. Intermediate (non central atrophy) c. Late (central atrophy)
Table 1. A summary of the classification of macular degeneration.
1.2.1.1 Age-‐related Macular Degeneration
A common classification of AMD is into ‘Dry’ and the less common ‘wet’
forms.
1.2.1.1.1 Dry Age-‐related Macular Degeneration
As we age a lipid-‐protein rich byproduct of the photo-‐transduction cycle,
lipofuscin, causes thickening of Bruch’s membrane. As a part of the aging
process this material accumulates beneath the RPE in bodies called Drusen;
they are present in approximately two-‐thirds of the population over the age

28
of 70 years (Rickmen et al, 2013). This accumulation is considered to be
abnormal or ‘degenerative’ if there are excessive drusen or additional
‘abnormalities’ of the RPE. These abnormalities can be seen as
hyperpigmentation of the RPE, which is noted as ‘stipulation’ or larger
‘clumping’ of pigment, or alternatively there can be loss of the pigmentation
termed hypopigmentation. Drusen can resolve or can evolve to become
larger or worse still cause loss of the associated photoreceptors and RPE in
the process of atrophy (Rickmen et al, 2013). Geographic atrophy (GA) is
observed where there is a well-‐defined area of visible loss of the RPE
demonstrated by the clear visualization of the choriocapillaris blood vessels
beneath (Sunness et al, 1999).
A well-‐accepted classification of AMD is that described by the Age-‐Related
Eye Disease Study Research Group study (AREDS, 2001a) and is based upon
the aforementioned clinical appearances.
A. No AMD (AREDS category 1). No or a few small drusen (<63 microns in
diameter)
B. Early AMD (AREDS category 2). Any or all of the following: multiple small
drusen, few intermediate drusen (63 to 124 microns in diameter), or RPE
abnormalities.
C. Intermediate AMD (AREDS category 3). Any or all of the following:
extensive intermediate drusen, and at least one large druse (≥ 125 microns
in diameter), or GA not involving the centre of the fovea.
D. Advanced AMD (AREDS category 4). GA involving the fovea and/or any
of the features of neovascular AMD (AREDs, 2001a).
Dry AMD is common in the western world. Estimates for the UK population
are a prevalence of late AMD of 4.8% (95% CI 3.4% to 6.6%) of those over

29
65 years of age and 12.2% (95% CI 8.8% to 16.3%) of those aged 80 years
or more in the UK (Owen et al, 2003).
Those affected may experience no visual symptoms in the early phases of
dry AMD. Difficulty in reading is a typical early symptom with people
requiring more light and having a reduced tolerance. Symptoms usually
progress slowly over a period of many years. Late stage symptoms are
characterized by central scotomata (holes in the vision), making tasks such
as reading and the recognition of facial features difficult.
The diagnosis of dry AMD is a clinical one, with typical changes being
observed directly by ophthalmoscopy. It is usually a bilateral disease,
although progress may be asymmetrical (AREDS, 2001a).
Although inhibitors of the pro-‐inflammatory complement pathway have
shown promise to slow the progression of GA in early phase clinical studies
(Do et al, 2014), currently there is no effective routine clinical treatment of
dry AMD. Vitamin supplementation in the form of high dose combination
has been shown to reduce the conversion of ‘dry’ to ‘wet’ disease however
(AREDS, 2001b).
1.2.1.1.2 Neovascular Age-‐related Macular Degeneration
Neovascular (new blood vessels) AMD, also termed ‘wet’ AMD, is a less
common but potentially more devastating form of the disease. The incidence
has been estimated at 450 per million in the UK (Owen et al, 2003). It is
typically of unilateral onset with the second eye becoming involved in
approximately 25-‐42% after 5 years (AREDS, 2001a). Neovascular AMD
(nvAMD) is of three principle types.
A. Choroidal Neovascular Membrane. A choroidal neovascular
membrane (CNV) occurs when there is a breach of Bruch’s membrane, the
tissue directly beneath the RPE, and a fibrovascular network of blood

30
vessels arises from the choroidal circulation. A breach of Bruch’s membrane
is not unique to AMD. It also occurs in trauma, shortsightedness and
hereditary abnormalities of its constituent collagenous tissue such as
pseudoxanthoma elasticum, but dry AMD is the commonest cause. The CNV
enters either the sub RPE space, the sub retinal (neurosensory) space or
both. These blood vessels are abnormal; being highly fenestrated they leak
serum and lipids, and are prone to haemorrhage (Kanski, 1999). Fluid can
accumulate beneath the RPE, the neurosensory retina, within the retina and
cause the RPE to detach from the underlying Bruch membrane (a so called
‘Pigment Epithelial Detachment’ or PED).
B. Retinal Angiomatous Proliferation. A Retinal Angiomatous
Proliferation (RAP) lesion is a similar neovascular abnormality to CNV but
the lesion arises from within the retina (stage 1). The lesion may extend to
below the neurosensory retina (stage 2) and in the late stage of the disease
(stage 3) it anastomoses with the choroidal circulation when CNV then
becomes present (Yannuzzi et al, 2012).
C. Polypoidal Choroidal Vasculopathy. Polypoidal Choroidal
Vasculopathy (PCV) is also a form of wet AMD usually occurring at a slightly
earlier age and more nasal in the macula than CNV, and typically with a
blood filled ‘serosanguinous’ PED. PCV is characterized by an arborizing
network of choroidal blood vessels, with dilated vessels that are seen as
‘polyps’. These do not often enter the sub retinal space and are only
associated with CNV in approximately 10% of cases (Yannuzzi et al, 1997).
Wet AMD causes symptoms of acute loss of vision, often accompanied with
distortion of lines that would otherwise be seen as straight, a symptom
known as metamorphopsia. The natural history of wet macular
degeneration is poor due to haemorrhage and fibrosis (scarring) ultimately
disrupting the function of the retina. This typically leads to severe loss of
central vision and blindness over a period of many months (Rosenfeld et al,
2006).

31
Diagnosis of nvAMD relies on clinical judgment of typical features (AREDS
2001a) at ophthalmoscopy supported by investigations. Fundus Fluorescein
Angiography (FFA) is required to confirm the presence of CNV, whilst
Indocyanine Green Angiography (ICG) confirms PCV. Both of these
techniques are dynamic examinations of the circulation, FFA of the retinal
and ICG of the choroidal systems. Following injection of the fluorescein or
Indocyanine Green dye into a vein in the arm, photographs are taken of the
posterior aspect of the retina (the Fundus) over a 10-‐15 minute period. Two
main forms of CNV are seen on FFA. Classic lesions, forming about 15 % of
all CNV, are well defined in the early stages of the angiogram (within 20
seconds), often have a lacey pattern and demonstrate leakage in the later
stage. Occult lesions are ill defined, are often described as having a
‘speckled’ hyperfluorescence, and leak in the later stages. Commonly a
combination of the two patterns is observed and lesions may be described
as 100% classic, predominantly classic (>/= 50%, Figure 1), minimally
classic (<50%) or occult. A third rare description of ‘late leakage of
undetermined origin’ has been made, whereby leakage is not seen until 2
minutes or more after the dye has been injected (Macular Photocoagulation
Study, 1991).

32
Figure 1. A Fundus Fluorescein angiogram demonstrating a predominantly
classic Choroidal neovascular membrane. This particular image of the FFA is
in the arterio-‐venous phase (the dye is in both arterioles and veins). It
demonstrates a well defined hyperfluorescent area (white) with dark
pigment encircling it (the classic component) with a less well defined
hyperfluorescent area on the lower right border demonstrating the occult
component.
Optical Coherence Tomography (OCT) is a non-‐invasive method of
evaluating the retina used to complement the techniques of FFA and ICG.
OCT is a non-‐dynamic examination of the central macular region
demonstrating the retinal and to a lesser extent adjacent choroidal
architecture. OCT is based on the principle of analysis of reflected waves of
laser light to from a 2-‐dimensional ‘A-‐scan’. Tissue interfaces reflect the light
allowing anatomical structures to be defined. A 3-‐dimensional image is
formed when multiple A-‐scans are taken to form a ‘B-‐scan’. Using

33
Fourier/spectral domain technology an image comprising of a few thousand
cross sections can be performed in a few seconds (Figure 2).
Figure 2. A spectral domain OCT image of normal macula anatomy. From
http://586eyes.com/diagnostic-‐center/spectralis/. Accessed 23 September
2015
1.2.1.1.2.1 The Treatment of Neovascular Age-‐related Macular
Degeneration
The treatment of nvAMD has rapidly evolved over the last 15 years with
particular advancement during the last 8 years.
One option for the treatment of CNV is thermal (or ‘hot’) laser therapy.
Applied directly to the lesion the energy cauterizes the vascular network
and so prevents further neovascularisation. Significant collateral damage to

34
the associated retina and RPE occurs, effectively destroying the tissue and
leaving a hole in the vision, a ‘scotoma’. Whether this scotoma is important
or not depends on its location. If the laser is applied to a CNV in an
extrafoveal location (that is >200μm from the centre of the fovea) then the
induced scotoma may not be symptomatic as it leaves the photoreceptor/
RPE complex required for functional vision unaffected. If the laser treatment
is given in a juxtafoveal location (1-‐200μm) there is a higher chance of
symptoms. If the laser ‘burn’ is subfoveal there is inevitably a sudden
reduction in vision at the time of laser treatment as the central cone
photoreceptors are destroyed. In this situation the resulting visual loss is
often worse, at least initially, than the visual loss due to the CNV itself
(Macular Photocoagulation Study, 1991). Thermal laser is now only
recommended for some extrafoveal lesions when other forms of therapy
may not be in the best interests of the individual.
Photodynamic therapy involves targeting the CNV with a different
wavelength of (‘cold’) laser to try and minimize collateral damage. An
‘exciting’ agent, verteporfin, is injected into the systemic circulation. After
83 seconds it accumulates in a higher concentration in the choroidal rather
than the retinal circulation. The applied laser then induces a photochemical
effect treating the CNV but minimizing damage to the surrounding retina.
Although this had a statistically beneficial effect on reducing the speed of
visual loss due the CNV, translated into clinical effect the results were often
disappointing (TAP study, 1999).
The major breakthrough in treatment of nvAMD occurred when for the first
time a treatment became available that enabled some restoration and
stabilisation of vision. Vascular Endothelial Growth Factor (VEGF) is one of
the principle chemical transmitters that promotes the growth and leakage of
blood vessels. It is found in a particularly high concentration in association
with neovascularisation. Anti-‐Vascular Endothelial Growth Factor (anti-‐
VEGF) agents are commonly used to treat new blood vessel growth in cancer
often being used as adjunctive chemotherapeutic agents. A trial of

35
intravenous injection of bevacizumab (trade name Avastin, Genentech Inc.
USA) in 9 patients with nvAMD demonstrated an improvement in visual
acuity, reduction in leakage of CNV on FFA imaging and thinning of the
retina using OCT (Michele, Rosenfeld, Puliafito, Marcus & Venkatrman,
2005). A subsequent trial of injection of a small volume of bevacizumab into
the vitreous body via the pars plana demonstrated resolution of subretinal
fluid and visual improvement (Rosenfeld, Moshfeghi & Puliafito, 2005). In
parallel to this ‘off-‐label’ use of bevacizumab, ranibizumab (trade name
Lucentis, Genentech Inc. USA) was being developed from just the
monoclonal antibody fragment of bevacizumab, as a treatment specifically
licensed for nvAMD. Ranibizumab is a humanised recombinant monoclonal
antibody fragment targeted against human vascular endothelial growth
factor A (VEGF-‐A). It binds with high affinity to all the VEGF-‐A isoforms
thereby preventing binding of VEGF-‐A to the receptors VEGFR-‐1 and
VEGFR-‐2.
Landmark clinical trials (Brown et al, 2006; Rosenfeld et al, 2006) using
fixed monthly injection of ranibizumab demonstrated a mean gain in visual
acuity after 3-‐4 injections with relative stability thereafter. Ranibizumab
(marketed by Novartis Pharmaceuticals AG in Europe) was licensed in
Europe in 2006 and approved for routine use in the NHS by the National
Institute for Health and Clinical Excellence in August 2008 (NICE, 2008). In
the UK, due to its unlicensed nature and the NICE 2008 ruling, bevacizumab
is rarely used, but in many other countries it is used more commonly than
ranibizumab. It is worth noting that the same company, Genentech,
manufactures both agents. The fact that Avastin, at the volume required for
the eye, is significantly cheaper than ranibizumab and is not recommended
for the use in the eye by Genentech has led to much controversy.
Independent comparative trials for efficacy have led many commentators to
describe similar efficacy with possible minor differences in systemic safety
signals at a population level between the agents. The debate continues.
(Martin, Maguire, Ying, Grunwald, 2011; Chakravarthy, Harding, Rogers,
Downes, Lotery, Wordsworth, et al 2012).

36
In July 2013 the molecule aflibercept (trade name Eylea, Bayer HealthCare)
was approved by NICE for use in nvAMD. Aflibercept is a fusion protein
designed to bind multiple isoforms of Vascular Endothelial Growth Factor-‐A
(VEGF-‐A) and Placental Growth Factor (PlGF). PlGF is another protein
involved in the abnormal growth of new blood vessels. Visual acuity results
have been similar to those in the clinical trials studying ranibizumab, but
dosing is different. Both products are given monthly for three doses then
aflibercept is given 8 weekly for the first year rather than the monthly as
required schedule for ranibizumab (Schmidt-‐Erfurth et al, 2014).
It has become clear that anti-‐VEGF agents, for all their ability to restore
some vision do not provide a cure for neovascular disease. By in large
treatments simply suppress disease until the clinical effect is no longer
apparent and treatment is re administered. Consequently the majority of
those with neovascular disease need to be monitored for signs of disease
activity and treated in the long term (Rofagha et al 2013; Tufail et al, 2014;
Airody, Venugopal, Allgar & Gale, 2014).
The effect of introduction of anti-‐VEGF agents for treatment of neovascular
AMD has been truly remarkable: the burden of blindness has reduced by
approximately 50% over the last decade (Bloch et al, 2012).
1.2.1.2 The Pathogenesis of Age-‐related macular degeneration
The pathogenesis of AMD is multifactorial. It can be thought of in terms of
predisposing factors, and triggers / drivers of the disease ultimately leading
to chronic destructive inflammation (Table 2). A number of candidate genes
have supported that notion that there is a strong genetic component
predisposing to AMD. Complement factor H, being one of this first major
genes to be identified with a mutation in C3, confers a 2.6 times greater risk
of developing the disease (Thakkinstian, et al, 2006). The complement
pathway is one of the naturally occurring pro inflammatory pathways.

37
Oxidative stress is the key mechanism in the development and progression
of the disease through the production of free radicals and ultimately chronic
inflammation of the retinal tissues. Oxidative stress occurs through disease
triggers and drivers such as smoking, hyperglycemia, poor vascular disease,
as well as the age-‐associated accumulation of lipofuscin by-‐products of the
photoreceptor transduction cycle. As we age naturally occurring anti-‐
oxidants in the macula, such as the carotenoid pigments lutein and
zeaxanthin, are less able to protect against these harmful stresses. The end
result of all of these factors is an increased production of chronic
inflammation with a reduced ability to be able to keep this in check (Pujol-‐
Lereis, SChlafer, Kuhn, Rohner, Pauly, 2016)
Pathogenesis of AMD
Predisposition Genetic mutations e.g. Complement
factor H
Triggers/ Drivers e.g.
Smoking
Hyperglycemia
Lipofuscin accumulation
Retinal Destruction Chronic Inflammation
Table 2. A summary of the pathogenesis of Age-‐related Macular
Degeneration
1.2.1.3 Myopic Macular Degeneration
Pathological myopic degeneration is the second commonest form of macular
degeneration. It is diagnosed by characteristic ocular appearances in
patients with at least 6 Dioptres of Myopic correction. It affects
approximately 2–4% of Caucasians and 9–21% of Asian populations
(Montero & Ruiz-‐Moreno, 2010; Soubrane, 2008). In a similar way to AMD it
can be divided into dry (atrophic) and wet (neovascular) forms.
38
1.2.1.3.1 Atrophic Myopic Degeneration
A characteristic feature of dry degeneration due to myopia is peripapillary
(adjacent to the optic disc) atrophy of the retina and RPE. This can progress
to affect the central macula and fovea causing profound visual loss.
1.2.1.3.2 Neovascular Myopic Degeneration
The central vision loss that can occur in patients with pathological myopia
(PM) most commonly results from CNV. It occurs in 4–11% of affected eyes
and predominantly in those younger than 50 years of age. The natural
history dictates that almost 90% of eyes will develop severe visual loss
(20/200 or less) after 5–10 years (Yoshida, Ohno-‐Matsui & Yasuzumi,
2003). The chance of the fellow eye being affected is high with around a
third being affected within 8 years (Ohno-‐Matsui, Yoshida & Futagami,
2003).
1.2.1.3.2.1 The Treatment of Neovascular Myopic Degeneration
In a similar manner to Laser based therapies for CNV associated with AMD,
thermal laser for pathological myopia is of limited value. Thermal laser to
subfoveal lesions will cause severe and immediate visual loss. Whilst this
does not occur with thermal treatment of juxta-‐ and extrafoveal lesions,
expansion of the laser induced chorioretinal scar into a subfoveal location
characteristically seen in myopia, and a high recurrence rate, dictates that it
is rarely used. (Chan et al, 2005; Secretan, Kuhn, Soubrane & Coscas, 1997).
Photodynamic therapy using verteporfin was the mainstay of treatment
until injectable treatment started being used, but at best this slowed down
the progression of visual loss. Data from a large multinational, randomized
clinical trial demonstrated a significant benefit for PDT over sham therapy
for the primary end point of what was considered to be clinically significant
vision loss (72% versus 44%; p < 0.01), but this effect was lost after 2 years
39
(64% versus 49% p=0.01) (Blinder, Blumenkranz & Bressler, 2003). Small
case series using the ‘off-‐label’ intravitreal anti-‐VEGF agents show promise
in outperforming PDT (Cohen, 2009).
1.3 Measuring outcomes of treatment of neovascular macular
degeneration
Having established there are now successful treatments for neovascular
macular degeneration (nvMD) is it important to be able to quantify their
outcome, not only from a clinical standpoint but also from a scientific point
of view. Outcomes measurements can be broadly divided into the following
categories:
A. Anatomical. A measure of anatomical
restoration
B. Functional.
i) Clinician / scientist measured. A measure of restoration of visual
function
ii) Patient / participant reported. Patients’ own perception of
improvement
1.3.1 Anatomical outcomes of treatment of neovascular macular
degeneration
Restoration of the anatomy of the retina, RPE and choroid to its pre diseased
state is a key goal of treatment of nvMD (Brown et al, 2006; Rosenfeld et al,
2006; Martin et al, 2011; Chakravarthy et al, 2012). The principle ways of
measuring the anatomy have been introduced already:

40
1.3.1.1 Angiography
FFA and ICG are excellent tools and are still considered the gold standard in
diagnosis of nvMD. Leak of the fluorescein dye out of the abnormal vascular
network on FFA is a marker of neovascular disease activity. The fluorescein
or indocyanine dye is administered intravenously and although some form
of abnormal reaction such as nausea, vomiting or rash is relatively common
(5-‐10%), anaphylactic reaction leading to death is very rare (1 in 250,000).
Given the invasiveness of these techniques FFA and ICG are rarely routinely
used to monitor disease progress at every patient visit and therefore limits
its use as a high volume tool for assessment.
1.3.1.2 Optical Coherence Tomography derived outcomes
The principles of OCT have been described above. It is a rapid, non-‐invasive
method of measuring single time point anatomy and therefore useful when
high volumes of assessments are required. Common resolution of the OCT in
a clinical based instrument is 6μm (Cirrus OCT, Carl Zeiss Meditec, Dublin,
CA). OCT is useful if defining normal anatomy and pathological changes such
as:
A. Tissue loss (for example atrophy of the inner and outer segment
junction of the photoreceptors or loss of the contact cylinder of
photoreceptor / RPE junction).
B. New tissue (such as sub retinal fibrosis occurring secondary to a CNV.
Fibrosis, haemorrhage and CNV all have similar reflectivity so distinguishing
between these is not accurate and they are often grouped together as ‘Sub
Retinal Highly Reflective Material’ or SHRM).
C. New spaces (which may be assumed to be fluid filled, such as intra
retinal fluid or subretinal fluid associated with incompetent new blood
vessels, or alternatively neuronal loss).

41
OCT alone does not give a dynamic assessment of anatomy and so it is not
possible to distinguish whether fluid seen on an image is a stagnant, inactive
‘pool’ or a ‘leak’ denoting active disease. Given the characteristics of CNV,
assumptions are often made based on previous history, findings and clinical
experience. OCT is also limited by its resolution. It follows that if higher
resolution technology were available more detailed anatomy and pathology
could be observed, which in turn may influence treatment criteria.
Figure 3. A Spectral domain OCT image through the central macula
demonstrating neovascular age-‐related macular degeneration. The left side
of the image demonstrates elevated areas of the RPE (‘pigment epithelial
detachments’) and fluid (dark) beneath retina and above the RPE (‘sub
retinal fluid’).
1.3.2 Functional outcomes of treatment of neovascular macular
degeneration
Restoration of retinal anatomy does not necessarily lead to the restoration
of function as ‘damage’ to the integrity of the tissue may occur. Anatomy
may therefore not be a good surrogate marker of function. The following
section introduces the techniques of visual acuity, microperimetry,
functional magnetic resonance imaging and patient reported outcomes as
markers of functional outcomes of treatment of nvMD.

42
1.3.2.1 Visual Acuity
Visual acuity is a measure of the spatial resolution of the visual processing
system and is dependent of the entire visual pathway. Visual acuity is
commonly measured by testing the ability to read high contrast black letters
(optotypes) on an illuminated background at 6 metres, a distance that is
assumed to be at infinity for optical purposes. The Snellen chart is a
common example, and uses rows of letters that decrease in size down the
chart. A person with normal vision would be assumed to able to see the
letters on the row marked ‘6’ at 6 metres, so called ‘6/6’ vision. This gives an
angle of resolution of 1 minute of arc. The less far down the chart is read, the
higher the denominator resulting in a value that represents worse vision.
The ability to read letters on a chart is influenced by a number of factors
associated with the chart itself such as the contrast of the optotype
compared with the background, the duration of presentation of the letters,
the type of optotype and interaction effects from adjacent letters (the
crowding effect of adjacent letters) (Kaiser, 2009).
The Bailey-‐Lovie chart uses a constant number of letters per line with a
constant amount of spacing and so overcomes the issue of spacing. It uses
optotype that decreases in size in a logarithmic manner and so is often
termed called a LogMAR chart. In 1982 the chart was adapted using the
‘Sloan’ selection of letters from the alphabet, these letters all being equally
recognisable, for the Early Treatment of Diabetic Retinopathy Study. The
“ETDRS’ chart, having 20 rows of 5 letters on each row has since been the
standard for visual acuity measurement in clinical trials and gives a letter
score of 0-‐100. (Ferris, Kassoff, Bresnick & Bailey, 1982; Ferris and Bailey,
1996).
Although visual acuity remains the gold standard assessment tool for
measuring visual function, it is widely recognized that these high contrast
tests of vision underestimate the level of visual impairment, particularly in
older patients (Scott, Schein & West, 1994; West, Munoz & Rubin, 1997;

43
Mangione, Gutierrez, Lowe, Orav & Seddon, 1999; Maclure, Hart and Jackson
2000: Hazel, Petre,, Armstrong, Benson & Frost, 2000).
1.3.2.2 Retinal sensitivity as performed by Microperimetry
Perimetry is a psychophysical method of assessing retinal sensitivity. A
visual stimulus is presented to a subject in a part of their field of vision
corresponding to the area of the retina under examination. If they perceive
the stimulus a positive response is made. The size, intensity, type (for
example a light, hand movements or coloured object) and location of the
stimulus can be selected depending upon the question being asked of the
subject. Two broad techniques are used the map the field of vision:
movement of a constant stimulus from the least sensitive peripheral field
towards the centre until it is seen (‘kinetic perimetry’), or the use of stimuli
which are presented in a constant location but increasing in intensity until
the threshold for identification is reached (‘static perimetry’). An example
of kinetic perimetry is the Goldmann technique. The particular importance
of this technique is that the size and intensity of the stimulus it uses have set
standards used with other technologies. The stimulus size varies between 0
and V (roman numerals) and intensity between 1 and 4 (for each 5dB
increase), further refined by a to e for 1dB increments. (Cohen & Kawasaki,
1999). Typically I4e is used for a peripheral assessment and I2e for a central
assessment.
An automated process of perimetry enables the determination of retinal
sensitivity in a numerous fine locations in a reliable and reproducible
manner if so required. A key aspect of perimetry is ensuring the subject
maintains fixation of vision in a constant place throughout the examination
and hence eye movements are kept to a minimum. Automated perimetry is
most commonly used to diagnose and monitor the effect of treatment of
visual field defects in glaucoma, a condition affecting the optic nerve that
characteristically produces peripheral visual defects.

44
Microperimetry enables the determination of the map of retinal sensitivity
in a much smaller field than conventional perimetry. This technique was
first developed using a modified colour camera and subsequently using a
scanning laser ophthalmoscope, a method using laser technology to view the
retina in real time and therefore monitor the precise retinal localization of
the stimulus and the ability of the patient to maintain fixation (Van de Velde,
Timberlake, Jalkh & Schepens, 1990). The Nidek MP-‐1 Microperimeter
(Nidek Technologies, Padova, Italy) uses an infrared camera in conjunction
with an automated eye-‐tracking system that shifts the position of what
should be constant stimulus locations to compensate for small eye
movements. This allows for precise microperimetric assessment of central
field sensitivities (Squirrel & Elrich, 2012).
Squirrel et al studied a small number of patients before and after
commencing anti-‐VEGF treatment for nvAMD. They used the MP-‐1
microperimeter with 45 Goldman III (medium) sized stimuli over a 12-‐
degree macular area. After the first 3 doses of treatment there was a mean
increase of 6 (-‐15 to +12) ETDRS letters and 2.85 (SD 1.55) dB retinal
sensitivity. Based on only 1 of 10 patients having an improvement in visual
acuity but 8 of 10 having an improvement in retinal sensitivity, they
concluded that visual acuity appeared to underestimate the functional
improvement seen with retinal sensitivity (Squirrel, Mawer, Mody & Brand,
2010).
1.3.2.3 The BOLD response as measured by Functional Magnetic
Resonance Imaging
Functional Magnetic Resonance Imaging (fMRI) is a neuroimaging technique
that uses Magnetic Resonance Imaging (MRI) to measure functional changes
in the brain based upon blood oxygenation (and probably volume). As
neuronal activity increases there is an increase in the amount of oxygenated
blood compared with deoxygenated blood. The additional oxygenated blood
also enables the delivery of glucose to neurons so they can be repolarized,

45
i.e. returned to their ready state, following previous activity. Neuronal
activity causes a release of glutamate, which ultimately leads to release of
nitric oxide, a powerful vasodilator, and so increases blood flow.
Deoxygenated hemoglobin is more magnetic than oxygenated hemoglobin
leading to an increase in the Magnetic Resonance (MR) signal detected. This
improvement can be mapped to show which neurons (or in fact many
thousands of neurons in a small volume called a voxel) are active at a
particular time. This so called Blood Oxygenation Level Dependent (BOLD)
contrast was taken advantage of by Ogawa in 1990 who pioneered, initially
in rats, the now commonly used research technique of fMRI (Ogawa, Lee,
Kay & Tank, 1990). The BOLD contrast can be quantified and the three
dimensional area that is studied divided into component parts or voxels to
show detailed functional change in specific anatomical locations: Functional
Magnetic Resonance Imaging is able to localise BOLD to within 2-‐3 mm of
the neuronal activity.
The increase in oxygenation typically lags 1-‐2 seconds behind neuronal
activity and peaks at 5 seconds. Once the stimulus for brain activity is
removed the level falls, overshoots below its original value slightly before
returning to normal.
Functional MRI is affected by unwanted signal, termed noise, from the
scanner and random brain activity, which can be as big as the signal itself.
To minimise this, fMRI studies repeat a stimulus presentation multiple times
and a mean response is taken.
Give its high retinal sensitivity the macula has a relatively large
representation in the visual cortex compared with the peripheral retina. It is
represented at the posterior pole of the cerebral cortex within the calcarine
sulcus. This Region Of Interest (ROI) can be pre-‐defined on an anatomical
MRI scan for study and signal change within this area can be studied when
the macula is stimulated with light. The amplitude and coherence of change

46
of the fMRI activity, synchronized with the stimulus can be calculated
(Baseler, 2011a).
Baseler et al studied a single case and reported improvement in fMRI signal
in a patient treated with ranibizumab for neovascular Age-‐related Macular
Degeneration. Functional MRI was suggested as a sensitive and objective
measurement of visual function as it does not rely on the patient to maintain
good visual fixation that can interfere with techniques such as VA and
microperimetry. Furthermore, the cortex appeared to remain responsive
when vision was restored (Baseler, 2011a).
1.3.2.4 Patient reported outcomes
Patients can report their own perception of response to treatment. A
number of different Patient Reported Outcomes (PRO) specific to eye
disease or treatment exist enabling a structured response that individuals
perceive to be recorded.
The National Eye Institute Visual Function Questionnaire (NEI VFQ) is an
example of a commonly used Patient Reported Outcome Measure (PROM)
(Mangione, Berry & Spritzer, 1998). It was initially developed as a 51-‐point
scale that sampled different aspects of visual function with the help of
patients. (Mangione et al, 1998). It was further refined to a 25 point scale,
which correlates well with the 51-‐pont scale and still being representative of
visual function (Mangione et al, 2001). The NEI VFQ has been used to
provide insight into the quality of life change following anti-‐VEGF treatment
for nvAMD (Rakic et al, 2013).
The 12-‐item well-‐being questionnaire (W-‐BQ12), (Riazi, Bradley, Barendse,
& Ishii, 2006) was developed from the longer 22-‐item version and
comprises 3 areas of assessment: Energy, positive well-‐being and negative
well-‐being (Bradley & Lewis, 1990; Bradley 1994). Each of these 3 areas has
a score of 12 points, making a total of 36 possible and a higher score

47
indicates a better well-‐being. Although the PROM was developed for use in
patients with diabetes, it has been shown to be a useful and reliable tool in
patients with macular disease (Mitchell & Bradley, 2001).
The treatment satisfaction questionnaire MacTSQ (Mitchell, Brose &
Bradley, 2007) was designed to assess treatment satisfaction in two areas:
impact of treatment, and provision of information and convenience. Each of
these scales can score a maximum of 36 points, making a potential
maximum score of 72 with a higher score indicating better satisfaction. The
MacTSQ was used in the IVAN trial, the results of which are awaited
(Chakravarthy et al, 2013).
1.3 Measuring the adverse effects of treating nvAMD
All treatments have side effects and anti VEGF therapy of nvAMD is no
exception. Side effects can be broadly considered as effects of the
pharmacological agent and adverse effects of the procedure.
1.4.1 Adverse effects of the pharmacological agents
There has been much debate about the side effects of suppressing VEGF,
particularly about potential systemic complications (Chakravarthy et al
2012, Martin et al, 2011). The SAILOR clinical trial studying the safety of
ranibizumab therapy in nvAMD, warned of an increase in cardiovascular
and cerebrovascular endpoints such as myocardial Infarction, arrhythmia
and stroke (Boyer, Heier, Brown, Francom & Ianchulev, 2008). Since then
most studies have not convincingly proven any excess cardiovascular events
but debate remains as to the possibility of slight excess of haemorrhagic
stroke (Bressler et al, 2012).

48
1.4.2 Adverse effects of the intravitreal injection procedure
The intravitreal injection procedure can inadvertently cause retinal tears,
vitreous haemorrhage or lenticular trauma. These are uncommon events
occurring at a frequency of less than 1 in a 1000. Introduction of infection
into the vitreous cavity, an ideal culture medium for bacteria and fungi can
lead to the complication of endophthalmitis. Endophthalmitis is a severe
inflammation of the ocular structures that occurs at a rate of approximately
1 in 3000 injections often having a devastating outcome on final visual
acuity (Boyer et al, 2009; Hasler et al, 2014).
Typically a volume of 0.05mls of an anti-‐VEGF agent is administered. As the
ocular structures are relatively rigid this leads to an intraocular pressure
rise (Kim et al, 2008). Intraocular pressure elevation is the main risk factor
glaucoma, a condition characterized by damage to the optic nerve, with loss
of retinal nerve fibres and consequently peripheral vision. The role of
treatment to protect glaucoma patients from short-‐term pressure spikes at
the time of injection has not been well studied.
1.5 The Aim of this Thesis
Being able to adequately quantify the outcome of neovascular AMD
treatment gives perspective not only on appropriate intervention for
individual patients, but also the understanding of the science behind the
disease, its therapeutics and design of future clinical trials.
Commonly used methods of measuring VA using high contrast charts often
underestimate visual function (Scott et al, 1994; West et al, 1997; Mangione
et al, 1999; Maclure, Hart and Jackson 2000: Hazel, Petre, Armstrong,
Benson & Frost, 2000). The Study by Squirrel et al concluded that VA might
underestimate the functional improvement in vision of nvAMD patients
treated with ranibizumab (Squirrel et al, 2010). It would be logical to
assume that there is a strong correlation between the restoration of normal

49
anatomy and the restoration of visual function; however this is not
consistent finding (Munk et al, 2013). Baseler et al suggested that fMRI
might provide a functional measurement of visual function avoiding some of
the problems with VA and microperimetry (Baseler, 2011).
Concluding from this introductory chapter, there is enough discussion to
warrant further study of the common methods, and development of new
techniques, which assess the outcomes of treatment of neovascular macular
degeneration.
This thesis aims to assess the common forms of outcome measures of
treatment of macular degeneration such as visual acuity assessment and
OCT imaging. It also aims to explore and develop the use the functional
measures of patient reported outcomes, microperimetry and functional MRI.
In line with this theme not just the positive aspects of therapy will be
studied, but also a negative aspect in the form of the prevention of short-‐
term pressure spikes following intravitreal injection. These outcome
measures will be evaluated in the context of a series of observational and
interventional studies assessing new and existing treatments and
techniques. Conclusions about these techniques and treatments, their
advantage and pitfalls as well as their appropriateness for scientific and
clinical use will be evaluated.

50
Chapter 2. Visual Acuity as an Outcome measure of anti-‐VEGF
treatment of Neovascular Age-‐related Macular Degeneration
2.1 Introduction
Following on from introducing some of the common methods of assessing
outcomes of anti-‐Vascular Endothelial Growth Factor (VEGF) treatment of
Neovascular Macular Degeneration (nvMD) in chapter 1, this chapter will
study the value of using visual acuity (VA) as an assessment tool. A cohort of
patients being treated with ranibizumab for neovascular Age-‐related
Macular Degeneration (nvAMD) was studied. The cohort initially had a
longer than recommended follow up interval, but as a part of redesign of
clinical services this was shortened to the required interval. Visual acuity
was used to assess the impact of this change.
2.2 Background
In the developed world nvAMD is the commonest cause of severe visual loss
in the retired population and accounts for more than half of all cases of
those registered sight and severe sight impairment in the United Kingdom
(Rostron & McKibbin, 2012). The incidence of nvAMD rises with age being
0.2% at age 55-‐64 years and 13% over the age of 85 years and equates to an
estimated 26,000 new cases in the United Kingdom per year (Bunce, Xing &
Wormold, 2010; Owen, Jarrar, Wormald, Cook & Fletcher, 2012). So with the
knowledge that anti-‐VEGF treatments by and large temporarily suppress the
disease rather than providing a cure (Rofagha et al 2013; Tufail et al, 2014;
Airody et al, 2014) and that we have an aging population, the prevalence of
treated nvAMD continues to rise. This has led to a substantial increase in
capacity demand and many nvAMD treatment clinics are failing to meet this
demand (Amoaku, Blakeney, Freeman, Gale, & Johnston, 2012).
Early treatment of nvAMD with anti vascular endothelial growth factor
agents in order to prevent the natural history of rapid and progressive

51
visual loss (Bressler, 2001) is standard care. This is evidenced by the
landmark studies ANCHOR (Anti-‐VEGF antibody for treatment of
predominantly classic choroidal neovascularisation in AMD) and MARINA
(Minimally Classic/Occult Trial of the Anti-‐VEGF Antibody Ranibizumab in
the Treatment of Neovascular AMD) (Brown et al, 2006; Rosenfeld et al,
2006). Typically there is an initial gain in mean VA of 7 to 9 ETDRS letters
with subsequent stabilisation. Studies have shown that equally important to
early diagnosis is regular and long-‐term follow up, enabling timely re-‐
treatment as required. These phase III clinical trials have demonstrated that
regular treatment by either injection on a ‘fixed dosing’ regimen or an ‘as
required’ (pro re nata or ‘prn’) regimen, with ranibizumab on a monthly
basis leads to long term visual stability (Boyer et al, 2009; Brown, 2006 et al;
Martin, Maguire, Ying, Grunwald, 2011; Martin et al 2012; Lalwani,
Rosenfeld, Fung, Dubovy, Michels, 2009; Rosenfeld et al, 2006). However,
fixed dosing at a quarterly interval following three initial monthly
ranibizumab injections leads to a gradual decline of the initial gain in visual
acuity (Regillo et al, 2008). Furthermore, the monthly regime studies also
demonstrated less frequent severe visual loss (defined as greater than or
equal to 15 ETDRS letter loss) and more significant visual gainers (defined
as greater than or equal to 15 ETDRS letter gain) than either no treatment or
treatment with photodynamic treatment (Brown et al, 2006; Rosenfeld et al,
2006). Mean visual acuity change and percentage of 15 ETDRS letter gainers
or losers are two common parameters measure when evaluating treatments
of vision threatening disease (Bressler, 2001; Brown, 2006; Rosenfeld,
2006).
With the knowledge that loss of vision is the consequence of not seeing
patients in a timely manner and that long-‐term therapy is required, many
nvAMD treatment centres have needed to reconfigure services to be able to
cope with continually rising demands. There are well-‐documented solutions
of how this may be achieved including ‘off site’ closer to home models.
(Amoaku et al, 2012). In order to reduce follow up intervals in one nvAMD

52
clinic (York Teaching Hospital, United Kingdom), a community eye clinic
was established (The Eye Site Clinic, Bridlington, UK).
2.3 Aims
The aim of this study was to evaluate the impact of reducing follow up
intervals in a cohort of individuals with nvAMD being treated with
ranibizumab, and evaluate the use of visual acuity as an outcome measure.
2.4 Study Design
The National Institute for Health and Clinical Excellence (NICE) Technology
Appraisal (TA) 155 for nvAMD recommends that patients are treated with 3
monthly initiation doses of ranibizumab, 0.5 mg, as part of the standard
induction phase (NICE, 2008). Patients should then be reviewed monthly
and retreated if there are signs of disease in an ‘as required’ phase (pro re
nata or prn). All patients at the ‘base’ hospital (York Teaching Hospital, UK)
were routinely managed in this way with signs of disease activity being
similar to that used in Martin et al’s Comparative Anti-‐VEGF Treatment Trial
(CATT): reduced VA explained by nvAMD, presence of intra or sub retinal
fluid on Ocular Coherence Tomography (OCT) or leakage on FFA (Martin et
al, 2011). Due to capacity limitations assessment intervals beyond the 3
initiation doses were often more than recommended.
To help address the shortfall in capacity and enable care to be given closer
to home 154 patients with 189 treated eyes were identified and had their
care transferred from the base hospital (BH, York Teaching Hospital, United
Kingdom) to the community eye clinic (CEC, The Eye Site Clinic, Bridlington,
UK). The new facility enabled a strict 28-‐day follow up interval to be offered
to all patients.

53
To be eligible for the study patients had to be at least 50 years of age and
have and a fluorescein angiogram confirmed diagnosis of nvAMD. In
addition to this, the patients must have been in the ‘stability phase’ of their
treatment defined as one month after having completed their 3 initiation
treatments with ranibizumab. These three treatments must have been given
at the BH each with an interval of between 28 and 35 days, this range
enabling some routine flexibility in appointments. At the time of the
commencement of the study the CEC had been operating for approximately
6 months enabling 6 visits at this location to be studied. To equate this study
period and so to be included in the study, patients must have attended at
least 12 consecutive visits in their stability phase comprising of 6 visits at
the BH followed by 6 visits at the CEC. It was these visits that formed the
study period.
Some treatment centres perform the assessment at one visit and if
treatment is required bring patients back for treatment on a different day.
This so called ‘two-‐stop’ method enables better capacity planning for the
host organization but is less convenient for patients and causes further
delay in the treatment pathway. Both the BH and the CEC used a ‘one stop’
model enabling assessment and re-‐treatment to be performed at the same
visit.
To be consistent across sites, both locations used routine clinical VA
measurement with the same type of standard ETDRS vision chart (Precision
vision; Ferris & Bailey, 1996). Vision was measured in the affected eye with
the patient’s current spectacle correction to give Best Corrected Visual
Acuity (BCVA). Consistent with routine clinical practice if the spectacle
correction was considered out of date then pinhole visual acuity was used.
Vision was measured at 4 metres in an illuminated room. If the patient was
able to read 4 or more of the five letters on the first line they were asked to
continue reading down the chart until they could read a fewer than three
letters on a single line. At this point the total number of letters read
correctly on the chart was recorded. Given that the measured distance was

54
at 4 metres then an additional 30 letters was added to the score to give a
total ETDRS letter count. If the patient was unable to read 4 letters correctly
on the first line they were brought to 1 metre and were asked to continue
reading down the chart until they could read fewer than 3 letters on a single
line. No additional 30 letters were added in this circumstance. This total
ETDRS score is routinely used as a clinical measurement and was the value
used for the study. Although not using a refracted score, this technique is
similar to that used for many clinical trials such as the REPAIR study (Tufail
et al, 2013b).
An important point to discuss is that although an ETDRS letter score is not
technically a measure of logarithmic acuity (it would need a multiplying by a
quotient of 0.02 to give an equivalent), its use is commonplace and standard
practice for clinical trial use since it 1996 (Ferris and Bailey, 1996)
To ensure consistency between the BH and CEC, the same model of OCT, the
key piece of technology helping to determine disease activity and therefore
governing retreatment decisions, was used at both sites (Cirrus HD OCT
4000, Carl Zeiss Meditec).
In addition to ETDRS visual acuity, the number of injections and the time
interval between visits (in days) were collected. A paired t-‐test was used to
compare the mean BCVA, total number of injections and mean follow-‐up
time between sites. The BCVA at each visit within each centre was compared
with a repeated measures ANOVA. The proportion of patients who gained
and lost 15 ETDRS letters (a figure considered to be ‘significant’ (MPS, 1991)
between sites was compared with a chi-‐square test. The data analysis was
undertaken on SPSS (v18, Chicago: SPSS inc.). A p-‐value of <0.05 was
considered to indicate statistical significance.

55
2.5 Results
After reviewing the records of the 154 patients 72 eyes of 62 patients met
the criteria to be included in this study. There were 45 female eyes and 27
males eyes with mean age of 82.0 years with a range of 60 to 96 years.
The mean follow up time between each visit in the period of study was 56.8
days (range 21 to 288 days) in the base hospital and 31.8 days (21 to 139)
days in the community eye clinic. The mean difference in the follow up
intervals between the base hospital and the community eye clinic was 25.0
days (SD: 14.95) and was significant (t 71=14.08, p<0.0001).
Taking a mean of all the 6 visits in the base hospital the BCVA was 54.49
ETDRS letters (SD=14.02) and 55.69 ETDRS (SD=15.49) letters in the
community clinic. This mean gain of 1.19 ETDRS letters (SD=5.57) after
being moved from the BH the CEC was not significant (p=0.073). In the base
hospital there was a trend of the BCVA to reduce however this did not reach
significance over the 6 visits (-‐1.13 letters; repeated measure test: p=0.871),
however in the CEC there was a significant increase in BCVA over the 6 visits
(+4.61 letters; p<0.001). This change is illustrated in Figure 4.

56
Figure 4. Mean visual acuity with 95% confidence intervals at the 6 visits in
the base hospital and the 6 visits in the community eye clinic. The shaded
area (TRANSFER) represents the time between the last visit at the base
hospital and the first visit at the community eye clinic.
The amount of significant visual gainers (15 ETDRS letter or more) was
statistically greater in the CEC compared with the BH, but the smaller
number of patients experiencing severe visual loss (15 ETDRS letters or
more) did not reach significance. In the BH only 1 eye out of the 72 eyes
(1.3%) had a gain of 15 ETDRS letters during the first six visits compared
with 9 eyes (12.5%) in the community eye clinic (p=<0.001). Seven eyes
(9.7%) lost 15 ETDRS letters in the base hospital compared to 3 eyes (4.1%)
in the community eye clinic (p=0.170).
The mean number of ranibizumab injections in the BH was 3.69 and 3.39 in
the CEC. This was not significantly different (p=0.7). The mean percentage of
patients requiring an injection at the BH was 62% and at the CEC 56%
(Figure 5). The study period was not the same duration in the BH and the
CEC and so adjusting for this, the predicated mean number of injections over
an equivalent 6-‐months period assuming the same injection rate and follow
up intervals, was 2.37 at the BH and 3.9 at the CEC.

57
Figure 5. The percentage of patients receiving a ranibizumab injection for
active nvAMD as a proportion of total assessments per month. For
comparison the mean ETDRS visual acuity is plotted in the same axis. The
shaded area (TRANSFER) represents the time between the last visit at the
base hospital and the first visit at the community eye clinic.
2.6 Discussion
2.6.1 The implications of the Visual Acuity results
The mean change in VA in anti-‐VEGF treatment-‐naïve patients demonstrates
a very characteristic response curve (Brown et al, 2006; Rosenfeld et al
2006). It can be considered to have an ‘initiation phase’ whereby there is a
rapid gain in VA in response to the first 3 treatments, followed by a ‘stability
phase’ during which the VA remains stable or at least there is not such a
dramatic change with monthly or prn dosing.
The ANCHOR and MARINA studies provide good examples of this stability
phase, in which there was a only a slight change of +1.3 letters between
month 3 and 12 when fixed monthly dosing was used (Brown et al, 2006;

58
Rosenfeld et al, 2006). In the large randomized study of the use ranibizumab
or bevacizumab, The Comparison of AMD Treatment Trial (CATT), a 2.4
letter gain in the fixed arm and 1.2 letter gain in the prn arm was
demonstrated in the equivalent stability phase (Brown et al, 2011).
It is important to distinguish between the initiation and stability phases
because the VA is influenced by different factors in these different phases.
During the initiation phase the gain in VA is considered to be primarily a
response to treatment. It is however, influenced by both patient and
treatment factors. Patient factors include CNV lesion type, (as defined by
angiography and demonstrates a greater increase in VA with classic lesions
rather than occult ones) (Brown et al 2006, Rosenfeld et al, 2006), and delay
in presentation (which may lead to more irreversible structural changes
such as fibrosis) (Kelly & Barua 2011). In fact delay is considered so
important on the final outcome the Royal College of Ophthalmologists have
developed guidelines recommending that time from presentation to
treatment should be no longer than 2 weeks (RCOphth, 2007). Ironically
treatment of CNV lesion very early in their evolution may lead to a ceiling
effect of VA gain: a patient with near normal starting VA will not have the
same potential to gain as many letters as a patient with significantly reduced
VA (Ross et al 2014). Treatment factors include the type and frequency of
anti-‐VEGF used (slight numerical difference between ranibizumab and
bevacizumab seen in the CATT trial, and between ranibizumab and
aflibercept in the VIEW study) (Martin et al, 2011; Schmidt-‐Erfurth et al,
2014).
The VA change within the stability phase can be considered as a marker of
disease control. Like the initiation phase outcomes, it is also influenced by
patient factors such as lesion type (Brown et al, 2006; Rosenfeld et al, 2006)
and smoking, (Klien, Knudtson, Cruickshanks. & Klein 2008). Treatment
factors are also particularly important, such as the regularity of follow up
and how much tolerance of signs of activity of the nvAMD is allowed. The

59
monitoring of VA in the stability phase can therefore reflect the quality of a
wet macular degeneration service. The results of this study support this
statement: there was an improvement in 4.61 letters over a 6 month period
when the mean time interval between assessments was reduced from
approximately 8 weeks to 4 weeks and so demonstrated an improvement in
the quality of the service. The number of individuals with severe loss of
vision can also be a marker of the quality of a service as discussed by Kelly
in his review of safety incidents for vascular endothelial growth factor
inhibitors, in which he reports 43% of incidents, mainly of severe visual loss,
were due to delay in treatment (Kelly & Barua, 2012). Our study
demonstrated fewer individuals losing 15 letters of more (7 compared with
3), although this did not reach statistical significance. ‘Significant’ gain in VA
also reflects the quality of a service; in our study a gain of 15 ETDRS letters
in the 2 periods of study was more in the CEC than the BH (9 versus 1).
The results of this study reflect conclusions that can be drawn from other
studies that have discussed the importance of the follow–up or retreatment
interval. Dagostar reported in a retrospective interventional cases series of
131 patients, that eyes receiving injections less than 2 months apart gained
a mean of 2.3 lines of vision at month 6 compared with those receiving
injections less frequently only gaining 0.46 lines. Similarly 3.1% of the
frequent group experienced severe visual loss compared with 15.9% of the
less frequent cohort (Dagostar, Ventura, Chung, Sharma & Kaiser, 2009). The
retrospective nature of this study, like ours, is open to bias but adds to the
argument that fewer treatments result in worse VA. The prospective
randomized controlled design of the PIER study, showing declining VA in the
stability phase with a mean loss of 0.2 letters from baseline at 12 months,
when quarterly injections of ranibizumab following 3 initiation treatments
are given adds further weight to this argument (Regillo et al, 2008).
The results of our study revealed a surprisingly large range of follow up
intervals in both groups. The reasons for this included patients’ wishes,
failure to attend and administration errors.

60
The percentage of patients requiring an injection per visit was reduced
when the follow up interval was reduced to every 4 weeks. The predicted
total number of injections over an equivalent 6-‐months period however,
was higher at 3.90 in the CEC compared with 2.37 at the BH. This finding
that a higher injection rate leads to a higher VA is again in keeping with
Dagostar’s finding. (Dagostar et al, 2009).
Although this study is open to bias due to different members of the clinical
staff performing assessments this bias is limited due to each member of staff
having undertaken training by the same team and working cross-‐site. To
draw a more definitive conclusion on the benefit of following individuals at
either 4 or 8 weekly intervals a prospective trial randomising to these
groups after 3 initiation doses would be required. The cost involved in such
a study and the realisation that the results would be non ‘real world’ data
would have to be taken into consideration if such a study were to go ahead.
2.6.2 The use of visual acuity as a measurement tool
Visual acuity is a measure of the spatial resolution of the visual processing
system and is dependent of the entire visual pathway. The commonest way
of measuring visual acuity in the clinical setting is with an optotype chart,
usually of the Snellen type. The Early Treatment Diabetic Retinopathy Study
(ETDRS) chart is now the recommended standard for measuring visual
acuity in the clinical trial setting (Ferris, Kassoff, Bresnick & Bailey, 1982;
Ferris & Bailey, 1996). Most clinical studies now use this modified
logarithmic chart, which has Sloan letters equally spaced across the chart
and 5 letters per line (Bressler et al, 2001; Brown et al, 2006; Rosenfeld et
al, 2006; Martin et al 2011, Martin et al 2012).
The use of visual acuity as a measure of vision has many advantages and
disadvantages. The principle advantages of the ETDRS chart are that it is a
relatively quick and easy way of estimating visual performance, typically

61
taking 2-‐3 minutes in a literate individual and being performed by a
member of staff that requires relatively little training. In addition a letter
score gives a numerical value making descriptive and inferential statistics
possible. It is possible therefore to perform power calculations to set
endpoints and to perform statistical evaluations of interventions in clinical
trials.
Care should be given to measure Best Correct Visual Acuity (BCVA); the best
possible measured vision with the use of spectacle correction if necessary.
Most high quality clinical trials that use VA as an endpoint mandate
refraction (that is the measurement for glasses) at each point of VA
assessment (Brown et al, 2006; Rosenfeld et al 2006; Martin et al, 2011).
Refraction is not routinely performed at each visit in clinical practice
though, as it takes approximately 20 minutes of an optometrist’s or
ophthalmologist’s time. It follows on that ‘real world’ studies do not use
refracted VAs at each visit. In real world studies if the subject has recently
been refracted then this prescription should be worn. In the unusual event
when the subject has forgotten their glasses the use of pinhole vision can be
tried. Looking through pinholes corrects some refractive error but can make
measured vision worse in people with macular disorders so may be no
better than unaided vision (Walker, Hall and Hurst, 1990).
Patients with vision on the borderline of being able to use the ETDRS chart
at 4 metres, that is whether they can see 4 letters on the first line and or
cannot and so have to be moved to 1 metre, often demonstrate widely
fluctuating measured VA on successive visits when there is no symptomatic
or anatomical evidence for this to be so. Experience from this study, and
clinical practice, shows that when the 1 metre chart is used measured vision
is often substantially worse and can therefore appear to ‘fall of a cliff’. This
phenomenon requires further investigation, but may be explained by the
additional effort, either on the part of the subject or the person assessing the
VA, that is required to read more letters on the 1 metre chart to achieve a
lower VA score than would be required for a higher score on the 4m chart.

62
This ‘cliff’ effect could artificially magnify the gain in visual acuity arising
from therapeutic agents and may have led to an overestimate of the
proportion of patients gaining 15 ETDRS letters. As was discussed in the
original description of the ETDRS chart by Ferris in 1982, the chart could
have been used at 2 metres, allowing for a range of acuities more
appropriate to our cohort to be captured without having change the chart
distance (Ferris et al, 1982).
The testing conditions should remain constant across multiple visits: the
exact testing distance from patient to chart, the luminance of the chart (to
ensure that contrast is consistent) and ambient lighting (which affects pupil
size and therefore the degree of aberrations).
Even with a very consistent testing environment there have been well-‐
documented variations in measured visual acuity. Patel et al reported on 90
fellow (non-‐treated) eyes in patients undergoing treatment for CNV with
bevacizumab. He stratified the extent of fellow AMD into early, intermediate
and late categories; these categories were discussed in chapter 1. It was
demonstrated, by using coefficient of repeatability (CR, a measure of test-‐
retest repeatability defined by Bland and Altman as the mean +/-‐1.96
standard deviations), that a 12-‐letter difference was noticed over the study
period of 4 measurements in 12 weeks. (Bland & Altmann, 1986) This was
refined to 10 letters after excluding patients who were tested at different
distances. Worse visual acuity demonstrated a worse coefficient. The
coefficient was similar when measured at an interval of a week compared
with the 4 weeks. (Patel, Chen, Rubin & Tufail, 2008).

63
All visits (n) Baseline and week one
only (n)
Early AMD 9 (29) 9(29)
Intermediate AMD 10 (36) 8(36)
Late AMD 17 (25) 15(25)
Total 12 (90) 11(90)
Table 3. The mean coefficient of repeatability by diagnosis, from Patel et al
2008.
Recently Aslam et al at has suggested that the repeatability may even be less
than this, finding a coefficient of 14.9. The test-‐ retest period was 4 weeks on
this occasion and used similar methodology to Patel of low background
luminance, ‘precision vision’ charts with illumination tubes that had been
‘burnt in’ for 96 hours and measured refracted VA (Aslam et al, 2014; Patel
et al 2008). This discussion about the lack of repeatability of VA
measurement is not a new one; an analysis of the Macular Photocoagulation
study found a standard deviation of 4.7 letters between baseline and week
one in a cohort of 60 nvAMD patients (Blackhurst & Maguire, 1989).
Our study did not use clinical trial standards but ‘real world’ measurements.
Optometrists did not perform visual acuity testing and refracted vision was
not obtained, although there were as many constants as possible applied
such as testing distance and background illumination; inevitably measured
VA will not be as accurate as clinical trial standards. A higher degree of
variability or reduced repeatability would therefore be anticipated. The
coefficient of repeatability has yet to be studied in the ‘real world’ situation.
The reasons for the high variability between visits can be many fold:
unexpected differences in the testing environment such as the vision alley
and its background illumination, the subjects general health, how much the
observer encourages the subject, and the visual ‘cliff effect’ for example.
Furthermore following damage to the fovea the development of new, or

64
multiple or variable areas of preferred fixation (preferred retinal loci or
PRL, which is different to the area of highest retinal sensitivity) could help to
explain this variation (Shima, Markowitz & Reyes, 2010). The concept of
developing of new PRL’s in a short period of time has been disputed
following a short-‐term study observing for the area of fixation before and
after 3 treatment with ranibizumab in previously treatment–naïve patients
(Gonzalez, Tarita-‐Nistor, Mandelcorn, Mandelcorn & Steinbach, 2011).
The documented coefficient of repeatability makes a single point-‐to-‐point
visual acuity change in an individual difficult to interpret as a measure of an
outcome of treatment. Therefore VA should not be used as an absolute
measure in this circumstance. When cohorts are studied and mean VAs are
calculated these fluctuations are decreased, and so it is appropriate to use
VA as an outcome measure. The study of the cohort of patients in this
chapter has demonstrated this. Furthermore, the use of mean change in
visual acuity and the change in visual acuity in the stability phase is
particularly useful. Mean VA is one of the commonest endpoints for clinical
trials in this field. Some examples are the mean VA gain at 12 months in the
‘as required’ treatment arms of the CATT, IVAN and PRONTO clinical trials
being reported as 6.8, 7.2, and 9.8 letters respectively (Martin et al, 2012;
Chakravarthy et al, 2012; Fung et al, 2012). Similarly, mean VA is used as an
outcome measure in ‘real world’ studies: Querques reports +9.0 at 24
months, Michalova +5.5 at 12 months, Rostos +4.6 at 13.6 months,
Rothenbuhler +7.3 at 24 months, Ross +2.4 at 24 months, and Kang +7.9 at
12 months. (Querques, et al 2010; Michalova et al 2009: Rostos, Patel, Chen
& Tufail, 2010; Rothenbuhler et al, 2009; Kang & Roh, 2009). Clinical trial
reporting should also include change in visual acuity in the stability phase.
Recently Ross and colleagues have questioned the use of the full cohort VA
measurement as an appropriate VA outcome. Following a large
retrospective, real world cohort that subdivided patients into starting VA
categories, it was shown that those with worse baseline vision gained most
vision, beyond the ‘ceiling effect’ (Ross et al, 2013).

65
So far these discussions have demonstrated that although there are
advantages of using VA as an outcome measure for nvAMD treatment
studies there are also significant difficulties especially for individual point-‐
to-‐point measurement. A further point of discussion is how well visual
acuity represents visual function.
Mean distance VA outcomes do appear to broadly reflect what many
patients informally communicate in the early part of their disease journey,
that initially there is an improvement in vision and thereafter stability is
reached. Once in the stability phase however, patients often do not report a
change in vision when there is variation in point to point measured VA. This
leads to discussion as to whether this measured change in VA is a true
reflection of change in vision or visual function. Certainly there is good
evidence that VA loss is associated with loss of day to day function: Scott
reported on a cohort of 86 consecutive patients at the Wilmer Institute,
Baltimore, of which 51 had normal visual acuity, and demonstrated that 2
quality of life questionnaires, the vision-‐specific Sickness Impact Profile and
the Community Disability Scale did independently predict visual acuity
(Scott et al, 1994). Similarly, a study of randomly selected participants in
Maryland USA reported functional loss correlated with VA loss of 6/12 or
more (West et al, 1997). This loss of function is also observed when macular
degeneration is the cause: Mangione reported on 201 participants with AMD
and noted that AMD did reduce quality of life based upon the Activities of
Daily Living scale, however concluded that the clinical grading of the AMD
did not explain the significant variation in visual function (Mangione et al,
1999). Hazel studied 28 participants with acquired macular disorders and
concluded that although high contrast tests such as conventional distance
VA measurement did correlate with performance loss as measured by vision
related quality of life questionnaire, low contrast tests and reading speed
better correlated with self-‐reported problems and visual concerns (Hazel,
Petre, Armstrong, Benson, Frost, 2000). This finding was supported by
McClure, who demonstrated in 100 patients with AMD that a combination of
66
reading index and distance VA had the best correlation with ‘Daily Living
Task Dependent upon Vision’ visual function index (McClure, Hart, Jackson,
Stevenson & Chakravarthy, 2000). Adding weight to this argument,
Bansback reports a better correlation of quality of life utility with contrast
sensitivity than distance visual acuity in 209 participants with either
unilateral or bilateral AMD (Bansback, et al 2007). In the same cohort as he
used to study the coefficient of variability of VA measurement, Patel also
demonstrated that there was greater gain in contrast sensitivity using a
Pelli-‐Robson Chart than ETDRS VA in the bevacizumab treated arm (Patel,
Chen, Da Cruz, Rubin & Tufail, 2011).
So there is good documentation that VA alone can underestimate visual
function. Frisen provides a good neuro-‐retinal explanation for this in a study
of micropsia (perception of images to be smaller than they are) in macular
oedema. Using quantitative assessment of micropsia as a sensitive indicator
of photoreceptor displacement, it was estimated that only 44% of the
normal neuro-‐retinal channels were required to give 6/6 (‘normal’) VA
(Frisen & Frisen, 1979).
2.7. Conclusion
This chapter set out to assess the value of VA as an assessment tool for the
outcome of treatment of nvAMD. It aimed to do this as a part of a study
assessing the impact of normalising the re-‐assessment intervals of a cohort
of individuals in the process of a nvAMD clinical service redesign.
The study demonstrated that during the stability phase of treatment
reducing re-‐assessment intervals from 8 to 4 weeks resulted in an
improvement of VA and that more treatments were given.
Using VA as an end point has advantages; it is quick and gives a numerical
score that is easily interpreted statistically. The drawbacks are that it is
tempting to translate the letters scores into accurate clinical outcomes. It is

67
clear from the experience of study and the work of others (Patel et al, 2008;
Aslam et al, 2014) that use of VA as a surrogate marker of visit-‐to-‐visit
disease activity accurate enough to base retreatment decision upon is
inappropriate. It is surprising that national clinical guidelines have
recommended retreatment based upon a loss in measured visual acuity
letters alone: the NICE retreatment guidance of a loss of 5 letters for
treatment of nvAMD with ranibizumab following 3 initiation treatments.
(NICE TA155). Visual acuity can be a very useful tool in estimating the
outcome of treatment of nvAMD but needs to be selected appropriately for
what it is intended to be a surrogate for. Assessing the mean response of VA
in cohorts, where variation is balanced amongst the participants is a much
more appropriate use of this outcome.
With the knowledge that measuring VA change underestimates the change
in visual function and the ability to perform visually dependent tasks
(Mangiona et al, 1999; Hazel et al, 2000; Bansback et al 2007: Patel et al,
2011), better ways of assessing outcomes are required. This thesis goes on
to explore some objective and subjective ways of assessing outcomes in
order to address this need.

68
Chapter 3. Visual acuity and Ocular Coherence Tomography as
Outcome measures of anti-‐VEGF treatment of Pathological Myopia
associated Neovascular Macular Degeneration
3.1 Introduction
The previous chapter studied the effect of shortening reassessment
intervals in patients receiving ranibizumab therapy for AMD complicated by
a choroidal neovascular membrane (CNV). Visual acuity alone was used as
an outcome measure of success of treatment and the merits and
disadvantages of which were discussed. This chapter investigates the used
of ranibizumab therapy to treat CNV secondary to myopia, and furthermore
uses both visual acuity and OCT as measurement tools.
3.2 Background
Myopia, defined as a refractive error of -‐0.5 Dioptres or more affects
approximately 1 in 3 people (Wolfram et al, 2014). Myopia is only defined
as pathological however, when the refractive error is greater than 6
Dioptres and is accompanied by characteristic clinical features giving rise to
an increased risk of visual loss. Pathological myopia (PM) is a principle
cause of blindness in developed countries affecting 2–4% of Caucasians and
9–21% of Asian populations (Montero et al, 2010; Soubrane, 2008; Chan,
Ohji & Lai, 2005). Choroidal neovascularization is the most common cause
for the irreversible central vision loss that occurs in patients with
pathological myopia. The natural history defines that approximately 90% of
patients with myopic CNV (mCNV) will have visual acuity at 6/60 or less
within 5-‐10 years of developing the complications, that the prevalence in
PM is 4-‐11% and that those 50 years or younger will be predominantly
affected. (Yoshida, Ohno-‐Matsui & Yasuzumi, 2003). The chance of the
fellow eye being affected is high with around a third being affected within 8
years (Ohno-‐Matsui, Yoshida & Futagami, 2003).

69
3.2.2 Treatments for Choroidal Neovascular Membrane associated
Pathological Myopia
3.2.2.1 Laser based therapies
Thermal laser, typically administered with an argon laser, is no longer
considered as a useful treatment in the majority of patients. Because the
wavelength of the laser causes collateral damage to the neurosensory
retina, retinal pigment epithelium and choroid, treatment of subfoveal
lesions induces severe immediate visual loss. Treatment of juxtafoveal
lesions (within 200 microns of the centre of the fovea) and extra-‐foveal
lesions (greater than 200 microns) is complicated by a high recurrence rate
and long-‐term expansion of the laser scar that can creep over many months
and years to involve the fovea (Chan et al, 2005; Secretan, Kuhn, Soubrane &
Coscas, 1997). Those lesions that are so extrafoveal that they are
asymptomatic can often be observed and may do well without intervention.
Transpupillary thermotherapy (TTT) uses diode laser and is less
destructive to surrounding healthy tissues because its emission wavelength
is close to infrared on the electromagnetic spectrum. It has low absorption
by xanthophyll (a key macular pigment) and haemoglobin, so minimising
nerve fibre layer damage, and allowing treatment through obscuring
haemorrhage (Berger, 1997). Initial studies using photocoagulation in age-‐
related CNV showed it to be effective demonstrating angiographic closure of
the CNV in 7 or 9 eyes 40 weeks following 1 or 2 treatments (Ulbig, McHugh
& Hamilton, 1993). Specifically for PM associated CNV, it has been shown to
stabilise vision in about 2/3 of 74 cases that were studied retrospectively,
with only 8% improving vision and the rest losing at least 0.1 LogMAR units
of VA (Nabawi & Shaarawi, 2001). Following further reports of safety
concerns such as macular infarction and poor efficacy, the National Institute
for Health and Clinical Excellence (NICE) have not recommended its use
outside of special arrangements for research (Benner, Ahuja & Butler, 2002;
NICE, 2004).

70
3.2.2.2 Verteporfin-‐ photodynamic therapy
Photodynamic therapy (PDT), using verteporfin was the mainstay of
treatment until injectable treatment started being used. As with the use of
TTT, the majority of study of PDT has been in age-‐related CNV, with the
results being extrapolated to PM associated disease. In nvAMD at best PDT
slowed down the progression of visual loss. Data from a large multinational,
randomized clinical trial demonstrated a significant benefit for PDT over
sham therapy for the primary end point of prevention of loss of 8 or more
ETDRS letters (considered to be clinically significant vision loss, 72% versus
44%; p<0.01), but this effect was lost after 2 years (64% versus 49%
p=0.11, Blinder, Blumenkranz & Bressler, 2003). Hayashi, when comparing
bevacizumab with PDT in a consecutive group of 75 patients for mCNV
demonstrated a significantly better VA in the former group at 12 months
(Hayashi et al, 2009). Similarly in 31 patients receiving either bevacizumab
or PDT, the PDT group demonstrated a mean worsening of VA after 12
months with significantly worse vision at 24 months (Ikuno et al, 2010).
The results of the RETAIN study, a large multinational prospective
randomised trial comparing ranibizumab and PDT is awaited.
3.2.2.3 Anti-‐ Vascular Endothelial Growth Factor therapies
Based on landmark trials (ANCHOR, MARINA, CATT, and ABC trials), and
clinical experience of treating patients with CNV secondary to AMD,
ophthalmologists began to use anti-‐VEGF agents such ranibizumab and
bevacizumab in an ‘off-‐label’ manner to treat CNV secondary to PM (Brown
et al, 2006; Rosenfeld et al, 2006; Chakravarthy et al, 2012; Tufail et al,
2010). Small case series showed promise for these anti-‐VEGF agents in
being able to substantially outperform PDT. Although different designs and
durations, they report gains in VA letters with ranibizumab therapy. Silva
reports a mean improvement from 20/100 to 20/50 at 6 months in 26 eyes,
15 of which were treatment naïve. (Silva et al, 2008). At the Jules Gonin
University Eye Hospital a case series of 14 eyes demonstrated a mean VA

71
imporvment of 0.48 log-‐MAR (Konstantinidis, Mantel, Pournaras, Zografos,
Ambresin, 2009). Mones et al reported on 23 eyes treated with a mean of
1.52 ranibizumab injections over 12 months gaining a mean of 9.5 letters
(Mones, Amselem, Serrano, Garcia & Hijano, 2009). Another report on 16
eyes showed a mean gain of 3 letters at 12 months (Lai, Chan, Liu, Lam,
2009). Reviews are supportive of anti-‐VEGF therapy for CNV secondary to
PM (Cohen, 2009; Ng, Kwok & Chang, 2012).
3.3 The aims of this study
The aim of this study is to evaluate the treatment of CNV secondary to
pathological myopia with ranibizumab and to assess visual acuity as a
functional measure and OCT as an anatomical measure of outcome.
At the time of performing this study no randomised controlled trials
comparing ranibizumab and the PDT existed. Although ideally randomized
controlled trials were needed to confirm results many retina specialists
perceived that a PDT arm would be clearly inferior. It was felt that a case
series demonstrating an increase in visual acuity in the context of well-‐
documented natural history studies (Silva et al, 2008; Konstantinidis et al,
2009: Mones et al, 2009, Lai, 2009) showing that untreated myopic CNV
results in a mean loss of VA would be a robust study design.
3.4 Methods
Approval was granted from the relevant ethical bodies for this study and it
was performed in accordance with the Declaration of Helsinki and Good
Clinical Practice. It was registered at ClinicalTrials.gov, identifier:
NCT01037348.

72
3.4.1 Patient selection
To be included in the study patients had to be aged 18 years or more and
have active primary or recurrent CNV secondary to PM. The lesion could be
either in a subfoveal or juxtafoveal location, but a best-‐corrected visual
acuity (BCVA) score of 24–78 Early Treatment Diabetic Retinopathy Study
(ETDRS) letters was required. PM was defined as having a spherical
equivalent of –6 Dioptres or more (or an axial length of 21mm or more on
A-‐scan if this was unavailable), with characteristic chorioretinal changes.
In order to see the effect of the medication on the single pathology of CNV
secondary to PM, patients were excluded if they met any of the criteria
outlined in Table 4.
Surgical intervention in the study eye within 2 months of the screening
visit
Current or previous macular laser photocoagulation
Treatment with intravitreal steroids, verteporfin-‐PDT or anti-‐VEGF
agents in the study eye
Prior treatment in the study eye with vitrectomy or transpupillary
thermotherapy
Those with current use or likely need for systemic medications known to
be toxic to the lens, retina or optic nerve e.g. ethambutol, desferoximine
Concurrent use of systemic anti-‐VEGF therapy or previous treatment
with intravenously administered bevacizumab
Concurrent use of chronic non-‐steroidal anti-‐inflammatory drugs
(NSAIDs) for more than 7 consecutive days
Systemic or topical ocular corticosteroids for ≥ 3 consecutive days within
6 months prior to baseline
CNV from causes other than pathological myopia

73
Table 4. Patients were excluded from enrolment to the PM treatment study
if they met the above criteria.
At Visit 1 (Baseline) all criteria for inclusion and exclusion were confirmed.
3.4.2 Ranibizumab dosing regimen
All study participants received one initial intravitreal injection of
ranibizumab at visit 2. A qualified ophthalmologist experienced in
intravitreal procedures administered this. A dose of 0.5 mg in 0.05 mL
ranibizumab in solution was chosen as this reflected the product labeling
for treatment of AMD (Summary of Product Characteristics (SmPC), 2007)
and that used the recent case-‐series mentioned above (Silva et al, 2008;
Konstantinidis et al, 2009; Mones et al, 2009, Lai, 2009).
The need for re-‐treatment was assessed at each subsequent visit (visit
numbers 3-‐13) and was determined by a flow chart used set out in Figure 6.
This was an ‘as needed’ (Pro Re Nata or prn) regimen with re-‐treatment
largely determined by BCVA, symptoms and spectral domain Optical
Coherence Tomography. A reduction in BCVA, symptoms of increased
blurred vision or increased metamorphopsia were used as surrogate
markers of the activity of the CNV. Visits were no more frequent than every
28 days.
1. Is there evidence of sub retinal or intra retinal fluid on the OCT?
YES-‐ Retreat
NO-‐ Go to question 2.
2. Has the patient had a decrease in BCVA by 5 letters or more or
experience increased blurring or metamorphopsia?
YES-‐ Go to question 3.

74
NO-‐ No treatment and monitor in 1 month
3. Is there leakage on Fundus fluorescein angiography?
YES-‐ Retreat
NO-‐ No treatment and monitor in 1 month
Figure 6. The algorithm used to determine retreatment in the PM treatment
study.
3.4.3 Outcome measures
Best corrected visual acuity (BCVA) and OCT determined centre point
thickness were the principle outcome measures for this study.
BCVA assessment required the patient to be refracted by a certified
optometrist at each visit. Initial testing was done at a distance of 4 meters.
All letters were counted until fewer than 3 letters were read on a line. This
number was then added to 30 to give the total letter score. If 4 letters could
not be read on the first line then the distance was reduced to 1 meter and
the total letter score equaled the total number of letters read.
Spectral domain OCT was performed on both eyes at each study visit prior
to study drug administration, and a central macular cube of 512 A scans and
128 B scans was acquired through dilated pupils. Central macular thickness
(centre point thickness) was recorded.
3.4.4 Endpoints
3.4.4.1 Primary endpoint
The mean change in BCVA from baseline to month 12 was the primary
endpoint of this study.

75
3.4.4.2 Secondary endpoints
The secondary endpoints were the evaluation of the mean change in central
macular thickness from baseline to month 12, the total number of
treatments, the change in proportions of eyes with retinal fluid, and the
safety of intravitreal injections of ranibizumab.
As with all clinical trials, safety data were collected. With regards to the
secondary endpoint only serious adverse events (SAEs) were analysed.
Events which are life threatening, fatal or which result in persistent or
significant disability including a congenital birth defect, or that require
inpatient hospitalization constituted the definition of an SAE.
3.4.5 Statistical analysis
The Mones study, reporting on the follow up of 23 eyes treated with
ranibizumab at 12 months helped determine the required sample size
(Mones et al, 2009). To detect a difference in mean BCVA of 10 letters, a
sample size of 58 was calculated to have 90% power to detect mean change
of 10 letters from baseline to month 12. This assumed a standard deviation
of differences of 23, using a paired t-‐test with a 0.05 two-‐sided significance
level. An expectation of approximately 10% drop out was allowed for,
requiring a total of 64 eyes of 64 patients to be enrolled.
Data from all participants were analysed as long as they received at least
one study injection of ranibizumab and had at least one further assessment
of BCVA using the last-‐observation-‐carried-‐forward and intent-‐to-‐treat
principles. Likewise safety was assessed for all patients who received at
least one application of study treatment and had at least one post-‐baseline
safety assessment.
Descriptive statistics for absolute values and changes from baseline were
reported for each endpoint. For the McNemar tests (used to analyse the

76
qualitative aspects of the OCT) the category 'Questionable' was included
with the 'Definite' category. Missing values (N/A) were excluded.
Due to the infrequency of the disease, only 7 participants were expected to
be recruited into the study locally. To enable the recruitment target to be
met 12 sites across the UK participated in the study. Correlation coefficients
were calculated between the local and UK cohorts. A two-‐tailed probability
was calculated an P <= 0.05 was taken as statistical significance.
3.5 Results
3.5.1 Demographic and baseline characteristics
In total, 7 participants were recruited locally and 65 throughout the UK. 62
patients completed the study, 1 withdrew due to an unsatisfactory
therapeutic effect, 1 was withdrawn due to a protocol violation and 1 was
lost to follow up. None of these 3 participants were in the local cohort.
Demographic data are presented in Table 5. Most participants were
Caucasian (90.8%), female (70.8%) and aged younger than 65 years
(76.9%).

77
Mean age, years (SD) 55.5 (14.97)
Age distribution, n (%)
< 50 years
50 to < 65 years
65 to < 75 years
75 to < 85 years
> 85 years
21 (32.3)
29 (44.6)
10 (15.4)
3 (4.6)
2 (3.1)
Gender, n (%)
Female
Male
46 (70.8)
19 (29.2)
Predominant race n (%)
Caucasian
Other
59 (90.8)
6 (9.2)
Table 5. Participant demographic data in the PM treatment study.
3.5.2 Primary endpoint
The mean BCVA increase for the local cohort of 7 participants was +16.5
letters (SD = 11.2, p <0.01, Paired T-‐test) over 12 months (Table 6 and
Figure 7). The greatest improvement was seen following the initial
treatment (+14.6 letters).

78
Visit Number
Mean VA (SD, ETDRS letters)
Mean CRT (SD,
μm)
1 (Baseline) 55.7 (12.2)
381 (113.6)
2(Mandatory
treatment)
70.3 (13.6)
282 (33.3)
3 71.2 (10.1)
273 (30.6)
4 69.1 (10.5)
260 (35.5)
5 74.6 (12.0)
261 (36.9)
6 74.4 (10.5)
261 (29.8)
7 74.0 (11.6)
255 (21.8)
8 73.3 (8.9)
243 (37.7)
9 69.9 (14.3)
272 (74.4)
10 70.0 (9.7)
271 (71.4)
11 74.4 (9.8)
260 (56.7)
12 70.4 (12.7)
268 (95.2)
13 74.9 (10.2)
269 (96.3)

79
Table 6. The mean (standard deviation) BCVA (ETDRS letters) and CRT
(micrometres) for the local cohort of 7 participants in the PM treatment
study. Figures are given for assessments at baseline, the mandatory
treatment and subsequent as required visits.
Figure 7. The mean (standard deviation) visual acuity for the local cohort of
7 participants in the PM treatment study. All 7 participants contributed to
the mean at each visit. Visit number is displayed on the X-‐axis and absolute
ETDRS BCVA on the Y-‐axis.
Analysing the whole UK cohort of patients, the mean VA improvement from
baseline was 13.8 (SD=14.0, p<0.001, Paired T-‐test Figure 8). The greatest
improvement was observed in the first month of treatment (mean change,
8.7 letters p<0.001); this was increased slightly throughout the 12-‐month
period.
0
10
20
30
40
50
60
70
80
90
100
1 2 3 4 5 6 7 8 9 10 11 12 13
Mean (SD) ETDRS letter score
Visit Number

80
Visit number
Mean VA (SD, ETDRS letters)
Mean CRT (SD,
μm)
1 (Baseline) 59.5 (13.6)
384.7 (130.9)
2(Mandatory
treatment)
68.5 (13.6)
280.6 (89.7)
3 70.3 (13.0)
277.1 (87.2)
4 69.3 (13.2)
269.3 (80.6)
5 71.0 (13.7)
252.3 (77.3)
6 69.6 (14.3)
257.2 (76.5)
7 70.7 (15.5)
256.7 (82.7)
8 71.4 (14.4)
262.2 (87.7)
9 72.2 (13.9)
253.6 (83.8)
10 72.8 (14.4)
256.5(85.2)
11 73.5 (13.3)
249.8 (79.5)
12 72.6 (14.8)
248.7 (80.8)
13 73.0 (13.3)
251.4 (78.1)

81
Table 7. The mean (standard deviation) BCVA (ETDRS letters) and CRT
(micrometres) for the UK cohort of 62 participants in the PM treatment
study. Figures are given for assessments at baseline, the mandatory
treatment and subsequent as required visits.
Figure 8. The mean (standard deviation) visual acuity for the UK cohort of
62 participants in the PM treatment study. Visit number is displayed on the
X-‐axis and absolute ETDRS BCVA on the Y-‐axis.
3.5.3 Secondary endpoints
The local cohort of participants demonstrated a mean reduction in CRT of
116 (SD=72, p<0.001, Paired T-‐test) microns over the 12-‐month study
period with the greatest reduction of 99 microns being observed after the
initial treatment (Table 3 and Figure 4). The SD increases from visit 9
onward due to a single outlying result.
0 10 20 30 40 50 60 70 80 90 100
1 2 3 4 5 6 7 8 9 10 11 12 13
Mean (SD) ETD
RS letter score
Visit Number
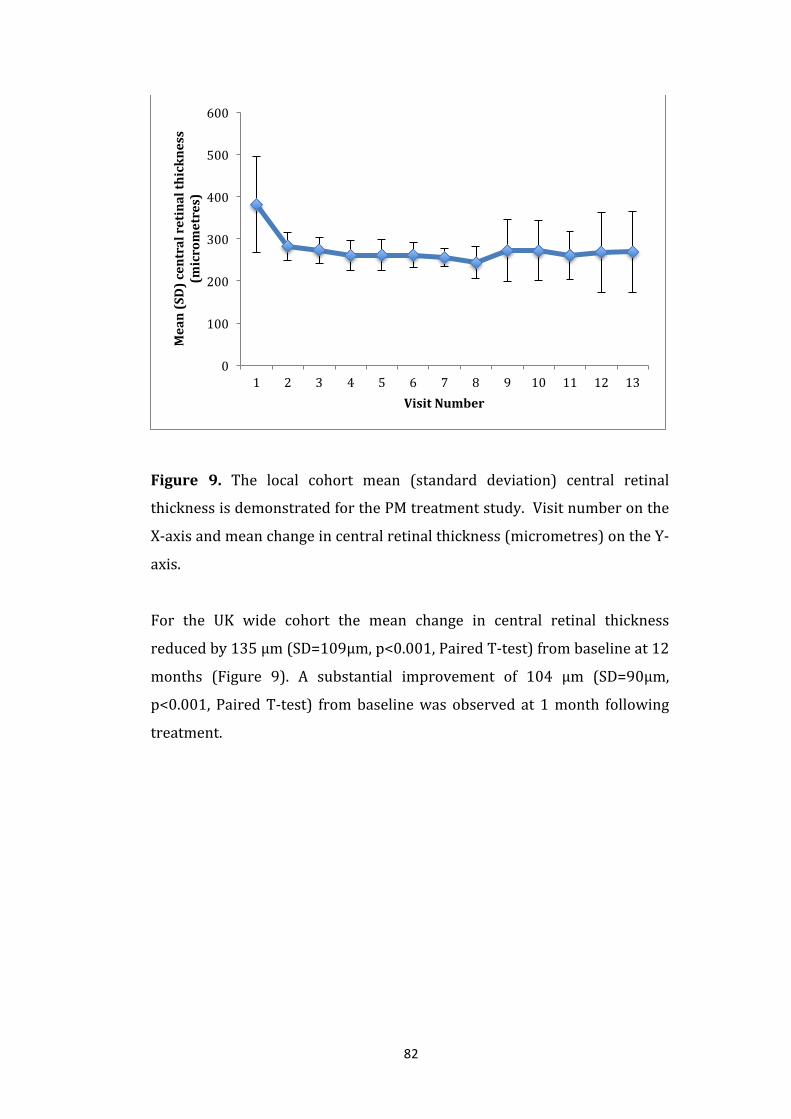
82
Figure 9. The local cohort mean (standard deviation) central retinal
thickness is demonstrated for the PM treatment study. Visit number on the
X-‐axis and mean change in central retinal thickness (micrometres) on the Y-‐
axis.
For the UK wide cohort the mean change in central retinal thickness
reduced by 135 µm (SD=109µm, p<0.001, Paired T-‐test) from baseline at 12
months (Figure 9). A substantial improvement of 104 µm (SD=90µm,
p<0.001, Paired T-‐test) from baseline was observed at 1 month following
treatment.
0
100
200
300
400
500
600
1 2 3 4 5 6 7 8 9 10 11 12 13
Mean (SD) central retinal thickness
(micrometres)
Visit Number

83
Figure 10. The UK cohort mean (standard deviation) central retinal
thickness is demonstrated for the PM treatment study. Visit number on the
X-‐axis and mean change in central retinal thickness (micrometres) on the Y-‐
axis.
For the UK cohort, participants received a mean number of 3.6 treatments
and thus a mean of 2.6 re-‐treatments was required after the prescribed first
treatment. The median number was 3. The corresponding figures for the
local cohort are 3.3, 2.3 and 2 treatments.
Qualitative analysis of the OCT images demonstrated that following
treatment with intravitreal ranibizumab, as a proportion of eyes, subretinal
fluid decreased from 67.7% to 7.7% (p<0.001, Paired T-‐test), intra-‐retinal
cysts decreased from 52.3% to 13.8% (p<0.001, Paired T-‐test) and diffuse
retinal oedema (DRE) decreased from 87.7% to 7.7% (p<0.001, Paired T-‐
test).
Three SAEs were reported in the UK wide series. There was one ocular SAE,
a case of culture negative endophthalmitis (considered to be related to the
0
100
200
300
400
500
600
1 2 3 4 5 6 7 8 9 10 11 12 13
Mean (SD) central retinal thickness
(micrometres)
Visit Number
84
injection technique), which occurred in the local cohort. In addition, there
were three non-‐ocular SAEs. There were two hospitalizations, one because
of joint dislocation and the other because of pre-‐existing depression and
anxiety, the latter occurring in a patient in the local cohort and was a pre-‐
existing condition. A termination of a partner’s pregnancy for social reasons
was the third SAE.
Post hoc analysis of change in BCVA demonstrated that all but one patient
avoided a loss of 15 letters or more, 32 (50.8%) gained 10 letters or more
and 24 (36.9%) gained 15 letters or more. At baseline, the treatment eye
was the worse seeing eye in 73.8% and this reduced to 59.4% at month 12.
3.6 Discussion
3.6.1 The efficacy and safety of ranibizumab as a treatment for CNV
associated with Pathological Myopia.
This local dataset of 7 participants showed an improvement in visual acuity
and reduction in central retinal thickness. Because of the small sample size
rendering it open to greater bias, most of the ensuing discussion will be
based upon the larger national dataset.
Ranibizumab treatment for CNV secondary to PM in a 1 + prn schedule
improved VA and reduced CRT at 12 months compared with baseline. These
improvements in vision were achieved with a low number of re-‐treatments
after the initial dose. Furthermore, very few SAEs were reported.
These data, which at the time of study were the largest cohort to be
prospectively studied show an improvement in VA of 13.8 letters at 12
months with a mean of 3.6 injections. Results from smaller case-‐series of
ranibizumab therapy in CNV secondary to PM also consistently demonstrate
significant improvements in VA with an equivalent improvement of 9-‐19

85
ETDRS letters (Silva et al, 2008; Konstantinidis et al, 2009: Mones et al,
2009, Lai, 2009). Based upon VA and CRT, the results add to the suggestion
of ranibizumab’s superiority to verteporfin-‐PDT with the VIP study (in age-‐
related disease) showing verteporfin-‐PDT produces a loss of 10 letters at 12
months (VIP study group, 2001). The awaited RADIANCE study results,
reporting on a direct comparison in a randomised trial, will better inform
us.
The three reported SAEs did not reveal any safety concerns; all but the case
of culture negative endophthalmitis were thought not to be related to the
medication or the injection procedure (Lucentis SmPC, 2007). These
findings are consistent with the well characterized safety profile
demonstrated by ranibizumab in this patient population in published
smaller, less robustly designed case-‐series (Silva et al, 2008; Konstantinidis
et al, 2009: Mones et al, 2009, Lai, 2009). Given the significantly increased
likelihood of retinal detachment in myopic eyes and eyes undergoing
interventional procedures it was reassuring to observe that there were no
reports of retinal detachment reported either in our study or the
aforementioned studies. A much larger cohort of patients studied for a
longer duration would be needed to more fully evaluate potential rare side
effects.
The single-‐armed uncontrolled nature of this study limits its interpretation.
The decision to have a singled armed open label design was taken as it was
thought difficult to justify the allocation of patients to verteporfin-‐PDT as
what appears to be, from the above discussion, a clearly inferior a
comparator arm.
Although data from a multicentre study reduces the influence of single site
bias the lack of a central reading centre leaves the interpretation of FFA and
OCT images dependent upon the investigator. This may however, give a
closer reflection of real world practice.

86
3.6.2 Visual acuity and OCT as outcome measures of the ranibizumab
in treatment of CNV secondary to pathological myopia
This study confirms the notion that mCNV occurs predominantly in the
work age group, and often in those age 50 years or younger (Chan et al,
2005). It therefore has the potential to have a significant economic impact
by limiting the ability to perform visually dependent tasks, and so on career
progression, even forcing early retirement (Soubrane, 2008). The question
has to be asked whether high contrast VA or CRT as measured by OCT are
the correct outcome measurements or a good proxy for visually dependent
tasks?
3.6.2.1 Visual acuity
The arguments for and against using high contrast VA in a study setting
have been made in Chapter 2 and concluded that measuring VA change
often underestimates the change in visual function and ability to perform
visually dependent tasks (Mangiona et al, 1999; Hazel et al, 2000; Bansback
et al 2007; Patel et al, 2011). An additional point of discussion brought out
by this study is which measurement of the change in VA is the most
appropriate? This study used the mean change in VA from baseline to
month 12. That is the mean of the entire visits post baseline out to month
12, and is an endpoint used in other studies (Ross et al, 2013). Another
alternative would have been to use the change in mean VA from baseline to
month 12 as in the ANCHOR and MARINA studies (Brown et al, 2006;
Rosenfeld et al, 2006). The former has the advantage in that it minimises
the impact of a non-‐representative result if the month 12 value is an outlier
compared with the previous results as it would be expected to be in the
stability phase of treatment (Tschour et al, 2013). The latter method has the
advantage in that the slower increase in VA in the initiation phase of
treatment does not dilute the true gain at 12 months (Tschour et al, 2013).
As long as is appreciated that these two endpoints are different and either
can be used.

87
3.6.2.2 Ocular Coherence Tomography
The advantages of the use of OCT to assess the outcome of treatment of
mCNV and nvMD in general are numerous. In a compliant individual an OCT
image, even with high resolution, typically takes a few minutes to acquire.
An automated calculation of central retinal thickness produces a numerical
value enabling the benefits of statistical analysis. Repeatability and
reproducibility of spectral domain OCT central thickness is high, Giana
reporting a highly reproducible central retinal thickness even of -‐6 to +6
microns using Bland-‐Altmann plots even when using different density of A-‐
scan per B scan (Giana, Deiro & Staurenghi, 2012). The interpretation of
OCT images is subject to inter-‐observer variability however. Patel reports
on the study of 278 lines of 73 scan in patients with nvAMD prior to
treatment. Two observers graded the images for the presence of intra-‐
retinal cysts, sub-‐retinal fluid, diffuse retinal oedema, sub-‐retinal tissue and
pigment epithelial detachment with agreement only ranging from 77-‐91%
(Patel et al, 2009). Joeres, in a study of 60 images in AMD patients
interpreted separately by 2 independent observers, demonstrated,
however, that with training grading can be highly reproducible with only
grading of sub retinal tissue, advanced CNV or RPE in the presence of poor
visibility giving rise to the significant discrepancies. (Joeres et al, 2007).
The use of OCT does have a number of limitation and unknowns. Although
the technology is advancing year upon year to give better resolution,
caution has to be given when using automated interpretations. Firstly, to
give an example, the Stratus (Carl Zeiss Meditec) time domain OCT does not
give the same central retinal thickness measurement as its more advanced
spectral domain successor, the Cirrus (Carl Zeiss Meditec). Grover and
colleagues demonstrated that mean centre-‐point thickness in the same 36
healthy eyes was 166.9 +/-‐ 29µm using a Stratus machine but 225.1 +/-‐
17.1µm (p<0.0001) using the Cirrus (Grover, Murthy, Brar & Chalam, 2010).
This knowledge means that technology needs standardising within trials
and caution given when interpreting across trials. Secondly, when OCT data

88
from the ABC trial were being analysed it was remarked upon that the
automated delineation of the retinal structures such as the internal limiting
membrane and the RPE (the structures between which retinal thickness is
calculated) were often misplaced and required manual placement (Keane et
al, 2012). As there was no central reading centre to verify the images in our
study, errors in this figure are likely.
There are a number of OCT acquired parameters that could be used to
assess macular morphology. Our study chose to use centre point thickness
as the CRT as myopic CNVs are often small. The term ‘CRT’ or central
retinal thickness differs between studies so again caution needs to be given
when interpreting this value. Many studies, including those in chapters 5
and 6 use the mean thickness of the central 1mm2 subfield thickness, taken
as a disc from the point of fixation as the CRT. This is because age-‐related
CNVs and so their sequelae of retained? fluid are often larger.
Qualitative analysis of OCT images is also helpful. Our study demonstrated
the proportion of eyes with intra-‐retinal, sub retinal and DRE was reduced
at 12 months compared with assessment prior to treatment. Keane et al
correlated qualitative OCT features with VA in the ABC trial involving AMD
patients and so gives justification for the use of change or the presence of
these features as re-‐treatment criteria (Keane et al, 2012). In an analysis of
the 121 treatment naïve patients randomised to receive either bevacizumab
or standard of care, OCT determined reduction in diffuse retinal oedema
correlated strongly with increase in VA (p =0.01). Surprisingly, as it is often
used as re-‐treatment criteria in many clinical trials such as the CATT and
IVAN studies (Martin et al, 2012; Chakravarthy et al, 2012) sub retinal fluid
did not (p=0.932). A larger volume of sub-‐retinal tissue at baseline also
strongly correlated with decreased VA at the 54-‐week study end point
(p<0.001). Furthermore Schmit-‐Urfuth’s group reported that the integrity
of the External Limiting Membrane (representing the photoreceptor layer)
is the most important spectral domain OCT biomarker correlating with VA
at any point during the treatment of nvAMD with ranibizumab (Roberts et

89
al, 2014). Through the 24 months study of 20 treatment naïve patients the
correlation was strong, but still did not serve as a predictive biomarker for
visual prognosis prospectively.
Central retinal thickness, an objective anatomical measure is used in this
study as proxy for functional outcomes. Results show that there is
justification for this in that there is a strong correlation between mean
increase in VA and mean decrease in CRT (p<0.001). Unfortunately data
was not collected to enable a qualitative change in OCT parameters to be
correlated. As discussed, VA is not sufficient to inform about the ability to
perform visually dependent tasks. The following chapter studies the use of
patient reported outcome measures and correlates them with VA and CRT.
3.7 Conclusion
The results of this study show that ranibizumab used in an ‘as required’ re-‐
treatment manner is an effective therapy for mCNV. It confirms the
improvement in VA seen in smaller retrospective case series and
supersedes performance of laser-‐based therapies. Few SAEs were identified
in line with other ranibizumab-‐based studies.
Central retinal thickness, as measured by OCT performed well with its
decrease correlating well with improvement in VA. Quantitative changes
thought to be markers of disease activity were used as re-‐treatment criteria.
As there is a paucity of literature on the treatment of mCNV, extrapolation is
often taken from experience with nvAMD. The results of this study are
consistent with that found with AMD, with improvement in VA possibly out
performing its age-‐related counterpart. There is still a lack of information
about how well the change in the surrogate markers of VA and CRT
represent visually dependent function. Nonetheless the National Institute
for Health and Clinical Excellence recently approved its used in the NHS
(NICE TA298, 2013).

90
Chapter 4. Patient Reported Outcomes as Outcome Measures of anti-‐
VEGF treatment of Pathological Myopia associated Neovascular
Macular Degeneration
4.1 Introduction
Chapter 3 reported on the use of Visual Acuity (VA) and Central Retinal
Thickness (CRT) as outcomes measures of anti-‐Vascular Endothelial Growth
Factor (VEGF) treatment of myopic Choroidal Neovascularisation (mCNV). It
concluded that there are benefits with the use of both of these biomarkers,
in particular their use in parallel being of synergistic value in validating
findings. It also discussed their limitations especially that they may not
represent visual function or quality of life.
It could be argued that the ultimate goal of any treatment of non-‐life
threatening disease is to restore the effect of disease on an individual’s
quality of life. Although surrogate markers of disease activity are important
in measuring immediate response to therapy, or indeed can help with
retreatment decision making it is also prudent to measure an individual’s
perception of disease effect. The National Institute of Health and Clinical
Excellence bases funding arrangements not just on efficacy of treatments
but also cost effectiveness using quality of life health utilities. An example of
this is the decision of the NHS to fund ranibizumab for nvAMD (NICE TA
155). Quality of life measurements aim to give a more holistic approach in
assessing treatment response. These measurements should be reported by
patients themselves, and in fact the use of the self-‐reported status of
healthcare has been suggested by some as to be of greater importance than
any other outcomes that are clinical, physiological or carer-‐given
(Deshpande, Rajan, Sudeepthi & Nazir, 2011). Patient Reported Outcomes
(PROs) as defined by the US Food and Drug Administration are any report of
the status of a ‘patient’s health condition that comes directly from the
patient (i.e. without interruption of the patient’s response by the physician

91
or anyone else’ US FDA, 2006). This chapter assesses the use of PROs as a
measurement of response to anti-‐VEGF treatment for mCNV.
4.2 Background
Pathological Myopia (PM) is a common disease with a significant risk of
visual loss due to CNV (Montero et al, 2010; Soubrane 2008; Chan et al,
2005; Yoshida et al, 2003). The study in Chapter 3, the second largest
prospective cohort at the time, showed that intravitreal anti-‐VEGF
treatment of mCNV improved and then stabilised vision in this situation
(Tufail et al, 2013a; Tufail et al 2013b). Of the 62 eyes that completed the
study the mean change in VA was 13.8 ETDRS letters at 12 months,
requiring a mean of 3.6 ranibizumab injections. The RADIANCE study,
comparing photodynamic therapy to ranibizumab in a randomised clinical
trial has now reported and also describes a significant mean gain in VA of
13.8 and 14.4 letters at 12 months in the 2 ranibizumab only arms (Wolf et
al, 2014).
There are a number of different Patient Reported Outcome Measures
(PROMs) that can assess vision related outcomes, each of which have been
validated. The National Eye Institute Visual Function Questionnaire (NEI
VFQ) is an example of a very commonly used one. With the help of patients
with visual impairment, NEI VFQ was developed as a 51-‐point scale that
sampled different aspects of visual function (Mangione et al, 1998). It was
later refined to a more convenient 25 point scale, the NEI VFQ-‐25, with
correlations to its 51 point predecessor showing it was still valid (Mangione
et al, 2001). The NEI VFQ has subsequently been used to provide insight into
the quality of life changes following anti-‐VEGF treatment for nvAMD. For
example, it was used in a 24-‐month open label study of ranibizumab in
nvAMD where baseline vision was maintained at month 12 and then
declined, despite a mean of 7.6 (SD 4.1) injections. On this occasion the NEI
VFQ-‐25 score improved at 6 months (p=0.03) and was subsequently
maintained out to month 24 (Rakic et al, 2013). The NEI VFQ-‐25 has also

92
been used to study quality of life in mCNV in the RADIANCE study and
demonstrated greater improvements in vision related function in the
ranibizumab treated group (Wolf et al, 2014).
The MacDQoL is another example and is a 22-‐stem questionnaire designed
to assess the impact of age-‐related macular degeneration on quality of life of
individuals with the AMD. It sampled 159 individuals at a single time point
and after removing 4 questions from the original 26 (mainly due to
redundancy) analyses demonstrated it had excellent internal consistency
and reliability. Furthermore the results demonstrated that AMD has a
significant impact on independence, leisure activities, the ability to deal with
personal affairs and mobility (Mitchell et al, 2005). It was further evaluated
in a longitudinal study in 135 individuals with AMD and demonstrated
excellent test re-‐test reliability over 12 months (Mitchell et al, 2007).
The domains of well-‐being and treatment satisfaction have not been studied
in the context of treatment of mCNV and so this chapter focuses on two tools
to assess these aspects of care.
4.2.1 The W-‐BQ12 Well-‐being questionnaire
The 12-‐item well-‐being questionnaire (W-‐BQ12, Riazi, Bradley, Barendse &
Ishii 2006) was developed from the longer 22-‐item version and comprises 3
areas of assessment: Energy, positive well-‐being and negative well-‐being
(Bradley & Lewis, 1990; Appendix A). Each of these 3 areas has a score of 12
points, making a total of 36 possible; a higher score indicates a better well-‐
being. Although the PROM was developed for use in patients with diabetes,
it has been shown to be a useful and reliable tool in patients with macular
disease. Mitchell and Bradley analysed results from a self-‐completed survey
of 1421 members of the then called Macular Disease Society and
demonstrated consistency with its use in those with diabetes and worse
scores in those registered as partially sighted or blind compared with those
who were not. They concluded that ‘The W-‐BQ12 will be useful in measuring

93
outcomes in rehabilitative and medical interventions and in researching
factors affecting adjustment to MD’ (Mitchell & Bradley, 2001).
4.2.2 The MacTSQ Treatment satisfaction questionnaire
The treatment satisfaction questionnaire MacTSQ (Mitchell, Brose &
Bradley, 2007) was designed to assess treatment satisfaction of macular
disorders using scales separated into two broad areas: impact of treatment,
and provision of information and convenience. There are 12 questions in
each of these 2 areas, with the maximum of 36 points in each area giving a
potential overall maximum score of 72 points (Appendix B). A higher score
indicates a better satisfaction. In a similar manner to the W-‐BQ12, the
MacTSQ questionnaire was based upon a retinopathy treatment satisfaction
questionnaire (Woodcock et al, 2005). The MacTSQ has been used to assess
the outcome of treatment of AMD with anti-‐VEGF therapy in the IVAN trial,
however the results are still awaited (Chakravarthy et al, 2013). It has not
been used to study response in those with mCNV so far.
4.3 Methods
This study used the same participants as described in Chapter 3. In short,
the aim was to recruit 65 participants with mCNV and treat them with a
single administration of ranibizumab followed by further treatments on a
monthly, as required basis out to 12 months. This was a single armed, open
label design.
Both the W-‐BQ12 and the MacTSQ were completed at months 1, 6 and 12
with the W-‐BQ12 also being completed at baseline prior to treatment. It was
given to the participants to complete independently but if required help
from a research nurse was allowed. The questionnaire was administered at
the study visits before the patients had ocular examination or treatment.

94
4.3.1 Statistical analysis
A full analysis set approach (all patients that had at least one treatment and
one assessment following baseline) was used to analyse the full data set. The
local cohort was not analysed separately due to the analysis of such a small
data set being invalid (Riazi et al, 2006; Mitchell et al 2007). Missing data
was handled by using a last observation carried forward method. Mean
differences over time were tested using analysis of covariance. Mean change
from baseline to month 12 in general, positive and negative well-‐being as
well as energy was pre-‐planned. Correlations (Pearson product-‐moment
correlation co-‐efficient) were used to study the relationship between VA, W-‐
BQ12 general well-‐being and MacTSQ overall score.. For the W-‐BQ12,
analyses was performed to compare participants when the treated eye being
the better seeing eye (BSE) with participants when the treated eye was the
worst seeing eye (WSE). A better seeing eye was defined as seeing 5 or more
ETDRS letters better than the worse at baseline. The W-‐BQ12 was also sub
analysed by groups dependent upon change from baseline VA (<0, 0-‐4, 5-‐9
and 10 or more ETDRS letters gained). For the MacTSQ, sub analyses
compared the BSE versus WSE and groups depending upon the number of
treatments given in 12 months (1, 2-‐3, or more than 3). Because these were
exploratory end points, results were reported as descriptive only. P values
were calculated using a paired t-‐test and a value of less than or equal to 0.05
was considered statistically significant.
4.4 Results
The VA and CRT results are described in detail in chapter 3, but to
summarise in the cohort of 62 participants there was a mean VA
improvement of 13.8 letters (SD=14.0, p<0.001), and a mean reduction in
central retinal thickness of 135µm (SD=109µm, p<0.001) at 12 months
(Tufail et al 2013a, Tufail et al 2013b).

95
4.4.1 W-‐BQ12 Well-‐being questionnaire
The mean general well-‐being score was 25.6 at baseline. Table 8 shows the
change in general and sub-‐scales of well-‐being over time indicating a
numerical increase in general well-‐being, positive well-‐being and energy,
with a fall in negative well-‐being.
Mean (SD)
general well-‐
being.
Mean (SD)
positive
well-‐being.
Mean (SD)
negative
well-‐being.
Mean
(SD)
energy.
Baseline
(n = 65)
25.6 (6.96) 8.3 (2.74) 2.3 (2.80) 7.6 (2.54)
Month 1
(n = 59)
26.8 (5.03) 8.6 (2.59) 1.4 (1.95) 7.6 (2.30)
Month 6
(n = 61)
27.2 (6.08) 8.9 (2.61) 1.7 (2.47) 8.0 (2.48)
Month 12
(n = 61)
27.3 (6.35) 8.7 (2.66) 1.5 (2.60) 8.1 (2.44)
Change from
baseline to
month 12,
p value
0.03 0.150 0.053 0.102
Table 8. The baseline and time point scores of the general well-‐being and
subscales.
The change in general well-‐being from baseline to month 12 was significant
(25.6 to 27.3, p=0.03) but the change in the subscales did not reach
statistical significance.
When analysing patients who had treatment to their BSE, the change in
general well-‐being, energy, positive well-‐being and negative well-‐being at 12
months were +2.1, +0.4, +0.2 and -‐1.5. When patients who had treatment to

96
their WSE was studied the changes were +1.7, +0.5, +0.8 and -‐0.5
respectively. Data for the general well-‐being is shown in Table 9.
Mean W-‐BQ12 score BSE
(n=15)
Mean W-‐BQ12
score WSE (n=44)
Baseline 23.2 27.2
Month 1 24.8 28.0
Month 6 25.9 28.2
Month 12 25.3 28.9
Table 9. The baseline and time point general well-‐being scores depending
on whether the treated eye was the better and worse seeing eye. Note that
there were 6 eyes where the baseline was neither better nor worse than the
fellow eye (within 5 ETDRS letters of each other) and so total analysis was
performed on 59 participants.
At 12 months participants who had achieved an increase in VA had an
increase in general well-‐being but those who lost VA demonstrated a
worsening of well-‐being (Table 10). Note this was not the case at 6 months
for those that had lost vision.

97
Mean general well-‐being score (number)
ETDRS letter
change from
baseline
(number of
participants)
<0
(8)
0-‐4
(16)
5-‐9
(10)
> 9
(28)
Baseline 23.4 25.6 24.6 26.6
Month 1 20.9 26.0 26.5 28.7
Month 6 26.1 25.4 28.0 27.5
Month 12
(change
from
baseline)
22.6 (-‐0.8) 29.1 (+3.5) 27.0 (+2.4) 28.7 (+2.1)
Table 10. General well-‐being score over the course of the study, sub-‐
grouped by improvement from baseline VA.
4.4.2 MacTSQ Treatment satisfaction questionnaire
The mean treatment satisfaction at month 1 was 55. This increased
significantly at 12 months to 64.9 (p<0.001) as did both impact of treatment,
and information provision and convenience subscales (Table 11)

98
Mean (SD)
treatment
satisfaction
Mean (SD)
impact of
treatment
Mean (SD)
information
provision and
convenience
Month 1
(n = 62)
55 (17.88) 26.2 (7.87) 28.7 (10.85)
Month 6
(n = 59)
58.8 (16.21) 29.6 (7.31) 29.2 (9.73)
Month 12
(n = 61)
64.9 (9.23) 32.0 (4.88) 32.9 (6.03)
Change from
baseline to
month 12, p
value
<0.001 <0.001 0.014
Table 11. The baseline and time point changes in overall treatment
satisfaction and subscales scores.
There was a similar increase in MacTSQ for both the BSE and WSE at 12
months (55.4 to 65.4, and 54.8 to 64.4) but at 6 months only treating the
WSE showed an improvement (54.8 to 60.0 at 6 months and 55.4 to 55.4 at
12 months). Patients receiving 2-‐3 injections had a numerically higher
increase in MacTSQ (51.0 to 66.8) from month 1 to 12 compared with those
receiving only 1 or >3 treatments (Table 12).

99
Mean treatment satisfaction
Number of
Treatments
(number)
1 (13) 2-‐3 (21) 3 or more (26)
Month 1 65.0 51.0 53.1
Month 6 66.5 58.4 56.8
Month 12
(change in score
from baseline)
63.0 (-‐2.0) 66.8 (+15.8) 64.5 (+11.4)
Table 12. The MacTSQ score over the course of the study, sub-‐grouped by
the number of treatments received.
4.4.3 Correlations between visual acuity, well-‐being and treatment
satisfaction
Weak correlations were noted between VA and W-‐BQ12 general well-‐being,
VA and MacTSQ total score and W-‐BQ12 and MacTSQ). (Table 13).
r value at month 12 (p
value)
VA and W-‐BQ12 0.02 (0.877)
VA and MacTSQ 0.02 (0.877)
W-‐B12 and MacTSQ 0.08 (0.537)
Table 13. The correlation co-‐efficients and two tailed probability tests for
correlations between VA, W-‐BQ12 and MacTSQ at month 12.

100
4.5 Discussion
4.5.1 Patient reported outcome measurements in the treatment of
myopic CNV with ranibizumab
This study showed that patients treated with ranibizumab for mCNV over a
12 month study period on an ‘as required’ basis had a small but statistically
significant increase in overall well-‐being as measured by the W-‐QB12 scale.
There is no benchmark W-‐BQ12 data for mCNV treatment, or indeed for
nvAMD for comparison, but the increase in well-‐being observed with
treatment would be in line with clinical expectation based upon a parallel
improvement in visual acuity. The validity of the result is further supported
by the 12-‐month observation that those who had achieved an increase in the
VA had an increase in general well-‐being but those who lost VA
demonstrated a worsening of well-‐being. Some caution has to be given to
these conclusions as it is also noted that this was not the case in those losing
vision at 6 months. The results show an improvement in energy and positive
well-‐being as well as a fall in negative well-‐being, with only the later
approaching significance. These changes in subscales are also in line with
clinical expectation and therefore the explanation for their failure to reach
statistical significance in likely to be that the study was underpowered.
Treatment satisfaction as measured by the MacTSQ improved throughout
the study both in terms of the treatment burden, and information provision
and convenience subscales. Like with the W-‐BQ12 instrument there is no
benchmark data in the use of the MacTSQ for the treatment of mCNV or
nvAMD and the results on the IVAN study are awaited where it was used as
an endpoint for treatment of nvAMD. Intravitreal injections can often be
associated with considerable anxiety, but an increase in the MacTSQ can be
interpreted as habituation to this in the context of this particular treatment
regimen and study environment. Both impact of treatment, and information
and convenience improved. Caution has to be taken in assuming these
findings would be extrapolated into clinical practice, as routine clinical

101
practice often does not involve the same degree of patient contact or indeed
the same environment as clinical trial practice offers.
By the definition used in this study more individuals were treated in a WSE
than in the BSE. Improvements were marginally greater in those treated in
their BSE. This small difference along with the small number in the BSE
group makes interpretation of this finding difficult, although it is tempting to
conclude it is explained by an improvement in the BSE having a greater
impact on overall visual function. The concept that health utility scores are
associated with the VA and in particular VA with their BSE is well founded
one however. Brown et al studied 80 patients with macular degeneration
and associated visual acuity with their BSE, reporting that those with mild
visual loss (20/20-‐20/25) were prepared to trade off 11% of their
remaining life and those with severe visual loss (Count fingers to Light
perception) 60% if normal vision could be restored (Brown, Sharma, Brown
& Kistler, 2000). This findng does not appear to be unique to AMD and
mirrored findings in 100 consecutive patients with diabetic retinopathy
with respective values of 15% and 41% (Brown, Brown, Sharma & Shah,
1999). Using similar trade off utility values in a cohort of 325 vitreoretinal
patients, Brown et al was able to find a closer correlation with VA in the BSE
than the WSE (Brown, Brown, Sharma, Smith & Landy 2001).
There appears to be no easily identifiable explanation for the difference in
month 1 MacTSQ results when subdivided by number of injections given
during the study. It may be expected that the month 1 MacTSQ would be
similar across the subgroups as at this time all participants would have
received a single initiation treatment, however those receiving only 1
treatment was higher than in the groups recieivng more. An large imbalance
in the numbers within each group may have distorted this result. Those
participants having only 1 treatment had a fall in MacTSQ whereas those
having 2-‐3 or more than 3 had an increase. This appears to be
counterintuitive but could be explained by those not requiring treatment
beyond the first injection percieiving that no further attempt is being made
102
to restore their vision and so being less content. No further subdivision on
the subscales is valid here due to the low participant numbers but analyses
from a larger scale trial, such as the anticipated IVAN study may be more
informative (Chakravarthy et al, 2012).
4.5.2 The use of PROMS as an outcome measure
Following on from the discussion in previous chapters, it is rational to
conclude that mean VA over a treatment period is a reasonable way to
assess the benefit of treatment of neovascular macular degeneration. It has
also been concluded that CRT is a reasonable surrogate marker for visual
acuity. In this chapter no correlation has been identified between the change
in VA and the change in both well-‐being and treatment satisfaction utilities
studied. It is therefore not possible to conclude with a degree of certainty
that the W-‐BQ12 and MacTSQ are valid PROMs tools in the assessment of
treatment of mCNV with ranibizumab on an as required basis, and
furthermore that VA is a marker of quality of life. It may that a study
designed to specifically addressed this, with adequate powering may be able
to conclude differently. The improvement in visual function as
demonstrated by the NEI-‐VFQ tool in the RADIANCE study adds further
weight to the suggestion of the validity of PROMS however. It has to be
appreciated that although broadly coming under the umbrella of ‘Quality of
life’ measurements these tools measure different concepts; the NEI-‐VFQ
measures perception of visual function, the MacTSQ perception of treatment
satisfaction and the W-‐BQ12 overall perception of well-‐being.
The advantage of using a PROM is that is offers a new dimension to assess
an outcome of treatment. Outcomes can be broadly divided into clinical
(efficacy or safety), humanistic (performance of role, emotional status) and
economical (expenses or saving) and the use of PROMs is a move away from
using traditional clinical biomarkers of the improvement in ‘disease’ such as
VA alone (Deshpande et al, 2011). The principle disadvantage of the use of
PROMS, apart from their often time consuming nature and dependency on
103
literative skills of the user, is that the questions posed are those of the study
team. Although the development of the W-‐BQ12 and MacTSQ may have been
informed by patients, ultimately the desgin was that at the discretion of the
investigators (Riaz et al 2006, Mitchell et al 2007). A purer way of capturing
perceptions of well-‐being may be to take a more qualitative approach;
however validating and interpreting such methods can prove more difficult.
Overall, PROMs work synergistically with clinical markers reinforcing the
use of all of these endpoints and as such they are becoming increasingly
used to assess the outcome of treatments in a number of therapeutic areas.
NHS England is currently using PROMs to assess the benefit and patient
perceptions of orthopaedic and surgical procedures (NHS England, 2015).
Although as of yet no areas of eye health care are subjected to such
mandatory study this is likely to become an important marker of the quality
of services in the future.
4.6 Conclusion
The study in this chapter was the first time that the W-‐BQ12 and MacTSQ
tools were used to evaluate outcomes in the treatment of mCNV with as
required ranibizumab. Results show that both well-‐being and treatment
satisfaction improved over the 12 month study period and although subject
to variability during the study and subscales being affected by low numbers,
help to set a benchmark for their use. The study demonstrates that changes
in PROMS are comparable to those in VA and CRT, and although provide a
different dimension to measuring outcome, have the potential to work
synergistically in evaluating such treatments.

104
Chapter 5. Change in retinal sensitivity following treatment of nvAMD
using anti-‐VEGF therapy: using a lesion-‐guided microperimetry retinal
sensitivity as an outcome measure
5.1 Introduction
The previous chapters have discussed the use of visual acuity (VA), central
retinal thickness (CRT) and patient reported outcomes (PROs) as outcome
measures in the treatment of neovascular macular degeneration.
Conclusions were made that VA, although useful when assessing cohorts, is
not good at assessing point-‐to-‐point change in vision. CRT, as measured by
Optical Coherence Tomography (OCT) is a more useful tool for individual
assessments between single time points but still qualitative analysis of each
image is required to aid the assessment of treatment. PROs are a usual
adjunct in assessing the overall impact of therapies for macular disease but
specific utilities are required to assess specific aspects of treatment and its
outcome. VA provides a functional assessment of vision and OCT provides a
morphological assessment of the macula. The chapter assesses and
evaluates the use of microperimetry (MP) in determining retinal sensitivity
as a part of an objective and functional outcome of treatment of neovascular
AMD.
5.2 Background
Age-‐related macular degeneration is the commonest cause of sight loss in
the elderly population (Owen et al, 2012). The neovascular subtype,
representing about a fifth of incident cases is treatable with anti-‐angiogenic
intravitreal injections (Brown et al, 2006; Rosenfeld et al, 2006; Martin et al,
2011; Charavarthy et al, 2012, Schmidt-‐Erfurth et al, 2014). The majority of
affected individuals require therapy in the long term in an attempt to
maintain vision (Rofagha et al, 2013; Tufail et al, 2014; Airody et al, 2014)
with the maximal restoration of visual function being the goal of treatment.
Once maximum visual potential has been reached, most individuals receive

105
discontinuous therapy, being retreated either when there are signs of
disease activity (reactive), or when activity is predicted to return
(proactive) (Lalwani et al, 2009; Berg, Pederson, Sandvik & Bragadottir,
2015). As discussed in previous chapters these signs of disease activity, and
so response to treatments, are commonly measured by distance visual
acuity assessment using an Early Treatment Diabetic Retinopathy Study
(ETDRS) chart and by assessment of retinal morphology as measured by
optical coherence tomography (OCT). Visual acuity, because of its large
coefficient of variability between measurements (Patel et al, 2008; Aslam et
al, 2014) can be considered better placed to assess the response of a cohort
of individuals or the mean response of an individual over a series of
observations rather than judge response between single time points. Central
Retinal Thickness (CRT) and in particular qualitative aspects of retinal
morphology, as measured by OCT has good reproducibility and so can be
considered well placed to measure outcomes between single time points.
Despite being able to use these two biomarkers of visual function
synergistically to aid the overall assessment of response to treatment there
is still disconnect between patients’ perceptions of visual change and
conventional assessment methods such as VA (Legge, Ross, Isenberg &
LaMay, 1992) and CRT (Munk et al, 2013; Cho et al, 2013).
Perimetry is a psychophysical method of assessing retinal sensitivity
whereby a stimulus of given size and intensity is presented in the field of
vision corresponding to the area of the retina under examination. An area of
reduction in retinal sensitivity, termed a relative scotoma, or an area of total
defect, an absolute scotoma, can be defined. Microperimetry, which enables
the determination of a map of retinal sensitivity in a much smaller field and
has shown promise as an objective tool of measuring macular function
following treatment of nvAMD with anti-‐angiogenic agents (Squirrel et al,
2010; Baseler et al, 2011; Munk et al, 2013; Cho et al 2013). Munk et al
chose to observe the size of the absolute scotoma over time and found a
trend towards a reduction in its size with treatment but this did not reach
statistical significance (Munk et al, 2013). Cho et al and Parravano et al

106
however showed an increase in overall retinal sensitivity over time (Cho et
al, 2013, Parravano et al, 2010). The common theme with each of these
studies was that an area of the macula was predefined before that start of
the study and then used for examination of each participant. This concept
has some inherent weaknesses in particular that the size of the retinal lesion
does not correspond exactly to the area of examination.
Fixation is known to be impaired in individuals with AMD, particularly in
late disease such as CNV (Tarita-‐Nistor, Gonzalez, Markowitz & Steinback,
2008; Pearce, Sivaprasad, & Chong, 2011). In these circumstances fixation
can be eccentric, can occupy one or more new preferential retinal locations
(PRLs) or can be unstable (Fletcher & Schuchard, 1997; Pearce et al, 2011).
Fixation stability or rather how unstable the fixation is, is known to
correlate with day-‐to-‐day tasks such as reading (Ergun, Maar, Radner,
Barbazetto, Schmidt-‐Erfurth & Stur, 2003; Crossland, Culham & Rubin.
2005) and so is potentially an important measure of visual function when
considering response to treatments.
This chapter studies the change in retinal sensitivity following treatment of
nvAMD using anti-‐VEGF therapy using a lesion-‐guided microperimetry
technique to specifically study an area of interest. It also evaluates fixation
stability as an exploratory outcome.
5.3 Methods
This research followed the tenets of the Declaration of Helsinki. Informed
written consent was obtained from all participants following an explanation
of the nature and possible consequences of the study. Experimental
protocols were approved by the York Neuroimaging Research, Ethics and
Governance Committee and the University of York Ethics Committee.

107
5.3.1 Patient population and treatment
Treatment naïve patients that fulfilled the National Institute for Health and
Clinical Excellence (NICE) criteria for treatment of nvAMD (Snellen VA 6/12
or less, nvAMD with evidence of recent disease progression) were recruited
into the study. All participants had previously been assessed with Fundus
Fluorescein Angiography as a part of routine care within 2 weeks of
recruitment. Fluorescein angiography had been performed using a Carl Zeiss
NM-‐1 camera with 2mls of 5% fluorescein being injected. Images were
captured using a standard macular protocol in the choroidal, arterial,
venous and late phases out to 10 minutes post-‐injection. Participants were
excluded if they were unable to give written consent.
All participants underwent assessment with of Best Corrected Visual Acuity
(BCVA) vision, CRT and retinal sensitivity (RS) at baseline (visit 1).
Treatment was subsequently commenced with the intravitreal anti-‐VEGF
agent that was requested by the local clinical commissioning group at that
time (ranibizumab 0.5mg in 0.05mls, or Aflibercept 2.0mg in 0.05mls) and
received monthly initiation doses under a standard aseptic technique via the
pars plana. BCVA, CRT and RS assessments were performed following the
subsequent three initiation doses making a total of 4 sessions per individual.
At the same time as RS was measured, fixation stability, the ability of the eye
to look at the target when the participant has been instructed to do so, was
measured as an exploratory outcome.
5.3.2 Best Corrected Visual Acuity assessment technique
Participants had BCVA measured wearing their most up to date pair of
distance glasses using an ETDRS chart (Pelli-‐Robson, Precision-‐Vision) at 4
metres. Each eye was assessed separately. If participants were able to read
at least 4 letters on the top line at 4 metres then they were encouraged to
read on until they were unable to read 3 or more letters on a subsequent
line. A score of 30 was then added to the total number of letters read

108
correctly (to compensate for the 4 metre testing distance) to give the total
letter score used for the study. If participants were unable to read 4 letters
or more on the top line of the chart at 4 metres, the chart was moved to 1
meter and the total letter score was then equal to the total number of letters
correctly read with no score being required to be added to this number
(Ferris et al, 1982).
5.3.3 Retinal Sensitivity assessment by Microperimetry
Microperimetry was performed with the MP-‐1 micro-‐perimeter (Nidek
Advanced Vision Information System [NAVIS]; Nidek Technologies, Padua,
Italy) and was sequenced after BCVA assessment and before any other in
order not to affect the measured retinal sensitivity. Participants had their
pupils dilated, wore a patch on their fellow eye and undertook the
assessment in a darkened environment. The fixation mark presented was in
the form of a cross 2o in diameter, which if necessary could be increased in
size. The light stimulus was presented in a sequential random grid pattern
and consisted of 76 test points. The stimulus intensity ranged from 0-‐20 dB
(0 dB refers to the strongest signal intensity of 127 cd/m2) in 1-‐dB steps.
The MP-‐1 proprietary software ‘follow-‐up function’ was used for every
follow-‐up visit ensuring the same areas of the macula were examined on
successive occasions.
5.3.4 Central Retinal thickness assessment with Optical coherence
tomography
Following microperimetry assessment the 1mm central subfield retinal
thickness (micrometres) was measured using a spectral domain OCT with a
standard macular cube assessment (Carl Zeiss Meditec).

109
5.3.5 Identification of the Area of Interest
Signs of the CNV and its sequelae (intraretinal fluid, subretinal fluid,
pigment epithelial detachment) were identified anatomically both on the
OCT and on a 10 minute frame of the FFA. An area, encompassing any of the
activity seen with either OCT or FFA, was subsequently manually mapped
onto the baseline MP grid pattern to identify which of the 76 points sampled
were affected. This ‘lesion plus sequelae’ area denoted the ‘area of interest’
and was kept consistent throughout the subsequent data analyses.
5.3.6 Fixation stability assessment
As a part of the retinal sensitivity program, the MP automatically assesses
eye fixation (that is if the eye is actually looking at the fixation target when
the participant has been instructed to) about 25 times per second. The MP-‐1
then calculates the number of fixation assessments that are made that fall
within 2 degrees or 4 degrees of the intended fixation target. Fixation
stability is then defined in accordance with a study by Fujii and associates as
follows:
1. Stable fixation: More than 75% of the fixation points inside the 2-‐
degree-‐diameter circle,
2. Relatively unstable fixation: More than 75% fixation points inside the 4-‐
degree-‐diameter circle and less than 75% inside the 2-‐degree-‐diameter
circle and,
3. Unstable fixation: Less than 75% inside the 4-‐degree-‐ diameter circle.
(Fujii, DeJuan, Humayun, Sunness, Chang T & Rossi 2003).
5.3.7 Statistical analysis
The number of points in the area of interest was identified. Within this area
the number and percentage of points that increased retinal sensitivity by
2dB and 4dB were calculated. Given that the co-‐efficient of repeatability for

110
the MP-‐1 has been described as 1.45 in Squirrel et al’s study and 4.12-‐
4.37dB in Wu et al’s study, both a 2dB change and a 4dB change in RS were
was chosen to be analysed at each location in the Grid (Squirrel et al, 2010;
Wu, Ayton, Guymer & Lu, 2013).
Pearson correlation coefficients were calculated between the treated eye VA
or CRT and the number of points gaining 2 or 4dBs. A two-‐tailed probability
was calculated and p <= 0.05 was taken as statistical significance.
Data from participants that withdrew consent were not analysed. Missing
data was handled by excluding that session from the analysis and the
number of participants in a particular analysis was displayed. Fixation
stability data is an exploratory outcome and so it is not appropriate to
perform any statistical analyses.
5.4 Results
Sixteen participants were recruited into the study, of which 6 withdrew
consent during the study. Of the remaining 10 participants all attended for
VA and CRT assessments. Participant 7 had BCVA measured by the Snellen
technique rather than ETDRS on the third visit so these data were excluded.
Seven participants had a baseline MP assessment and only 8 had one or
more further MP assessments. Of these follow up assessments only 6 had
the first, 8 the second and one the final follow up assessments. Because of
these low numbers data has only been analysed from the 8 participants with
two of more MP assessments during the period of baseline (visit 1) to
second follow up (visit 3) and missing data within these session was
handled as described in the statisical analysis section of the methods.
Reasons for this low MP rate included participants declining the assessment,
technical failure and absence of staff.

111
Mean participant age was 76 years (67-‐87) with equal male:female
distribution. There were 6 right eyes and 2 left eyes studied. The baseline
charaterisitics are outlined below in table 14.
Particip
ant
number
Baseline
BCVA for
the
Treated
Eye
(letters)
Baseline
BCVA for
the
Untreated
Eye
(letters)
Baseline
CRT for the
Treated
Eye (µm)
Baseline
CRT for the
Untreated
Eye (µm)
Number
of points
in the
area of
interest
(treated
eye
only).
1 75 85 309 261 76
2 62 75 269 235 51
3 79 71 292 288 55
5 40 79 314 288 29
6 55 69 272 266 50
7 69 94 335 315 57
8 70 68 260 237 (26 at
visit 2)
10 28 72 738 317 29
Table 14. The baseline (visit 1) characteristics of the 8 participants (BCVA=
best corrected visual acuity in ETDRS letters, CRT= central 1mm2 subfield
retinal thickness in micrometers, and number points in the area of interest.
Note that participant 8 had no baseline microperimetry performed so the
area of interest was mapped onto the retinal sensitivity map at visit 2.
5.4.1 Best Corrected Visual Acuity
The BCVA values for individual participants during the study (Table 15) and
the means of the cohort (Table 16 and Figure 11) are presented below.

112
Particpant
number
BCVA visit 2
for the
Treated Eye
(letters)
BCVA visit 2
for the
Untreated
Eye
(letters)
BCVA visit 3
for the
Treated Eye
(letters)
BCVA visit 3
for the
Untreated Eye
(letters)
1 64 79 75 85
2 80 79 81 79
3 80 74 80 75
5 51 90 63 80
6 48 67 74 69
7 82 89
8 77 75 78 73
10 48 80 47 83
Table 15. Treated and untreated eye visual acuity (ETDRS letters) for the 8
participants over the 2 follow up sessions. A blank cell represents missing
data.
Mean
(SD)
BCVA
Baseline
for the
Treated
Eye
(letters
n=8)
Mean (SD)
BCVA
Baseline
for the
Untreated
Eye
(letters
n=8)
Mean
(SD)
BCVA
visit 2 for
the
Treated
Eye
(letters
n=8)
Mean
(SD)
BCVA
visit 2 for
the
Untreated
Eye
(letters
n=7)
Mean
(SD)
BCVA
visit 3 for
the
Treated
Eye
(letters,
n=7)
Mean (SD)
BCVA visit
3 for the
Untreated
Eye
(letters
n=8)
60
(18.3)
77
(8.3)
66
(15.7)
79
(7.6)
71 (12.2) 78
(5.7)
Table 16. Treated and untreated mean and standard deviation (SD) of best
corrected visual acuity (ETDRS letters) for the 8 participants over the 3
sessions, visit 1 (baseline) to visit 3. The number of sessions analysed (n)

113
was 8 in all cases except for visit 3 when the figure was 7 due to missing
data.
Figure 11. Mean (standard deviation) visual acuity (y-‐axis, ETDRS letter
score) at visit 1 (baseline) to visit 3 (x-‐axis). Data from the treated eye is
displayed in blue and data from the untreated eye in red.
5.4.2 Central retinal thickness
The CRT values for individual participants (Table 17) and the means of the
cohort (Table 18 and Figure 12) are presented below.
0 10 20 30 40 50 60 70 80 90 100
1 2 3
Mean (SD) ETD
RS letter Score
Visit Number

114
Participant
number
CRT
visit 2 for the
Treated Eye
(μm)
CRT
visit 2 for the
Untreated
Eye
(μm)
CRT
visit 3 for
the Treated
Eye
(μm)
CRT
visit 3 for the
Untreated Eye
(μm)
1 357 261 305 249
2 186 235 203 234
3 289 291 278 291
5 294 285 270 281
6 260 265 259 261
7 306 316 333 318
8 234 238 233 235
10 375 318 345 313
Table 17. Treated and untreated CRT (central 1mm2 subfield retinal
thickness, micrometres) for the 8 participants over the 2 follow up sessions.
Mean
(SD) CRT
Baseline
for the
Treated
Eye
(μm)
Mean
(SD) CRT
Baseline
for the
Untreated
Eye
(μm)
Mean (SD)
CRT
Visit 2 for
the
Treated
Eye
(μm)
Mean (SD)
CRT
Visit 2 for
the
Untreated
Eye
(μm)
Mean (SD)
CRT
Visit 3 for
the
Treated
Eye
(μm)
Mean
(SD) CRT
Visit 3 for
the
Untreated
Eye
(μm)
349
(159.4)
276
(31.7)
288 (61.9) 264 (50.9) 278 (48.3) 273
(33.1)
Table 18. Treated and untreated mean and standard deviation (SD) CRT
(central 1mm2 subfield retinal thickness, micrometres) for the 8
participants over the 3 sessions, visit 1 (baseline) to visit 3.

115
Figure 12. Mean (standard deviation) 1mm2 central subfield retinal
thickness (y-‐axis, micrometres) at visit 1 (baseline) to visit 3 (x-‐axis). Data
from the treated eye is displayed in blue and data from the untreated eye in
red.
5.4.3 Retinal sensitivity
The mean number of points in the area of interest was 47 (SD 17.3). The
mean retinal sensitivity increased by 2.52dB (SD +/-‐1.2) at visit 3. The
change in retinal sensitivity values as acquired by MP for individual
participants (Table 19) and the means of the cohort (Table 20 and Figure
10) are presented below.
0
100
200
300
400
500
600
1 2 3
Mean (SD) Central retinal Thickness
(micrometres)
Visit Number

116
Participant
number
Number
of
points
in area
of
interest
Percentage
(number)
of points
that
increased
by 2dB or
more in
area of
interest at
visit 2
compared
with
baseline
(n=6)
Percentage
(number)
of points
that
increased
by 4dB or
more in
area of
interest at
visit 2
compared
with
baseline
(n=6)
Percentage
(numbers)
of points
that
increased
by 2dB or
more in in
area of
interest at
visit 3
compared
with
baseline
(n=7)
Percentage
(number)
of points
that
increased
by 4dB or
more in
area of
interest at
visit 3
compared
with
baseline
(n= 7)
1 76 14.5 (11) 11.8 (9) 44.7 (34) 22.4 (17)
2 51 29.4 (15) 19.6 (10)
3 55 63.0 (34) 24.1 (13) 78.7 (37) 42.5 (20)
5 29 27.6 (8) 13.8 (4) 58.6 (17) 34.5 (10)
6 50 44.0 (22) 20.0 (10) 62.0 (31) 46.0 (23)
7 57 33.3 (19) 28.1 (16) 77.2 (44) 54.4 (31)
8 26 73.1 (19) 38.5 (10)
10 29 13.8 (4) 13.8 (4)
Table 19. Number of microperimetry points in the area of interest.
Percentage and number of points that increased in retinal sensitivity by 2dB
or more and 4dB or more for the 8 participants over the 2 follow up
sessions. A blank cell represents missing data. n = the number of sessions
analysed.

117
Mean
percentage of
points that
increased by
2dB or more in
acitve area at
visit 2
compared with
baseline (n=6)
Mean (SD)
percentage of
points that
increased by 4dB
or more in acitve
area at visit 2
compared with
baseline (n=6)
Mean (SD)
percentage of
points that
increased by 2dB
or more in acitve
area at visit 3
compared with
baseline (n=7)
Mean (SD)
percentage of
points that
increased by
4dB or more in
acitve area at
visit 3
compared with
baseline (n= 7)
33 (13.7) 18 (6.3) 62 (15.6) 39 (16.0)
Table 20. Mean percentage and standard deviation of points that increased
retinal sensitivity by 2dB or more and 4dB or more for the 8 participants
over the 2 follow up sessions. A blank cell represents missing data. n = the
number of sessions analysed.
Figure 13. Mean (standard deviation) percentage of points that increased
retinal sensitivity by 2dB or more (blue) and 4dB (Red) or more (y-‐axis) for
the 8 participants over the 2 follow up sessions 1 and 2 (x-‐axis). The
baseline (visit 1) data has not been displayed as it is defined as zero for all
0 10 20 30 40 50 60 70 80 90
1 2
MEan (SD) precentage of points
increased by 2dB (blue) or 4dB
(red)
Follow up seesion 1 or 2

118
participants and change between baseline and first follow up may be
affected by a significant learning effect (Wu et al, 2013).
5.4.4 Fixation stability
At baseline, 6 of 7 participants had relatively unstable fixation and 1 had
stable fixation. Compared with baseline (visit 2 for subject 8 as baseline was
missing), 2 subjects improved stability, 5 maintained stability and one got
worse. In the case that fixation got worse data from visit 3 was missing
(Table 21).
Participant
number
Fixation at
baseline
Fixation at
visit 2
Fixation at
visit 3
Change in
fixation
stability
1 R R S Better
2 R R Same
3 R S R Same
5 S R S Same
6 R R R Same
7 R R S Better
8 S S Same
10 R U Worse
Table 21. fixation stability at baseline (visit 1), visit 2 and visit 3. S = stable
fixation, R = relatively unstable fixation, U = unstable fixation (Fujii et al,
2003).
5.4.5 Correlation between VA, CRT and retinal sensitivity
Neither VA or CRT correlated even at a weak trend level with percentage
retinal sensitivity change of 2dB or more or with 4dB or more (Table 22).

119
VA vs CRT
(N=6)
VA vs 2dB
(N=6)
VA vs 4dB
(N=6)
CRT vs 2dB
(N=6)
CRT vs 4dB
(N=6)
-‐0.573
(P=0.234)
-‐0.323
(p=0.532)
0.030
(p=0.955)
0.607
(p=0.201)
0.582
(p<0.226)
Table 22. Correlations between visual acuity of the treated eye (VA), central
1mm2 subfield retinal thickness of the treated eye (CRT) and percentage
increase in retinal sensitivity of 2dB or more or 4dB or more (N= sample
size).
5.6 Discussion
The mean increase in VA in this cohort of participants was 11 ETDRS letters
following 2 treatments with anti-‐VEGF agents. This is much larger than the
mean gain approximately 5.5 to 7.0 ETDRS letters in the corresponding time
points of much larger published clinical trial data sets of (Brown et al, 2011;
Chakravarthy et al, 2013; Schmidt-‐Erfurth et al 2014). The mean CRT
reduction was 61 micrometers, which is smaller than expected from the
same clinical trials (range approximately -‐120 to -‐180 μm). At first
assessment it may appear that the study cohort of patients is therefore not
representative of a typical population but caution has to be taken with this
view, as the sample size is small.
5.6.1 The use of lesion-‐guided microperimetry retinal sensitivity as an
outcome measure
The mean retinal sensitivity (RS) increased following the first and second
treatments. This is in line with other published studies, although different
methods of assessing RS have been used and so caution has to be taken
when making judgment. Munk et al reported an increase in RS when mean
central retinal sensitivity was studied in 64 treatment naïve patients treated
with monthly ranibizumab over a 12 month period (Munk et al, 2013). On

120
that occasion, the microperimetry map covered 33 points over the central
12 degrees of the macula and showed the largest increase in RS 4 months
post treatment and thereafter the RS plateaued. Correlation between the RS
and VA was not reported upon but a decrease in absolute scotoma size over
the course of the study was only significant at a trend level (p = 0.053).
Paravanno et al performed microperimetry on 5 occasions over 24 months
during the study of 18 patients that were treated with ranibizumab. They
were given an initial 3 monthly treatments then retreated with an ‘as
required’ dosing regimen. The RS map consisted of 37 points over the
central 12 degrees. On this occasion the VA improved up to 24 weeks then
slowly declined whereas the mean RS continued to improve out to 24
months. In the second year the greatest disconnect between VA and RS was
seen; the participants received a mean of 6.2 treatments achieving stable RS
despite their VA slowly declining (Paravanno et al, 2010).
Cho et al used an OTI (Ophthalmic Technologies Inc.) microperimetry device
to study 28 points in the central 12 degrees of the macula, in 42 eyes with
newly presenting untreated nvAMD. Mean RS increased and the absolute
scotoma decreased over the 12-‐month study period but no VA correlation
data was reported.
The three aforementioned studies all use the mean change in RS of a large
retinal map with a predetermined size. This technique has the advantage of
capturing the full extent of a large area affected by nvAMD but also has the
disadvantage of diluting the effect of any change with the surrounding
healthy retinal tissue that would not be expected to change. This effect
would be particularly strong in lesions of a smaller size. Baseler et al
evaluated retinal sensitivity across 40 degrees but only analysed the central
10 degrees as this was deemed to be the area where damage was most likely
to be (Baseler et al, 2011). In their study, in which a single case was
reported upon, the scotoma decreased in size and the overall RS improved.
Taking this concept of targeting the most appropriate area of the retina to
121
be studied a step further, the technique used in this chapter of the thesis
studied the affected area of the macula alone. The location of the CNV and its
sequelae was determined by late frame FFA and OCT morphology and so
defined an ‘area of interest’. Subsequently only RS change in this region was
analysed.
Squirrel et al (2010) performed a study similar in duration to the one
reported in this thesis whereby 10 eyes were analysed by MP out to one
month following 3 ranibizumab injections. They reported a mean increase in
RS of 2.9 dB (SD +/-‐1.5) over the 45 points measured within a central 12-‐
degree map. Using repeatability measures it was determined that a 2dB
change was likely to be significant change. Subsequently they reported that
9 of the 10 individuals had a change of at least 2 dB in 12 or more of the 45
points studied (Squirrell et al, 2010). This is a rather confusing statistic to
report and even interpret, but the concept of how many points increase by
2dB is an interesting one. However, the down side of reporting on how many
points change by a certain figure is that the size of the lesion and therefore
number of points within the lesion (26-‐76 in this case) will differ between
individuals. The study in this chapter therefore used the percentage of
points within the area of interest that changed by 2dB and so attempts to
correct for the size of the lesion. In fact the mean percentage of points that
increased by 2dB or more in active area was 62% after 2 treatments. This
seems an intuitively better way to represent the treatment effect.
Neither VA change nor CRT change came close to correlating with the
increase in percentage of points achieving 2 or 4 dB improvement. Because
of the low sample size it is therefore hard to interpret whether this result is
due the study being underpowered or indeed whether there is in fact no
correlation. Based upon these results it is again hard to validate RS used in
this way as a useful tool to measure visual function for an individual
response to treatment on a visit-‐to-‐visit basis.
122
Much as qualitative aspects of OCT morphology such as the presence of
retinal fluid represent disease activity and so are used to guide treatment
(Martin et al, 2011; Chakravarthy et al, 2012), future studies could be aimed
to see if retreatment criteria could be based upon the signs of disease
activity as represented by MP determined retinal function.
The weaknesses of this study have to be acknowledged, in particular the low
numbers and short duration of follow up, when interpreting the data.
Furthermore it has to be acknowledged that the participants may have
undergone a significant learning effect between the first and second
evaluations, as was noted by the work of Wu and colleagues (Wu et al,
2013). This potential bias was taken accounted for by not displaying the
change between the baseline and first follow up examination in figure 5.3.
Pre planning analyses on the correlation of VA, CRT and absolute RS may
have provided useful information in being able to validate RS as a useful tool
help guide re treatment decisions and should be considered for future
studies.
Nonetheless this study demonstrated that there was improvement in RS
within a high proportion of significant improvement points within the area
of interest. These data would act as good pilot data for a larger study to
confirm that this technique is a sensitive way of detecting RS change
following therapeutic intervention for nvAMD. Demonstrating that RS can
continue to improve or decline when VA and CRT plateau, particularly if
individuals continue to notice a change in their visual function, adds to the
argument for its routine evaluation in clinical practice. Alexander et al
demonstrated that in 5 of 21 eyes in the ‘stability phase’ of their treatment
as determined by stable VA and CRT when ranibizumab was not
administered, RS decreased (Alexander, Mushtaq, Osmond & Amoaku,
2012). Retinal sensitivity as a functional outcome of MP could act
synergistically along with VA and OCT to help determine outcomes or
treatment response.

123
The main disadvantage of using MP as a routine assessment tool is that the
time required to perform the examination can often be 8-‐12 minutes per
eye. So to commit significant resources to do this its added value over and
above OCT, which has an acquisition time of only around 1 minute per eye,
would have to be certain. In addition, technical reliability and staff time need
to be secured as both of these factors hampered data acquisition in this
study.
5.6.2 The evaluation of fixation stability as on outcome measure
Of the eight participants, two improved stability, five maintained stability
and one got worse. The general trend is toward maintenance or
improvement although it has to be noted that 2 already had stable fixation at
their initial assessment and so were subject to the ceiling effect. These
observations are broadly in line with other studies in the literature that also
used the Fujii method of assessing fixation on the MPI-‐1. Munk et al reports
that 63% of eyes had relatively stable fixation, 27% unstable and 10% stable
fixation before anti-‐VEGF treatment changing to 72%, 13% and 15%
respectively at 12 months (Munk et al, 2013). The cross sectional study of
102 patients by Pearce et al, 76 of whom had ranibizumab treatment,
demonstrated similar results in the treated group (Pearce et al, 2011).
Although the Fujii method of determining fixation stability is often used
(Parravano et al, 2010; Pearce et al, 2011; Munk et al 2013) it is a relatively
crude measure in that it is only a three-‐point scale (Fujii et al, 2003).
Crossland reports a potentially more accurate way of assessing fixation
stability by capturing fixation using a bivariate contour ellipse area (BCEA).
This gives a numerical value that has been showed to better correlate with
reading speed than the Fujji method (Crossland, Dunbar & Rubin, 2009). It
was not possible to retrospectively capture raw numerical data necessary to
calculate the BCEA or perform other analyses, but consideration should be
given to using this method for future studies.
124
Just as discussion about the qualitative aspects of OCT and MP have
suggested their usefulness in retreatment decisions, the same argument can
be applied to fixation data. If it was clear that disease activity was
threatening a PRL then a physician may be more likely to administer
treatment.
5.6.7 Conclusion
The use of microperimetry to assess RS and fixation stability has merits in
potentially being able to explain disconnect between visual function and
conventional methods of assessing disease activity such as OCT and VA. Both
quantitative and qualitative aspects need further study to evaluate if the
principle downside of these additional measurements, that is the time taken
to acquire the data, is outweighed by its benefits.

125
Chapter 6. Functional MRI Blood Oxygen Level Dependency response
as an outcome measure of visual function following the treatment of
neovascular Age-‐related Macular Degeneration: restoration of primary
visual cortex activity.
6.1 Introduction
By performing specific studies the previous chapters have discussed the use
of visual acuity (VA), central retinal thickness (CRT) and retinal sensitivity
(RS) as outcome measures when assessing the affect of treating neovascular
macular degeneration (nvMD). This chapter discusses the merits of using
functional MRI as an outcome measure and compares it with these
previously discussed methods.
6.2 Background
Treatment paradigms for neovascular Age-‐related, Macular Degeneration
(nvAMD) have been discussed in detail in previous chapters. After the
‘initiation phase’ of treatment when monthly intravitreal injections are
given, retreatment is in either a proactive or reactive manner (Brown et al,
2006; Rosenfeld et al, 2006; Martin et al, 2011; Charavarthy et al, 2012,
Schmidt-‐Erfurth et al, 2014). Most patients can expect an initial gain in
visual acuity followed by visual stability or a slow decline in the ‘stability
phase’ (Rofagha et al, 2013; Tufail et al, 2014; Airody et al, 2014). Despite
the routine use of VA measurement and OCT features these outcome
measures do not give a complete representation of visual function or indeed
the change in visual function in response to treatment.
Functional activity of the visual cortex as measured by the Blood Oxygen
Level-‐Dependent (BOLD) response on MRI has the potential to be an
objective measurement of visual response to retinal treatment and
complement existing assessment modalities. As neuronal activity increases
in the brain there is an increase in the amount of oxygenated blood

126
compared to deoxygenated blood. This is because neuronal activity causes a
release of the neuro-‐transmitter glutamate, leading to the release of nitric
oxide and ultimately dilation of blood vessels (Ogawa, Lee, Kay & Tank,
1990).
To enable the BOLD response to be a potential marker of visual function in
those treated for nvAMD two principle assumptions need to be met. The
first assumption is that there is the absence of significant re-‐modeling of the
visual cortex in those with AMD so that retinotopic (retina to cortex spatial
mapping) relationships are maintained. This assumption would mean that
any BOLD change that is observed would be due to the treatment
intervention and not natural recovery. A number of studies have debated
this point. Baker et al reported on preliminary fMRI investigations into 2
patients with severe AMD and suggested that visual processing could be
reorganised. It was demonstrated that peripheral retinal stimulation
activated the area of the visual cortex only normally represented by foveal
stimulation (Baker, Peli, Knouf & Kanwisher, 2005). Baker et al went on to
qualify this statement, after replicating the study in 3 further individuals, by
suggesting that this re-‐organisation may only occur if there was severe loss
of foveal function (Baker, Dilks, Peli, & Kanwisher, 2008). To add to this
argument Schumacher et al noted that this apparent degree of cortical
plasticity could be related to eccentric viewing. (Schumacher et al, 2008).
This debate about cortical reorganisation has swung the other way more
recently when Baseler et al performed fMRI assessments of a much larger
cohort of patients. All had established bilateral macular degeneration and no
significant activity in the foveal representation was observed (Baseler et al,
2011). Studies in macaque monkeys with macular degeneration have
confirmed this limited capacity for reorganisation in this so called lesion
projection zone (that is the area of the cortex that represents the area of
retinal defect) of the primary visual cortex (Smirnakis et al, 2005; Shao et al,
2013), but interestingly more extensive plasticity in the higher visual cortex
zone V5 was noted (Shao et al, 2013). It is worth noting that this absence of

127
significant reorganisation occurs in the presence of both monocular and
binocular retinal lesions, a point particularly important when studying
nvAMD, which typically has a unilateral onset (Murkami, Komatsu,
Kinoshita, 1997). So the balance of argument is now strongly in favour of
concluding that there is no significant cortical re-‐organisation in long-‐
standing retinal lesion acquired in adulthood.
The second assumption that needs to be fulfilled is that the visual cortex has
the ability to recover function. Boucard et al performed an MRI study of the
posterior pole anatomy in 9 AMD patients, average age of 72.6 years, and
demonstrated a reduced grey matter volume compared with age-‐matched
controls (Boucard et al, 2009). A similar anatomical study in adults with
long standing retinal defects also showed grey and white matter volume
changes (Noppeney, Friston, Ashburner, Frackowiak & Price, 2005).
Although these studies seem to deny this second assumption they did not
assess functional aspects of MRI and a direct relationship between structure
and function may not be inevitable. To support the case that function can
recover, Baseler et al has reported on a single case that showed clear
improvement in the BOLD visual cortical response when nvAMD was
treated with an anti-‐VEGF agent (Baseler, et al, 2011).
So the way seems to be paved to allow further assessment of the use of the
BOLD response in measuring outcomes of retinal treatment. The aim of the
study in this chapter was to determine the BOLD response of the visual
cortex in a cohort of individuals with nvAMD before, during and after the
initiation phase of treatment with anti-‐angiogenic therapy. Furthermore it
aimed to determine how the BOLD response compares with the standard
clinical methods of assessing vision and retinal anatomy.

128
6.3 Methods
This research followed the tenets of the Declaration of Helsinki. Informed
written consent was obtained from all participants following an explanation
of the nature and possible consequences of the study. Experimental
protocols were approved by the York Neuroimaging Research, Ethics and
Governance Committee and the University of York Ethics Committee.
6.3.1 Patient population and treatment
This study ran in parallel with the study described in Chapter 5 and on the
same cohort of individuals. To recap, treatment naïve patients that fulfilled
the National Institute for Health and Clinical Excellence (NICE) criteria for
treatment of nvAMD (Snellen VA 6/12 or less, nvAMD, evidence of recent
disease progression) were recruited in to the study. Participants were
excluded if they were unable to give written consent. All participants
underwent assessment with best-‐corrected visual acuity (BCVA) using an
ETDRS chart, OCT (Cirrus, Carl Zeiss Meditec) and fMRI at baseline (visit 1).
All participants were commenced on the recommended intravitreal anti-‐
VEGF agent at that time (ranibizumab 0.5mg in 0.05mls, or Aflibercept
2.0mg in 0.05mls) and received 3 monthly initiation doses under a standard
aseptic technique via the pars plana. Assessments (VA, OCT and MRI) were
repeated following the three initiation doses making a total of 4 sessions
(visit 2-‐4) per participant.
6.3.2 Visual acuity technique
This was as described in chapter 5 with participants having best corrected
visual acuity (BCVA) measured using an ETDRS chart (Pelli-‐Robson,
Precision-‐Vision) at 4 metres using their most up to date pair of distance
glasses.
129
6.3.3 Ocular coherence tomography
This was also as described in chapter 5. Following pupillary dilation a
standard macular cube assessment on a spectral domain OCT (Cirrus, Carl
Zeiss-‐Meditec) allowed the 1 mm2 central subfield central retinal thickness
to be recorded.
6.3.4 Functional MRI technique
At each visit there were two assessments of the treated eye and two of the
untreated (control) eye giving a total duration of examination of up to 30
minutes.
The stimulus was generated using MATLAB (Natick Laboratory; MATLAB
and Statistics toolbox release, The Mathworks, Inc., Natick, Massachusetts,
USA.) and presented using an LCD projector (EPSON GB5900, 60Hz refresh
rate, maximum luminance = 6000 candelas per metre squared -‐ Minolta
LS110 photometer). A 45 degree-‐tilted, front-‐silvered mirror was placed in
front of the subject's head, so the projection could occur onto the face from
the light source. A diffusing acrylic film was fit to some clear acrylic goggles,
which were placed over the subject's eyes. This film attenuated the mean
luminance to 1350 cd/m2. Additionally, underneath the goggles, either the
left or right eye of the subject was occluded with a sterile fabric eye patch
while measurements from the other eye were made. Participants were
instructed to keep both eyes open and to remain still during the scans; no
fixation was required. Foam padding was used around the participant's head
to minimise movement, with earplugs provided to protect from the noise of
the scanner. The stimulus was a contrast reversing Ganzfield, reversing at
6Hz. The stimulus was presented for 18 seconds and interleaved with
periods of mean luminance (grey screen) of 18 seconds each. This 36 second
stimulus cycle was repeated 8 times per scan.

130
Structural data were acquired using high-‐resolution T1-‐weighted images
and inplane structural images. Functional MRI data were acquired using an
eight-‐channel, phase-‐array head coil tuned to 127.4 MHz, on a General
Electric Signa HD Excite 3T MRI scanner. Gradient recalled echo-‐pulse
sequences were used to measure T2*-‐weighted blood oxygen level-‐
dependent (BOLD) data. The imaging parameters used for the T2* weighting
were TR = 3000ms, TE = 30ms, Flip angle = 90degrees, matrix size = 64 x 64,
field of view = 192 mm, slice thickness = 3 mm and voxel size = 3 x 3 x 3mm3
In additional to the functional data a whole head high resolution T1
weighted anatomical image was acquired with the following parameters:
TR = 7.92ms, TE = 2.9ms, matrix size = 256 x 256 field of view = 290 mm,
slice thickness = 1 mm and voxel size = 1 x 1.13 x 1.13mm3 This high
resolution brain image was used as a common space for comparison of data
across sessions. To aide alignment of data across sessions an additional
anatomical image was acquired as an intermediate step for aligning
functional data to the high-‐resolution whole brain dataset. This proton
density weighted image was acquired with the same slice prescription as the
functional data and with the following parameters: TR = 2500ms, TE =
34.9ms, matrix size = 512 x 512 field of view = 192 mm, slice thickness = 3
mm and voxel size = 3 x 0.375 x 0.375mm3 Pre-‐processing stages included;
MCFLIRT motion correction (Jenkinson, Bannister, Brady & Smith, 2002)
using FLIRT (FMRIB’s Linear Registration Tool), slice-‐timing correction
using Fourier-‐space time-‐series phase-‐shifting and linear detrend filtering,
to filter out any inconsistencies. Functional time-‐series were high-‐pass
filtered to remove baseline drifts.
Data analysis was performed primarily in MATLAB using the publicly
available mrVista toolbox (http://white.stanford.edu/software). Data were
averaged across scans for each participant and were aligned to the high-‐
resolution anatomical volume and visualised in 3D.
Based on anatomical criteria two regions of interest (ROI's), 5 mm in
diameter were chosen in each hemisphere from each participant. One was
131
chosen at the posterior occipital pole (PP), retinotopically representing the
macula region, and the second in the mid-‐calcarine (MC) region
representing a peripheral location in V1 to act as a control. The percent
BOLD signal change was averaged across all voxels within a given ROI. The
BOLD response (BR = a ratio) from the PP was controlled for the expected
variation (Rosengarth et al, 2013) in intersession response by correcting it
by the MC activity. To further minimise this variation the treated eye
response was also controlled by the untreated eye and so the final BR was
calculated using the following equation:
BR = (PP/MC) Treated / (PP/MC) Untreated
6.4.5 Statistical analysis
The stimulus driven amplitude of the signal recorded at each voxel within
the ROI was computed via a vector mean calculation. Data was averaged
across hemispheres within each scan session.
Pearson correlation coefficients were calculated between the treated eye
VA, the treated eye CRT and the BOLD response. A two-‐tailed probability
was calculated and P <= 0.05 was taken as statistical significance.
Data from participants that withdrew consent were not analysed. Missing
data was handled by excluding that session from the analysis and the
number of participants analysed displayed.
6.5 Results
Sixteen patients were recruited into the study, of which 6 withdrew consent
during the study. Data from the remaining ten patients were analyzed with
seven right and three left eyes affected. Mean age was 75.7 years (67-‐87)
with equal male to female distribution. All patients attended for their
treatment and VA/OCT assessments on schedule but only five attended all

132
four neuroimaging sessions. Of the remaining five, all attended for their first
assessment and two further assessments with one not attending the second
and two not attending their third or fourth assessments. Participant number
seven had BCVA measured by the Snellen technique rather than ETDRS on
the third visit so this data was excluded. The baseline VA, CRT and BOLD
characteristics are outlined in Table 23.
Participant
number
Baseline
BCVA
Treated
(letters)
Baseline
BCVA
Untreated
(letters)
Baseline
CRT
Treated
(μm)
Baseline
CRT
Untreated
(μm)
BOLD
(PP/MC)
Treated
BOLD
(PP/MC)
Untreated
1 75 85 309 261 0.282 0.591
2 62 75 269 235 1.462 1.453
3 79 71 292 288 0.430 0.459
4 60 84 366 245 0.132 0.473
5 40 79 314 288 0.187 0.388
6 55 69 272 266 1.991 1.183
7 69 94 335 315 0.824 1.190
8 70 68 260 237 0.337 1.166
9 62 74 233 258 0.373 0.479
10 28 72 738 317 0.439 -‐0.628
Table 23. The baseline (visit 1) characteristics of the 10 participants’
treated and untreated eyes (BCVA= Best Corrected Visual Acuity in ETDRS
letters, CRT= central 1mm2 subfield retinal thickness in micrometers, BOLD
= Vector mean projected amplitude of Blood Oxygen Dependency Level).
6.5.1 Visual acuity
The VA values for individual participants and the means of the cohort are
presented below.

133
Participant
number
BCVA
visit 2
Treated
(letters)
BCVA visit
2
Untreated
(letters)
BCVA
visit 3
Treated
(letters)
BCVA visit
3
Untreated
(letters)
BCVA visit
4 Treated
(letters)
BCVA visit
4
Untreated
(letters)
1 64 79 75 85 77 76
2 80 79 81 79 78 78
3 80 74 80 75 85 78
4 60 85 60 83 55 78
5 51 90 63 80 66 85
6 48 67 74 69 76 74
7 82 89 81 89
8 77 75 78 73 78 78
9 49 73 57 75 46 78
10 48 80 47 83 45 79
Table 24. Treated and untreated eye visual acuity (ETDRS letters) for the
participants, 1-‐10 over the 3 follow up sessions. A blank cell represents
missing data.
Mean
(SD)
BCVA
Baseline
Treated
(letters
n=10)
Mean
(SD)
BCVA
Baseline
Untreated
(letters
n=10)
Mean
(SD)
BCVA
visit 2
Treated
(letters
n=10)
Mean
(SD)
BCVA
visit 2
Untreated
(letters
n=10)
Mean
(SD)
BCVA
visit 3
Treated
(letters,
n=9)
Mean
(SD)
BCVA
visit 3
Untreated
(letters
n=9)
Mean
(SD)
BCVA
visit 4
Treated
(letters
n=10)
Mean (SD)
BCVA visit
4
Untreated
(letters
n=10)
59.8
(16.1)
77.1
(8.3)
63.9
(14.6)
79.1
(7.3)
68.3
(12.0)
78.0
(5.3)
68.6
(14.8)
79.3
(4.4)
Table 25. Treated and untreated mean and standard deviation (SD) visual
acuity (ETDRS letters) for the participants 1-‐10 over all 4 sessions, visit 1
(baseline) to visit 4. The number of sessions analysed (n) was 10 in all cases
except for visit three when the figure was 9 due to missing data.

134
Figure 14. Mean (standard deviation) visual acuity (y-‐axis, ETDRS letter
score) at visit 1 (baseline) to visit 4 (x-‐axis) for the 10 participants. Treated
data is displayed in blue and untreated data in red. See Table 23.
6.5.2 Central Retinal Thickness
The CRT values for individual participants and the means of the cohort are
presented below.
40
45
50
55
60
65
70
75
80
85
1 2 3 4
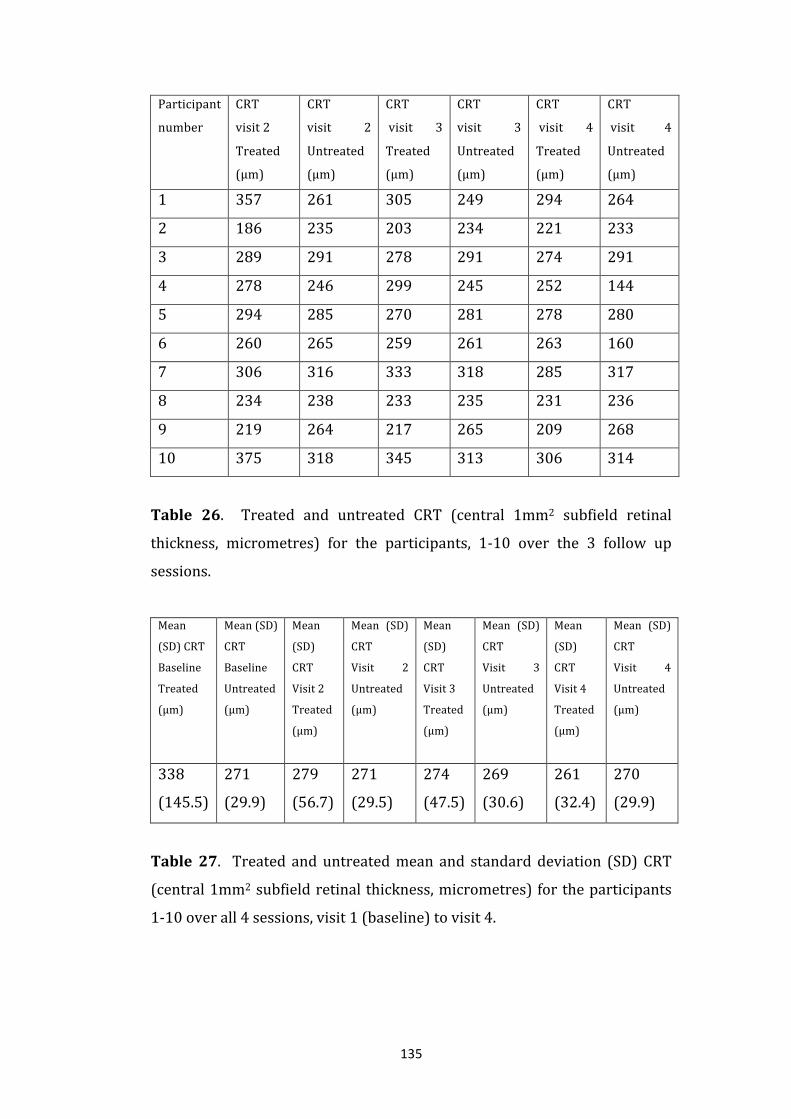
135
Participant
number
CRT
visit 2
Treated
(μm)
CRT
visit 2
Untreated
(μm)
CRT
visit 3
Treated
(μm)
CRT
visit 3
Untreated
(μm)
CRT
visit 4
Treated
(μm)
CRT
visit 4
Untreated
(μm)
1 357 261 305 249 294 264
2 186 235 203 234 221 233
3 289 291 278 291 274 291
4 278 246 299 245 252 144
5 294 285 270 281 278 280
6 260 265 259 261 263 160
7 306 316 333 318 285 317
8 234 238 233 235 231 236
9 219 264 217 265 209 268
10 375 318 345 313 306 314
Table 26. Treated and untreated CRT (central 1mm2 subfield retinal
thickness, micrometres) for the participants, 1-‐10 over the 3 follow up
sessions.
Mean
(SD) CRT
Baseline
Treated
(μm)
Mean (SD)
CRT
Baseline
Untreated
(μm)
Mean
(SD)
CRT
Visit 2
Treated
(μm)
Mean (SD)
CRT
Visit 2
Untreated
(μm)
Mean
(SD)
CRT
Visit 3
Treated
(μm)
Mean (SD)
CRT
Visit 3
Untreated
(μm)
Mean
(SD)
CRT
Visit 4
Treated
(μm)
Mean (SD)
CRT
Visit 4
Untreated
(μm)
338
(145.5)
271
(29.9)
279
(56.7)
271
(29.5)
274
(47.5)
269
(30.6)
261
(32.4)
270
(29.9)
Table 27. Treated and untreated mean and standard deviation (SD) CRT
(central 1mm2 subfield retinal thickness, micrometres) for the participants
1-‐10 over all 4 sessions, visit 1 (baseline) to visit 4.

136
Figure 15. Mean (standard deviation) 1mm2 central subfield retinal
thickness (y-‐axis, micrometres) at visit 1 (baseline) to visit 4 (x-‐axis) for the
10 participants. Treated data is displayed in blue and untreated data in red.
6.5.3 Vector mean projected amplitude of BOLD responses
The BOLD response for individual participants and the means of the cohort
are presented below.
200
250
300
350
400
450
500
550
1 2 3 4

137
Participant
number
BOLD
visit 2
Treated
(n=8)
BOLD
visit 2
Untreated
(n=8)
BOLD
visit 3
Treated
(n=9)
BOLD visit
3
Untreated
(n=9)
BOLD
visit 4
Treated
(n=8)
BOLD
visit 4
Untreated
(n=8)
1 0.474 0.746 -‐0.149 0.915
2 1.024 1.659 1.622 1.657
3 0.361 0.247 0.428 0.522 0.578 0.497
4 0.285 0.412 0.019 0.412
5 -‐0.147 0.143 0.106 0.161
6 1.862 1.554 1.312 1.713 1.761 1.609
7 0.618 0.868 0.669 0.918 0.813 0.614
8 0/152 0.333 0.763 0.680 0.472 0.586
9 0.454 0.622 0.388 0.589
10 0.112 -‐0.628 -‐0.263 -‐1.790 -‐2.622 -‐1.621
Table 28. Treated and untreated BOLD (vector mean projected amplitude
of BOLD responses) for the participants, 1-‐10 over the three follow up
sessions. A blank cell represents missing data. The number of participants
analysed (n) was less than ten across all sessions after baseline due to
missing data.
Mean
(SD)
BOLD
Baseline
Treated
(n=10)
Mean (SD)
BOLD
Baseline
Untreated
(n=10)
Mean
(SD)
BOLD
visit 2
Treated
(n=8)
Mean (SD)
BOLD
visit 2
Untreated
(n=8)
Mean
(SD)
BOLD
visit 3
Treated
(n=9)
Mean (SD)
BOLD
visit 3
Untreated
(n=9)
Mean
(SD)
BOLD
visit 4
Treated
(n=8)
Mean (SD)
BOLD
visit 4
Untreated
(n=8)
0.646
(0.644)
0.676
(0.604)
0.608
(0.584)
0.626
(0.753)
0.141
(1.123)
0.437
(0.888)
0.322
(1.459)
0.551
(1.025)
Table 29. Treated and untreated mean and standard deviation (SD) BOLD
(vector mean projected amplitude of BOLD responses) for the participants
1-‐10 over the 3 follow up sessions. Following the baseline assessment, the
number of participants analysed (n) was less than ten across the remaining
sessions due to missing data.

138
Figure 16. Mean (standard deviation) BOLD response (y-‐axis) at visit 1
(baseline) to visit 4 (x-‐axis). Treated data is displayed in blue and untreated
data in red.
Participant
number
BOLD
(Treated /
Untreated)
Baseline
(n=10)
BOLD
(Treated /
Untreated)
visit 1 (n=8)
BOLD
(Treated /
Untreated)
visit 2 (n=9)
BOLD
(Treated /
Untreated)
visit 3 (n=8)
1 0.478 0.633 -‐0.163
2 1.006 0.617 0.979
3 0.938 1.458 0.820 1.186
4 0.279 0.692 0.046
5 0.481 -‐1.030 0.657
6 1.683 1.200 0.766 1.940
7 0.693 0.712 0.729 1.323
8 0.289 0.458 1.218 0.805
9 0.781 0.730 0.659
10 -‐0.699 -‐0.164 1.474 1.612
-1.5
-1
-0.5
0
0.5
1
1.5
2
1 2 3 4
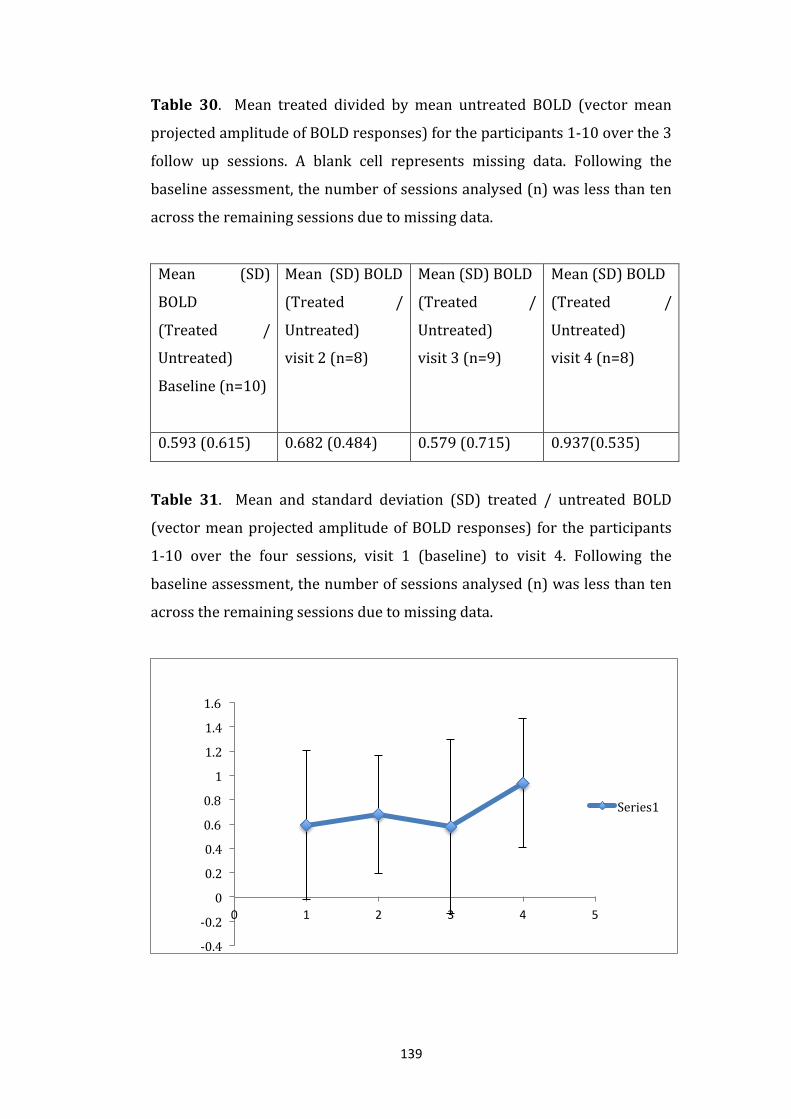
139
Table 30. Mean treated divided by mean untreated BOLD (vector mean
projected amplitude of BOLD responses) for the participants 1-‐10 over the 3
follow up sessions. A blank cell represents missing data. Following the
baseline assessment, the number of sessions analysed (n) was less than ten
across the remaining sessions due to missing data.
Mean (SD)
BOLD
(Treated /
Untreated)
Baseline (n=10)
Mean (SD) BOLD
(Treated /
Untreated)
visit 2 (n=8)
Mean (SD) BOLD
(Treated /
Untreated)
visit 3 (n=9)
Mean (SD) BOLD
(Treated /
Untreated)
visit 4 (n=8)
0.593 (0.615) 0.682 (0.484) 0.579 (0.715) 0.937(0.535)
Table 31. Mean and standard deviation (SD) treated / untreated BOLD
(vector mean projected amplitude of BOLD responses) for the participants
1-‐10 over the four sessions, visit 1 (baseline) to visit 4. Following the
baseline assessment, the number of sessions analysed (n) was less than ten
across the remaining sessions due to missing data.
-‐0.4
-‐0.2
0
0.2
0.4
0.6
0.8
1
1.2
1.4
1.6
0 1 2 3 4 5
Series1
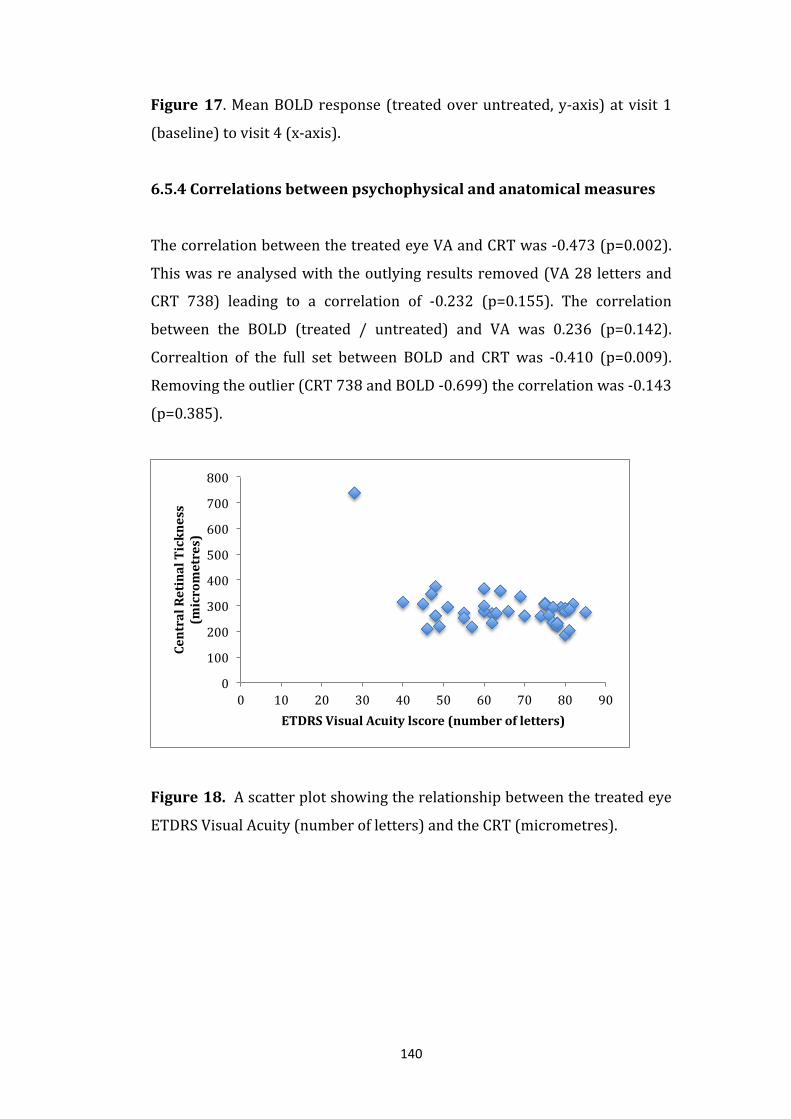
140
Figure 17. Mean BOLD response (treated over untreated, y-‐axis) at visit 1
(baseline) to visit 4 (x-‐axis).
6.5.4 Correlations between psychophysical and anatomical measures
The correlation between the treated eye VA and CRT was -‐0.473 (p=0.002).
This was re analysed with the outlying results removed (VA 28 letters and
CRT 738) leading to a correlation of -‐0.232 (p=0.155). The correlation
between the BOLD (treated / untreated) and VA was 0.236 (p=0.142).
Correaltion of the full set between BOLD and CRT was -‐0.410 (p=0.009).
Removing the outlier (CRT 738 and BOLD -‐0.699) the correlation was -‐0.143
(p=0.385).
Figure 18. A scatter plot showing the relationship between the treated eye
ETDRS Visual Acuity (number of letters) and the CRT (micrometres).
0
100
200
300
400
500
600
700
800
0 10 20 30 40 50 60 70 80 90
Central Retinal Tickness
(micrometres)
ETDRS Visual Acuity lscore (number of letters)

141
Figure 19. A scatter plot showing the relationship between the treated eye
the BOLD response and the ETDRS Visual Acuity (number of letters).
Figure 20. A scatter plot showing the relationship between the treated eye
BOLD response and the CRT (micrometres).
0
10
20
30
40
50
60
70
80
90
-‐1.5 -‐1 -‐0.5 0 0.5 1 1.5 2 2.5
ETDRS Visual Acuity score (num
ber of letters)
BOLD response
0
100
200
300
400
500
600
700
800
-‐1.5 -‐1 -‐0.5 0 0.5 1 1.5 2 2.5
Central Retinal Thickness
(micrometres)
BOLD response

142
6.6 Discussion
The mean VA improvement from pre treatment to after the third treatment
of 8.8 ETDRS letters is in line with the expected response from larger
published trials (Brown et al, 2011; Chakravarthy et al, 2013; Schmidt-‐
Erfurth et al 2014). Similarly the corresponding reduction in central 1mm
subfield CRT of 129.4 microns was smaller but similar to that expected. This
demonstrates that our subject population is broadly representative of a
typical population of nvAMD patients.
The BOLD response of both the treated and untreated eyes showed a mean
decrease over the 4 sessions. At first glance this is surprisingly
counterintuitive, but is a well-‐documented phenomenon, thought to be due
to habituation or attenuation possibly because the same stimulus is
presented at each session (Rosengarth et al, 2013). When the response of
the treated eye was corrected for this expected variability by using the
quotient of the untreated eye response, and the quotient of the MC, an
improvement in activity was demonstrated from the first to the fourth
session. This method of using a quotient is a logical step to take to
counteract the habituation / attenuation effect. Just as Rosengarth had used
during many of her experiments, the method used in this thesis employed a
full field as a stimulus at each visit. This aimed to give consistency across
sessions, but ultimately may have worked against the ability to show a
greater effect. To counteract the habituation / attenuation effect an
alternative method would have been to use either a stimulus appearing in
multifocal locations over a short time sequence or to use randomly selected
different patterns during and between sessions. Consideration needs to be
given to this for future studies. In a similar vein the VA and CRT data could
have been presented using quotients of treated eye divided by untreated
eye, but because there are relatively small standard deviations associated
with the mean values of the treated eyes this calculation seems unnecessary.

143
Nonetheless, using the quotient the rise in BOLD is consistent with the effect
shown in Baseler et al’s single case report (Baseler et al, 2011). It supports
the notion that the area of the primary visual cortex anatomically mapped to
and so representing the central macula is able to increase its activity after a
period of having reduced activity due to nvAMD. A degree of caution has to
be applied to this conclusion though as the standard deviations are very
large. It may be that a non-‐parametric statistic would capture the overall
trend in BOLD response change without displaying such high variance in the
absolute quotient and this type of analysis should be considered as a pre-‐
planned outcome measure for future studies. The increase in cortical
activity following treatment is an important finding in its own right but also
allows the discussion about the place of using the BOLD response as an
outcome measure of the treatment of AMD. The significant variability in the
single subject BOLD response between sessions indicates that it is not a
good measure of individual response to treatment from visit to visit. When a
cohort is studied the mean change in BOLD is less vulnerable to this
variability and so it is better to use mean values to demonstrate treatment
effect. This conclusion is similar to that of the use of VA in chapter 1, in that
as an outcome measure it is also open to significant intersession coefficient
of variability (Patel et al, 2008; Aslam et al 2014).
What cannot be demonstrated is if the recovery of visual cortex function is
back to its fully pre diseased state as we do not have BOLD data prior to the
onset of the neovascularisation. One would estimate that there would be full
recovery if the retinal function allowed it, and can extrapolate thinking from
other disease processes. From studies of patients treated for nvAMD it is
known that VA does not return to the pre-‐diseased level (Airody et al, 2014;
Tufail et al, 2014), but this is likely to be due to the incomplete amelioration
of the retinal pathology as we see full visual recovery following treatment of
other causes of reversible visual loss such as following cataract surgery. It
has already been discussed that anatomical changes can occur in the grey
matter in those having developed AMD and those with longer term retinal
lesions (Noppeney et al, 2005; Boucard et al, 2009; Hernowo et al 2013).

144
Following on from this point, it is also not possible to conclude if there is a
critical window of opportunity to protect the visual cortex from an inability
to recover activity either fully or partially. This knowledge would have
implications on the timing of treatments to try to recover vision following
the onset of nvAMD and furthermore whether neuro-‐protection strategies in
new onset disease would be advisable.
This study was open to bias in a number of areas in particular in the
subjective selection of the Regions of Interest (ROIs). The ROIs were
determined by selecting what was estimated to be the correct anatomical
locations corresponding to the macula and to a region in the peripheral
retina without any knowledge of their function. It is possible that the
posterior pole and to a lesser extent the mid calcarine regions selected were
not of the correct location, size or shape and therefore do not show the full
effect of the change. To counteract this the ROIs could be selected to find the
regions that have the greatest increase when the raw BOLD data is
visualised, but this technique could be criticised in that one could ‘select the
result to fit the question’. An alternative is to use line ROIs that join the PP
and MC areas as done by Smirnakis et al. This captures a much larger cross
section of the cortex which means that the location of the change in the
BOLD response and not just its magnitude become the important end points
(Smirnakis et al, 2005). Further consideration should also be given to using
larger regions of interest, even possibly the whole visual cortex, which may
increase the chance of capturing change in activation.
Another area of bias was that by the very nature of the duration and
commitment required for fMRI, and particularly so in this older population,
not all participants were able to attend all sessions. This could compromise
the quality of the data. However given that only 5 sessions were missed in a
total of 40, and that no participant missed more than one session, the results
are likely to be representative of a full dataset. The fact that participants
were not always able to attend their session as well as the cost, duration and
contraindications for the use of MRI, strengthens the argument that fMRI is

145
not a suitable tool for an assessment tool to guide re-‐treatments. The
reasons listed would have also contributed to slow recruitment into the
study. Once again, all of these factors need to be taken into consideration for
future studies.
Correlations between the VA, CRT and BOLD response all missed
significance, which could be due to the under powering of the study, but may
also be due to the techniques being insufficiently sensitive to detect small
change.
Further work need to be done to refine the technique of both detection and
analysis of the BOLD response, in order to increase its sensitivity. Although
using the mid calcarine response and the fellow eye to control for the
variation in the BOLD response seems logical, this quotient is in fact a ratio
of a ratio and therefore has significant disadvantages. It may be an
inherently unstable value particularly when there are large changes in the
denominators. In addition to the drawback it may not be valid to use
parametric analyses. Furthermore the use of negative values (as driven by
some negative BOLD responses) appears intuitively inappropriate. These
are all useful learning points for the design of future outcome analyses using
the BOLD response.
6.7 Conclusion
The results of this study quite substantially confirm that the area of the
primary visual cortex anatomically mapped to and so representing the
central macula is able to increase its activity after a period of having reduced
activity due to nvAMD. Furthermore measuring the BOLD response by fMRI
appears to have potential to be a good, objective way assessing cortical
function in response to treatment. However, due to its intersession
variability and for practical reasons, the technique described in this thesis is
best placed to assess cohorts of individuals, retrospectively over multiple
scans, and at the moment in the research setting.

146
Chapter 7. Quantifying the adverse effects of macular degeneration
treatment: Short term intraocular pressure trends following
intravitreal Ranibizumab injections for neovascular Age-‐related
Macular Degeneration and the role of oral Acetazolamide in protecting
glaucoma patients
7.1. Introduction
The preceding chapters have focused attention on measuring the efficacy
outcomes of the treatment of neovascular macular degeneration (nvMD). An
equally important consideration of any treatment is the quantification of
adverse events. This chapter studies the risk and implications of short term
raised intraocular pressure (IOP) as a side effect of treatment of neovascular
age-‐related macular degeneration (nvAMD) with intravitreal ranibizumab.
Furthermore the prevention of raised IOP with the use of oral acetazolamide
is evaluated in a randomised controlled trial.
7.2. Background
As has been highlighted in previous chapters, nvAMD contributes
substantially to the visual loss burden in society (Owen et al, 2012).
Following a ruling by the National Institute of Health and Clinical excellence
(NICE) in 2008, routine treatment is widely available in the UK and on
average enables partial restoration of vision and its continued preservation
in the longer term (NICE TA155, 2008; Rofagha et al, 2013; Tufail et al,
2014; Airody et al, 2014; Schmidt-‐Erfurth et al, 2014).
All therapeutic interventions have associated side effects or complications
and intravitreal injections with anti-‐VEGF agents are no exception to this
rule. The most feared complications are as a result of structural damage to
the eye at the time of injection or as a result of an infection affecting the
internal coats of the eye manifesting in the post injection period, a process
termed endophthalmitis. Endophthalmitis often leads to a devastating

147
outcome on final visual acuity and routine precautions such as prophylactic
antiseptic treatments and a strict aseptic environment are routinely
employed (Boyer, Heier, Brown, Francom & Ianchulev, 2009; Hasler et al,
2014). These events, although uncommon, have been well studied and occur
at a frequency of less than 1 in a 1000 injections, with endophthalmitis at
approximately 1 in 3000 injections, (Brown et al, 2006; Rosenfeld et al,
2006; Boyer et al, 2009; Martin et al, 2011; Chakravarthy et al 2012).
A less well-‐studied side effect is the phenomenon of short term raised IOP
following injection into the vitreous cavity. This unwanted effect is
particularly relevant to patients who have glaucoma, a condition whereby
there is progressive loss of the retinal nerve fibre layer manifesting as a
‘cupped’ appearance of the optic nerve. This loss causes peripheral visual
defects and as the condition progresses towards an advanced stage field loss
encroaches on and then finally obliterates the nerve responsible for fixation.
The principle risk factor for glaucoma is raised IOP, which untreated is
usually above the normal range of 10-‐22mmHg. Treatment is aimed at
pharmacologically, and occasionally surgically, lowering the IOP and
reducing the diurnal variation of the pressure.
At the time of an intravitreal injection of a therapeutic dose of and anti-‐VEGF
agent (usually 0.05mls) a sharp rise in IOP occurs, raising it to a mean value
of around 44mmHg. After 30 minutes the IOP usually subsides to around
30mmHg (Kim Manravadi, Hur & Covert, 2008; Falkenstein, Cheng &
Freeman, 2007; Hollands, Wong, Bruen, Compbell, Sharma & Gale, 2007). As
commented upon by Mathalone et al, this effect may not be transient. In
approximately 11% of 201 eyes treated with bevacizumab the IOP rise was
sustained, being defined at IOP greater than 22mmHg or a rise of 6mmHg or
more from baseline for at least 30 days. Retreatment intervals of less than 8
weeks were found to be a risk factor (Mathalone et al, 2012).
With the knowledge that nvAMD is a chronic disease requiring multiple
injections over a number of years (Rofagha et al, 2013; Tufail et al, 2014;

148
Airody et al 2014), concern has been raised as to the whether peripheral
visual loss may be being promoted in those who have glaucoma and are
being treated for nvAMD. Loss of peripheral vision has particular
implications for those being treated for nvAMD who, by NICE guided
criteria, must already have compromised central vision (Kim et al, 2008;
Falkenstein et al, 2007). Furthermore debate exists as to whether those with
glaucoma are more vulnerable to IOP rise following injection. In Kim et al’s
study of 213 consecutive injections in 120 eyes a mean IOP immediately
post injection of 44 mmHg (range 4 to 87 mmHg) was observed. Twenty of
these patients had pre-‐existing glaucoma and it was noted that these
glaucomatous eyes took significantly longer to return to a pressure of 30
mmHg or lower (Kim et al., 2008). To support the opposing view Frenkel et
al studied 22 patients receiving intravitreal pegaptanib injections (a less
efficacious and so now a less commonly used anti-‐VEGF agent) and showed
no statistical significance between the 2 groups at any time interval. This
study however only had 9 glaucoma patients and there was no clarity about
which of the patients may have received prophylactic IOP lowering
treatment (Frenkel et al., 2007).
Similarly it is not clear if treatments to prevent raised IOP are useful.
Frenkel et al reported upon another series of 71 patients being injected with
one of three different types of anti-‐VEGF agents: ranibizumab, bevacizumab
and pegaptanib. Various types of prophylactic IOP lowering medication (the
anti-‐glaucoma drops timolol, brimonidine, aproclonidine and brinzolamide
or oral acetazolamide) were administered 1-‐2 hours prior to injection in
around two thirds of cases. The report concluded that glaucoma patients
behaved in a similar manner to non-‐glaucoma patients and that IOP-‐
lowering medications were essentially ineffective (Frenkel, Haji & Frenkel,
2010). The non-‐randomised and inconsistent use of medications in this
study casts doubt upon the validity of such a bold statement. Theoulakis et
al however, reported on a prospective double-‐blind placebo controlled
study and concluded that use of Combigan (brimonidine and timolol) twice
a day on the day before an intravitreal injection of Ranibizumab is effective.

149
Unfortunately on this occasion IOP was not measured immediately post
injection missing the highest IOP spike (Theoulakis et al., 2010). All of these
studies mentioned so far did not specifically study the population most at
risk to losing peripheral visual field: those with glaucoma or glaucoma
suspect.
Any loss of the nerve fibre layer and associated visual field with single IOP
spike is likely to be too small to be detectable with current technology and
so ideally very long term studies of these indices should be performed. As
with the studies described so far in this chapter raised IOP is often taken as
a surrogate marker of potential visual field loss and so is the focus of
investigation (McMonnies, 2008; Kim et al, 2008; Falkenstein et al, 2007;
Frenkel et al, 2007; Frenkel et al, 2010). The aim of the study in this chapter
is to determine the effect of a single prophylactic medication, oral
acetazolamide, on lowering the peak and duration of IOP rise in glaucoma
and glaucoma suspect patients, following an injection of ranibizumab for
nvAMD. Oral acetazolamide was chosen because of it known properties in
being able to clear volume from so called ‘fourth spaces’ such as the vitreous
and its already established use in some nvAMD treatment clinics.
7.3. Methods
In accordance with the Declarations of Helsinki, York Teaching Hospital NHS
Foundation Trust gave approval for the study and the trial was assigned
EudraCT (European clinical trial database) number 2010-‐023037-‐35.
7.3.1 Participant selection
Participants were recruited from a single centre nvAMD treatment clinic,
had to have been previously diagnosed with glaucoma or glaucoma suspect
and to require an intravitreal injection of ranibizumab in accordance with
NICE guidance (NICE TA155, 2008). The full inclusion and exclusion criteria
are listed in Table 32.

150
Inclusion criteria:
1. Patients with nAMD requiring Ranibizumab injections.
2. Glaucoma or glaucoma suspect.
3. Able to give written informed consent.
Exclusion criteria:
1. Baseline pre-‐injection IOP of 30 mmHg or higher.
2. Known allergy to sulphur/sulphonamide containing drugs or acetazolamide.
3. Severe kidney or liver disease/dysfunction.
4. Adrenal gland failure.
5. Hyperchloraemic acidosis.
6. Hepatic cirrhosis.
7. Pregnancy/Pre-‐menopausal.
8. Concomitant use of other oral carbonic anhydrase inhibitors.
9. Enrolment in a pre existing clinical trial
Table 32. The inclusion and exclusion criteria for participation in the IOP
rise prophylaxis study.
7.3.2 Trial design
Participants were randomised 1:1 to receive either 500mg acetazolamide or
no treatment 60-‐90 minutes prior to treatment. The randomisation
sequence had previously been software generated by an independent
member of staff and was held by the trial pharmacist. In accordance with the
Royal College of Ophthalmologists guidance on administration of
intravitreal therapies, 0.5mg in 0.05mls of ranibizumab was administered
via the pars plana (RCOphth, 2009). The IOP was measured using a Tono-‐
Pen (Medtronic Xomed Ophthalmics Inc., Mineapolis, Minnesota, USA) prior
to injection to give the baseline (TB) reading. A second member of the
151
research team verified the reading on the Tono-‐Pen screen. Further
readings were taken immediately after the injection (T0) and subsequently
at 5 (T5), 10 (T10) and 30 (T30) minutes post treatment.
7.3.3 Statistical methodology
The primary end points were change in IOP from baseline to time points T0,
T5, T10 and T30. No published data existed on the anticipated treatment
effect. An effect of 9mmHg difference at T0 was therefore estimated based
upon clinical experience of the use of acetazolamide in other conditions with
raised IOP by three ophthalmologists. To provide a power of 80% with a 5%
significance level 12 participants in each arm were required.
An intention to treat analysis was used, with repeated measures ANOVA to
compare IOP over time and ANCOVA to compare between the arms at each
time point. All analyses were adjusted for baseline IOP. All analyses were
undertaken on SPSS version 18.0 (IBM, Portsmouth, UK) and p < 0.05 was
considered to indicate statistical significance.
An exploratory endpoint was to observe any treatment differences in the
subtypes of glaucoma at baseline. These baseline observations along with
age, sex and race were summarised using means (standard deviations),
medians (inter-‐quartiles ranges) and proportions (percentages).
7.4 Results
Twenty-‐four participants were randomised and completed the study. Their
baseline characteristics are displayed in Table 33.

152
No aceta-‐
zolamide
(12)
Aceta-‐
zolamide (12) Total
Age Mean (SD) 84.9 (7.4) 80.8 (4.6) 82.9 (6.4)
Gender Male 5 (42%) 9 (75%) 14 (58%)
Female 7 (58%) 3 (25%) 10 (42%)
Ethnic group Caucasian 12 (100%) 12 (100%)
24
(100%)
Eye injected with
Lucentis during
study
Right eye 7 (58%) 6 (50%) 13 (54%)
Left eye 5 (42%) 6 (50%) 11 (46%)
Type of
Glaucoma or
suspected
glaucoma
Normal
tension
glaucoma
0 (0%) 2 (17%) 2 (8%)
Primary /
Chronic
open angle
glaucoma
10 (83%) 8 (67%) 18 (75%)
Angle
closure
glaucoma
1 (8%) 0 (0%) 1 (4%)
Glaucoma
Suspect 1 (8%) 2 (17%) 3 (13%)
Trabeculectomy No 11 (92%) 10 (83%) 21 (88%)
Yes 1 (8%) 2 (17%) 3 (12%)
Cataract surgery No 6 (50%) 7 (58%) 13 (54%)
Yes 6 (50%) 5 (42%) 11 (46%)
Number of
concomitant
medications for
glaucoma
0 1 (8%) 2 (17%) 3 (13%)
1
7 (58%)
5 (42%) 12 (50%)
2 4 (33%) 5 (42%) 9 (38%)

153
Table 33. Baseline characteristics of study participants in the acetazolamide
treated and non-‐treated groups.
A reduction in IOP was demonstrated from T0 to T30 (F(4)=72.97, p<0.001),
although no difference between the two groups was observed (F(1)=0.57,
p=0.459). Data is displayed in Table 34 and graphical representation in
Figure 18.
Mean (SD)
Range 95% CI
Baseline (TB) No Acetazolamide 15.1 (5.5) [8-‐26]
12.0, 18.2
Acetazolamide 15.8 (4.8) [8-‐26] 13.1, 18.4
Post Lucentis
injection at 0
minutes
(mmHg)
No Acetazolamide 44.5 (19.8) [19-‐86] 33.3, 55.7
Acetazolamide 42.2 (10.2) [25-‐58] 36.4, 48.0
Post Lucentis
injection at 5
minutes
(mmHg)
No Acetazolamide 31.4 (14.4) [13-‐65] 23.3, 39.6
Acetazolamide 27.1 (10.0) [14-‐48] 21.4, 32.7
Post Lucentis
injection at 10
minutes
(mmHg)
No Acetazolamide 24.5 (11.7) [10-‐50] 17.9, 31.1
Acetazolamide 21.3 (7.0) [10-‐35] 17.4, 25.3
Post Lucentis
injection at 30
minutes
(mmHg)
No Acetazolamide 20.6 (9.5) [11-‐46] 15.2, 25.9
Acetazolamide 15.7 (4.3) [8-‐21] 13.3, 18.2

154
Table 34. Intraocular pressures in the acetazolamide and control group
over each time point summarised with descriptive statistics.
Figure 21. Mean (SD) intraocular pressure (mmHg, y axis) for time points
TB, T0, T5, T10, T30 (minutes, x axis). The dashed line indicates the
injection occured between TB and T0
Single time points were analysed in an attempt to reveal data for potential
future studies, such as observing IOP over a longer duration. No difference
was seen between the two groups at time points T0, T5 or T10 but a
difference at T30 was noted (SD 0.1, 95% CI 1.3-‐9.8, p= 0.013). Data for
these time points is displayed in Table 35.

155
Absolute change from TB Difference
between
groups
adjusting for
baseline
Mean (SD)
(95% CI)
ANCOV
A p-‐
value
No
Acetazolamide
(SD)
Acetazolamide
(SD)
Change from
TB to T0
29.4 (16.1) 26.4 (8.2) 3.8 (0.4) (-‐6.2,
13.7)
0.440
Change from
TB to T5
16.3 (10.0) 11.3 (9.7) 5.4 (0.2) (-‐2.7,
13.5)
0.183
Change from
TB to T10
9.4 (8.5) 5.6 (6.0) 4.0 (0.2) (-‐2.3,
10.3)
0.201
Change from
TB to T30
5.5 (5.4) 0.00 (4.4) 5.5 (0.1) (1.3,
9.8)
0.013
Table 35. A comparison in the change in IOP from baseline to T0, T5, T10
and T30 between the treated and untreated groups.
A post-‐hoc analysis of area under the curve was calculated for the two
groups: 780.4 for the group not receiving acetazolamide and 665.0 for the
treated group.
Throughout the short time participants were enrolled in this study no
serious adverse or adverse events were reported.
7.5 Discussion
This study shows that transient IOP increase following intravitreal injection
of ranibizumab for nvAMD is commonplace and can be substantial in
glaucoma and glaucoma suspect patients. These results are in line with
previous studies that have not specifically followed glaucoma patients
(Frenkel et al, 2007; Kim et al, 2008; Schmidt-‐Urfurth, 2010; Frenkel et al,

156
2010) although debate continues as to whether IOP behaves differently
following an injection in those with glaucoma compared to those without
(Kim et al, 2008, Frenkel et al, 2010). Nonetheless, given that IOP spikes are
a risk factor for the development and progression of glaucoma (McMonnies,
2008), and understanding that a substantial increase in IOP occurs with
injections (and potentially worse still as treatments may be up on a monthly
basis), precautionary measures must be considered in this at risk
population.
The study in this chapter used oral acetazolamide as prophylactic treatment
to try and address the issue of prevention of IOP rise following intravitreal
injection. The treatment and non-‐treatment groups were well balanced for
baseline characteristics, although the non-‐treatment group was slightly
older and had a female propensity, so any differences in effect are likely to
be due to the treatment. Overall, no statistical significant difference was
observed between the group that received acetazolamide and the group that
did not. In an attempt to look for data that may be useful to be able to power
future studies an analysis of the single time points were performed. A
statistically significant reduction in post injection IOP spike was seen at T0,
T5 or T10 but a difference was observed at T30 (20.6mmHg versus
15.8mmHg). At first assessment the results therefore imply that the peak
IOP is not affected by the treatment but the duration of IOP rise is
shortened. This finding would need further examination to be confirmed. It
can be argued that a modest reduction in IOP at 30 minutes may not be
clinically significant in all but those patients with the most vulnerable
retinal nerve fibre layers.
There are two mechanisms whereby raised IOP can potentially cause nerve
fibre layer damage; peak IOP and sustained raised IOP. Without the benefit
of having measured the nerve fibre layer thickness at these time points
using optical coherence tomography (and assuming the degree of change
would in fact be measurable after a single injection), it is not easy to discern
which of these factors is the most important. It may well be that both play a

157
role and that the IOP reduction in the area under the curve is important
(Figure 18). Post hoc analysis showed a numerical difference suggesting that
this could be a candidate measure for future studies. Furthermore an
interesting observation to note is that at each time point the range of
measured IOPs and the peak pressure was substantially lower in the treated
group; this reduced chance of a very high peak pressure may be of more
clinical significance in protecting the nerve fibre layer than the mean
reduction in IOP and so the effect of the prophylactic acetazolamide may be
more than it first appears. A larger sample size may have been able to detect
this difference.
If clinicians choose to use acetazolamide as prophylaxis against IOP rise they
will need to debate the clinical significance of these findings. In particular
there is a need to balance the apparent limited degree of efficacy with the
potential side effects of treatment. Although no adverse events were
reported in this study, acetazolamide can precipitate renal impairment and
confusion, particularly in the elderly, which is of course the nvAMD
population.
Analysing the exploratory outcome of differences between the groups based
upon the type of glaucoma was not valid as by far the majority of
participants had primary open angle glaucoma.
The design of the study in this chapter was robust in all but the method of
informing the power calculation. Perhaps a larger group of clinical experts
may have decided upon a lower peak reduction in IOP and so a larger
sample size would be been used: the study appears under-‐powered.
Nonetheless the results of this study act as good pilot data to inform future
studies. Furthermore, proving a statistical significance may not necessarily
change its clinical relevance.
Prophylactic medical treatments are unlikely to be able to prevent the full
extent of the IOP spike as the globe is principally a rigid structure. A positive

158
correlation has been described between rigidity coefficient and age
suggesting that injection into an older more rigid eye would produce a
higher peak IOP (Pallikaris, Kymionis, Gnis, Kounis & Tslimbaris 2005;
Kotliar et al, 2007). Other factors have also been found to contribute to the
degree of IOP rise such as the volume of the eye, needle bore size, vitreous
reflux, and volume injected (Kim et al, 2008; Kotliar et al, 2007). In some
eyes that are the most vulnerable to an IOP spike the only way to prevent an
IOP rise may be to remove the equivalent volume from the eye immediately
prior to injection. This is not a published technique and has the additional
risk of requiring two punctures.
7.6 Conclusion
This chapter reports on the first randomised controlled trial studying the
prophylaxis of IOP rise following intravitreal injection in glaucoma and
glaucoma suspect patients. Oral acetazolamide given 60-‐90 minutes before
ranibizumab injection to treat nvAMD reduced mean IOP 30 minutes post
injection by approximately 5 mmHg. Although this figure in itself it likely to
be of little clinical significance, the reduction in peak IOP values immediately
following injection and the reduced ‘area under the curve’ may well be
important to those most vulnerable to pressure rise.

159
8. Summary and Conclusions: Quantification of neovascular macular
degeneration treatment
This thesis began by discussing macular degeneration and with particular
emphasis on the neovascular form and its treatments. The common and
some novel ways of quantifying treatment effect were then examined in a
series of 6 studies. This final chapter summarises the context of the thesis,
its findings and then discusses some alternative methods of assessing
outcomes of treatments not studied here, before drawing final conclusions.
8.1 Overview of the context
Neovascular macular degeneration, and in particular the age-‐related form is
a common cause of vision loss in the population (Owen et al, 2012).
Treatments are now available in the form of regular anti-‐vascular
endothelial growth factor (anti-‐VEGF) injections into the vitreous of the eye,
which not only restore a degree of the visual loss but also maintain vision in
the long term (Martin et al, 2011; Chakravarthy et al, 2012; Schmidt-‐Erfurth
et al, 2014; Tufail et al, 2014; Airody et al, 2014). Measuring the outcome of
treatments is an important aspect of any care, not only to document
progression through the disease journey, but also to aid treatment decisions
such as which therapies to use and when. Documenting outcomes are
equally important when describing the response to or side effects of
treatments in populations, as effects are not always necessarily predictable
in individuals.
In a clinical setting the conventional way of reporting nvAMD treatment
outcome is to use Visual Acuity (VA) (Brown et al, 2006; Rosenfeld et al,
2006; Tufail et al, 2014). There is much discussion about the merits of doing
this, in particular that VA alone may not be a comprehensive representation
of vision and indeed could underestimate visual function (Scott et al, 1994;
West et al 1997; Mangione et al, 1999; Maclure et al, 2000; Hazel et al,
2000). Central retinal thickness (CRT) as measured by Optical Coherence
160
Tomography (OCT) is also used as a routine outcome measure usually to aid
retreatment decisions (Lalwani et al, 2009; Martin et al, 2011; Chakravarthy
et al, 2012; Airody et al, 2014). In a similar way to the VA discussion, there is
also comment that the use of OCT alone may not fully represent visual
function change with treatment (Alexander et al, 2012).
This thesis aimed to assess these common forms of outcome measures and
in addition aimed to explore the use of some functional measures including
the use of Patient Reported Outcome Measures (PROMs), microperimetry
(MP) and functional Magnetic Resonance Imaging (fMRI). In line with this
theme, not just the positive aspects of therapy were studied, but also a
negative aspect in the form of the prevention of short-‐term pressure spikes
following intravitreal injection.
8.2 Overview of the findings
The studies presented comprise observational, interventional, randomised
and open label methodology.
8.2.1 Visual acuity as an outcome measure
At the time of this study the principle treatment for nvAMD was
ranibizumab administered monthly for 3 months and then as required on a
monthly basis. (Lalwani et al, 2009; NICE TA 155, 2008). As a part of service
redesign, and in particular to try and ensure that patients received
assessment on a monthly basis, a new treatment clinic was established. To
evaluate the benefit of this change VA outcomes were assessed. Seventy-‐two
eyes of 62 patients with nvAMD who had already received the 3 initiation
treatments of ranibizumab and were in the so called ‘stability phase’ of their
treatment were studied. Outcomes were assessed 6 visits before and 6
visits after their move to the new location (Tschour et al, 2013). In the 6
visits prior to transfer the patients were seen at a mean frequency of 56.8
days (8 weeks) and had a mean loss in VA of 1.1 ETDRS letters. Following

161
transfer the patients were seen at a mean frequency of 31.8 days (4.3
weeks) and subsequently VA improved by 4.6 letters. This information
supports the notion that if their dosing regimen is to be on an ‘as required’
basis, patients with nvAMD should have better outcomes if they are seen
monthly rather than 8 weekly.
In this case distance ETDRS letter score VA was used as the principle
outcome measure. Its main advantages are that it is a quick and relatively
simple assessment tool that produces a numerical value that can be used
easily for statistical analysis. The principle disadvantages that were
discussed were that it has a large co-‐efficient in repeatability (Patel 2008;
Aslam, 2014) meaning that it is not good at representing true responses
between visits, and that it is not a full reflection of visual function (Scott et
al, 1994; West et al 1997; Mangione et al, 1999; Maclure et al 2000; Haze et
al, 2000). Consequently basing re-‐treatment decisions on VA alone, as was
suggested in the product license of one anti-‐VEGF treatment does not
appear to be appropriate (SmPC Ranibizumab, 2007).
8.2.2 Central retinal thickness as an outcome measure
Pathological myopia (PM) is the second commonest cause of macular
degeneration and affects a younger population than its age-‐related
counterpart. Neovascular disease is a common complication of PM and, left
untreated, has a poor natural history (Chan et al, 2008; Montero et al, 2010).
At the time of study there was no licensed anti-‐VEGF treatment for the
treatment of CNV secondary to PM. The REPAIR study was aimed at
evaluating the safety and efficacy of ranibizumab in the treatment of CNV
secondary to PM. The local dataset was combined with a national data set
and showed that there was a mean improvement of 13.8 (SD 14.0) ETDRS
letters at 12 months with a median number of treatments being 3 injections.
The CRT as measured by spectral domain OCT, decreased by a mean of
108μm (SD 109) at this time point.

162
The principle advantages of using CRT are that the information is quickly
acquired by OCT, it is highly reproducible (Giana, Deiro & Staurenghi, 2012)
and a numerical value enables statistical manipulation. The CRT may not
give complete information about the activity of neovascular disease
however, as this may be governed by the exact site of the thickening and
exactly what is measured within the ‘central retinal’ area. Furthermore, to
aid re-‐treatment decisions qualitative aspects of the OCT scan are important
(Martin et al, 2012; Chakravarthy et al, 2012) and training of those who
interpret the image is required to given consistent results (Joeres et al,
2007).
8.2.3 The use of Patient Reported Outcome Measures
Quality of life measurements give a holistic approach to outcomes of
treatment and have been suggested to be more important than clinical
outcomes (Deshpande et al, 2011). Chapter 4 used the same REPAIR cohort
of individuals as in the CRT study but analysed outcomes using a well-‐being
questionnaire (W-‐BQ12) (Riazi et al, 2006) and a treatment satisfaction
questionnaire (MacTSQ) (Mitchell et al, 2007). The results showed that
individuals had a small but statistically significant improvement in their
well-‐being and an improvement in treatment satisfaction over the 12 month
study period.
Both the W-‐BQ12 and MacTSQ only correlated weakly with mean VA
improvement in the cohort. This gives hope that a specifically powered
study would give validity to these tools and also that VA could act as a
biomarker for quality of life under this circumstance. PROMs give a new
dimension to the assessment of outcomes and intuitively a change in quality
of life measurement is more relevant to those receiving the treatment than a
surrogate biomarker. Collecting and interpreting W-‐BQ12 and MacTSQ data
is time consuming and not practical for all patients in a high volume clinical
setting, however. PROMS are well placed to retrospectively evaluate
interventions, but given their nature they do not directly help treatment

163
decisions. At present they are best placed as a research or service evaluation
tool.
8.2.4 The use of microperimetry as tool for outcome measurement
Data from eight participants undergoing routine, NICE approved NHS care
for treatment of nvAMD were analysed in the study. All eight had VA, OCT
and microperimetry (MP) assessments followed by treatment with anti-‐
VEGF therapy at baseline. Visual acuity, CRT and MP were repeated prior to
re-‐treatment at two further subsequent monthly visits. Due to missing data
only the first three time points were analysed. The mean VA improved by 11
ETDRS letters and the CRT decreased by 61 micrometers.
8.2.4.1 Retinal sensitivity
Retinal sensitivity (RS) was analysed from within an ‘area of interest’ that
was defined as the area of CNV and sequelae guided by late frame FFA and
OCT images. The percentage of points within the area of interest that
increased by 2dB or more or 4dB or more was used as the principle outcome
measure. One month following the first treatment a mean of 33% of points
increased by 2dB or more and 18% by 4dB or more. At two months,
following the second treatment the figures rose to 62% and 39%
respectively.
Despite the main set back of this study being low participant numbers and a
short study duration (12 months would have been better), RS has the
potential to be used as an outcome measure not only for populations
analysis, but also to aid visit-‐to-‐visit re-‐treatment decisions. Alexander et al,
studying visit-‐to-‐visit change, albeit not with an ‘area of interest’ guided MP
technique, and demonstrated that change in RS may precede change in VA
or OCT measures. (Alexander et al, 2012). The principle disadvantage of
using RS is that data acquisition takes 8-‐12 minutes per eye, which is

164
difficult for frail individuals to achieve and would necessitate substantial
resources.
8.2.4.2 Fixation stability
Fixation is impaired in late stage AMD (Pearce et al, 2011). Fixation stability
is potentially an important measure of visual function as it correlates with
day-‐to-‐day tasks such as reading (Ergun et al, 2003; Crossland et al, 2005).
In parallel with the MP assessment of RS, fixation stability data was
gathered as an exploratory outcome. It was analysed using the method
described by Fujii (Fujii et al, 2003) but in hindsight using the bivariate
contour ellipse area, as described by Crossland may have proved more
sensitive to detect change (Crossland, et al, 2005). Five of the 8 participants
demonstrated no change in the fixation stability (of these 2 already had
stable vision), 2 had an improvement in their fixation and 1 showed a
decline. These results are broadly in line with other larger published
datasets although study designs were not directly comparable (Pearce et al
2011; Munk et al 2013). The relatively small numbers of participants, short
study duration and the analysis method precluded meaningful correlation
analysis with VA, OCT and RS. Capturing FS data could be useful in
determining the preferred retinal location and, in combination with
qualitative aspects of OCT such as the presence of retinal fluid, can inform if
retreatment is appropriate.
8.2.5 Functional MRI and the BOLD response
This study looked at cortical response to retinal treatment for nvAMD. Data
from 10 participants from the same cohort as in the MP study undergoing
routine, NICE approved NHS treatment were analysed. All had VA, CRT and
fMRI assessments prior to their first treatment and then on a further three
occasions, prior to re-‐treatment. The Blood Oxygenation Level Dependent
(BOLD) response from predefined Regions of Interest (ROI) of the visual

165
cortex, which corresponded either to the macular or peripheral retina, were
studied. Averaging of two scans in a session and averaging across
hemispheres corrected data for the anticipated normal variation.
The VA improved and CRT decreased broadly in line with larger data sets
(Martin et al, 2011, Chakravarty et al, 2012, Schmidt-‐Urfurth, 2014). There
was a decline in BOLD across the four sessions however, in both mean
treated and untreated eyes This is a well-‐documented phenomenon, thought
to be due to habituation or attenuation, possibly because the same stimulus
is presented at each session (Rosengarth et al, 2013). This decline was
accounted for by correcting the treated eye response by the untreated eye
response and subsequently the mean treated / untreated BOLD response
increased across the 4 sessions. Correlation with VA and CRT both missed
significance and this may be explained by under powering of the study or
the technique itself.
The main conclusions of this aspect of this study were two fold. Primarily it
demonstrated that reactivation of the visual cortex is possible after a period
of inactivity due to nvAMD. This confirmed the findings from the single case
reported by Baseler et al (Baseler et al, 2012). It was not possible however,
to establish to what extent the visual cortex is able to recover, if this was
limited by retinal function recovery or indeed if there is a critical window
where recovery is possible. Different study designs would be required to
address these issues. Secondarily, the range of BOLD response was so great
that even if fMRI was practical to perform routinely it would not be a useful
tool for measurement of activity from visit-‐to-‐visit and therefore to guide
retreatment. It may have potential in the clinical setting as a tool to
investigate if the cause of ‘non response’ to treatment is cortical or retinal.

166
8.2.6 Measuring the side effects of treatment. The amelioration of
short-‐term intraocular pressure fluctuations with oral acetazolamide
Chapter 7 appreciated that outcomes of nvAMD treatment are not always
positive (Brown et al, 2006; Rosenfeld et al, 2006) and that thought needs to
be give as to how side effects are measured. Side effects with anti-‐VEGF
therapy can be classified as either systemic or ocular and the transient rise
in intraocular pressure (IOP) at the time of and after an intravitreal
treatment is a well-‐documented example of the latter. (Falkenstein et al,
2007; Kim et al, 2008). Individuals with glaucoma, who are already at risk of
peripheral visual loss due to raised pressure, were studied. The study in
chapter 7 was a randomized controlled trial aimed to establish if oral
acetazolamide, a diuretic, was able to reduce pressure rise following
intravitreal injection in a group of glaucoma and glaucoma suspect patients
having treatment for nvAMD.
Of the 24 participants studied, 12 were randomized to receive treatment.
This group showed a numerical reduction in peak IOP measurement
(42.2mmHg, SD 10.2) compared with the control group (44.3 mmHg, SD
19.8). All points out to the end of the study at 30 minutes demonstrated
similar numerical difference and using ANOVA testing no difference
between the groups was identified. At the 30-‐minute single time point
measure a difference in the two groups did reach statistical significance
(15.7mmHg, SD 4.3, versus 20.6 mmHg, SD 9.5, p = 0.013). This, along with
the area under the curve post analysis, provides useful information in
designing future studies. Despite this statistical difference there is unlikely
to be clinical significance in such a small difference in all except those that
are extremely vulnerable to an IOP spike.
Discussion followed as to whether it is the IOP that is important to measure
or in fact the visual loss caused by the raised pressure that should be the
outcome of interest. As progression of visual fields is very slow and can
sometimes be unreliable, a study of much longer duration with numerous

167
intravitreal injections and multiple visual field analyses would be required
to address the issue (Choy, Kwun, Han & Kee, 2015). Given the time and
resource available, studying the IOP change as a proxy of potential visual
change was appropriate.
8.3 Outcome measures of neovascular Macular Degeneration not
addressed in this thesis
Outcomes of any treatment can be broadly divided into the following
categories: clinical (e.g. efficacy, side effects), humanistic (e.g. role
performance, emotional status) and economical (e.g. expenses, saving)
(Deshpande et al, 2011). This thesis has mainly addressed clinical and some
humanistic outcomes and has not aimed to address economic outcomes. The
main focus has been on VA, CRT and IOP as commonly used outcomes and
PROMS, MP and fMRI in what could be considered as primarily research
tools. Other ways of assessing vision are the topic of the following
discussion.
8.3.1 Near (reading) visual acuity and reading speed
The effect on reading performance (reading visual acuity and speed) has
been studied in depth in AMD (Legge et al, 1997; Stifter, Sacu, Benesch &
Weghaupt, 2005; Richter-‐Mueksch, Stur, Stifter & Radner, 2006; Cacho,
Dickinson, Smith & Harper, 2010). Reading performance has been shown to
be significantly impaired in AMD with 60% of the impairment in reading
speed being due to reduced near acuity and scotomas (Cacho et al, 2010).
This is in contrast to distance acuity, which only has a 10% influence on
reading performance (Legge et al, 1992). Late stage AMD disproportionately
affects reading performance more than distance visual acuity (Richter-‐
Mueksch et al, 2006). Furthermore reading acuity has been shown to
improve more than distance VA when nvAMD is treated (Frennesson,
Nilsson, Peebo & Nilsson, 2010).

168
8.4.2. Contrast sensitivity
Contrast is the luminance or colour of an object that makes its
distinguishable from its background. Contrast sensitivity (CS) is the ability
to discern the difference in luminance between objects. It has also been well
studied in AMD (Mones & Rubin, 2005; Bansback et al, 2007; Patel et al,
2011). In a study of 209 patients with AMD, CS correlated more closely with
visual function and quality of life utility than did distance visual acuity
(Bansback et al, 2007). Contrast sensitivity was reported to be a more
sensitive test of visual function change than distance VA when 121 nvAMD
patients were treated with bevacizumab in the ABC trial (Patel et al, 2011).
Furthermore OCT morphology correlated well with CS, in particular CS
decreasing with an increasing amount of subretinal tissue (Keane et al,
2010). It may be expected that CS would correlate well with RS, however in
a small study of 23 participants no relationship was identified. The authors
feel that this may be because the study was underpowered (Hautamaki,
Oikkonen, Onkamo & Immonen, 2014).
8.4 Conclusions
There are numerous ways of assessing outcomes of the treatment of nvMD.
Ultimately the goal of any therapeutics is to maintain or improve quality of
life and this can be measured directly with health utility scores. Given their
nature, such indicators would perform poorly in assessing the effects of
immediate treatment are so best used to retrospectively assess
interventions. To assess immediate effect proxy measurements of quality of
life are required. It is clear that this principal proxy outcome measure
should be governed by the reason for measuring the change. The reasons
include the need to describe the response of a population, in which case VA
or CRT are appropriate, or to help guide treatment decision, in which case
OCT morphology or RS are better suited. Even within these categories some
measures may outperform others. For example CRT is a more objective
measure than VA, but in some individuals may be of less relevance than VA.

169
Resources and practical issues are important to consider; the time and
ability to perform complex technology dependent measures, even though
they are very sensitive, may render them better as research tools. An
example of this is the use of fMRI.
The acquisition of many outcome measures can enable a composite view of
response to treatment. In this way the individual outcome measurements
can work synergistically. This process requires an individual to assimilate
all the pieces of relevant information and put them into context of the
question to be addressed.
There are many aspects of this thesis that have provided insight into the
successful delivery of high quality research; the importance of study design,
methodology, attention to the recruitment window and a focus on
participant retention have been particularly pertinent. Taking this into
account and as is often the case in research, accepting that there are many
new questions that have been generated, this thesis has generated useful
insights in assessing the outcomes of nvMD treatment.
Understandably there is a tendency for early phase clinical trials to focus on
easily quantifiable measure of success such as VA or retinal morphology. I
would hope that earlier phases of evaluation of therapeutic interventions
would also explore alternative outcomes such as retinal sensitivity. As
clinical trials begin to develop for treatment of conditions where the natural
history is for visual acuity to change very slowly, such as Geographic
Atrophy, clearly new study endpoints are required. Again, retinal sensitivity
may be more appropriate. Visual cortex outcomes may also be appropriate
in these circumstances, particularly in the knowledge that there may be a
loss of volume or activity of the cortex in the long term and that putatively
neuroprotection could play an important role. Ultimately, and in particular
for the later phase clinical trials, quality of life utilities, which are the most
important outcomes for individuals, should be given higher priority.

170
Appendices Appendix A. The W-‐BQ12 Well-‐being questionnaire Item Negative well-‐
being Energy Positive
well-‐being I have episodes of crying or wanting to cry
I feel down hearted and sad I feel fear for no reason I become easily upset and panic
I feel energetic, active and full of vitality
I feel without energy and weak
I feel tired, worn out or exhausted
I wake up felling fresh and rested
I am happy, satisfied or content with my personal life
I have the type of life I wanted
I feel enthusiastic to get on with daily tasks or take new decisions
I feel I can easily deal with any serious problem or big change in my life.
Appendix B. The MacTSQ Treatment satisfaction questionnaire
1. How satisfied are you with the treatment for your MD?
2. How bothered are you by any side effects or other effects you
experienced with the treatment for your MD?
3. How bothered are you by any discomfort or pain from the treatment for
your MD?
4. How do you feel the treatment for your MD is working?
5. How unpleasant did you find the treatment for your MD?

171
6. How apprehensive did you feel about your most recent treatment for
MD?
7. How satisfied are you with any cost to you associated with treatment for
your MD?
8. How satisfied are you with the safety of the treatment for MD?
9. Were you given information about your MD treatment, e.g. information
about procedures, benefits and any risks? 9a. Was the information you
were given in a form you could take home (e.g. in a leaflet)? (b. If yes, was
the information given to you long enough before your treatment to allow
you to make best use of it? 9c. How satisfied are you with the information
provided about the treatment for your MD?
10. If further treatment for your MD were necessary, how satisfied would
you be to continue or repeat the treatment?
11. How satisfied are you with the time spent at the clinics on each
treatment day?
12. How satisfied are you with the overall duration of the treatment for
your MD?
13. Would you encourage someone else with MD like yours to have your
kind of treatment?
14. Are there any other aspects of the treatment for your MD, causing
satisfaction of dissatisfaction, that have not been covered already?
The MacTSQ can be used as a single scale or as in our study as 2 subscales.
Subscale 1 (Information provision and convenience) contains six items (1,
9c and 10 to 13) and subscale 2 (Impact of treatment), which contains six
items (2 to 6 and 8). Each question scores between 0 and 6 giving a total
possible score of 72.

172
Appendix C. Raw BOLD data for participants 1-‐10-‐ Left and right
hemisphere projected amplitude across all 4 sessions for both the treated
and untreated eye.
PP_Left Hem_ProjAmp
Treated Eye Untreated Eye Participant Session 1 Session 2 Session 3 Session 4 Session 1 Session 2 Session 3 Session 4
1 0.199852
0.177254 0.028077 0.445891 0.541926 0.120751
2 1.587112 1.142707
1.970797 1.462461 1.433796
1.634187
3 0.197924 0.191190 0.273981 0.211132 0.241968 0.299090 0.146287 0.362546
4 0.300632 0.340123 0.168455
0.437856 0.498992 0.510980
5 0.035295
0.144161 0.102315 0.121328
0.105470 0.179376
6 0.584713 0.909950 0.388482 0.574210 0.187114 0.213241 0.138982 0.490987
7 0.648770 0.382172 0.656346 0.745081 0.706105 0.370161 0.509113 0.307332
8 0.015962 0.026680 0.166332 0.250102 0.298358 0.145402 0.212310 0.283924
9 0.154021 0.394266 0.183401
0.344309 0.738739 0.528823
10 -‐0.456334 0.053861 1.143094 1.456971 0.615644 0.708574 1.150516 1.198214
PP_Right_Hem_ProjAmp Treated Eye Untreated Eye
Session 1 Session 2 Session 3 Session 4 Session 1 Session 2 Session 3 Session 4
0.190795 0.245601 0.098371 0.276177 0.331438 0.20571
0.595263 0.889731
0.738290 0.266001 1.097948
1.099594
0.299272 0.196710 0.20282 0.375874 0.313938 0.032305 0.422897 0.157396 0.179509 0.061465 0.15052
0.124951 0.150538 0.010907
0.233128
-‐0.05200 0.222557 0.556975
0.373369 0.329240
2.710465 2.314634 1.882082 2.126247 1.062131 1.874393 1.599101 2.504829
0.386992 0.252248 0.377487 0.388136 0.506045 0.344709 0.340193 0.276683
0.276350 0.178966 0.294250 0.209231 0.632990 0.220506 0.236842 0.271296
0.760945 1.288191 1.241026 0.871843 1.430766 1.389128
0.203453 0.006687 -‐0.36734 0.003686 0.042165 0.066416 0.121872 0.010442

173
MC_Left_Hem_ProjAmp
Treated Eye Untreated Eye Particpant Session 1 Session 2 Session 3 Session 4 Session 1 Session 2 Session 3 Session 4
1 0.368023 0.156996 0.123644 0.419915 0.234552 0.002558
2 0.768052 0.828275
1.053571 0.868828 0.767719
0.854110
3 0.264387 0.288367 0.347817 0.226581 0.310856 0.454403 0.270657 0.372601
4 0.212357 0.324846 0.223399 0.064743 0.458877 0.124197
5 0.859819
0.649731 0.763742 1.046257
1.074632 0.251409
6 0.828071 0.980123 0.806527 0.789223 0.560860 0.598943 0.483433 0.863680
7 0.563859 0.458631 0.713748 0.662989 0.581278 0.367953 0.434152 0.364377
8 0.332584 0.384538 0.238464 0.582487 0.229772 0.573932 0.290741 0.479894
9 0.811453 1.157065 1.450169 1.224781 1.161217 1.184117
10 0.646467 0.263102 0.310145 0.317467 0.349314 0.330606 0.267022 0.338613
Line_Right_Hem_ProjAmp Treated Eye Untreated Eye
Session 1 Session 2 Session 3 Session 4 Session 1 Session 2 Session 3 Session 4
0.890321 0.880818 0.276000 0.601474 0.947429 0.200337
0.945582 1.299540
1.030788 0.556175 1.353398
1.340461
0.448729 0.236317 0.354217 0.472443 0.275876 0.268415 0.473296 0.278034
0.603537 0.846508 0.415649 0.398622 -‐1.123799 0.495722
0.270391
-‐0.083958 0.099623 0.744949
0.592507 -‐0.504903
1.265250 0.897362 -‐1.127648 1.018246 0.418475 1.322228 0.745803 1.351727
0.656800 0.411092 -‐0.611596 -‐0.614306 -‐0.654271 0.393036 0.499581 0.452691
0.543412 0.693411 0.489000 0.512592 -‐0.696131 0.636431 0.569816 0.607865
-‐1.032286 1.796397 1.696452 1.227540 1.696585 1.694391
0.328651 0.120536 0.037389 0.080819 0.358883 0.269647 0.138510 0.150211

174
Definitions
ABC Bevacizumab for Neovascular Age-‐related Macular
Degeneration trial
ANCHOR Anti-‐VEGF antibody for treatment of predominantly classic
choroidal neovascularisation in AMD study
ANOVA Analysis of Variance
Anti-‐VEGF Anti-‐Vascular endothelial Growth Factor
AMD Age-‐related Macular Degeneration
AREDS Age-‐related Eye Disease Study Group
BCVA Best Corrected Visual Acuity
BH Base Hospital
BOLD Blood Oxygen Level Dependent
BSE Better seeing eye
CATT Comparison of anti-‐VEGF Treatment Trial
CEC Community Eye Clinic
CRT Central Retinal Thickness
CNV Choroidal Neovascular Membrane
dB Decibels
ETDRS Early Treatment Diabetic Retinopathy Study
FDA Food and Drug Administration
FFA Fundus Fluorescein Angiography
fMRI Functional Magnetic Resonance Imaging
GA Geographic Atrophy
ICG Indocyanine angiography
IOP Intraocular Pressure
IVAN Investigation of anti-‐VEGF Agents in Neovascular AMD Trial
LGN Lateral Geniculate Nuclei
LogMAR Logarithm of Minimum Angle of Resolution
MARINA Minimally Classic/Occult Trial of the Anti-‐VEGF Antibody
Ranibizumab in the Treatment of Neovascular AMD
MacTSQ Macular Treatment Satisfaction Questionnaire
MD Macular Degeneration

175
MMD Myopic Macular Degeneration
MP Microperimetry
MPS Macular Photocoagulation Study
MRI Magnetic Resonance Imaging
NEI VFQ National Eye Institute Visual Function Questionnaire
NHS National Health Service
NICE National Institute for Health and Clinical Excellence
OCT Optical Coherence Tomography
nvAMD Neovascular Age-‐related Macular Degeneration
nvMD Neovascular Macular Degeneration
PCV Polypoidal Choroidal Vasculopathy
PDT Photodynamic Therapy
PED Pigment Epithelial Detachment
PlGF Placental Derived Growth Factor
PM Pathological Myopia
prn Pro re nata / as required
PRO Patient Reported Outcome
PROM Patient Reported Outcome Measure
RADINACE A randomized controlled study of ranibizumab in patients
with choroidal neovascularisation secondary to pathological
myopia.
RAP Retinal Angiomatous Proliferation
RPE Retinal Pigment Epithelium
SAE Serious Adverse Events
SAILOR Safety of ranibizumab in subjects with nvAMD trial
SmPC Summary of Product Characteristics
SPSS Statistical Package for the Social Sciences
SD Standard Deviation
TAP Treatment of Age-‐related Macular degeneration with
Photodynamic therapy study
TAG Technology appraisal guidance
TTT Transpupillary Thermotherapy
V1 Primary Visual Cortex

176
V2 Secondary Visual cortex
V3 Tertiary Visual Cortex
V4 Quaternary Visual Cortex
V5 Fifth Visual Cortex
VA Visual Acuity
VEGF Vascular Endothelial Growth Factor
VIP Verteporfin in Pathological Myopia study
W-‐BQ12 12 Item Well-‐Being Questionnaire
WSE Worst seeing eye

177
List of References
Age-‐Related Eye Disease Study Research Group. (2001a). The Age-‐Related
Eye Disease Study system for classifying age-‐related macular degeneration
from stereoscopic color fundus photographs: the Age-‐Related Eye Disease
Study Report Number 6. Am J Ophthalmol, 132(5), 668-‐81.
Age-‐Related Eye Disease Study Research Group. (2001b). A randomized,
placebo-‐controlled, clinical trial of high-‐dose supplementation with vitamins
C and E, beta carotene, and zinc for age-‐related macular degeneration and
vision loss: AREDS report no. 8. Arch Ophthal; 119(10): 1417-‐36.
Airody A., Venugopal D., Allgar V., Gale R. (2014). Clinical characteristics and
outcomes after 5 years pro re nata treatment of neovascular age-‐related
macular degeneration with ranibizumab. Acta Ophthamol, 9, 10.1111/aos
12618.
Alexander P., Mushtaq F., Osmond C, Amoaku W. (2012). Microperimetric
changes in neovascular age-‐related macular degeneration treated with
ranibizumab. Eye, 26(5), 678-‐83.
Amoaku W., Blakeney S., Freeman M., Gale R., Johnston R. (2012). Action on
AMD. Optimising patient management: act now to ensure current and
continual delivery of best possible patient care. Eye. 26, 2-‐21.
Amoaku W., Gale R., Lotery A., Geeta M., Sivaprasad S., Petrillo J., et al.
(2015). Treatment Satisfaction and Well-‐being in Patients With Myopic
Choroidal Neovascularization Treated With Ranibizumab in the REPAIR
Study. Plos one, accepted for publication.
Aslam T., Mahmood S., Balaskas K., Patton N., Tanawade R., Tan S., et al.
(2014) Repeatability of visual function measures in age-‐related macular
degeneration. Graefes Arch Clin Exp Ophthalmol, 252(2), 201-‐6.

178
Baker C., Dilks D., Peli E., Kanwisher M. (2008). Reorganization of visual
processing in macular degeneration: replication and clues about the role of
foveal loss. Vision Res, 48(18), 1910-‐9.
Baker C., Peli E., Knouf N., Kanwisher M. (2005). Reorganization of visual
processing in macular degeneration. J Neurosci, 25(3), 614-‐8.
Bansback N., Czoski-‐Murray C., Lewis G., Hughes L., Espallargues M., Brand
C., et al. (2007). Determinants of health related quality of life and health
state utility in patients with age related macular degeneration: the
association of contrast sensitivity and visual acuity. Qual Life Res, 16(3),
533-‐43.
Baseler H., Gouws A., Crossland M., Leung C., Tufail A., Rubin G, et al.
(2011a). Objective visual assessment of anti-‐angiogenic treatment for
wet age-‐related macular degeneration Optom Vis Sci, 88(10), 125.
Baseler H., Gouws A., Haak K., Racey C., Crossland M., Tufail A., et al.(2011b).
Large-‐scale remapping of visual cortex is absent in adult humans with
macular degeneration. Nat Neurosci, 14, 649–55.
Benner J., Ahuja R., Butler J. (2002). Macular infarction after
transpupillary thermotherapy for subfoveal choroidal
neovascularization in age-‐related macular degeneration. Am J
Ophthalmol, 134(5), 765-‐8.
Berg K., Pederson T., Sandvik L., Bragadottir R. (2015). Comparison of
Ranibizumab and Bevacizumab for Neovascular Age-‐Related Macular
Degeneration According to LUCAS Treat-‐and-‐Extend Protocol. Ophthalmol,
122(1), 146-‐52.
Berger J. (1997). Thermal modeling of micropulsed diode laser retinal

179
photocoagulation. Lasers Surg Med, 20, 409–15.
Blackhurst D. & Maguire M. (1989). Reproducibility of refraction and visual
acuity measurement under a standard protocol. The Macular
Photocoagulation Study Group. Retina, 163-‐169.
Bland M., & Altman D. (1986). Statistical methods for measuring agreement
between two methods of clinical assessment. Lancet, 1(8476), 307-‐10
Blinder K., Blumenkranz M., Bressler N. (2003). Verteporfin therapy of
subfoveal choroidal neovascularization in pathologic myopia: 2-‐year results
of a randomized clinical trial-‐-‐VIP report no. 3. Ophthalmology, 110(4), 667-‐
73.
Bloch S., Larsen M., Munch I. (2012). Incidence of legal blindness from age-‐
related macular degeneration in Denmark: year 2000 to 2010. Am J
Ophthalmol, 153(2), 209-‐13 e2.
Born R., Bradley D. (2005). Structure and function of visual area MT. Annu
Rev Neurosci, 28, 157-‐89.
Boucard C., Hernowo A., Maguire R., Jansonius N., Roerdink J., Hooymans M.,
et al. (2009). Changes in cortical grey matter density associated with long-‐
standing retinal visual field defects. Brain, 132, 1898-‐1906.
Boyer D., Heier J., Brown D., Francom S., Ianchulev T. (2009). A Phase IIIb
study to evaluate the safety of ranibizumab in subjects with neovascular
age-‐related macular degeneration. Ophthalmology, 116, 1731-‐1739.
Bradley C., Lewis K. (1990). Measures of psychological well-‐being and
treatment satisfaction developed from the responses of people with tablet-‐
treated diabetes. Diabet Med. 7: 445-‐451.

180
Bradley C. (1994). The Well-‐Being Questionnaire. In: C. B, editor. Handbook
of Psychology and Diabetes: A Guide to Psychological Measurement Chur,
Switzerland: Harwood Academic. pp. 89-‐109.
Bressler N. (2001). Treatment of Age-‐Related Macular Degeneration with
Photodynamic Therapy (TAP) Study Group. Photodynamic therapy of
subfoveal choroidal neovascularisation in age-‐related macular degeneration
with verteporfin: two-‐year results of 2 randomized clinical trials-‐tap report
2. Arch Ophthalmol, 119, 198-‐207.
Bressler N., Boywer D., Williams D., Butler S., Francom S., Brown B et al.
(2012). Cerebrovascular accidents in patients treated for choroidal
neovascularization with ranibizumab in randomized controlled trials.
Retina. 32(9), 1821-‐8.
Bressler N. (2001). Treatment of Age-‐Related Macular Degeneration with
Photodynamic Therapy (TAP) Study Group. Photodynamic therapy of
subfoveal choroidal neovascularisation in age-‐related macular degeneration
with verteporfin: two-‐year results of 2 randomized clinical trials-‐tap report
2. Arch Ophthalmol, 119, 198-‐207.
Brown D., Kaiser P., Michels M., Soubrane G., Heier S., Kim R., et al. ANCHOR
Study Group (2006). Ranibizumab versus Verteporfin for Neovascular Age-‐
Related Macular Degeneration. N Engl J Med, 355, 1432-‐1444.
Brown G., Sharma S., Brown M., Kistler J. (2000). Utility values and age-‐
related macular degeneration. Arch Ophthalmol, 118, 47-‐51.
Brown M., Brown G., Sharma S., Shah G. (1999). Utility values and diabetic
retinopathy. Am J Ophthalmol, 128, 324-‐330.
181
Brown M., Brown G., Sharma S., Smith A., Landy J. (2001). A utility analysis
correlation with visual acuity: methodologies and vision in the better and
poorer eyes. Int Ophthalmol, 24, 123-‐127.
Bunce C., Xing W., Wormald R., (2010). Causes of blind and partial sight
certifications in England and Wales: April 2007-‐March 2008. Eye, 24, 1692-‐
1699.
Cacho I., Dickinson C., Smith H., Harper R. (2010). Clinical impairment
measures and reading performance in a large age-‐related macular
degeneration group. Optom Vis Sci, 87(5), 344-‐9.
Ferris F., Bailey I. (1996). Standardizing the measurement of visual acuity
for clinical research studies: guidelines from the Eye Care Technology
Forum. Ophthalmology, 103, 181–182.
Chakravarthy U., Harding S., Rogers C., Downes S., Lotery A., Wordsworth S.,
et al (2012). Ranibizumab versus bevacizumab to treat neovascular age-‐
related macular degeneration: one-‐year findings from the IVAN randomized
trial. Ophthalmology, 119 (7), 1399–1411.
Cho H., Kim C., Yoo S., Cho S., Lee D., Kim J., et al (2013). Retinal functional
changes measured by microperimetry in neovascular age-‐related macular
degeneration treated with ranibizumab. Am J Ophthalmol, 155(1), 118-‐126.
Chan W., Ohji M., Lai T. (2005). Choroidal neovascularisation in pathological
myopia: an update in management. Br J Ophthalmol. 89(11), 1522-‐8.
Cohen S. (2009). Anti-‐VEGF drugs as the 2009 first-‐line therapy for
choroidal neovascularization in pathologic myopia. Retina, 29(8),
1062-‐6.

182
Cohen S, Kawasaki A. (1999). Introduction to formal visaul field
testing: Goldmann and Humphrey perimety. J Ophthalmic Nurs
Technol, 18(1), 7-‐11.
Crossland M., Culham L., Rubin G. (2005). Predicting reading fluency in
patients with macular disease. Optom Vis Sci, 82(1), 11–17.
Crossland M., Dunbar H., Rubin G. (2009) Fixation stability measurement
using the MP1 microperimeter. Retina, 29(5), 651–656.
Deshpande P., Rajan S., Sudeepthi B., Nazir C. (2011). Patient-‐reported
outcomes: A new era in clinical research. Perpect Clin Research, 2(4$),
137-‐44.
Do D, Pieramici D, Van Lookeren Campagne M, Beres T, Friesenhahn M,
Zhang, Y, et al. (2014). A phase I dose-‐escalation study of the anti-‐factor D
monoclonal antibody fragment FCFD4514S in patients with geographic
atrophy. Retina. 34(2): 313-‐20.
Dagostar H., Ventura A., Chung J., Sharma S. & Kaiser P. (2009) Evaluation of
injection frequency and visual acuity outcomes for ranibizumab
monotherapy in exudative age-‐related macular degeneration.
Ophthalmology, 116, 1740-‐1747.
Ergun E., Maar N., Radner W., Barbazetto I., Schmidt-‐Erfurth U., Stur M.
(2003). Scotoma size and reading speed in patients with subfoveal occult
choroidal neovascularization in age-‐related macular degeneration.
Ophthalmol, 110(1), 65–69.
Falkenstein I., Cheng L., Freeman W. (2007). Changes of intraocular pressure
after intravitreal injection of bevacizumab (avastin). Retina, 27, 1044-‐7.
Ferris F., Kassoff A., Bresnick G. & Bailey I. (1982). New visual acuity charts

183
for clinical research. Am J Ophthalmol, 94, 91–96.
Ferris F., & Bailey I. (1996). Standardizing the measurement of visual acuity
for clinical research studies: guidelines from the Eye Care Technology
Forum. Ophthalmology, 103, 181–182.
Ferris F., Wilkinson C., Bird A., Chakravarthy U., Chew E., Csaky K., et al.
(2013). Clinical classification of age-‐related macular degeneration.
Ophthalmology. 120(4), 844-‐51.
Fletcher D., Schuchard R. (1997) Preferred retinal loci relationship to
macular scotomas in low-‐vision population. Ophthalmology, 104, 632–638.
Frische J., Fariss R., Stambollan D., Abecassiss G., Curion C., Swaroop A.
(2014). Age-‐related macular degeneration: genetics and biology coming
together. Annu Rev Geneomic Num Genet, 15; 151-‐71.
Frenkel R., Mani L., Toler A., Frenkel M. (2007). Intraocular pressure effects
of pegaptanib (Macugen) injections in patients with and without glaucoma.
Am J Ophthalmol, 143, 1034-‐5.
Frisen L., Frisen M. Micropsia and visual acuity in macular edema. (1997) A
study of the neuro-‐retinal basis of visual acuity. Albrecht Von Graefes Arch
Klin Exp Ophthalmol. 2, 69 –77.
Fujii G., DeJuan E., Humayun M., Sunness J., Chang T., Rossi J. (2003)
Characteristics of visual loss by scanning laser ophthalmoscope
microperimetry in eyes with subfoveal choroidal neovascularization
secondary to age-‐related macular degeneration. Am J Ophthalmol, 136(6),
1067–1078.
Fung A., Lalwani G., Rosenfeld P., Dubovy S., Michels S., Feuer W., et al.
(2007). An optical coherence tomography-‐guided, variable dosing regimen
184
with intravitreal ranibizumab (Lucentis) for neovascular age-‐related
macular degeneration. Am J Ophthalmol, 2007, 143.
Giana A., Deiro A., Staurenghi G. (2012). Repeatability and
reproducibility of retinal thickness measurements with spectral-‐domain
optical coherence tomography using different scan parameters. Retina,
32 (5), 1007-‐2.
Gonzalez E., Tarita-‐Nistor L., Mandelcorn E., Mandelcorn M., Steinbach M.
(2011). Fixation control before and after treatment for neovascular age-‐
related macular degeneration. Invest Ophthalmol Vis Sci, 52(7), 4208-‐13.
Grover S., Murthy R., Brar V., Chalam K. (2010). Comparison of Retinal
Thickness in Normal Eyes Using Stratus and Spectralis Optical
Coherence Tomography. Retina, 51(5), 2644-‐7.
Hasler P., Brandi Bloch S., Villumsen J., Fuchs J., Lund-‐Anderson H., Larsen M.
(2014). Safety study of 38 503 intravitreal ranibizumab injections
performed mainly by physicians in training and nurses in a hospital setting.
Acta Ophthalmol. 17; 10.1111/aos. 12589.
Hayashi K., Ohno-‐Matsui K., Teramukai S., Shimada., Moriyama M.,
Hayashi W., et al. (2009). Comparison of visual outcome and regression
pattern of myopic choroidal neovascularization after intravitreal
bevacizumab or after photodynamic therapy. Am J Ophthalmol, 148 (3),
396-‐408.
Hazel C., Petre K., Armstrong R., Benson M., Frost N. (2000). Visual function
and subjective quality of life compared in subjects with acquired macular
disease. Invest Ophthamol Vis Sci. 41:1309-‐1314.

185
Hollands M., Wong J., Bruen R., Compbell R., Sharma S., Gale J. (2007). Short-‐
term intraocular pressure changes after intravitreal injection of
bevacizumab. Can J Ophthalmol, 42, 807-‐11.
Ikuno Y., Nagai Y., Matsuda S., Arisawa A., Sho K., Oshita T. et al. (2010).
Two-‐year visual results for older Asian women treated with
photodynamic therapy or bevacizumab for myopic choroidal
neovascularization. Am J Ophthalmol, 149(1), 140-‐6.
Jenkinson, M., Bannister, P., Brady, J., Smith, S. (2002). Improved
Optimisation for the Robust and Accurate Linear Registration and Motion
Correction of Brain Images. NeuroImage, 17(2), 825-‐841.
Jessell T., Kandel R., Schwartz, James H. (2000). Principles of neural science.
New York: McGraw-‐Hill.
Kaiser P. (2009). Prospective evaluation of visual acuity assessment: a
comparison of Snellen versus ETDRS charts in clinical practice (an AOS
theses). Trans Am Ophthalmol Soc, 107, 311-‐314.
Kang S., & Roh Y-‐J. (2009). One-‐year results of intravitreal ranibizumab for
neovascular age-‐related macular degeneration and clinical responses of
various subgroups. Jpn J Ophthalmol, 53(4), 389–395.
Kanski J. (1999). Clinical Ophthalmology. Oxford: Butterworth-‐Heinemann.
Keane P., Heussen F., Ouyang Y., Mokwa N., Walsh A., Tutail A., et al.
(2012). Assessment of Differential Pharmacodynamic Effects Using
Optical Coherence Tomography in Neovascular Age-‐Related Macular
Degeneration. Invest Ophthalmol Vis Sci, 53(3), 1152-‐1161.

186
Kelly S & Barua A. (2011). A review of safety incidents in England and Wales
for vascular endothelial growth factor inhibitor medications. Eye, 25, 710-‐
716.
Kim J., Mantravardi A., Hur E., Covert, D. (2008). Short-‐term intraocular
pressure changes immediately after intravitreal injections of anti-‐vascular
endothelial growth factor agents. Am J Ophthalmol, 146, 930-‐4 e1.
Klein R., Klein B., Knudtson M., Meuer S., Swift M., Gangnon R. (2007).
Fifteen-‐year cumulative incidence of age-‐related macular degeneration: the
Beaver Dam Eye Study. Ophthalmology, 114(2), 253-‐62.
Klein R., Knudtson M., Cruickshaks K. & Klein B. (2008). Further observation
on the association between smoking and the long-‐term incidence and
progression of age-‐related macular degeneration: the Beaver Dam Eye
Study. Arch Ophthalmol, 126, 115-‐121.
Konstantinidis L., Mantel I., Pournaras J., Zografos L. Ambresin A. (2009).
Intravitreal ranibizumab (Lucentis) for the treatment of myopic
choroidal neovascularization. Graefes Arch Clin Exp Ophthalmol, 247(3),
311-‐8.
Kotliar K., Maier M., Bauer S., Feucht N., Lohmann C., Lanzi I. (2007). Effect of
intravitreal injections and volume changes on intraocular pressure: clinical
results and biomechanical model. Acta Ophthalmol Scand, 85, 777-‐81.
Lai T., Chan W., Liu D., Lam D. (2009). Intravitreal ranibizumab for the
primary treatment of choroidal neovascularization secondary to
pathologic myopia. Retina, 29(6), 750-‐6.
Lalwani G., Rosenfeld P., Fung A., Dubovy S., Michels S. (2009). A variable-‐
dosing regimen with intravitreal ranibizumab for neovascular age-‐related
187
macular degeneration: year 2 of the PrONTO Study. Am J Ophthalmol, 148,
43-‐58.
Legge G., Ross J., Isenberg L., LaMay J. (1992). Psychophysics of reading.
Clinical predictors of low-‐vision reading speed. Invest Ophthalmol Vis Sci,
3(3), 677–687.
Lucentis Summary of Product Characteristis. 2007.
Macular Photocoagulation Study Group. (1991). Subfoveal neovascular
lesions in age-‐related macular degeneration. Guidelines for evaluation and
treatment in the macular photocoagulation study. Archives of ophthalmology,
109(9), 1242-‐57.
Mangione C., Berry S., Spritzer K. (1998). Identifying the content area for the
51-‐item National Eye Institute Visual Function Questionnaire: results from
focus groups with visually impaired persons. Arch Ophthalmol, 116, 227–
233.
Mangione C., Gutierrez P., Lowe G., Orav E., Seddon J. (1999). Influence of
age-‐related maculopathy on visual functioning and health-‐related quality of
life. Am J Ophthamol. 128, 45-‐53.
Mangione C., Lee P., Gutierrez P., Spritzer K., Berry S., Hays R.. (2001).
Development of the 25-‐item National Eye Institute Visual Function
Questionnaire. Arch Ophthalmol, 119:1050–1058.
Mankowska A., Airody A., Baseler H., Morland A., Gale R. (2015). Analysis of
an area of interest (choroidal neovascular membrane and sequelae) using
microperimetry demonstrates significant increase in retinal sensitivity
following anti-‐VEGF therapy for neovascular Age-‐related Macular
Degeneration (nvAMD). ARVO. Program no 2772, Poster no B0154.
188
Murkami I., Komatsu H., Kinoshita M. (1997). Perceptual filling-‐in at the
scotoma following a monocular retinal lesion in the monkey. Vis Neurosci,
14(10), 89-‐101.
Martin D., Maguire M., Ying G, Grunwald J. (CATT Research Group). (2011).
Ranibizumab and bevacizumab for neovascular age-‐related macular
degeneration. N Engl J Med, 364, 1897-‐1908.
Martin D., Maguire M., Fine S., Ying G., Jaffe G., Grunwald J., et al. CATT
Research Group. (2012). Ranibizumab and bevacizumab for treatment of
neovascular age-‐related macular degeneration: two-‐year results.
Ophthalmology. 119, 1388-‐1398.
Mathalone N., Arodi-‐Goal A., Sar S., Wolfson Y., Shalem M., Lavi I., et al
(2012). Sustained elevation of intraocular pressure after intravitreal
injections of bevacizumab in eyes with neovascular age-‐related macular
degeneration. Graefes Arch Clin Exp Ophthalmol, 250(10), 1435-‐40.
McClure M., Hart P., Jackson A., Stevenson M., Chakravarthy U. (2000).
Macular degeneration: do conventional measurements of impaired visual
function equate with visual disability? Br J Ophthalmol, 84(3), 244-‐250.
McMonnies C. (2008) Intraocular pressure spikes in keratectasia, axial
myopia, and glaucoma. Optom Vis Sci, 2008, 85(10), 1018-‐26.
Michalova K., Wickremasinghe S., Tan T., Chang A., Harper C., Downie J., et al.
(2009). Ranibizumab treatment for neovascular age-‐related macular
degeneration: from randomized trials to clinical practice. Eye, 23(8), 1633–
1640.
Michele S., Rosenfeld P., Puliafito C., Marcus E., Venkatrman A. (2005).
Systemic bevacizumab (Avastin) therapy for neovascular age-‐related

189
macular degeneration twelve-‐week results of an uncontrolled open-‐label
clinical study. Ophthalmology, 112(6), 1035-‐47
Mitchell J., Bradley C. (2001). Psychometric evaluation of the 12-‐item Well-‐
being Questionnaire for use with people with macular disease. Qual Life Res,
10:, 465-‐473.
Mitchell J., Brose L., Bradley C. (2007). Design of a measure of satisfaction
with treatment for macular degeneration (MacTSQ). Qual Life Res, A-‐120
(suppl), International Society for Quality of Life Research meeting abstracts,
Abstract 1150.
Mitchell J., Wolffsohn J., Woodcock A., Anderson A., McMillam C., FfytcheT., et
al (2005). Psychometric evaluation of the MacDQoL individualized measure
of the impact of macular degeneration on quality of life. Health Qual Life
Outcomes, 3, 25, Published on line 2005 April 14.
Mones J., Amselem L., Serrano A., Garcia M., Hijano. (2009). Intravitreal
ranibizumab for choroidal neovascularization secondary to pathologic
myopia: 12-‐month results. Eye, 23(6), 1275-‐80;
Montero J., Ruiz-‐Moreno J. (2010). Treatment of choroidal
neovascularization in high myopia. Curr Drug Targets, 11(5, :630-‐44.
Munk M., Kiss C., Huf W., Sulzbacher F., Roberts P., Mittermuller T., Sacu S., et
al (2013). One year follow-‐up of functional recovery in neovascular AMD
during monthly anti-‐VEGF treatment. Am J Ophthalmol, 156(4), 633-‐43.
Nabawi K., Sharawi A. (2001). Transpupillary thermotherapy of
subfoveal choroidal neovascularization secondary to pathologic myopia.
Ophthalmic Surg Lasers Imaging, 41(1), 12-‐7.

190
NICE interventional procedure guidance 58, (2004). Retrieved on
October 16th, 2014 from
http://www.nice.org.uk/nicemedia/live/11051/30754/30754.pdf
NICE Technology Appraisal Guidance TA155. Ranibizumab and pegaptanib
for the treatment of age-‐related macular degeneration (2008) Retrieved on
January 2nd, 2015 from http:// www.nice.org.uk/TA155 guidance.pdf
NICE Technology Appraisal Guidance TA298, (2013). Retrieved on
October 16th, 2014 from
http://guidance.nice.org.uk/TA298/Guidance/pdf/English
Ng D., Kwok A., Chan C. (2012). Anti-‐vascular endothelial growth factor
for myopic choroidal neovascularization. Clin Experiment Ophthalmol,
40(1), e98-‐e110.
Noppeney U., Friston K., Ashburner J., Frackowiak R., Price C. (2005). Early
visual deprivation induces structural plasticity in gray and white matter.
Curr Biol, 15, R488–90.
Ogawa S., Lee T., Kay A., Tank D. (1990). Brain magnetic resonance imaging
with contrast dependent on blood oxygenation. Proct Natl Acad Sci USA,
87(24), 9868-‐9872.
Ohno-‐Matsui K., Yoshida T., Futagami S. (2003). Patchy atrophy and lacquer
cracks predispose to the development of choroidal neovascularisation in
pathological myopia. Br J Ophthalmol, 87, 570–573.
Owen C., Fletcher A., Donoghue M., Rudnicka A. (2003) How big is the
burden of visual loss caused by age related macular degeneration in the
United Kingdom? Br J Ophthalmol, 87(3), 312-‐7.

191
Owen C., Jarrar Z., Wormald R., Cook D., Fletcher A., (2012). The estimated
prevalence and incidence of late stage age related macular degeneration in
the UK. Br J Ophthalmol, 96, 752-‐756.
Pallikaris I., Kymionis G., Gnis H., Kounis G., Tslimbaris M. (2005). Ocular
rigidity in living human eyes. Invest Ophthalmol Vis Sci, 46, 409-‐14.
Parravano M., Oddone F., Tedeschi M., Chiaravalloti A., Perillo L., Boccassini
B., et al (2010). Retinal functional changes measured by microperimetry in
neovascular age-‐related macular degeneration treated with ranibizumab:
24-‐month results. Retina, 30(7), 1017–1024.
Patel P., Chen F., Rubin G., Tufail, A. (2008). Intersession repeatability of
visual acuity scores in age-‐related macular degeneration. Invest Ophthalmol
Vis Sci, 49(10), 4347-‐52.
Patel P., Chen F., Da Cruz L., Rubin G., Tufail A., ABC Trial Study Group.
(2011). Contrast sensitivity outcomes in the ABC Trial: a randomized trial of
bevacizumab for neovascular age-‐related macular degeneration. Invest
Ophthalmol Vis Sci, 52(6), 3089-‐93.
Patient Reported Outcome Measures, (2015). Retrieved on February 1st
2015 from http://www.england.nhs.uk/statistics/statistical-‐work-‐
areas/proms/
Pujol-‐Lereis L., Schlafer N., Kuhn L., Rohner B., Pauly D, (2016).
Interrelation Between Oxidation Stress and Complment activation in
Models of Age-‐related Macular Degeneration. Adv Exp Med Biol 854, 87-‐
93
Pearce E., Sivaprasad S., Chong N. (2011). Comparing fixation location and
stability in patients with neovascular age-‐related macular degeneration
treated with or without Ranibizumab. Eye, 25, 149-‐153.

192
Querques G., Azrya S., Martinelli D., Berboucha E., Feldman A., Pece A., et al.
(2010). Ranibizumab for exudative age-‐related macular degeneration: 24-‐
month outcomes from a single-‐centre institutional setting. Br J Ophthalmol,
294(3), 292–296.
Rakic J., Leys A., Brié H., Denhaerynck K., Pacheco C., Vancayzeele S et al.
(2013). Real-‐world variability in ranibizumab treatment and associated
clinical, quality of life and safety outcomes over 24 months in patients with
neovascular age-‐related macular degeneration; the HELIOS study. Clin
Ophthalmol. 7, 1849-‐1858.
Riazi A., Bradley C., Barendse S., Ishii H. (2006). Development of the Well-‐
being questionnaire short-‐form in Japanese: the W-‐BQ12. Health Qual Life
Outcomes, 4, 40.
Rickman C., Farisu S., Toth C., Klingeborn, M. (2013). Dry Age-‐Related
Macular Degeneration: Mechanisms, Therapeutic Targets, and Imaging.
Invest Ophthalmol Vis Sci, 54(14), ORSF68-‐ORSF80.
Regillo C., Brown D., Abraham P., Yue H., Ianchulev T., Schneider S., et al.
(2008). Randomized, double-‐masked, sham-‐controlled trial of ranibizumab
for neovascular age-‐related macular degeneration: PIER Study year 1. Am J
Ophthalmol, 145, 239-‐248.
Roberts P., Mittermueller T., Montuoro A., Sulzbacher F., Munk M., Sacu S., et
al (2014). A quantitative approach to identify morphological features
relevant for visual function in ranibizumab therapy of neovascular AMD.
Invest Ophthalmol Vis Sci, 55(10), 6623-‐30.
Rofagha S., Bhisitkul B., Boyer D., Sadda S., Zhang K., Abraham P. et al.
(2013). Seven – year outcomes in ranibizumab – treated patients in

193
ANCHOR, MARINA and HORIZON: a multicenter cohort study (SEVEN – UP).
Ophthalmology, 120(11), 2292-‐2299.
Rosenfeld P., Moshfeghi A., Puliafito C. (2005). Optical coherence
tomography findings after an intravitreal injection of bevacizumab (avastin)
for neovascular age-‐related macular degeneration. Ophthalmic Surg Lasers
Imaging, 36(4, 331-‐5.
Rosenfeld J., Brown M., Heier S., Boyer S., Kaiser P., Chung Y., et al for the
MARINA Study Group (2006). Ranibizumab for neovascular age-‐related
macular degeneration. N Engl J Med, 355, 1419-‐1431.
Rosengarth K., Keck I., Brandl-‐Rühle S., Frolo J., Hufendiek K., Greenlee M., et
al. (2013). Functional and structural brain modifications induced by
oculomotor training in patients with age-‐related macular degeneration.
Frontiers in psychology, 4 , 428.
Ross A., Donachie P., Sallam A., Stratton I., Monhamed Q., Scanolon P., et al.
(2013). Which visual acuity measurements define high-‐quality care for
patients with neovascular age-‐related macular degeneration treated with
ranibizumab? Eye, 27(1), 56-‐64.
Rostron E, McKibbin M. (2012). Visual impairment certification secondary to
ARMD in Leeds, 2005-‐2010: is the incidence falling? Eye, 26, 933-‐936.
Rothenbuehler S., Waeber D., Brinkmann C., Wolf S. & Wolf-‐Schnurrbusch U.
(2009). Effects of ranibizumab in patients with subfoveal choroidal
neovascularization attributable to age-‐related macular degeneration. Am J
Ophthalmol, 147(5), 831–837.

194
Rotsos T., Patel P., Chen F., & Tufail A. (2010). Initial clinical experience of
ranibizumab therapy for neovascular age-‐related macular degeneration. Clin
Ophthalmol, 4, 1271–1275.
Royal College of Ophthalmologists (RCOphth). Commissioning
contemporary AMD services: a guide for commissioners and clinicians
(2007) Retreived on 9th January, 2015 from
http://www.rcophth.ac.uk/core/core_picker/download/Commissioning+Co
ntemporary+AMD+Sevices.
Royal College of Ophthalmologists Guidelines for Intravitreal Injections
Procedure 2009. Retrieved on 9Th January 2015 at
www.rcophth.ac.uk/publications/guidelines
Schmidt-‐Erfurth U., Kaiser P., Korobelnik J., Brown D., Chong V., Ngyuyen Q.,
et al. (2014) Intravitreal aflibercept injection for neovascular age-‐related
macular degeneration: ninety-‐six-‐week results of the VIEW studies.
Ophthalmology. 121(1);193-‐201.
Schumacher E., Jacko J., Primo S., Main K., Moloney K., Kinzel E., et al. (2008).
Reorganization of visual processing is related to eccentric viewing in
patients with macular degeneration. Restor Neurol Neurosci, 26, 391–402.
Scott I., Schein O., West S, Bandeen-‐Roche K., Enger C., Folstein F. (1994).
Functional status and quality of life measurements among ophthalmic
patients. Arch Ophthamol, 112, 329-‐335.
Secretan M., Kuhn D., Soubrane G., Coscas G. (1997). Long-‐term visual
outcome of choroidal neovascularization in pathologic myopia: natural
history and laser treatment. Eur J Ophthalmol, 4, 307-‐16.
Shao Y., Keliris G., Papaniloaou A., Fischer M., Zibor D., Jagle H., et al (2013).

195
Visual cortex organisation in a macaque monkey with macular degeneration.
Eur J Neurosci, 38, 3456-‐3465.
Shima N., Markowitz S., Reyes S. (2010). Concept of a functional retinal locus
in age-‐related macular degeneration. Can J Ophthalmol, 45 (1), 62-‐6.
Silva R., Ruiz-‐Moreno J., Nascimento J., Carnerio A., Rosa A., Barbosaa A.,
et al. (2008). Short-‐term efficacy and safety of intravitreal ranibizumab
for myopic choroidal neovascularization. Retina, 28(8),1117-‐23.
Smirnakis S., Brewer A., Schmid M., Tolias A., Schu ̈z A., Augath M., et al
(2005). Lack of long-‐term cortical reorganization after macaque retinal
lesions. Nature, 435, 300-‐307.
Snell R. and Lemp M. (1998). Clinical Anatomy of the Eye. Second Edition.
Malden; Blackwell Science, Inc.
Soubrane G. (2008). Choroidal neovascularization in pathologic myopia:
recent developments in diagnosis and treatment. Surv Ophthalmol, 53(2),
121-‐38.
Squirrell D., Ehrlich R. (2012) The Use of Macular Microperimetry in the
Assessment and Diagnosis of Macular Disease. Retinal physician, 9, 53-‐57
Squirrell D., Mawer N., Mody C., Brand C. (2010). Visual outcome after
intravitreal ranibizumab for wet age related macular degeneration: a
comparison between: a comparison between best-‐corrected visual acuity
and microperimetry. Retina, 30, 436-‐442.
Sunness J., Bressler N., Tian Y., Alexander J., Applegate C. (1999). Measuring
geographic atrophy in advanced age-‐related macular degeneration. Invest
Ophthalmol Vis Sci, 40(8), 1761-‐9

196
Tarita-‐Nistor L., Gonzalez E., Markowitz S., Steinback M. (2008). Fixation
characteristics of patients with macular degeneration recorded with the mp-‐
1 microperimeter. Retina, 28(1), 125-‐33.
Thakkinsatian A., Han P., McEvoy., Smith W., Hoh J., et al. (2006). Systematic
review and meta-‐analysis of the association between complement factore H
Y402H polymorphisms and age-‐related macular degeneration. Hum Mol
Genet, 15(18): 2784-‐90.
Treatment of age-‐related macular degeneration with photodynamic therapy
(TAP) Study Group. (1991). Photodynamic therapy of subfoveal choroidal
neovascularization in age-‐ related macular degeneration with verteporfin:
one-‐year results of 2 randomized clinical trials-‐-‐TAP report. Arch
Ophthalmol, 117(10),1329-‐45.
Tschour P., Pilly B., Venogopal D., Gale R. (2013). Optimising assessment
intervals improves visual outcomes in ranibizumab treated age-‐related
neovascular macular degeneration: using the stability phase as benchmark.
Graefes Arch Clin Exp Ophth, 251(10), 2327-‐30.
Tufail A., Narendran N., Patel P., Sivaprasad S., Amoaku W, Gale R., et al.
(2013b) Ranibizumab in myopic choroidal neovascularization: the 12-‐
month results from the REPAIR study. Ophthalmology, 120, 1944-‐1945
e1941
Tufail A., Patel P., Egan., Hykin P., da Cruz., Gregor Z., et al. (2010).
Bevacizumab for neovascular age related macular degeneration (ABC
Trial): multicentre randomised double masked study. BMJ, 9, 340.

197
Tufail A., Patel P., Sivaprasad S., Amoaku., Browning A. Gale R., et al. (2013a).
Ranibizumab for the treatment of choroidal neovascularisation secondary to
pathological myopia: interim analysis of the REPAIR study. Eye, 27, 709-‐715.
Tufail A., Xing W., Johnston R., Akerele T., McKibbin M., Downey L., et al.
(2014). The neovascular age – related macular degeneration database:
multicenter study of 92976 ranibizumab injections: report 1: visual acuity.
Ophthalmology, 121, 1092-‐1101.
Ulbig M., McHugh J., Hamilton P. (1993). Photocoagulation of choroidal
neovascular membranes with a diode laser. Br J Ophthalmol, 77, 218–21.
US FDA. (2006). Guidance for industry: patient-‐reported outcome
measures: use in medical product development to support labeling
claims: draft guidance. Health Qual Life Outcomes, 11(4), 79.
Underwood, J. (1992). General and Systemic Pathology. New York: Churchill
Livingstone.
Van de Velde F., Timberlake G., Jalkh A., Schepens C. (1990). Static
microperimetry with the laser scanning ophthalmolscope. Ophthalmologe,
4(3), 291-‐4.
Verteporfin in Photodynamic Therapy study group (2001).
Photodynamic therapy of subfoveal choroidal neovascularization in
pathologic myopia with verteporfin. 1-‐year results of a randomized
clinical trial-‐-‐VIP report no. 1. Ophthalmology, 108(5), 841-‐52.
Walker H., Hall W., Hurst j. (1990) Clinical methods: The history, Physical
and Laboratory Examination . Third edition. Boston, Butterworths.

198
West S., Munoz B., Rubin G., Schein O., Bandeen-‐Roche K., Zeger S., et al
(1997). Function and visual impairment in a population-‐based study of
older adults. The SEE project. Invest Ophthamol Vis Sci, 38, 72-‐82.
Yoshida T., Ohno-‐Matsui K., Yasuzumi K., (2003). Myopic choroidal
neovascularization: a 10-‐year follow-‐up. Ophthalmology, 110(7),1297-‐305.
Wolf S., Balciuniene V., Laganovska G., Menchini., Ohno-‐Matsui K., Sharma T.,
et al. (2014). RADIANCE: a randomized controlled study of ranibizumab in
patients with choroidal neovascularization secondary to pathologic myopia.
Ophthalmology, 121, 682-‐692 e682.
Wolfram C., Höhn R., Kottler U., Wild P., Blettner M., Bühren J., et
al.(2014). Prevalence of refractive errors in the European adult
population: the Gutenberg Health Study (GHS). Br J Ophthalmol, 98(7),
857-‐61.
Woodcock A., Plowright R., Kennedy-‐Martin T., Hirsch A., ffytche T, et al.
(2005) Development of the new Retinopathy Treatment Satisfaction
Questionnaire (RetTSQ). Int Congr Ser, 1282, 342-‐346.
Wu Z., Ayton L., Guymer R., Luu, C. (2013). Intrasession test-‐retest
variability of microperimetry in age-‐related macular degeneration. Invest
Ophthalmol Vis Sci, 54(12), 7378-‐85.
Yannuzzi L., Lardella A., Spaide R., Rabb F., Freud K., Orlock D. (1997). The
expanding clinical spectrum of idiopathic polypoidal choroidal
Vasculopathy. Arch Ophthalmol, 115(4), 478-‐85.
Yannuzzi L., Negrao S., Lida, T., Carvalho C., Rodriguez-‐Coleman H., Slakter J.
et al (2012). Retinal angiomatous proliferation in age–related macular
degeneration. Retina, 32(1), 416-‐34.

199
Yoshida T., Ohno-‐Matsui K., Yasuzumi K. (2003). Myopic choroidal
neovascularization: a 10-‐year follow-‐up. Ophthalmology, 110(7), 1297-‐305