quantitative phase analysis › ... › dxc2014-madsen-quantifying-2.pdf · theory and practice ian...
TRANSCRIPT

Quantitative Phase AnalysisTheory and PracticeTheory and PracticeIan C. Madsen
CSIRO Mineral Resources Flagship
QUANTITATIVE PHASE ANALYSIS WORKSHOP – DXC2014, BIG SKY, MONTANA
Box 312, Clayton South 3169, Victoria, [email protected]
Q , ,

Outline
• Basis of quantitative phase1 analysis (QPA)o Single peak methodso Whole pattern methods
• H t l t hi h th d t• How to select which method to use
• Some lecture notes available at :• Some lecture notes available at :‐o http://www.crystalerice.org/Erice2011/books/Book_Erice2011_PD.pdf
1 Phase = a crystallographically distinct component of the sample not to be confused with the “phase problem” in structure solution
Ian Madsen | TOPAS Training – Level 1 2013 |2 | Ian Madsen | TOPAS Training Course – Level 1 | 2013 |2 | Ian Madsen | CSIRO Mineral Resources Flagship | Quantitative Phase Analysis | DXC2014, Big Sky, Montana2 |
not to be confused with the phase problem in structure solution
Sources of Information for Quantitative XRDWide coverage of general principlesWide coverage of general principles
o Zevin & Kimmel (1995) Q i i X Diff– Quantitative X‐ray Diffractometry.
– Springer New York
Ian Madsen | TOPAS Training – Level 1 2013 |3 | Ian Madsen | TOPAS Training Course – Level 1 | 2013 |3 | Ian Madsen | CSIRO Mineral Resources Flagship | Quantitative Phase Analysis | DXC2014, Big Sky, Montana3 |
An Opportunity for Shameless Self Citation
• Chapter 10o Quantitative Phase Analysis Using
the Rietveld Method– I.C. Madsen, N.V.Y. Scarlett,, ,
D.P. Riley and M.D. Raven
Ian Madsen | TOPAS Training – Level 1 2013 |4 | Ian Madsen | TOPAS Training Course – Level 1 | 2013 |4 | Ian Madsen | CSIRO Mineral Resources Flagship | Quantitative Phase Analysis | DXC2014, Big Sky, Montana4 |

International Tables for CrystallographyVolume H – Powder Diffraction
• Contents (provisional):o Part 1 Introduction
Volume H – Powder Diffraction
o Part 1. Introductiono Part 2. Instrumentation and sample
preparationo Part 3. Methodologygyo Part 4. Structure determinationo Part 5. Defects, texture,
microstructure and fibresP 6 S fo Part 6. Software
o Part 7. Applications• Volume H will be the key
reference for all powderreference for all powder diffractionists from beginners to advanced practitioners
• Scheduled publication date: o December 2014
Ian Madsen | TOPAS Training – Level 1 2013 |5 | Ian Madsen | TOPAS Training Course – Level 1 | 2013 |5 | Ian Madsen | CSIRO Mineral Resources Flagship | Quantitative Phase Analysis | DXC2014, Big Sky, Montana5 |

Analytical Methods of Phase AnalysisIndirect methodsDirect methodsDirect methodsXRD for quantitative phase analysisRange of complexity of materials analysed
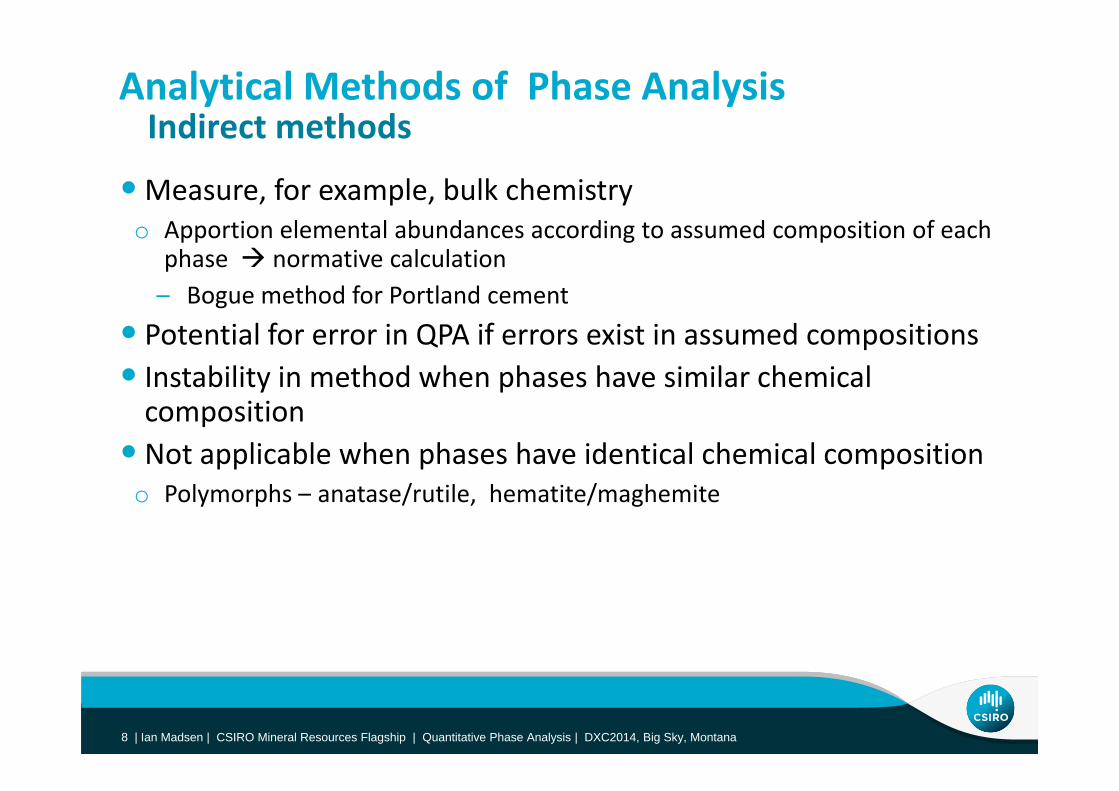
Analytical Methods of Phase AnalysisIndirect methods
•Measure, for example, bulk chemistry
Indirect methods
o Apportion elemental abundances according to assumed composition of each phase normative calculation – Bogue method for Portland cementg
• Potential for error in QPA if errors exist in assumed compositions• Instability in method when phases have similar chemical composition
• Not applicable when phases have identical chemical composition P l h / il h i / h io Polymorphs – anatase/rutile, hematite/maghemite
Ian Madsen | TOPAS Training – Level 1 2013 |8 | Ian Madsen | TOPAS Training Course – Level 1 | 2013 |8 | Ian Madsen | CSIRO Mineral Resources Flagship | Quantitative Phase Analysis | DXC2014, Big Sky, Montana8 |

Analytical Methods of Phase AnalysisDirect methods
•Magnetic susceptibility
Direct methods
o limited to samples with magnetic phases• Selective dissolution
o Rate of dissolution can be phase dependanto Rate of dissolution can be phase dependant• Density measurements
o Physical separation of phaseso Physical separation of phases• Image analysis
o Optical & e‐beam images – issues with stereology• Thermal analysis
o Magnitude of endo‐/exo‐thermic features during phase transitions relate to phase contentphase content
• Diffraction based methods ………………………….
Ian Madsen | TOPAS Training – Level 1 2013 |9 | Ian Madsen | TOPAS Training Course – Level 1 | 2013 |9 | Ian Madsen | CSIRO Mineral Resources Flagship | Quantitative Phase Analysis | DXC2014, Big Sky, Montana9 |

XRD for Quantitative Phase Analysis
• “Quantitative phase analysis by X‐ray diffraction (QXRD) is the l l ti l t h i th t i t l h iti ” 1only analytical technique that is truly phase sensitive” 1
o Diffraction data derived directly from the crystal structure of each phase– Results are not inferred via indirect measurementResults are not inferred via indirect measurement
o Capable of analysing polymorphs
• Mathematical basis of QPA is well established, butQ ,o Limitations on accuracy are mostly experimental
• Many sources of error yo Instrument configuration Particle statisticso Counting error Preferred orientationo Microabsorptiono Operator error ! PICNIC Problem In Chair, Not In Computer
Ian Madsen | TOPAS Training – Level 1 2013 |10 | Ian Madsen | TOPAS Training Course – Level 1 | 2013 |10 | Ian Madsen | CSIRO Mineral Resources Flagship | Quantitative Phase Analysis | DXC2014, Big Sky, Montana10 |
1 Chung & Smith (2000)

Range of Complexity in QPASynthetic materials
• Sample 1G from IUCr CPD round robin
Synthetic materials
o ‘Simple’ – 3 well defined phases with high symmetry, small unit cells– Little peak overlap
Corundum 33.08 %Fl it 33 56 %
150Fluorite 33.56 %Zincite 33.35 %
qrt(C
ount
s) 100
Sq
50
2Th Degrees7065605550454035302520
Ian Madsen | TOPAS Training – Level 1 2013 |11 | Ian Madsen | TOPAS Training Course – Level 1 | 2013 |11 | Ian Madsen | CSIRO Mineral Resources Flagship | Quantitative Phase Analysis | DXC2014, Big Sky, Montana11 |

Range of Complexity in QPA Mineralogical samples
• Mineral samples are complex • QPA of mineral samples is rarely a straight forward exercise !
Mineralogical samples
o Multi‐phase (20 not uncommon) o Inhomogeneous at all size ranges• Sample related issues
straight‐forward exercise !• Difficult to standardize methodology
115
110
105
100
95
90
Pyrite 16.41 %Pentlandite 54.56 %Magnetite 10.73 %Magnesite 4.31 %Violerite 1.91 %Galena 0.06 %Millerite 0.33 %Pyrrhotite1 1.42 %
• Sample related issueso Poorly crystallinity – Clays, goethite, nontronite
Nickel Concentrate
85
80
75
70
65
60
55
Pyrrhotite2 1.24 %Talc 3.89 %Hydrotalcite 0.63 %Nepouite 4.51 %o Variable chemical composition
(solid solution) of phaseso Preferred orientation 55
50
45
40
35
30
25
o Preferred orientation, micro‐absorption etc..
2Theta (deg)7570656055504540353025201510
20
15
10
5
0
Ian Madsen | TOPAS Training – Level 1 2013 |12 | Ian Madsen | TOPAS Training Course – Level 1 | 2013 |12 | Ian Madsen | CSIRO Mineral Resources Flagship | Quantitative Phase Analysis | DXC2014, Big Sky, Montana12 |
2Theta (deg)
Basis of Quantitative Phase AnalysisSingle peak methodsWhole pattern methodsWhole pattern methods
Commonly Used Diffraction Based QPA Methods Divided Into Two Distinct Groups• Traditional ‘single peak’ methods
Divided Into Two Distinct Groups
o Rely on measurement of intensity of a peak, or group of peaks, for each phase of interest
o Assumes intensity is representative of phase concentration – affected byy p p y– Peak overlap, preferred orientation and microabsorption
•Whole pattern methods o Compare wide 2θ range diffraction data with a calculated pattern– Summation of individual phase components which have either been:‐
• Measured from pure phase samples• Measured from pure phase samples• Calculated from crystal structure information
Ian Madsen | TOPAS Training – Level 1 2013 |14 | Ian Madsen | TOPAS Training Course – Level 1 | 2013 |14 | Ian Madsen | CSIRO Mineral Resources Flagship | Quantitative Phase Analysis | DXC2014, Big Sky, Montana14 |
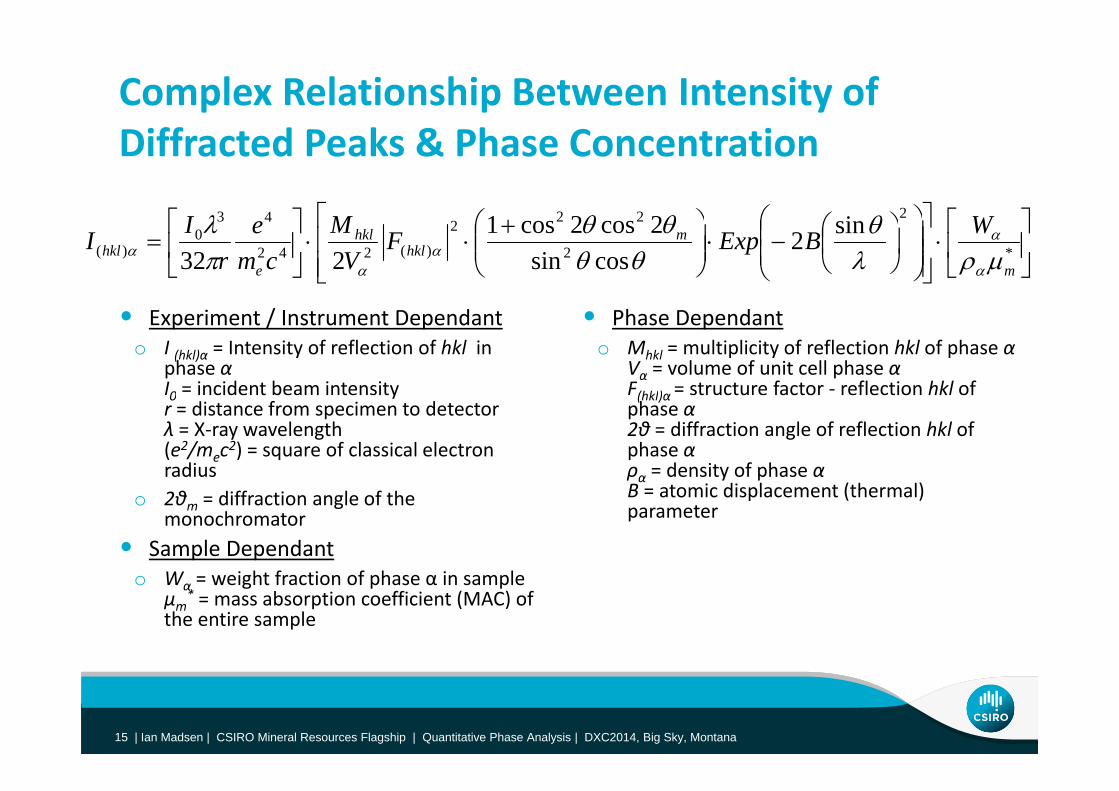
Complex Relationship Between Intensity of Diffracted Peaks & Phase Concentration
22243 i221 WMI *
2
2
222
)(242
430
)(sin2
cossin2cos2cos1
232
m
mhkl
hkl
ehkl
WBExpFV
Mcm
er
II
• Experiment / Instrument Dependanto I (hkl)α = Intensity of reflection of hkl in
phase αI0 = incident beam intensity
• Phase Dependanto Mhkl = multiplicity of reflection hkl of phase α
Vα = volume of unit cell phase αF(hkl)α= structure factor ‐ reflection hkl of 0 y
r = distance from specimen to detectorλ = X‐ray wavelength(e2/mec2) = square of classical electron radius
(hkl)αphase α2θ = diffraction angle of reflection hkl of phase αρα = density of phase αB t i di l t (th l)o 2θm = diffraction angle of the
monochromator• Sample Dependant
W weight fraction of phase α in sample
B = atomic displacement (thermal) parameter
o Wα = weight fraction of phase α in sampleμm* = mass absorption coefficient (MAC) of the entire sample
Ian Madsen | TOPAS Training – Level 1 2013 |15 | Ian Madsen | TOPAS Training Course – Level 1 | 2013 |15 | Ian Madsen | CSIRO Mineral Resources Flagship | Quantitative Phase Analysis | DXC2014, Big Sky, Montana15 |

Relationship Between Intensity of Diffracted Peaks & Phase Concentration
*
2
2
222
)(242
430
)(sin2
cossin2cos2cos1
232
m
mhkl
hkl
ehkl
WBExpFV
Mcm
er
II
Constant for SampleConstant for intensity
Constant for experimental
setup
Sample effects
Constant for intensity of peak (hkl) for phase
11W2* 21)(
11
V
WCCIm
hkl
Ian Madsen | TOPAS Training – Level 1 2013 |16 | Ian Madsen | TOPAS Training Course – Level 1 | 2013 |16 | Ian Madsen | CSIRO Mineral Resources Flagship | Quantitative Phase Analysis | DXC2014, Big Sky, Montana16 |
Single Peak MethodsAbsorption‐diffraction methodInternal standard methodInternal standard methodHow to choose an internal standard
R f i t it tiReference intensity ratioMatrix flushing method

Single Peak MethodsAbsorption Diffraction method
o Rearrange to extract phase abundances in real samples
Absorption‐Diffraction method
W
i h f i f h
abundances in real samples*m
iiWCI
I *o Wα = weight fraction of phase αo Iiα = intensity of peak (or group of
peaks) i for phase α
i
mi
CIW
o Ciα = calibration constanto μm* = whole sample MAC
R t d i C f
o Need to determine μm* for each sample and standard
o Need to prepare standard(s)o Rearrange to derive Ciα from standard(s) with known Wα
o Need to prepare standard(s)
I *
W
IC mii
Ian Madsen | TOPAS Training – Level 1 2013 |18 | Ian Madsen | TOPAS Training Course – Level 1 | 2013 |18 | Ian Madsen | CSIRO Mineral Resources Flagship | Quantitative Phase Analysis | DXC2014, Big Sky, Montana18 |

Determining Sample Mass Absorption Coefficient
Direct Measurement• M b i i i λ
Calculation• C l l * f h f h• Measure beam intensity using same λ
used in XRD data collectiono Sample of known thickness t
• Calculate μm* from the sum of the products of :‐
o Theoretical MAC (j) of each element (or phase)• I = intensity with sample in
• I0 = intensity with sample out
phase) o Weight fractions (Wj) of all n elements (or phases) in the sample
tII
mm*exp j
n
jm W ** I0
jj
j1
t
– Note – using chemical analysis is likely to be more accurate since amorphous content (not analysed by XRD) is included in the calculation
Io I
μρ
λ
Ian Madsen | TOPAS Training – Level 1 2013 |19 | Ian Madsen | TOPAS Training Course – Level 1 | 2013 |19 | Ian Madsen | CSIRO Mineral Resources Flagship | Quantitative Phase Analysis | DXC2014, Big Sky, Montana19 |

Single Peak MethodsInternal standard method
• Recall relationship for phase α • Divide two equations
Internal standard method
o Eliminate μm*
*iiWCI
iisi CCWI
• Include an internal standard sin known quantityW and
m
ijs
js
is
js
i CCWI
in known quantity Ws and measure peak(s) intensity Ijs
o where Cjsiα is a calibration constant specific to phase, standard and lines used
•Wα determined by :‐*m
sjsjs
WCI
iIWW m
js
iijs
s
II
CWW
Ian Madsen | TOPAS Training – Level 1 2013 |20 | Ian Madsen | TOPAS Training Course – Level 1 | 2013 |20 | Ian Madsen | CSIRO Mineral Resources Flagship | Quantitative Phase Analysis | DXC2014, Big Sky, Montana20 |
How to Choose an Internal Standard
• Material should be stable & unreactiveo Especially for in situ studies
• Simple diffraction pattern – minimal overlap with sample peaks
• Standard MAC should be similar to sample MACo Avoid introducing microabsorption effects
• Minimal sample related effect on observed intensitieso No preferred orientation • 100% (or known) crystallinity
Mi i l ‘ i i ’o Minimal ‘graininess’
Ian Madsen | TOPAS Training – Level 1 2013 |21 | Ian Madsen | TOPAS Training Course – Level 1 | 2013 |21 | Ian Madsen | CSIRO Mineral Resources Flagship | Quantitative Phase Analysis | DXC2014, Big Sky, Montana21 |

How to Choose an Internal Standard (cont’d)
• Possibilitieso ‐Al2O3 (corundum) TiO2 (rutile) ZnO (zincite) Cr2O3 (eskolaite)
‐Fe2O3 (hematite) CeO2 (cerianite) CaF2 (fluorite) C (diamond)
• Alternate approacho Use an independent measure (e.g. chemical analysis) to derive the
concentration of a phase already present in the sampleo Designate it as the internal standard
Ian Madsen | TOPAS Training – Level 1 2013 |22 | Ian Madsen | TOPAS Training Course – Level 1 | 2013 |22 | Ian Madsen | CSIRO Mineral Resources Flagship | Quantitative Phase Analysis | DXC2014, Big Sky, Montana22 |

Single Peak MethodsReference Intensity Ratio RIR
• An instrument independent phase constant
Reference Intensity Ratio RIR
•Developed specifically for QPA• Ratio of strongest peak of phase to strongest peak of standard s
isi RIRCWI s
ijs
s
js
i RIRCWI
Ian Madsen | TOPAS Training – Level 1 2013 |23 | Ian Madsen | TOPAS Training Course – Level 1 | 2013 |23 | Ian Madsen | CSIRO Mineral Resources Flagship | Quantitative Phase Analysis | DXC2014, Big Sky, Montana23 |
Single Peak MethodsReference Intensity Ratio RIR (cont’d)
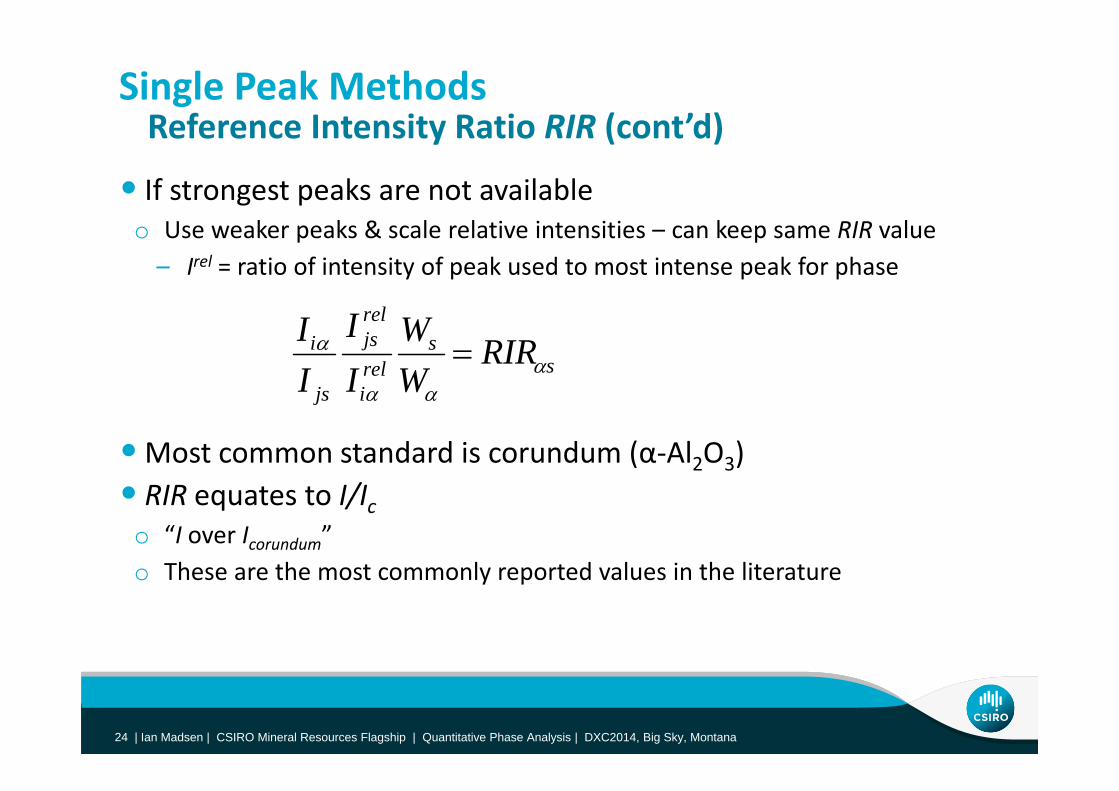
• If strongest peaks are not available
Reference Intensity Ratio RIR (cont d)
o Use weaker peaks & scale relative intensities – can keep same RIR value– Irel = ratio of intensity of peak used to most intense peak for phase
ss
reli
reljs
js
i RIRWW
II
II
•Most common standard is corundum (α‐Al2O3)RIR I/I
ijs
• RIR equates to I/Ico “I over Icorundum”o These are the most commonly reported values in the literatureo These are the most commonly reported values in the literature
Ian Madsen | TOPAS Training – Level 1 2013 |24 | Ian Madsen | TOPAS Training Course – Level 1 | 2013 |24 | Ian Madsen | CSIRO Mineral Resources Flagship | Quantitative Phase Analysis | DXC2014, Big Sky, Montana24 |

Single Peak MethodsReference Intensity Ratio RIR (cont’d)
• Collated lists of RIR values for common phases in ICDD database
Reference Intensity Ratio RIR (cont d)
• Take care in selection of RIR value for their particular experiment • RIR depends upon the data collection and measurement strategy
k h i h i d k h l l ho Peak height, integrated peak area, whole pattern, X‐ray wavelengtho Must match the conditions used in analysis• Do not rely on published values ‐ determine for current materialDo not rely on published values determine for current material
Ian Madsen | TOPAS Training – Level 1 2013 |25 | Ian Madsen | TOPAS Training Course – Level 1 | 2013 |25 | Ian Madsen | CSIRO Mineral Resources Flagship | Quantitative Phase Analysis | DXC2014, Big Sky, Montana25 |
Single Peak MethodsReference Intensity Ratio RIR (cont’d)
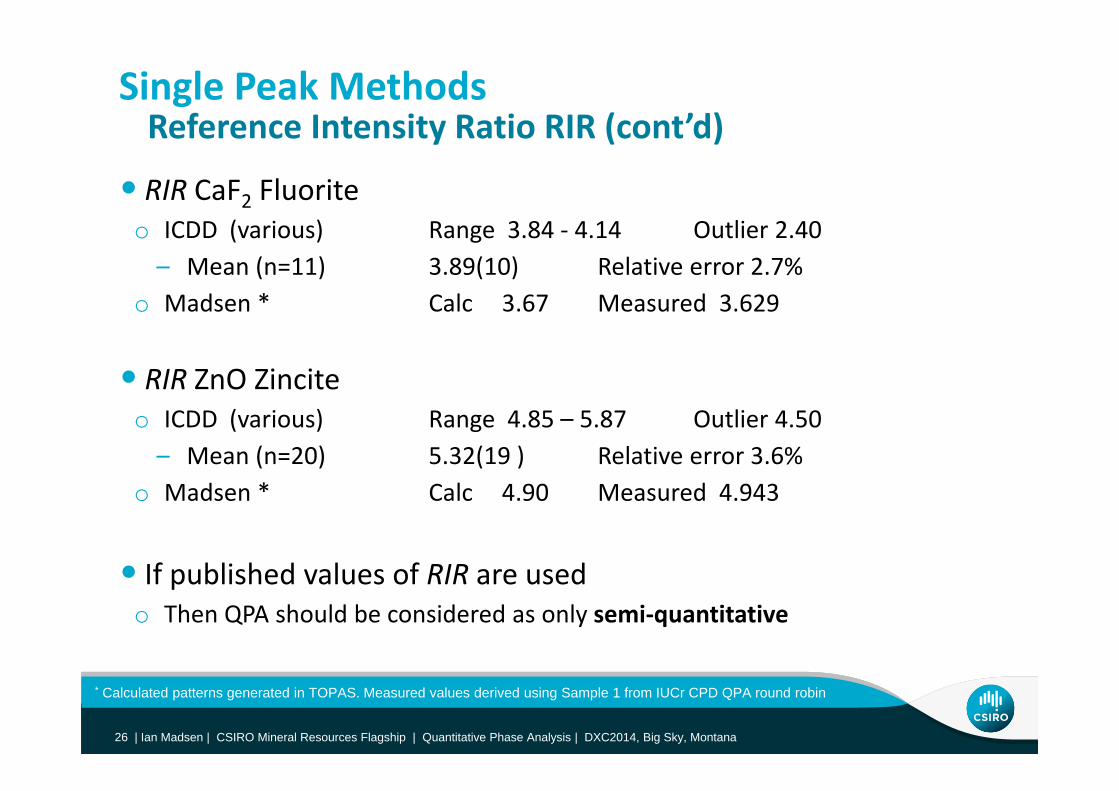
• RIR CaF2 Fluorite
Reference Intensity Ratio RIR (cont d)
o ICDD (various) Range 3.84 ‐ 4.14 Outlier 2.40 – Mean (n=11) 3.89(10) Relative error 2.7%
o Madsen * Calc 3 67 Measured 3 629o Madsen Calc 3.67 Measured 3.629
• RIR ZnO Zinciteo ICDD (various) Range 4.85 – 5.87 Outlier 4.50– Mean (n=20) 5.32(19 ) Relative error 3.6%M d * C l 4 90 M d 4 943o Madsen * Calc 4.90 Measured 4.943
• If published values of RIR are used• If published values of RIR are used o Then QPA should be considered as only semi‐quantitative
Ian Madsen | TOPAS Training – Level 1 2013 |26 | Ian Madsen | TOPAS Training Course – Level 1 | 2013 |26 | Ian Madsen | CSIRO Mineral Resources Flagship | Quantitative Phase Analysis | DXC2014, Big Sky, Montana26 |
* Calculated patterns generated in TOPAS. Measured values derived using Sample 1 from IUCr CPD QPA round robin
Single Peak MethodsMatrix Flushing Method *
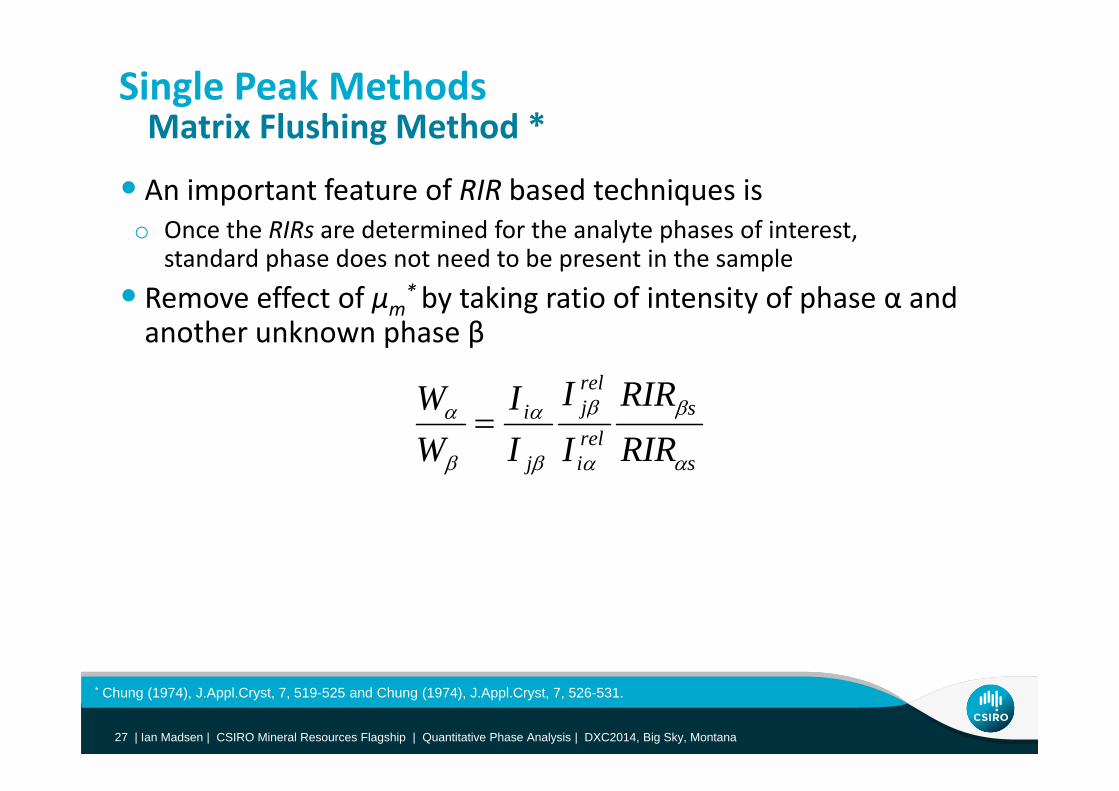
• An important feature of RIR based techniques is
Matrix Flushing Method *
o Once the RIRs are determined for the analyte phases of interest,standard phase does not need to be present in the sample
• Remove effect of μm* by taking ratio of intensity of phase α andRemove effect of μm by taking ratio of intensity of phase α and another unknown phase β
rel RIRIIW
s
sreli
j
j
i
RIRRIR
II
II
WW
Ian Madsen | TOPAS Training – Level 1 2013 |27 | Ian Madsen | TOPAS Training Course – Level 1 | 2013 |27 | Ian Madsen | CSIRO Mineral Resources Flagship | Quantitative Phase Analysis | DXC2014, Big Sky, Montana27 |
* Chung (1974), J.Appl.Cryst, 7, 519-525 and Chung (1974), J.Appl.Cryst, 7, 526-531.

Single Peak MethodsMatrix Flushing Method (cont’d)
• If all components are crystalline and included in the analysis, i t d dditi l t i t
Matrix Flushing Method (cont d)
introduce an additional constraint
n
0.11
k
kW
• Sum of all weight fractions = unity (or known value)
Ian Madsen | TOPAS Training – Level 1 2013 |28 | Ian Madsen | TOPAS Training Course – Level 1 | 2013 |28 | Ian Madsen | CSIRO Mineral Resources Flagship | Quantitative Phase Analysis | DXC2014, Big Sky, Montana28 |
Single Peak MethodsMatrix Flushing Method (cont’d)
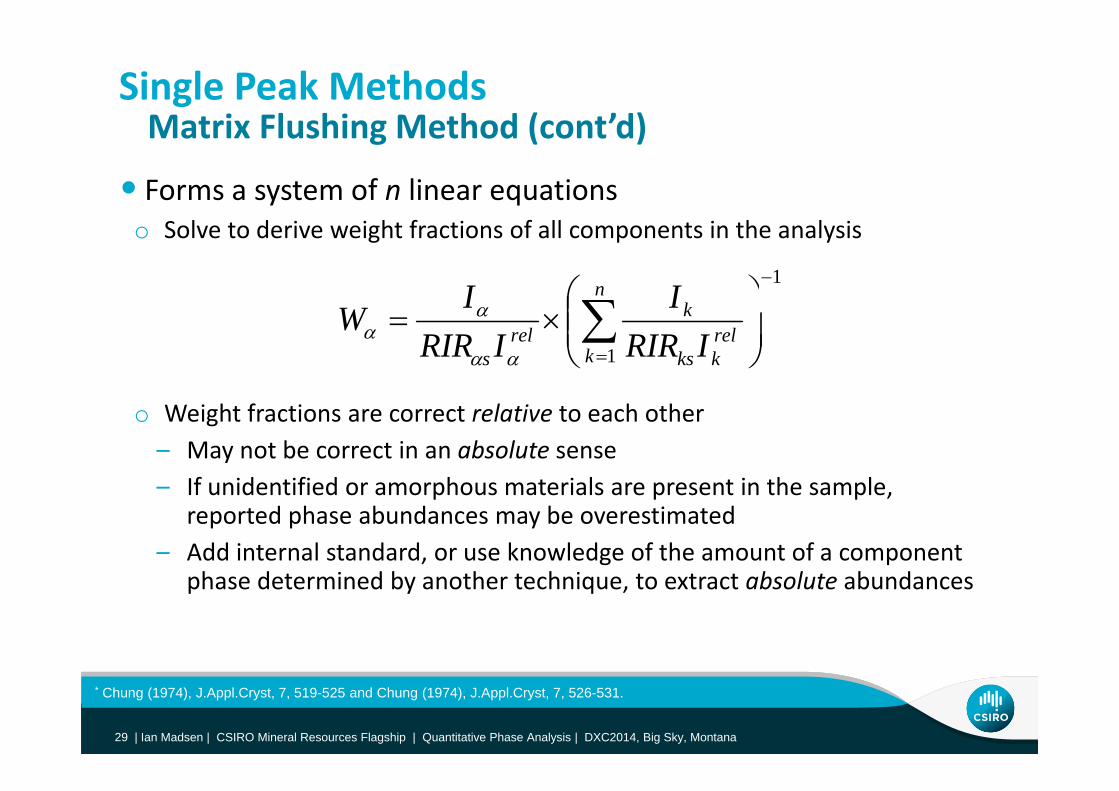
• Forms a system of n linear equations
Matrix Flushing Method (cont d)
o Solve to derive weight fractions of all components in the analysis
1
nkII
1
krelkks
krel
s IRIRI
IRIRIW
o Weight fractions are correct relative to each other – May not be correct in an absolute sense
If unidentified or amorphous materials are present in the sample– If unidentified or amorphous materials are present in the sample, reported phase abundances may be overestimated
– Add internal standard, or use knowledge of the amount of a component h d t i d b th t h i t t t b l t b dphase determined by another technique, to extract absolute abundances
Ian Madsen | TOPAS Training – Level 1 2013 |29 | Ian Madsen | TOPAS Training Course – Level 1 | 2013 |29 | Ian Madsen | CSIRO Mineral Resources Flagship | Quantitative Phase Analysis | DXC2014, Big Sky, Montana29 |
* Chung (1974), J.Appl.Cryst, 7, 519-525 and Chung (1974), J.Appl.Cryst, 7, 526-531.

Demonstration of methodsSingle peak methods

IUCr Commission on Powder Diffraction
90
1000
10 c
Round Robin on Quantitative Phase Analysis• Experimental design for Sample 1
Ei h i f 3 h
%) 70
80
90
20
30
o Eight mixtures of 3 phases– Corundum – ‐Al2O3
– Fluorite – CaF2
ndum
(wt%
50
60
70 Zincite (w
40
50 f
– Zincite – ZnOo Each phase present at a range of
concentrations
Coru
nd
30
40
50 wt%)60
70
d
go ~ 1.5, 5, 15, 30, 55, 95 wt%• Data collection
o 3 replicates
10
20
30
80
90
de
ho 3 replicates
0 10 20 30 40 50 60 70 80 90 100Fluorite (wt%)
0
10
100 ab
Ian Madsen | TOPAS Training – Level 1 2013 |31 | Ian Madsen | TOPAS Training Course – Level 1 | 2013 |31 | Ian Madsen | CSIRO Mineral Resources Flagship | Quantitative Phase Analysis | DXC2014, Big Sky, Montana31 |
( )
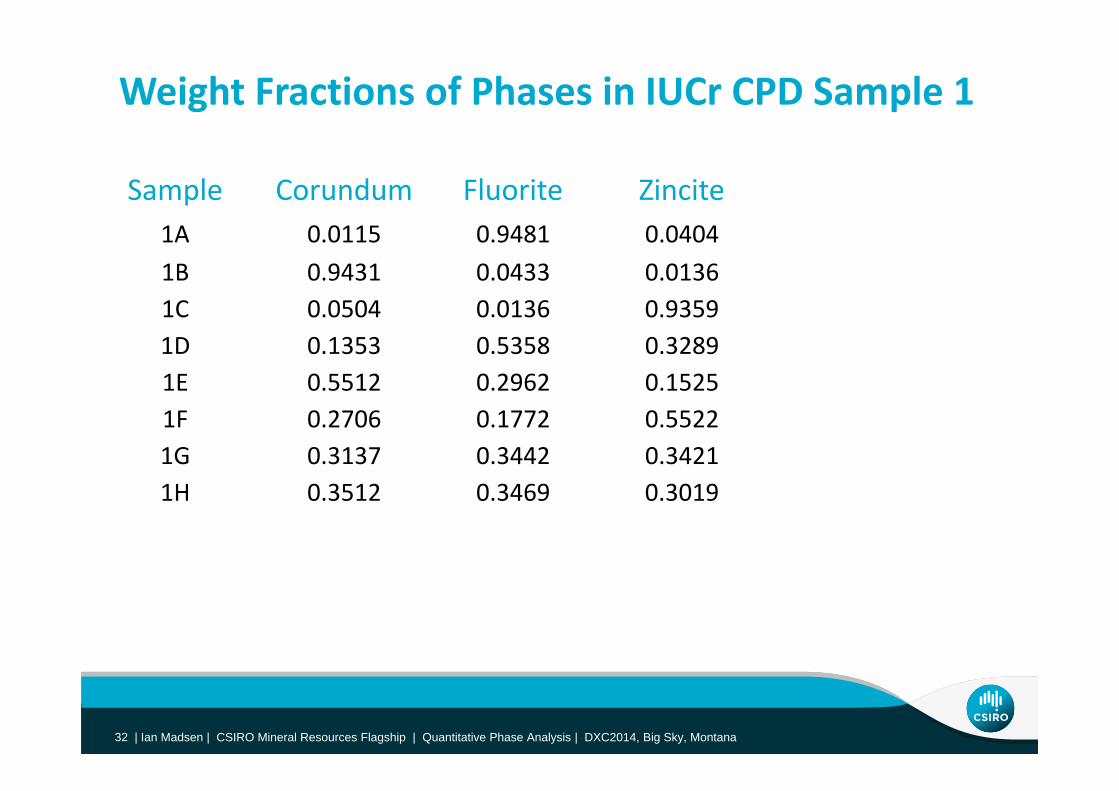
Weight Fractions of Phases in IUCr CPD Sample 1
Sample Corundum Fluorite Zincite1A 0.0115 0.9481 0.04041B 0.9431 0.0433 0.01361C 0 0504 0 0136 0 93591C 0.0504 0.0136 0.93591D 0.1353 0.5358 0.32891E 0.5512 0.2962 0.15251F 0.2706 0.1772 0.55221G 0.3137 0.3442 0.34211H 0 3512 0 3469 0 30191H 0.3512 0.3469 0.3019
Ian Madsen | TOPAS Training – Level 1 2013 |32 | Ian Madsen | TOPAS Training Course – Level 1 | 2013 |32 | Ian Madsen | CSIRO Mineral Resources Flagship | Quantitative Phase Analysis | DXC2014, Big Sky, Montana32 |
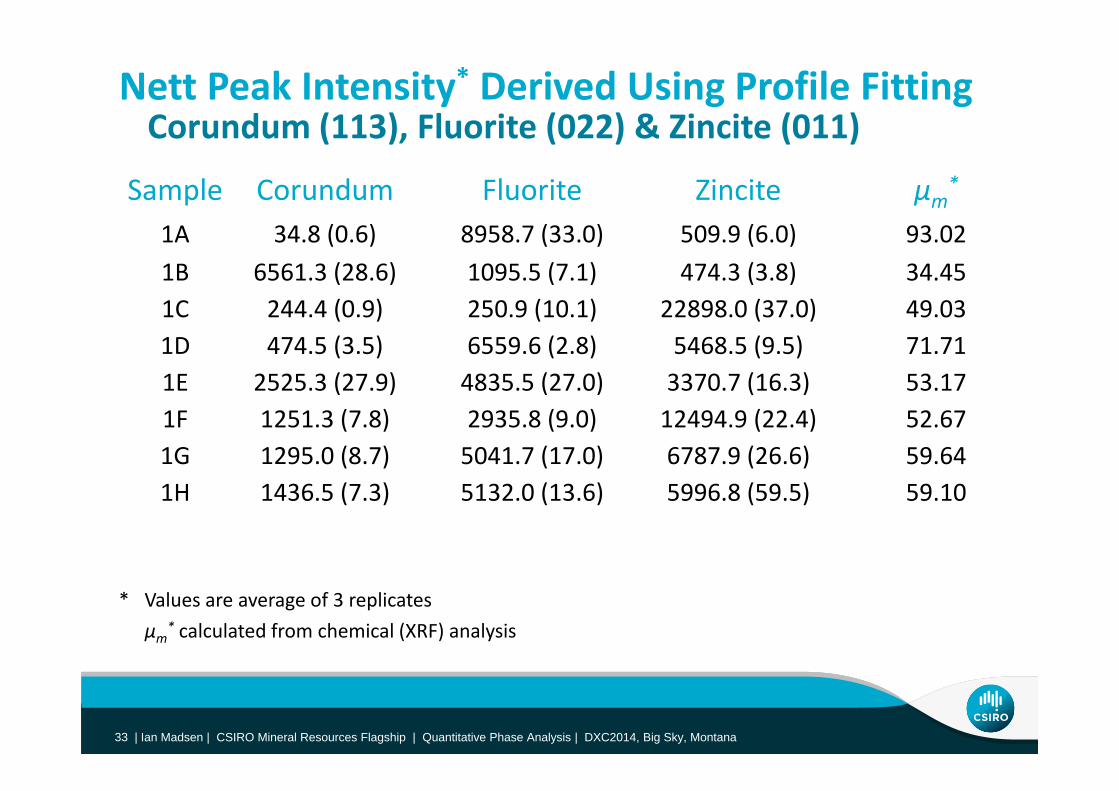
Nett Peak Intensity* Derived Using Profile Fitting Corundum (113) Fluorite (022) & Zincite (011)
Sample Corundum Fluorite Zincite μm*
Corundum (113), Fluorite (022) & Zincite (011)
1A 34.8 (0.6) 8958.7 (33.0) 509.9 (6.0) 93.021B 6561.3 (28.6) 1095.5 (7.1) 474.3 (3.8) 34.451C 244 4 (0 9) 250 9 (10 1) 22898 0 (37 0) 49 031C 244.4 (0.9) 250.9 (10.1) 22898.0 (37.0) 49.031D 474.5 (3.5) 6559.6 (2.8) 5468.5 (9.5) 71.711E 2525.3 (27.9) 4835.5 (27.0) 3370.7 (16.3) 53.171F 1251.3 (7.8) 2935.8 (9.0) 12494.9 (22.4) 52.671G 1295.0 (8.7) 5041.7 (17.0) 6787.9 (26.6) 59.641H 1436 5 (7 3) 5132 0 (13 6) 5996 8 (59 5) 59 101H 1436.5 (7.3) 5132.0 (13.6) 5996.8 (59.5) 59.10
* Values are average of 3 replicatesμm* calculated from chemical (XRF) analysis
Ian Madsen | TOPAS Training – Level 1 2013 |33 | Ian Madsen | TOPAS Training Course – Level 1 | 2013 |33 | Ian Madsen | CSIRO Mineral Resources Flagship | Quantitative Phase Analysis | DXC2014, Big Sky, Montana33 |
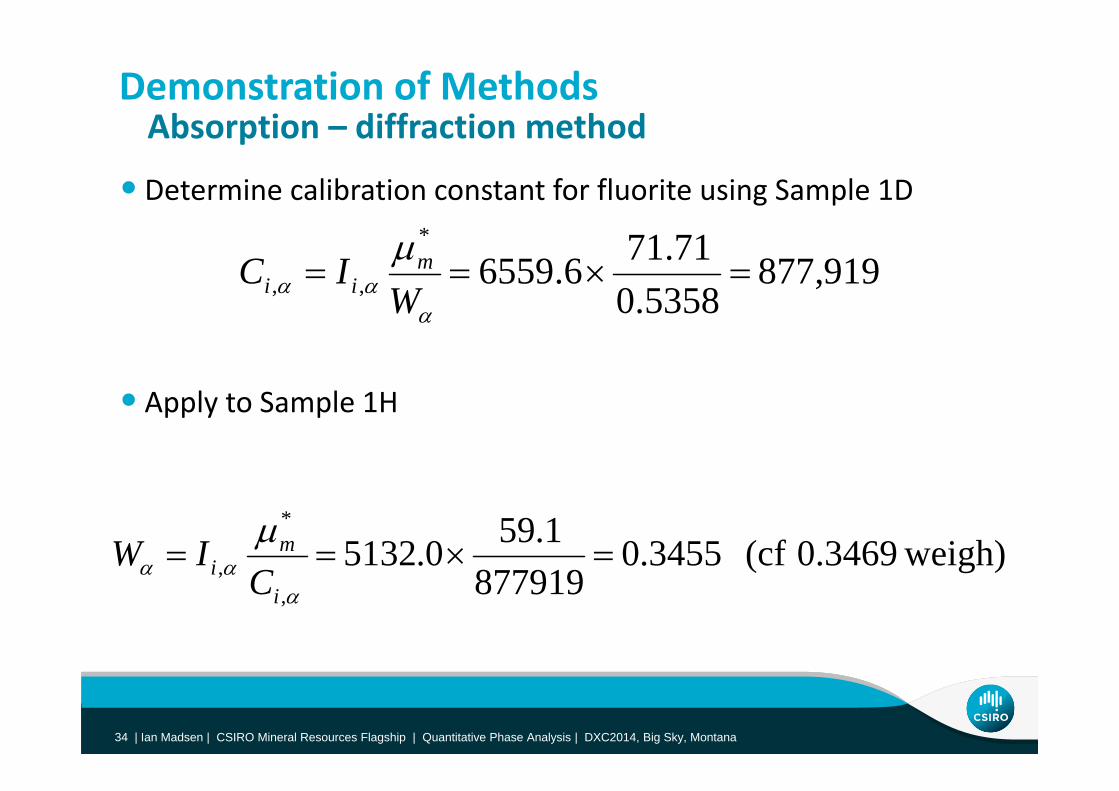
Demonstration of MethodsAbsorption – diffraction method
•Determine calibration constant for fluorite using Sample 1D
Absorption – diffraction method
919,87753580
71.716.6559*
,, W
IC mii
• A l t S l 1H
5358.0W
• Apply to Sample 1H
weigh)0.3469 (cf 3455.0877919
1.590.5132*
, m
i CIW
877919,,
iC
Ian Madsen | TOPAS Training – Level 1 2013 |34 | Ian Madsen | TOPAS Training Course – Level 1 | 2013 |34 | Ian Madsen | CSIRO Mineral Resources Flagship | Quantitative Phase Analysis | DXC2014, Big Sky, Montana34 |
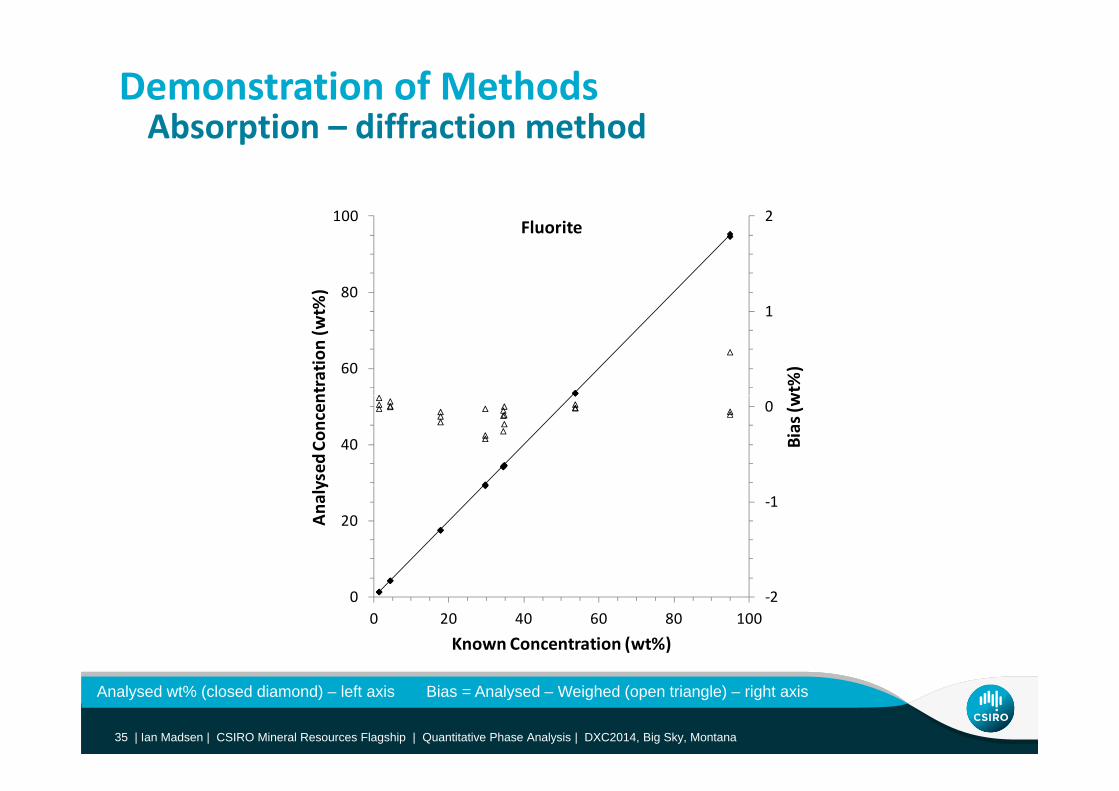
Demonstration of MethodsAbsorption – diffraction methodAbsorption – diffraction method
2100
1
2
80
100
%)
Fluorite
1
60
wt%
)
ntratio
n (w
t%
0
40 Bias (w
ysed
Con
cen
‐120An
aly
‐200 20 40 60 80 100
Known Concentration (wt%)
Ian Madsen | TOPAS Training – Level 1 2013 |35 | Ian Madsen | TOPAS Training Course – Level 1 | 2013 |35 | Ian Madsen | CSIRO Mineral Resources Flagship | Quantitative Phase Analysis | DXC2014, Big Sky, Montana35 |
Analysed wt% (closed diamond) – left axis Bias = Analysed – Weighed (open triangle) – right axis

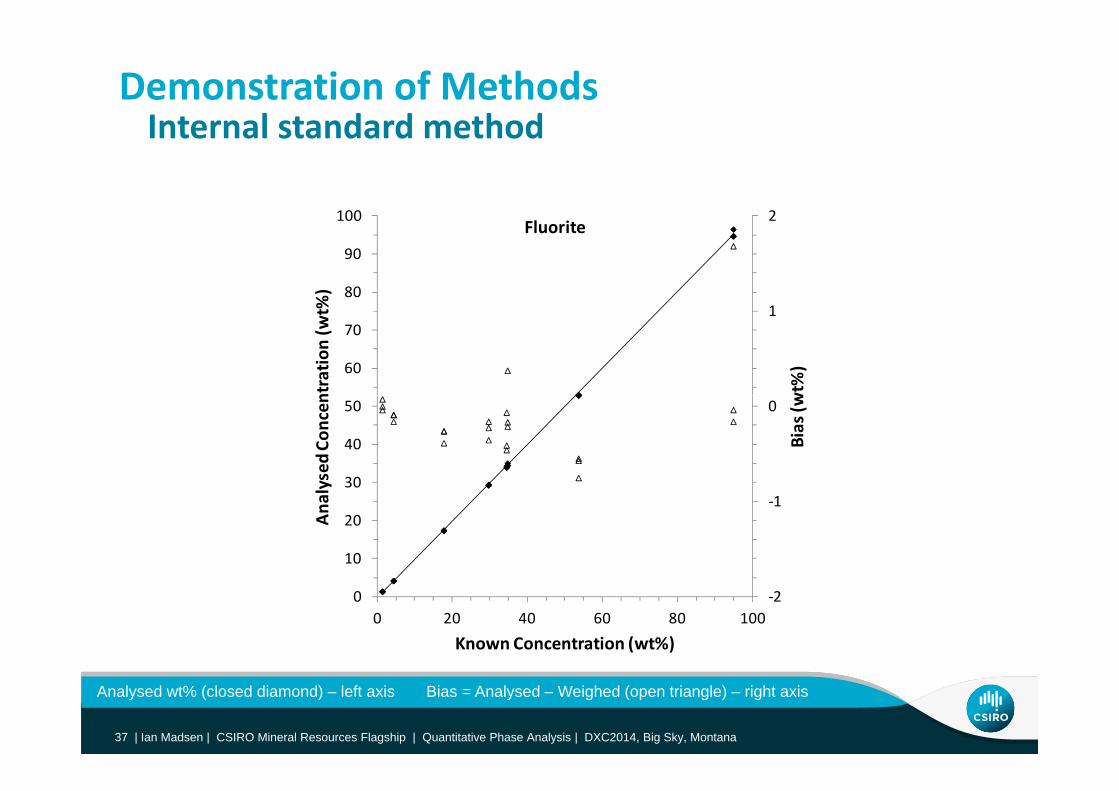
Demonstration of MethodsInternal standard method
•Determine calibration constant for fluorite using Sample 1H
Internal standard method
o Designate zincite as internal standard
3019005132fl i WI7448.0
3469.03019.0
8.59960.5132
ijs
fluorite
zincite
zincite
fluorite CWW
II
• Apply to Sample 1DApply to Sample 1D
i h d)0 5358( f529706.65593289.0fluoritezincite IWW weighed)0.5358(cf 5297.05.54687448.0
zincite
fluoriteijs
zincitefluorite IC
W
Ian Madsen | TOPAS Training – Level 1 2013 |36 | Ian Madsen | TOPAS Training Course – Level 1 | 2013 |36 | Ian Madsen | CSIRO Mineral Resources Flagship | Quantitative Phase Analysis | DXC2014, Big Sky, Montana36 |
Demonstration of MethodsInternal standard methodInternal standard method
2100
1
2
80
90
100
%)
Fluorite
1
60
70
wt%
)
ntratio
n (w
t%
0
30
40
50
Bias (w
ysed
Con
cen
‐1
10
20
30
Analy
‐200 20 40 60 80 100
Known Concentration (wt%)
Ian Madsen | TOPAS Training – Level 1 2013 |37 | Ian Madsen | TOPAS Training Course – Level 1 | 2013 |37 | Ian Madsen | CSIRO Mineral Resources Flagship | Quantitative Phase Analysis | DXC2014, Big Sky, Montana37 |
Analysed wt% (closed diamond) – left axis Bias = Analysed – Weighed (open triangle) – right axis
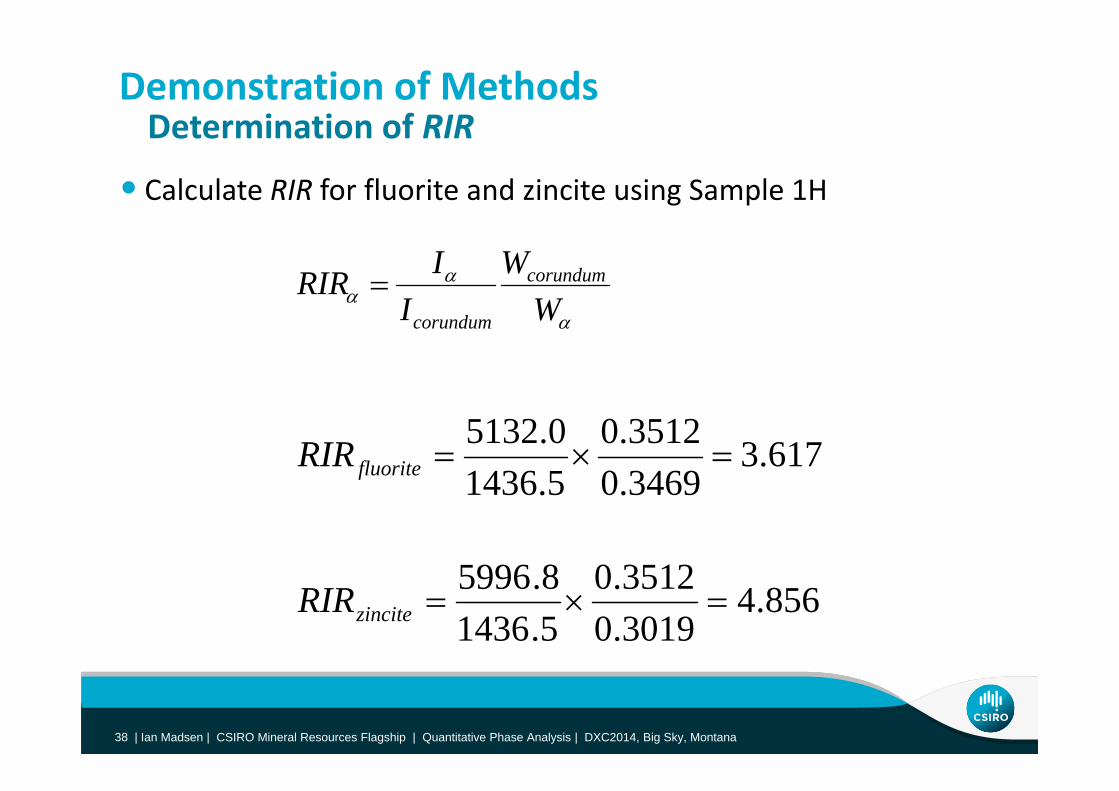
Demonstration of MethodsDetermination of RIR
• Calculate RIR for fluorite and zincite using Sample 1H
Determination of RIR
W
WI
IRIR corundumWIcorundum
617.3346903512.0
514360.5132
fluoriteRIR3469.05.1436
3512085996 856.43019.03512.0
5.14368.5996
zinciteRIR
Ian Madsen | TOPAS Training – Level 1 2013 |38 | Ian Madsen | TOPAS Training Course – Level 1 | 2013 |38 | Ian Madsen | CSIRO Mineral Resources Flagship | Quantitative Phase Analysis | DXC2014, Big Sky, Montana38 |
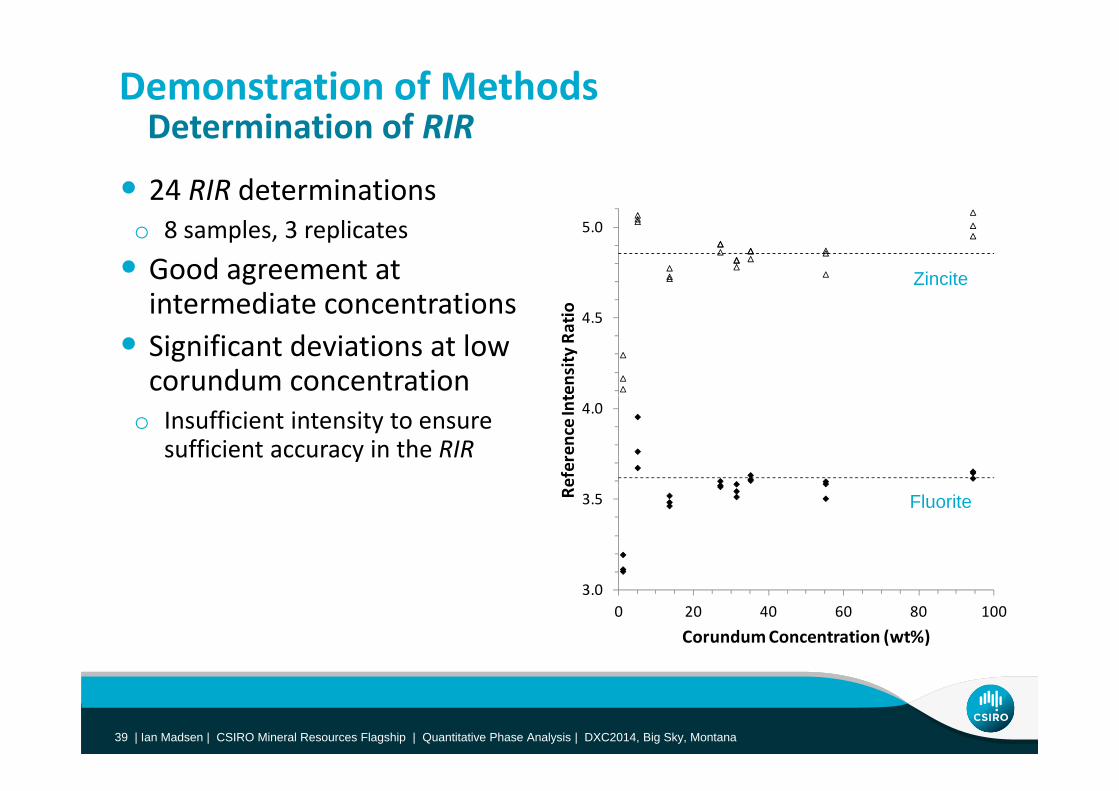
Demonstration of MethodsDetermination of RIR
• 24 RIR determinations
Determination of RIR
o 8 samples, 3 replicates• Good agreement at intermediate concentrations
5.0
o
Zinciteintermediate concentrations
• Significant deviations at low corundum concentration
4.5
tensity
Ratio
o Insufficient intensity to ensure sufficient accuracy in the RIR
4.0
eferen
ce Int
3.5Re Fluorite
3.00 20 40 60 80 100
Corundum Concentration (wt%)
Ian Madsen | TOPAS Training – Level 1 2013 |39 | Ian Madsen | TOPAS Training Course – Level 1 | 2013 |39 | Ian Madsen | CSIRO Mineral Resources Flagship | Quantitative Phase Analysis | DXC2014, Big Sky, Montana39 |
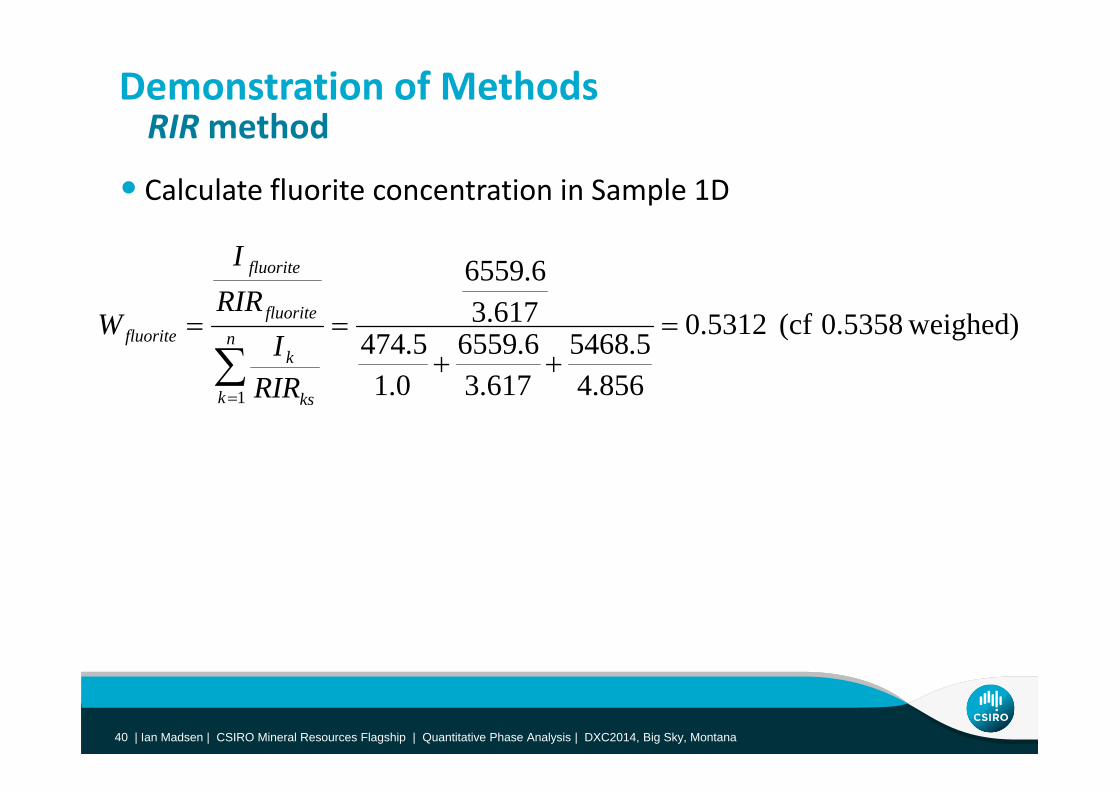
Demonstration of MethodsRIRmethod
• Calculate fluorite concentration in Sample 1D
RIRmethod
61736.6559fluorite
RIRI
weighed)0.5358 (cf 5312.0
856.45.5468
617.36.6559
0.15.474
617.3
1
n
k k
k
fluoritefluorite
RIRI
RIRW
1k ksRIR
Ian Madsen | TOPAS Training – Level 1 2013 |40 | Ian Madsen | TOPAS Training Course – Level 1 | 2013 |40 | Ian Madsen | CSIRO Mineral Resources Flagship | Quantitative Phase Analysis | DXC2014, Big Sky, Montana40 |

Demonstration of MethodsRIRmethodRIRmethod
2 000 2.0
80
90
100
%)
Fluorite
1.0
60
70
t%)
tration (w
t%
0.0
30
40
50
Bias (w
t
sed Co
ncen
t
‐1.0
10
20
30
Analys
‐2.000 20 40 60 80 100
Known Concentration (wt%)
Ian Madsen | TOPAS Training – Level 1 2013 |41 | Ian Madsen | TOPAS Training Course – Level 1 | 2013 |41 | Ian Madsen | CSIRO Mineral Resources Flagship | Quantitative Phase Analysis | DXC2014, Big Sky, Montana41 |
Analysed wt% (closed diamond) – left axis Bias = Analysed – Weighed (open triangle) – right axis

Whole Pattern MethodsPattern summationRietveld basedRietveld basedExternal standardInternal standardInternal standardMatrix flushing (Rietveld context)
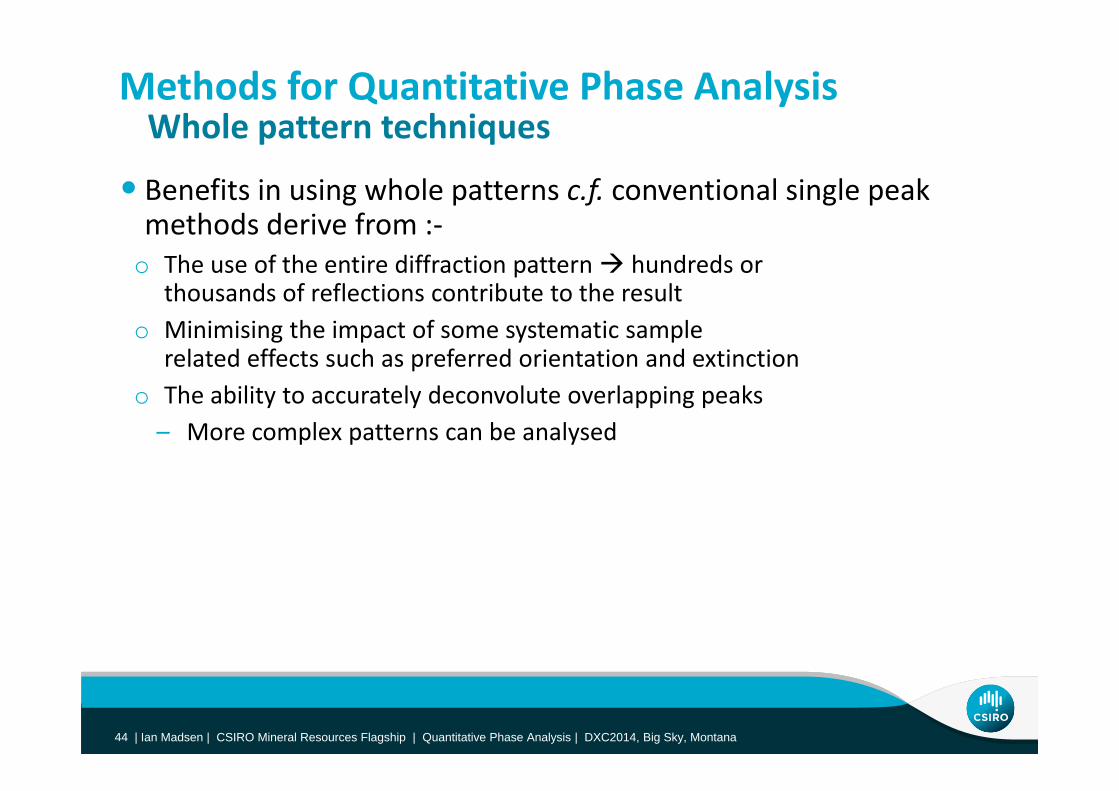
Methods for Quantitative Phase AnalysisWhole pattern techniques
• Benefits in using whole patterns c.f. conventional single peak th d d i f
Whole pattern techniques
methods derive from :‐o The use of the entire diffraction pattern hundreds or
thousands of reflections contribute to the resulto Minimising the impact of some systematic sample
related effects such as preferred orientation and extinctiono The ability to accurately deconvolute overlapping peakso The ability to accurately deconvolute overlapping peaks– More complex patterns can be analysed
Ian Madsen | TOPAS Training – Level 1 2013 |44 | Ian Madsen | TOPAS Training Course – Level 1 | 2013 |44 | Ian Madsen | CSIRO Mineral Resources Flagship | Quantitative Phase Analysis | DXC2014, Big Sky, Montana44 |

Methods for Quantitative Phase AnalysisFull pattern fitting techniques
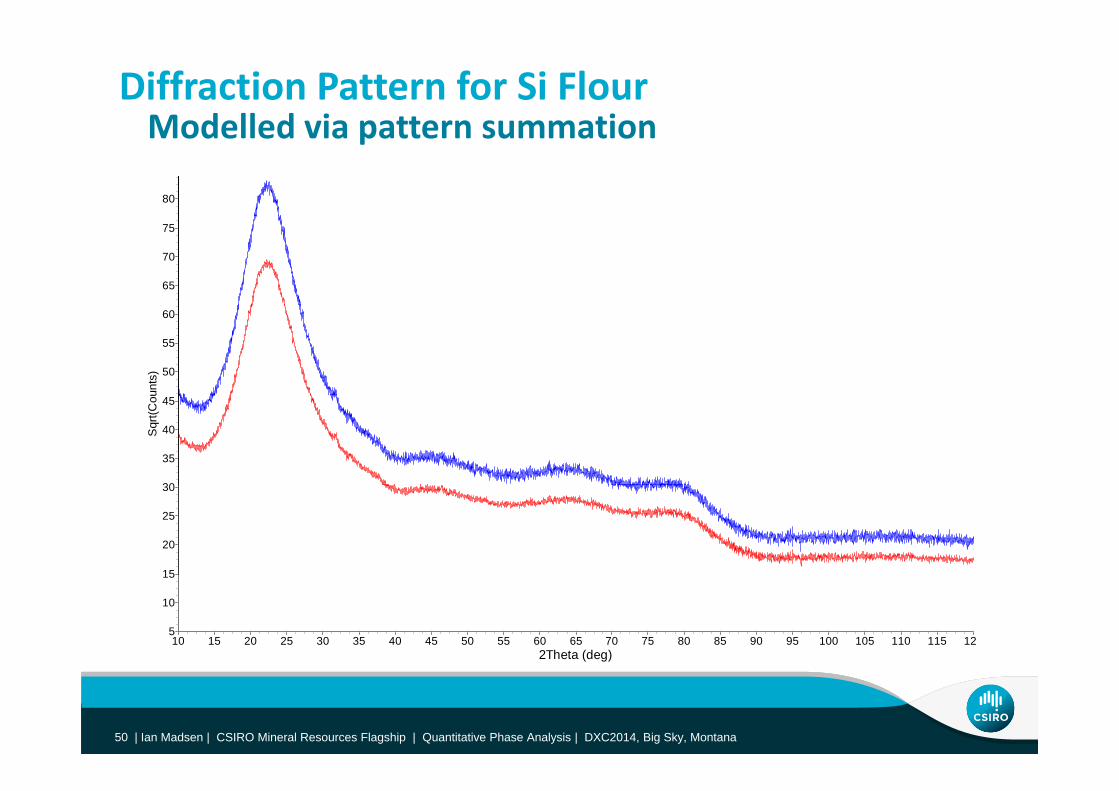
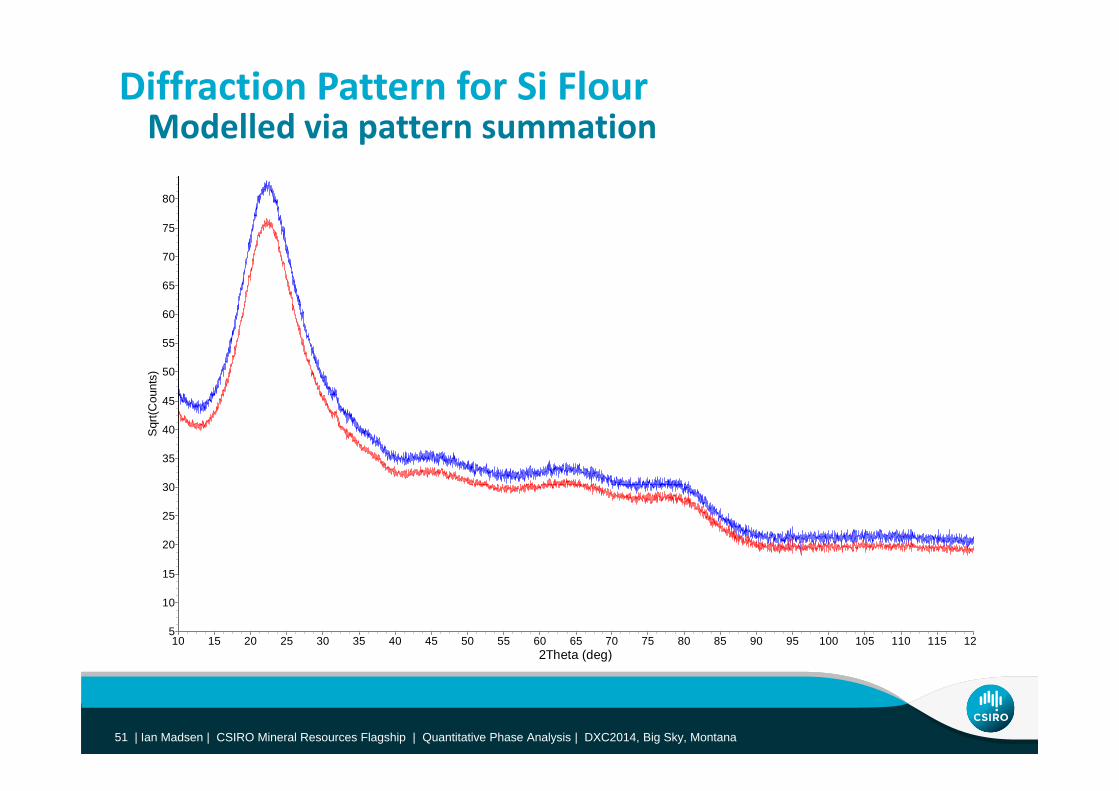
• Based on the principle that an observed diffraction pattern is the f th i di id l t
Full pattern fitting techniques
sum of the individual components• Full‐pattern fitting methods
o GMquant D K Smitho GMquant – D.K. Smitho FULLPAT – S. J. Chipera and D. L. Bisho RockJock – D.D. Eberlo ??? – M. Batchelder and G. Cressey•Wide‐range diffraction patterns of (pure) phases of interest are
l d d d d ith th b d diff ti d tscaled, summed and compared with the observed diffraction datao Use least squares fitting to obtain best fit
Ian Madsen | TOPAS Training – Level 1 2013 |45 | Ian Madsen | TOPAS Training Course – Level 1 | 2013 |45 | Ian Madsen | CSIRO Mineral Resources Flagship | Quantitative Phase Analysis | DXC2014, Big Sky, Montana45 |

Sample 1G ≈ Mix of Corundum, Fluorite, ZinciteZincite contributionZincite contribution165160155150150145140135130125120
unts
)
115110105100
959085
Sqr
t(Cou 85
807570656055504540353025
2Theta (deg)80757065605550454035302520
201510
50
Ian Madsen | TOPAS Training – Level 1 2013 |46 | Ian Madsen | TOPAS Training Course – Level 1 | 2013 |46 | Ian Madsen | CSIRO Mineral Resources Flagship | Quantitative Phase Analysis | DXC2014, Big Sky, Montana46 |
( g)
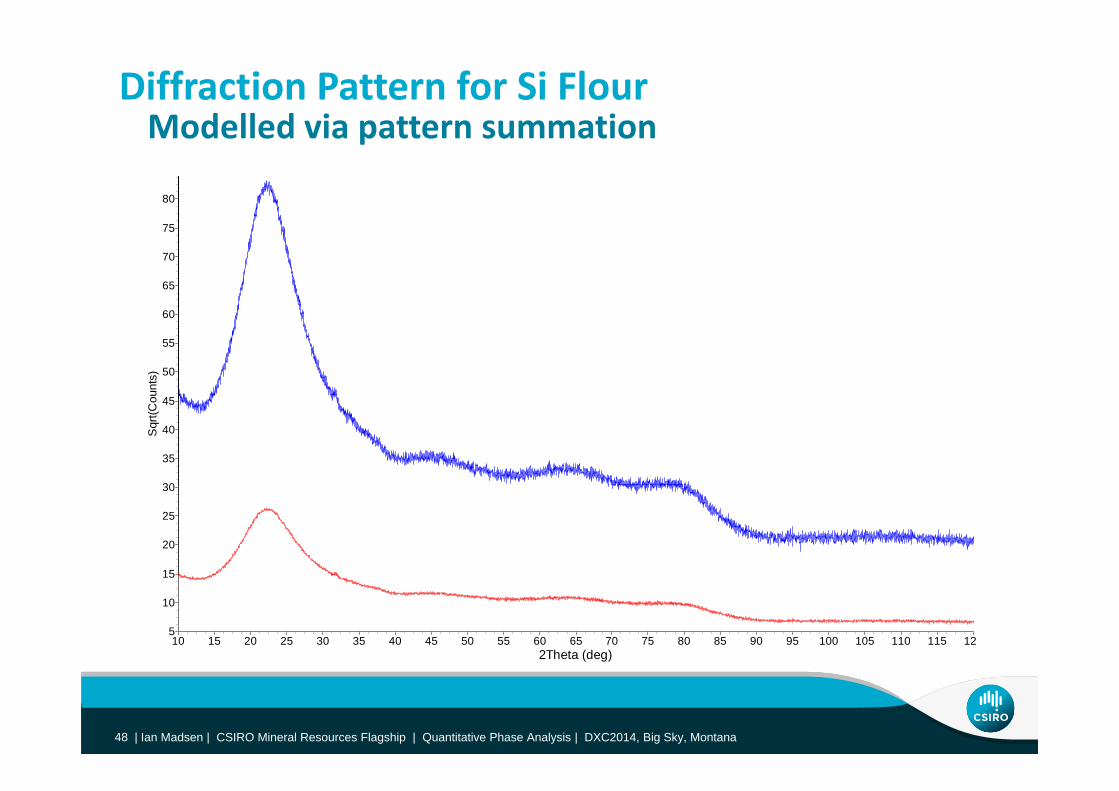
Diffraction Pattern for Si FlourModelled via pattern summationModelled via pattern summation
80
75
70
65
unts
)
60
55
50
Sqr
t(Cou 45
40
35
3030
25
20
15
2Theta (deg)12115110105100959085807570656055504540353025201510
15
10
5
Ian Madsen | TOPAS Training – Level 1 2013 |48 | Ian Madsen | TOPAS Training Course – Level 1 | 2013 |48 | Ian Madsen | CSIRO Mineral Resources Flagship | Quantitative Phase Analysis | DXC2014, Big Sky, Montana48 |

Diffraction Pattern for Si FlourModelled via pattern summationModelled via pattern summation
80
75
70
65
unts
)
60
55
50
Sqr
t(Cou 45
40
35
3030
25
20
15
2Theta (deg)12115110105100959085807570656055504540353025201510
15
10
5
Ian Madsen | TOPAS Training – Level 1 2013 |49 | Ian Madsen | TOPAS Training Course – Level 1 | 2013 |49 | Ian Madsen | CSIRO Mineral Resources Flagship | Quantitative Phase Analysis | DXC2014, Big Sky, Montana49 |
Diffraction Pattern for Si FlourModelled via pattern summationModelled via pattern summation
80
75
70
65
unts
)
60
55
50
Sqr
t(Cou 45
40
35
3030
25
20
15
2Theta (deg)12115110105100959085807570656055504540353025201510
15
10
5
Ian Madsen | TOPAS Training – Level 1 2013 |50 | Ian Madsen | TOPAS Training Course – Level 1 | 2013 |50 | Ian Madsen | CSIRO Mineral Resources Flagship | Quantitative Phase Analysis | DXC2014, Big Sky, Montana50 |
Diffraction Pattern for Si FlourModelled via pattern summationModelled via pattern summation
80
75
70
65
unts
)
60
55
50
Sqr
t(Cou 45
40
35
3030
25
20
15
2Theta (deg)12115110105100959085807570656055504540353025201510
15
10
5
Ian Madsen | TOPAS Training – Level 1 2013 |51 | Ian Madsen | TOPAS Training Course – Level 1 | 2013 |51 | Ian Madsen | CSIRO Mineral Resources Flagship | Quantitative Phase Analysis | DXC2014, Big Sky, Montana51 |

Diffraction Pattern for Si FlourModelled via pattern summationModelled via pattern summation
80
75
70
65
unts
)
60
55
50
Sqr
t(Cou 45
40
35
3030
25
20
15
2Theta (deg)12115110105100959085807570656055504540353025201510
15
10
5
Ian Madsen | TOPAS Training – Level 1 2013 |52 | Ian Madsen | TOPAS Training Course – Level 1 | 2013 |52 | Ian Madsen | CSIRO Mineral Resources Flagship | Quantitative Phase Analysis | DXC2014, Big Sky, Montana52 |
Methods for Quantitative Phase AnalysisFull pattern fitting techniques (cont’d)
• Relies on the generation of a library of standard patterns for each h t d i th l i
Full pattern fitting techniques (cont d)
phase expected in the analysis• Collect library patterns under the same instrumental conditions as those used in subsequent analysisthose used in subsequent analysis
• Selection of standards which match the phases in the unknown sample is a critically important step
o Composition may affect peak positionso Crystallite size / strain may affect peaks width & shape• Lib i f f• Library can consist of patterns of :‐
o Well‐ordered phaseso Less well ordered material such as glasses polymers clay mineralso Less well ordered material such as glasses, polymers, clay mineralso Calculated patterns
Ian Madsen | TOPAS Training – Level 1 2013 |53 | Ian Madsen | TOPAS Training Course – Level 1 | 2013 |53 | Ian Madsen | CSIRO Mineral Resources Flagship | Quantitative Phase Analysis | DXC2014, Big Sky, Montana53 |

Methods for Quantitative Phase AnalysisFull pattern fitting techniques (cont’d)
•Weight fractions obtained using refined scale factors in :‐
Full pattern fitting techniques (cont d)
o Absorption‐diffraction method where sample MAC is calculated from analysis of chemical composition
o Internal standard method where scale factors are normalised to an internal standard, typically corundum, using a RIR approach
Ian Madsen | TOPAS Training – Level 1 2013 |54 | Ian Madsen | TOPAS Training Course – Level 1 | 2013 |54 | Ian Madsen | CSIRO Mineral Resources Flagship | Quantitative Phase Analysis | DXC2014, Big Sky, Montana54 |
Chipera & Bish, 2002, Chipera & Bish, 2013
Relationship Between Rietveld Scale Factor and Phase Concentration
1WK *2
1
m
WVKS
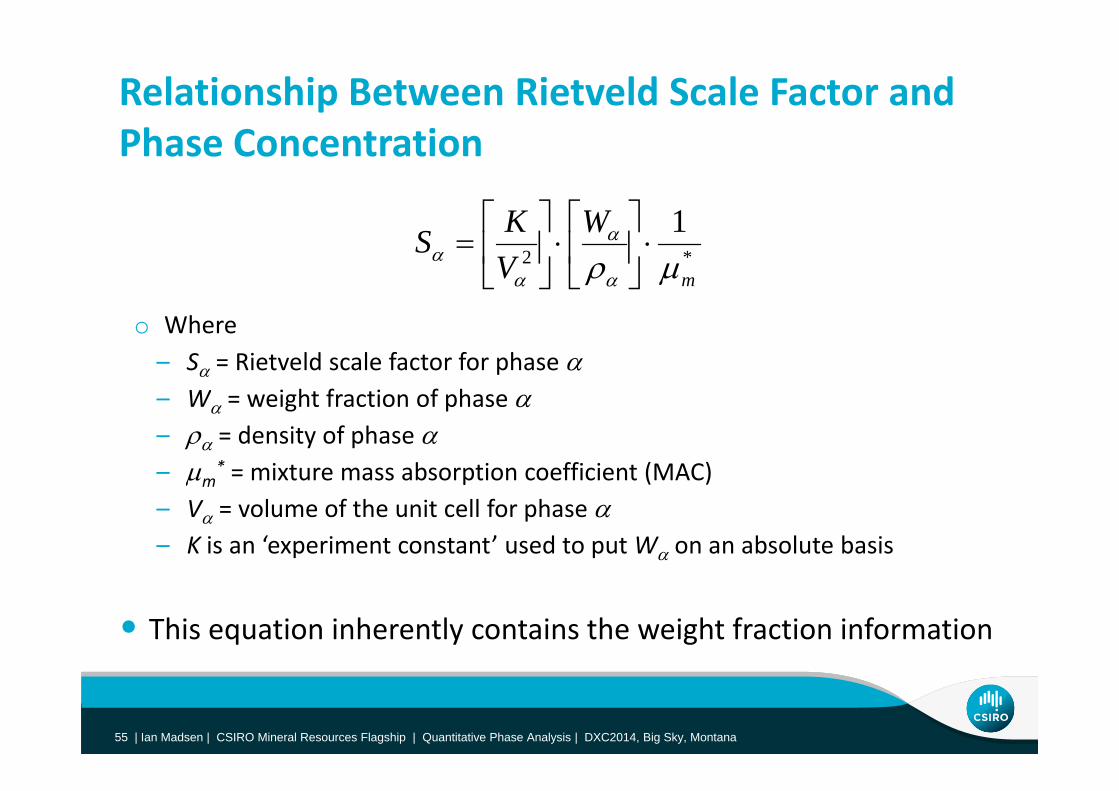
o Where– S = Rietveld scale factor for phase
W weight fraction of phase – W = weight fraction of phase – = density of phase – m
* = mixture mass absorption coefficient (MAC)m
– V = volume of the unit cell for phase – K is an ‘experiment constant’ used to put W on an absolute basis
• This equation inherently contains the weight fraction information
Ian Madsen | TOPAS Training – Level 1 2013 |55 | Ian Madsen | TOPAS Training Course – Level 1 | 2013 |55 | Ian Madsen | CSIRO Mineral Resources Flagship | Quantitative Phase Analysis | DXC2014, Big Sky, Montana55 |
Rietveld Based Techniques for QPAExtracting phase abundances
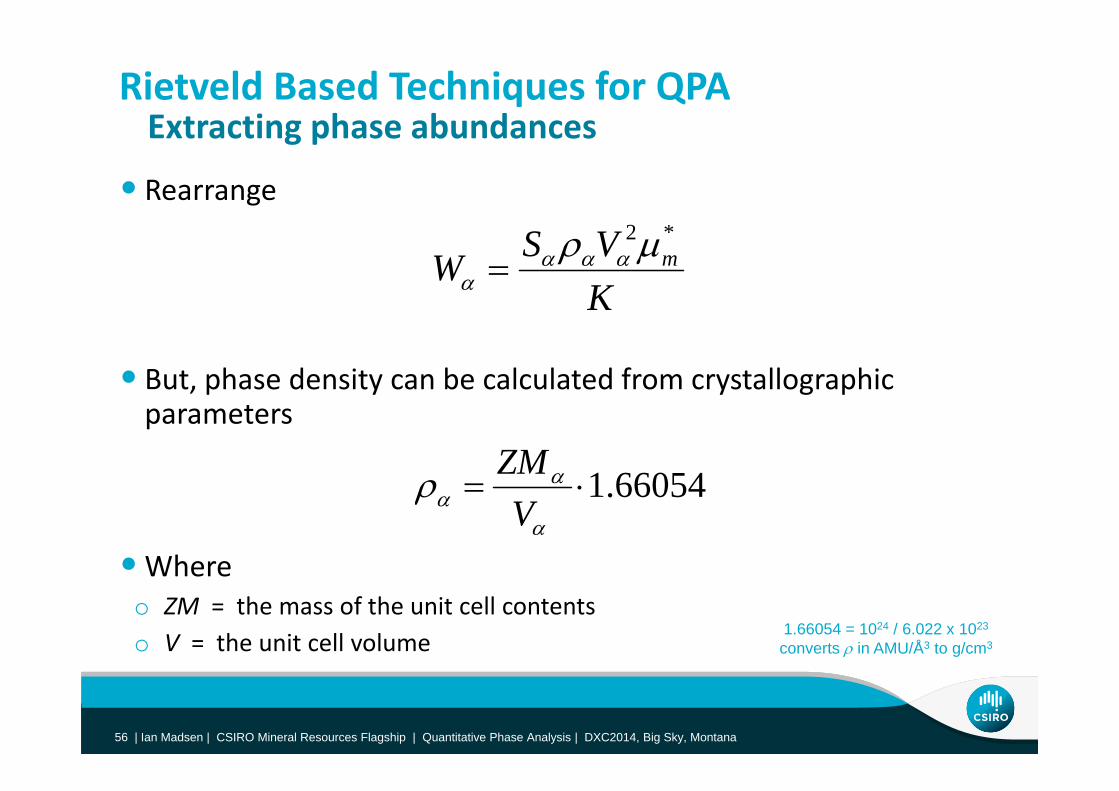
• Rearrange
Extracting phase abundances
KVSW m
*2
• But, phase density can be calculated from crystallographic
K
parameters
1 66054 ZM
•Where
1.66054
VWhere
o ZM = the mass of the unit cell contentso V = the unit cell volume
1.66054 = 1024 / 6.022 x 10²³
converts in AMU/Å3 to g/cm3
Ian Madsen | TOPAS Training – Level 1 2013 |56 | Ian Madsen | TOPAS Training Course – Level 1 | 2013 |56 | Ian Madsen | CSIRO Mineral Resources Flagship | Quantitative Phase Analysis | DXC2014, Big Sky, Montana56 |

Substitute for Density
K
ZMVSW m*
• K is an ‘experiment constant’ for the instrumental setup 1,2
K
p po Used to put W on an absolute basiso Dependant only on instrumental and data collection conditions
I d d f i di id l h d ll l l do Independent of individual phase and overall sample‐related parameterso A single measurement is (usually) sufficient to determine K
• ZMV becomes a dynamic ‘phase constant’ for phase • ZMV becomes a dynamic phase constant for phase o It is updated as the structure is refinedo Can be determined from published/refined crystal structure parametersp / y p
• Referred to hereafter as the External Standard Method
Ian Madsen | TOPAS Training – Level 1 2013 |57 | Ian Madsen | TOPAS Training Course – Level 1 | 2013 |57 | Ian Madsen | CSIRO Mineral Resources Flagship | Quantitative Phase Analysis | DXC2014, Big Sky, Montana57 |
1 O‘Connor & Raven (1988) Powder Diffraction, 3(1), 2-6. – Rec‘d 31/03/1987 2 Bish & Howard (1988) J.Applied Crystallogr., 21, 86-91. – Rec‘d 30/03/1987

Rietveld Based Techniques for QPAIssues in the application of the external standard method
•Need to measure K and ensure that instrumental conditions do t h b t t f K d d t ll ti f
Issues in the application of the external standard method
not change between measurement of K and data collection from samples
• Need to measure or calculate μ *Need to measure or calculate μmo Difficult to measure directlyo Need total chemistry or QPA for calculation• Can eliminate the need to know K and μm* by:‐
o Adding a known amount Ws of a well characterised standard S to the sample
ZMVSW mss*
K
Ws
Ian Madsen | TOPAS Training – Level 1 2013 |58 | Ian Madsen | TOPAS Training Course – Level 1 | 2013 |58 | Ian Madsen | CSIRO Mineral Resources Flagship | Quantitative Phase Analysis | DXC2014, Big Sky, Montana58 |

Eliminating K and μm*
• Divide equation for phase by equation for standard S,
*
*m
ZMVSK
KZMVS
WW
msss ZMVSKW
• Rearrange , eliminate K, µm*
s ZMVSZMVSWW
• Effect of sample MAC & experiment conditions are eliminated
ss ZMVS
p p• Referred to hereafter as the Internal Standard Method
Ian Madsen | TOPAS Training – Level 1 2013 |59 | Ian Madsen | TOPAS Training Course – Level 1 | 2013 |59 | Ian Madsen | CSIRO Mineral Resources Flagship | Quantitative Phase Analysis | DXC2014, Big Sky, Montana59 |
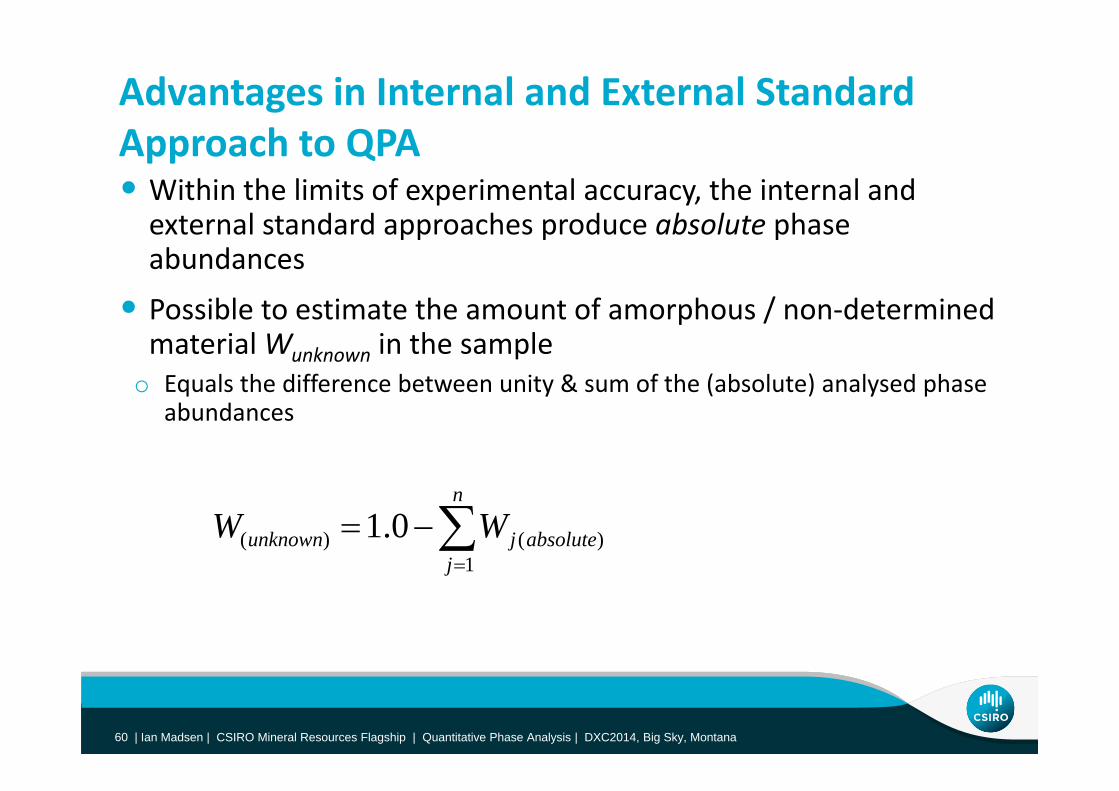
Advantages in Internal and External Standard Approach to QPA• Within the limits of experimental accuracy, the internal and
t l t d d h d b l t hexternal standard approaches produce absolute phase abundances
• Possible to estimate the amount of amorphous / non determined• Possible to estimate the amount of amorphous / non‐determined material Wunknown in the sample
o Equals the difference between unity & sum of the (absolute) analysed phase q y ( ) y pabundances
n
jabsolutejunknown WW
1)()( 0.1
j
Ian Madsen | TOPAS Training – Level 1 2013 |60 | Ian Madsen | TOPAS Training Course – Level 1 | 2013 |60 | Ian Madsen | CSIRO Mineral Resources Flagship | Quantitative Phase Analysis | DXC2014, Big Sky, Montana60 |
Matrix Flushing Method (MFM) 1, 2Rietveld Context (ZMVmethod)
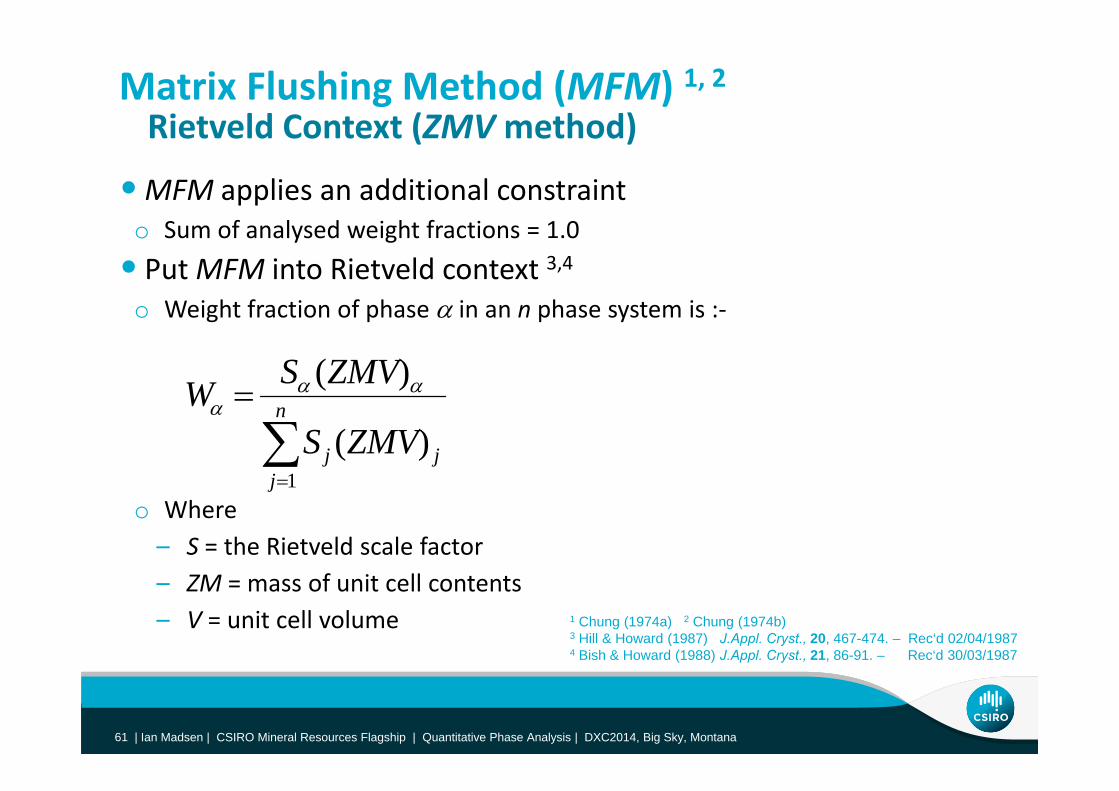
•MFM applies an additional constraint
Rietveld Context (ZMVmethod)
o Sum of analysed weight fractions = 1.0• Put MFM into Rietveld context 3,4
o Weight fraction of phase in an n phase system is :o Weight fraction of phase in an n phase system is :‐
)(
ZMVSW
1)(
n
jjj ZMVS
W
o Where– S = the Rietveld scale factor
ZM f i ll
1j
– ZM = mass of unit cell contents– V = unit cell volume 1 Chung (1974a) 2 Chung (1974b)
3 Hill & Howard (1987) J.Appl. Cryst., 20, 467-474. – Rec‘d 02/04/19874 Bish & Howard (1988) J.Appl. Cryst., 21, 86-91. – Rec‘d 30/03/1987
Ian Madsen | TOPAS Training – Level 1 2013 |61 | Ian Madsen | TOPAS Training Course – Level 1 | 2013 |61 | Ian Madsen | CSIRO Mineral Resources Flagship | Quantitative Phase Analysis | DXC2014, Big Sky, Montana61 |

Matrix Flushing Method (MFM) 1, 2Rietveld Context (cont’d)
• This approach is the most widely used for Rietveld based QPA
Rietveld Context (cont d)
o Almost universally coded into Rietveld analysis programso This is probably the default QPA reported• BUT only produces relative phase abundances• BUT, only produces relative phase abundances.
o If the sample contains amorphous phases and/or unidentified crystalline phases analysed weight fractions will be overestimated
• If absolute abundances are required ..o Reaction kinetics via in situ studies
M t f h t to Measurement of amorphous contentetc... etc...
... then this method is not suitable !
Ian Madsen | TOPAS Training – Level 1 2013 |62 | Ian Madsen | TOPAS Training Course – Level 1 | 2013 |62 | Ian Madsen | CSIRO Mineral Resources Flagship | Quantitative Phase Analysis | DXC2014, Big Sky, Montana62 |

Application of QPA MethodologyHow to select which QPA method to use
How to Select Which QPA Method to Use
• Experiment at the Australian Synchrotron by Webster et al. 1o Study of nucleation & crystal growth of gibbsite Al(OH)3– Context – Bayer process (extraction of Al from bauxite ores)
• S th ti B li (Al l d d ti l ti )• Synthetic Bayer liquors (Al‐loaded caustic solutions) o Seeded with various Fe‐oxides – in this example, goethite (‐FeOOH)– Use S‐XRD to follow mechanism & kinetics of phase formationUse S XRD to follow mechanism & kinetics of phase formation
Ian Madsen | TOPAS Training – Level 1 2013 |64 | Ian Madsen | TOPAS Training Course – Level 1 | 2013 |64 | Ian Madsen | CSIRO Mineral Resources Flagship | Quantitative Phase Analysis | DXC2014, Big Sky, Montana64 |
1 Webster, N.A.S. et al, J. Appl. Cryst., 43: 466-472.

Experimental Configuration for Seeding Studies
• Sample environment1 l ill
Pressure line to 900psi
Quartz glass capillary (reaction vessel)o 1 mm quartz glass capillary
o Heated to 60 – 75°C using hot air blower
(reaction vessel)
o Slight pressure to prevent evaporation of fluid
• Simultaneous data collectiono Mythen multistrip detector, Australian
Synchrotrono 2 minutes per data set for ~3 hours• Rietveld based data analysis
o Three different QPA methods used to extract phase abundance at each
Thermocouple
extract phase abundance at each stage of the reaction Heater
(to 450°C)
Ian Madsen | TOPAS Training – Level 1 2013 |65 | Ian Madsen | TOPAS Training Course – Level 1 | 2013 |65 | Ian Madsen | CSIRO Mineral Resources Flagship | Quantitative Phase Analysis | DXC2014, Big Sky, Montana65 |
Method #1QPA derived using ZMV (Hill & Howard) algorithm
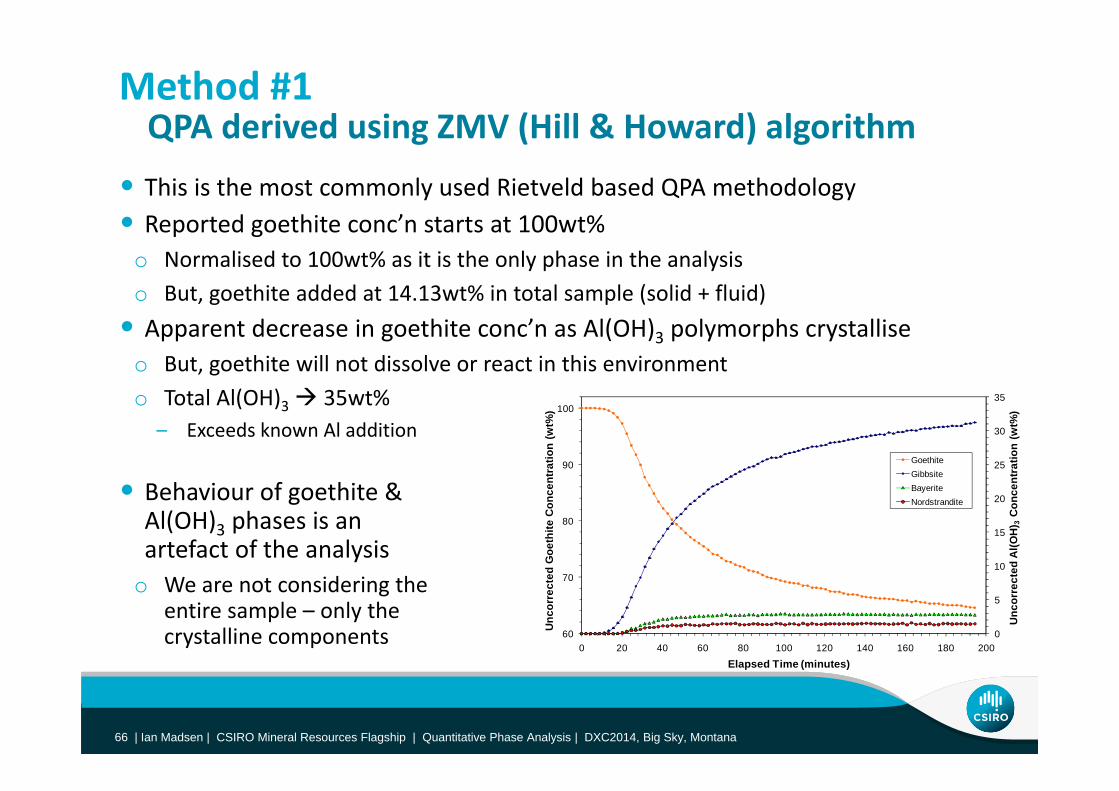
• This is the most commonly used Rietveld based QPA methodologyR d hi ’ 100 %
QPA derived using ZMV (Hill & Howard) algorithm
• Reported goethite conc’n starts at 100wt%o Normalised to 100wt% as it is the only phase in the analysiso But, goethite added at 14.13wt% in total sample (solid + fluid)• Apparent decrease in goethite conc’n as Al(OH)3 polymorphs crystallise
o But, goethite will not dissolve or react in this environmento Total Al(OH) 35wt% 35o Total Al(OH)3 35wt%
– Exceeds known Al addition
• B h i f thit &25
30
35
90
100
entr
atio
n (w
t%)
entr
atio
n (w
t%)
Goethite Gibbsite B it• Behaviour of goethite &
Al(OH)3 phases is an artefact of the analysis
10
15
20
70
80
ted
Al(O
H) 3
Con
ce
ed G
oeth
ite C
once Bayerite
Nordstrandite
o We are not considering the entire sample – only thecrystalline components 0
5
60
70
0 20 40 60 80 100 120 140 160 180 200
Unc
orre
ct
Unc
orre
cte
Elapsed Time (minutes)
Ian Madsen | TOPAS Training – Level 1 2013 |66 | Ian Madsen | TOPAS Training Course – Level 1 | 2013 |66 | Ian Madsen | CSIRO Mineral Resources Flagship | Quantitative Phase Analysis | DXC2014, Big Sky, Montana66 |
Elapsed Time (minutes)

Method #2QPA derived using internal standard method
• Goethite seed added in known amount – 14.13wt%A h i d h d i i
QPA derived using internal standard method
o Assume that it does not change during experimento Correct concentrations of other phases using internal standard equation
• Al(OH)3 phase conc’n now ~7.5wt% = ~ ½ of the known Al additiono In agreement with performance from independent estimates
814 2
• Must consider the entire sample (solid & liquid)
5
6
7
8
14.0
14.1
14.2
ratio
n (w
t%)
ratio
n (w
t%)
• Now have ability to derivereaction kinetics from
2
3
4
5
13.8
13.9
Al(O
H) 3
Con
cent
r
Goe
thite
Con
cent
Goethite Gibbsite
absolute QPA0
1
2
13.6
13.7
0 20 40 60 80 100 120 140 160 180 200
Cor
rect
ed
Spik
ed G
Elapsed Time (minutes)
Bayerite Nordstrandite
Ian Madsen | TOPAS Training – Level 1 2013 |67 | Ian Madsen | TOPAS Training Course – Level 1 | 2013 |67 | Ian Madsen | CSIRO Mineral Resources Flagship | Quantitative Phase Analysis | DXC2014, Big Sky, Montana67 |
Elapsed Time (minutes)
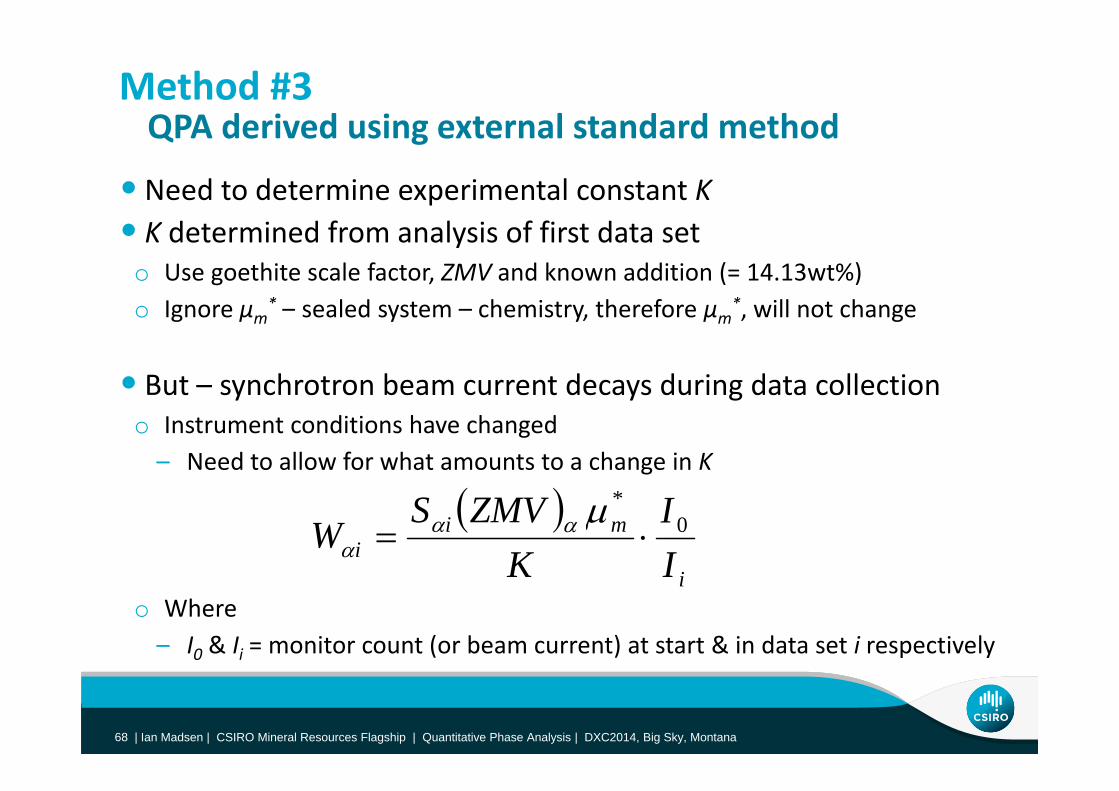
Method #3QPA derived using external standard method
•Need to determine experimental constant K
QPA derived using external standard method
• K determined from analysis of first data seto Use goethite scale factor, ZMV and known addition (= 14.13wt%)o Ignore μ * sealed system chemistry therefore μ * will not changeo Ignore μm – sealed system – chemistry, therefore μm , will not change
• But – synchrotron beam current decays during data collectiony y go Instrument conditions have changed– Need to allow for what amounts to a change in K
i
mii I
IK
ZMVSW 0
*
o Where– I0 & Ii = monitor count (or beam current) at start & in data set i respectively
iIK
Ian Madsen | TOPAS Training – Level 1 2013 |68 | Ian Madsen | TOPAS Training Course – Level 1 | 2013 |68 | Ian Madsen | CSIRO Mineral Resources Flagship | Quantitative Phase Analysis | DXC2014, Big Sky, Montana68 |

Method #3QPA derived using external standard method (cont’d)
• Absolute phase abundances derived
QPA derived using external standard method (cont d)
• Al(OH)3 conc’n ~same as internal standard estimates• Now observe a slight decrease in goethite QPA (<1% relative)
h ld b h ?o What could be the cause ?
814 2
5
6
7
8
14.0
14.1
14.2
atio
n (w
t%)
ratio
n (w
t%)
2
3
4
5
13.8
13.9
Al(O
H) 3
Con
cent
ra
Goe
thite
Con
cent
rGoethite
Gibbsite
0
1
2
13.6
13.7
0 20 40 60 80 100 120 140 160 180 200
Cor
rect
ed
Cor
rect
ed G
Elapsed Time (minutes)
Bayerite
Nordstrandite
Ian Madsen | TOPAS Training – Level 1 2013 |69 | Ian Madsen | TOPAS Training Course – Level 1 | 2013 |69 | Ian Madsen | CSIRO Mineral Resources Flagship | Quantitative Phase Analysis | DXC2014, Big Sky, Montana69 |
Elapsed Time (minutes)
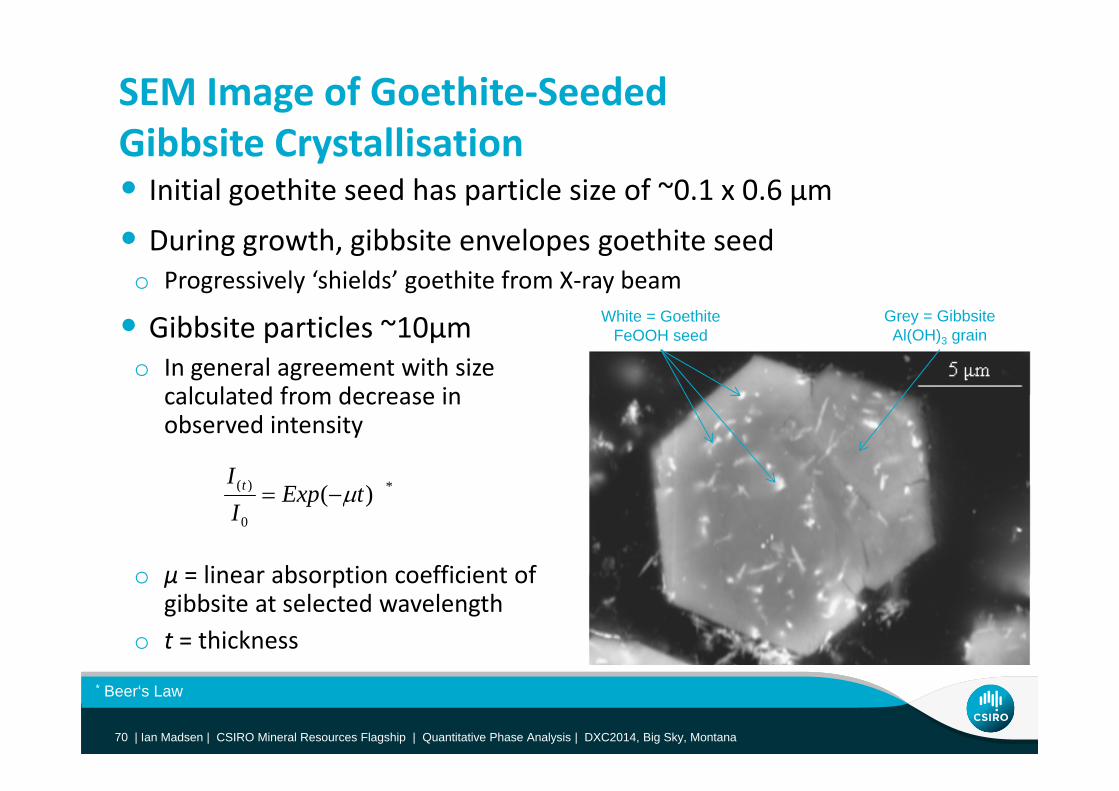
SEM Image of Goethite‐Seeded Gibbsite Crystallisation• Initial goethite seed has particle size of ~0.1 x 0.6 µm
• During growth, gibbsite envelopes goethite seedo Progressively ‘shields’ goethite from X‐ray beam
White = Goethite FeOOH seed
Grey = Gibbsite Al(OH)3 grain• Gibbsite particles ~10µm
o In general agreement with size calculated from decrease incalculated from decrease in observed intensity
*)( )(I t
o µ = linear absorption coefficient of
*
0
)( )( tExpI
t
o µ = linear absorption coefficient of gibbsite at selected wavelength
o t = thickness
Ian Madsen | TOPAS Training – Level 1 2013 |70 | Ian Madsen | TOPAS Training Course – Level 1 | 2013 |70 | Ian Madsen | CSIRO Mineral Resources Flagship | Quantitative Phase Analysis | DXC2014, Big Sky, Montana70 |
* Beer‘s Law

Ian MadsenIan Madsen Diffraction Science Team LeaderCSIRO Mineral Resources FlagshipBox 312 Clayton South 3169Victoria, Australia
t +61 3 9545 8785 e [email protected] www.csiro.au/cpse