quantitative evaluation of the pattern flow in right...
TRANSCRIPT

Quantitative Evaluation of the Pattern of Shunt Flow
in the Right Ventricle and Pulmonary Artery of Dogs
with Experimental Ventricular Septal Defect
MASATSUGUNAKAI, TETSUOTOMINO, YOICHI GOTO, JIN YAMAMOTO,YUKIO MATSUI, TATSUOTOGAWA,and KOICHI OGINO, Divisions ofCardiovascular Dynamics and Cardiovascular Surgery, NationalCardiovascular Center, Suita, Osaka 565, Japan; Department of Medicine,Saga Medical University, Saga, Saga 840-01, Japan; Institute for Medical andDental Engineering, Tokyo Medical and Dental University, Chiyodaku,Tokyo 101, Japan
A B S T R A C T Cineangiographic studies in patientswith ventricular septal defect (VSD) have occasionallydemonstrated that part of the blood across the defectis ejected immediately into the pulmonary artery (PA)passing through the outflow tract of the right ventricle(RV), but without being trapped in it. Weattemptedto make a quantitative evaluation of the flow of a par-tial shunt pathway (a direct VSD-PA pathway) thatdrains that part of the blood from the defect. Ourmethod depended on a thermal dilution technique toobtain the ejection fraction of the RV and to observea simultaneous pair of dilution curves at the roots ofthe aorta and PA after introduction of tracer into theleft atrium. An analytical process was specially de-signed by incorporating a stable one-pass deconvolu-tion technique. The method was applied to eight anes-thetized dogs with acutely produced experimentalVSD on the entrance of the outflow tract of the RV.The flow through the direct VSD-PA pathway was, inmost cases, >50 and up to 85% (mean of the eight,57±5% SE) of the total left-to-right shunt flow. Thiswould imply that <50%, and down to as little as 15%,of the total amount of shunt flow contributed to extrawork of the RV in these cases. In addition, the impacton the pulmonary vasculature due to such a largeamount of pulsatile flow through the direct VSD-PApathway may accelerate the development of hyper-trophy of the pulmonary vessel wall.
Received for publication 30 August 1982 and in revisedform 26 May 1983.
INTRODUCTION
In view of its pathophysiological importance, clinicalinvestigators have studied the pattern of left-to-rightshunt flow in patients with ventricular septal defect(VSD).' Levin et al. (1) first demonstrated in their cine-angiographic study that part of the blood across thedefect surges into the root of the pulmonary artery(PA) via the outflow tract of the right ventricle (RV)without being trapped in the RV. The remaining partof the blood across the VSD is directed toward thebody of the RV, is trapped there, and eventually flowsout of the RV into the PA during subsequent ventric-ular contractions. The partial shunt tract that drainsblood across the VSD in the former manner is referredto in the text as a direct VSD-PA pathway, and in thelatter manner, as a VSD-RV-PA pathway.
A method has yet to be established for the quanti-tative determination of partial shunt flows throughthese two pathways. The conventional oxygen satu-ration technique for such quantitative evaluationwould require blood sampling from the RV, PA, andartery. The technique may thus not be entirely suit-able, owing to poor mixing of the tracer, i.e., oxygen,with the blood in the RV. Wedesigned an analyticalprocess for this purpose by using a pair of thermaldilution curves sampled at the roots of the aorta andof the PA. In these vessels, the tracer may mix better
'Abbreviations used in this paper: LA, left atrium; LV,left ventricle; PA, pulmonary artery; RV, right ventricle;VSD, ventricular septal defect.
J. Clin. Invest. The American Society for Clinical Investigation, Inc. * 0021-9738/83/09/0779/10 $1.00
Volume 72 September 1983 779-788
779
with the blood than in the RV. The principle of theprocess is analogous to that previously reported (2). Inrelation to the present study, we also discuss two well-known pathophysiological manifestations of the pe-culiar pattern of shunt flow in patients with VSD, i.e.,the lesser degree of enlargement of the RV than of theleft ventricle, and the progressive increase in flow re-sistance of the pulmonary circulation (3).
METHODS
Theoretical approachWeconstructed our whole theory using a block flow model.
During each heart cycle, blood and tracer were instanta-neously transported toward the cardiovascular compart-ments, e.g., the cardiac ventricles and roots of the PA andaorta, and mixed there immediately. The tracer was assumedto be inert and nondiffusible, so that it was transported td-ward the PA and aorta from the site of tracer injection,without being lost outside the cardiovascular space. Wefur-ther assumed that right-to-left shunt did not coexist, for thetracer returned to the left ventricle (LV) from the RV acrossthe defect does not mix perfectly in the LV before beingejected into the aorta, RV, or PA (1).
Model for the left-to-right shunt pathway. Wequanti-tatively described the flow pattern of the left-to-right shuntpathway by using a transport function (transfer or frequencyfunction, transit time distribution, probability density func-tion of transit time). The following discretized form of thefunction h can be introduced when it is considered to be aresponse at the root of the PA to a bolus placed at the orificeof the VSD during the heart cycle immediately before thefirst one:
[hi (i= 1),
1( - ) -h2 )Eh (1)
where i represents the serial number of the heart cycle; ht,a value of h over the ith heart cycle; At, the time intervalof a single heart cycle considered to be identical for all heartcycles; and EF, the ejection fraction of the RV.
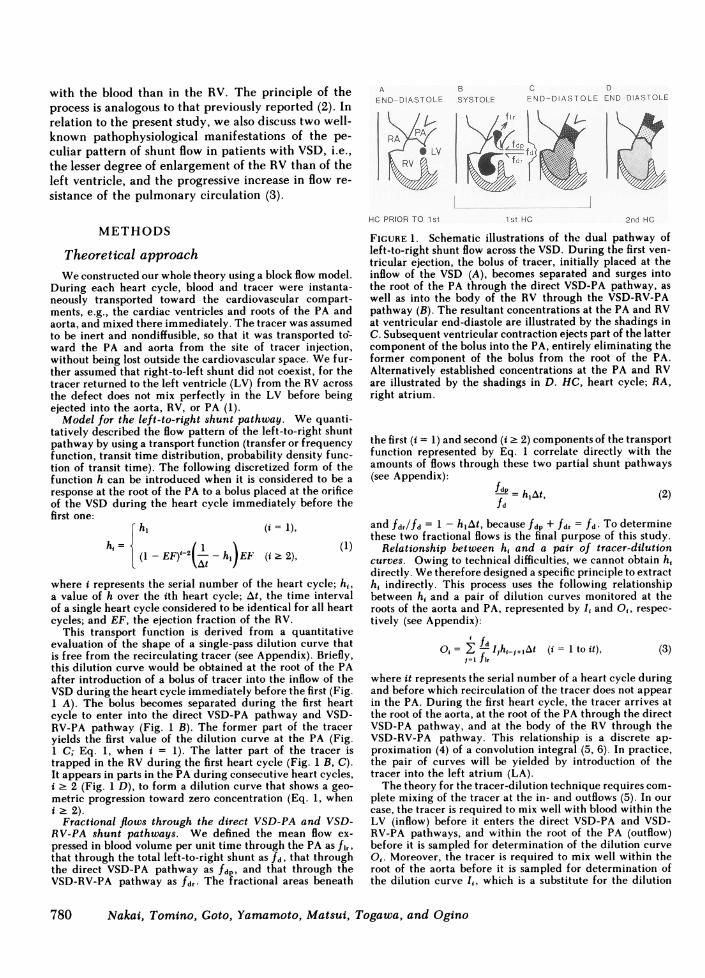
This transport function is derived from a quantitativeevaluation of the shape of a single-pass dilution curve thatis free from the recirculating tracer (see Appendix). Briefly,this dilution curve would be obtained at the root of the PAafter introduction of a bolus of tracer into the inflow of theVSDduring the heart cycle immediately before the first (Fig.1 A). The bolus becomes separated during the first heartcycle to enter into the direct VSD-PA pathway and VSD-RV-PA pathway (Fig. 1 B). The former part of the traceryields the first value of the dilution curve at the PA (Fig.1 C; Eq. 1, when i = 1). The latter part of the tracer istrapped in the RV during the first heart cycle (Fig. 1 B, C).It appears in parts in the PA during consecutive heart cycles,i 2 2 (Fig. 1 D), to form a dilution curve that shows a geo-metric progression toward zero concentration (Eq. 1, wheni 2 2).
Fractional flows through the direct VSD-PA and VSD-RV-PA shunt pathways. We defined the mean flow ex-pressed in blood volume per unit time through the PA as fi,,that through the total left-to-right shunt as fd, that throughthe direct VSD-PA pathway as fdp, and that through theVSD-RV-PA pathway as fdr. The fractional areas beneath
A BEND DIASTOLE SYSTOLE
HC PRIOR TO 1 st
C DEND DIASTOLE END-DIAST'OLE
1 st HC 2nd HC
FIGURE 1. Schematic illustrations of the dual pathway ofleft-to-right shunt flow across the VSD. During the first ven-tricular ejection, the bolus of tracer, initially placed at theinflow of the VSD (A), becomes separated and surges intothe root of the PA through the direct VSD-PA pathway, aswell as into the body of the RV through the VSD-RV-PApathway (B). The resultant concentrations at the PA and RVat ventricular end-diastole are illustrated by the shadings inC. Subsequent ventricular contraction ejects part of the lattercomponent of the bolus into the PA, entirely eliminating theformer component of the bolus from the root of the PA.Alternatively established concentrations at the PA and RVare illustrated by the shadings in D. HC, heart cycle; RA,right atrium.
the first (i = 1) and second (i 2 2) components of the transportfunction represented by Eq. 1 correlate directly with theamounts of flows through these two partial shunt pathways(see Appendix):
fdp = hlAt,fd
(2)
and fdr/fd = 1 - hjAt, because fdp + fdr = fd. To determinethese two fractional flows is the final purpose of this study.
Relationship between hi and a pair of tracer-dilutioncurves. Owing to technical difficulties, we cannot obtain hidirectly. Wetherefore designed a specific principle to extracth, indirectly. This process uses the following relationshipbetween h, and a pair of dilution curves monitored at theroots of the aorta and PA, represented by Ii and O,, respec-tively (see Appendix):
(3)0 i= fir ihi-j+,At (i = I to it),J=1 fir
where it represents the serial number of a heart cycle duringand before which recirculation of the tracer does not appearin the PA. During the first heart cycle, the tracer arrives atthe root of the aorta, at the root of the PA through the directVSD-PA pathway, and at the body of the RV through theVSD-RV-PA pathway. This relationship is a discrete ap-proximation (4) of a convolution integral (5, 6). In practice,the pair of curves will be yielded by introduction of thetracer into the left atrium (LA).
The theory for the tracer-dilution technique requires com-plete mixing of the tracer at the in- and outflows (5). In ourcase, the tracer is required to mix well with blood within theLV (inflow) before it enters the direct VSD-PA and VSD-RV-PA pathways, and within the root of the PA (outflow)before it is sampled for determination of the dilution curveO,. Moreover, the tracer is required to mix well within theroot of the aorta before it is sampled for determination ofthe dilution curve I, which is a substitute for the dilution
780 Nakai, Tomino, Goto, Yamamoto, Matsui, Togawa, and Ogino

curve at the inflow, i.e., LV (see below and Appendix). Forthis reason, the calculation needs to be carried out by usingvalues for the dilution curves, I and Oi, at their full equil-ibrations to which, in practice, the curves attain only at end-diastole. Faster sample rates than one per single heart cyclewould thus violate the requirement. Perfect mixing of thetracer in the RV is not an indispensable assumption, as longas the RV ejects the tracer at a uniform rate. The reason forselecting the root of the aorta, instead of the LV, as thesampling site is for obtaining a more stable dilution curve.
Deconvolution by multiple regression analysis. The pro-cess of calculating hi from Eq. 3 is called numerical decon-volution. This process, however, tends to yield unreasonableoscillations and negative values in the results. To overcomethis difficulty, we designed a deconvolution process with theaid of multiple regression analysis (7) in combination withsimultaneous introduction of a fitting function for h,. Wehave already performed the latter process by introducingEq. 1 as the fitting function for h,. The analysis yields thefollowing working equations (see Appendix):
'V - 2 'T .. 2 ,- V .. 2fd _ , Xi L Yt- - (z, x y) -
fir X,Zt z yt2-2 Xyi z !
fd Xy2z yiZt- z Xiyt 2Id X 2 yi2 - (2: Xiyi)'
where the sums are all carried out withruns from 1 to it. The values for x, y, arfollows:
and
0jx-At
I-I
EF; (1 - EF)'-2t_j+]=2
F 0
at 2 (1-EF)J _1+
- I,
EF can be obtained by monitoring the diPA yielded by a bolus injection of tracer
Reconvoluted dilution curve at the PAaccuracy of the numerical computation ofa reconvolution was performed in eachby use of the calculated hi. The proce:reconvoluted dilution curve at the PA, 0right side of Eq. 3. A comparison was i
O, so calculated and experimentally obcurves at the PA.
Predicted dilution curve in the RV. ijection into the LA, a dilution curve is alsRV. To provide a straightforward confirnity of our principle, we will compare etained, Ri, and analytically predicted, R',the RV. The latter curve is obtained by aidentical to that for the derivations of Ei
This dilution curve in the RV is calculowing equation by using preset valuesflows, EF, At, and dilution curve at the ao.
fdrt=1 flr fdpI1rt,+At (i=1
j=l flr -fdp
where
ri =EF
(1-EF)At
( F (i = 1 to oc), (10)
and r, is the transport function of a partial shunt pathwayfrom the VSD to the body of the RV (the partial VSD-RVpathway). The outflow of the partial VSD-RV pathway isassumed to be located in the body of the RV. The pathwayis identical to the initial half of the VSD-RV-PA pathway.After the (it-I)th heart cycle, Eq. 9 no longer holds becauseof the recirculation of tracer appearing in the RV via thesystemic circulation. Only for the introduction of Eqs. 9 and10, is the tracer assumed to equilibrate well in the RV duringeach heart cycle.
Wealso predict a dilution curve at the RV that would beobtained when the direct VSD-PA pathway does not exist.This process is carried out by using Eqs. 9 and 10 with fdpset at zero (see Appendix).
Experimental procedures(4) Surgical procedure. A total of eight mongrel dogs of both
yiz. ' sexes, weighing 13±1 kg (mean±SE), were anesthetized withpentobarbital sodium (30 mg/kg i.v.; Abbott Laboratories,
xjzj North Chicago, IL). The animals were artificially ventilated2- At, (5) through a cuffed endotracheal tube with a mixture of oxygen
and room air using a respirator (Mark 8, Bird Corp., Palmrespect to i, which Springs, CA). Sufficient immobility of each animal was ob-
dz are defined as tained with supplemental doses of pentobarbital (6-8 mg/kg i.v.), given when necessary. The femoral artery was can-nulated for continuous recording of arterial blood pressure.The thoracic cage was opened widely by a sternal-splitting
(i i1 to it), (6) incision. The pericardium was sagittally incised. Its edgeswere attached to the thoracotomy margin to form a cradle
(i = 1), for the heart. Heparin was introduced via a catheter insertedinto the femoral vein (500 U/kg, Novo Research Institute,
(i 2 to it); (7) Bagsvaerd, Denmark). Experimental VSD was producedwith a thin wall cylindrical boring tool 8 mmin diameter.The tool was introduced through the midpoint of a purse-
(i =1), string suture placed in the anterior wall of the RV.We designed the experiment with cooled normal saline
as the tracer. The time courses of the tracer concentration(i = 2 to it). (8) at the PA and aorta were monitored with thermistors. After
producing the defect, we advanced a handmade catheter-ilution curve at the tip thermistor into the root of the PA through the incision
into the RV (8). in the anterior wall of the RV. Another catheter-tip therm-L. To evaluate the istor was placed at the root of the ascending aorta via anthe deconvolution, incision made in the apex of the LV. The catheters werecomputational run then fixed firmly in position by tightening the suture.ss is to obtain the Two cannulae for tracer-injection, both with blind tipsX,, according to the and lateral openings, were advanced through one of the pul-made between the monary veins and through the external jugular vein so thattained O, dilution their tips were located in the LA and RV, respectively. The
thorax was kept loosely open during the experiment. Intra-A,fter the tracer in- venous low molecular weight dextran (Otsuka Pharma-so developed in the ceutical Co., Tokyo, Japan) in a volume of 50-100 ml wasnation of the valid- infused to combat hemorrhagic hypotension. At the end ofmxperimentally ob- each experiment, the animals were killed with an intrave-
dilution curves in nous overdose of pentobarbital. Postmortem examinationsprinciple entirely were made of the location of the experimental VSD.
qs. 3-5. Observations of dilution curves for calculating fractionallated with the fol- flows. Normal saline (0.5 ml) in a syringe was cooled to 10-for the fractional 15°C in an ice-water bath. Bolus introduction of the saline
rta (see Appendix): into the LA yielded a simultaneous pair of thermal dilutioncurves at the roots of the ascending aorta and of the PA, I,
to it -1) (9) and Oi, respectively. The circulatory system under analysisin our study consists of the cardiac ventricles and the roots
Dual Pathway of Left-to-Right Flow across Ventricular Septal Defect 781

of the major vessels. The loss of the diffusible tracer, cooledsaline, from the cardiovascular space may thus be as negli-gible as in the conventional thermodilution technique forthe determination of cardiac output (8). Mixing of the tracerwith the blood in the LV may be better with the tracer-injection into the LA than into the LV. The values for thedilution curves were sampled at each ventricular end-dias-tole, when the tracer equilibrates well in the roots of thesetwo major vessels. Each end-diastolic point for sampling wasidentified by taking account of the simultaneously monitoredtime courses of right ventricular and arterial pressures.
A separate bolus of chilled saline introduced into the RVyielded a thermal dilution curve at the PA, permitting de-termination of EF for the RV. The simulataneous recordingsof O, and It were immediately preceded or followed by theseparate determination of EF before the pattern of shuntflow underwent change.
In accord with our principle, it was necessary to samplevalues for 0 before the recirculating tracer contributed toit via the systemic circulation. To satisfy this requirement,we sampled values for the dilution curves usually over thefirst six, and at most over eight, heart cycles in a small num-ber of cases.
Experimental and predicted dilution curves in the RV.In one animal, a comparison was made between the pre-dicted and experimentally obtained dilution curves at theRV, R', and R*, respectively. For this purpose, three sets ofdilution curves were monitored within a short period (Fig.5): the dilution curve at the PA for determination of EF; apair of dilution curves at the aorta I,, and PA 0i (Fig. 5, left)for determination of the flow fractions fd/fd and fd/fIr; anda pair of dilution curves at the aorta I, and RV R, (Fig. 5,right). To monitor the last set of dilution curves, the catheter-tip thermistor initially positioned in the PA was retracteduntil it rested within the body of the RV. For determinationof the predicted dilution curves at the RV, the aortic dilutioncurve of the last set of curves was introduced into the rightside of Eq. 9, together with the fractional flows and EFpredetermined from the preceding two sets of dilutioncurves.
Irnstrumenits. The glass-bead thermistors used (OizumiManufacturing Co., Tokyo, Japan) were as small as 0.7 mmin diameter, allowing rnonitoring of rapid changes in tem-perature. They were mounted on plastic balls attached atthe tips of Teflon catheters (1.2 mmin diameter) and pro-tected by metal cages. The catheter-tip balls, 6 mmin di-ameter, were provided to improve mixing of the tracer atthe roots of the PA and aorta. Signals from the thermistorswere fed into Wheatstone bridges and amplifiers and dis-played on a multichannel pen recorder (Biophysiograph, 140System, San-ei Instruments Co., Tokyo, Japan). Calibrationof the thermal dilution curves for absolute values of flow wasnot performed. However, we did calibrate the individualmonitoring systems in vitro to assess the relative values forthe simultaneous dilution curves, I, and 0, or R,, with respectto each other. The linearity of the systems covered a suffi-ciently wide range between the temperature at which thebridge was balanced and that at least 1.5°C below the bal-anced level. The data were processed on a computer (PDP11/44, Digital Equipment Corp., Marlboro, MA).
Statistical analysis. In each animal, the data and resultswere averaged and expressed as the mean±SE. Comparisonswere made for the x2 test of goodness of fit between theexperimental dilution curve O0 and the reconvoluted curveO, (7). The influence of EF on the calculation of the fractionalflows was examined by using two different values for EF,one observed and the other arbitrarily preset. The signifi-
cance of the difference between these two results was eval-uated by the paired t test (7). In both of the tests, the nullhypothesis was considered to be acceptable when P > 0.05.
RESULTS
Location of the experimental VSD. All of the ex-perimental VSD were found to be located adjacent tothe right ventricular papillary muscle of the conus(Fig. 2). It was difficult to quantify the size of thedefect because of the irregularly cut edges. The axialdirection of the defect was always approximately per-pendicular to the surface of the right ventricularseptum.
Dilution curves. Fig. 3 shows typical records of theaortic and right ventricular pressures and a pair ofdilution curves at the aorta and PA in dog 1. Note thatthe dilution curve at the PA develops simultaneouslywith that at the aorta during the first heart cycle. Thiswas observed in every experimental run in all animalsand definitely indicates that the direct VSD-PA path-way exists. Fig. 4 (bottom) illustrates a dilution curveat the PA for determination of EF as yielded by bolusinjection of the tracer into the RV. The curve wasobtained shortly after observation of the pair of di-lution curves shown in Fig. 3. The aortic dilution curvedid not develop before the sixth heart cycle, indicatingabsent right-to-left shunt across the VSD. This was thecase in every animal.
Fractional shunt flows through the direct VSD-PAand VSD-RV-PA pathways. Two examples of resultsobtained from our deconvolution process are given inFig. 3 (bottom) and Fig. 5 (left). The calculated trans-port functions hi, drawn as solid straight lines, rep-resent a large proportion of the fractional area during
FIGURE 2 Locations of the experimental VSD, viewed fromthe right ventricular aspect. The numbers in the diagramare those of the animals and indicate the locations of theindividual defects. PM, papillary muscle of the conus; RBB,right bundle branch; others as in legend to Fig. 1.
782 Nakai, Tomino, Goto, Yamamoto, Matsui, Togawa, and Ogino

200
A
O L
200
50
0 - X,v v-
~~~~~F SA S S A--if
CW F-':> CExo
0
z0
F- '
-4
40
' 110 _
OL_
.4cn 1b> 0
-.:
U
-4
03"
Ph
3 C- '.
_ zro z-
2 4 6 8 HC
ls
FIGURE 3 Typical set of records for systemic arterial pres-sure (SAP) and right ventricular pressure (RVP), and a pairof thermal dilution curves I, and O, at the aorta and PA,respectively, in dog 1. The scales for temperature are drawnarbitrarily but relative to each other. Wesampled values ofthese dilution curves at each end-diastole during individualheart cycles. Points on the dilution curves selected for sam-pling are indicated by 0. Our deconvolution technique ex-tracted a trasport function of the shunt tract hf (bottom, solidstraight lines) with a large proportion of the fractional area(0.73) during the first heart cycle. The value of EF was 0.39.Reconvolution of the aortic dilution curve upon the transportfunction obtained, together with the calculated fractionalflow through the total shunt (fd/flr = 0.23), yielded a re-convoluted dilution curve at the PA OQ (bottom, *). A closeresemblance is clearly seen between OY, and O, (P > 0.5,x2 test of goodness of fit).
the first heart cycle. Table I summarizes the experi-mental data and calculated results. The values for EFof the RV were considerably low, ranging from 0.23to 0.38 (mean±SE, 0.30±0.02). The ratio of the totalshunt flow to the pulmonary arterial flow, fd/flr,ranged between 0.16 and 0.72 (0.41±0.08).
The fractional shunt flow through the direct VSD-PA pathway fdp/fd was very large, ranging between0.35 and 0.85 (0.57±0.05). In seven out of eight ani-
60
O _
10E
0L
2 4 6 8 10 HC
ls
FIGURE 4 Records of thermal dilution curves at the aortaand PA yielded by bolus introduction of chilled saline intothe RV for determination of EF of the RV. The dilutioncurve at the PA was saturated during the first heart cyclewhen mixing of the chilled saline with the blood in the RVmight be incomplete. The value of EF was 0.39, as calculatedby sampling values of the curve at the PA during three con-secutive heart cycles. Points for sampling are indicated by0. Recirculation of the tracer was not apparent in the aorticdilution curve before the sixth heart cycle.
mals, the fractional flow was >0.50. In all cases, re-convolution to yield the calculated dilution curves atthe PA O, resulted in an excellent similarity with theexperimentally observed curves Oi (P > 0.05, x2 testof goodness of fit). Typical examples illustrating thegood fit are given in Fig. 3 (P > 0.5, bottom) and Fig.5 (P > 0.9, left).
Right ventricular dilution curve. Fig. 5 shows rec-ords of two sets of dilution curves yielded by two sep-arate injections of the tracer into the LA, in dog 2; i.e.,Is and Ot (left), and Ii and Ri (right). Using these curvestogether with the predetermined EF, we calculatedthe two predicted dilution curves in the RV R, andcompared these with the experimentally observedcurve Ri (lower right).
First, we calculated the predicted curve assumingthat the direct VSD-PA pathway does not exist. On thebasis of this assumption, the value for fd/fl was de-termined to be 0.24. The results for R; are indicatedby solid triangles in the lower right panel. The findingthat the experimentally observed curve R, was muchsmaller than the calculated curve R' suggests that the
Dual Pathway of Left-to-Right Flow across Ventricular Septal Defect
7.--- -7-
783
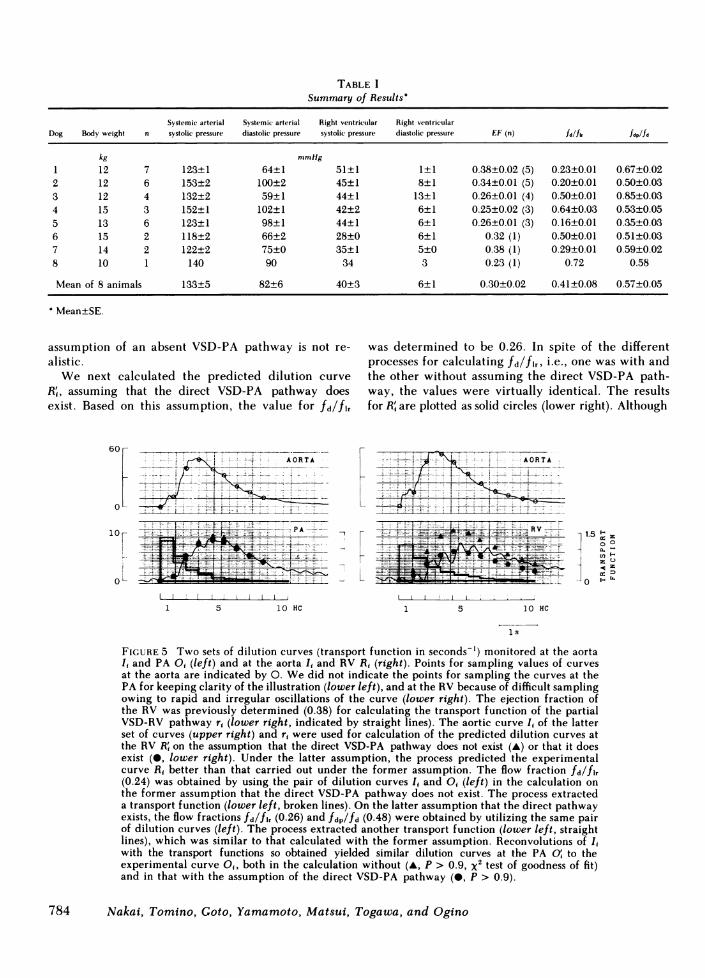
TABLE ISummary of Results'
Systemic arterial Systemic arterial Right ventricular Right ventricularDog Body weight n systolic pressure diastolic pressure systolic pressure diastolic pressure EF (n) fd/fkfdp/fd
kg mmHg
1 12 7 123±1 64±1 51±1 1±1 0.38±0.02 (5) 0.23±0.01 0.67±0.022 12 6 153±2 100±2 45±1 8±1 0.34±0.01 (5) 0.20±0.01 0.50±0.033 12 4 132±2 59±1 44±1 13±1 0.26±0.01 (4) 0.50±0.01 0.85±0.034 15 3 152±1 102±1 42±2 6±1 0.25±0.02 (3) 0.64±0.03 0.53±0.055 13 6 123±1 98±1 44±1 6±1 0.26±0.01 (3) 0.16±0.01 0.35±0.036 15 2 118±2 66±2 28±0 6±1 0.32 (1) 0.50±0.01 0.51±0.037 14 2 122±2 75±0 35±1 5±0 0.38 (1) 0.29±0.01 0.59±0.028 10 1 140 90 34 3 0.23 (1) 0.72 0.58
Mean of 8 animals 133±5 82±6 40±3 6±1 0.30±0.02 0.41±0.08 0.57±0.05
Mean±SE.
assumption of an absent VSD-PA pathway is not re-alistic.
We next calculated the predicted dilution curveR , assuming that the direct VSD-PA pathway doesexist. Based on this assumption, the value for fd/flr
60 L
PA
1 5 10OHC
was determined to be 0.26. In spite of the differentprocesses for calculating fd/flr, i.e., one was with andthe other without assuming the direct VSD-PA path-way, the values were virtually identical. The resultsfor R' are plotted as solid circles (lower right). Although
L
-1.5 "I z0 o)a,. _
z U
w D
0 t.. E-
1 5 10 HC
ls
FIGURE 5 Two sets of dilution curves (transport function in seconds-') monitored at the aortaI, and PA O, (left) and at the aorta I, and RV R, (right). Points for sampling values of curvesat the aorta are indicated by 0. Wedid not indicate the points for sampling the curves at thePA for keeping clarity of the illustration (lower left), and at the RV because of difficult samplingowing to rapid and irregular oscillations of the curve (lower right). The ejection fraction ofthe RV was previously determined (0.38) for calculating the transport function of the partialVSD-RV pathway r, (lower right, indicated by straight lines). The aortic curve It of the latterset of curves (upper right) and r, were used for calculation of the predicted dilution curves atthe RV R' on the assumption that the direct VSD-PA pathway does not exist (A) or that it doesexist (0, lower right). Under the latter assumption, the process predicted the experimentalcurve R1 better than that carried out under the former assumption. The flow fraction fd/flr(0.24) was obtained by using the pair of dilution curves I, and O, (left) in the calculation onthe former assumption that the direct VSD-PA pathway does not exist. The process extracteda transport function (lower left, broken lines). On the latter assumption that the direct pathwayexists, the flow fractions fd/fl, (0.26) and fdp/fd (0.48) were obtained by utilizing the same pairof dilution curves (left). The process extracted another transport function (lower left, straightlines), which was similar to that calculated with the former assumption. Reconvolutions of I,with the transport functions so obtained yielded similar dilution curves at the PA O, to theexperimental curve O,, both in the calculation without (A, p > 0.9, x2 test of goodness of fit)and in that with the assumption of the direct VSD-PA pathway (0, P > 0.9).
784 Nakai, Tomino, Goto, Yamamoto, Matsui, Togawa, and Ogino

large oscillations of R, rendered a quantitative com-parison impossible, the calculated values for R' cor-related well with the individual peaks of the oscilla-tions of Ri up to the fourth heart cycles. In the de-scending limb, the experimental right ventricularcurve was slightly larger than the predicted one. Thisdiscrepancy may indicate arrival of the recirculatingtracer at the RV through the systemic circulation.Overall, we conclude that there was a good resem-blance between the predicted dilution curve in the RVcalculated on the assumption of a coexisting directVSD-PA pathway, and the experimental right ven-tricular dilution curve.
DISCUSSION
Assessment of the methodologyValidity of our model for the intracardiac flow pat-
tern of left-to-right shunt. Our principle for dataanalysis depends on deconvolution from a discretizedform of the convolution integral for obtaining a trans-port function from a pair of in- and outflow tracerdilution curves (4-6). The deconvolution process is,however, generally highly sensitive to experimentalerrors imposed on the pair of dilution curves (2, 4, 9-12). Bassingthwaighte (13) assumed a single fittingfunction with several parameters as a mathematicalmodel for the entire time course of the transport func-tion. An iterative adjustment of the parameters affectsstable deconvolution to select the most reasonabletransport function by questioning at each time whetheror not the convolution equation is sufficiently approx-imated.
To verify the fitting function as a reasonable modelfor the pattern of flow, it is necessary for its intro-duction to provide a theoretical or empirical reason(12). In our case, we obtained experimental data toshow that the dilution curve at the PA O, developedduring the first heart cycle simultaneously to that atthe aorta I, (Figs. 3 and 5), and that the size of theexperimentally observed curve at the RV R, was muchsmaller than the predicted curve R;, which should bethe case if the left-to-right shunt was devoid of thedirect VSD-PA pathway (Fig. 5). These two findingsclearly indicate that the VSD-RV-PA pathway coexistswith the direct VSD-PA pathway and that a consid-erable amount of blood is transported through the lat-ter pathway.
The intravascular volume of the root of the PA issufficiently small relative to the flow through it. Itseems realistic, therefore, to assume, as we did in ourbasic principle (see Appendix for derivation of Eq. 1),that the tracer that has been transported through thedirect VSD-PA pathway into the root during any one
of the heart cycles is totally washed out during thenext cycle. The tracer trapped in the RV during anyone of the heart cycles is postulated to be ejected inparts during subsequent cycles and to yield a dilutioncurve at the PA whose descending limb shows a geo-metric progression. This assumption is also reasonable,as experimentally proven in Fig. 4, and is widely ac-cepted in the theory for determination of the ventric-ular ejection fraction (8). Our fitting function Eq. 1representing the model for the intracardiac pattern ofleft-to-right shunt flow thus satisfies the requirementfor empirical as well as theoretical reasons.
In addition, when the direct VSD-PA pathway wasassumed to exist, the reconvolution resulted in anequivalent size of predicted dilution curve at the RVR' to the experimentally obtained curve Ri. When thedirect VSD-PA pathway was assumed to be absent, thereconvolution resulted in a much larger predictedcurve than the experimental one (Fig. 5). These find-ings provide a straightforward confirmation of the va-lidity of our principle for determination of the frac-tional flow fdp/fd through the direct VSD-PA pathway.
We obtained good similarities between the recon-voluted and experimentally obtained dilution curvesat the PA (Figs. 3 and 5). Although such close resem-blances are not a test of the uniqueness of our fittingfunction, while necessary (10), they do support theaccuracy of the computation of the deconvolution pro-cesses.
Deconvolution with multiple regression analysis.As early as 1952, Paynter (4) suggested the advantagesof deconvolution performed in combination with si-multaneous introduction of multiple linear regressionanalysis. His idea is very sensible, since such statisticalcomputation does not pay too much attention to er-roneous experimental values appearing in the tracer-dilution curves. This favorable feature apparentlyholds true in our case, in which the fractional flowswere calculated by carrying out the deconvolution,taking account of all the sampled values of dilutioncurves (Eqs. 4-8). Additionally, the process suggestedby Paynter (4) allows one-pass computation withoutiteration. It was shown that with this treatment theinherent instability of the deconvolution was muchimproved but still persisted (2). For this reason, Nakai(2) attempted deconvolution and regression analysisin additional combination with a technique assumingweighted simple fitting functions for every small seg-ment of the transport function.
This process requires iteration but extracts a rea-sonable transport function. In the present study also,the method was shown to be a powerful technique forcarrying out stable deconvolution when introducingsimultaneously not only the multiple regression anal-ysis but also the fitting function for the transport func-
Dual Pathway of Left-to-Right Flow across Ventricular Septal Defect 785

tion. Such was indeed the case also in the method pro-posed by Knopp et al. (14), who adopted prechosenmultiple fitting functions for the transport function.
Present experimental model inrelation to human VSD
The pathophysiological state of our experimentalanimals may be designated as falling into the groupwith medium-sized defect with normal pulmonaryvascular resistance and moderately elevated right ven-tricular pressure. The defect in the ventricular septumwas placed on the entrance of the outflow tract of theRV. All the animals used in the present study devel-oped a substantial amount of flow through the directVSD-PA pathway. In patients with VSD, however,such frequent incidence has not been found to holdtrue, as experienced in our cineangiographic exami-nations of the intracardiac pattern of shunt flow. Wewould regard our experimental VSD as functionallythe same as some subtype of human defect in whichthe direct VSD-PA pathway coexists.
The right ventricular EF was considerably lower inthe present study than that (mean, 0.62) reported inpatients with VSD (15). The purse-suture placed in theanterior wall of the RV would be responsible for areduction in right ventricular performance togetherwith acute right ventricular volume overload due toleft-to-right shunt. The value for EF, however, cannotbe considered a significant variable that critically in-fluences the values of the fractional flows fd/fl, andfdp/fd. This inference is derived from the finding thatfdp/fd, which is independent of EF, is great; and thefact that the sole determinant of fd/fl, is the size ofthe dilution curve at the PA, not the time course ofthe curve.
To confirm the small influence of EF on the results,we calculated the fractional flows under an EF valuepreset at 0.62 (Table II and reference 15). Differencesin values for fdp/fd between that calculated with theobserved EF and that with the preset EF were oftenstatistically significant, but quite small in all animalsexcept one. The larger difference in dog 5 was dueto a smaller proportion of the fractional flow fdp/fd(0.35±0.03). The influence of these two different valuesfor EF on fd/flr is also trivial. In this calculation witharbitrarily present values of EF, the reconvolutedcurves O° were similar to the experimental curves O(P > 0.05, x2 test of goodness of fit).
Implications of the present study
The most striking result obtained in the presentstudy was that the partial shunt flow through the direct
TABLE IIEffects of EF on the Fractional Shunt Flows
Dog n EF (n) fd/fl, fdp/fd
1 7 0.38±0.02 (5) 0.23±0.01 0.67±0.020.62 0.22±0.01 0.68±0.02
2 6 0.34±0.01 (5) 0.20±0.01 0.50±0.030.62 0.18±0.01 0.47±0.04
3 4 0.26±0.01 (4) 0.50±0.01 0.85±0.030.62 0.47±0.01 * 0.88±0.04
4 3 0.25±0.02 (3) 0.64±0.03 0.53±0.050.62 0.54±0.04 0.53±0.08
5 6 0.26±0.01 (3) 0.16±0.01 0.35±0.030.62 0.12±0.010 0.28±0.06
6 2 0.32 (1) 0.50+0.01 0.51+0.030.62 0.44±0.02 0.49±0.05
7 2 0.38 (1) 0.29±0.01 0.59±0.020.62 0.26±0.02 0.59±0.01
8 1 0.23 (1) 0.72 0.580.62 0.60 0.66
Data from dogs 4, 6, 7, and 8 were not evaluated statistically be-cause of the small number of measurements.e Statistically significant differences between the results (P < 0.05,paired t test).
VSD-PA pathway was great. The amount ranged be-tween 35 and 85% of the total shunt flow. The amountwas >50% in seven cases out of eight. In other words,in most cases <50%, and down to as little as 15%, ofthe total shunt flow entered the RV through the VSD-RV-PA pathway. Only this small component of shuntflow contributed to extra work of the RV.
Levin et al. (1) were the first to demonstrate thedirect VSD-PA component of the shunt tract in theircineangiographic study. Its pathophysiological signif-icance concerns one of the well known manifestationsof patients with VSD, i.e., the lesser degree of enlarge-ment of the RV than of the LV before pulmonaryhypertension develops. This point was argued by Gra-ham et al. (3) in their suggestive review. As they say,"since normally the major shunting occurs during ven-tricular systole and is ejected into the outflow tract ofthe right ventricle, the right ventricle does not enlargeto the same extent as the left ventricle." Their analysisis in accord with our quantitative finding that the frac-tional flow through the VSD-RV-PA pathway fdr/fdis very small.
Another characteristic feature of patients with VSDis the progressive increase in pulmonary vascular re-sistance with medial hypertrophy and intimal prolif-eration (16). The basic mechanisms giving rise to such
786 Nakai, Tomino, Goto, Yamamoto, Matsui, Togawa, and Ogino

manifestations remain to be clarified (3). However,increased stress on the pulmonary vessel wall drivenby "a common ejectile force from both ventricles" (3)may directly or indirectly trigger such changes (3, 17).The impact of flow conducted through the direct VSD-PA pathway should be especially marked in the pul-monary vessels, because a high flow velocity across theVSD is not damped by the RV. Thus, when the flowthrough the direct VSD-PA pathway is great in pro-portion to the total pulmonary flow, i.e., fdp/flr, themechanisms leading to pathological changes of thepulmonary vessel wall may operate more efficiently.
APPENDIX
Glossary
i or j serial number of the heart cycleit serial number of the heart cycle during and before
which the dilution curve at the PA is free fromrecirculating tracer
At time interval of a single heart cycle considered tobe equal for all heart cycles
C1 value of a single-pass dilution curve obtained dur-ing the ith heart cycle at the root of the PA inresponse to a bolus tracer injection
It tracer-dilution curve recorded at the root of theaorta
O, dilution curve at the root of the PA0', reconvoluted dilution curve at the PAR, dilution curve in the RVR;i predicted dilution curve in the RVhi transport function of the total shunt pathway from
the VSD to the PA'r, transport function of the partial VSD-RV pathwayfir mean total blood flow through the PA expressed
as blood volume/unit timefd mean total left-to-right flow across the VSDfdp mean flow through the direct VSD-PA pathwayfdr mean flow through the VSD-RV-PA pathwayEF ejection fraction of the RVQ total amount of tracer-bolus introduced during a
single heart cycle into the inflow of the VSDa, , estimates of f lr/fd and fdp/fdAt, respectivelyxi, yi, z, variables of a set of simultaneous equationset discrepancy between z and the value determined
from a, ,B, x, and y caused by experimental error
Derivation of Eq. 1. The single-pass dilution curve, de-noted here by C,, during the first heart cycle, Cl, consistssolely of the tracer drained from the direct VSD-PA pathway(Fig. 1 C). Subsequent ventricular ejection during the secondheart cycle will totally eliminate this part of the tracer fromthe root of the PA (Fig. 1 D). The dilution curve at the PAafter the first heart cycle consists of the tracer drained fromthe VSD-RV-PA pathway. The time course of the curve willshow a geometric progression towards zero concentration.The ratio C,/C,- will thus be equivalent to l-EF (8).
The entire time course of C1 is expressed as
{(-E) = C2 (i = 1), (11)
To standardize C1 for convenience in further discussions, weintroduce a discretized form of the transport function h de-fined as
Clhi,= X ' (i=lto 0).
z C,Att=l
(12)
Weobtain Eq. 1 from Eq. 11 by the use of this relationshipand by taking into account the solution that X(1 -EF)'-converges to 1 IEF as i proceeds from 2 up to infinity, andthe area beneath the entire time course of the function isunity: Zh,At = 1, where j runs from 1 up to infinity.
Derivation of Eq. 2. Weintroduce Eq. 2 by utilizing thesingle-pass dilution curve C,. Let Q represent the totalamount of tracer appearing in the PA through the left-to-right shunt pathway. Wethen obtain Q = 2:fi,AtC,, wherej takes values from 1 up to infinity. This relationship be-comes Q = fIrCj/hi by considering Eq. 12 when i = 1. Sincethe amount of tracer entering the direct VSD-PA pathway,(fdp/fd)Q, is identical to that appearing in the PA duringthe first heart cycle, fl,AtC,, we obtain Eq. 2.
Derivation of Eq. 3. The mathematical analysis is basi-cally the same as that described by Zierler (5) when quan-titatively evaluating a component of recirculation super-imposed on a single-pass dilution curve of tracer. The di-lution curve at the aorta It is considered to consist of a trainof square waves of concentration II, I2, . . . Ia, which developduring the individual heart cycles over a period of At. Theindividual square wave at the aorta during, say, the jth heartcycle, also represents that in the LV during the immediatelypreceding cycle j - 1. The configuration of the single-passdilution curve at the PA, which would be obtained in re-sponse to only this square wave in the LV, should be essen-tially identical to that of hi. However, as in Zierler's (5)analysis, the magnitude of its concentration and the locationon the time axis depend on those of the square wave in theLV. The dilution curve at the PA 0° should consist of allsuch individual single-pass curves. The flow ratio fd/flr isintroduced in Eq. 3, since the dilution curve I enters theshunt pathway with a flow fd, whereas the curve 0 is carriedby the pulmonary arterial flow at an amount of fl,
Derivation of Eqs. 4 and 5. First, we must rearrange Eq.3 to facilitate our purpose of applying linear regression anal-ysis. Rearrangement with respect to the two unknown coef-ficients, fd/flr and hl, together with substitution of the rightside of Eq. 1 for h, that appears in Eq. 3, yields the followingit simultaneous equations:
flr. *1 h Is = 0 (i = 1),fd At I I
fir 01 F2 1
fAt+ h,[EF (I(- EF)' it~=-E (1- EF) 1_)+I (i = 2 to it).
At J=2(13)
These equations are linear with respect to the coefficientsfir/fd and h1 when EF, Ii, At, and Ot are known.
Eq. 13 describes a precise relationship. In practice, how-ever, we cannot draw the relationship accurately, becauseobservational errors are inevitably involved in the experi-mentally obtained values for the dilution curves, EF, andAt. For simplicity, let x, y, and z be the values determinedby such experimental measurements (Eqs. 6-8) and corre-spond to the variables of the simultaneous equations ex-
Dual Pathway of Left-to-Right Flow across Ventricular Septal Defect 787

pressed by Eq. 13. We then introduce the following rela-tionship which simulates Eq. 13:
a;x + ,Sy, = z, + e, (i = 1 to it), (14)
where a and ,3 are to be obtained from x, y, and z to estimateflr/fd and hl, respectively; and es represents an unavoidablediscrepancy caused by experimental error between the leftside of Eq. 14 and zj.
The regression analysis (7) approximates Eq. 14 to theprecise relationship Eq. 13 in such a way that the sum ofthe squared e, is minimal by adjusting a and ft. The valuesfor a and , so obtained will satisfy, albeit not perfectly, allof the relationships between x, y, and z. By substituting fi,rfd and fdp/fdAt for a and A, respectively, the analysis finallyyields Eqs. 4 and 5.
Derivation of Eqs. 9 and 10. The following considerationgives rise to Eq. 10: A single-pass dilution curve in the RVresponding to a bolus injection of tracer into the orifice ofthe VSD reduces its concentration in a geometric progres-sion. The theoretical approach for Eq. 9 is identical to thatfor Eq. 3, except in the following respects: The dilution curvein the RV consists of the tracer trapped in the RV in thepassage through the VSD-RV-PA pathway to the PA, theflow through the pathway is fd,, and the amount of flow thatdilutes the tracer in the RV is flr - fdp.
Derivation of the predicted dilution curve at the RVwhen the direct VSD-PA pathway does not exist. In thiscase, fdp is set at zero and therefore fd, = fd for Eq. 9. Sincewe assume arbitrarily in this case that the direct VSD-PApathway does not exist, the value for fd/flr has to be cal-culated in a manner different from that using Eq. 4. Thealternative process is the same as that reported previously(2). Briefly, we deconvolute Eq. 3 for extracting a curve of(fd/flr)hi from I, and O, with simultaneous introduction ofmultiple regression analysis and a few restrictions. The re-strictions adopted are as follows: Each small segment on thecurve follows a quadratic curve, and the value for (fd/fi,)h,is zero after the eighth heart cycle. The former restrictionis used for smoothing of the curve, never as an assumptionfor the intracardiac flow pattern of the shunt. The fractionalflow fd/fir is identical to the area beneath the (fd/fir)h, curveso obtained.
REFERENCES1. Levin, A. R., M. S. Spach, R. V. Canent, Jr., J. P. Boineau,
M. P. Capp, V. Jain, and R. C. Barr. 1967. Intracardiacpressure-flow dynamics in isolated ventricular septaldefects. Circulation. 35:430-441.
2. Nakai, M. 1981. Computation of transport function usingmultiple regression analysis. Am. J. Physiol. 240(HeartCirc. Physiol. 9):H133-H144.
3. Graham, T. P., Jr., H. W. Bender, and M. S. Spach. 1977.Defects of the ventricular septum. In Heart Disease inInfants, Children, and Adolescents. A. J. Moss, F. H.Adams, and G. C. Emmanouillides, editors. Williams& Wilkins Co., Baltimore. Second ed. 140-161.
4. Paynter, H. M. 1952. Methods and results from M.I.T.studies in unsteady flow. Boston Soc. Civil Eng. J.39:120-165.
5. Zierler, K. L. 1962. Theoretical basis of indicator-dilu-tion methods for measuring flow and volume. Circ. Res.10:393-407.
6. Stephenson, J. L. 1948. Theory of the measurement ofblood flow by the dilution of an indicator. Bull. Math.Biophys. 10:117-121.
7. Miller, I., and J. E. Freund. 1977. Probability and Sta-tistics for Engineers. Prentice-Hall Inc., EnglewoodCliffs, New Jersey. Second ed.
8. Yang, S. S., L. G. Bentivoglio, V. Maranhao, and H.Goldberg. 1978. From Cardiac Catheterization Data toHemodynamic Parameters. F. A. Davis Co., Philadel-phia. Second ed. 101-151.
9. Coulam, C. M., H. R. Warner, E. H. Wood, and J. B.Bassingthwaighte. 1966. A transfer function analysis ofcoronary and renal circulation calculated from upstreamand downstream indicator-dilution curves. Circ. Res.19:879-890.
10. Gamel, J., W. F. Rousseau, C. R. Katholi, and E. Mesel.1973. Pitfalls in digital computation of the impulse re-sponse of vascular beds from indicator-dilution curves.Circ. Res. 32:516-523.
11. Maseri, A., P. Caldini, S. Permutt, and K. L. Zierler.1970. Frequency function of transit times through dogpulmonary circulation. Circ. Res. 26:527-543.
12. Neufeld, G. R. 1971. Computation of transit time dis-tributions using sampled data Laplace transforms. J.Appl. Physiol. 31:148-153.
13. Bassingthwaighte, J. B. 1966. Plasma indicator disper-sion in arteries of the human leg. Circ. Res. 19:332-346.
14. Knopp, T. J., W. A. Dobbs, J. F. Greenleaf, and J. B.Bassingthwaighte. 1976. Transcoronary intravasculartransport functions obtained via a stable deconvolutiontechnique. Ann. Biomed. Eng. 4:44-59.
15. Graham, T. P., Jr., G. F. Atwood, R. J. Boucek, Jr., D.Cordell, and R. C. Boerth. 1976. Right ventricular vol-ume characteristics in ventricular septal defect. Circu-lation. 54:800-804.
16. Dammann, J. F., Jr., W. M. Thompson, Jr., 0. Sosa, andI. Christlieb. 1960. Anatomy, physiology and naturalhistory of simple ventricular septal defects. Am. J. Car-diol. 5:136-166.
17. Wood, P. 1968. Diseases of the Heart and Circulation.Eyre & Spottiswoode, London. Third ed. 964-985.
788 Nakai, Tomino, Goto, Yamamoto, Matsui, Togawa, and Ogino