quantitative analysis of mineral elements in...
TRANSCRIPT

International Journal of Food Science and Biotechnology 2018; 3(2): 60-69
http://www.sciencepublishinggroup.com/j/ijfsb
doi: 10.11648/j.ijfsb.20180302.14
Quantitative Analysis of Mineral Elements in Commercial Pineapple Juices by Inductively Coupled Plasma Mass Spectrometry (ICP-MS)
Alassane Youssao Abdou Karim1, *
, Magloire Akakpo Nonvignon Gbaguidi1, Oriol Baltrons
3,
Fabienne Seby3, Mathilde Monperus
3, Henri Houénoukpo Soclo
1, Olivier Donard
2, 3
1Department of Chemical Engineering-Processes, Polytechnic School of Abomey-Calavi, University of Abomey, Calavi, Bénin 2Ultra Trace Analysis Aquitaine (UT2A), University of Pau and Pays de l’Adour (UPPA), Pau, France 3Multidisciplinary Institute of Research on Environment and Materials (IPREM 12- UMR 5254), University of Pau and Pays de l’Adour
(UPPA), Pau, France
Email address:
*Corresponding author
To cite this article: Alassane Youssao Abdou Karim, Magloire Akakpo Nonvignon Gbaguidi, Oriol Baltrons, Fabienne Seby, Mathilde Monperus, Henri
Houénoukpo Soclo, Olivier Donard. Quantitative Analysis of Mineral Elements in Commercial Pineapple Juices by Inductively Coupled
Plasma Mass Spectrometry (ICP-MS). International Journal of Food Science and Biotechnology. Vol. 3, No. 2, 2018, pp. 60-69.
doi: 10.11648/j.ijfsb.20180302.14
Received: April 1, 2018; Accepted: April 17, 2018; Published: May 21, 2018
Abstract: The consumption of fruit juice in the diet has increased in recent years because it contains mineral food
supplements and other essential vitamins. In this study, sugar levels and mineral nutrient concentrations were evaluated in 92
commercial pineapple juice samples from Benin and France using inductively coupled plasma mass spectrometry (ICP-MS).
The analysis of the data obtained reveals three ranges of concentrations relative to major elements or macro-elements (Ca,
Mg), to minor elements or micro-elements (Mn, Fe, Ni, Cu, Zn), and to trace elements (Mo, V, Co, Cr). The concentrations of
macro-elements and micro-elements (expressed in µg/L) vary from 11333 to 278000 for Mg, 95200 to 788000 for Ca, 536 to
25344 for Mn, 142 to 85612 for Fe, 5 to 253 for Ni, 5 to 1256 for Cu, and from 43 to 25862 for Zn. The trace elements were
found in the concentration ranges (expressed in µg/L) of: 0.23 - 12.50 for Vanadium, 0.58 - 17.10 for Cobalt, 1.17 - 58.70 for
Molybdenum and finally 4 - 70.5 for Chromium. The sugar levels in the various commercial juices collected in Benin and
France vary from 11.0 to 18.5 Brix with an average value of 14.0 Brix. Apart from the heterogeneous nature of the juices
produced in Benin production units, mineral and sugar levels were generally in accordance with international standards such as
CODEX STAN 182-1993. The transformation of pineapple into fruit juice is a credible alternative for the improvement of
pineapple exports, if the marketing strategy is better adapted and the local authorities support the manufacturers of the
production chain to improve the quality of juices and highlight their excellent nutritional quality.
Keywords: Minerals, Juice, Pineapple, Benin, France, Codex Stan, ICP-MS
1. Introduction
Two varieties of pineapple, namely "Cayenne smooth" and
"Sugarloaf", are known to be produced in Benin Republic.
The vegetative cycle of pineapple covers a period from 15 to
24 months with their production being concentrated in the
southern and central regions of the country, representing 10%
of the territorial area inhabited by nearly 60% of the
population [1]. Furthermore, an increase in the production
and consumption of pineapple has been observed aided by
the extension of its cultivation in new geographical areas of
the country coupled with the increase in cross-border flows,
through informal transactions, to neighbouring countries such
as Nigeria, Burkina Faso and Niger. For instance, earlier in
20016, it contributed 1.2% to the Gross Domestic Product
61 Alassane Youssao Abdou Karim et al.: Quantitative Analysis of Mineral Elements in Commercial Pineapple Juices by
Inductively Coupled Plasma Mass Spectrometry (ICP-MS)
(GDP) and 4.3% to agricultural GDP, or about 13 billions
FCFA [1]. Apart from cotton and cashew with higher export
potential, pineapple is another crop that can be exported. This
is one of the reasons why the government of Benin Republic,
in its strategy to fight against poverty, has made the revival of
the agricultural sector one of its priorities.
Concerning pineapple, the goal is to increase substantial
production of high quality crops and improve the marketing
of the fresh fruits and its by-products in order to contribute to
the diversification of exports [2]. Despite this renewed
interest in this sector in Benin, in terms of its potential socio-
economic and financial benefits, that part that has to do with
pineapple is facing a number of challenges such as those
related to the competitiveness of the commodity in terms of
finished products meeting the standard requirements,
especially the knowledge of nutritional value, for
international market. Consequently, this study was carried
out to investigate the concentrations of some minerals in
extracted and bottled pineapple juices in Benin in comparison
with those for other branded pineapple juices purchased from
shopping outlets in France.
2. Materials and Methods
2.1. Sampling of Juices
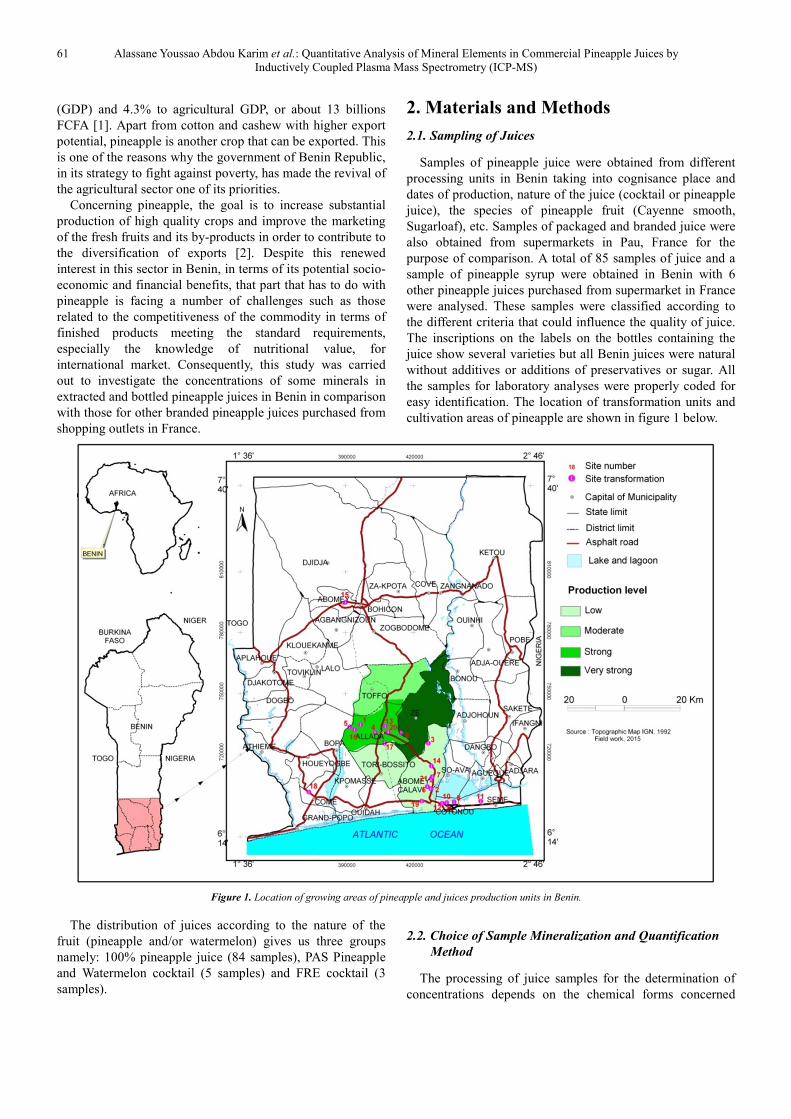
Samples of pineapple juice were obtained from different
processing units in Benin taking into cognisance place and
dates of production, nature of the juice (cocktail or pineapple
juice), the species of pineapple fruit (Cayenne smooth,
Sugarloaf), etc. Samples of packaged and branded juice were
also obtained from supermarkets in Pau, France for the
purpose of comparison. A total of 85 samples of juice and a
sample of pineapple syrup were obtained in Benin with 6
other pineapple juices purchased from supermarket in France
were analysed. These samples were classified according to
the different criteria that could influence the quality of juice.
The inscriptions on the labels on the bottles containing the
juice show several varieties but all Benin juices were natural
without additives or additions of preservatives or sugar. All
the samples for laboratory analyses were properly coded for
easy identification. The location of transformation units and
cultivation areas of pineapple are shown in figure 1 below.
Figure 1. Location of growing areas of pineapple and juices production units in Benin.
The distribution of juices according to the nature of the
fruit (pineapple and/or watermelon) gives us three groups
namely: 100% pineapple juice (84 samples), PAS Pineapple
and Watermelon cocktail (5 samples) and FRE cocktail (3
samples).
2.2. Choice of Sample Mineralization and Quantification
Method
The processing of juice samples for the determination of
concentrations depends on the chemical forms concerned

International Journal of Food Science and Biotechnology 2018; 3(2): 60-69 62
(soluble, total, species derived from the mineral element) and
the mineral elements. Different authors have used hydrostatic
atomic fluorescence spectrometry [3], optical emission
spectrometry with an inductively coupled plasma source [3]
or mass spectrometry inductively coupled plasma source
(ICP-MS) [3, 4, 5, 6] without special treatment of samples
other than dry or wet incineration for determination of
chemical elements in juices. In this study, juice samples were
mineralized to destroy organic matter [3] due to high
viscosity and high content of dissolved solids; this made it
possible to avoid non-spectral difficulties (mainly matrix
effects) and spectral interferences in the spectrometric
measurements. Digestion of the fruit juice samples was done
by DigiPrep digestion blocks with concentrated nitric acid
(HNO3) and 30% hydrogen peroxide (H2O2) [5] in a
programmable oven with two levels of temperature (45 C and
90 C). An ELAN DRC Perkin Elmer apparatus equipped
with a nebulizer was used with a Meinhart silica cyclonic
chamber for spraying and continuous nebulization. The
operating conditions were optimized daily using a standard 8-
level aqueous solution (for calibration of the apparatus)
containing: 0; 0.05; 0.1; 0.5; 1; 5; 20 and 100 ppb and
internal standards for the control of isotope intensities. The
internal standards used were indium (In), bismuth (Bi) and
scandium (Sc) with 5ppb concentrations. Two types of
reference materials (SRM NIST 1640a and SRM SLRS-5)
were used to determine the percentages of recuperation.
First, we used the semi-quantitative method available with
Perkin-Elmer ICP-MS instrumentation (Perkin-Elmer total
Quant III) which allowed us to identify the levels of
concentrations in juices from Benin and juices purchased in
supermarkets in France. After, we use the quantitative
method to detect the real contamination level of our samples.
The method of analysis was "Total Quant": this is a unique
software feature for ELAN ICP-MS systems to quantify 81
elements in a sample by interpreting the full mass spectrum.
Total Quant is an ideal tool for semi-quantitative analysis
during the development of the method; it is also used for the
characterization of the final material. When using Total
Quant, the spectral interpretation is performed automatically
by the software, and the intensities were assigned to elements
after correction of the interference on the individual isotopes.
The intensities were compared to a stored response table to
convert them into concentrations. Total Quant gives
quantitative results typically +/- 25% of the real value in
simple matrices.
This precision has been improved by the use of an external
standard that corrects the "response table" used by the
software. Internal standards, added to the sample and
standard solutions, are mainly used in measurements made
by plasma-based instruments to compensate for possible
variations in ICP-MS performance.
2.3. Statistical Analysis
Statistical analyses were carried out with the aid of
Statistical Package for Social Science (SPSS) Version 20.0
and Minitab Version 16.0. The statistical tools were those for
calculation of the dispersion characteristics and plotting of
the moustache boxes and logit including analysis of variance.
The data were pre-processed using the whisker boxes to
identify recording errors and concentration differences
between different processing units.
3. Results and Discussion
3.1. Sugar Levels in Pineapple Juice
Small producers in Benin are presently struggling to meet
the criteria set for standard products particularly for export.
This can be seen in the fact that the yields and volume of
pineapple were high but less than 2% of the pineapple
produced is exported [4]. It is important to state that the
conversion of pineapple into fruit juice is an opportunity for
producers from Benin to be able to export more pineapple in
strict compliance with standards, in this case, the sugar levels
expressed in Brix degree. The amount of sugar was
determined using a prism from the refractive index. It
expresses the amount of dry matter (in grams) per 100 grams
of liquid. According to French Directive 93/77 of 21
September 1993 and CODEX STAN 247-2005, the minimum
and maximum sugar levels in Brix degree of a commercial
pineapple juice were 12.1 and 12.8 respectively. For Citrullus
lanatus watermelon juice, the minimum sugar level in Brix
degree is 8.0 (CODEX STAN 247-2005). In practice,
corrected Brix is used which takes into account that juice
acids do not contribute exactly to Brix in the same way as
pure saccharose. But in a first approximation, we evaluated
the contents without this correction for pineapple juices.
For juice comparison purposes, we determined the sugar
content of pineapple juices sampled in manufacturing units in
Benin and some samples purchased in supermarkets in
France. For all these juices, the average total solid content
was 14.0 Brix (Table 1), which was above 12.8 Brix, the
international reference value. According to the results of the
92 samples presented in the following Table 1, the sugar
levels vary from 11.0 to 18.5 Brix.
Table 1. Dispersal characteristics of total dissolved solids levels (sugar) in pineapple commercial juices.
Variable (Brix) Mean value SD Minimum Maximum Percentiles
25 50 75
Total dissolved solids 14.0 1.8 11.0 18.5 13.0 15.0 15.0
SD: Standard Deviation
These results are in agreement with those of Miele et al.,
(2014) [2] for grape juices produced by biological processes.
The first quartile was 13.0, which means that at least 75% of
the samples have a sugar concentration higher than Codex
63 Alassane Youssao Abdou Karim et al.: Quantitative Analysis of Mineral Elements in Commercial Pineapple Juices by
Inductively Coupled Plasma Mass Spectrometry (ICP-MS)
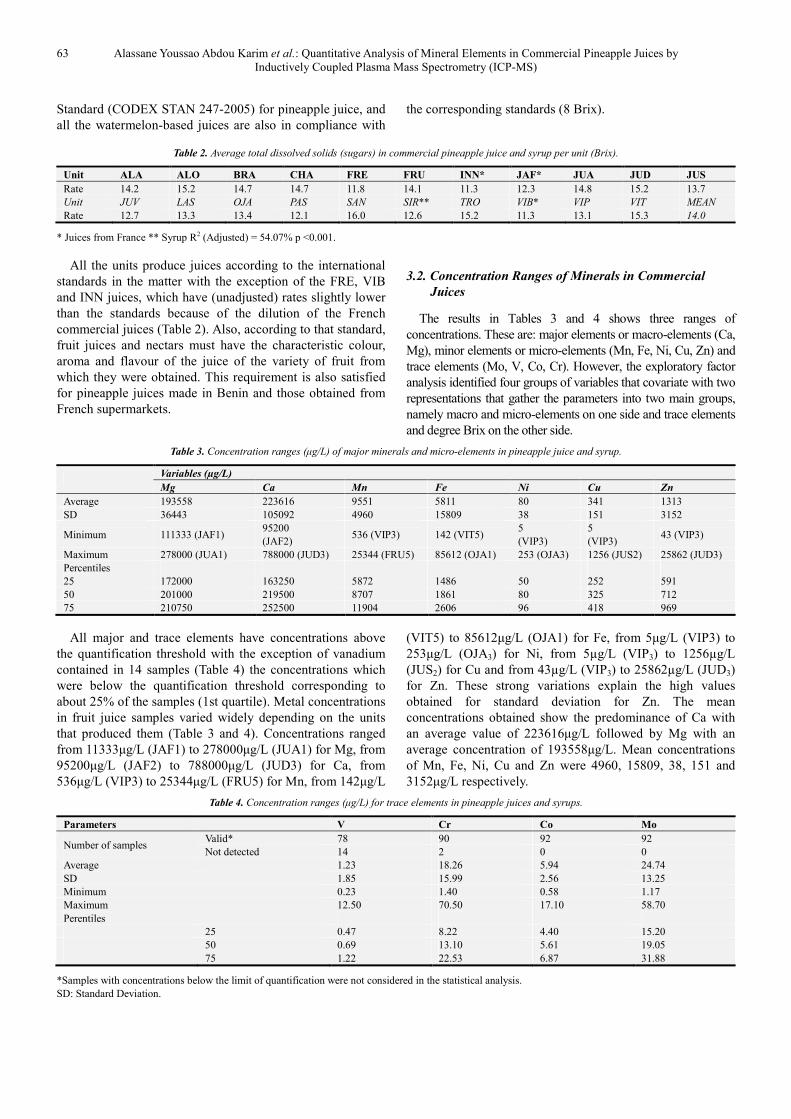
Standard (CODEX STAN 247-2005) for pineapple juice, and
all the watermelon-based juices are also in compliance with
the corresponding standards (8 Brix).
Table 2. Average total dissolved solids (sugars) in commercial pineapple juice and syrup per unit (Brix).
Unit ALA ALO BRA CHA FRE FRU INN* JAF* JUA JUD JUS
Rate 14.2 15.2 14.7 14.7 11.8 14.1 11.3 12.3 14.8 15.2 13.7
Unit JUV LAS OJA PAS SAN SIR** TRO VIB* VIP VIT MEAN
Rate 12.7 13.3 13.4 12.1 16.0 12.6 15.2 11.3 13.1 15.3 14.0
* Juices from France ** Syrup R2 (Adjusted) = 54.07% p <0.001.
All the units produce juices according to the international
standards in the matter with the exception of the FRE, VIB
and INN juices, which have (unadjusted) rates slightly lower
than the standards because of the dilution of the French
commercial juices (Table 2). Also, according to that standard,
fruit juices and nectars must have the characteristic colour,
aroma and flavour of the juice of the variety of fruit from
which they were obtained. This requirement is also satisfied
for pineapple juices made in Benin and those obtained from
French supermarkets.
3.2. Concentration Ranges of Minerals in Commercial
Juices
The results in Tables 3 and 4 shows three ranges of
concentrations. These are: major elements or macro-elements (Ca,
Mg), minor elements or micro-elements (Mn, Fe, Ni, Cu, Zn) and
trace elements (Mo, V, Co, Cr). However, the exploratory factor
analysis identified four groups of variables that covariate with two
representations that gather the parameters into two main groups,
namely macro and micro-elements on one side and trace elements
and degree Brix on the other side.
Table 3. Concentration ranges (µg/L) of major minerals and micro-elements in pineapple juice and syrup.
Variables (µg/L)
Mg Ca Mn Fe Ni Cu Zn
Average 193558 223616 9551 5811 80 341 1313
SD 36443 105092 4960 15809 38 151 3152
Minimum 111333 (JAF1) 95200
(JAF2) 536 (VIP3) 142 (VIT5)
5
(VIP3)
5
(VIP3) 43 (VIP3)
Maximum 278000 (JUA1) 788000 (JUD3) 25344 (FRU5) 85612 (OJA1) 253 (OJA3) 1256 (JUS2) 25862 (JUD3)
Percentiles
25 172000 163250 5872 1486 50 252 591
50 201000 219500 8707 1861 80 325 712
75 210750 252500 11904 2606 96 418 969
All major and trace elements have concentrations above
the quantification threshold with the exception of vanadium
contained in 14 samples (Table 4) the concentrations which
were below the quantification threshold corresponding to
about 25% of the samples (1st quartile). Metal concentrations
in fruit juice samples varied widely depending on the units
that produced them (Table 3 and 4). Concentrations ranged
from 11333µg/L (JAF1) to 278000µg/L (JUA1) for Mg, from
95200µg/L (JAF2) to 788000µg/L (JUD3) for Ca, from
536µg/L (VIP3) to 25344µg/L (FRU5) for Mn, from 142µg/L
(VIT5) to 85612µg/L (OJA1) for Fe, from 5µg/L (VIP3) to
253µg/L (OJA3) for Ni, from 5µg/L (VIP3) to 1256µg/L
(JUS2) for Cu and from 43µg/L (VIP3) to 25862µg/L (JUD3)
for Zn. These strong variations explain the high values
obtained for standard deviation for Zn. The mean
concentrations obtained show the predominance of Ca with
an average value of 223616µg/L followed by Mg with an
average concentration of 193558µg/L. Mean concentrations
of Mn, Fe, Ni, Cu and Zn were 4960, 15809, 38, 151 and
3152µg/L respectively.
Table 4. Concentration ranges (µg/L) for trace elements in pineapple juices and syrups.
Parameters V Cr Co Mo
Number of samples Valid* 78 90 92 92
Not detected 14 2 0 0
Average 1.23 18.26 5.94 24.74
SD 1.85 15.99 2.56 13.25
Minimum 0.23 1.40 0.58 1.17
Maximum 12.50 70.50 17.10 58.70
Perentiles
25 0.47 8.22 4.40 15.20
50 0.69 13.10 5.61 19.05
75 1.22 22.53 6.87 31.88
*Samples with concentrations below the limit of quantification were not considered in the statistical analysis.
SD: Standard Deviation.

International Journal of Food Science and Biotechnology 2018; 3(2): 60-69 64
Elements such as vanadium (V), cobalt (Co), molybdenum
(Mo) and chromium (Cr) were relatively in low
concentrations or absent in the analysed fruit juices. These
trace elements were found in the following ranges: from
0.23µg/L (CHA1) to 12.50µg/L (JUD3) for V, from 0.58µg/L
(CHA4) to 17.10µg/L (JUD3) for Co, and finally from
1.17µg/L (CHA4) to 58.70 (CHA5) for Mo, and 1.40µg/L
(FRE4) to 70.50µg/L) for Cr. Mean values were 1.24µg/L,
18.26µg/L, 5.95µg/L, 24.74µg/L and 15.23µg/L for V, Co,
Mo and Cr respectively.
A classification of the elements in descending order of the
concentrations gives Mg>Ca>Mn> Fe> Cu> Zn> Ni for the
major and minor elements and Mo> Cr Co> V for the trace
elements. These results are consistent with a synthesis of
scientific results from different authors [3, 4, 6, 9, 10, 13, 14,
17] who obtained the ranges of concentrations of the
following elements: Mg (7000µg/L - 750000µg/L); Ca
(140µg/L - 980100µg/L), Mn (60µg/L - 23000µg/L); Fe
(9µg/L - 179200µg/L); Ni (40µg/L - 73370µg/L); Cu (ND –
490µg/L); Cr (ND - 2767µg/L) and Zn (40µg/L -
545900µg/L) where ND means "not detected".
The mean concentration of Mg was close to that obtained
by [9], whereas that of Zn was close to the value obtained by
[10] in pineapple juices but widely differed from those of
[11]. The highest grades were obtained by [11] for Fe, Ni and
Zn. Concentrations for Ni were slightly lower in commercial
pineapple juices from Benin whereas Cu shows slightly
higher values compared to the literature with the exception of
[8] which obtained a high value (2910µg/L) for grape juice
cultivated according to biological processes.
All things considered, the major elements (Mg and Ca) and
the minor elements with Mn and Fe at the upper end were
strongly present in the juices. The mean value of Ni (which
was equal to the median) was greater than the maximum
value of the literature [3, 4, 5, 6, 9, 10].
On the other hand, the Ca and Mg content were higher
than those obtained by [8] in grape juice, the same was true
for Fe, Mn and Zn. On the other hand, Cu values were lower
than those obtained by [8]
The concentrations of Ca were generally distributed
around the median value (219500µg/L) which was close to
the mean value (223616µg/L) with the exception of JUD2
(593000µg/L), JUD3 788000µg/L) and VIP3 (755000µg/L)
which were well above the two reference values (Figure 2).
The distribution of Mg concentrations around the median
(201000µg/L) and the mean (193558µg/L) was more uniform
than that of Ca. Some samples slightly deviate JUA1
(278000µg/L), CHA1 (268000µg/L), CHA2 (276000µg/L) and
OJA4 (273000µg/L) at the upper end of the mustache box and
JAF1 the lower end of the mustache box (Figure 2). The best
rates of Mn (Figure 3) could be explained by the processes
applied by the FRU unit which displays the highest Mn values
for FRU4, FRU5 and FRU6, with the respective concentrations
25225µg/L, 25344µg/L and 24981µg/L, followed closely by
VIB juice (VIB2, 19950µg/L) while the median value was
8707µg/L and the mean value was 5811µg/L.
Figure 2. Mustache box representation of macro-element concentrations (Ca and Mg).
These strong variations in concentrations could be
attributed to juice production processes. Indeed, [6] have
noted that laboratory-extracted juices generally contain less
Mn than commercially purchased juices and attribute this to
extraction processes rather than the acidity of the soils on
which the fruits were grown.
Fe concentrations in juices produced by the OJA unit
(Figure 3) vary from 41635µg/L (for OJA2) to 85612µg/L

65 Alassane Youssao Abdou Karim et al.: Quantitative Analysis of Mineral Elements in Commercial Pineapple Juices by
Inductively Coupled Plasma Mass Spectrometry (ICP-MS)
(for OJA1) and were significantly higher than those of other
processing units; the third quartile (2606µg/L) was much
lower (Table 3). All juices in this unit (OJA) exceeded the
threshold of 50,000 µg/L prescribed by the beverage quality
standards with the exception of OJA2 (Figure 3).
Figure 3. Box-mustache representation of micronutrient concentrations (Mn, Fe, Ni, Cu and 254 Zn).
Although Zn levels were relatively low, we observed a
heterogeneity of concentrations with JUD2 and JUD3
(17508µg/L and 25862µg/L respectively) well above the
average (1313µg/L), followed by SAN6, OJA3 and OJA1
(3501µg/L, 1649µg/L and 2627µg/L) while the 3rd quartile
(75% of the values were below this value) is 969µg/L. The
relatively low concentration Ni and Cu elements were more
homogeneous in pineapple juices with an average of 80µg/L
and 341µg/L respectively and a median of 80µg/L and
325µg/L respectively (Table 3). Except OJA3 (253µg/L) and
SAN4 (196µg/L) for Ni and OJA4 (4541µg/L) and JUS2
(1256µg/L) for Cu which deviate from the mean and median,
all other samples have concentrations concentrated around
these two values.
In conclusion Benin's pineapple juices were rich in minerals
and especially in Ca, Mg, Mn and Fe. These juices could be
used to improve nutritional health in all social strata. Indeed,
various authors have shown that maternal and infant mortality
and morbidity are directly or indirectly related to malnutrition
related to mineral deficiency [11, 12]. The antioxidant
properties of certain minerals contained in the fruit juices help
protect human health from free radical damage and oxidative
stress, and thereby prevent cardiovascular or degenerative
diseases, as well as certain cancers. The mineral elements exert
primordial functions in the biochemical processes of the
organism: they regulate the metabolism, facilitate the release
of energy and ensure important functions in the synthesis of
bones and tissues [11, 12, 13, 14].
Micronutrient deficiency is a dangerous form of
malnutrition caused by insufficient intake of essential
vitamins and minerals. About 30 minerals are known to be
essential for life and pineapple juices contain plenty of them.
While some of them such as Ca, Mg are needed in more or
less significant quantities (macronutrients), others are in the
order of trace or ultra-trace (trace elements). Elements such
as Cu, Fe, Ni, Zn and Mn were at the upper end of this scale
of trace elements and play an important role in biological
systems. This was the case of the chemical elements V, Mo,
Cr and Co which are necessary to smaller proportions
compared to the first ones. The concentrations of these
elements in the different samples were low (<80µg/L) but
were not uniform from one unit to another; they vary from
0.23µg/L (CHA1) to 12.50µg/L (JUD3) for V, 1.40µg/L
(FRE4) to 70.50µg/L (FRU3) for Cr, 0, 58µg/L (CHA4) to
17.10µg/L (JUD3) for Co and from 1.17µg/L (CHA4) to
58.70µg/L (CHA5) for Mo (Table 4). However, some units
were distinguished by relatively higher values than others
(Figure 4). This was JUD2 and JUD3 for the V and Co,
OJA1, OJA3 and OJA4 for the Co, JUS1 and JUS3 for the Cr
and CHA6 and CHA5 for the Mb. In isolation we can add to
this list FRE2 and JUA2 for the V and ALA1 for the Co.
The ranges of concentrations were in the same order of
magnitude compared to previous work [3, 4, 5, 6, 9, 10]
except [5] which recorded for Cr values of 2767µg/L and
[15], who obtained a value of 370µg/L for Co. However, for
V, [7] recorded 5µg/L whereas [15] obtained 52µg/L.

International Journal of Food Science and Biotechnology 2018; 3(2): 60-69 66
Figure 4. Box-mustache representation of trace element concentrations.
The average daily requirements for mineral elements are presented in Table below 5, showing a coherence of nutritional
requirements with the composition of pineapple juices in mineral elements.
Table 5. The average daily needs in mineral elements.
Elements Mg Ca Mn Fe Co Cu Zn Se V Ni Cr Mo
RDI (mg) 310 1000 10 18 2 0.9 8 8 1.5 0.25 0.025 0.034
RDI: Recommended daily intake
According to the classification of minerals, the macro-
elements are those needed in quantity greater than 50 mg/day,
among these are calcium and magnesium. The trace elements
are those needed in quantity less than 50 mg/day, namely:
iron, zinc, copper, manganese, molybdenum, etc. The data
obtained show that the consumption of pineapple juice at the
rate of one litre per day distributed between meals would
effectively meet the daily needs of minerals. Because of the
large amounts of essential and physiologically important
elements they contain, fruit juices often prove to be rich
sources of nutrients and valuable dietary supplements in the
event of mineral deficiencies [3, 7, 11, 13-16]. Considering
the total concentrations of elements, some studies relating to
the elementary analysis of fruit juices reveal that the daily
consumption of fruit juice can clearly shelter from the
recommended daily doses (RDI) for certain nutritionally
important elements required for infants, children, pregnant
women and adults [13, 15, 17, 18].
3.3. Comparative Analysis of Minerals in Commercial
Juices from Benin and France
One of the objectives of this research was to analyse the
average concentrations per unit of production in order to
study the compliance of Benin's juices with international
standards with reference values the concentrations of juices
sampled in France and analysed in the same conditions.
Tables 6 and 7, related to the variation of the composition of
juices in minerals according to the production units, present
the averages of the results of the analyses by unit of
manufacture, by country and the general average of the
concentrations in minerals. Overall, the concentrations of
macro-elements, micro-elements and trace elements in the
juices of Benin units were above these reference values
except for Mn. This could be the consequence of the high
Brix value which represent the dry matter content and which
shows that French commercial juices have been diluted. The
reversal of the trend for Mn can be seen through the average
concentration of Mn in Benin juices equal to 9472µg/L,
which was lower than that in French commercial juices,
which was 11343µg/L and the average which was equal to
9551µg/L. This is explained by the high values of this
element in commercial VIB juice from France with an
average of 19631µg/L, which was closely followed by FRU
juice from Benin with an average of 18515µg/L. Moreover,
the vanadium level in the juices was less than 10µg/L, the
Cobalt 15µg/L and the Molybdenum 50µg/L except the
67 Alassane Youssao Abdou Karim et al.: Quantitative Analysis of Mineral Elements in Commercial Pineapple Juices by
Inductively Coupled Plasma Mass Spectrometry (ICP-MS)
TROP juices with an average molybdenum content of
53.55µg/L. It should also be noted that the FRU juice
contains practically no vanadium (the content of which was
below the threshold of quantification).
3.4. Analysis of the Homogeneity of Commercial Juices in
Relation to Mineral Composition
The homogeneity analysis will consist in studying the
variability of the results averages of the quantitative analysis
of minerals and sugar levels around the median value for the
juices of each unit of production in relation to the sampling
parameters, the date of production, the area of cultivation
and/or production of the juice, which were generally close,
will also be discussed. According to [17], pineapple growing
areas in Benin are located in five of the eight Atlantic
townships of the Atlantic Department. The same was true of
exporters and intermediaries who were located in the
pineapple growing areas in the five townships of Abomey-
Calavi, Zè, Allada, Tori and Toffo. Wholesalers and retailers
were based in five markets: SèmèKraké (in Sèmè-Kpodji),
Dantokpa (in Cotonou), Zè, Sékou (Allada) and Sèhouè
(Toffo). Sèmè-Kraké and Dantokpa are the main sources of
supply for the regional market since they are often visited by
local and regional customers from Nigeria, Ghana, Burkina
Faso, Mali and Côte-d'Ivoire. The fruit and juice pineapple
processors are located in the Atlantic and Littoral
Departments; but most of them are not located in the
pineapple producing areas, but in the Littoral Department
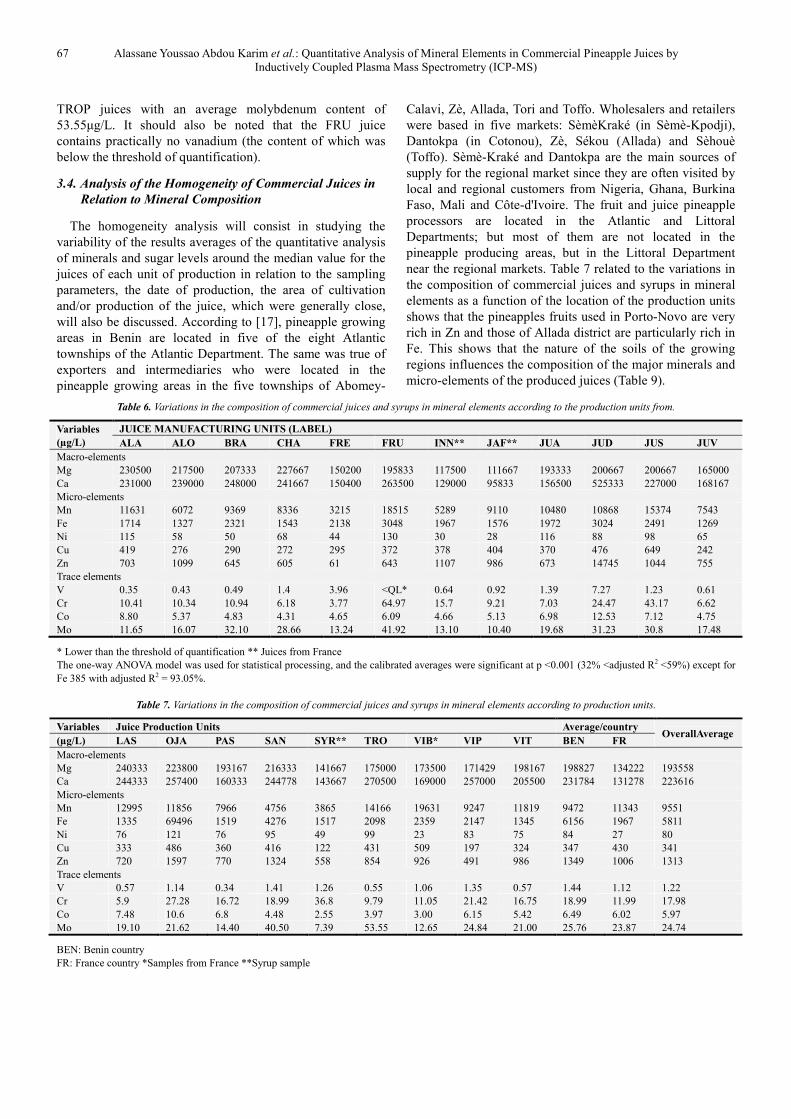
near the regional markets. Table 7 related to the variations in
the composition of commercial juices and syrups in mineral
elements as a function of the location of the production units
shows that the pineapples fruits used in Porto-Novo are very
rich in Zn and those of Allada district are particularly rich in
Fe. This shows that the nature of the soils of the growing
regions influences the composition of the major minerals and
micro-elements of the produced juices (Table 9).
Table 6. Variations in the composition of commercial juices and syrups in mineral elements according to the production units from.
Variables
(µg/L)
JUICE MANUFACTURING UNITS (LABEL)
ALA ALO BRA CHA FRE FRU INN** JAF** JUA JUD JUS JUV
Macro-elements
Mg 230500 217500 207333 227667 150200 195833 117500 111667 193333 200667 200667 165000
Ca 231000 239000 248000 241667 150400 263500 129000 95833 156500 525333 227000 168167
Micro-elements
Mn 11631 6072 9369 8336 3215 18515 5289 9110 10480 10868 15374 7543
Fe 1714 1327 2321 1543 2138 3048 1967 1576 1972 3024 2491 1269
Ni 115 58 50 68 44 130 30 28 116 88 98 65
Cu 419 276 290 272 295 372 378 404 370 476 649 242
Zn 703 1099 645 605 61 643 1107 986 673 14745 1044 755
Trace elements
V 0.35 0.43 0.49 1.4 3.96 <QL* 0.64 0.92 1.39 7.27 1.23 0.61
Cr 10.41 10.34 10.94 6.18 3.77 64.97 15.7 9.21 7.03 24.47 43.17 6.62
Co 8.80 5.37 4.83 4.31 4.65 6.09 4.66 5.13 6.98 12.53 7.12 4.75
Mo 11.65 16.07 32.10 28.66 13.24 41.92 13.10 10.40 19.68 31.23 30.8 17.48
* Lower than the threshold of quantification ** Juices from France The one-way ANOVA model was used for statistical processing, and the calibrated averages were significant at p <0.001 (32% <adjusted R2 <59%) except for
Fe 385 with adjusted R2 = 93.05%.
Table 7. Variations in the composition of commercial juices and syrups in mineral elements according to production units.
Variables Juice Production Units Average/country OverallAverage
(µg/L) LAS OJA PAS SAN SYR** TRO VIB* VIP VIT BEN FR
Macro-elements
Mg 240333 223800 193167 216333 141667 175000 173500 171429 198167 198827 134222 193558
Ca 244333 257400 160333 244778 143667 270500 169000 257000 205500 231784 131278 223616
Micro-elements
Mn 12995 11856 7966 4756 3865 14166 19631 9247 11819 9472 11343 9551
Fe 1335 69496 1519 4276 1517 2098 2359 2147 1345 6156 1967 5811
Ni 76 121 76 95 49 99 23 83 75 84 27 80
Cu 333 486 360 416 122 431 509 197 324 347 430 341
Zn 720 1597 770 1324 558 854 926 491 986 1349 1006 1313
Trace elements
V 0.57 1.14 0.34 1.41 1.26 0.55 1.06 1.35 0.57 1.44 1.12 1.22
Cr 5.9 27.28 16.72 18.99 36.8 9.79 11.05 21.42 16.75 18.99 11.99 17.98
Co 7.48 10.6 6.8 4.48 2.55 3.97 3.00 6.15 5.42 6.49 6.02 5.97
Mo 19.10 21.62 14.40 40.50 7.39 53.55 12.65 24.84 21.00 25.76 23.87 24.74
BEN: Benin country FR: France country *Samples from France **Syrup sample

International Journal of Food Science and Biotechnology 2018; 3(2): 60-69 68
Table 8. Variations in the composition of commercial juices and syrups in mineral elementsaccording to the location of the production units.
Townships/districts Ns Concentrations (in µg/L)
Average (Brix) Mg Ca Mn Fe Ni Cu Zn
ABOMEY 6 193333 156500 10480 1972 116 370 673 14.8
AKASSATO 6 207333 248000 9369 2321 50 290 645 14.7
ALLADA 13 218077 252154 10587 27764 93 379 1025 14.3
AVAKPA 9 216333 244778 4756 4061 93 369 1278 16.0
CALAVI 8 202500 178000 8883 1567 85 375 753 12.7
COME 6 165000 168167 7543 1269 65 242 755 12.7
COTONOU 7 171429 257000 9247 2147 83 197 491 13.1
EKPE 6 217500 239000 6072 1327 58 276 1099 15.2
FR 6 134222 131278 11343 1967 27 370 1006 11.6
LOGBOZOUKPA 6 195833 263500 18515 3048 130 372 643 14.1
PORTO-NOVO 9 177037 285815 6852 2344 62 359 5335 13.1
SEKOU 3 200667 227000 15374 2491 98 649 1044 13.7
SYR* (ABOMEY) 1 141667 143667 3865 1517 49 122 558 12.6
ZE 6 198167 205500 11819 1345 75 324 986 15.3
Ns: Number of samples collected. * Syrup was manufactured in Abomey
Table 9. Presentation of the samples with their identification codes.
TOWN/COUNTRY Ns SAMPLES IDENTIFICATION NAME
ABOMEY 7 JUA1- JUA6, SYR
AKASSATO 6 BRA1– BRA6,
ALLADA 13 CHA1 – CHA6, OJA1– OJA5, TRO1–
TRO2
AVAKPA 9 SAN1– SAN9
CALAVI 8 ALA1– ALA2, PAS1– PAS6
COME 6 JUV1– JUV6
COTONOU 7 VIP1 – VIP7
EKPE 6 ALO1– ALO6
FRANCE 6 JAF1– JAF2, INN1– INN2, VIB1– VIB2
LOGBOZOUKPA 6 FRU1– FRU6
PORTO-NOVO 9 FRE4– FRE5, LAS, JUD1– JUD3
SEKOU 3 JUS1– JUS3
ZE 6 VIT1– VIT6
TOTAL 92
Ns: Number of samples
In general, juices manufactured in urban areas, far from
production sites, were characterized by the lowest sugar
levels at the limit of the required threshold (Table 8). These
are the cities of Cotonou (13.1 Brix), Porto-Novo (13.1 Brix),
Abomey-Calavi (12.7 Brix) and Comé (12.7 Brix) unlike
rural areas such as AVAKPA (16.0 Brix). The juice
production units of these localities proceeds either to
systematic Brix corrections or the fruits were affected by the
conditions of transport and conservation before processing
into juice. This thesis of degradation of the quality and
especially of the sugars the atomic links of which were
destroyed is more concordant for several reasons. According
to Hotegni et al. [11, 12, 17, 20] the poor transportation
system and poor storage conditions at the wholesaler and
processor level and the lack of transport crates would be one
of the major causes of significant fruit loss. According to
these authors, pineapple is delivered under uncontrolled
conditions in "taxis" or "bachées" by independent drivers
hired by buyers. Also, fruits were exposed to sunlight for a
few hours, loading in trucks side by side and unconditioned
transport conditions would affect fruit quality Crisosto et al.,
1995 cited by [7]. However, it is well known that temperature
conditions affect the shelf life of fruit Nunes and Edmond
2002 in [7]. According to [12], the optimal storage
temperature for a long shelf life of pineapple is 10 °C while
the ambient temperature in the region fluctuates between
25 °C and 31 °C.
4. Conclusion
Globally, the major elements (Mg and Ca) and the minor
elements (Mn, Fe, Ni, Cu, Zn) were strongly present in
pineapple juices made in Benin. For all juice samples, Mn
and Fe were the most quantitatively represented micro-
elements, while Ni, Cu and Zn were weakly detected, with
the exception of juice of the JUAN unit where Zn is strongly
detected. It is noted that the soils of culture have a
determining role in the composition of the juices as well as
the conditions of transport which would affect the quality of
the juices, particularly with regard to the low level of Brix
degree.
The basic analysis shows that fruit juices in Benin have a
varied mineral composition with very high levels of certain
elements in some regions. These juices could be used as
dietary supplements [8] to stem malnutrition and improve
nutritional health in all social strata.
Trace and minor elements such as Co, Cr, Cu, Ni, Zn and
Se contained in juices do not contribute significantly to
nutritional requirements. The process of concentrating to
obtain pineapple syrup appears to cause a loss of sugars and a
significant variation in mineral concentrations either by loss
or gain. Further work may be carried out in the direction of
controlling these factors of influence on the nutritional
quality of pineapple juices and syrups.
Acknowledgments
We gratefully acknowledge the advice and assistance of
Andrew A. Erakhrumen, PhD/ Department of Forest
Resources and Wildlife Management/Faculty of Agriculture,
University of Benin, Benin City, Nigeria.

69 Alassane Youssao Abdou Karim et al.: Quantitative Analysis of Mineral Elements in Commercial Pineapple Juices by
Inductively Coupled Plasma Mass Spectrometry (ICP-MS)
References
[1] Institut National de la Statistique et de l’Analyse Economique (INSAE), Recensement général de la population, Cotonou- Bénin, 2007.
[2] Ministère de l’Agriculture, de l’Elevage et de la Pêche (MAEP), Rapport sur l’Ananas au Bénin, 2010.
[3] Szymczycha-Madeja, A.; Welna, M; Jedryczko, D.; Pohl P., Developments and strategies in the spectrochemical elemental analysis of fruit juices, Trends in Analytical Chemistry 2014. 55 pp. 68–80.
[4] Achigan-Dako, E. G.; Adjé, C. A.; N’Danikou, S.; Fassinou Hotegni, N. V.; Agbangla, C. and Ahanchédé, A., Drivers of conservation and utilization of pineapple genetic resources in Benin, SpringerPlus, 2014. 3:273, pp. 1-11. http://www.springerplus.com/content/3/1/273
[5] Francisco, J. A. P.; Raquel, P. F.; Cruz-lopes, G. L., Effects of pre- and post-harvest factors on the selected elements contents in fruit juices, Czech J. Food Sci. 2015, 33, 201 (4) pp. 384–391.
[6] McHard, J. A.; Winefordner, J. D. and Ting, Sik-Vung, Atomic Absorption Spectrometric Determination of Eight Trace Metals in Orange Juice following Hydrolytic Preparation, J. Agric. Food Chem. 1976, Vol. 24, No. 5, pp 950-953.
[7] Santos Froes, R. E.; Neto, W. B.; Couto Silva, N. O.; Naveira, R. L. P.; Nascentes, C. C.; da Silva, J. B. B, Multivariate optimization by exploratory analysis applied to the determination of microelements in fruit juice by inductively coupled plasma optical emission spectrometry, Spectrochimica Acta Part B 64 (2009) pp. 619–622.
[8] Miele, A.; Rizzdn, L. A., Nascimento de Queirdz, S. C. do; Gianelld, C, Physicochemical composition, minerals, and pesticide residues in organic grape juices. Food Science and Technology, 2014. DDI: http://dx.doi.org/10.1590/1678-457X.6540. ISSN 0101-2061
[9] Camara, M.; Diez, C. and Torija, E., Chemical characterization of pineapple juices and nectars. Principal component analysis, Food Chemistry 1995. 54 pp. 93-100.
[10] Akan, B. W.; Olusegun, O. A.; Adekunle, F. O., Trace metal levels in fruit juices and carbonated beverages in Nigeria.
Environ Monit Assess, 2009. 156: 303–306 DOI 10. 1007/s10661-008-0485-1.
[11] Fassinou Hotegni, V. N.; Lommen, W. J. M.; Van der Vorst, J. G. A. J., Agbossou, E. K. and Struik, P. C., Analysis of Pineapple Production Systems in Benin, Eds.: J.-N. Wünsche and L. G. Albrigo, Acta Hort. 2012. 928, ISHS pp. 47 – 58.
[12] Fassinou Hotegni, V. N.; Lommen, W. J. M.; Agbossou, E. K. and Struik, P. C., Influence of weight and type of planting material on fruit quality and its heterogeneity in pineapple [Ananas comosus (L.), 2016. Volume5 Article798 pp. 1 -16.
[13] World Health Organization (WHO), Expert Committee on Trace Metals in Human Nutrition. World Health Organization Tech. Rep. Ser. No. 532, 1973.
[14] World Health Organization (WHO), Trace Elements in human nutrition and health, Geneva, 1996.
[15] Tormen, L., Placido Torres, D.; Dittert, I. M.; Arau´ jo, R. G. O., Frescura, V. L. A.; Jose´ Curtius, A., Rapid assessment of metal contamination in commercial fruit juices by inductively coupled mass spectrometry after a simple dilution, Journal of Food Composition and Analysis 2011. 24 pp. 95–102.
[16] Perez, A. L.; Smith, B. W. and Anderson, K. A., Stable isotope and trace element profiling combined with classification models to differentiate geographic growing origin for three fruits: Effects of Subregion and Variety, J. Agric. Food Chem. 2006, 54, pp. 4506 - 4516.
[17] Fassinou Hotegni, N. V.; Lommen, W. J. M.; Van der Vorst, J. G. A. J.; Agbossou E. K. and Struik, P. C., Bottlenecks and Opportunities for Quality Improvement in Fresh Pineapple Supply Chains in Benin, International Food and Agribusiness Management Review, 2014. Volume 17 Issue 3, pp. 139 – 170.
[18] World Health Organization (WHO), Safety Evaluation of certain food additives and contaminants; Tin. WHO Food Additives Series No. 46. Joint FAO/WHO, 2001.
[19] https://s3.amazonaws.com/public-inspection.federalregister.gov/2016-11867.pdf (pages 903-904)
[20] Fassinou Hotegni, V. N., Lommen, W. J. M.; Agbossou E. K. and Struik, P. C., Understanding the effects of slip pruning on pineapple fruit quality, Acta Hortic. 2016. 1111. ISHS. DOI Eds.: J.-N. Wünsche and L. G. Albrigo Acta Hort. 928, ISHS 2012, pp. 231 - 240.