quantifying the value of hydropower
TRANSCRIPT
8/9/2019 Quantifying the Value of Hydropower
http://slidepdf.com/reader/full/quantifying-the-value-of-hydropower 1/78
2013 TECHNICAL REPORT
Quantifying the Value of Hydropower in the Electric
Grid: Final Report

8/9/2019 Quantifying the Value of Hydropower
http://slidepdf.com/reader/full/quantifying-the-value-of-hydropower 2/78

8/9/2019 Quantifying the Value of Hydropower
http://slidepdf.com/reader/full/quantifying-the-value-of-hydropower 3/78
DE-EE0002666
EPRI Project ManagerT. Key
ELECTRIC POWER RESEARCH INSTITUTE3420 Hillview Avenue, Palo Alto, California 94304-1338 PO Box 10412, Palo Alto, California 94303-0813 USA
800.313.3774 650.855.2121 [email protected] www.epri.com
Quantifying the Value ofHydropower in the Electric Grid:
Final Report1023144
Final Report, February 2013

8/9/2019 Quantifying the Value of Hydropower
http://slidepdf.com/reader/full/quantifying-the-value-of-hydropower 4/78
DISCLAIMER OF WARRANTIES AND LIMITATION OF LIABILITIES
THIS DOCUMENT WAS PREPARED BY THE ORGANIZATION(S) NAMED BELOW AS AN ACCOUNT OF WORK SPONSORED OR COSPONSORED BY THE ELECTRIC POWER RESEARCHINSTITUTE, INC. (EPRI). NEITHER EPRI, ANY MEMBER OF EPRI, ANY COSPONSOR, THEORGANIZATION(S) BELOW, NOR ANY PERSON ACTING ON BEHALF OF ANY OF THEM:
(A) MAKES ANY WARRANTY OR REPRESENTATION WHATSOEVER, EXPRESS OR IMPLIED, (I)WITH RESPECT TO THE USE OF ANY INFORMATION, APPARATUS, METHOD, PROCESS, ORSIMILAR ITEM DISCLOSED IN THIS DOCUMENT, INCLUDING MERCHANTABILITY AND FITNESSFOR A PARTICULAR PURPOSE, OR (II) THAT SUCH USE DOES NOT INFRINGE ON ORINTERFERE WITH PRIVATELY OWNED RIGHTS, INCLUDING ANY PARTY'S INTELLECTUALPROPERTY, OR (III) THAT THIS DOCUMENT IS SUITABLE TO ANY PARTICULAR USER'SCIRCUMSTANCE; OR
(B) ASSUMES RESPONSIBILITY FOR ANY DAMAGES OR OTHER LIABILITY WHATSOEVER(INCLUDING ANY CONSEQUENTIAL DAMAGES, EVEN IF EPRI OR ANY EPRI REPRESENTATIVEHAS BEEN ADVISED OF THE POSSIBILITY OF SUCH DAMAGES) RESULTING FROM YOURSELECTION OR USE OF THIS DOCUMENT OR ANY INFORMATION, APPARATUS, METHOD,PROCESS, OR SIMILAR ITEM DISCLOSED IN THIS DOCUMENT.
REFERENCE HEREIN TO ANY SPECIFIC COMMERCIAL PRODUCT, PROCESS, OR SERVICE BY ITS
TRADE NAME, TRADEMARK, MANUFACTURER, OR OTHERWISE, DOES NOT NECESSARILYCONSTITUTE OR IMPLY ITS ENDORSEMENT, RECOMMENDATION, OR FAVORING BY EPRI.
THE FOLLOWING ORGANIZATION PREPARED THIS REPORT:
Electric Power Research Institute(EPRI)
NOTICE
NEITHER THE UNITED STATES GOVERNMENT NOR ANY AGENCY THEREOF, NOR ANY OFTHEIR EMPLOYEES, MAKES ANY WARRANTY, EXPRESS OR IMPLIED, OR ASSUMES ANYLEGAL LIABILITY OR RESPONSIBILITY FOR THE ACCURACY, COMPLETENESS, ORUSEFULNESS OF ANY INFORMATION, APPARATUS, PRODUCT, OR PROCESS DISCLOSED, ORREPRESENTS THAT ITS USE WOULD NOT INFRINGE PRIVATELY OWNED RIGHTS.REFERENCE HEREIN TO ANY SPECIFIC COMMERCIAL PRODUCT, PROCESS, OR SERVICE BYTRADE NAME, TRADEMARK, MANUFACTURER, OR OTHERWISE DOES NOT NECESSARILY
CONSTITUTE OR IMPLY ITS ENDORSEMENT RECOMMENDATION, OR FAVORING BY THEUNITED STATES GOVERNMENT OR ANY AGENCY THEREOF.
THIS REPORT IS BEING DISSEMINATED BY THE DEPARTMENT OF ENERGY. AS SUCH, THEDOCUMENT WAS PREPARED IN COMPLIANCE WITH SECTION 515 OF THE TREASURYANDGENERAL GOVERNMENT APPROPRIATIONS ACT FOR FISCAL YEAR 2001 (PUBLIC LAW 106-554) AND THE INFORMATION QUALITY GUIDELINES ISSUED BY THE DEPARTMENT OFENERGY. THOUGH THIS REPORT DOES NOT CONSTITUTE “INFLUENTIAL” INFORMATION, ASTHAT TERM IS DEFINED IN DOE’S INFORMATION QUALITY GUIDELINES OR THE OFFICE OFMANAGEMENT AND BUDGET’S INFORMATION QUALITY BULLETIN FOR PEER REVIEW(BULLETIN), THE STUDY WAS REVIEWED BOTH INTERNALLY AND EXTERNALLY PRIOR TOPUBLICATION. FOR PURPOSES OF EXTERNAL REVIEW, THE STUDY BENEFITED FROM THE
ADVICE AND COMMENTS OF EIGHT MAJOR U.S. UTILITIES WITH EXISTING HYDROPOWER ASSETS, FEDERAL LABS, CONSULTANTS, AND HYDROPOWER EQUIPMENTMANUFACTURERS.
NOTE
For further information about EPRI, call the EPRI Customer Assistance Center at 800.313.3774 ore-mail [email protected].
Electric Power Research Institute, EPRI, and TOGETHER…SHAPING THE FUTURE OF ELECTRICITYare registered service marks of the Electric Power Research Institute, Inc.
Copyright © 2013 Electric Power Research Institute, Inc. All rights reserved.
8/9/2019 Quantifying the Value of Hydropower
http://slidepdf.com/reader/full/quantifying-the-value-of-hydropower 5/78
This publication is a corporate document that should be cited in the literature in the followingmanner:
Quantifying the Value of Hydropower in the Electric Grid: Final Report. EPRI, Palo Alto, CA:2013. 1023144.
iii
ACKNOWLEDGMENTSThe following organization prepared this report:
Electric Power Research Institute942 Corridor Park BlvdKnoxville, TN 37932
Principal InvestigatorsT. KeyL. RogersD. BrooksA. Tuohy
This report describes research sponsored by the U.S. Department of Energy. EPRI would like toacknowledge the support and contributions of the following organizations:
• HDR Engineering, Inc.
• Hydro Performance Processes Inc.
• Kirby Consulting
• LCG Consulting
• Oak Ridge National Laboratory
• Sandia National Laboratories
• AmerenUE
• Brookfield Power
• Chelan County PUD
• Duke Energy
• Exelon Generation
• Manitoba Hydro
• Tennessee Valley Authority
• Voith Hydro

8/9/2019 Quantifying the Value of Hydropower
http://slidepdf.com/reader/full/quantifying-the-value-of-hydropower 6/78
8/9/2019 Quantifying the Value of Hydropower
http://slidepdf.com/reader/full/quantifying-the-value-of-hydropower 7/78
v
ABSTRACT
The report summarizes research to Quantify the Value of Hydropower in the Electric Grid. This3-year DOE study focused on defining value of hydropower assets in a changing electric grid.Methods are described for valuation and planning of pumped storage and conventionalhydropower. The project team conducted plant case studies, electric system modeling, marketanalysis, cost data gathering, and evaluations of operating strategies and constraints. Five otherreports detailing these research results are available a project website, www.epri.com/hydrogrid.
With increasing deployment of wind and solar renewable generation, many owners, operators,and developers of hydropower have recognized the opportunity to provide more flexibility andancillary services to the electric grid. To quantify value of services, this study focused on theWestern Electric Coordinating Council region. A security-constrained, unit commitment and
economic dispatch model was used to quantify the role of hydropower for several future energyscenarios up to 2020. This hourly production simulation considered transmission requirements todeliver energy, including future expansion plans. Both energy and ancillary service values wereconsidered. Addressing specifically the quantification of pumped storage value, no single valuestream dominated predicted plant contributions in various energy futures. Modeling confirmedthat service value depends greatly on location and on competition with other available gridsupport resources. In this summary, ten different value streams related to hydropower aredescribed. These fell into three categories; operational improvements, new technologies, andelectricity market opportunities. Of these ten, the study was able to quantify a monetary value insix by applying both present day and future scenarios for operating the electric grid.
This study confirmed that hydropower resources across the United States contribute significantly
to operation of the grid in terms of energy, capacity, and ancillary services. Many potentialimprovements to existing hydropower plants were found to be cost-effective. Pumped storage isthe most likely form of large new hydro asset expansions in the U.S. however, justifyinginvestments in new pumped storage plants remains very challenging with current electricitymarket economics. Even over a wide range of possible energy futures, up to 2020, no energyfuture was found to bring quantifiable revenues sufficient to cover estimated costs of plantconstruction.
Value streams not quantified in this study may provide a different cost-benefit balance and aneconomic tipping point for hydro. Future studies are essential in the quest to quantify the full potential value. Additional research should consider the value of services provided by advancedstorage hydropower and pumped storage at smaller time steps for integration of variable
renewable resources, and should include all possible value streams such as capacity value and portfolio benefits i.e.; reducing cycling on traditional generation.
Keywords
Hydropower Energy and Ancillary Services MarketsConventional Hydropower Pumped StorageElectric Sector Modeling Hydro Plant OptimizationHydrologic Constraints Renewable Integration

8/9/2019 Quantifying the Value of Hydropower
http://slidepdf.com/reader/full/quantifying-the-value-of-hydropower 8/78
8/9/2019 Quantifying the Value of Hydropower
http://slidepdf.com/reader/full/quantifying-the-value-of-hydropower 9/78
vii
EXECUTIVE SUMMARY
Concerns about energy security and climate change are driving policies, regulations, and energymarkets to encourage new renewables, such as wind and solar, and reconsider traditionalrenewables, primarily hydropower. Many in the traditional hydropower industry, includingowners, operators, and developers, desire to better understand how these trends will affectinvestment decisions for conventional hydro and pumped storage. Examples of major policy andmarket changes that may affect the value of hydropower are the future limits on power plant CO2 emissions and the addition of a large amount of variable renewables. The market effects of either
of these could shift economic break points in favor of hydropower options, including the additionof pumped storage. Wind power, in particular, by its large scale and general availability at night,introduces system-balancing challenges that could make many hydropower assets more valuable.The question is, can the benefits be monetized to justify the cost of hydropower investments incurrent and future market structures?
To answer this question, the study looked at existing large hydropower operations in the U.S.,models for different electricity futures, markets, costs of existing and new technologies as well astrends related to hydropower investments in other parts of the world. The interest and participation of the hydro industry in this work was significant and included eight major U.S.utilities with existing hydropower assets, federal labs, consultants, and hydropower equipmentmanufacturers. The effort involved regular feedback on topic area presentations, progress
reviews, discussions, and resulted in a number of adjustments to the depth and direction of thework. Stakeholder interactions and inputs were sustained over approximately a thirty-month period, achieving the goal to create a broad industry collaborative effort.
Through these collaboration efforts, the work has contributed to and built on other relatedindustry efforts. Specifically, a whitepaper was written by the National HydropowerAssociation’s Pumped Storage Development Council entitled Challenges and Opportunities for
New Pumped Storage Development: A White Paper developed by NHA’s Pumped Storage Development Council that addresses some of the key issues facing pumped storage in the currentmarket and opportunities looking into the future. A recent U.S. Department of Energy (DOE)study on wind integration, entitled “Integrating Southwest Power Pool Wind Energy intoSoutheast Electricity Markets,” was completed that provided enhancements and insights in themodeling of wind. Lastly, work done by the Western Electric Coordinating Council (WECC) andthe National Renewable Energy Laboratory (NREL) to better define expansion planning withsolar and wind power was vital to the project.
The DOE Office of Energy Efficiency and Renewable Energy, Wind and Water Power Programsponsored the work: “Quantifying the Value of Hydropower in the Electric Grid” (under contractDE-EE0002666).
8/9/2019 Quantifying the Value of Hydropower
http://slidepdf.com/reader/full/quantifying-the-value-of-hydropower 10/78
viii
Completing a value analysis that included all the important assumptions and variables toaccurately and credibly predict the future value of hydropower plants to the transmission gridwas expected to be very challenging. In the past, electric capacity expansion models and resource plans have often taken ancillary services for granted and have tended to underestimate the potential value of hydropower. A key aim of this study was to overcome these historical
limitations. The main approach here has been to develop methods for valuation and resource planning of pumped storage and conventional hydropower projects. The project employedseveral industry analyses and modeling tools for quantifying the benefits provided byhydroelectric projects to the electric transmission grid. These tools were applied at all levels: thehydro unit, the plant, the balancing area, and at the regional electric system operator level.
A diverse team was assembled, made up of organizations with experience in grid modeling,hydropower costs, and electricity markets, as well as experts in hydropower operations.Assignments included plant case studies, electric system modeling, electricity market analysis,costing modernization and new hydro plants, valuing different operating strategies andconstraints, and policy impact analysis. The overall work scope was broken down into thefollowing specific tasks:
Task 1 - Case Studies on Plant Operations and Utilization
Task 2 - Modeling Approach and Base Case Scenario
Task 3 - Existing Electricity Markets and Opportunities in Future Markets
Task 4 - Systemic Plant Operating Constraints
Task 5 - Plant Cost Elements
Task 6 - Modeling Results for Future Scenarios
Task 7 - Effects of Alternative Policy Scenarios on Value of Hydropower
Task 8 - Result Synthesis and Dissemination (to affect planning and operating strategies)
Case Studies (Task 1) - The task of investigating existing plants via case studies capturedoperating experience and specific ideas for future plant optimization improvements fromoperators at eight plants in both the eastern and western U.S. The case studies showed that hydrofacilities in both structured market and non-market areas have opportunities to improve plantefficiency, leading to a more economic operation with the same water resource (particularly ifthe energy market is more lucrative than the ancillary services market). Conventional and pumped storage plants in non-market areas operated most efficiently. In general, a potentialincrease of 1% - 3% in revenue could be expected from optimizing plant operations. For detailedcase study results on pumped storage and conventional hydropower plants, refer to the EPRIreports Results from Case Studies of Pumped Storage Hydroelectric Plants (1023142) and
Results from Case Studies of Conventional Hydroelectric Plants (1023143).
Electric Sector Modeling (Task 2) - Detailed electric system modeling was carried out for theWECC region of the U.S. and Canada. WECC was selected because of the expected growth inrenewable generation and strong interest in pumped storage development. This region representsabout 20% of the electricity use in the U.S. and Canada. The hourly modeling was set up toconsider the role of hydropower with other renewable and non-renewable generation in theelectricity sector. It consisted of a grid security-constrained unit commitment with economic
8/9/2019 Quantifying the Value of Hydropower
http://slidepdf.com/reader/full/quantifying-the-value-of-hydropower 11/78
ix
dispatch, load shapes, TEPPC 2019 transmission expansion plan, consideration of likelygeneration capacity expansions, and within-hour reserve requirements. The 2010 and 2020reference cases were developed to characterize hydropower plants performance against regionalfuel mix, demand for energy, ancillary services, plant capability, and price metrics. For moredetails on the base case scenario and modeling approach, refer to the EPRI report Quantifying the
Value of Hydropower in the Electric Grid: Modeling Approach and Base Case Scenario (1023139).
Markets (Task 3) – Existing and future electricity markets for energy and ancillary serviceswere analyzed across the United States looking specifically at the role of hydropower. In particular, the role for ancillary services for hydro generation assets was investigated. The studyfound many different potential sources of revenue, and no single dominant value stream. It wasconfirmed that the value of services depends greatly on location and on the competition withother available grid support resources in a balancing region. Also, current market structures donot fully capture the actual costs and benefits from hydropower projects. For more details on themarket structures in the United States, refer to the Sandia National Laboratories reportQuantifying the Value of Hydropower in the Electric Grid: Role of Hydropower in Existing
Markets (SAND2011-1009).
Operating Constraints (Task 4) - In nearly all practical cases, hydro plant operations will needto respect other systemic plant operating constraints. There are significant constraints in theWECC including water availability, irrigation, minimum flows and other environmentalrequirements related to fish passage as well as water reservoir/river recreational needs. Thesemay be less of a concern for new off-channel pumped storage plants specifically designed and built to provide grid services, as opposed to the multi-purpose pumped storage schemes built inthe 20th century, which also focused on water supply. For example, designs such as closed-loop pumped storage are aimed to mitigate some of these environmental constraints. In general, theoperating constraints are likely to impact the profitability of the plant especially in areas withmore stringent requirements. A sample of the effects of these types of operating constraints in themid-west can be found in the Oak Ridge National Laboratory report, Case Study: Hydropower
Constraints on OSAGE and TAUM SAUK Facilities (ORNL/TM-2012/232).
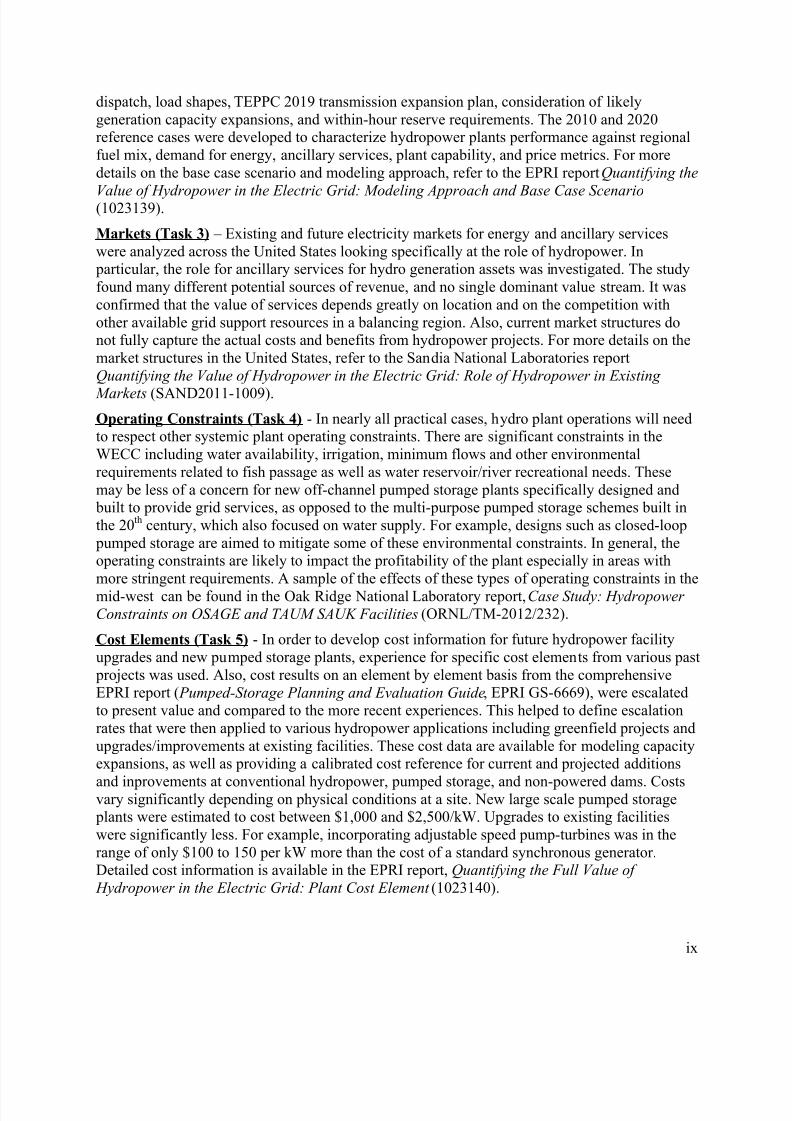
Cost Elements (Task 5) - In order to develop cost information for future hydropower facilityupgrades and new pumped storage plants, experience for specific cost elements from various past projects was used. Also, cost results on an element by element basis from the comprehensiveEPRI report ( Pumped-Storage Planning and Evaluation Guide, EPRI GS-6669), were escalatedto present value and compared to the more recent experiences. This helped to define escalationrates that were then applied to various hydropower applications including greenfield projects andupgrades/improvements at existing facilities. These cost data are available for modeling capacityexpansions, as well as providing a calibrated cost reference for current and projected additions
and inprovements at conventional hydropower, pumped storage, and non-powered dams. Costsvary significantly depending on physical conditions at a site. New large scale pumped storage plants were estimated to cost between $1,000 and $2,500/kW. Upgrades to existing facilitieswere significantly less. For example, incorporating adjustable speed pump-turbines was in therange of only $100 to 150 per kW more than the cost of a standard synchronous generator.Detailed cost information is available in the EPRI report, Quantifying the Full Value of
Hydropower in the Electric Grid: Plant Cost Element (1023140).

8/9/2019 Quantifying the Value of Hydropower
http://slidepdf.com/reader/full/quantifying-the-value-of-hydropower 12/78
x
Electric System Modeling Future Scenarios (Task 6) - Based on work begun in the referencecase hydro modeling, four additional energy futures for the year 2020 were evaluated based ondifferent assumptions. These 2020 futures covered the range of renewable deployment, CO2 prices, natural gas prices and other market factors. In total twenty-three scenarios were run usingthe four energy futures to capture the value of both energy and ancillary services with increased
reserve requirements from wind and solar. In general, the results showed that increases in systemrequirements for flexible reserves could double the income of pumped storage plants. Inaddition, when modeling pumped storage plants with increased operating capacity or variablespeed pumps, the average income of the plant increased between 60% and 80%. Based on the2020 hourly modeling, the average annual market income of the conventional plants ranged from$175/kW to $291/kW, while the pumped storage ranged from $22/kW to $48/kW depending onthe WECC region in which the plants were sited. The capacity value of hydropower technologieswas not assessed. For detailed results from the modeling of future scenarios, refer to the EPRIreport Quantifying the Value of Hydropower in the Electric Grid: Modeling Results for Future
Scenarios (1023141).
Details of the specific elements of the overall study are covered in individual reports available at
www.epri.com/hydrogrid.
Synthesizing Results and Effects to the Value of Hydropower (Task 7 & 8)
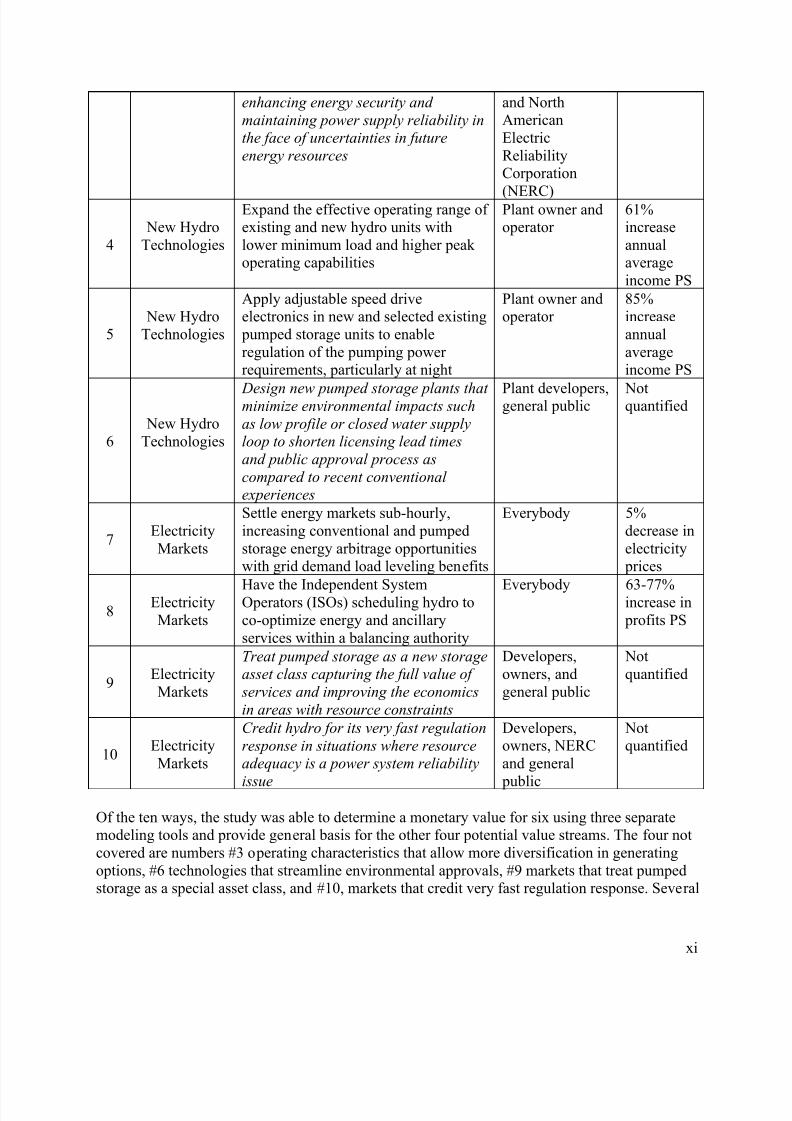
This report summary provides the key conclusions and synthesizes all the results intorecommendations of how to better capture the value of hydropower resources in the electricityenterprise. From the step-by-step project development, tasks areas of investigation, andinteractions with key stakeholders, we are able to point out ten ways to potentially increase thevalue of hydropower to electric grid services. In this final report of the study, ten different valuestreams related to hydropower grid services are described. These are non-overlapping andidentified as operational improvements, new technology advantages, or electricity marketopportunities. Six of these ten value streams are included in this study and the other four (initalics below) are not. The value streams that were not quantified in this study may provide adifferent cost benefit balance and an economic tipping point for hydro. Ways to account for thevalue of hydropower, and the implied opportunities, are summarized in Table ES-1:
Table ES-1 Ways to increase the value of hydropower
No.Value
StreamsWays to Increase Value Beneficiaries
Potential
Value
1Operational
Improvements
Identify and make plant efficiencyimprovements by modifying hydro unitoperations while respecting riversystem optimizations and constraints
Plant owner 1-3%revenueincrease
2Operational
Improvements
Use hydro more frequently to addressother generation and load variability inthe power system, providing flexiblereserves, reducing wear and tear on thethermal fleet, while increasing theefficiency of other generation
System operatoror verticallyintegrated utility
40%annualrevenueincrease PS
3Operational
Improvements Recognize hydro for allowing more
generation diversity and options, thus
National interest,general public,
Notquantified
8/9/2019 Quantifying the Value of Hydropower
http://slidepdf.com/reader/full/quantifying-the-value-of-hydropower 13/78
xi
enhancing energy security and
maintaining power supply reliability inthe face of uncertainties in future
energy resources
and NorthAmericanElectricReliabilityCorporation
(NERC)
4 New HydroTechnologies
Expand the effective operating range ofexisting and new hydro units withlower minimum load and higher peakoperating capabilities
Plant owner andoperator
61%increaseannualaverageincome PS
5 New HydroTechnologies
Apply adjustable speed driveelectronics in new and selected existing pumped storage units to enableregulation of the pumping powerrequirements, particularly at night
Plant owner andoperator
85%increaseannualaverageincome PS
6 New HydroTechnologies
Design new pumped storage plants thatminimize environmental impacts such
as low profile or closed water supplyloop to shorten licensing lead times
and public approval process as
compared to recent conventionalexperiences
Plant developers,general public Notquantified
7ElectricityMarkets
Settle energy markets sub-hourly,increasing conventional and pumpedstorage energy arbitrage opportunitieswith grid demand load leveling benefits
Everybody 5%decrease inelectricity prices
8ElectricityMarkets
Have the Independent SystemOperators (ISOs) scheduling hydro toco-optimize energy and ancillaryservices within a balancing authority
Everybody 63-77%increase in profits PS
9ElectricityMarkets
Treat pumped storage as a new storageasset class capturing the full value of
services and improving the economics
in areas with resource constraints
Developers,owners, andgeneral public
Notquantified
10ElectricityMarkets
Credit hydro for its very fast regulation
response in situations where resourceadequacy is a power system reliability
issue
Developers,owners, NERCand general
public
Notquantified
Of the ten ways, the study was able to determine a monetary value for six using three separatemodeling tools and provide general basis for the other four potential value streams. The four notcovered are numbers #3 operating characteristics that allow more diversification in generatingoptions, #6 technologies that streamline environmental approvals, #9 markets that treat pumpedstorage as a special asset class, and #10, markets that credit very fast regulation response. Several
8/9/2019 Quantifying the Value of Hydropower
http://slidepdf.com/reader/full/quantifying-the-value-of-hydropower 14/78
xii
of these value streams provide broad public benefit and longer-term energy security, but are not
easy to monetize.
Based on those value streams that could be monetized in competitive electricity markets, thisstudy identifies many cost-effective improvements to existing hydropower plants. However, over
the range of possible energy futures, standard cost/benefit analysis shows that market revenues
alone (within existing market structures) do not provide enough value to justify the constructionof pumped storage hydro plants in the U.S. in 2020. The value streams that were not quantified
in this study may provide a different cost benefit balance and an economic tipping point for
hydro. Future studies are essential in the quest to quantify the full potential value. Researchshould consider the value of services provided by advanced storage hydropower and pumped
storage at smaller time steps for integration of variable renewable resources, and should include
all possible value streams such as capacity value and portfolio benefits i.e.; reducing cycling on
traditional generation.
Key stakeholder input argues that development of new hydro generation assets has stalled for
many years. Stakeholders stated that policy and market incentives have been insufficient to
overcome permitting difficulties and financial risks. However, hydro resources, particularly
pumped storage are expected to play a more prominent role as the need for flexibility in thesystem increases. Furthermore, as the evolution of wholesale markets expands and markets
become more fine-tuned through application of “Pay for Performance,” compensation
opportunities to flexible and quick-response resources such as pumped storage may increase thefinancial and economic incentives to more fully utilize existing facilities.
This could, in turn,
provide incentives to build new pumped storage facilities.
As shown for each of these value streams, the benefits are spread around among different
stakeholders. Some of the value streams are not well defined and recognized and others arehighly dependent on local conditions and the state of competing energy resources. A standard
cost-benefit analysis is complicated with time-dependent variables and cannot by itself capture
full value. This study has aimed to highlight all of the different elements of the actual costs and benefits from hydropower projects that are not fully recognized under existing policies and
market structures.
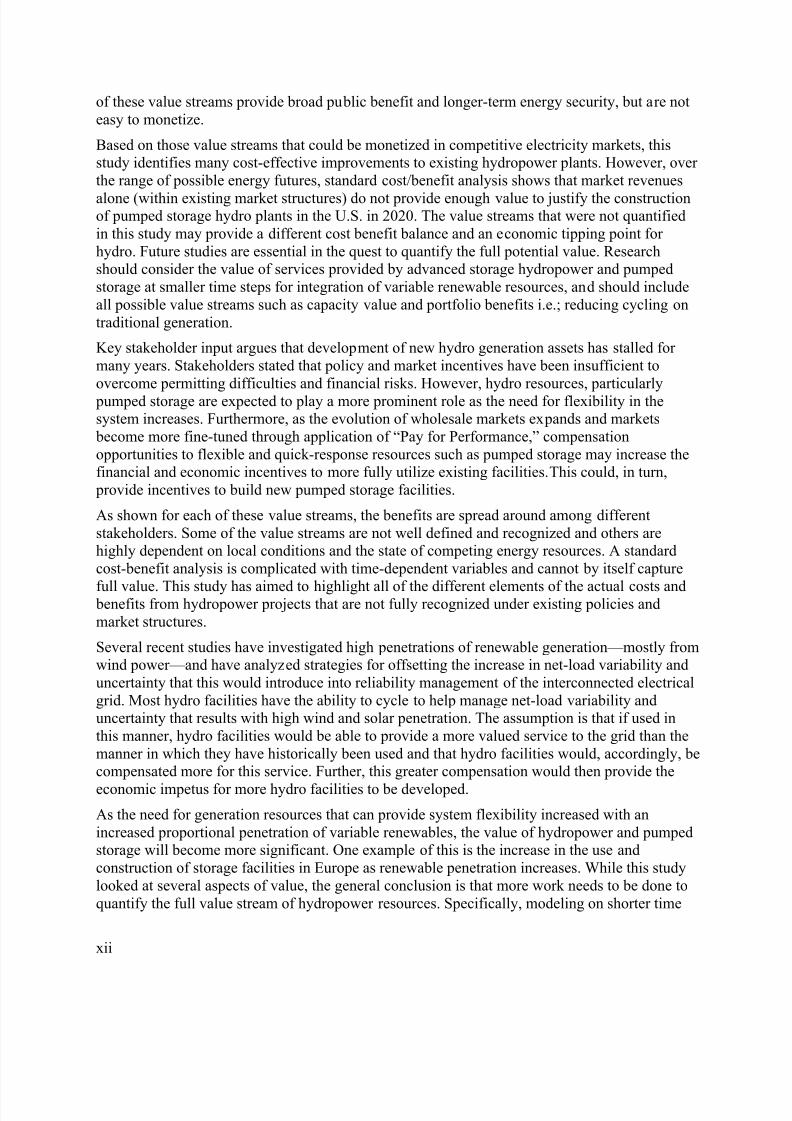
Several recent studies have investigated high penetrations of renewable generation—mostly fromwind power—and have analyzed strategies for offsetting the increase in net-load variability and
uncertainty that this would introduce into reliability management of the interconnected electrical
grid. Most hydro facilities have the ability to cycle to help manage net-load variability anduncertainty that results with high wind and solar penetration. The assumption is that if used in
this manner, hydro facilities would be able to provide a more valued service to the grid than the
manner in which they have historically been used and that hydro facilities would, accordingly, becompensated more for this service. Further, this greater compensation would then provide the
economic impetus for more hydro facilities to be developed.
As the need for generation resources that can provide system flexibility increased with an
increased proportional penetration of variable renewables, the value of hydropower and pumpedstorage will become more significant. One example of this is the increase in the use and
construction of storage facilities in Europe as renewable penetration increases. While this study
looked at several aspects of value, the general conclusion is that more work needs to be done to
quantify the full value stream of hydropower resources. Specifically, modeling on shorter time

8/9/2019 Quantifying the Value of Hydropower
http://slidepdf.com/reader/full/quantifying-the-value-of-hydropower 15/78
xiii
scales may be beneficial to capture the value on a within-hour basis. The new DOE project led by Argonne National Laboratory will follow the work discussed here and focus directly on thisuncertainty and granularity. Additionally, work needs to be done to better understandhydropower’s role in supporting a reliable grid and preparing the power system for an uncertainenergy market future. These are items that benefit the electric grid (e.g black-start capability),
but are hard to quantify and attribute to one technology or another on a countrywide scale.Ultimately, hydropower will have to compete with other generation resources, demand response,and better forecasting within the market and non-market structures efficiently and effectively tocapture value.
Overall, this study has aimed to assist the utility and hydroelectric industries to better understandthe value and economic viability of existing and future hydropower assets providing both energyand ancillary services. It shows how value will be sensitive to different future energy scenariosincluding high levels of renewable integration, variations in fossil plant operations andcommodity prices such as CO2 credits and natural gas. Results will also be useful in formulating policies and regulations, for developing fair markets, and for investing in energy andtransmission infrastructure to ensure energy security and to address climate change concerns.
Uses include quantifying benefits provided by conventional and pumped storage hydro projectsto the transmission grid, validating a power and market systems model, analyzing scenarios, andexamining the implications of alternative market structures.

8/9/2019 Quantifying the Value of Hydropower
http://slidepdf.com/reader/full/quantifying-the-value-of-hydropower 16/78

8/9/2019 Quantifying the Value of Hydropower
http://slidepdf.com/reader/full/quantifying-the-value-of-hydropower 17/78

8/9/2019 Quantifying the Value of Hydropower
http://slidepdf.com/reader/full/quantifying-the-value-of-hydropower 18/78
xvi
Scheduling Energy .........................................................................................................3-16
Ancillary Services ...........................................................................................................3-21
Extending Co-optimization .............................................................................................3-23
Treat Pumped Storage as a New Storage Asset Class ..................................................... 3-23
Credit Hydro for Fast Regulation .......................................................................................3-244 Conclusions & Future REsearch .............................................................................................4-1
Ten Ways to Increase the Value of Hydropower Assets ........................................................ 4-1
Looking Ahead ........................................................................................................................4-3
5 References ..............................................................................................................................5-1
A Recent Enhancements to Market Access for Energy Storage Technologies ........................ A-1
8/9/2019 Quantifying the Value of Hydropower
http://slidepdf.com/reader/full/quantifying-the-value-of-hydropower 19/78
xvii
LIST OF FIGURES
Figure 1-1 Strategic approach to valuing hydropower ............................................................... 1-1
Figure 2-1 Organization structure of North American electric industry ...................................... 2-1
Figure 2-2 Typical operational constraints on hydropower facilities........................................... 2-5
Figure 2-3 Pump Storage use in night to day energy shifting .................................................... 2-6
Figure 2-4 Grid power control issue and energy management timeframes ............................... 2-7
Figure 2-5 Change in renewable energy generation in Germany .............................................. 2-7
Figure 2-6 Head and power ranges of modern advanced pumped storage equipment ............. 2-8
Figure 2-7 Relative grid service capability of advanced pumped storage units ......................... 2-9
Figure 2-8 Mode change times for various advanced PS concepts ......................................... 2-10
Figure 2-9 Timeframes for modern advanced PS unit regulation ............................................ 2-10
Figure 3-1 Conventional and pumped storage case study locations ......................................... 3-2
Figure 3-2 Difference in Conventional hydro performance with increased reserves.................. 3-5
Figure 3-3 Difference in pumped storage performance with increased reserves....................... 3-6
Figure 3-4 Difference in starts and stops with increased pumped storage ................................ 3-6
Figure 3-5 Pumped storage units balancing forecast error ........................................................ 3-7
Figure 3-6 Timeframes for advanced pumped storage unit regulation .................................... 3-11
Figure 3-7 Ancillary service procurement with and without hydro participation ....................... 3-14
Figure 3-8 Conventional plant revenues ($1000) in base case ............................................... 3-15
Figure 3-9 Ancillary service and energy revenue when adding one new pumped storageplant ................................................................................................................................. 3-15
Figure 3-10 Pumped storage revenues ($1000) in base scenario ........................................... 3-16
Figure 3-11 A fossil fueled generator maximizes its profits by bidding its variable cost;$35/MWh in this example ................................................................................................. 3-17
Figure 3-12 Variable renewables bid zero or negative and typically clear the marketevery hour they are available. .......................................................................................... 3-18
Figure 3-13 Hourly energy markets do not optimize the scheduling of energy-limited
hydro. ............................................................................................................................... 3-19
Figure 3-14 Energy-limited hydro must either explicitly schedule production duringexpected high price hours or it must bias its offer price during expected lower pricehours ................................................................................................................................ 3-20
Figure 3-15 Pumped storage operators must forecast both high and low prices andadjust both the buy and sell bids based on both the expected buy and sell prices .......... 3-21

8/9/2019 Quantifying the Value of Hydropower
http://slidepdf.com/reader/full/quantifying-the-value-of-hydropower 20/78
xviii
Figure 3-16 Energy-limited hydro cost to supply spinning reserve depends on the hour itis delivered and on how many other hours of spin are being provided ............................ 3-22
Figure 3-17 Example of pumped storage as a new storage asset ........................................... 3-24

8/9/2019 Quantifying the Value of Hydropower
http://slidepdf.com/reader/full/quantifying-the-value-of-hydropower 21/78
xix
LIST OF TABLES
Table ES-1 Ways to increase the value of hydropower .............................................................. 10
Table 2-1 Functions and services provided by generation [14] ................................................. 2-3
Table 2-2 Pumped Storage Construction Cost Data [9] ........................................................... 2-11
Table 2-3 Energy futures and modeling scenarios .................................................................. 2-13
Table 3-1 Operational ways to increase the value of hydropower ............................................. 3-1
Table 3-2 Conventional hydro performance by region with increased reserverequirements ...................................................................................................................... 3-4
Table 3-3 Pumped storage performance by region with increased reserve requirements......... 3-5
Table 3-4 Drivers leading to energy storage investment in Europe ........................................... 3-8
Table 3-5 Installed and planned pumped storage developments in Europe and U.S. [3] .......... 3-9
Table 3-6 Technological ways to increase the value of hydropower.......................................... 3-9
Table 3-7 Performance of pumped storage plants with upgrades ........................................... 3-10
Table 3-8 Features and benefits of variable speed pumped storage [6] .................................. 3-11
Table 3-9 Performance of variable speed pumped storage units ............................................ 3-12
Table 3-10 New variable speed pumped storage plant performance ...................................... 3-12
Table 3-11 Market ways to increase the value of hydropower ................................................. 3-13
Table 4-1 Ways to increase the value of hydropower ................................................................ 4-2

8/9/2019 Quantifying the Value of Hydropower
http://slidepdf.com/reader/full/quantifying-the-value-of-hydropower 22/78

8/9/2019 Quantifying the Value of Hydropower
http://slidepdf.com/reader/full/quantifying-the-value-of-hydropower 23/78
1-1
1INTRODUCTION
In the last 25 years, U.S. development of new hydropower, both conventional and pumpedstorage, has faced multiple challenges. These include limited siting opportunities, large initialcapital investment requirements, and diverse value streams that have been difficult to quantify ina deregulated electric sector. Hydropower has generally not been considered in planning forgeneration capacity planning. Day-to-day grid operation decisions in resource selection andelectricity production are driven by economic dispatch, resource allocations, unit commitment,and the selection of required reserve resources. Hydropower must compete with many otherenergy and ancillary services generation options as well as load demand response alternatives.
Development of new hydropower plants has been stalled, in part, due to the lack of clearfinancial incentives and stable, long term energy markets to compensate for the cost of permitting and constructing new facilities. In the coming years, wind and solar generation areexpected to increase volatility and uncertainty in the electric grid. Hydropower, including pumped storage, has the potential to help manage these variable resources. However, it has beendifficult to capture the full and long-term value that hydropower may bring.
Given the challenges, the goal of this project has been to identify and calculate the value ofenergy production, services, and reliability attributes of hydropower. The approach has been todefine the flexibility and limitations of existing hydropower plants, simulate operations in an
economic model for present and future scenarios, analyze the operating constraints andopportunities, develop cost data, and evaluate existing and potential market operations throughindustry outreach and feedback. This analysis, and the detailed modeling, has focused on theWECC area because of the traditional importance of hydropower and the significant growth invariable wind and solar generation in the region. Figure 1-1 shows the strategic approach forquantifying the value of hydropower is defined by four components.
Figure 1-1 Strategic approach to valuing hydropower
•Hourly economic dispatch model of WECCwith sub-hourly reserve requirements
Economic value of Hydro
•Market comparison, gaps &recommendations
Market Structure
•Hydrological constraints
•Operational opportunitiesOperational Experiences
• New technologies, upgrades, and costsTechnologies & Costs

8/9/2019 Quantifying the Value of Hydropower
http://slidepdf.com/reader/full/quantifying-the-value-of-hydropower 24/78
1-2
This final report summarizes findings of the study and defines the current state of hydropower inthe U.S. including market structures and operational experiences. Ten opportunities to increaseor further capture the value of hydropower through operations, technology, and markets aredefined.
8/9/2019 Quantifying the Value of Hydropower
http://slidepdf.com/reader/full/quantifying-the-value-of-hydropower 25/78
8/9/2019 Quantifying the Value of Hydropower
http://slidepdf.com/reader/full/quantifying-the-value-of-hydropower 26/78
2-2
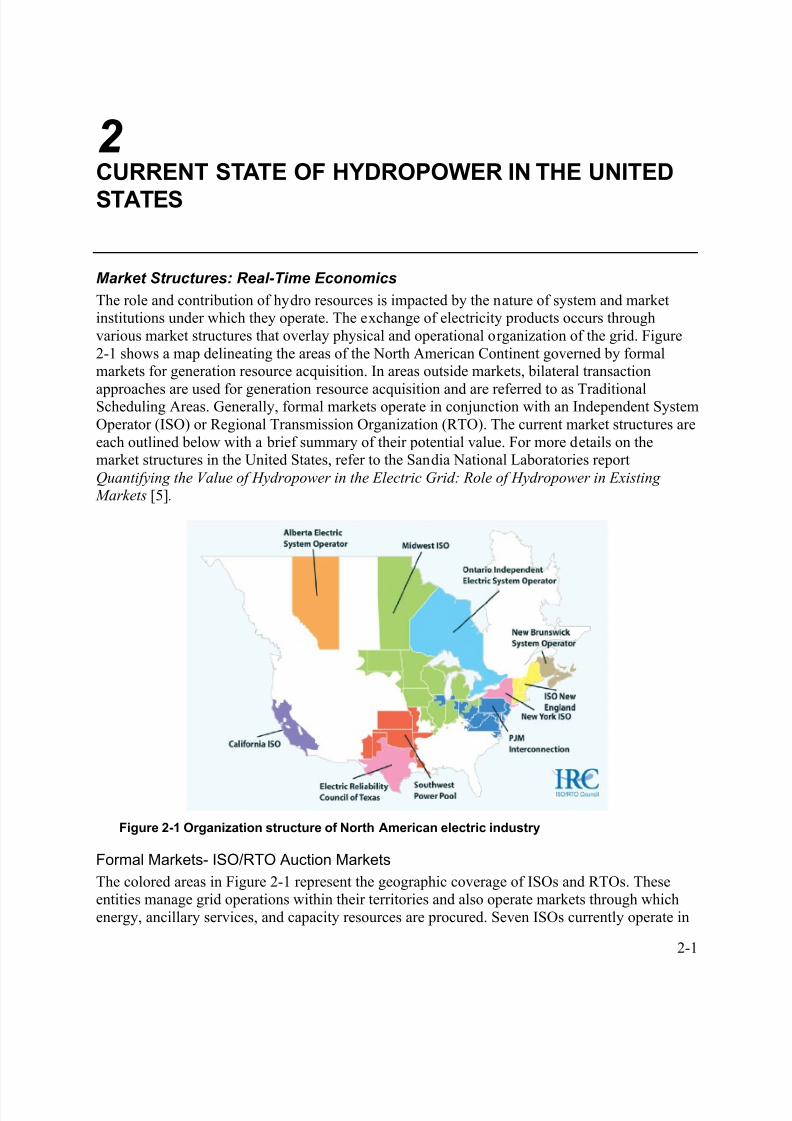
the U.S. (several of which extend operations into Canada). Like all U.S.-based TransmissionService Providers, ISOs are required to file Open Access Transmission Tariffs (OATTs) with theFederal Energy Regulatory Commission (FERC). OATTs define and implement marketdefinitions and operations and specify details of accounting and settlement procedures. Market participants within these areas must file substantial technical and financial paperwork with the
ISO, have their generation assets tested and approved to meet the technical engineering standardsrequired to implement North American Electric Reliability Corporation (NERC) reliabilitystandards, and demonstrate that they are financially sound. In formal markets, individualgenerator owners, merchant plants, independent power producers (IPPs), and demand-sideresources bid to provide energy and ancillary services based on financial incentives and profitmotive. These productions do not carry the traditional “obligation to serve” end-use demand in a particular service territory.
Non-Market Traditional Scheduling Areas
Traditional Scheduling Areas (non-market areas) consist of regulated utilities that havemaintained their historical vertically integrated organization, planning, and operating models, i.e.
Southeast Reliability Corporation (SERC) and the Florida Reliability Coordinating Council(FRCC). They are regulated by state public utility regulatory authorities as well as by FERC andhave an obligation to serve the load within their defined territory unlike formal markets.Operators schedule energy and power transactions, and coordinate operations as well as systemexpansion planning to maintain grid reliability following the same NERC criteria. Entities mayengage in bi-lateral trades with other adjacent utilities in order to meet their obligations. Noformal markets exist in these traditional scheduling areas.
Mixed Business Model
The mixed business model is characteristic of NERC Regional Entities, which contain acombination of market and non-market areas within their boundaries. The WECC represents a
mixed model due to the presence of formal markets under the California Independent SystemOperator (CAISO) and Alberta Electric System Operator (AESO) with the balance governed bya system very much like that in the southeast U.S. The presence of formal markets in the WECC, particularly the CAISO market, presents opportunities and obligations to generation asset ownerswhose assets exist outside of the CAISO borders. They are still used to meet load-servingobligation within their Balancing Areas, but they can also bid their assets into the Californiamarket. There are also informal bilateral wholesale markets in the WECC. Having a mixed business model presents the opportunity for more value streams than in solely a traditionalscheduling or formal market area.
Significance of Real-Time Markets
As the competitive business model continues to expand into or influence non-market areas,change will continue to take place. The variety of physical, operational and market organizationstructures makes it difficult to generalize about the methods, procedures, and effects of hydrogeneration participation now and in the future. The same can be said for the integrating largeamounts of variable generation capacity into the existing capacity mix. However, oneameliorating factor tending to simplify this otherwise complex situation is that fundamentaleconomic behavior driven by cost minimization provides a common foundation that underlies the behavior of participants in both market and non-market segments of the industry. Formal
8/9/2019 Quantifying the Value of Hydropower
http://slidepdf.com/reader/full/quantifying-the-value-of-hydropower 27/78
2-3
electricity markets sharpen the profit incentives of all participants, including those that aresubject to some, or even considerable regulation. The role of formal markets is likely to grow inthe WECC region; marketers of western hydroelectric power can benefit by responding to thesedevelopments.
One set of questions concerns both how and how well models can represent traditional cost-minimization objectives as well as new market opportunities for increasingly monetizing thevalue of the hydroelectric assets that it markets. Hydropower resources across the United Statescontribute significantly to the reliability of the grid in terms of energy, capacity, and ancillaryservices. Hydro plants have been used to provide spinning and non-spinning reserve,replacement reserve, and regulation or load following. These services are not fully recognized inthe current non-market areas due to the hourly scheduling structure. In addition to this study, theDOE is now funding a project led by Argonne National Laboratory. The new project is entitled Detailed Analysis to Demonstrate the Value of Advanced Pumped Storage Hydropower in theU.S. and will focus on modeling finer time scales, on the order of seconds, to capture the valuestreams available for ancillary services provided by pumped storage facilities that are not being
captured in the current market structure. It should be noted that many conventional hydropower plants currently provide the same fast-ramping ancillary services that are offered by pumpedstorage facilities.
Role of Generation and Contribution of Hydro
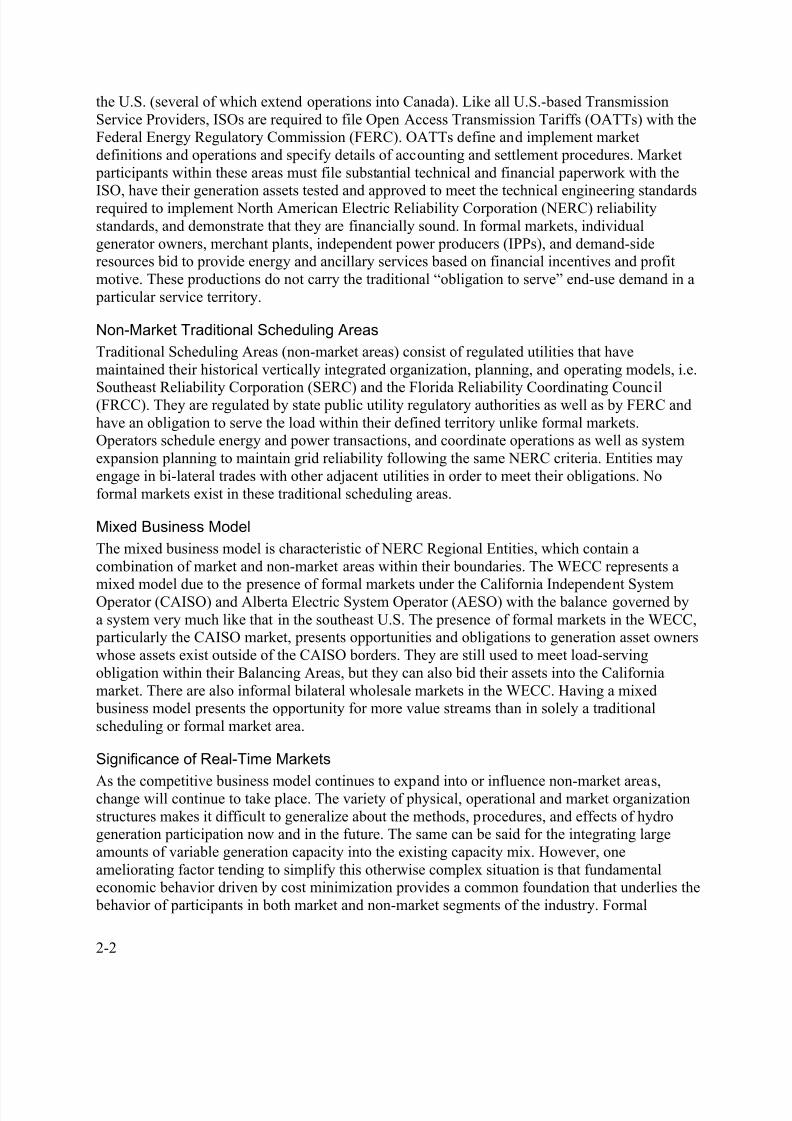
The primary motive of generation in the electric power system is to serve the load by producingelectric energy. The power system must be balanced in near real-time so that production andconsumption of real and reactive power match. Maintaining this balance along with reliable andlow-cost operations requires operational scheduling, planning, and coordination. In addition to providing generation, operators rely on other performance capabilities and services being provided through participating in either the energy market or separately bidding into ancillary
services markets. Sometimes a quick response time is critical for these services in order tomaintain stability in the real-time balancing. Table 2-1 below outlines the various functions andservices generators can provide and the response time for which these services are needed [14].
Table 2-1 Functions and services provided by generation [14]
Functions and Services Short Description Time Frame
Base load units (non-regulating)
Energy (firm) scheduled well in advance, based on availability, price, and long-term contracts
Long-term commitments
Committed units (usually withregulation capacity)
Energy (firm) scheduled based onavailability and price to meet block load,with Loss of Load Expectation and loadforecasts considered
Day before plan, hourly resolution
Load-following or energy- balancing units
Energy ramping to follow the load, met by adjusting generation scheduled and theimbalance energy market
Hourly plan with 5- to
10-minute resolution
Frequency regulation(regulating reserves)
Service provides capacity based on asignal from dispatcher, with AutomaticGeneration Control to meet CPS1 andCPS2 and no net energy
Every few minutes, minute-to-
minute resolution

8/9/2019 Quantifying the Value of Hydropower
http://slidepdf.com/reader/full/quantifying-the-value-of-hydropower 28/78
2-4
Hydroelectric resources operate in all of the major electricity operating regions in NorthAmerica. They contribute significantly to the reliability of the grid in terms of energy, capacity,and ancillary services as outlined in Table 2-1. The historical and current contribution of hydrofacilities to electricity generation is greatest in the western U.S. where large federal, multi- purpose projects, mostly conventional hydro, were built during the early- to mid-20th century.
Hydro provides the largest percentage of total net generation in the WECC among all regions.Among the market areas, the California ISO has historically had the largest contribution to
generation by hydroelectric facilities. These facilities show that approximately half have beenused in the past to provide spinning and non-spinning reserves, replacement reserves andregulation or load following. More than half have been used to provide black start, and mosthave provided voltage support in the past. This historical experience demonstrates thatconventional hydro facilities have the potential to provide increased ancillary services in additionto energy; these operating modes offer new revenue opportunities for plant operators. Pumpedstorage hydro resources, while either energy-limited or a net load, can still provide valuablecapacity and ancillary services to the grid. Pumped storage facilities actively participate inancillary services markets where those markets are available. With increased variable generation(solar and wind), these services are likely to become more critical.
Operational Constraints
When considering hydropower plant scheduling and operation to provide the grid servicesdiscussed in the previous section, operators must also typically abide by a set of operational(including environmental) constraints. These constraints can complicate attempts to maximize profits from grid services, and therefore an understanding of how these constraints limit the participation of hydro is needed. Examples of the restrictions on hydro include: “(1) limitationsin maximum and minimum water output which can vary by season, time of day, abnormal eventssuch as flooding and drought, and environmental and regulatory policies; (2) facility restrictions
Reactive supply and voltagecontrol
Service of injecting or absorbing ofreactive power to control localtransmission voltages (usually providedwith energy)
Continuous with response inseconds
Spinning operating reserve Service to provide energy in response tocontingencies and frequency deviations
Begin within 10 sec full powerin 10 min
Non-spinning operatingreserves
Service to provide load/generation balance in response to contingencies, notfrequency response
Respond within 10 minutes
Replacement reserves Service to restore contingency capacity to prepare for the next generation ortransmission contingency
Respond within 60 minutes, runup to 2 hours
System black start Service to restore all or a major portionof the power system without outsideenergy after a total collapse
As required
Firm capacity Service to provide an agreed uponamount of dependable capacity to cover peak load and contingency situations to
assure resource adequacy and systemreliability
As required
8/9/2019 Quantifying the Value of Hydropower
http://slidepdf.com/reader/full/quantifying-the-value-of-hydropower 29/78
2-5
such as the vibration of equipment as turbines ramp up and ramp down, optimizing efficiency toensure maximum return of investment, and minimum and maximum generator production limits;and (3) electrical considerations such as over voltage and under voltage conditions and market prices that ensure that the hydro facility is still profitable” [13].
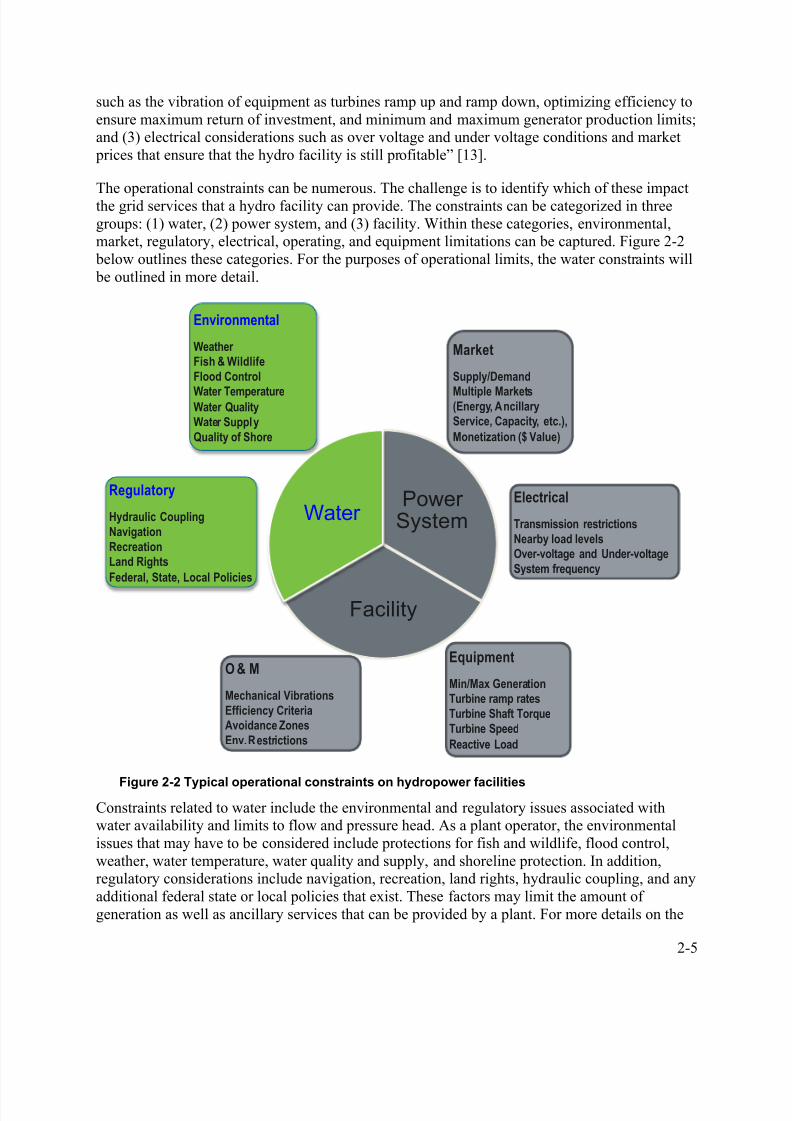
The operational constraints can be numerous. The challenge is to identify which of these impactthe grid services that a hydro facility can provide. The constraints can be categorized in threegroups: (1) water, (2) power system, and (3) facility. Within these categories, environmental,market, regulatory, electrical, operating, and equipment limitations can be captured. Figure 2-2 below outlines these categories. For the purposes of operational limits, the water constraints will be outlined in more detail.
Figure 2-2 Typical operational constraints on hydropower facilities
Constraints related to water include the environmental and regulatory issues associated withwater availability and limits to flow and pressure head. As a plant operator, the environmentalissues that may have to be considered include protections for fish and wildlife, flood control,weather, water temperature, water quality and supply, and shoreline protection. In addition,regulatory considerations include navigation, recreation, land rights, hydraulic coupling, and anyadditional federal state or local policies that exist. These factors may limit the amount ofgeneration as well as ancillary services that can be provided by a plant. For more details on the
Electrical
Transmission restrictionsNearby load levelsOver-voltage and Under-voltageSystem frequency
Market
Supply/Demand
Multiple Markets(Energy, AncillaryService, Capacity, etc.),
Monetization ($ Value)
Equipment
Min/Max GenerationTurbine ramp ratesTurbine Shaft TorqueTurbine Speed
Reactive Load
O & M
Mechanical VibrationsEfficiency CriteriaAvoidance ZonesEnv. Restrictions
Regulatory
Hydraulic CouplingNavigationRecreationLand Rights
Federal, State, Local Policies
Environmental
Weather Fish & WildlifeFlood Control
Water TemperatureWater QualityWater SupplyQuality of Shore
PowerSystem
Facility
Water
8/9/2019 Quantifying the Value of Hydropower
http://slidepdf.com/reader/full/quantifying-the-value-of-hydropower 30/78
2-6
specific water constraints experienced at hydro facilities, please refer to the Oak Ridge NationalLaboratory report from 2012 entitled Case Study: Hydropower Constraints on OSAGE andTAUM SAUK Facilities [13].
Pumped Storage Technologies and Cost [3],[9]
Pumped storage development started about 120 years ago. The first use of pumped storageoccurred in the 1890s in Italy and Switzerland. In 1907, the first storage set in Germany wascommissioned. In these early days the typical pumped storage plant consisted of two sets ofmachines, a motor driving a pump with a separate turbine in the plant turning a generator. Lateron, the sets where combined into a ternary unit which consisted of a motor generator, a pumpand a turbine, all connected on one shaft. In the 1930s, reversible pumped storage units weredeveloped. These reversible units could operate as both turbine-generators in one rotationaldirection and in the reverse rotational direction as electric motor driven pumps.
The first use of pumped-storage units in the United States was in 1930 by the ConnecticutElectric and Power Company, using a large reservoir located near New Milford, Connecticut,
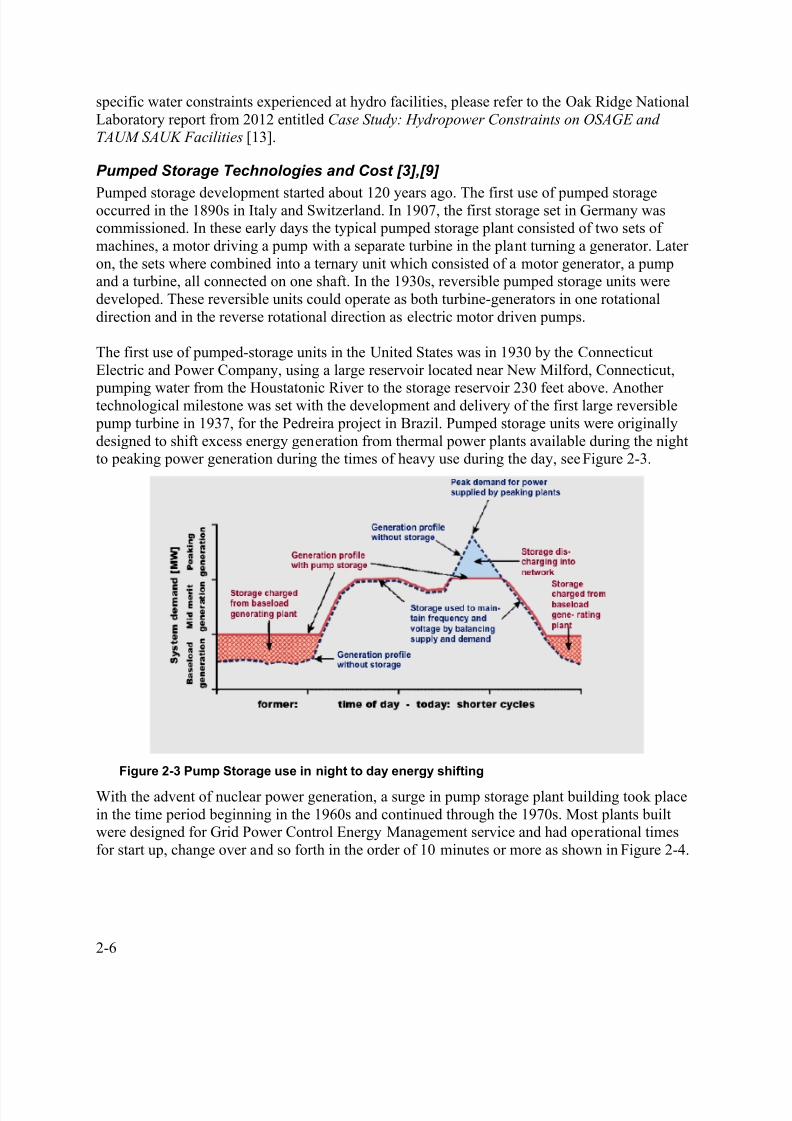
pumping water from the Houstatonic River to the storage reservoir 230 feet above. Anothertechnological milestone was set with the development and delivery of the first large reversible pump turbine in 1937, for the Pedreira project in Brazil. Pumped storage units were originallydesigned to shift excess energy generation from thermal power plants available during the nightto peaking power generation during the times of heavy use during the day, see Figure 2-3.
Figure 2-3 Pump Storage use in night to day energy shifting
With the advent of nuclear power generation, a surge in pump storage plant building took placein the time period beginning in the 1960s and continued through the 1970s. Most plants builtwere designed for Grid Power Control Energy Management service and had operational timesfor start up, change over and so forth in the order of 10 minutes or more as shown in Figure 2-4.
8/9/2019 Quantifying the Value of Hydropower
http://slidepdf.com/reader/full/quantifying-the-value-of-hydropower 31/78
2-7
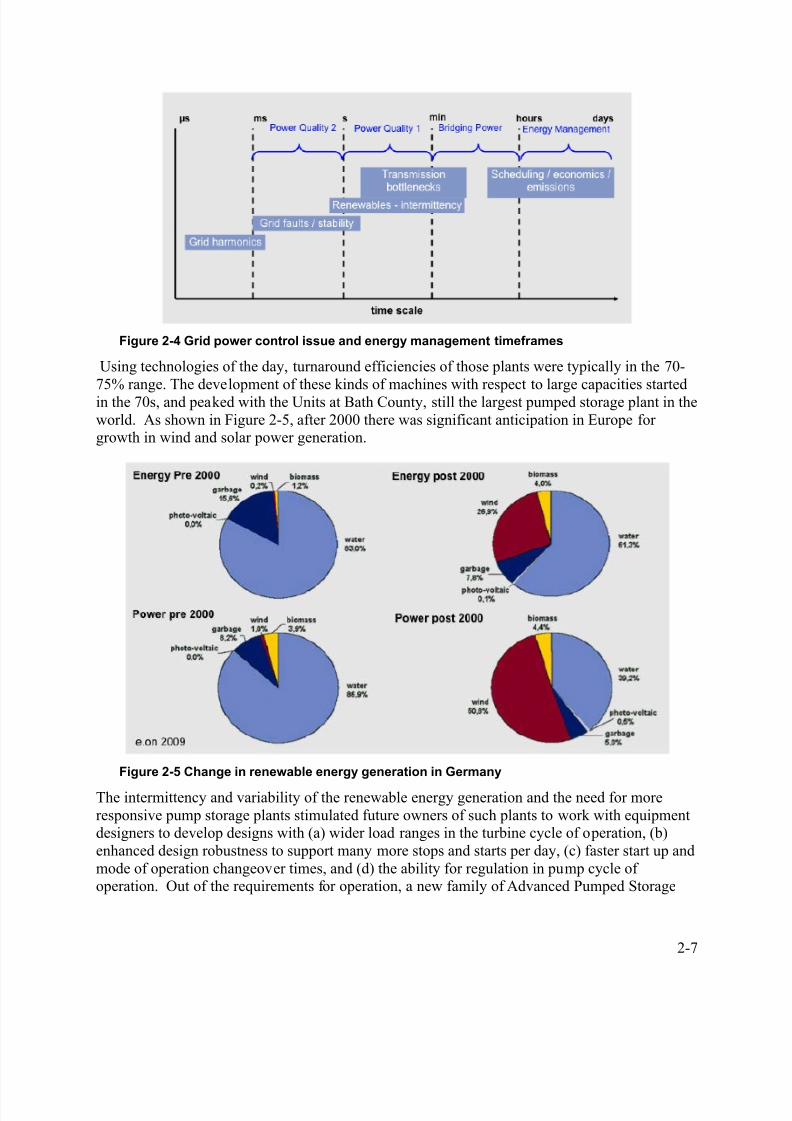
Figure 2-4 Grid power control issue and energy management timeframes
Using technologies of the day, turnaround efficiencies of those plants were typically in the 70-75% range. The development of these kinds of machines with respect to large capacities startedin the 70s, and peaked with the Units at Bath County, still the largest pumped storage plant in theworld. As shown in Figure 2-5, after 2000 there was significant anticipation in Europe forgrowth in wind and solar power generation.
Figure 2-5 Change in renewable energy generation in Germany
The intermittency and variability of the renewable energy generation and the need for moreresponsive pump storage plants stimulated future owners of such plants to work with equipmentdesigners to develop designs with (a) wider load ranges in the turbine cycle of operation, (b)enhanced design robustness to support many more stops and starts per day, (c) faster start up andmode of operation changeover times, and (d) the ability for regulation in pump cycle ofoperation. Out of the requirements for operation, a new family of Advanced Pumped Storage
8/9/2019 Quantifying the Value of Hydropower
http://slidepdf.com/reader/full/quantifying-the-value-of-hydropower 32/78
2-8
units and plants were and continue to be developed which provide higher turnaround efficiencies,and more robust and flexible equipment.
Pumped Storage Equipment Overview
Pumped storage equipment can be classified into several types: separate pump and turbine units,
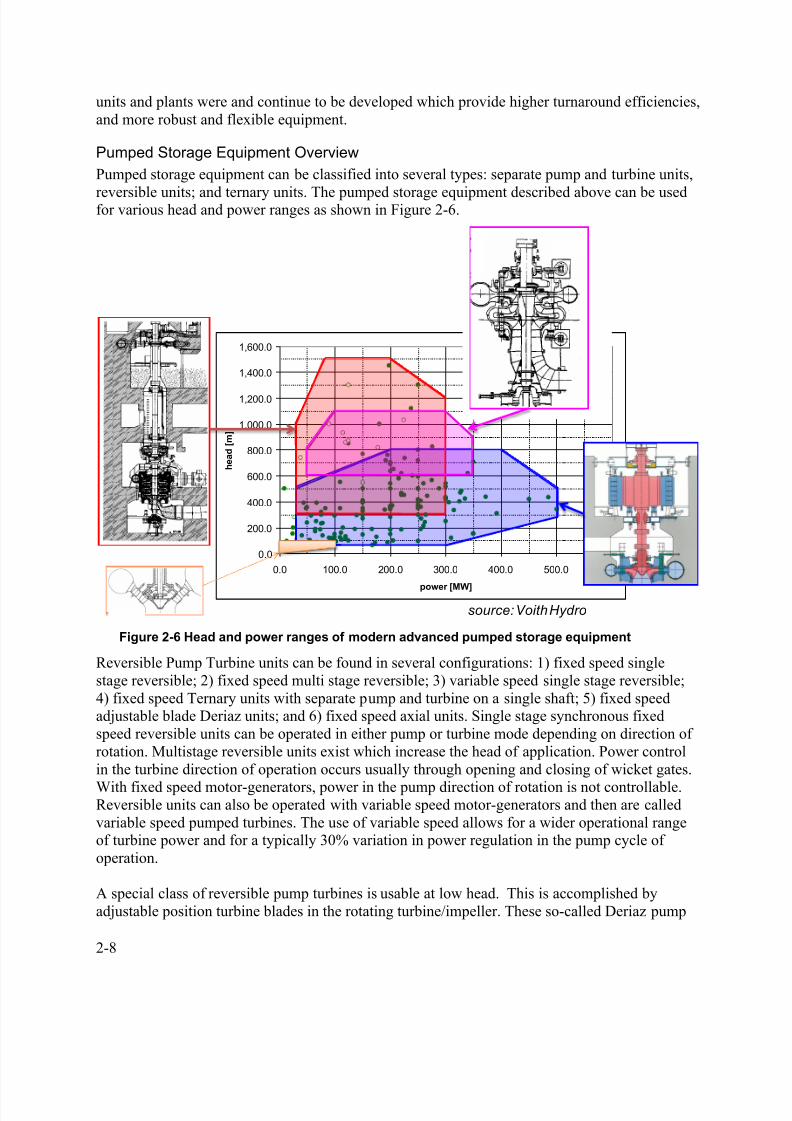
reversible units; and ternary units. The pumped storage equipment described above can be usedfor various head and power ranges as shown in Figure 2-6.
Figure 2-6 Head and power ranges of modern advanced pumped storage equipment
Reversible Pump Turbine units can be found in several configurations: 1) fixed speed singlestage reversible; 2) fixed speed multi stage reversible; 3) variable speed single stage reversible;4) fixed speed Ternary units with separate pump and turbine on a single shaft; 5) fixed speedadjustable blade Deriaz units; and 6) fixed speed axial units. Single stage synchronous fixedspeed reversible units can be operated in either pump or turbine mode depending on direction ofrotation. Multistage reversible units exist which increase the head of application. Power controlin the turbine direction of operation occurs usually through opening and closing of wicket gates.
With fixed speed motor-generators, power in the pump direction of rotation is not controllable.Reversible units can also be operated with variable speed motor-generators and then are calledvariable speed pumped turbines. The use of variable speed allows for a wider operational rangeof turbine power and for a typically 30% variation in power regulation in the pump cycle ofoperation.
A special class of reversible pump turbines is usable at low head. This is accomplished byadjustable position turbine blades in the rotating turbine/impeller. These so-called Deriaz pump
0.0
200.0
400.0
600.0
800.0
1,000.0
1,200.0
1,400.0
1,600.0
0.0 100.0 200.0 300.0 400.0 500.0 600.0
power [MW]
h e a d [ m ]
Market_0809_1920_PT
Market_0809_1920_Pump
application range rev. 1 stage PT
application range multistage pump
application range bi-stage PTapplication range Deriaz PT
source: Voith Hydro

8/9/2019 Quantifying the Value of Hydropower
http://slidepdf.com/reader/full/quantifying-the-value-of-hydropower 33/78
2-9
turbines operate at fixed speed. They can be operated at various power levels when pumping as aconsequence of the adjustable blade position. Modern advanced technology pumped storage plants are operating which have turnaround plant cycle efficiencies up to 82%.
Ternary pump turbine units have a separate generator, turbine and pump on a single shaft and are
operated in a single rotational direction. Ternary units can have turbines that are either impulse
or Francis type, and pump sets on Ternary units are usually multi stage. Advanced ternary unitsalso can have a hydraulic torque converter coupling connecting the pump to the shaft system. Not shown on this figure are special infrequently-used pumped storage equipment applicationssuch as reversible axial flow bulb pump turbines and reversible Kaplan style pump turbineswhich have been used at low heads and powers for special applications. Separate synchronousspeed pumps and turbines have also applied at some plants to provide energy storage services.
Figure 2-7 Relative grid service capability of advanced pumped storage units
Pumped storage equipment can also be characterized based on their regulation responsiveness togrid needs (Figure 2-7). Pump Turbine waterways including penstocks, surge chambers, anddischarge tunnels need to be designed in accordance to the speed of response desired from the plant. Modern conventional reversible pumped storage units are typically at the slower and lessflexible range. Advanced conventional reversible units have been built for very fast and frequentstart up, mode change and fast ramping operation. Multiple units in the same plant or in nearby plants can be operated together in a so called asynchronous balanced (hydraulic short circuit)mode to provide increased flexibility from the plant to support grid needs (i.e. a unit operating inthe pump mode while an adjacent unit operates in the turbine mode to provide fast and flexibleabsorption of power from the plant should it make economic sense based on ancillary service payments). Variable speed Pump Turbine units provide even more flexible responsiveness to
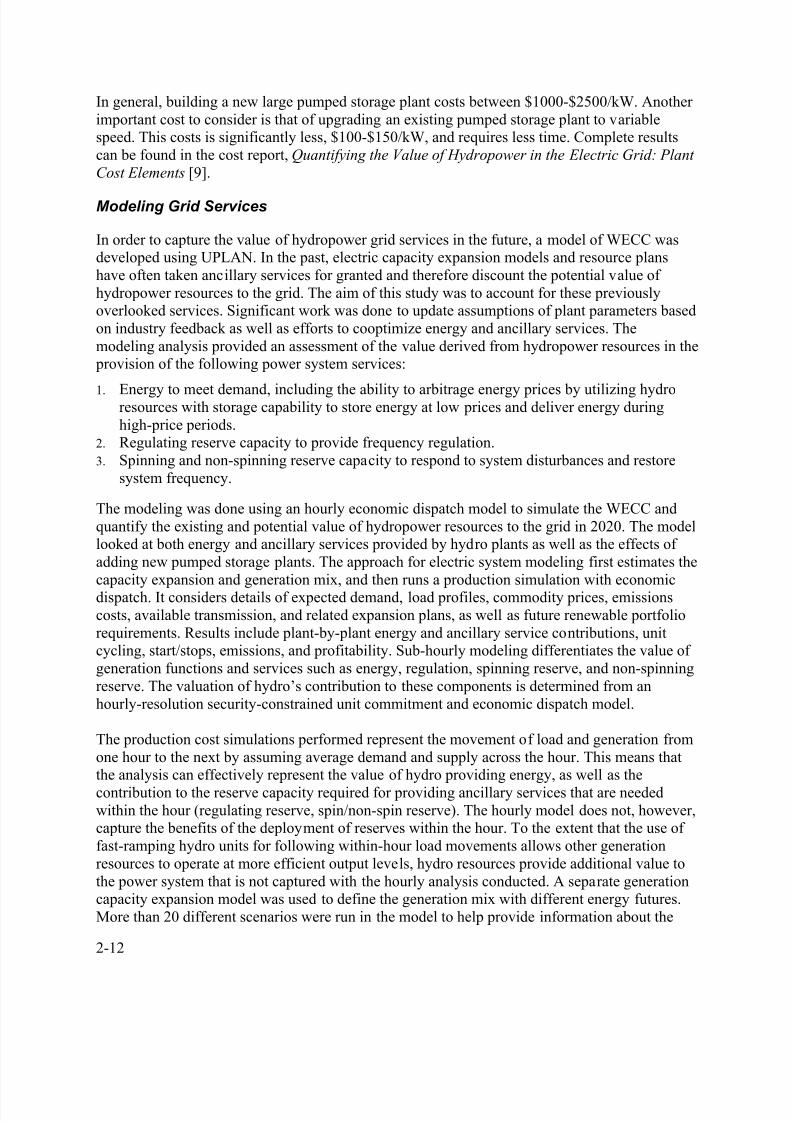
grid needs in many cases. They can operate at lower power percentage of their rated capacitythan conventional reversible machines and can provide power regulation when operating in the pump mode. For applications providing very fast and flexible operation, Ternary Pump Turbineunits are at the most flexible and fastest response range. Figure 2-8 shows typical modechangeover times from/to full load pump or full load turbine operation and startup times to fullload achievable from advanced pumped turbines operating today. Figure 2-9 shows timescales inwhich the advanced pumped storage units operate to provide grid services in Europe today.
8/9/2019 Quantifying the Value of Hydropower
http://slidepdf.com/reader/full/quantifying-the-value-of-hydropower 34/78
2-10
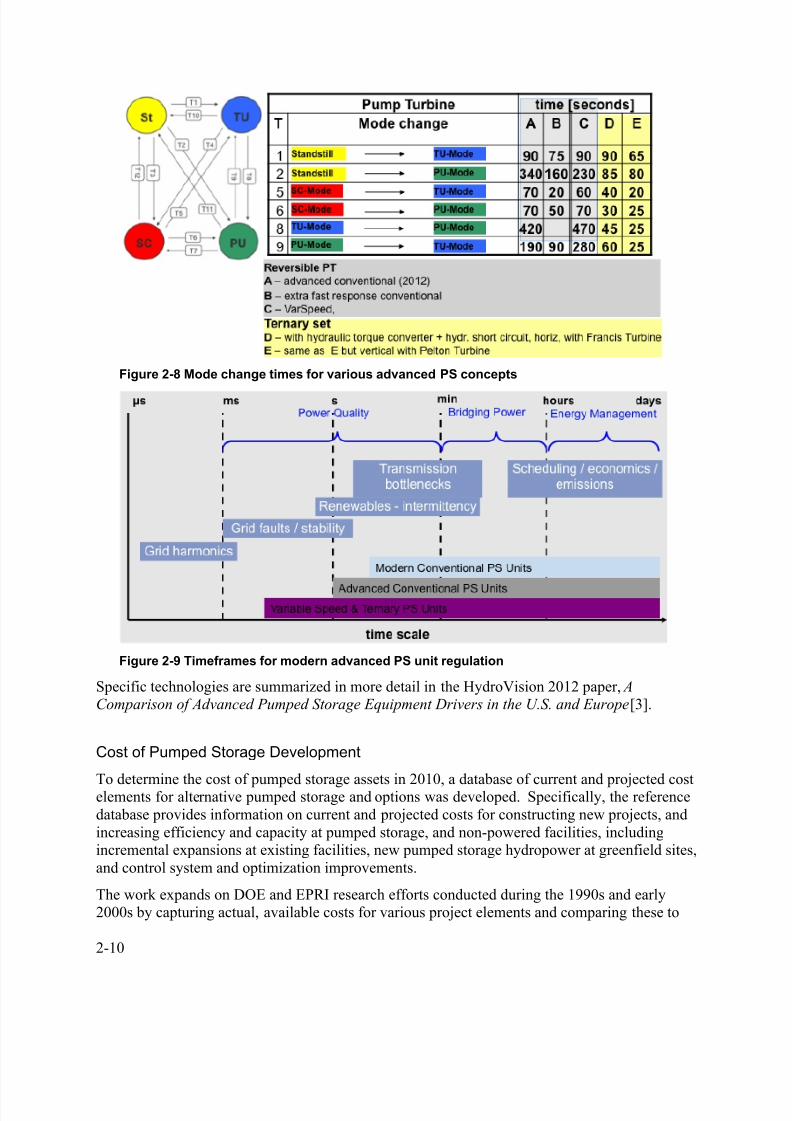
Figure 2-8 Mode change times for various advanced PS concepts
Figure 2-9 Timeframes for modern advanced PS unit regulation
Specific technologies are summarized in more detail in the HydroVision 2012 paper, AComparison of Advanced Pumped Storage Equipment Drivers in the U.S. and Europe [3].
Cost of Pumped Storage Development
To determine the cost of pumped storage assets in 2010, a database of current and projected costelements for alternative pumped storage and options was developed. Specifically, the referencedatabase provides information on current and projected costs for constructing new projects, andincreasing efficiency and capacity at pumped storage, and non-powered facilities, includingincremental expansions at existing facilities, new pumped storage hydropower at greenfield sites,and control system and optimization improvements.
The work expands on DOE and EPRI research efforts conducted during the 1990s and early2000s by capturing actual, available costs for various project elements and comparing these to

8/9/2019 Quantifying the Value of Hydropower
http://slidepdf.com/reader/full/quantifying-the-value-of-hydropower 35/78
2-11
the projected costs developed in these previous efforts. Cost data are obtained for the logicalgrouping of project elements, escalated, and applied to various hydropower applicationsincluding greenfield projects and upgrades/improvements at existing facilities.
Updating and escalating techniques include procedures developed by the U.S. Army Corps ofEngineers and U.S. Bureau of Reclamation, recent studies and hydropower equipment
vendor/contractor opinions, published labor and material indices, and recently completed projects and operations costs, as available. This assures the cost data are comparable forhydropower applications. For more detailed information please see the plant cost element reportQuantifying the Value of Hydropower in the Electric Grid: Plant Cost Elements [9].
This study particularly focuses on pumped storage construction costs. Table 2-2 shows the predicted $/kW for recently constructed and planned pumped storage (single speed and variablespeed) in estimated escalated 2010 costs for the United States.
Table 2-2 Pumped Storage Construction Cost Data [9]
Project Single vs.Variable
Speed
StatedCapacity
(MW)
Est. Cost($/kW)
Year ofCost
EscalationFactor to
2010
Est. Cost2010 ($/kW)
Max.Gross
Head (ft)
Ratio($/kW/Head)
Projects Constructed in U.S. 1960–1988 (Do not include AFUDC or transmission interconnection costs)
Taum Sauk SS 350 462 1988 2.6 1,201 267 4.50
Yards Creek SS 330 332 1988 2.6 863 760 1.14
Muddy Run SS 855 322 1988 2.6 837 127 6.62
Cabin Creek SS 280 404 1988 2.6 1,050 373 2.81
Seneca SS 380 505 1988 2.6 1,313 165 7.96
Northfield SS 1,000 288 1988 2.6 749 252 2.97
Blenheim-Gilboa SS 1,030 321 1988 2.6 835 1,143 0.73Ludington SS 1,890 376 1988 2.6 978 364 2.69
Jocassee SS 628 422 1988 2.6 1,097 335 3.28
Bear Swamp SS 540 507 1988 2.6 1,318 235 5.62
Raccoon Mtn. SS 1,530 296 1988 2.6 770 1,042 0.74
Fairfield SS 512 586 1988 2.6 1,524 169 9.02
Helms SS 1,050 616 1988 2.6 1,602 1,745 0.92
Bath County SS 2,100 639 1988 2.6 1,661 1,260 1.32
U.S. Projects Various Stage of Study Development Not Constructed
Eagle Mtn. SS & VS 1,300 1,062 2010 1 1,062 1,572 0.68
Mokelumne SS 1,200 2,342 2009 1.05 2,342 1,863 1.26Red Mtn Bar SS 900 1,851 2008 1.1 1,999 830 2.41
MulqueeneyRanch
SS 280 1,500 2009 1.05 1,500 700 2.14
Iowa Hill VS 400 2,000 2010 1 2,000 1,223 1.64
Red Mtn Bar VS 1,000 2,103 2008 1.1 2,342 830 2.82
8/9/2019 Quantifying the Value of Hydropower
http://slidepdf.com/reader/full/quantifying-the-value-of-hydropower 36/78
2-12
In general, building a new large pumped storage plant costs between $1000-$2500/kW. Anotherimportant cost to consider is that of upgrading an existing pumped storage plant to variablespeed. This costs is significantly less, $100-$150/kW, and requires less time. Complete resultscan be found in the cost report, Quantifying the Value of Hydropower in the Electric Grid: Plant
Cost Elements [9].
Modeling Grid Services
In order to capture the value of hydropower grid services in the future, a model of WECC wasdeveloped using UPLAN. In the past, electric capacity expansion models and resource planshave often taken ancillary services for granted and therefore discount the potential value ofhydropower resources to the grid. The aim of this study was to account for these previouslyoverlooked services. Significant work was done to update assumptions of plant parameters basedon industry feedback as well as efforts to cooptimize energy and ancillary services. Themodeling analysis provided an assessment of the value derived from hydropower resources in the provision of the following power system services:
1. Energy to meet demand, including the ability to arbitrage energy prices by utilizing hydroresources with storage capability to store energy at low prices and deliver energy duringhigh-price periods.
2. Regulating reserve capacity to provide frequency regulation.3. Spinning and non-spinning reserve capacity to respond to system disturbances and restore
system frequency.
The modeling was done using an hourly economic dispatch model to simulate the WECC andquantify the existing and potential value of hydropower resources to the grid in 2020. The modellooked at both energy and ancillary services provided by hydro plants as well as the effects ofadding new pumped storage plants. The approach for electric system modeling first estimates thecapacity expansion and generation mix, and then runs a production simulation with economicdispatch. It considers details of expected demand, load profiles, commodity prices, emissionscosts, available transmission, and related expansion plans, as well as future renewable portfoliorequirements. Results include plant-by-plant energy and ancillary service contributions, unitcycling, start/stops, emissions, and profitability. Sub-hourly modeling differentiates the value ofgeneration functions and services such as energy, regulation, spinning reserve, and non-spinningreserve. The valuation of hydro’s contribution to these components is determined from anhourly-resolution security-constrained unit commitment and economic dispatch model.
The production cost simulations performed represent the movement of load and generation fromone hour to the next by assuming average demand and supply across the hour. This means thatthe analysis can effectively represent the value of hydro providing energy, as well as thecontribution to the reserve capacity required for providing ancillary services that are neededwithin the hour (regulating reserve, spin/non-spin reserve). The hourly model does not, however,capture the benefits of the deployment of reserves within the hour. To the extent that the use offast-ramping hydro units for following within-hour load movements allows other generationresources to operate at more efficient output levels, hydro resources provide additional value tothe power system that is not captured with the hourly analysis conducted. A separate generationcapacity expansion model was used to define the generation mix with different energy futures.More than 20 different scenarios were run in the model to help provide information about the

8/9/2019 Quantifying the Value of Hydropower
http://slidepdf.com/reader/full/quantifying-the-value-of-hydropower 37/78
2-13
effect of increased renewables (expansion from 15%-33% to meet federal renewable portfoliostandards), CO2 prices, natural gas prices, and upgraded plants on the overall value tohydropower. These scenarios, shown in Table 2-3, intend to provide insight into energy dispatchand services that a future electricity market structure may need to capture. Selected results fromthe modeling that speak to the ways to increase the value of hydropower are included below.
Complete results can be found in the modeling report, Quantifying the Value of Hydropower inthe Electric Grid: Modeling Results for Future Scenarios [10].
Table 2-3 Energy futures and modeling scenarios
ScenarioHydro
Conditions
CO2 Emiss ion
CostsDemand Notes
Base-Wet Wet None Average NESSIE Generation, Renewable Expansion
TEPPC Normal None Average TEPPC Generation, Renewable Expansion
Base-OneNewPS Normal None Average NESSIE Generation, Renewable Expansion, one new PS plant
Bas e-HighRegReq Normal None Average NESSIE Generation, Renewable Expans ion, increas ed regulation
reserve req.
Bas e-PumpUpgrade Normal None Average NESSIE Generation, Renewable Expans ion, variable s peed pump
added at one plant
Bas e-GenUpgrade Normal None Average NESSIE Generation, Renewable Expans ion, new technology atone PS plant
Base Normal None Average NESSIE Generation, Renewable Expansion
Bas e-LowRegReq Normal None Average NESSIE Generation, Renewable Expans ion, reduced regulation
reserve req.
Bas e-Trans Relax Normal None Average NESSIE Generation, Renewable Expans ion, relaxed trans mis sion
Base-Dry Dry None Average NESSIE Generation, Renewable Expansion
Bas e-NoHydroAS Normal None Average NESSIE Generation, Renewable Expans ion, hydro cannot
supply ancillary services
Extreme-Dry Dry $0.02/lb High NESSIE Generation/Renewable Expansion
Base-FiveNewPS-TransRelax Normal None Average NESSIE Generation, Renewable Expansion, five new PS plants,
relaxed t ransmission
Carbon-Dry Dry $0.02/lb Average NESSIE Generation, Renewable Expansion
Ext reme-TransRelax Normal $0.02/ lb High NESSIE Generation, Renewab le Expansion, relaxed transmissionBas e-FiveNewPS Normal None Average NESSIE Generation, Renewable Expans ion, five new PS plants
Extreme Normal $0.02/lb High NESSIE Generation, Renewable Expansion
Extreme-OneNewPS Normal $0.02/lb High NESSIE Generation, Renewable Expans ion, CA PS plant
Carbon-OneNewPS Normal $0.02/ lb Average NESSIE Generation, Renewab le Expansion, one new PS p lant
Carbon Normal $0.02/lb Average NESSIE Generation, Renewable Expansion
Extreme-Wet Wet $0.02/lb High NESSIE Generation, Renewable Expansion
Carbon-TransRelax Normal $0.02/ lb Average NESSIE Generation, Renewab le Expansion, relaxed t ransmission
Carbon-Wet Wet $0.02/lb Average NESSIE Generation, Renewable Expansion

8/9/2019 Quantifying the Value of Hydropower
http://slidepdf.com/reader/full/quantifying-the-value-of-hydropower 38/78
8/9/2019 Quantifying the Value of Hydropower
http://slidepdf.com/reader/full/quantifying-the-value-of-hydropower 39/78
3-1
3WAYS TO INCREASE THE VALUE OF HYDROPOWER
Finding the value of hydropower in the electricity grid is very application-and case-specific.Value depends not only on plant size, location, and technology, but also other competingresources and the infrastructure to deliver energy and ancillary services. Efforts during this studyhave addressed operational, market, business, and policy considerations in valuing hydropower.
Synthesizing these results, ten different ways have been identified that may better recognize,increase and capture the value of hydropower resources to the grid.
This section of the report will outline each of the potential ways and describe what value can be
associated. They include individual plant as well as broader system-wide opportunities. Thevalue is not quantified in every case. Only six of the ten ways were monetized through the casestudies and system modeling in this project. To facilitate the discussion and to compare andcontrast, these ten ways are divided into in three different categories: (1) operations, (2)technology, and (3) markets.
Operational Improvements
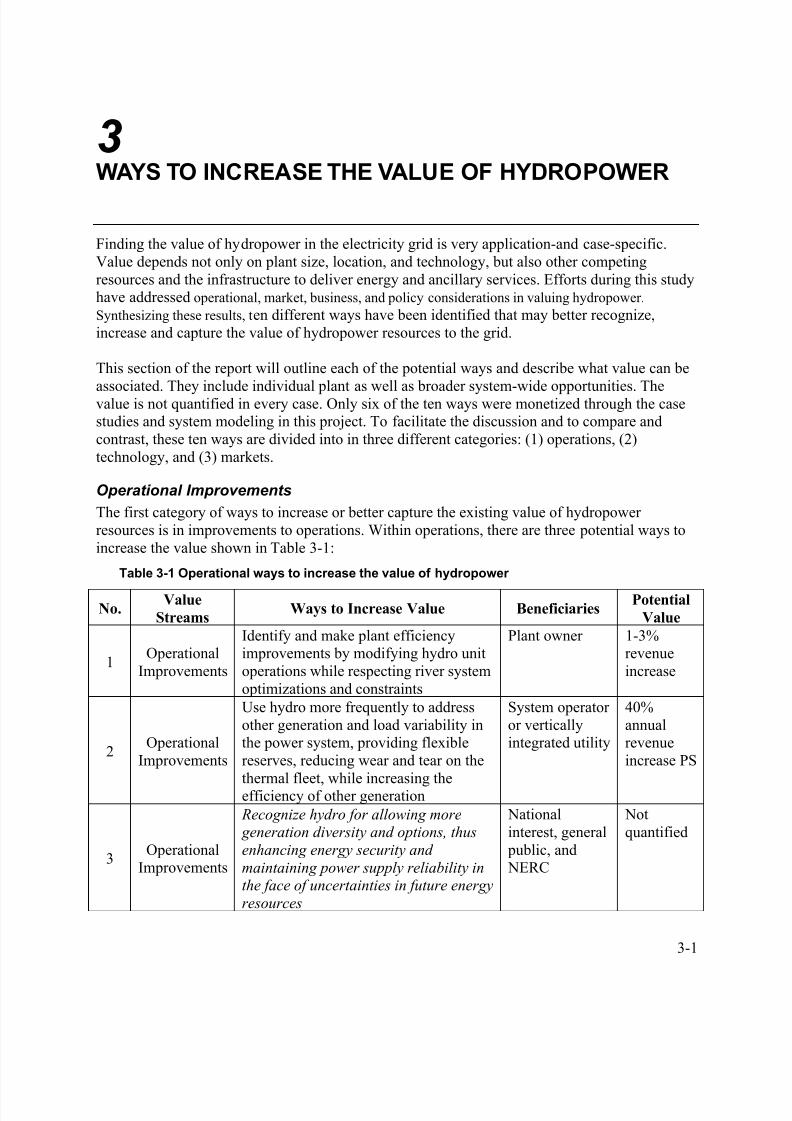
The first category of ways to increase or better capture the existing value of hydropowerresources is in improvements to operations. Within operations, there are three potential ways toincrease the value shown in Table 3-1:
Table 3-1 Operational ways to increase the value of hydropower
No.Value
StreamsWays to Increase Value Beneficiaries
Potential
Value
1Operational
Improvements
Identify and make plant efficiencyimprovements by modifying hydro unitoperations while respecting river systemoptimizations and constraints
Plant owner 1-3%revenueincrease
2Operational
Improvements
Use hydro more frequently to addressother generation and load variability inthe power system, providing flexiblereserves, reducing wear and tear on the
thermal fleet, while increasing theefficiency of other generation
System operatoror verticallyintegrated utility
40%annualrevenueincrease PS
3Operational
Improvements
Recognize hydro for allowing more generation diversity and options, thus
enhancing energy security and
maintaining power supply reliability inthe face of uncertainties in future energy
resources
Nationalinterest, general public, and NERC
Notquantified
8/9/2019 Quantifying the Value of Hydropower
http://slidepdf.com/reader/full/quantifying-the-value-of-hydropower 40/78
3-2
In this study the first two operational improvements were monetized through case studies andmodeling. The third operational improvement is more challenging to monetize. All three arediscussed in detail below.
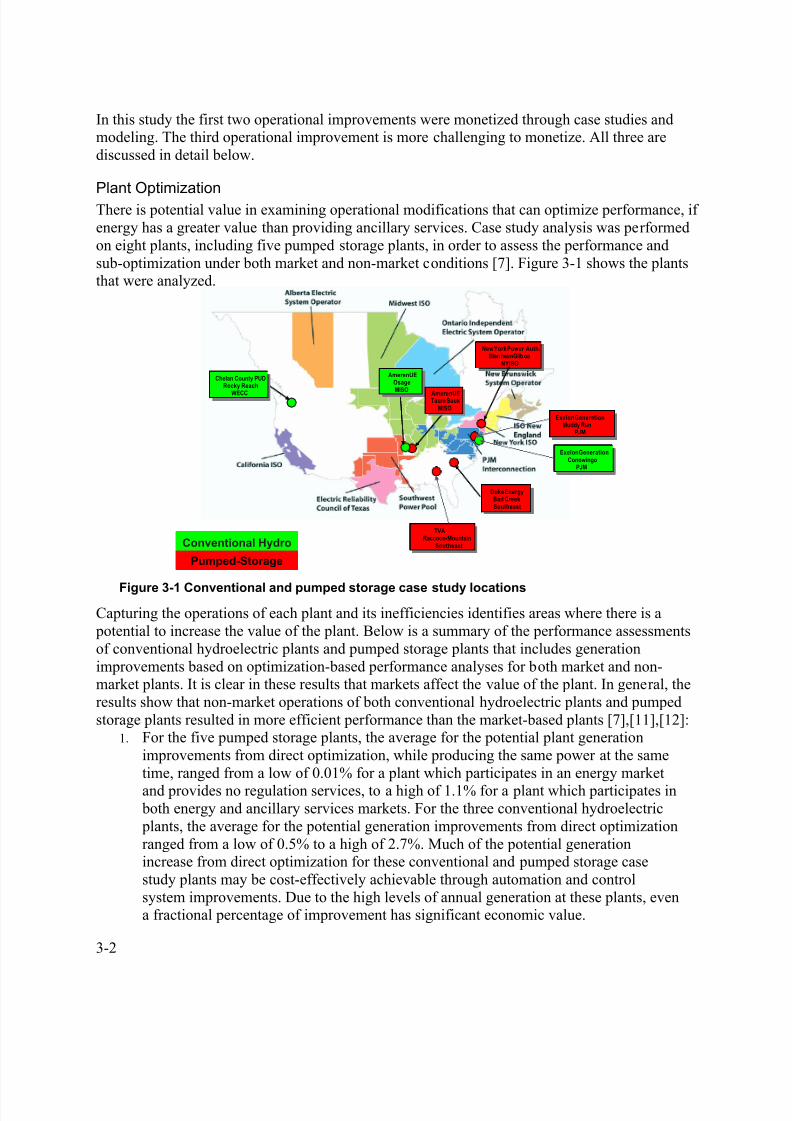
Plant Optimization
There is potential value in examining operational modifications that can optimize performance, ifenergy has a greater value than providing ancillary services. Case study analysis was performedon eight plants, including five pumped storage plants, in order to assess the performance andsub-optimization under both market and non-market conditions [7]. Figure 3-1 shows the plantsthat were analyzed.
Figure 3-1 Conventional and pumped storage case study locations
Capturing the operations of each plant and its inefficiencies identifies areas where there is a potential to increase the value of the plant. Below is a summary of the performance assessmentsof conventional hydroelectric plants and pumped storage plants that includes generationimprovements based on optimization-based performance analyses for both market and non-market plants. It is clear in these results that markets affect the value of the plant. In general, theresults show that non-market operations of both conventional hydroelectric plants and pumpedstorage plants resulted in more efficient performance than the market-based plants [7],[11],[12]:
1. For the five pumped storage plants, the average for the potential plant generationimprovements from direct optimization, while producing the same power at the sametime, ranged from a low of 0.01% for a plant which participates in an energy market
and provides no regulation services, to a high of 1.1% for a plant which participates in both energy and ancillary services markets. For the three conventional hydroelectric plants, the average for the potential generation improvements from direct optimizationranged from a low of 0.5% to a high of 2.7%. Much of the potential generationincrease from direct optimization for these conventional and pumped storage casestudy plants may be cost-effectively achievable through automation and controlsystem improvements. Due to the high levels of annual generation at these plants, evena fractional percentage of improvement has significant economic value.
Pacific Gas & ElectricHelms
CAISO, WECC
Pacific Gas & ElectricHelms
CAISO, WECC
USACE
SWPA, MISO
USACEHarry S. Truman
Duke EnergyBad CreekSoutheast
Duke EnergyBad CreekSoutheast
AmerenUEOsage
MISO
AmerenUEOsage
MISO AmerenUETaum Sauk
MISO
AmerenUETaum Sauk
MISO
Chelan County PUDRocky Reach
WECC
Chelan County PUDRocky Reach
WECC
Chelan County PUDRocky Reach
WECC
Chelan County PUDRocky Reach
WECC
New York Power Auth.Blen heim-Gil boa
NYISO
New York Power Auth.Blen heim-Gilb oa
NYISO
New York Power Auth.Blen heim-Gil boa
NYISO
New York Power Auth.Blen heim-Gilb oa
NYISO
Duke EnergyBad CreekSoutheast
Duke EnergyBad CreekSoutheast
AmerenUEOsage
MISO
AmerenUEOsage
MISO AmerenUETaum Sauk
MISO
AmerenUETaum Sauk
MISO
New York Power Auth.Blen heim-Gil boa
NYISO
New York Power Auth.Blenh eim-Gil boa
NYISO
New York Power Auth.Blen heim-Gil boa
NYISO
Exelon GenerationMuddy Run-
PJM
Chelan County PUDRocky Reach
WECC
Chelan County PUDRocky Reach
WECC
Chelan County PUDRocky Reach
WECC
Exelon GenerationConowingo
PJM
New York Power Auth.Blen heim-Gil boa
NYISO
New York Power Auth.Blen heim-Gil boa
NYISO
New York Power Auth.Blen heim-Gil boa
NYISO
TVARaccoon Mountain-
SoutheastConventional Hydro
Pumped-Storage
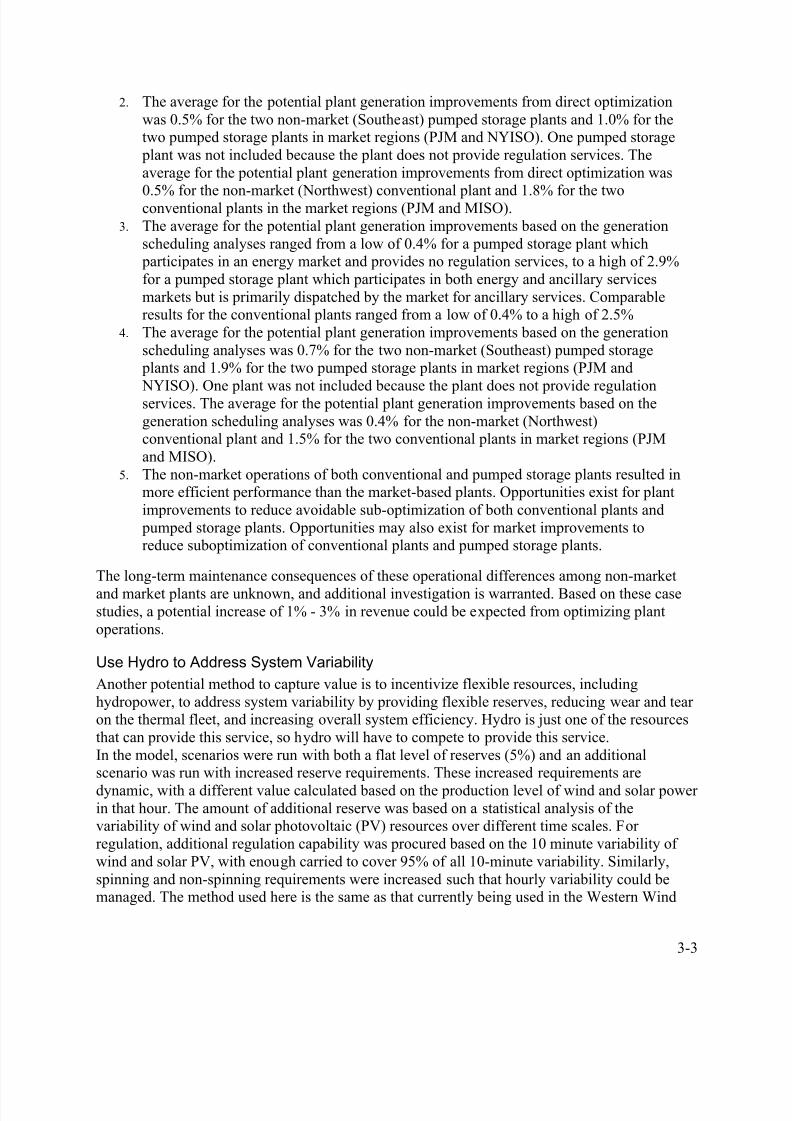
8/9/2019 Quantifying the Value of Hydropower
http://slidepdf.com/reader/full/quantifying-the-value-of-hydropower 41/78
3-3
2. The average for the potential plant generation improvements from direct optimizationwas 0.5% for the two non-market (Southeast) pumped storage plants and 1.0% for thetwo pumped storage plants in market regions (PJM and NYISO). One pumped storage plant was not included because the plant does not provide regulation services. Theaverage for the potential plant generation improvements from direct optimization was
0.5% for the non-market (Northwest) conventional plant and 1.8% for the twoconventional plants in the market regions (PJM and MISO).3. The average for the potential plant generation improvements based on the generation
scheduling analyses ranged from a low of 0.4% for a pumped storage plant which participates in an energy market and provides no regulation services, to a high of 2.9%for a pumped storage plant which participates in both energy and ancillary servicesmarkets but is primarily dispatched by the market for ancillary services. Comparableresults for the conventional plants ranged from a low of 0.4% to a high of 2.5%
4. The average for the potential plant generation improvements based on the generationscheduling analyses was 0.7% for the two non-market (Southeast) pumped storage plants and 1.9% for the two pumped storage plants in market regions (PJM and
NYISO). One plant was not included because the plant does not provide regulationservices. The average for the potential plant generation improvements based on thegeneration scheduling analyses was 0.4% for the non-market (Northwest)conventional plant and 1.5% for the two conventional plants in market regions (PJMand MISO).
5. The non-market operations of both conventional and pumped storage plants resulted inmore efficient performance than the market-based plants. Opportunities exist for plantimprovements to reduce avoidable sub-optimization of both conventional plants and pumped storage plants. Opportunities may also exist for market improvements toreduce suboptimization of conventional plants and pumped storage plants.
The long-term maintenance consequences of these operational differences among non-market
and market plants are unknown, and additional investigation is warranted. Based on these casestudies, a potential increase of 1% - 3% in revenue could be expected from optimizing plantoperations.
Use Hydro to Address System Variability
Another potential method to capture value is to incentivize flexible resources, includinghydropower, to address system variability by providing flexible reserves, reducing wear and tearon the thermal fleet, and increasing overall system efficiency. Hydro is just one of the resourcesthat can provide this service, so hydro will have to compete to provide this service.In the model, scenarios were run with both a flat level of reserves (5%) and an additionalscenario was run with increased reserve requirements. These increased requirements are
dynamic, with a different value calculated based on the production level of wind and solar powerin that hour. The amount of additional reserve was based on a statistical analysis of thevariability of wind and solar photovoltaic (PV) resources over different time scales. Forregulation, additional regulation capability was procured based on the 10 minute variability ofwind and solar PV, with enough carried to cover 95% of all 10-minute variability. Similarly,spinning and non-spinning requirements were increased such that hourly variability could bemanaged. The method used here is the same as that currently being used in the Western Wind

8/9/2019 Quantifying the Value of Hydropower
http://slidepdf.com/reader/full/quantifying-the-value-of-hydropower 42/78
3-4
and Solar Integration Study1 and an NREL study relating to the proposed Energy ImbalanceMarket in WECC
2. The average additional regulation carried across WECC was 1,229 MW, with
a maximum of 2,835 MW and minimum of 153 MW. For this study, the reserve requirements are broken down into three classes by the types of resources required to fulfill them: (1) regulation,(2) spinning reserve, and (3) non-spinning and supplemental reserves. Detailed information on
the calculations can be found in the Quantifying the Value of Hydropower in the Electric Grid: Modeling Results for Future Scenarios report [10].
When the increased flexible reserve requirements are considered in 2020, the model showed anincrease in ancillary services revenue for conventional hydro plants in WECC as compared tolower levels of reserve requirements. Table 3-2 shows that the conventional hydro in Californiamakes the most profit. However, the average income for the regions remains approximately thesame due to the decrease in energy revenue.
Table 3-2 Conventional hydro performance by region with increased reserve requirements3
Region Capacity
(MW)
Generation
(GWh)
Energy Revenue
($1000)
Ancillary Service
Revenue ($1000)
Net
Income($1
000)
Average
Income
($/kW)
AZ-NM-SNV 3,906 9,439 563,610 128,874 683,045 175CA-MX US 9,078 42,955 2,414,816 271,617 2,643,488 291
NWPP 49,002 203,789 12,367,189 181,457 12,344,857 252RMPA 1,151 2,861 171,813 42,136 211,088 183
WECC 63,137 259,044 15,517,428 624,084 15,882,478 252
Figure 3-2 shows the difference in revenue by region with the increased reserves. While revenuein most regions changes significantly, the total revenue for conventional hydro is only $1/kWmore due to the decrease in energy revenue offsetting the increase in ancillary service revenue.
1 See http://wind.nrel.gov/public/WWIS/Reserves.pdf 2 King, J., Kirby, B., Milligan, M., Beuning, S., “Operating Reserve Reductions From a Proposed Energy Imbalance Market WithWind and Solar Generation in the Western Interconnection”, National Renewable Energy Laboratory Technical Report,
NREL/TP-5500-54660, Golden, CO, May 20123 Energy Revenue refers to the total revenue collected for power delivered; Ancillary Service Revenue refers to thetotal revenue collected for the provision of ancillary services; Net Income is total revenue minus expenses includingcost of pumping energy; and Average Income is the Net Income divided by the unit size.
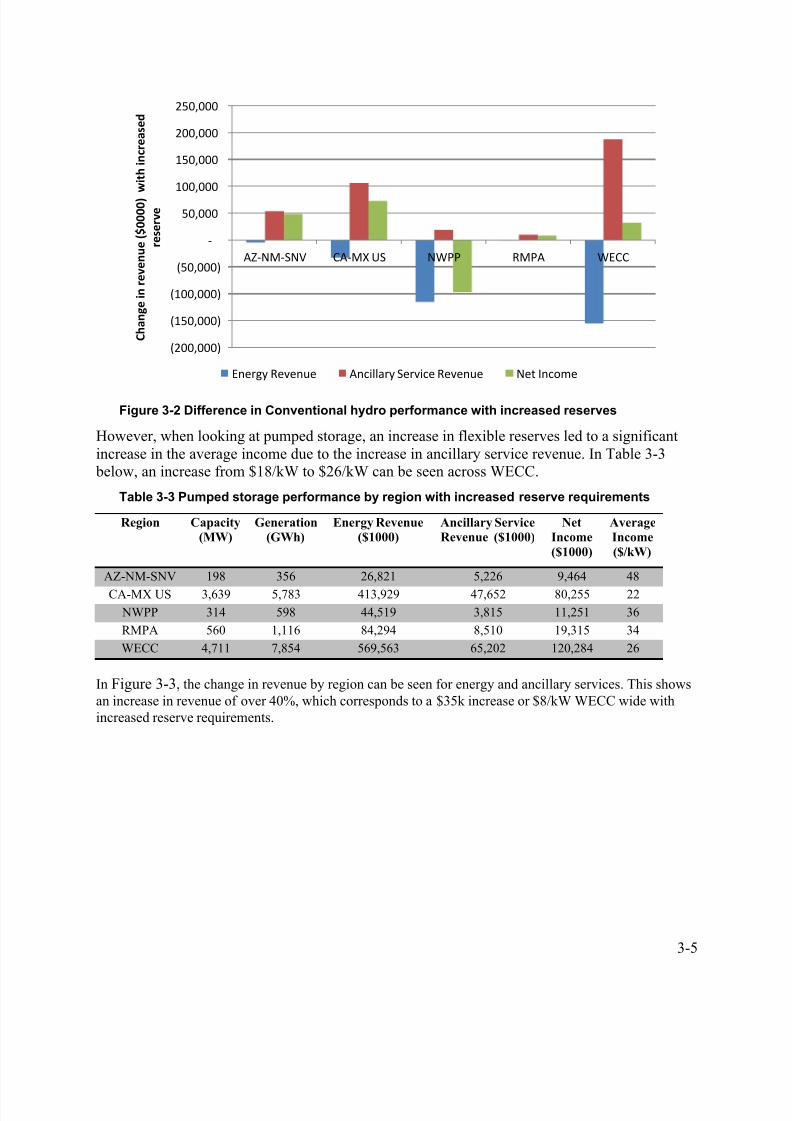
8/9/2019 Quantifying the Value of Hydropower
http://slidepdf.com/reader/full/quantifying-the-value-of-hydropower 43/78
3-5
Figure 3-2 Difference in Conventional hydro performance with increased reserves
However, when looking at pumped storage, an increase in flexible reserves led to a significantincrease in the average income due to the increase in ancillary service revenue. In Table 3-3 below, an increase from $18/kW to $26/kW can be seen across WECC.
Table 3-3 Pumped storage performance by region with increased reserve requirements
Region Capacity
(MW)
Generation
(GWh)
Energy Revenue
($1000)
Ancillary Service
Revenue ($1000)
Net
Income
($1000)
Average
Income
($/kW)
AZ-NM-SNV 198 356 26,821 5,226 9,464 48
CA-MX US 3,639 5,783 413,929 47,652 80,255 22
NWPP 314 598 44,519 3,815 11,251 36
RMPA 560 1,116 84,294 8,510 19,315 34
WECC 4,711 7,854 569,563 65,202 120,284 26
In Figure 3-3, the change in revenue by region can be seen for energy and ancillary services. This shows
an increase in revenue of over 40%, which corresponds to a $35k increase or $8/kW WECC wide with
increased reserve requirements.
(200,000)
(150,000)
(100,000)
(50,000)
-
50,000
100,000
150,000
200,000
250,000
AZ-NM-SNV CA-MX US NWPP RMPA WECC
C h a n g e i n r e v e n u e ( $ 0 0 0 0 )
w i t h i n c r e a s e d
r e s e r v e
Energy Revenue Ancillary Service Revenue Net Income

8/9/2019 Quantifying the Value of Hydropower
http://slidepdf.com/reader/full/quantifying-the-value-of-hydropower 44/78
3-6
Figure 3-3 Difference in pumped storage performance with increased reserves
The modeling clearly shows an increase in the overall revenue through the increase in flexiblereserves. There is also an increase in the use of combined cycle plants. Ultimately, hydro plantswill have to compete to provide this resource.
Another aspect related to support system variability is protecting the existing fleet fromadditional wear and tear. While in the modeling this was not monetized, there were indications ofreduced starts and stops on the thermal fleet in WECC. Figure 3-4 shows that when pumpedstorage is increased in WECC, the number of starts and stops of combustion turbines and coal plants decreases in most regions.
Figure 3-4 Difference in starts and stops with increased pumped storage
(5,000)
-
5,000
10,000
15,000
20,000
25,000
30,000
35,000
40,000
45,000
50,000
AZ-NM-SNV CA-MX US NWPP RMPA WECC
C h a n g e i n r e v e n u e (
$ 0 0 0 0 ) w i t h
i n c r e a s e d r e s e r v e
Region
Energy Revenue Reserve Revenue Net Income
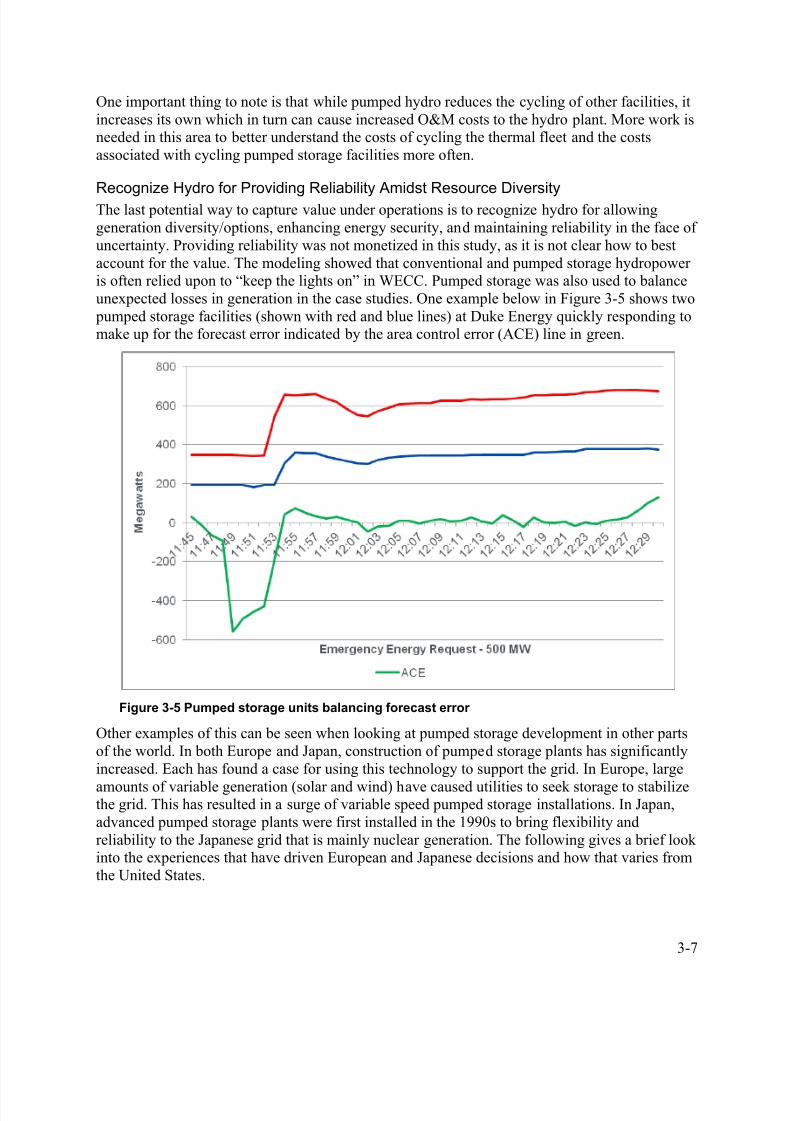
8/9/2019 Quantifying the Value of Hydropower
http://slidepdf.com/reader/full/quantifying-the-value-of-hydropower 45/78
3-7
One important thing to note is that while pumped hydro reduces the cycling of other facilities, itincreases its own which in turn can cause increased O&M costs to the hydro plant. More work isneeded in this area to better understand the costs of cycling the thermal fleet and the costsassociated with cycling pumped storage facilities more often.
Recognize Hydro for Providing Reliability Amidst Resource Diversity
The last potential way to capture value under operations is to recognize hydro for allowinggeneration diversity/options, enhancing energy security, and maintaining reliability in the face ofuncertainty. Providing reliability was not monetized in this study, as it is not clear how to bestaccount for the value. The modeling showed that conventional and pumped storage hydropoweris often relied upon to “keep the lights on” in WECC. Pumped storage was also used to balanceunexpected losses in generation in the case studies. One example below in Figure 3-5 shows two pumped storage facilities (shown with red and blue lines) at Duke Energy quickly responding tomake up for the forecast error indicated by the area control error (ACE) line in green.
Figure 3-5 Pumped storage units balancing forecast error
Other examples of this can be seen when looking at pumped storage development in other partsof the world. In both Europe and Japan, construction of pumped storage plants has significantlyincreased. Each has found a case for using this technology to support the grid. In Europe, large
amounts of variable generation (solar and wind) have caused utilities to seek storage to stabilizethe grid. This has resulted in a surge of variable speed pumped storage installations. In Japan,advanced pumped storage plants were first installed in the 1990s to bring flexibility andreliability to the Japanese grid that is mainly nuclear generation. The following gives a brief lookinto the experiences that have driven European and Japanese decisions and how that varies fromthe United States.
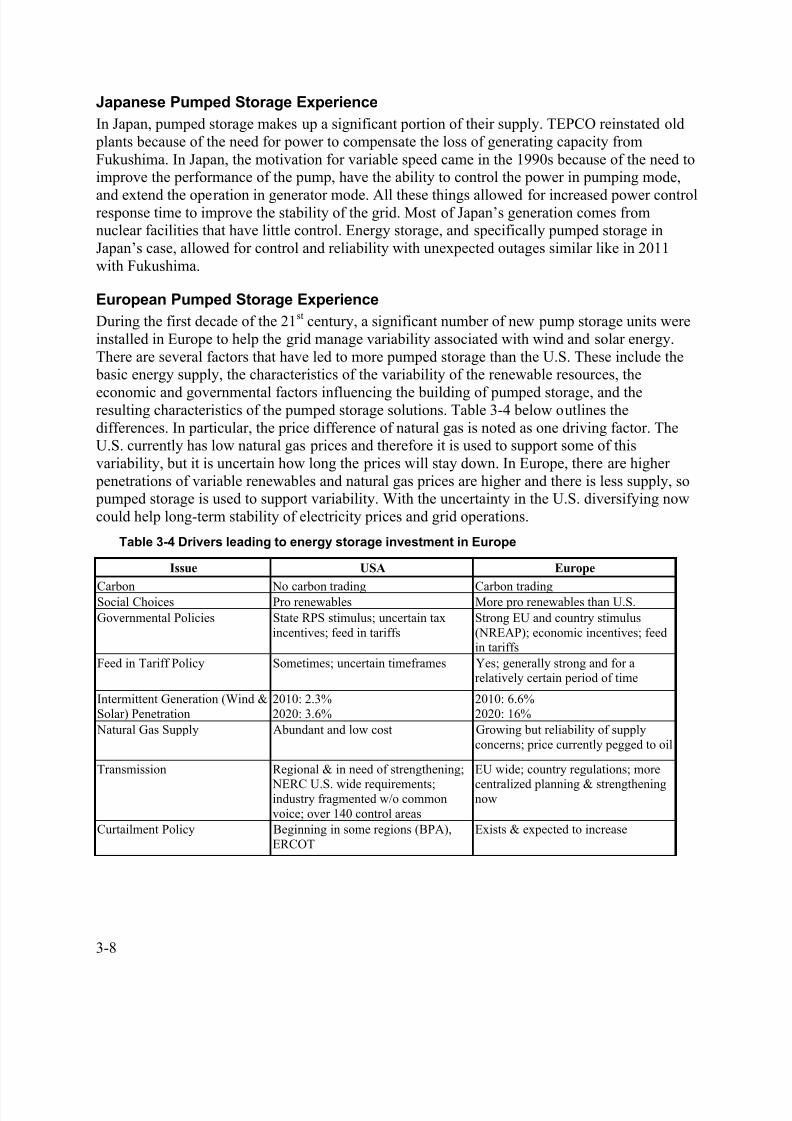
8/9/2019 Quantifying the Value of Hydropower
http://slidepdf.com/reader/full/quantifying-the-value-of-hydropower 46/78
3-8
Japanese Pumped Storage Experience
In Japan, pumped storage makes up a significant portion of their supply. TEPCO reinstated old plants because of the need for power to compensate the loss of generating capacity fromFukushima. In Japan, the motivation for variable speed came in the 1990s because of the need toimprove the performance of the pump, have the ability to control the power in pumping mode,
and extend the operation in generator mode. All these things allowed for increased power controlresponse time to improve the stability of the grid. Most of Japan’s generation comes fromnuclear facilities that have little control. Energy storage, and specifically pumped storage inJapan’s case, allowed for control and reliability with unexpected outages similar like in 2011with Fukushima.
European Pumped Storage Experience
During the first decade of the 21st century, a significant number of new pump storage units wereinstalled in Europe to help the grid manage variability associated with wind and solar energy.There are several factors that have led to more pumped storage than the U.S. These include the basic energy supply, the characteristics of the variability of the renewable resources, the
economic and governmental factors influencing the building of pumped storage, and theresulting characteristics of the pumped storage solutions. Table 3-4 below outlines thedifferences. In particular, the price difference of natural gas is noted as one driving factor. TheU.S. currently has low natural gas prices and therefore it is used to support some of thisvariability, but it is uncertain how long the prices will stay down. In Europe, there are higher penetrations of variable renewables and natural gas prices are higher and there is less supply, so pumped storage is used to support variability. With the uncertainty in the U.S. diversifying nowcould help long-term stability of electricity prices and grid operations.
Table 3-4 Drivers leading to energy storage investment in Europe
Issue USA Europe
Carbon No carbon trading Carbon tradingSocial Choices Pro renewables More pro renewables than U.S.
Governmental Policies State RPS stimulus; uncertain taxincentives; feed in tariffs
Strong EU and country stimulus(NREAP); economic incentives; feedin tariffs
Feed in Tariff Policy Sometimes; uncertain timeframes Yes; generally strong and for arelatively certain period of time
Intermittent Generation (Wind &Solar) Penetration
2010: 2.3%2020: 3.6%
2010: 6.6%2020: 16%
Natural Gas Supply Abundant and low cost Growing but reliability of supplyconcerns; price currently pegged to oil
Transmission Regional & in need of strengthening;
NERC U.S. wide requirements;industry fragmented w/o commonvoice; over 140 control areas
EU wide; country regulations; more
centralized planning & strengtheningnow
Curtailment Policy Beginning in some regions (BPA),ERCOT
Exists & expected to increase

8/9/2019 Quantifying the Value of Hydropower
http://slidepdf.com/reader/full/quantifying-the-value-of-hydropower 47/78
3-9
Markets Some active markets for medium &longer term energy; evolving with new payment streams including capacity payments; markets don’t existeverywhere
Active markets for short & mediumterm energy; still country based, but in process of unification; addressing“flexibility” by new market productsstill missing
Return on Investment Uncertain Energy arbitrage, Ancillary Services
payments, Portfolio effects rewardinvestment
Plant Investors Principally Independent PowerProducers (IPP) in deregulatedmarkets
Principally Generation Utilities
Not only is Europe installing more pumped storage than the U.S., but they are installing moreadvanced pumped storage technologies. In Table 3-5 below, a breakdown of installed and planned installations in Europe and North America is compared by technology type. In Europe,more installations of ternary and variable speed units are expected due to the capabilities theycan provide in a short time span with increased levels of renewables and the ability for increasedrevenue opportunities.
Table 3-5 Installed and planned pumped storage developments in Europe and U.S. [3]
2000 to 2010 MW MW MW MW
Total Conventional PS Ternary Variable Speed
Europe 2,443 836 547 1,060
North America 0 0 0 0
2011 to 2020 % % %
Total Conventional PS Ternary Variable Speed
Europe 11,562 6,849 303 4,410
North America 40 40 0 0
New Hydropower Technologies
The second category of ways to increase or better capture the value of hydropower resources isin the technology. Within technology, there are three potential ways to increase the value shownin Table 3-6:
Table 3-6 Technological ways to increase the value of hydropower
No.Value
StreamsWays to Increase Value Beneficiaries
Potential
Value
4
New Hydro
Technologies
Expand the effective operating range ofexisting and new hydro units with lower
minimum load and higher peak operatingcapabilities
Plant ownerand operator
61%increase
annualaverageincome PS
5 New HydroTechnologies
Apply adjustable speed drive electronics innew and selected existing pumped storageunits to enable regulation of the pumping power requirements, particularly at night
Plant ownerand operator
85%increaseannualaverageincome PS
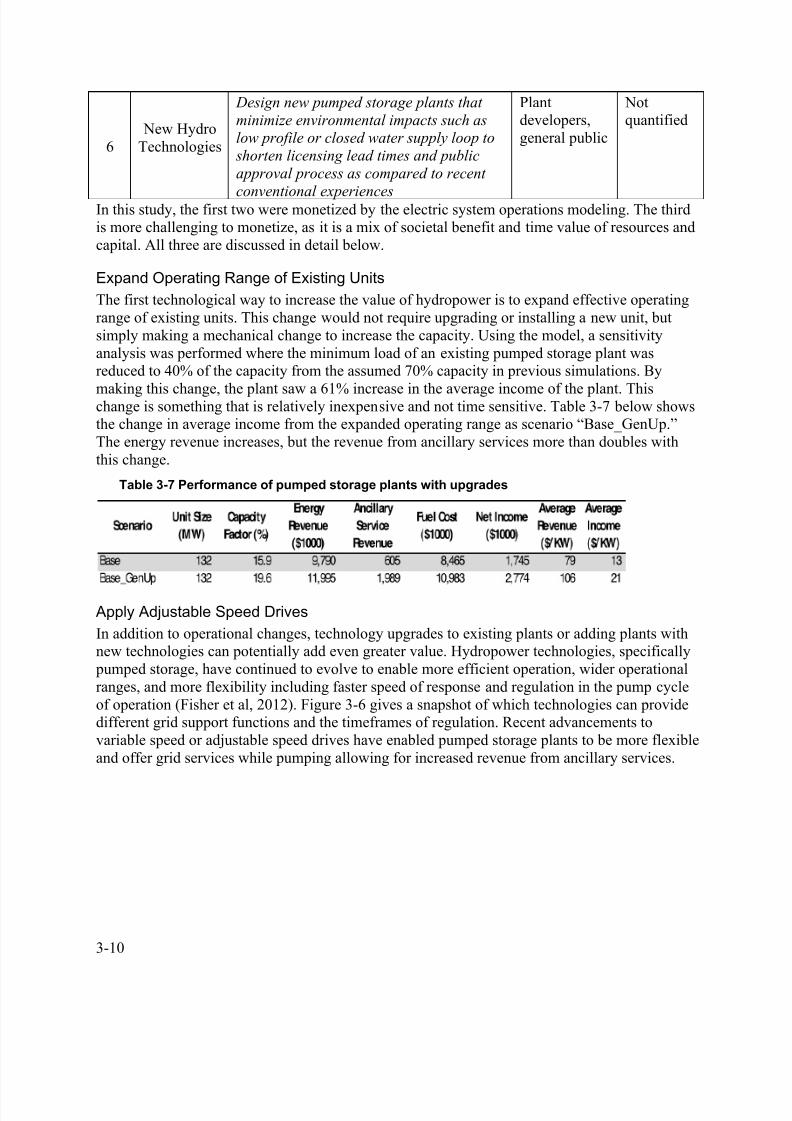
8/9/2019 Quantifying the Value of Hydropower
http://slidepdf.com/reader/full/quantifying-the-value-of-hydropower 48/78
3-10
6 New HydroTechnologies
Design new pumped storage plants that
minimize environmental impacts such aslow profile or closed water supply loop to
shorten licensing lead times and public
approval process as compared to recent
conventional experiences
Plantdevelopers,general public
Notquantified
In this study, the first two were monetized by the electric system operations modeling. The thirdis more challenging to monetize, as it is a mix of societal benefit and time value of resources andcapital. All three are discussed in detail below.
Expand Operating Range of Existing Units
The first technological way to increase the value of hydropower is to expand effective operatingrange of existing units. This change would not require upgrading or installing a new unit, butsimply making a mechanical change to increase the capacity. Using the model, a sensitivityanalysis was performed where the minimum load of an existing pumped storage plant wasreduced to 40% of the capacity from the assumed 70% capacity in previous simulations. By
making this change, the plant saw a 61% increase in the average income of the plant. Thischange is something that is relatively inexpensive and not time sensitive. Table 3-7 below showsthe change in average income from the expanded operating range as scenario “Base_GenUp.”The energy revenue increases, but the revenue from ancillary services more than doubles withthis change.
Table 3-7 Performance of pumped storage plants with upgrades
Apply Adjustable Speed Drives
In addition to operational changes, technology upgrades to existing plants or adding plants withnew technologies can potentially add even greater value. Hydropower technologies, specifically pumped storage, have continued to evolve to enable more efficient operation, wider operationalranges, and more flexibility including faster speed of response and regulation in the pump cycleof operation (Fisher et al, 2012). Figure 3-6 gives a snapshot of which technologies can providedifferent grid support functions and the timeframes of regulation. Recent advancements tovariable speed or adjustable speed drives have enabled pumped storage plants to be more flexibleand offer grid services while pumping allowing for increased revenue from ancillary services.
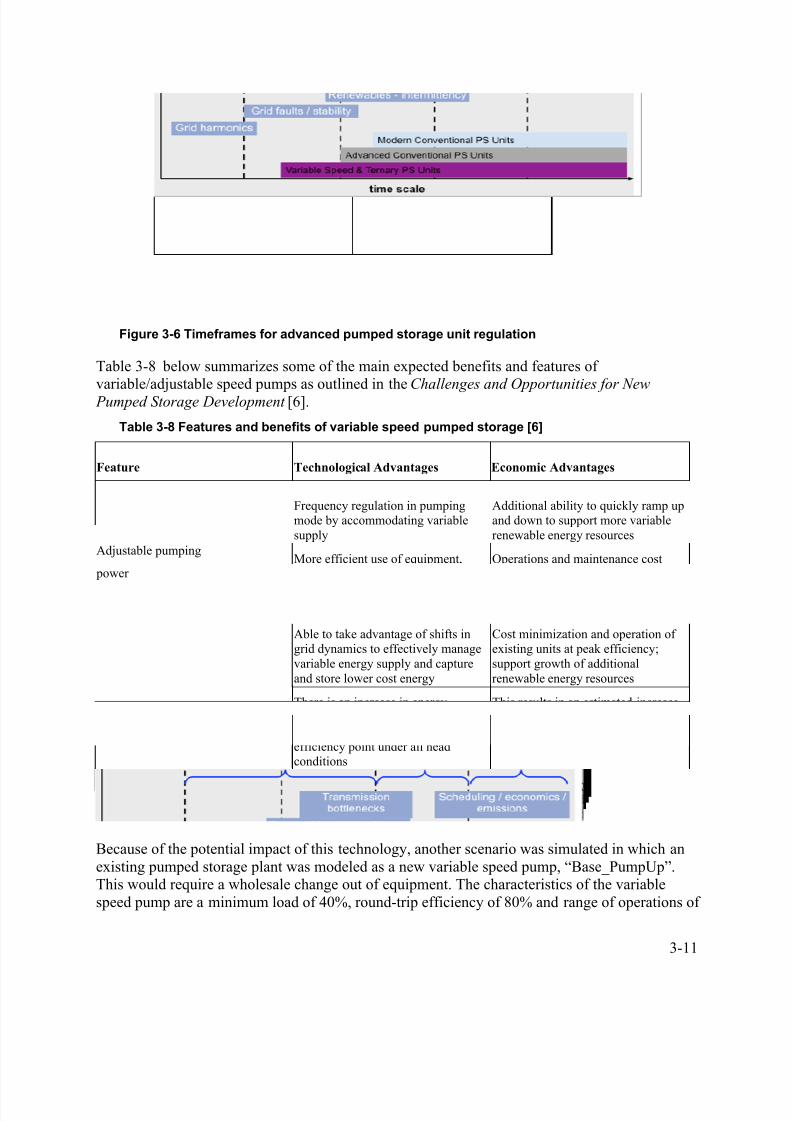
8/9/2019 Quantifying the Value of Hydropower
http://slidepdf.com/reader/full/quantifying-the-value-of-hydropower 49/78
3-11
Figure 3-6 Timeframes for advanced pumped storage unit regulation
Table 3-8 below summarizes some of the main expected benefits and features ofvariable/adjustable speed pumps as outlined in the Challenges and Opportunities for New
Pumped Storage Development [6].
Table 3-8 Features and benefits of variable speed pumped storage [6]
Feature Technological Advantages Economic Advantages
Adjustable pumping
power
Frequency regulation in pumpingmode by accommodating variablesupply
Additional ability to quickly ramp upand down to support more variablerenewable energy resources
More efficient use of equipment,reducing the need for thermal plant
cycling; critical for avoidinggreenhouse gas emissions
Operations and maintenance costreduction and increase of equipment
lifespan; greenhouse gas offsets ifmarket develops
Able to take advantage of shifts ingrid dynamics to effectively managevariable energy supply and captureand store lower cost energy
Cost minimization and operation ofexisting units at peak efficiency;support growth of additionalrenewable energy resources
There is an increase in energygeneration due to the fact that theturbine can be operated at its peakefficiency point under all headconditions
This results in an estimated increasein energy generated on the order of3% annually
Faster power adjustment and reactiontime
Improved balancing of variableenergy units (wind/solar) andcoordination of overall energy mix
More stable equipment translates intorisk reduction and increasedreliability of the domestic grid
Because of the potential impact of this technology, another scenario was simulated in which anexisting pumped storage plant was modeled as a new variable speed pump, “Base_PumpUp”.This would require a wholesale change out of equipment. The characteristics of the variablespeed pump are a minimum load of 40%, round-trip efficiency of 80% and range of operations of
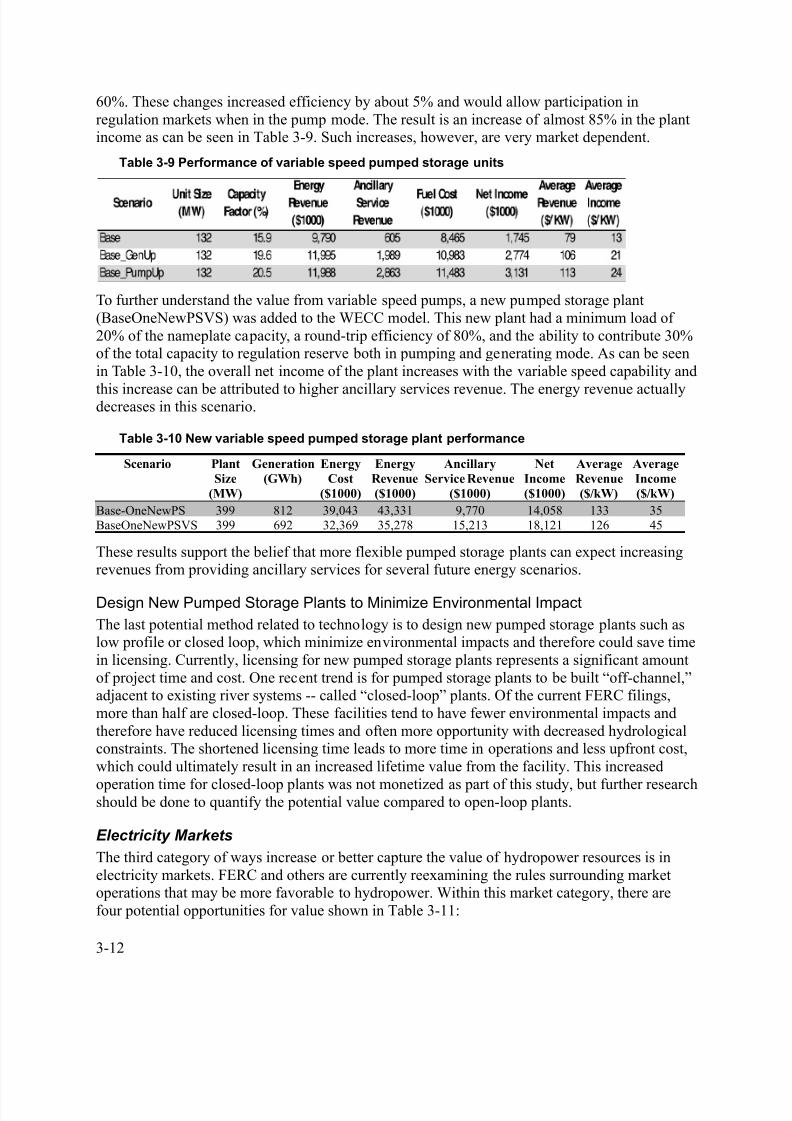
8/9/2019 Quantifying the Value of Hydropower
http://slidepdf.com/reader/full/quantifying-the-value-of-hydropower 50/78
3-12
60%. These changes increased efficiency by about 5% and would allow participation inregulation markets when in the pump mode. The result is an increase of almost 85% in the plantincome as can be seen in Table 3-9. Such increases, however, are very market dependent.
Table 3-9 Performance of variable speed pumped storage units
To further understand the value from variable speed pumps, a new pumped storage plant(BaseOneNewPSVS) was added to the WECC model. This new plant had a minimum load of20% of the nameplate capacity, a round-trip efficiency of 80%, and the ability to contribute 30%of the total capacity to regulation reserve both in pumping and generating mode. As can be seenin Table 3-10, the overall net income of the plant increases with the variable speed capability and
this increase can be attributed to higher ancillary services revenue. The energy revenue actuallydecreases in this scenario.
Table 3-10 New variable speed pumped storage plant performance
Scenario Plant
Size
(MW)
Generation
(GWh)
Energy
Cost
($1000)
Energy
Revenue
($1000)
Ancillary
Service Revenue
($1000)
Net
Income
($1000)
Average
Revenue
($/kW)
Average
Income
($/kW)
Base-OneNewPS 399 812 39,043 43,331 9,770 14,058 133 35BaseOneNewPSVS 399 692 32,369 35,278 15,213 18,121 126 45
These results support the belief that more flexible pumped storage plants can expect increasingrevenues from providing ancillary services for several future energy scenarios.
Design New Pumped Storage Plants to Minimize Environmental Impact
The last potential method related to technology is to design new pumped storage plants such aslow profile or closed loop, which minimize environmental impacts and therefore could save timein licensing. Currently, licensing for new pumped storage plants represents a significant amountof project time and cost. One recent trend is for pumped storage plants to be built “off-channel,”adjacent to existing river systems -- called “closed-loop” plants. Of the current FERC filings,more than half are closed-loop. These facilities tend to have fewer environmental impacts andtherefore have reduced licensing times and often more opportunity with decreased hydrologicalconstraints. The shortened licensing time leads to more time in operations and less upfront cost,which could ultimately result in an increased lifetime value from the facility. This increased
operation time for closed-loop plants was not monetized as part of this study, but further researchshould be done to quantify the potential value compared to open-loop plants.
Electricity Markets
The third category of ways increase or better capture the value of hydropower resources is inelectricity markets. FERC and others are currently reexamining the rules surrounding marketoperations that may be more favorable to hydropower. Within this market category, there arefour potential opportunities for value shown in Table 3-11:

8/9/2019 Quantifying the Value of Hydropower
http://slidepdf.com/reader/full/quantifying-the-value-of-hydropower 51/78
3-13
Table 3-11 Market ways to increase the value of hydropower
No.Value
StreamsWays to Increase Value Beneficiaries
Potential
Value
7
Electricity
Markets
Settle energy markets sub-hourly,increasing conventional and pumped
storage energy arbitrage opportunities withgrid demand load leveling benefits
Everybody 5%decrease in
electricity prices
8ElectricityMarkets
Have the Independent System Operators(ISOs) scheduling hydro to co-optimizeenergy and ancillary services within a balancing authority
Everybody 63-77%increase in profits PS
9ElectricityMarkets
Treat pumped storage as a new storage
asset class capturing the full value of
services and improving the economics inareas with resource constraints
Developers,owners, andgeneral public
Notquantified
10 ElectricityMarkets
Credit hydro for its very fast regulation
response in situations where resourceadequacy is a power system reliability
issue
Developers,
owners, NERCand general public
Not
quantified
In this study, the first two were studied through various modeling analysis. The third and fourthwas not modeled, as it requires modeling for very fast time scales and speculation of marketsituations where such fast response can be used. All four are discussed in detail below.
Settle Energy Markets Sub-hourly
One potential model is to allow open markets, including sub-hourly energy markets, to allow forwider participation. Sub-hourly energy scheduling benefits the power system by providing access
to the full flexibility of all generators. Sub-hourly markets allow generators to profit bycompensating generators for their flexibility. This is especially important for flexible hydro and pumped storage generators. Development of forward markets also has the potential to benefithydro and pumped storage resources that must schedule their production based on limited energyresources. Finally, developing a workable system through which demand response can be brought to the market would help to reduce market power in both energy and reserves markets,allowing all generators to receive competitive energy and ancillary service prices. The newFERC ruling on the Integration of Variable Energy Resources is a step towards this. The rulingremoved the barriers by requiring utility transmission owners to offer intra-hourly transmissionsscheduling.
The approach for electric system modeling first estimates the capacity expansion and generationmix, and then runs a production simulation with economic dispatch. Sub-hourly modelingdifferentiates the value of generation functions and services such as energy, regulation, spinningreserve, and non-spinning reserve. The valuation of hydro’s contribution to these components isdetermined from an hourly-resolution security-constrained unit commitment and economicdispatch model. The production cost simulations performed represent the movement of load andgeneration from one hour to the next by assuming average demand and supply across the hour.This means the analysis can effectively represent the value of hydro providing energy, as well as
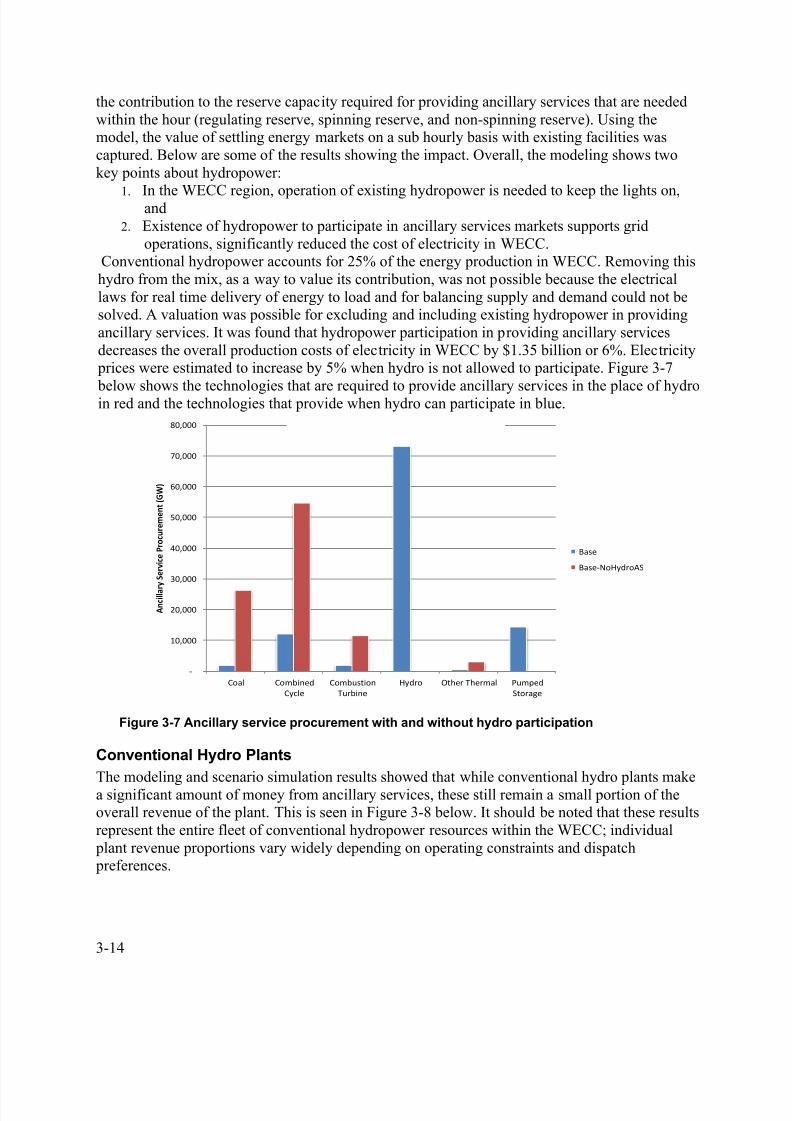
8/9/2019 Quantifying the Value of Hydropower
http://slidepdf.com/reader/full/quantifying-the-value-of-hydropower 52/78
3-14
the contribution to the reserve capacity required for providing ancillary services that are neededwithin the hour (regulating reserve, spinning reserve, and non-spinning reserve). Using themodel, the value of settling energy markets on a sub hourly basis with existing facilities wascaptured. Below are some of the results showing the impact. Overall, the modeling shows twokey points about hydropower:
1. In the WECC region, operation of existing hydropower is needed to keep the lights on,and2. Existence of hydropower to participate in ancillary services markets supports grid
operations, significantly reduced the cost of electricity in WECC.Conventional hydropower accounts for 25% of the energy production in WECC. Removing thishydro from the mix, as a way to value its contribution, was not possible because the electricallaws for real time delivery of energy to load and for balancing supply and demand could not besolved. A valuation was possible for excluding and including existing hydropower in providingancillary services. It was found that hydropower participation in providing ancillary servicesdecreases the overall production costs of electricity in WECC by $1.35 billion or 6%. Electricity prices were estimated to increase by 5% when hydro is not allowed to participate. Figure 3-7
below shows the technologies that are required to provide ancillary services in the place of hydroin red and the technologies that provide when hydro can participate in blue.
Figure 3-7 Ancillary service procurement with and without hydro participation
Conventional Hydro Plants
The modeling and scenario simulation results showed that while conventional hydro plants makea significant amount of money from ancillary services, these still remain a small portion of theoverall revenue of the plant. This is seen in Figure 3-8 below. It should be noted that these resultsrepresent the entire fleet of conventional hydropower resources within the WECC; individual plant revenue proportions vary widely depending on operating constraints and dispatch preferences.
-
10,000
20,000
30,000
40,000
50,000
60,000
70,000
80,000
Coal Combined
Cycle
Combustion
Turbine
Hydro Other Thermal Pumped
Storage
A n c i l l a r y S e r v i c e P r o c u r e m e n t ( G W )
Ancillary Service Procurement
Base
Base-NoHydroAS

8/9/2019 Quantifying the Value of Hydropower
http://slidepdf.com/reader/full/quantifying-the-value-of-hydropower 53/78
3-15
Figure 3-8 Conventional plant revenues ($1000) in base case
Also for conventional plants, adding variable generation and thus increasing the system reserverequirements increased total ancillary service revenue by $23 million with an average ancillaryservice income increase of $1.5/kW. In general, the average conventional hydropower plantreceived revenues ranging from $134 to $230/kW in the base case 2020 prior to the increase ofreserve requirements from variability discussed previously.
Pumped Storage Plants
A significant potential future value stream for pumped storage plants will be in providingancillary services in WECC. Figure 3-9 below shows the income when adding one new pumpedstorage plant in three different scenarios (Base-OneNewPS, Carbon-OneNewPS, Extreme-OneNewPS). The ancillary service revenue is a significant portion in each scenario, but in theextreme case when there is high demand, increased renewables and high natural gas prices, the pumped storage plant sees a significantly higher portion of ancillary service revenues.
Figure 3-9 Ancillary service and energy revenue when adding one new pumped storageplant
When looking WECC-wide across all the future scenarios, it was found that a pumped storageunit can receive 30%-50% of its revenues from ancillary services and the remaining from energyarbitrage. This can be seen in Figure 3-10 below. In addition, simulation results show that eightof the cases have greater than 40% of the 2020 revenues from ancillary services.
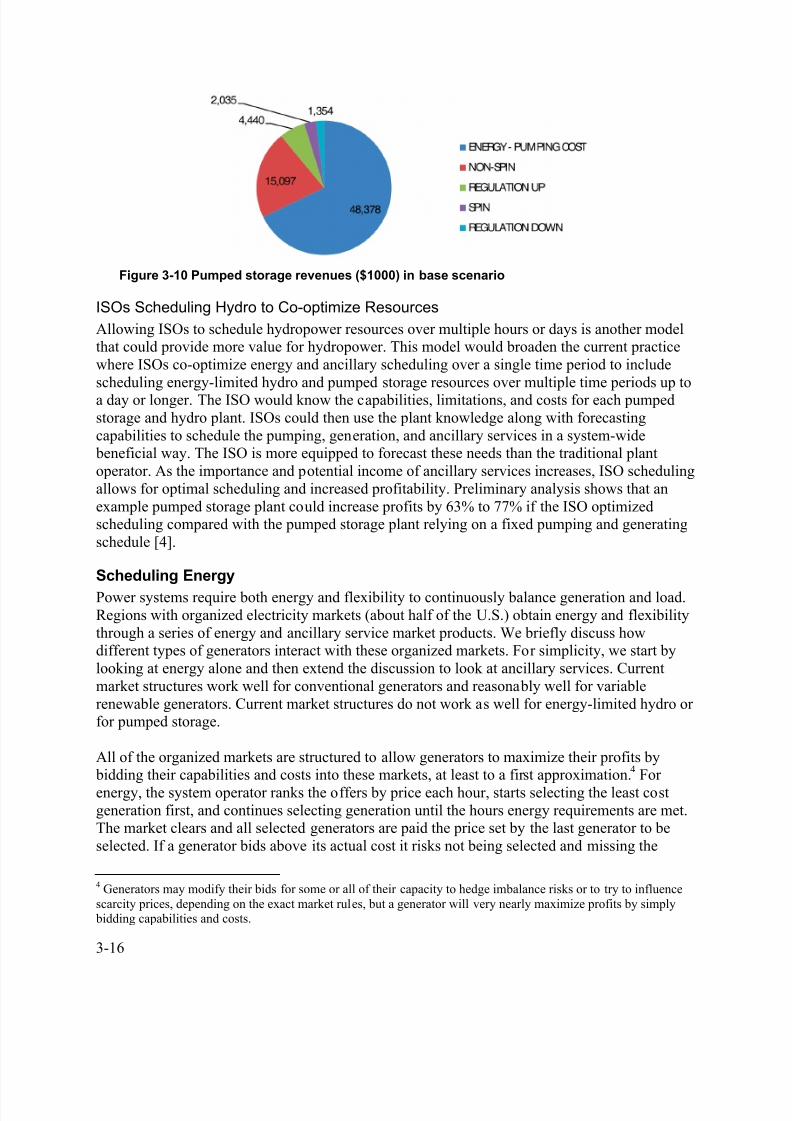
8/9/2019 Quantifying the Value of Hydropower
http://slidepdf.com/reader/full/quantifying-the-value-of-hydropower 54/78
3-16
Figure 3-10 Pumped storage revenues ($1000) in base scenario
ISOs Scheduling Hydro to Co-optimize Resources
Allowing ISOs to schedule hydropower resources over multiple hours or days is another modelthat could provide more value for hydropower. This model would broaden the current practicewhere ISOs co-optimize energy and ancillary scheduling over a single time period to includescheduling energy-limited hydro and pumped storage resources over multiple time periods up toa day or longer. The ISO would know the capabilities, limitations, and costs for each pumpedstorage and hydro plant. ISOs could then use the plant knowledge along with forecastingcapabilities to schedule the pumping, generation, and ancillary services in a system-wide beneficial way. The ISO is more equipped to forecast these needs than the traditional plantoperator. As the importance and potential income of ancillary services increases, ISO schedulingallows for optimal scheduling and increased profitability. Preliminary analysis shows that anexample pumped storage plant could increase profits by 63% to 77% if the ISO optimizedscheduling compared with the pumped storage plant relying on a fixed pumping and generatingschedule [4].
Scheduling Energy
Power systems require both energy and flexibility to continuously balance generation and load.Regions with organized electricity markets (about half of the U.S.) obtain energy and flexibilitythrough a series of energy and ancillary service market products. We briefly discuss howdifferent types of generators interact with these organized markets. For simplicity, we start bylooking at energy alone and then extend the discussion to look at ancillary services. Currentmarket structures work well for conventional generators and reasonably well for variablerenewable generators. Current market structures do not work as well for energy-limited hydro orfor pumped storage.
All of the organized markets are structured to allow generators to maximize their profits by bidding their capabilities and costs into these markets, at least to a first approximation.4 Forenergy, the system operator ranks the offers by price each hour, starts selecting the least costgeneration first, and continues selecting generation until the hours energy requirements are met.The market clears and all selected generators are paid the price set by the last generator to beselected. If a generator bids above its actual cost it risks not being selected and missing the
4 Generators may modify their bids for some or all of their capacity to hedge imbalance risks or to try to influencescarcity prices, depending on the exact market rules, but a generator will very nearly maximize profits by simply bidding capabilities and costs.
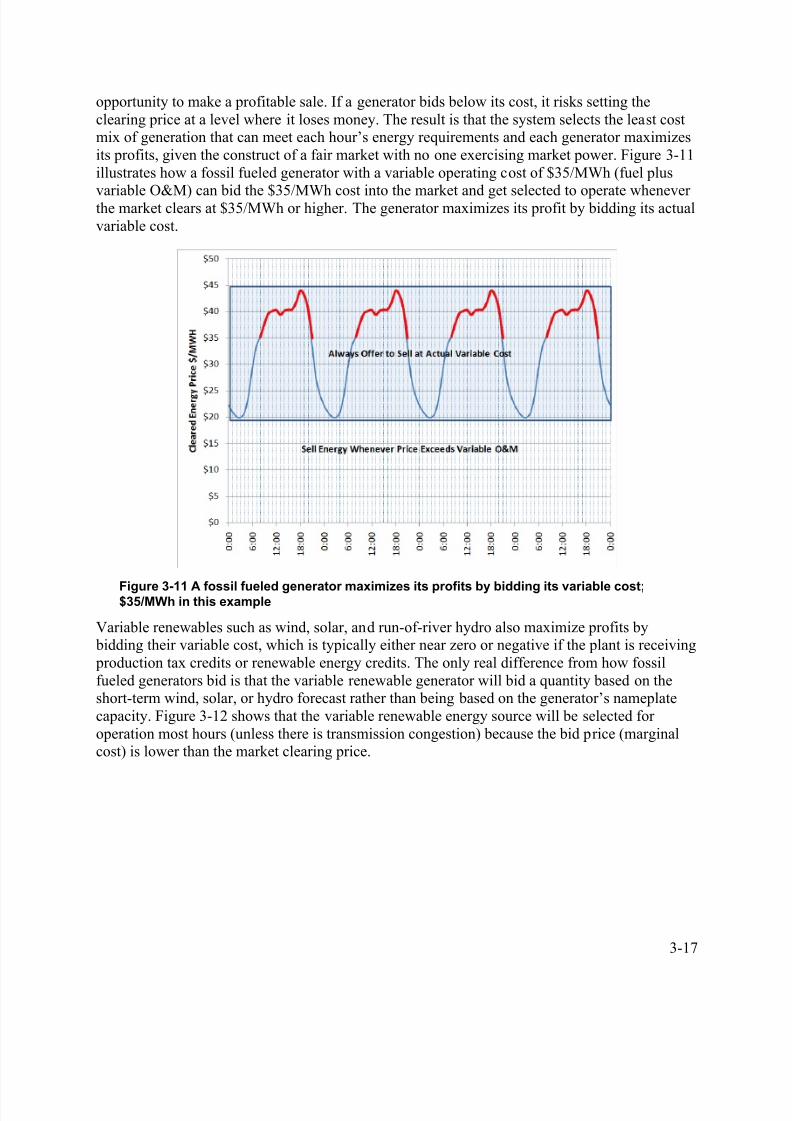
8/9/2019 Quantifying the Value of Hydropower
http://slidepdf.com/reader/full/quantifying-the-value-of-hydropower 55/78
3-17
opportunity to make a profitable sale. If a generator bids below its cost, it risks setting theclearing price at a level where it loses money. The result is that the system selects the least costmix of generation that can meet each hour’s energy requirements and each generator maximizesits profits, given the construct of a fair market with no one exercising market power. Figure 3-11illustrates how a fossil fueled generator with a variable operating cost of $35/MWh (fuel plus
variable O&M) can bid the $35/MWh cost into the market and get selected to operate wheneverthe market clears at $35/MWh or higher. The generator maximizes its profit by bidding its actualvariable cost.
Figure 3-11 A fossil fueled generator maximizes its profits by bidding its variable cost;$35/MWh in this example
Variable renewables such as wind, solar, and run-of-river hydro also maximize profits by bidding their variable cost, which is typically either near zero or negative if the plant is receiving production tax credits or renewable energy credits. The only real difference from how fossilfueled generators bid is that the variable renewable generator will bid a quantity based on theshort-term wind, solar, or hydro forecast rather than being based on the generator’s nameplatecapacity. Figure 3-12 shows that the variable renewable energy source will be selected foroperation most hours (unless there is transmission congestion) because the bid price (marginalcost) is lower than the market clearing price.
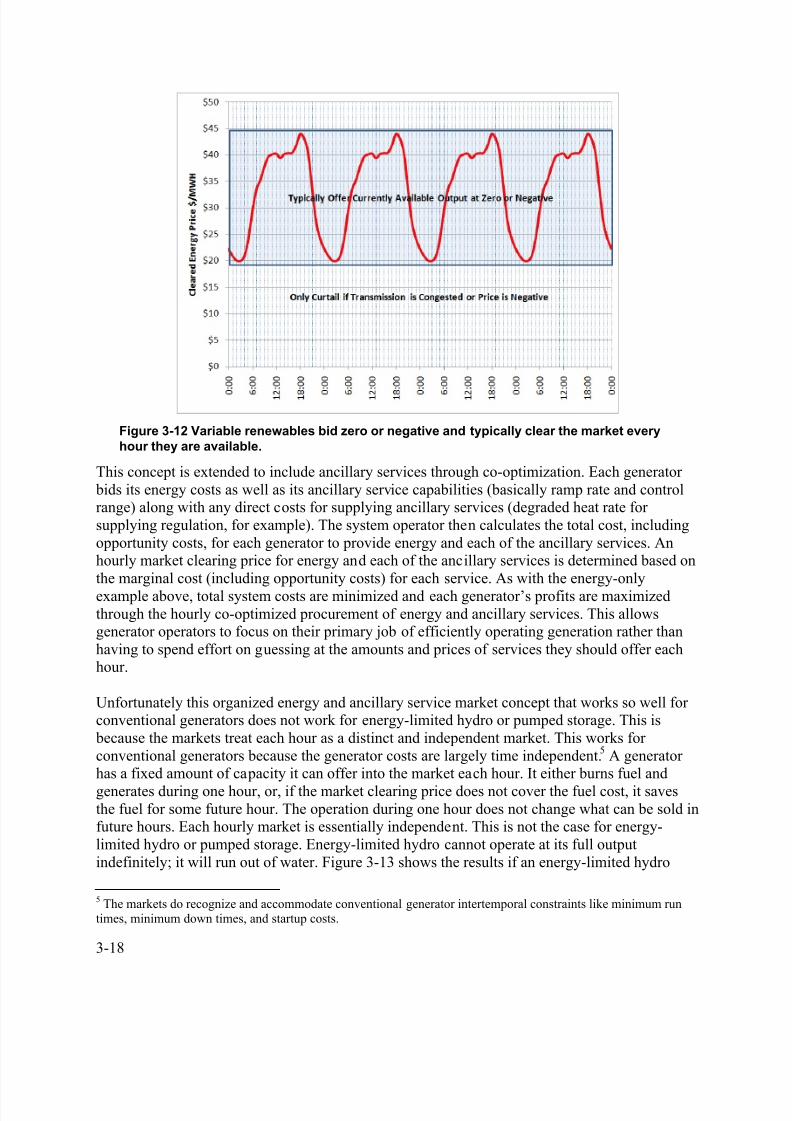
8/9/2019 Quantifying the Value of Hydropower
http://slidepdf.com/reader/full/quantifying-the-value-of-hydropower 56/78

8/9/2019 Quantifying the Value of Hydropower
http://slidepdf.com/reader/full/quantifying-the-value-of-hydropower 57/78
3-19
plant bids its marginal cost for as-available energy, similar to the optimal method for thermal plant bidding. This simplified hypothetical plant receives enough water each day to fill its 6-hourreservoir. If it simply offers this capability to the hourly energy market it will likely be selectedevery hour until the water runs out (midnight to 6am since each trading day starts at midnight)and it will miss the opportunity to sell during later higher priced hours.
Figure 3-13 Hourly energy markets do not optimize the scheduling of energy-limited hydro.
Instead, the energy-limited hydro plant should ration its production and sell during the highest- price hours it is able, given a forecast window that may span days or weeks. This is best for thehydro plant because it maximizes profits and it is best for society because it reduces overall production costs. Figure 3-14 shows how the plant must not offer its capacity at cost. Instead itshould guess at the expected energy market clearing prices and either: only offer during theexpected six highest-price hours; or bias its offer price up during the expected lower-price hoursand bias it down during the expected highest-price hours. The plant operator must forecast boththe clearing prices and their timing.
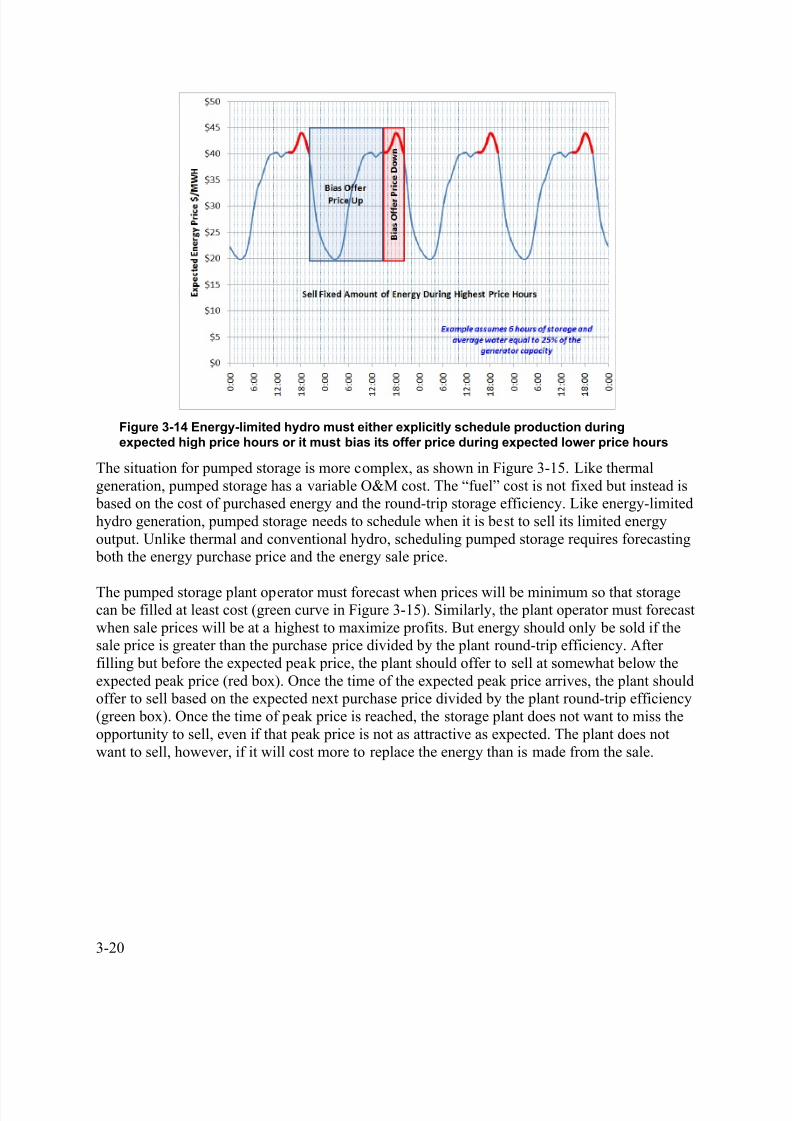
8/9/2019 Quantifying the Value of Hydropower
http://slidepdf.com/reader/full/quantifying-the-value-of-hydropower 58/78
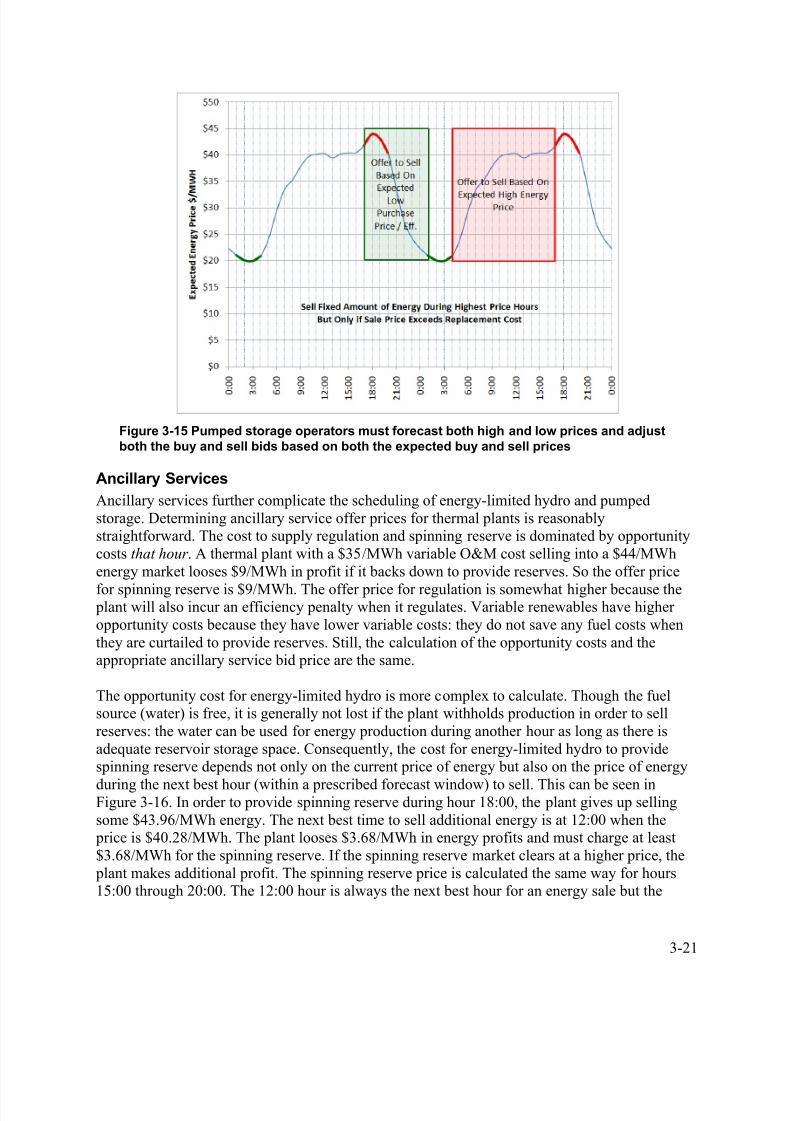
8/9/2019 Quantifying the Value of Hydropower
http://slidepdf.com/reader/full/quantifying-the-value-of-hydropower 59/78
3-21
Figure 3-15 Pumped storage operators must forecast both high and low prices and adjustboth the buy and sell bids based on both the expected buy and sell prices
Ancillary Services
Ancillary services further complicate the scheduling of energy-limited hydro and pumpedstorage. Determining ancillary service offer prices for thermal plants is reasonablystraightforward. The cost to supply regulation and spinning reserve is dominated by opportunitycosts that hour . A thermal plant with a $35/MWh variable O&M cost selling into a $44/MWhenergy market looses $9/MWh in profit if it backs down to provide reserves. So the offer price
for spinning reserve is $9/MWh. The offer price for regulation is somewhat higher because the plant will also incur an efficiency penalty when it regulates. Variable renewables have higheropportunity costs because they have lower variable costs: they do not save any fuel costs whenthey are curtailed to provide reserves. Still, the calculation of the opportunity costs and theappropriate ancillary service bid price are the same.
The opportunity cost for energy-limited hydro is more complex to calculate. Though the fuelsource (water) is free, it is generally not lost if the plant withholds production in order to sellreserves: the water can be used for energy production during another hour as long as there isadequate reservoir storage space. Consequently, the cost for energy-limited hydro to providespinning reserve depends not only on the current price of energy but also on the price of energy
during the next best hour (within a prescribed forecast window) to sell. This can be seen inFigure 3-16. In order to provide spinning reserve during hour 18:00, the plant gives up sellingsome $43.96/MWh energy. The next best time to sell additional energy is at 12:00 when the price is $40.28/MWh. The plant looses $3.68/MWh in energy profits and must charge at least$3.68/MWh for the spinning reserve. If the spinning reserve market clears at a higher price, the plant makes additional profit. The spinning reserve price is calculated the same way for hours15:00 through 20:00. The 12:00 hour is always the next best hour for an energy sale but the

8/9/2019 Quantifying the Value of Hydropower
http://slidepdf.com/reader/full/quantifying-the-value-of-hydropower 60/78
3-22
energy market price varies and consequently the opportunity cost and the spinning reserve costvaries too.
For hours 0:00 through 14:00 and 21:00 through 0:00, the plant was not planning to sell energy.With only 6 hours of storage, these hours are not as attractive for energy sales. In order to sell
spinning reserve during these hours the plant would have to operate at minimum load (assumedto be 50% for this example). That means that the plant would have to forego energy sales duringa more profitable hour (20:00 at $40.35/MWh, the lowest energy price hour when the plant was planning on generating), and sell energy during a less profitable hour (3:00 at $19.99/MWh, forexample) in order to be able to sell spin during that hour. The 3:00 cost for spin would then be$20.36/MWh to compensate for the lost energy profit.
Figure 3-16 Energy-limited hydro cost to supply spinning reserve depends on the hour it isdelivered and on how many other hours of spin are being provided
Spinning reserve costs rise if spin is to be provided for multiple hours. If spin is to be providedfor a second hour between 15:00 and 20:00, then the excess energy could still be sold during the12:00 hour selling 100% output instead of 50% so the opportunity costs are the same. If spin is to be sold for a third hour, the cost rises because a lower price hour (14:00 at $40.17) must beselected to sell the excess energy. Spin costs continue to rise as spin is provided for additionalhours.
Pumped storage adds another layer of complexity with the necessity of considering fulldistribution of forecasted prices by hour, with the goal of establishing threshold prices for pumping as well as generating.
8/9/2019 Quantifying the Value of Hydropower
http://slidepdf.com/reader/full/quantifying-the-value-of-hydropower 61/78
3-23
Extending Co-optimization
ISOs co-optimize energy and ancillary services for conventional generators every hour becausethis optimizes the use of generation resources. Both the generators and society benefit. Thegenerators no longer have to guess at the likely energy and ancillary services market clearing prices. They simply offer their capabilities and costs and their plant is optimally scheduled by the
system operator each hour. Society benefits because co-optimization makes the most efficientuse of all the resources and minimizes total costs. Unfortunately, co-optimization typically treatseach hour independently.
It may be appropriate to extend this co-optimization to cover the multi-hour scheduling horizonof energy storage. As with conventional generation, this would benefit both the storage plantsand the rest of the power system customers by optimizing the use of the limited resources.Society does not benefit from making hydro and pumped storage guess at future power prices;indeed, these resources could be operated to provide much greater grid benefits with animproved scheduling horizon.
Treat Pumped Storage as a New Storage Asset ClassAnother potential option is for pumped storage plants to be treated as a new storage assetclass. The current regulatory structure does not allow resources to be compensated for providing regulated transmission support while also supplying competitive energy andancillary services. The National Hydropower Association has recommended that a newasset class be created to allow storage to be compensated for being able to support thegrid during both low and high demand periods. Included in the recommendation arecontracts to allow for procurement of long-term ancillary services in which pumpedstorage can help mitigate the effects of increased variable renewable generation capacity.Figure 3-17 gives an example of how this asset class could work. This model could provide increased value by compensating pumped storage for the grid support and
functionality they can provide specifically. This model is similar to a “Pay forPerformance” method.

8/9/2019 Quantifying the Value of Hydropower
http://slidepdf.com/reader/full/quantifying-the-value-of-hydropower 62/78
3-24
Figure 3-17 Example of pumped storage as a new storage asset
Based on the recent adoption of FERC’s Pay for Performance rules, markets for ancillaryservices will likely become more transparent and more accessible to a wider variety of resources.In addition, the pay for performance rules likely will lead to definition of new products that canresult in new revenue streams for generators. Moves in this direction by ISO/RTO organizationsare already evident—MISO is considering a product for “flexible ramping” as is CAISO. ISO- NE already has such a product in effect in its “mileage payments.”
Accordingly, flexibility and rapid, accurate response, such as can be obtained by energy storage
resources, will likely become relatively more valued in these future markets. Furthermore,flexibility can be used to take advantage of spikes in energy markets such as those seen in therecent past. This requires market “savvy” and an institutional arrangement based on quickdecision making. Finally, due to long-term changes in the nature of U.S. electricity demand, it is possible that the current trend to a more predominant peak load may provide hydro operatorswith opportunities to obtain more revenue from energy markets. Whether hydro can play a largerrole in the new grid future may depend on the willingness of hydro facility operators to operatetheir facilities to provide the maximum amount of flexibility to the power system.
Credit Hydro for Fast Regulation
The last method under the market is to capture the value of allowing hydro to receive credit for
providing very fast regulation. Hydropower could gain additional value by providing dynamicreactive power support, primary frequency response, and within-hour deployment services. Inthis study, this value was not captured because the study used an hourly model. A new projecthas been initiated by the Department of Energy entitled Detailed Analysis to Demonstrate theValue of Advanced Pumped Storage Hydropower in the U.S. The goal of the project is to create amodel that will evaluate pumped storage hydro’s contribution on the second and sub-second basis (the conclusions of this study should be applicable to large conventional hydropower units

8/9/2019 Quantifying the Value of Hydropower
http://slidepdf.com/reader/full/quantifying-the-value-of-hydropower 63/78
3-25
as well). More work needs to be done in this area to understand what value there may be in thisvery fast timeframe, and whether hydropower or other resources can benefit from it.

8/9/2019 Quantifying the Value of Hydropower
http://slidepdf.com/reader/full/quantifying-the-value-of-hydropower 64/78
8/9/2019 Quantifying the Value of Hydropower
http://slidepdf.com/reader/full/quantifying-the-value-of-hydropower 65/78
4-1
4CONCLUSIONS & FUTURE RESEARCH
The study confirmed that hydropower resources across the United States contribute significantlyto operation of the grid in terms of energy, capacity, and ancillary services. With approximately75GW of conventional and 22GW of pumped storage, hydro represents about 9% of generationcapacity and about 7% of electric generation in the US. Although new dams have not been anactive option, there are many plant upgrades ongoing for within this existing US conventionalhydropower fleet. Significant upgrades have also been undertaken in many of the existing pumped storage plants. Construction of new pumped storage continues to be in active discussion,although siting and justifying the cost remains very challenging. But, pumped storage remains a
viable option for large new hydro capacity assets in the U.S.
In this study a significant effort was applied to modeling and simulation to predict the future roleof hydropower with many different possible energy scenarios. For this part of the project, thevalue of hydro power was quantified using current electricity market rules and the best availablesecurity-constrained economic dispatch modeling tools. Of the ten different potential valuestreams identified, we were able to quantify six and apply these to specific scenarios in theWECC region of the U.S.
The value was quantified from operating efficiency improvements, fleet support, technologyupgrades to increase operating range and services, and faster settling time and co-optimization in
electricity markets. These were considered to look at adding pumped storage in WECC. Over awide range of possible energy futures, up to 2020, and using current market rules, none of thecases investigated in the region were found to bring revenues sufficient to justify newconstruction.
It should be noted that considering additional potential value streams and extending the timehorizon of the analysis may change this result. Regarding the value streams, this study was notable to quantify several of the values identified. For example, capturing very fast regulation and providing flexibility reserves to accommodate larger penetration of variable renewable energyresources (wind and solar) may increase the ancillary service revenue opportunities for pumpedstorage. Also increasing the research time horizon, and the related electric system assumptions, beyond 2020 could be explored. Considering these factors in future research is recommended.
Ten Ways to Increase the Value of Hydropower Assets
From the step-by-step project development, tasks areas of investigation, and interactions withkey stakeholders, we are able to point out ten ways to potentially increase the value ofhydropower to the electric grid. This final report focused on the ten different value streamsidentified during the study and describes each one. These are intended to be non-overlapping andcan be conveniently categorized as operational improvements, new hydro technology, and
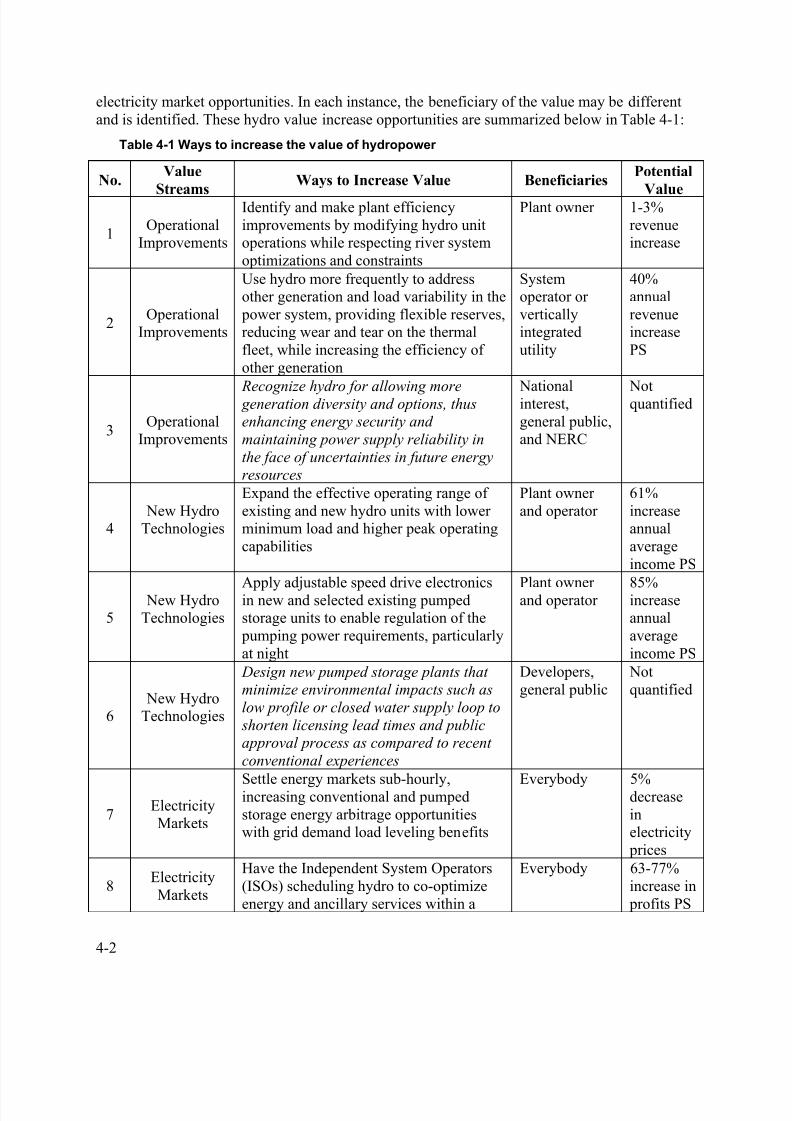
8/9/2019 Quantifying the Value of Hydropower
http://slidepdf.com/reader/full/quantifying-the-value-of-hydropower 66/78
4-2
electricity market opportunities. In each instance, the beneficiary of the value may be differentand is identified. These hydro value increase opportunities are summarized below in Table 4-1:
Table 4-1 Ways to increase the value of hydropower
No.Value
Streams
Ways to Increase Value BeneficiariesPotential
Value
1Operational
Improvements
Identify and make plant efficiencyimprovements by modifying hydro unitoperations while respecting river systemoptimizations and constraints
Plant owner 1-3%revenueincrease
2Operational
Improvements
Use hydro more frequently to addressother generation and load variability in the power system, providing flexible reserves,reducing wear and tear on the thermalfleet, while increasing the efficiency ofother generation
Systemoperator orverticallyintegratedutility
40%annualrevenueincreasePS
3Operational
Improvements
Recognize hydro for allowing more generation diversity and options, thusenhancing energy security and
maintaining power supply reliability in
the face of uncertainties in future energyresources
Nationalinterest,general public,and NERC
Notquantified
4 New HydroTechnologies
Expand the effective operating range ofexisting and new hydro units with lowerminimum load and higher peak operatingcapabilities
Plant ownerand operator
61%increaseannualaverageincome PS
5 New HydroTechnologies
Apply adjustable speed drive electronicsin new and selected existing pumpedstorage units to enable regulation of the pumping power requirements, particularlyat night
Plant ownerand operator 85%increaseannualaverageincome PS
6 New HydroTechnologies
Design new pumped storage plants thatminimize environmental impacts such as
low profile or closed water supply loop to
shorten licensing lead times and publicapproval process as compared to recent
conventional experiences
Developers,general public
Notquantified
7ElectricityMarkets
Settle energy markets sub-hourly,increasing conventional and pumpedstorage energy arbitrage opportunitieswith grid demand load leveling benefits
Everybody 5%decreaseinelectricity prices
8ElectricityMarkets
Have the Independent System Operators(ISOs) scheduling hydro to co-optimizeenergy and ancillary services within a
Everybody 63-77%increase in profits PS
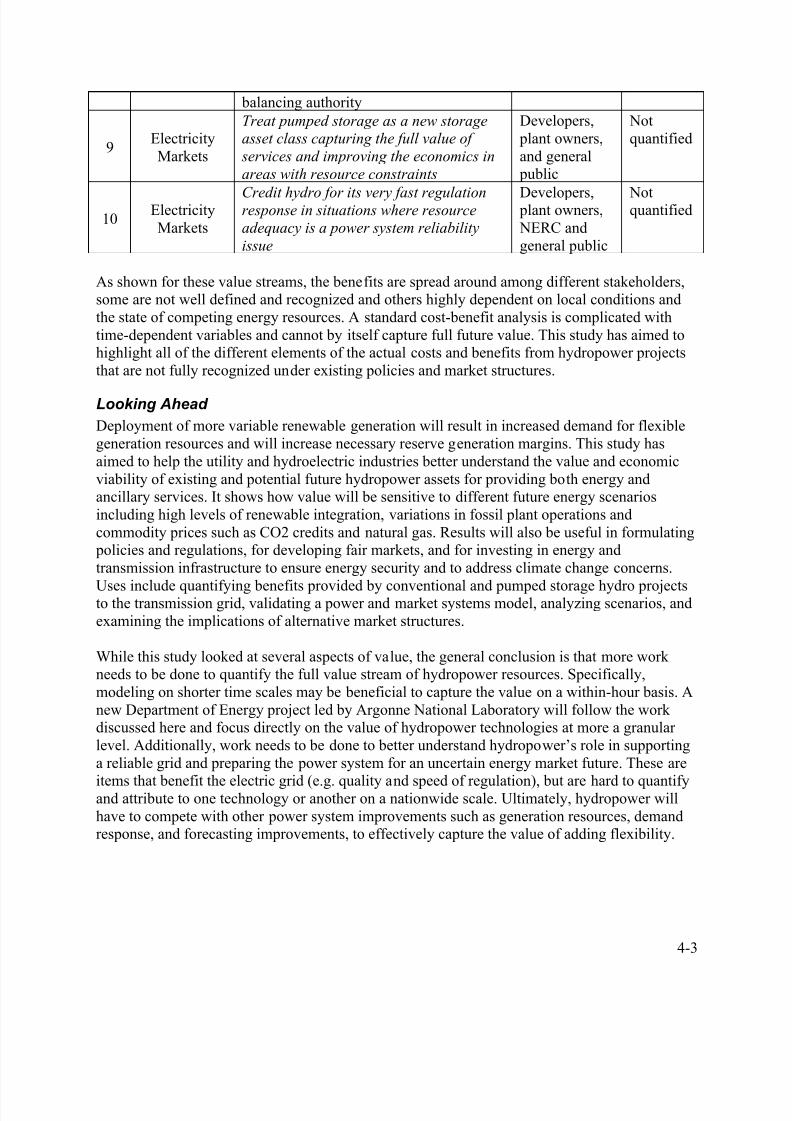
8/9/2019 Quantifying the Value of Hydropower
http://slidepdf.com/reader/full/quantifying-the-value-of-hydropower 67/78
4-3
balancing authority
9ElectricityMarkets
Treat pumped storage as a new storageasset class capturing the full value of
services and improving the economics in
areas with resource constraints
Developers, plant owners,and general public
Notquantified
10ElectricityMarkets
Credit hydro for its very fast regulationresponse in situations where resourceadequacy is a power system reliability
issue
Developers, plant owners, NERC andgeneral public
Notquantified
As shown for these value streams, the benefits are spread around among different stakeholders,some are not well defined and recognized and others highly dependent on local conditions andthe state of competing energy resources. A standard cost-benefit analysis is complicated withtime-dependent variables and cannot by itself capture full future value. This study has aimed tohighlight all of the different elements of the actual costs and benefits from hydropower projectsthat are not fully recognized under existing policies and market structures.
Looking Ahead
Deployment of more variable renewable generation will result in increased demand for flexiblegeneration resources and will increase necessary reserve generation margins. This study hasaimed to help the utility and hydroelectric industries better understand the value and economicviability of existing and potential future hydropower assets for providing both energy andancillary services. It shows how value will be sensitive to different future energy scenariosincluding high levels of renewable integration, variations in fossil plant operations andcommodity prices such as CO2 credits and natural gas. Results will also be useful in formulating policies and regulations, for developing fair markets, and for investing in energy andtransmission infrastructure to ensure energy security and to address climate change concerns.
Uses include quantifying benefits provided by conventional and pumped storage hydro projectsto the transmission grid, validating a power and market systems model, analyzing scenarios, andexamining the implications of alternative market structures.
While this study looked at several aspects of value, the general conclusion is that more workneeds to be done to quantify the full value stream of hydropower resources. Specifically,modeling on shorter time scales may be beneficial to capture the value on a within-hour basis. Anew Department of Energy project led by Argonne National Laboratory will follow the workdiscussed here and focus directly on the value of hydropower technologies at more a granularlevel. Additionally, work needs to be done to better understand hydropower’s role in supportinga reliable grid and preparing the power system for an uncertain energy market future. These are
items that benefit the electric grid (e.g. quality and speed of regulation), but are hard to quantifyand attribute to one technology or another on a nationwide scale. Ultimately, hydropower willhave to compete with other power system improvements such as generation resources, demandresponse, and forecasting improvements, to effectively capture the value of adding flexibility.

8/9/2019 Quantifying the Value of Hydropower
http://slidepdf.com/reader/full/quantifying-the-value-of-hydropower 68/78
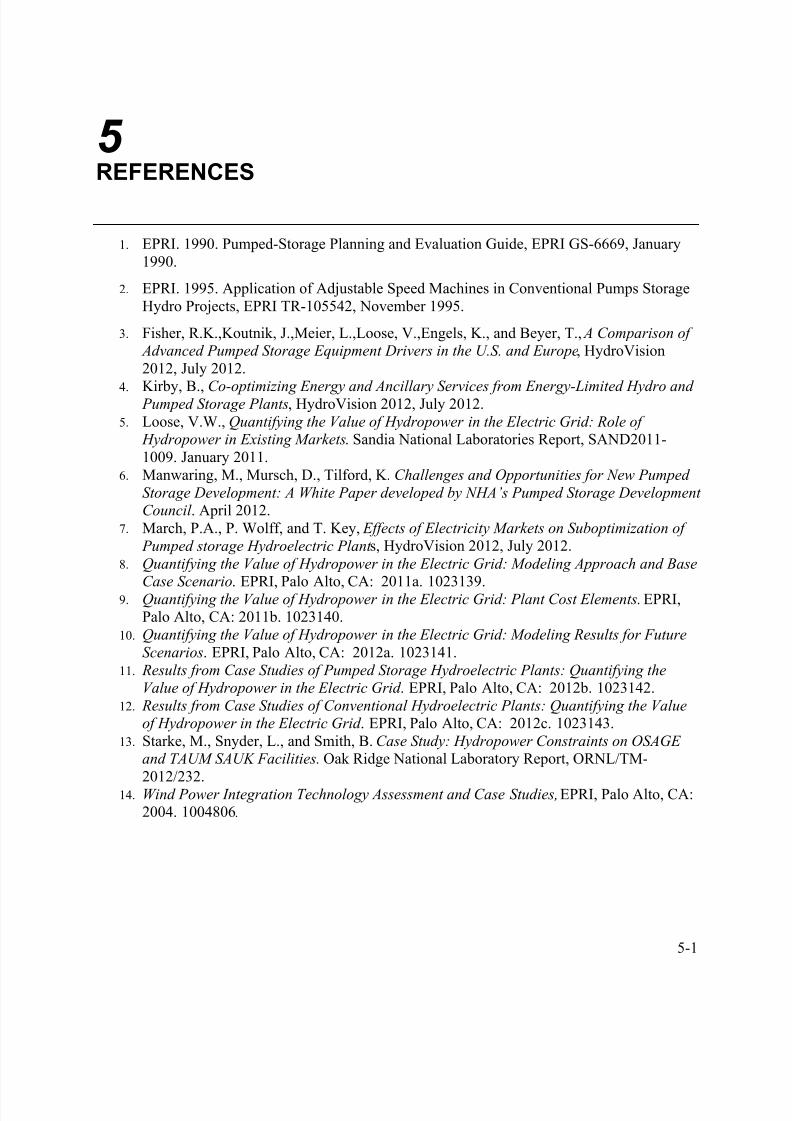
8/9/2019 Quantifying the Value of Hydropower
http://slidepdf.com/reader/full/quantifying-the-value-of-hydropower 69/78
5-1
5REFERENCES
1. EPRI. 1990. Pumped-Storage Planning and Evaluation Guide, EPRI GS-6669, January1990.
2. EPRI. 1995. Application of Adjustable Speed Machines in Conventional Pumps StorageHydro Projects, EPRI TR-105542, November 1995.
3. Fisher, R.K.,Koutnik, J.,Meier, L.,Loose, V.,Engels, K., and Beyer, T., A Comparison of Advanced Pumped Storage Equipment Drivers in the U.S. and Europe, HydroVision2012, July 2012.
4. Kirby, B., Co-optimizing Energy and Ancillary Services from Energy-Limited Hydro and Pumped Storage Plants, HydroVision 2012, July 2012.5. Loose, V.W., Quantifying the Value of Hydropower in the Electric Grid: Role of
Hydropower in Existing Markets. Sandia National Laboratories Report, SAND2011-1009. January 2011.
6. Manwaring, M., Mursch, D., Tilford, K. Challenges and Opportunities for New Pumped
Storage Development: A White Paper developed by NHA’s Pumped Storage DevelopmentCouncil . April 2012.
7. March, P.A., P. Wolff, and T. Key, Effects of Electricity Markets on Suboptimization of
Pumped storage Hydroelectric Plant s, HydroVision 2012, July 2012.8. Quantifying the Value of Hydropower in the Electric Grid: Modeling Approach and Base
Case Scenario. EPRI, Palo Alto, CA: 2011a. 1023139.9. Quantifying the Value of Hydropower in the Electric Grid: Plant Cost Elements. EPRI,Palo Alto, CA: 2011b. 1023140.
10. Quantifying the Value of Hydropower in the Electric Grid: Modeling Results for Future
Scenarios. EPRI, Palo Alto, CA: 2012a. 1023141.11. Results from Case Studies of Pumped Storage Hydroelectric Plants: Quantifying the
Value of Hydropower in the Electric Grid . EPRI, Palo Alto, CA: 2012b. 1023142.12. Results from Case Studies of Conventional Hydroelectric Plants: Quantifying the Value
of Hydropower in the Electric Grid . EPRI, Palo Alto, CA: 2012c. 1023143.13. Starke, M., Snyder, L., and Smith, B. Case Study: Hydropower Constraints on OSAGE
and TAUM SAUK Facilities. Oak Ridge National Laboratory Report, ORNL/TM-2012/232.
14. Wind Power Integration Technology Assessment and Case Studies, EPRI, Palo Alto, CA:2004. 1004806.

8/9/2019 Quantifying the Value of Hydropower
http://slidepdf.com/reader/full/quantifying-the-value-of-hydropower 70/78
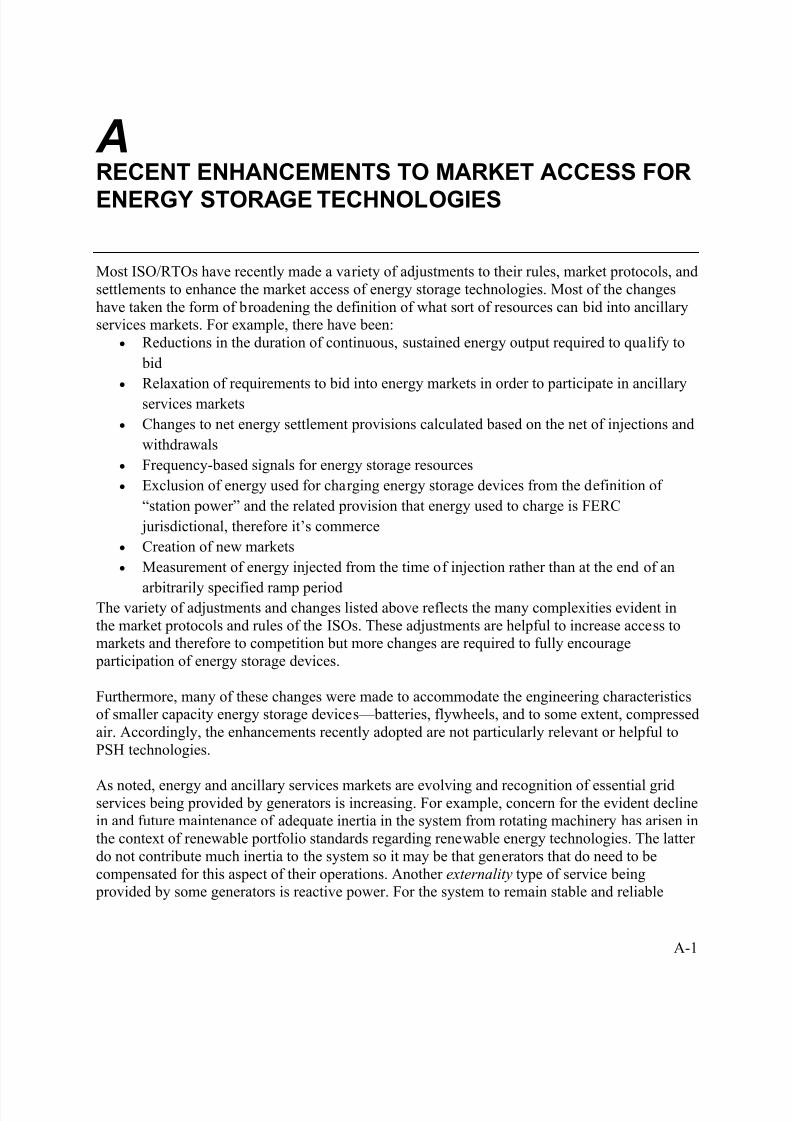
8/9/2019 Quantifying the Value of Hydropower
http://slidepdf.com/reader/full/quantifying-the-value-of-hydropower 71/78
A-1
ARECENT ENHANCEMENTS TO MARKET ACCESS FOR
ENERGY STORAGE TECHNOLOGIES
Most ISO/RTOs have recently made a variety of adjustments to their rules, market protocols, andsettlements to enhance the market access of energy storage technologies. Most of the changeshave taken the form of broadening the definition of what sort of resources can bid into ancillaryservices markets. For example, there have been:
• Reductions in the duration of continuous, sustained energy output required to qualify to
bid
• Relaxation of requirements to bid into energy markets in order to participate in ancillary
services markets
• Changes to net energy settlement provisions calculated based on the net of injections and
withdrawals
• Frequency-based signals for energy storage resources
• Exclusion of energy used for charging energy storage devices from the definition of
“station power” and the related provision that energy used to charge is FERC
jurisdictional, therefore it’s commerce
• Creation of new markets
• Measurement of energy injected from the time of injection rather than at the end of an
arbitrarily specified ramp periodThe variety of adjustments and changes listed above reflects the many complexities evident inthe market protocols and rules of the ISOs. These adjustments are helpful to increase access tomarkets and therefore to competition but more changes are required to fully encourage participation of energy storage devices.
Furthermore, many of these changes were made to accommodate the engineering characteristicsof smaller capacity energy storage devices—batteries, flywheels, and to some extent, compressedair. Accordingly, the enhancements recently adopted are not particularly relevant or helpful toPSH technologies.
As noted, energy and ancillary services markets are evolving and recognition of essential gridservices being provided by generators is increasing. For example, concern for the evident declinein and future maintenance of adequate inertia in the system from rotating machinery has arisen inthe context of renewable portfolio standards regarding renewable energy technologies. The latterdo not contribute much inertia to the system so it may be that generators that do need to becompensated for this aspect of their operations. Another externality type of service being provided by some generators is reactive power. For the system to remain stable and reliable

8/9/2019 Quantifying the Value of Hydropower
http://slidepdf.com/reader/full/quantifying-the-value-of-hydropower 72/78
A-2
adequate incentives to provide these services must be instituted.6 If revenues covered every
service that is provided by generators, then it should be the case that sufficient compensation isavailable so that the required reserves of capacity and energy are available to the system and
asset owners would have the continued incentive to make investments.
Beyond these constraints there is an issue facing PSH operators that merits serious attention— market power. FERC is very concerned about market power as evidenced by the recent NOI on
Ancillary Service, much of which is focused on market power issues. Operators of ISO/RTOs are
equally concerned about competitiveness in bidding into both energy and reserves markets; everyone of the ISOs has a market monitoring function that regularly assesses the competitiveness of
bidding. Market power concerns are particularly acute in reserves markets because fewer
generators are capable of bidding into them and the markets are generally smaller in terms of theamount of energy or capacity transacted within them. Bidding into reserves markets by owners
of conventional generators is already restricted to only those generators that possess the technical
characteristics that render them capable of meeting the requirements for the particular type ofreserve. Many balancing areas will have a reserve requirement that is less than the capacity of a
typical PSH project. Thus, one large bidder (a 1,000 MW PSH plant?) might be competing witha number of bidders whose assets are much smaller—on the order of 1 MW or less. Because of
the way in which economists evaluate the potential for market power the concentration ratio(market shares of the largest competitors) in this situation might indicate a serious potential
problem. Behavioral measures tend to suggest the exercise of market power. These include
pivotal bid frequency, ratios of bid volumes to required volumes, and ratio of actual prices tocompetitive prices.
There are ways to mitigate this potential problem. New competition can be encouraged byfurther reducing the restrictions and definitions that competitors see as barriers to entry. Also,
wider geographic participation can be encouraged; in particular, larger balancing areas mightgreatly reduce the concentration ratio problems of smaller balancing areas. Development of
forward markets also has the potential to reduce market power potential. Finally, developing a
workable system through which demand response can be brought to the market would help toreduce market power in both energy and reserves markets.
Previous Studies on the Role of Hydropower with Renewables
Development of new hydro generation assets has stalled for many years. Stakeholders stated that
policy and market incentives have been insufficient to overcome permitting difficulties andfinancial risks. However, hydro resources, particularly PSH are expected to play a more
prominent role as the need for flexibility in the system increases, i.e. as the penetration of
variable renewable increases. Furthermore, as the evolution to wholesale markets expands and
markets become more fine-tuned through application of “Pay for Performance,” compensationopportunities to flexible and quick-response resources such as PSH will increase the financial
6 Externalities are benefits (or costs) provided to the system generally that do not pass through a market and for
which no mechanism for compensation (or payment) is available in the system.

8/9/2019 Quantifying the Value of Hydropower
http://slidepdf.com/reader/full/quantifying-the-value-of-hydropower 73/78
A-3
and economic incentives to more fully utilize existing facilities. 7 This should, in turn, provide
incentives to construction of new PSH facilities.
Eastern and Western Interconnection Wind Integration Studies
Several recent studies have investigated high penetrations of renewable generation—mostly wind
turbines—and have analyzed strategies for offsetting the increase in net-load variability anduncertainty that this would introduce into reliability management of the interconnected electrical
grid. Most hydro facilities have the ability to cycle to help manage net-load variability and
uncertainty that results with high wind and solar penetration. The assumption is that used in this
manner, hydro facilities would be able to provide a more valued service to the grid than themanner in which they have historically been used and that hydro facilities would, accordingly, be
compensated more for this service. Further, this greater compensation would then provide the
economic impetus for more hydro facilities to be developed.
Two key studies, both commissioned by the Department of Energy (DOE) through the NationalRenewable Energy Laboratory (NREL), have focused on integration of significant new
renewable generation, particularly wind generation capacity. One of these studies focused on the
Eastern Interconnection (Eastern Wind Integration and Transmission Study – EWITS) 8 while theother focused on the WestConnect portion of the Western Interconnection (Western Wind
Integration Study – WWIS) 9
. Both studies released findings and reports during 2010.10
The generation expansion portion of the EWITS did not deploy additional hydro by assumption.
”Before using the capacity expansion model, the project team eliminated other alternatives suchas integrated gasification and combined cycle (IGCC) units with sequestration, biomass, and
hydro facilities as options because they were not economically competitive with the conventional
resources under the assumptions applied to the analysis.”11
The Western Wind and Solar Integration Study (WWSIS) provided somewhat more analysis of
the potential for hydro to play a more significant role. The contribution of hydro was benchmarked in the base cases (no wind and solar) and changes to hydro scheduling were
examined in the three renewable penetration scenarios—10%, 20%, and 30% renewable
penetration. 12
The authors note that as more wind was added, particularly in the 30% renewablescenario, the hourly schedule of hydro did change but the total monthly energy remained
constant as well as the monthly minimum and maximum power output levels. These latter two
constraints—minimum and maximum power output levels—typically arise from constraints onhydro operations requiring minimum and maximum water spillage constraints and could thus not
be treated as variables in the simulations analyses.
7 The FERC issued its Final Rule adopting the principles of Pay for Performance on 20 October 2011. (137 FERC Paragraph
61,064, 18 CFR Part 35, entitled “Frequency Regulation Compensation in the Organized Wholesale Power Markets”). Available
at: http://www.ferc.gov/whats-new/comm-meet/2011/102011/E-28.pdf 8 Eastern Wind Integration and Transmission Study; Prepared for the National Renewable Energy Laboratory by EnerNex
Corporation; Sub contract report number NREL/SR-5500-47078 Issued January 2010, Revised February 2011. 9 Western Wind and Solar Integration Study; Prepared for the National Renewable Energy Laboratory by GE Energy; Sub
contract report NREL/SR-550-47434 Issued May 2010. 10 Another study conducted by the European associations of transmission system operators with the European Commission is also
on the scale and scope of these two studies for portions of the North American grid. 11 Ibid , EWITS, p 96, revised version
12 Penetration levels are based on energy delivered to load.

8/9/2019 Quantifying the Value of Hydropower
http://slidepdf.com/reader/full/quantifying-the-value-of-hydropower 74/78
A-4
Despite the relatively unchanged hourly hydro scheduling noted by the authors they do concludethat “Because there are no thermal cycling issues involved, hydro generation offers a potentiallycritical source for both inter-hour and intra-hour flexibility. Limits to this flexibility should beassessed at all of the hydro plants to further refine their role in renewable integration.”13
More Detailed Focus on Hydro Contribution in WWSIS
A companion study to WWIS conducted further investigations of hydro contributions to obtain amore complete picture of the potential hydropower role in renewables integration and provide amore robust foundation for the findings from the main study.
14 The focus of this study was
sharpened to include plant level analysis at seven hydroelectric facilities within the largerWWSIS study footprint, including one pumped storage facility. A number of the questionsaddressed as well as the analysis methodology are directly pertinent to the present project.Among the most pertinent questions are:
15
• What is the magnitude and character of change in generation and operations at individualhydropower and pumped storage plants when high penetration levels of variable and
uncertain renewables are incorporated into the grid system?• What is the overall value of hydropower as a balancing resource?• What is the value to hydropower utilities in participating in wind integration?• What is the impact of integrating renewables on pumped storage hydro operations?
To answer these and other questions a technical analysis was conducted using multipleapproaches based on the output of a series of production cost simulations. Results from thesimulations were compared to actual production patterns and to each other. In particular, thestudies were conducted to assess the modeling capabilities, the impact of renewables onhydropower operation, and the benefits of using hydropower in wind and solar integration.Among the study findings most pertinent to the Hydro Grid Services Project are the following:
•
Results of Renewable Generation Impact on Hydro Operations. As the wind generation penetration level increased little change in overall hydro generation pattern was observedat the system level. This was interpreted as an artifact of the model’s preference todispatch hydro on peak and not for balancing. Nevertheless, at certain larger hydro plants,their use increased as the penetration level increased. The use of hydro flexibility wasfound to increase at each of the two larger plants investigated in detail (Hoover and GlenCanyon). The greatest differences in hydro operations occurred during the spring monthswhen high winds occur in the west leading to full use of the storage and flexibility ofhydro facilities. Several different scenarios for siting the renewable facilities involveddifferent combinations of in-area and out-of-area locations. As more of the newrenewable projects were located in remote regions outside of the study footprint, less ofthe flexibility of hydro was needed due to the lower variability of net load. This led tochanges in operations at the plants as between different scenarios of build-out strategies.
• Results of hydropower used as a balancing resource. Using hydro to balance variabilitywould result in an overall increase of system costs involving increased costs for thermal
13 Ibid, p 146-7. 14 Western Wind and Solar Integration Study: Hydropower Analysis, prepared for National Renewable Energy Laboratory,Prepared By Dr. Tom Acker and Mr. Carson Pete, Northern Arizona University. October 2010. 15 Ibid , p. v, Executive Summary

8/9/2019 Quantifying the Value of Hydropower
http://slidepdf.com/reader/full/quantifying-the-value-of-hydropower 75/78
A-5
resources and lost revenue for hydro (as compared with base case). The greatest impactwould be felt again at the two largest dams—Hoover and Glen Canyon.
• Results of hydro participation in wind integration. This involves dispatching hydro toload only (without accounting for renewable generation) result in more use of thermalgeneration (mostly natural gas units) so that, together with the hydro, operating costs for
the system would increase slightly at the lower penetration levels but increase withincreased renewable penetration. • Results of renewable impact on pumped storage hydro operations. Results show that a
new 100 MW pumped storage plant would not be economically justified if used solely for balancing renewables integration. This is due to the effect that large penetrations ofrenewables would reduce spot prices enough in an open, liquid market so that balancingenergy prices would be relatively low.
The focus among hydro advocates today is the capability of hydro to provide added value byacting as a counter-balance to the variability of solar and wind generation which is thought to, orexpected to increase the requirement for reserves, particularly reserves devoted to ancillary
services.
16
Ancillary services, particularly the regulation component, have typically experiencedhigher clearing prices than energy prices in wholesale market areas. While the permanence ofthis price relationship may be open to debate it is thought that hydro facilities could providequick response ancillary services and thereby increase revenue to owners and operators.
This study was the broadest and most detailed when completed to focus on the effects of high penetration renewable capacity into the electric grid, including an examination of the mosteffective role for hydro facilities. It has the additional feature of a close examination of theeffects of this investment strategy on hydro facilities and on how hydro can help ease thetransition into this new future. While it has valuable insights into the role that hydro could perform, that role may be restricted by site-specific requirements on how much hydro flexibilityis actually available.
16 Expanding the geographic area contained within each balancing area is a competing approach to mitigation of the expected
increase of reserves required to balance wind and solar variability; the idea is that weather conditions are less likely to beconsistent over a larger geographic area. In theory, if wind and solar generation sites are widely dispersed over the balancingareas territory then it is less likely to be cloudy or calm throughout the entire area. However, experience has shown that wind andsolar build out concentrate where the greatest fuel resource occurs, and achieving geographic diversity is a challenge.

8/9/2019 Quantifying the Value of Hydropower
http://slidepdf.com/reader/full/quantifying-the-value-of-hydropower 76/78

8/9/2019 Quantifying the Value of Hydropower
http://slidepdf.com/reader/full/quantifying-the-value-of-hydropower 77/78

8/9/2019 Quantifying the Value of Hydropower
http://slidepdf.com/reader/full/quantifying-the-value-of-hydropower 78/78
The Electric Power Research Institute Inc., (EPRI, www.epri.com)
conducts research and development relating to the generation, delivery
and use of electricity for the benefit of the public. An independent,
nonprofit organization, EPRI brings together its scientists and engineers
as well as experts from academia and industry to help address challenges
in electricity, including reliability, efficiency, affordability, health, safety
and the environment. EPRI also provides technology, policy and economic
analyses to drive long-range research and development planning, and
supports research in emerging technologies. EPRI’s members represent
approximately 90 percent of the electricity generated and delivered in
the United States, and international participation extends to more than
30 countries. EPRI’s principal offices and laboratories are located in
Palo Alto, Calif.; Charlotte, N.C.; Knoxville, Tenn.; and Lenox, Mass.
Together...Shaping the Future of Electricity
© 2013 Electric Power Research Institute (EPRI), Inc. All rights reserved. Electric Power
Research Institute, EPRI, and TOGETHER...SHAPING THE FUTURE OF ELECTRICITY areregistered service marks of the Electric Power Research Institute, Inc.
Program:
Bulk Power System Integration of Variable Generation